Filed Pursuant to Rule 424(b)(3)
Registration No. 333-162507
PROSPECTUS
6,397,507 Shares
Common Stock
This prospectus relates to the resale of 6,397,507 shares of our common stock, by the selling stockholders identified in the selling stockholders tables beginning on page 13 of this prospectus (“Selling Stockholders”). We will not receive any proceeds from the sale of these shares by the selling stockholders.
The prices at which the Selling Stockholders may sell their shares will be determined by the prevailing market price for the shares or in privately negotiated transactions or in any other manner as described in the “Plan of Distribution” section of this prospectus. Information regarding the Selling Stockholders is provided under the “Selling Stockholders” section of this prospectus.
Our common stock is quoted on the Over-the-Counter Bulletin Board (the “OTCBB”) and on the Pinksheets under the symbol “GNSZ.” On September 20, 2011, the closing price of our common stock was $1.85 per share. You are urged to obtain current market quotations of our common stock before purchasing any of the shares being offered for sale pursuant to this prospectus.
Our principal executive offices are located at 2511 N Loop 1604 W, Suite 204, San Antonio, Texas, 78258, telephone number 210-479-8112.
Investing in our common stock is highly speculative and involves a high degree of risk. You should consider carefully the risks and uncertainties contained in the section of this prospectus entitled “Risk Factors” beginning on page 3.
NEITHER THE SECURITIES AND EXCHANGE COMMISSION NOR ANY STATE SECURITIES COMMISSION HAS APPROVED OR DISAPPROVED OF THESE SECURITIES OR PASSED UPON THE ADEQUACY OR ACCURACY OF THIS PROSPECTUS. ANY REPRESENTATION TO THE CONTRARY IS A CRIMINAL OFFENSE.
The date of this Prospectus is October 14, 2011.
TABLE OF CONTENTS
| Page | |
| FORWARD LOOKING STATEMENTS | 3 |
| RISK FACTORS | 3 |
| USE OF PROCEEDS | 10 |
| DETERMINATION OF OFFERING PRICE | 11 |
| SELLING STOCKHOLDERS | 11 |
| PLAN OF DISTRIBUTION | 19 |
| DESCRIPTION OF SECURITIES | 20 |
| DESCRIPTION OF BUSINESS | 21 |
| DESCRIPTION OF PROPERTY | 29 |
| LEGAL PROCEEDINGS | 29 |
| MARKET FOR COMMON EQUITY & RELATED STOCKHOLDER MATTERS | 29 |
| MANAGEMENT’S DISCUSSION AND ANALYSIS OF FINANCIAL CONDITION AND RESULTS OF OPERATIONS | 30 |
| MANAGEMENT | 36 |
| EXECUTIVE COMPENSATION | 38 |
| CERTAIN RELATIONSHIPS AND RELATED TRANSACTIONS | 43 |
| PRINCIPAL STOCKHOLDERS | 44 |
| INDEMNIFICATION OF DIRECTORS AND OFFICERS | 45 |
| EXPERTS | 46 |
| INTERESTS OF NAMED EXPERTS AND COUNSEL | 46 |
| WHERE YOU CAN FIND MORE INFORMATION | 46 |
| FINANCIAL STATEMENTS | F-1 |
You may rely only on the information contained in this prospectus. We have not authorized anyone to provide information or to make representations not contained in this prospectus. This prospectus is neither an offer to sell nor a solicitation of an offer to buy any securities other than those registered by this prospectus, nor is it an offer to sell or a solicitation of an offer to buy securities where an offer or solicitation would be unlawful. Neither the delivery of this prospectus, nor any sale made under this prospectus, means that the information contained in this prospectus is correct as of any time after the date of this prospectus.
2
We urge you to read this entire prospectus carefully, including the” Risk Factors” section and the financial statements and related notes included in our Annual Report on Form 10-K for the fiscal year ended December 31, 2010, filed with the Securities and Exchange Commission (“SEC”) on March 30, 2011 as well as all subsequent Quarterly Reports on Form 10-Q. As used in this prospectus, unless context otherwise requires, the words “we,” “us,”“our,” “the Company” and “GenSpera” refer to GenSpera, Inc. Also, any reference to “common shares” or “common stock” refers to our $.0001 par value common stock.
FORWARD LOOKING STATEMENTS
This prospectus contains forward-looking statements within the meaning of Section 27A of the Securities Act of 1933, as amended, or the Securities Act, and Section 21E of the Securities Exchange Act of 1934, as amended, or the Exchange Act. Any statements about our expectations, beliefs, plans, objectives, assumptions or future events or performance that are not historical in nature may be forward-looking. These forward-looking statements include, but are not limited to, statements about:
| · | the development of our drug candidates, including when we expect to undertake, initiate and complete clinical trials of our product candidates; |
| · | the regulatory approval of our drug candidates; |
| · | our use of clinical research centers and other contractors; |
| · | our ability to sell, license or market any of our products; |
| · | our ability to compete against other companies; |
| · | our ability to secure adequate protection for our intellectual property; |
| · | our ability to attract and retain key personnel; and |
| · | our ability to obtain adequate financing. |
These statements are often, but not always, made through the use of words or phrases such as “anticipate,” “estimate,” “plan,” “project,” “continuing,” “ongoing,” “expect,” “believe,” “intend” and similar words or phrases. Accordingly, these statements involve estimates, assumptions and uncertainties that could cause actual results to differ materially from those expressed in them. Discussions containing these forward-looking statements may be found throughout this prospectus, including the section entitled Management’s Discussion and Analysis of Financial Condition and Results of Operations. These forward-looking statements involve risks and uncertainties, including the risks discussed under the caption “Risk Factors” that could cause our actual results to differ materially from those in the forward-looking statements. We undertake no obligation to publicly release any revisions to the forward-looking statements or reflect events or circumstances after the date of this document. The risks discussed in this report should be considered in evaluating our prospects and future financial performance.
RISK FACTORS
Investing in our common stock involves a high degree of risk. You should carefully consider the following risk factors and all other information contained in this prospectus before purchasing our common stock. If any of the following events were to occur, our business, financial condition or results of operations could be materially and adversely affected. In these circumstances, the market price of our common stock could decline, and you could lose your entire investment.
General Risks Relating to Our Business and Business Model
We are not profitable and may never be profitable.
Our net loss for the six months ended June 30, 2011 is $2,044,964. Our net losses for the two most recent fiscal years ended December 31, 2010 and 2009 have been $4,257,839 and $5,132,827, respectively. Since inception, we have generated no revenue. We intend to develop our drug compounds through Phase I/II, and then license our drug compounds to third parties after Phase I/II clinical trials. It is expected that such third parties would then continue to develop, market, sell, and distribute the resulting products. Even if we succeed in developing one or more product candidates, we expect to incur substantial losses for the foreseeable future and may never become profitable.
3
As a result of our limited operating history, you cannot rely upon our historical performance to make an investment decision.
Our limited operating history means that there is a high degree of uncertainty in our ability to: (i) develop and commercialize our technologies and proposed products; (ii) obtain regulatory approval to commence marketing our products; (iii) achieve market acceptance of our proposed product, if developed; (iv) respond to competition; or (v) operate the business, as management has not previously undertaken such actions as a company. No assurances can be given as to exactly when, if at all, we will be able to fully develop, license, commercialize, market, sell and derive any revenues from our proposed products in development.
We currently have no product revenues and will need to raise additional capital to operate our business.
Since inception in 2003 and through June 30, 2011, we have raised approximately $17,026,000 in capital. During this same period, we have recorded accumulated losses totaling $16,494,332. As of June 30, 2011 and December 31, 2010, we had working capital of $7,110,073 and $3,414,465, respectively, and stockholders’ equity of $5,537,370 and $1,285,030 respectively. To date, we have generated no product revenues. Until, and unless, we receive approval from the United States Food and Drug Administration (“FDA”) and other regulatory authorities for our product candidates, we cannot sell our drugs and will not have product revenues. Currently, our only product candidates are G-202 and G-115. Neither of these products is approved for sale by the FDA. Therefore, for the foreseeable future, we will have to fund all of our operations and capital expenditures from cash on hand and potential future offerings. As of June 30, 2011, we had cash of approximately $7,914,000. Our current monthly cash burn rate is approximately $500,000. This will increase to $800,000 per month in the 4th quarter 2011 primarily due to G-115 development costs. The monthly burn rate is expected to be $600,000 during the first half of 2012 as we embark upon Phase II clinical studies with G-202 and a Phase I study for G-115. Accordingly, based on our cash at June 30, 2011, we believe that we have sufficient cash on hand to fund our operations until July 2012. However, changes may occur that would consume our available capital before that time, including changes in and progress of our development activities, acquisitions of additional product candidates and changes in regulation. Accordingly, we will need additional capital to fund our continuing operations. Since we do not generate any revenue, the most likely sources of such additional capital include the sale of our securities or funds from a potential strategic licensing or collaboration transaction involving the rights to one or more of our product candidates or from grants. To the extent that we raise additional capital by issuing equity securities, our stockholders will likely experience dilution, which may be significant. If we raise additional funds through collaborations and licensing arrangements, it may be necessary to relinquish some rights to our technologies, product candidates or products, or grant licenses on terms that are not favorable to us. If we raise additional funds by incurring debt, we could incur significant interest expense and become subject to covenants in the related transaction documentation that could affect the manner in which we conduct our business.
We have no committed sources of additional capital and our access to capital funding is always uncertain. Accordingly, despite our ability to secure adequate capital in the past, there is no assurance that additional equity or debt financing will be available to us when needed, on acceptable terms or even at all. In the event that we are not able to secure financing, we may have to delay, reduce the scope of, or eliminate one or more of our research, development or commercialization programs, product launches, or marketing efforts. Any such change may materially harm our business, financial condition, and operations.
Raising needed capital may be difficult as a result of our limited operating history.
When making investment decisions, investors typically look at a company’s historical performance in evaluating the risks and operations of the business and the business’s future prospects. Our limited operating history makes such evaluation and an estimation of our future performance substantially more difficult. As a result, investors may be unwilling to invest in us or such investment may be on terms or conditions which are not acceptable. If we are unable to secure such additional finance, we may need to cease operations.
We may not be able to commercially develop our technologies.
We have concentrated our research and development on our pro-drug technologies. Our ability to generate revenue and operate profitably will depend on us being able to develop these technologies for human applications. Our technologies are primarily directed toward the development of cancer therapeutic agents. We cannot guarantee that the results obtained in the pre-clinical and clinical evaluation of our therapeutic agents will be sufficient to warrant approval by the FDA. Even if our therapeutic agents are approved for use by the FDA, there is no guarantee that they will exhibit an enhanced efficacy relative to competing therapeutic modalities such that they will be adopted by the medical community. Without significant adoption by the medical community, our agents will have limited commercial potential which could harm our ability to generate revenues, operate profitably or remain a viable business.
Inability to complete pre-clinical and clinical testing and trials will impair our viability.
During the first quarter of 2010, we commenced our first clinical trials of G-202 at the University of Wisconsin Carbone Cancer Center in Madison, Wisconsin and at the Sydney Kimmel Comprehensive Cancer Center at Johns Hopkins University. We expanded the study during the first quarter of 2011, by opening a third Phase I clinical trial site at the Cancer Therapy and Research Center at the University of Texas Health Science Center at San Antonio. Although our clinical trials are underway, the outcome of the trials is uncertain and, if we are unable to satisfactorily complete such trials, or if such trials yield unsatisfactory results, we will be unable to commercialize our proposed products. No assurances can be given that our clinical trials will be successful. The failure of such trials could delay or prevent regulatory approval and could harm our ability to generate revenues, operate profitably or remain a viable business.
4
Future financing will result in dilution to existing stockholders.
We will require additional financing in the future. We are authorized to issue 80 million shares of common stock and 10 million shares of preferred stock. Such securities may be issued without the approval or consent of our stockholders. The issuance of our equity securities in connection with a future financing will result in a decrease of our current stockholders’ percentage ownership.
We depend on Craig A. Dionne, PhD, our Chief Executive Officer, and Russell Richerson, PhD, our Chief Operating Officer, for our continued operations.
We only have 2 full time employees. The loss of Craig A. Dionne, PhD, our Chief Executive Officer, or Russell Richerson, PhD, our Chief Operating Officer, would be detrimental to us. Although we have entered into employment agreements with Messrs. Dionne and Richerson, there can be no assurance that these individuals will continue to provide services to us. A voluntary or involuntary termination of employment by Messrs. Dionne or Richerson could have a materially adverse effect on our business.
We may be required to make significant payments to members of our management in the event their employment with us is terminated or if we experience a change of control.
We are a party to employment agreements with each of Craig Dionne, our Chief Executive Officer, and Russell Richerson, our Chief Operating Officer. In the event we terminate the employment of either of these executives, we experience a change in control, or in certain cases, if such executive terminates his employment with us, such executive will be entitled to receive certain severance and related payments. Additionally, in such instance, certain securities held by Messrs. Dionne and Richerson will become immediately vested and exercisable. Upon the occurrence of any such event, our obligation to make such payments could significantly impact our working capital and accordingly, our ability to execute our business plan which could have a materially adverse effect to our business. Also, these provisions may discourage potential takeover attempts.
We will require additional personnel to execute our business plan.
Our anticipated growth and expansion into areas and activities requiring additional expertise, such as clinical testing, regulatory compliance, manufacturing and marketing, may require the addition of new personnel and the development of additional expertise by existing management. There is intense competition for qualified personnel in such areas. There can be no assurances that we will be able to continue to attract and retain the qualified personnel necessary for the development of our business.
Our competitors have significantly greater experience and financial resources.
We compete against numerous companies, many of which have substantially greater financial and other resources than us. Several such competitors have research programs and/or efforts to treat the same diseases we target. Companies such as Merck, Ipsen, Johnson and Johnson, and Sanofi, as well as others, have substantially greater resources and experience than we do and are situated to compete with us effectively. As a result, our competitors may bring competing products to market that would result in a decrease in demand for our product, if developed, which could have a materially adverse effect on the viability of the company.
We are dependent upon third-parties to develop our product candidates, and such parties are, to some extent, outside of our control.
We depend upon independent investigators and collaborators, such as universities and medical institutions, to conduct our pre-clinical and clinical trials under agreements with us. These individuals and/or entities are not our employees and we cannot control the amount or timing of resources that they devote to our programs. These investigators may not assign as great a priority to our programs or pursue them as diligently as we would if we were undertaking such programs ourselves. If outside collaborators fail to devote sufficient time and resources to our drug-development programs, or if their performance is substandard, the approval of our FDA applications, if any, and our introduction of new drugs, if any, will be delayed. These collaborators may also have relationships with other commercial entities, some of whom may compete with us.
We intend to rely exclusively upon the third-party FDA-approved manufacturers and suppliers for our products.
We currently have no internal manufacturing capability, and will rely exclusively on FDA-approved licensees, strategic partners or third party contract manufacturers or suppliers. Should we be forced to manufacture our products, we cannot give you any assurance that we will be able to develop internal manufacturing capabilities or procure third party suppliers. In the event we seek third party suppliers, they may require us to purchase a minimum amount of materials or could require other unfavorable terms. Any such event would materially impact our prospects and could delay the development of our products. Moreover, we cannot give you any assurance that any contract manufacturers or suppliers that we select will be able to supply our products in a timely or cost effective manner or in accordance with applicable regulatory requirements or our specifications.
5
Our business is dependent upon securing sufficient quantities of a natural product that currently grows in very specific locations outside of the United States.
The therapeutic component of our products, including our lead compound G-202, is referred to as 12ADT. 12ADT functions by dramatically raising the levels of calcium inside cells, which leads to cell death. 12ADT is derived from a material called thapsigargin. Thapsigargin is derived from the seeds of a plant referred to as Thapsia garganica which grows along the coastal regions of the Mediterranean Sea. We currently secure the seeds from Thapsibiza, SL, a third-party supplier. There can be no assurances that the countries from which we can secure Thapsia garganica will continue to allow Thapsibiza, SL to collect such seeds and/or export the seeds derived from Thapsia garganica to the United States. In the event we are no longer able to import these seeds, we will not be able to produce our proposed drug and our business will be adversely affected.
We may be required to secure land for cultivation and harvesting of Thapsia garganica.
We believe that we can satisfy our needs for clinical development of G-202, through completion of Phase III clinical studies, from Thapsia garganica that grows naturally in the wild. In the event G-202 is approved for commercial marketing, our current supply of Thapsia garganica may not be sufficient for the anticipated demand. We estimate that in order to secure sufficient quantities of Thapsia garganica for the commercialization of a product comprising G-202, we will need to secure approximately 1000 acres of land to cultivate and grow Thapsia garganica. We anticipate the cost to lease such land would be $400,000 per year but have not yet fully assessed what other costs would be associated with a full-scale farming operation. There can be no assurances that we can secure such acreage, or that even if we are able to do so, that we could adequately grow sufficient quantities of Thapsia garganica to satisfy any commercial objectives that involve G-202. Our inability to secure adequate seeds will result in us not being able to develop and manufacture our proposed drug and will adversely impact our business.
Thapsia garganica and Thapsigargin can cause severe skin irritation and is highly toxic.
The plant Thapsia garganica can cause severe skin irritation when contact is made between the plant and the skin. ��In 1978, thapsigargin was determined to be the skin-irritating component of the plant Thapsia garganica. The therapeutic component of our products, including our lead product G-202, is derived from thapsigargin. We obtain thapsigargin from the above-ground seeds of Thapsia garganica. These seeds are harvested by hand and those conducting the harvesting must wear protective clothing and gloves to avoid skin contact. Although we obtain the seeds from a third-party contractor located in Spain, and although the contractor has contractually waived any and all liability associated with collecting the seeds, it is possible that the contractor or those employed by the contractor may suffer medical issues related to the harvesting and subsequently seek compensation from us via, for example, litigation. No assurances can be given, despite our contractual relationship with the third-party contractor, that we will not be the subject of litigation related to the harvesting of Thapsia garganica.
The synthesis of 12ADT must be conducted in special facilities.
There are a limited number of manufacturing facilities qualified to handle and manufacture therapeutic toxic agents and compounds. This limits the potential number of possible manufacturing sites for our therapeutic compounds derived from Thapsia garganica. No assurances can be provided that these facilities will be available for the manufacture of our therapeutic compounds under our time schedules or within the parameters of our manufacturing budget. In the event facilities are not available for manufacturing our therapeutic compounds, our business and future prospects will be adversely affected.
Our current manufacturing process requires acetonitrile.
The current manufacturing process for our compounds requires the common solvent acetonitrile. From late 2008 through 2009 there was a worldwide shortage of acetonitrile for a variety of reasons. We observed during that time that the available supply of acetonitrile was of variable quality, some of which is not suitable for our purposes. If we are unable to successfully change our manufacturing methods to avoid the reliance upon acetonitrile, we may incur prolonged production timelines and increased production costs. In an extreme case this situation could adversely affect our ability to manufacture our compounds altogether, thus significantly impacting our future operations.
Our proposed products may not be accepted by the health care community.
Our proposed products, if approved for marketing, may not achieve market acceptance since hospitals, physicians, patients or the medical community in general may decide not to accept and utilize them. We are attempting to develop products that will likely be first approved for marketing in late stage cancer where there is no truly effective standard of care. If approved for use in late stage cancer, the drugs will then be evaluated in earlier stage where they would represent substantial departures from established treatment methods and will compete with a number of more conventional drugs and therapies manufactured and marketed by major pharmaceutical companies. It is too early in the development cycle of the drugs for us to accurately predict our major competitors. Nonetheless, the degree of market acceptance of any of our developed products will depend on a number of factors, including but not limited to:
6
| · | our demonstration to the medical community of the clinical efficacy and safety of our proposed products; |
| · | our ability to create products that are superior to alternatives currently on the market; |
| · | our ability to establish in the medical community the potential advantage of our treatments over alternative treatment methods; and |
| · | the reimbursement policies of government and third-party payors. |
If the health care community does not accept our products, our business will be materially harmed.
Our therapeutic compounds have not been subjected to large scale manufacturing procedures.
To date, G-202 and G-115 have only been manufactured at a scale which is adequate to supply early stage clinical trials. There can be no assurances that the current procedures for manufacturing G-202 and G-115 will work at a larger scale which is adequate for commercial needs. In the event our therapeutic compounds cannot be manufactured in sufficient commercial quantities, our future prospects could be significantly impacted.
We face product liability risks for which we may not be able to obtain adequate insurance to protect us against losses.
We currently have no products that have been approved for commercial sale. However, the current and future use of our product candidates by us in clinical trials, and the sale of any approved products in the future, may expose us to liability claims. These claims might be made directly by consumers or healthcare providers or indirectly by pharmaceutical companies, or others selling such products. We may experience financial losses in the future due to product liability claims. We have obtained limited general commercial liability insurance coverage for our clinical trials. However, we may not be able to maintain insurance coverage at a reasonable cost or in sufficient amounts to protect us against all losses. If a successful product liability claim or series of claims is brought against us for uninsured liabilities or in excess of insured liabilities, our assets may not be sufficient to cover such claims and our business operations could be impaired.
Risks Relating to Intellectual Property and Government Regulation
We may not be able to withstand challenges to our intellectual property rights.
We rely on our intellectual property, including our issued and applied for patents and our licenses, as the foundation of our business. Our intellectual property rights may come under challenge. No assurances can be given that our patents or licenses will survive claims alleging invalidity or infringement on other patents and/or licenses. The viability of our business will suffer if our intellectual property protection becomes limited or is eliminated.
We may not be able to adequately protect our intellectual property.
Considerable research with regard to our technologies has been performed in countries outside of the United States. The laws protecting intellectual property in some of those countries may not provide protection for our trade secrets and intellectual property. If our trade secrets or intellectual property are misappropriated in those countries, we may be without adequate remedies to address the issue. In addition to our patents, we rely on confidentiality and assignment of invention agreements to protect our intellectual property. These agreements provide for contractual remedies in the event of misappropriation. We do not know to what extent, if any, these agreements and any remedies for their breach will be enforced by a foreign or domestic court. In the event our intellectual property is misappropriated or infringed upon and an adequate remedy is not available, our future prospects will greatly diminish.
Our proposed products may not receive FDA approval.
The FDA and comparable government agencies in foreign countries impose substantial regulations on the manufacture and marketing of pharmaceutical products through lengthy and detailed laboratory, pre-clinical and clinical testing procedures, sampling activities and other costly and time-consuming procedures. Satisfaction of these regulations typically takes several years or more and varies substantially based upon the type, complexity and novelty of the proposed product. Although our G-202 Phase I clinical trials are underway, we cannot assure you that we will successfully complete the trial. As of June 30, 2011, we had dosed 19 patients. It is still too early to predict when we might first submit any product license application for FDA approval or whether any such product license application would be granted on a timely basis, if at all. Any delay in obtaining, or failure to obtain, such approvals could have a materially adverse effect on the commercialization of our products and the viability of the company.
7
Risks Relating To Our Common Stock
Our limited market is relatively illiquid.
On September 18, 2009, our common shares began quotation on the Over-the-Counter Bulletin Board (“OTCBB”) and Pinksheets. The shares were initially sporadically traded and as a result, we did not consider that a public market for our securities existed. Commencing in the first quarter of 2010, our common shares began trading regularly but with limited volume. Accordingly, although a limited public market for our securities now exists, it is still relatively illiquid. Any prospective investor in our common stock should consider the limited market when making an investment decision. No assurances can be given that the trading volume of our common shares will increase or that a liquid public market will ever materialize. Additionally, due to the limited trading volume, it may be difficult for an investor to sell his or her shares.
Our stock price may be particularly volatile because we are a drug development company.
The market prices for securities of biotechnology companies in general, and early-stage drug development companies in particular, have been highly volatile and may continue to be highly volatile in the future. The following factors, in addition to other risk factors described in this section, may have a significant impact on the market price of our common stock:
| · | the development status of our drug candidates, particularly the results of our clinical trials of G-202; |
| · | market conditions or trends related to the biotechnology and pharmaceutical industries, or the market in general; |
| · | announcements of technological innovations, new commercial products, or other material events by our competitors or us; |
| · | disputes or other developments concerning our proprietary rights; |
| · | changes in, or failure to meet, securities analysts’ or investors’ expectations of our financial and developmental performance; |
| · | additions or departures of key personnel; |
| · | discussions of our business, products, financial performance, prospects, or stock price by the financial and scientific press and online investor communities such as chat rooms; |
| · | public concern as to, and legislative action with respect to, testing or other research areas of biopharmaceutical companies, the pricing and availability of prescription drugs, or the safety of drugs; |
| · | regulatory developments in the United States or foreign countries; and |
| · | economic and political factors. |
In the past, following periods of volatility in the market price of a particular company’s securities, securities class action litigation has often been brought against that company. We may become subject to this type of litigation, which is often extremely expensive and diverts management’s attention.
We face risks related to compliance with corporate governance laws and financial reporting standards.
The Sarbanes-Oxley Act of 2002, as well as related new rules and regulations implemented by the United States Securities and Exchange Commission (“SEC”) and the Public Company Accounting Oversight Board, require changes in the corporate governance practices and financial reporting standards for public companies. These new laws, rules and regulations, including compliance with Section 404 of the Sarbanes-Oxley Act of 2002 relating to internal control over financial reporting (���Section 404”), will materially increase the Company's legal and financial compliance costs and make some activities more time-consuming and more burdensome. As a result, management will be required to devote more time to compliance which could result in a reduced focus on development thereby adversely affecting the Company’s development activities. Also, the increased costs will require the Company to seek financing sooner that it may otherwise have had to.
Presently we qualify as a non-accelerated filer and, accordingly, are exempt from the requirements of 404b and our independent registered public accounting firm is not required to audit the design and operating effectiveness of our internal controls and management's assessment of the design and the operating effectiveness of such internal controls. In the event we become an accelerated filer, we will be required to expend substantial capital in connection with compliance.
8
Because of our limited resources, management has concluded that our internal control over financial reporting may not be effective in providing reasonable assurance regarding the reliability of financial reporting and the preparation of financial statements for external purposes in accordance with U.S. generally accepted accounting principles. To mitigate the current limited resources and limited number of employees, we rely heavily on direct management oversight of transactions, along with the use of legal and accounting professionals. As we grow, we expect to increase our number of employees, which will enable us to implement adequate segregation of duties within the Committee of Sponsoring Organizations of the Treadway Commission internal control framework.
Compliance with changing regulation of corporate governance and public disclosure will result in additional expenses and will divert time and attention away from revenue generating activities.
Changing laws, regulations and standards relating to corporate governance and public disclosure, including the Sarbanes-Oxley Act of 2002 and related SEC regulations, have created uncertainty for public companies and significantly increased the costs and risks associated with accessing the public markets and public reporting. For example, on January 30th, 2009, the SEC adopted rules requiring companies to provide their financial statements in interactive data format using the eXtensible Business Reporting Language, or XBRL. Our management team will need to invest significant management time and financial resources to comply with both existing and evolving standards for public companies, which will lead to increased general and administrative expenses and a diversion of management time and attention from developing our business to compliance activities which could have an adverse effect on our business.
Our common stock may be considered a “penny stock,” and thereby be subject to additional sale and trading regulations that may make it more difficult to sell.
Our common stock, which currently trades on the Over-the-Counter Bulletin Board and Pinksheets, may be considered to be a “penny stock” if it does not qualify for one of the exemptions from the definition of “penny stock” under Section 3a51-1 of the Securities Exchange Act for 1934, as amended (the “Exchange Act”). Our common stock may be a “penny stock” if it meets one or more of the following conditions (i) the stock trades at a price less than $5.00 per share; (ii) it is NOT traded on a “recognized” national exchange; (iii) it is NOT quoted on the Nasdaq Capital Market, or even if so, has a price less than $5.00 per share; or (iv) is issued by a company that has been in business less than three years with net tangible assets less than $5 million.
The principal result or effect of being designated a “penny stock” is that securities broker-dealers participating in sales of our common stock will be subject to the “penny stock” regulations set forth in Rules 15-2 through 15g-9 promulgated under the Exchange Act. For example, Rule 15g-2 requires broker-dealers dealing in penny stocks to provide potential investors with a document disclosing the risks of penny stocks and to obtain a manually signed and dated written receipt of the document at least two business days before effecting any transaction in a penny stock for the investor’s account. Moreover, Rule 15g-9 requires broker-dealers in penny stocks to approve the account of any investor for transactions in such stocks before selling any penny stock to that investor. This procedure requires the broker-dealer to (i) obtain from the investor information concerning his or her financial situation, investment experience and investment objectives; (ii) reasonably determine, based on that information, that transactions in penny stocks are suitable for the investor and that the investor has sufficient knowledge and experience as to be reasonably capable of evaluating the risks of penny stock transactions; (iii) provide the investor with a written statement setting forth the basis on which the broker-dealer made the determination in (ii) above; and (iv) receive a signed and dated copy of such statement from the investor, confirming that it accurately reflects the investor’s financial situation, investment experience and investment objectives. Compliance with these requirements may make it more difficult and time consuming for holders of our common stock to resell their shares to third parties or to otherwise dispose of them in the market or otherwise.
As an issuer of “penny stock” the protection provided by the federal securities laws relating to forward-looking statements does not apply to us.
Although the federal securities law provide a safe harbor for forward-looking statements made by a public company that files reports under the federal securities laws, this safe harbor is not available to issuers of penny stocks. As a result, if we are a penny stock issuer, we will not have the benefit of this safe harbor protection in the event of any claim that the material provided by us contained a material misstatement of fact or was misleading in any material respect because of our failure to include any statements necessary to make the statements not misleading.
If securities or industry analysts do not publish research or reports or publish unfavorable research about our business, the price and trading volume of our common stock could decline.
The trading market for our common stock will depend in part on the research and reports that securities or industry analysts publish about us or our business. We do not currently have and may never obtain research coverage by securities and industry analysts. If no securities or industry analysts commence coverage, the trading price for our common stock will be negatively affected. In the event we obtain securities or industry analyst coverage, if one or more of the analysts who covers us downgrades our securities, the price of our securities would likely decline. If one or more of these analysts ceases to cover us or fails to publish regular reports on us, interest in the purchase of our securities could decrease, which could cause the price of our common stock and other securities and their trading volume to decline.
9
We do not intend to pay cash dividends.
We do not pay, and do not anticipate paying cash dividends in the foreseeable future. Accordingly, any gains on your investment will need to come through an increase in the price of our common stock. The lack of a liquid market for our common stock makes such gains highly unlikely.
Our board of directors has broad discretion to issue additional securities.
We are entitled under our certificate of incorporation to issue up to 80,000,000 common and 10,000,000 “blank check” preferred shares. Blank check preferred shares provide the board of directors broad authority to determine voting, dividend, conversion, and other rights. As of June 30, 2011, we have issued and outstanding 21,443,735 common shares and we have 16,371,218 common shares reserved for future grants under our equity compensation plans and issuances upon the exercise of current outstanding options, warrants and convertible securities. Accordingly, we are entitled to issue up to 42,185,047 additional common shares and 10,000,000 additional preferred shares. Our board may generally issue those common and preferred shares, or options or warrants to purchase those shares, without further approval by our shareholders. Any preferred shares we may issue will have such rights, preferences, privileges and restrictions as may be designated from time-to-time by our board, including preferential dividend rights, voting rights, conversion rights, redemption rights and liquidation provisions. It is likely that we will be required to issue a large amount of additional securities to raise capital to further our development and marketing plans. It is also likely that we will be required to issue a large amount of additional securities to directors, officers, employees and consultants as compensatory grants in connection with their services, both in the form of stand-alone grants or under our various stock plans. The issuance of additional securities may cause substantial dilution to our shareholders.
Our Officers and Scientific Advisors beneficially own approximately 31% of our outstanding common shares.
Our Officers and Scientific Advisors own approximately 31% of our issued and outstanding common shares. As a consequence of their level of stock ownership, the group retains substantial ability to influence the elect or remove members of our board of directors, and thereby control our management. This group of shareholders has the ability to significantly control the outcome of corporate actions requiring shareholder approval, including mergers and other changes of corporate control, going private transactions, and other extraordinary transactions any of which may be in opposition to the best interest of the other shareholders and may negatively impact the value of your investment.
Provisions in Delaware law and executive employment agreements may prevent or delay a change of control.
We are subject to the Delaware anti-takeover laws regulating corporate takeovers. These anti-takeover laws prevent Delaware corporations from engaging in a merger or sale of more than 10% of its assets with any stockholder, including all affiliates and associates of the stockholder, who owns 15% or more of the corporation’s outstanding voting stock, for three years following the date that the stockholder acquired 15% or more of the corporation’s assets unless:
| · | the Board of Directors approved the transaction in which the stockholder acquired 15% or more of the corporation’s assets; |
| · | after the transaction in which the stockholder acquired 15% or more of the corporation’s assets, the stockholder owned at least 85% of the corporation’s outstanding voting stock, excluding shares owned by directors, officers and employee stock plans in which employee participants do not have the right to determine confidentially whether shares held under the plan will be tendered in a tender or exchange offer; or |
| · | on or after this date, the merger or sale is approved by the Board of Directors and the holders of at least two-thirds of the outstanding voting stock that is not owned by the stockholder. |
A Delaware corporation may opt out of the Delaware anti-takeover laws if its certificate of incorporation or bylaws so provide. We have not opted out of the provisions of the anti-takeover laws. As such, these laws could prohibit or delay mergers or other takeover or change of control of GenSpera and may discourage attempts by other companies to acquire us.
In addition, employment agreements with certain executive officers provide for the payment of severance and acceleration of the vesting of options and restricted stock in the event of termination of the executive officer following a change of control of GenSpera. These provisions could have the effect of discouraging potential takeover attempts.
USE OF PROCEEDS
We will not receive any of the proceeds from the sale of the shares by any of the selling stockholders, but we will receive up to $7,362,427 upon the exercise of warrants in the event they are exercised for cash. We will use the proceeds received from the exercise of warrants, if any, for working capital.
10
DETERMINATION OF OFFERING PRICE
The Selling Stockholders will offer their shares at the prevailing market prices, privately negotiated prices, or in any other fashion and manner as described in the section of this Prospectus entitled “Plan of Distribution.”
SELLING STOCKHOLDERS
This prospectus relates to the offering and sale, from time to time, of up to 6,397,507 shares of our common stock held by the stockholders named in the tables below (“Selling Stockholders”), which amount includes common shares issuable upon the exercise of warrants held by the Selling Stockholders. Of the shares being included, 6,397,507 have been previously registered and this prospectus will constitute a post-effective amendment to the prior registration statement.
The shares previously registered relate to: (i) shares and shares underlying warrants issued during our September 2009 offering (“2009 September Offering”); (ii) shares and shares underlying warrants issued during our June and July 2009 offering (“2009 June Offering”); (iii) shares and shares underlying warrants issued during our February 2009 offering (“2009 February Offering”); (iv) shares and shares underlying warrants issued to consultants for services provided (“Consultant Warrants”); (v) shares underlying warrants issued as a result of anti-dilution provisions (“Anti-Dilution Warrants”); and (vi) shares and shares underlying warrants issued during our July and August 2008 offering (“2008 July Offering”).
2009 September Offering
Pursuant to the terms of the September 2, 2009 offering, we sold an aggregate of 160,000 units resulting in gross proceeds of $240,000 or $1.50 per unit. Each unit consists of: (i) one share of common stock, and (ii) one half common stock purchase warrant. The warrants have a term of five years and allow the investors to purchase our common shares at a price per share of $3.00. The warrants also contain anti-dilution protection in the event of stock splits, stock dividends and other similar transactions. The warrants are callable by us in the event our shares are publically traded in the future and certain price and volume conditions are met. We paid a total of $23,100 in fees and expenses incurred in connection with the offering. We also issued warrants to purchase 12,267 common shares, with identical terms to the warrant, as a partial finder’s fee in connection with the offering. We previously registered the: (i) 160,002 common shares, and (ii) 92,269 common shares underlying the warrants, issued pursuant to the offering. The selling shareholders have previously sold shares pursuant to rule 144 or the prior prospectus: 0 common shares and 0 common shares underlying warrants. Accordingly, we are including herein the remaining unsold: 160,002 common shares and 92,269 common shares underlying warrants.
2009 June Offering
In June and July of 2009 we completed the offering of 2,025,344 units resulting in gross proceeds of $3,038,000 or $1.50 per unit. Each unit consists of: (i) one share of common stock; and (ii) one half common stock purchase warrant. The warrants have a term of five years and allow the investors to purchase our common shares at a price per share of $3.00. The Warrants also contain anti-dilution protection in the event of stock splits, stock dividends and other similar transactions. The warrants are callable by us in the event the Company’s shares are publically traded in the future and certain price and volume conditions are met. We previously registered herein the: (i) 2,025,344 common shares, and (ii) 1,012,679 common shares underlying the warrants, issued pursuant to the June Offering.. The selling shareholders have previously sold shares pursuant to rule 144 or the prior prospectus: 467,780 common shares and 0 common shares underlying warrants. Accordingly, we are including herein the remaining unsold: 1,557,564 common shares and 1,012,679 common shares underlying warrants. We are also registering the remaining unsold: (i) 33,334 common shares; and (ii) 100,562 common shares underlying warrants that were issued to finders in connection with the offering. No shares arising out of the finders’ 33,334 common shares or 100,562 common shares underlying warrants have been sold.
Anti-Dilution Warrants
In our 2008 Offering, we sold an aggregate of 2,320,000 units resulting in gross proceeds of $2,320,000 or $1.00 per unit. Each unit consisted of: (i) 1 share of common stock; and (ii) one half common stock purchase warrant. The warrants have a term of 5 years and an exercise price of $2.00 per shares subject to certain anti-dilution adjustments. During February of 2009 the Company completed the 2009 February Offering and sold an aggregate of $750,000 units at a price per unit of $1.50. As a result of the 2009 February Offering, certain anti-dilution provisions in the warrants held by investors who participated in our July and August, 2008 offering were triggered. The result of these anti-dilution provisions was that the exercise price of warrants issued during our July and August 2008 offering were reduced from $2.00 to $1.50; and we issued the investors in the offering warrants to purchase an additional 506,754 common shares at $1.50. We previously included herein the shares underlying 394,187 of the additional 506,754 warrants which we issued. The selling shareholders have previously sold shares pursuant to rule 144 or the prior prospectus: 12,501 common shares underlying warrants. Accordingly, we are including herein the remaining unsold: 381,686 common shares underlying warrants.
11
2009 February Offering
In February and April of 2009 we completed the offering of 500,000 units resulting in gross proceeds of $750,000 or $1.50 per unit. Each unit consists of: (i) one share of common stock; and (ii) one half common stock purchase warrant. The warrants have a term of five years and allow the investors to purchase our common shares at a price per share of $3.00. The Warrants also contain anti-dilution protection in the event of stock splits, stock dividends and other similar transactions. The warrants are callable by us in the event the Company’s shares are publically traded in the future and certain price and volume conditions are met. We previously included herein the: (i) 500,008 common shares, and (ii) 250,006 common shares underlying the warrants, issued pursuant to the 2009 February Offering. The selling shareholders have previously sold shares pursuant to rule 144 or the prior prospectus: 150,003 common shares and 0 common shares underlying warrants. Accordingly, we are including herein the remaining unsold: 350,005 common shares and 250,006 common shares underlying warrants.
2008 July Offering
In July and August of 2008 we completed the offering of 2,320,000 units resulting in gross proceeds of $2,320,000 or $1.00 per unit. Each unit consists of: (i) 1 share of common stock; and (ii) one half common stock purchase warrant. The warrants have a term of 5 years and an exercise price of $2.00 per shares subject to certain anti-dilution adjustments. The warrants are also callable by the Company in the event the Company’s shares are publically traded in the future and certain price and volume conditions are met. As part of the offering, TR Winston & Company, LLC acted as the Company’s placement agent with respect to the transaction. Pursuant to a placement agent agreement with TR Winston & Company, LLC we agreed to the following compensation: (i) cash fee equal to 8% of gross proceeds raised, including any payments made to the Company upon the exercise of the warrants; (ii) the issuance of a warrant to purchase 8% of all securities issued; and (iii) payment of legal expenses totaling $20,000. Accordingly, we issued to TR Winston & Company, LLC a warrant to purchase 278,400 common shares of which 22,500 were assigned to Mercer Capital, Ltd. and associated persons for their assistance in the offering. The warrant has an exercise price per common shares of $2.00 and a term of 5 years. Also, as an accommodation to the Company, TR Winston & Company, LLC agreed to receive a convertible debenture in the principal amount of $163,600 and warrants to purchase an additional 81,800 common shares, in lieu of its $163,600 cash fee. The convertible debenture accrues interest at 5% per annum and has a maturity date of July 14, 2009. It is convertible into the shares of the Company’s common stock, at the sole discretion of the holder, at $1.00 per share subject to certain anti-dilution adjustments. The warrant has the same terms as those issued to investors in the offering. We previously registered herein: (i) 2,195,000 common shares, and (ii) 1,438,400 common shares underlying the warrants, issued pursuant to the July Offering. The selling shareholders have previously sold shares pursuant to rule 144 or the prior prospectus in the amount of 1,795,500 common shares and 37,500 common shares underlying warrants. Accordingly, we are including herein the remaining unsold: 399,500 common shares and 1,400,900 common shares underlying warrants.
In addition we previously registered along with the July 2008 offering, 2,295,000 shares and 84,000 warrants underlying common shares. Of these, 2,105,000 common shares have been sold and 0 shares have been sold underlying warrants. We are including herein the remaining 190,000 common shares.
The exercise price of the warrants issued as part of the 2008 July Offering have previously been adjusted to $1.50.
Consultant Warrants and Common Shares
We are also registering 385,000 shares issued to consultants and service providers in exchange for services and reimbursement of expenses. We previously registered: (i) 25,000 common shares, (ii) and 444,000 common shares underlying warrants. The selling shareholders have previously sold shares pursuant to rule 144 or the prior prospectus: 0 common shares and 0 common shares underlying warrants. Accordingly, we are including herein the remaining unsold: 25,000 common shares and 444,000 common shares underlying warrants.
12
The Selling Stockholders may exercise their warrants at any time in their sole discretion. All of the Selling Stockholders named below acquired their common stock and warrants directly from us in private transactions.
| Common Shares Owned Before Sale (1) | Shares | Common Shares Owned After Sale (2) | ||||||||||||||||||||||||||
Held Outright | Warrants/ Options | Amount | % of class | being registered | Amount | % of Class | ||||||||||||||||||||||
| Bristol Investment Fund, Ltd.(3) | - | 216,667 | 216,667 | * | 166,667 | 50,000 | * | |||||||||||||||||||||
| G. Tyler Runnels or Jasmine Niklas Runnels TTEES The Runnel Family Trust dtd 1-11-20(4) | - | 83,334 | 83,334 | * | 83,334 | - | * | |||||||||||||||||||||
| Richard Hull, PhD | - | 48,334 | 48,334 | * | 33,334 | 15,000 | * | |||||||||||||||||||||
| IRA FBO J. Steven Emerson Rollover II Pershing LLC as Custodian | 125,000 | 229,167 | 354,167 | 1.65 | % | 166,667 | 187,500 | * | ||||||||||||||||||||
| T.R. Winston & Company, LLC (5) | - | 518,267 | 518,267 | 2.42 | % | 255,900 | 262,367 | 1.22 | % | |||||||||||||||||||
| Steven Michell Sack PSP U/A DTD 01/01/1994 | 50,000 | 91,667 | 141,667 | * | 66,667 | 75,000 | * | |||||||||||||||||||||
| Charles S. and Kathryn F. Hopper, JTWROS (was Kathryn F. Hopper) | - | 20,000 | 20,000 | * | 20,000 | - | * | |||||||||||||||||||||
| Robert O'Mara | 163,334 | 43,334 | 206,668 | * | 206,668 | - | * | |||||||||||||||||||||
| Subhash C. Gulati | - | 19,167 | 19,167 | * | 6,667 | 12,500 | * | |||||||||||||||||||||
| Ajax Partners (6) | 100,000 | 66,667 | 166,667 | * | 166,667 | - | * | |||||||||||||||||||||
| JAG MULTI INVESTMENTS LLC (7) | - | 66,667 | 66,667 | * | 66,667 | - | * | |||||||||||||||||||||
| Robert R. Kauffman | - | 66,667 | 66,667 | * | 66,667 | - | * | |||||||||||||||||||||
| Steven Mitchell Sack | 80,000 | 106,667 | 186,667 | * | 66,667 | 120,000 | * | |||||||||||||||||||||
| New Giles, LLC (8) | - | 50,000 | 50,000 | * | 50,000 | - | * | |||||||||||||||||||||
| Samax Family Limited Partnership (9) | 50,000 | 75,000 | 125,000 | * | 50,000 | 75,000 | * | |||||||||||||||||||||
| Jay R. Solan | 25,000 | 29,167 | 54,167 | * | 16,667 | 37,500 | * | |||||||||||||||||||||
| Thomas E. Genna | 50,000 | 25,000 | 75,000 | * | 50,000 | 25,000 | * | |||||||||||||||||||||
| Richard W. Green | - | 16,667 | 16,667 | * | 16,667 | - | * | |||||||||||||||||||||
| D. Carl Lustig, III | - | 50,000 | 50,000 | * | 50,000 | - | * | |||||||||||||||||||||
| The Verrazano Group, LLC (10) | - | 233,625 | 233,625 | 1.09 | % | 184,000 | 49,625 | * | ||||||||||||||||||||
| Windermere Insurance Co. Ltd. (11) | 50,000 | 33,334 | 83,334 | * | 83,334 | - | * | |||||||||||||||||||||
| Christopher Miglino | - | 33,334 | 33,334 | * | 33,334 | - | * | |||||||||||||||||||||
| Doris Sutz Roth IRA | - | 33,334 | 33,334 | * | 33,334 | - | * | |||||||||||||||||||||
| Dr. Arnold Yoskowitz and Regina Yoskowitz | - | 33,334 | 33,334 | * | 33,334 | - | * | |||||||||||||||||||||
| Gerald B. Lichtenberger | 7,000 | 33,334 | 40,334 | * | 40,334 | - | * | |||||||||||||||||||||
| John Peter Christensen | 50,000 | 33,334 | 83,334 | * | 83,334 | - | * | |||||||||||||||||||||
| Philip S. Sassower | - | 33,334 | 33,334 | * | 33,334 | - | * | |||||||||||||||||||||
| Mitchell J. Sassower | - | 33,334 | 33,334 | * | 33,334 | - | * | |||||||||||||||||||||
| Jerry A. Lubliner, M.D. | - | 33,334 | 33,334 | * | 33,334 | - | * | |||||||||||||||||||||
| Beatrice Slomiuc | 50,000 | - | 50,000 | * | 50,000 | - | * | |||||||||||||||||||||
| Sheila Sugerman | 50,000 | - | 50,000 | * | 50,000 | - | * | |||||||||||||||||||||
| Alan Schwartz | - | 16,667 | 16,667 | * | 16,667 | - | * | |||||||||||||||||||||
| Arthur Dunkin | - | 16,667 | 16,667 | * | 16,667 | - | * | |||||||||||||||||||||
13
| Common Shares Owned Before Sale (1) | Shares | Common Shares Owned After Sale (2) | ||||||||||||||||||||||||||
Held Outright | Warrants/ Options | Amount | % of class | being registered | Amount | % of Class | ||||||||||||||||||||||
| Faith Griffin & John A. Lenhart JTWROS | 25,000 | 16,667 | 41,667 | * | 41,667 | - | * | |||||||||||||||||||||
| Patrick Hund | - | 16,667 | 16,667 | * | 16,667 | - | * | |||||||||||||||||||||
| Rhonda Wesolak, Individual Retirement Account, RBC Capital Markets Corp Cust | 25,000 | 16,667 | 41,667 | * | 41,667 | - | * | |||||||||||||||||||||
| John G. Korman | - | 16,667 | 16,667 | * | 16,667 | - | * | |||||||||||||||||||||
| A.C. Providenti | - | 16,667 | 16,667 | * | 16,667 | - | * | |||||||||||||||||||||
| Benjamin Hill | 21,667 | 12,501 | 34,168 | * | 25,001 | 9,167 | * | |||||||||||||||||||||
| John Toedtman | 10,000 | 10,000 | * | 10,000 | - | * | ||||||||||||||||||||||
| Donald L. Stahl | - | 8,334 | 8,334 | * | 8,334 | - | * | |||||||||||||||||||||
| Leslie M. James | 12,500 | 8,334 | 20,834 | * | 20,834 | - | * | |||||||||||||||||||||
| Nathan Sugerman | 12,500 | 8,334 | 20,834 | * | 20,834 | - | * | |||||||||||||||||||||
| Robert B. Greene | 12,500 | 8,334 | 20,834 | * | 20,834 | - | * | |||||||||||||||||||||
| Klaus Peter Eichner | - | 8,334 | 8,334 | * | 8,334 | - | * | |||||||||||||||||||||
| Gary J. Faden | - | 8,334 | 8,334 | * | 8,334 | - | * | |||||||||||||||||||||
| Brian H. Reis | - | 20,667 | 20,667 | * | 20,667 | - | * | |||||||||||||||||||||
| Andrew B. Dorman | - | 5,667 | 5,667 | * | 5,667 | - | * | |||||||||||||||||||||
| David S. Lustig | - | 2,774 | 2,774 | * | 2,774 | - | * | |||||||||||||||||||||
| Nicole H. Tavernier | - | 667 | 667 | * | 667 | - | * | |||||||||||||||||||||
| Mark P. Eichner | - | 227 | 227 | * | 227 | - | * | |||||||||||||||||||||
| Jeffrey J. Kraws | - | 25,000 | 25,000 | * | 25,000 | - | * | |||||||||||||||||||||
| Karen B. Goldfarb | - | 25,000 | 25,000 | * | 25,000 | - | * | |||||||||||||||||||||
| Peter Nejes | - | 30,000 | 30,000 | * | 30,000 | - | * | |||||||||||||||||||||
| Dennis Powers | - | 30,000 | 30,000 | * | 30,000 | - | * | |||||||||||||||||||||
| Karen Kemmerer | - | 90,000 | 90,000 | * | 90,000 | - | * | |||||||||||||||||||||
| John L. Kemmerer, JR. 1970 Trust (12) | 690,000 | 345,000 | 1,035,000 | 4.83 | % | 1,035,000 | - | * | ||||||||||||||||||||
| Photon Global Ltd. (13) | 125,000 | 229,167 | 354,167 | 1.65 | % | 166,667 | 187,500 | * | ||||||||||||||||||||
| Gregory P. Zeller | 166,667 | 83,334 | 250,001 | 1.17 | % | 250,001 | - | * | ||||||||||||||||||||
| Far Hills Capital, LLC (14) | 183,334 | 91,667 | 275,001 | 1.28 | % | 200,001 | 75,000 | * | ||||||||||||||||||||
| Cynthia P. Stafford Trust | 133,334 | 66,667 | 200,001 | * | 200,001 | - | * | |||||||||||||||||||||
| Jonathan Meyers | 66,667 | 33,334 | 100,001 | * | 100,001 | - | * | |||||||||||||||||||||
| Gene Mulvihill | - | 33,334 | 33,334 | * | 33,334 | - | * | |||||||||||||||||||||
| Robert L. and Natacha Stafford | 66,667 | 33,334 | 100,001 | * | 100,001 | - | * | |||||||||||||||||||||
| Horemheb Investments, LLC (15) | 66,667 | 33,334 | 100,001 | * | 100,001 | - | * | |||||||||||||||||||||
| Robert L. Stafford Jr. Trust | 96,667 | 48,334 | 145,001 | * | 100,001 | 45,000 | * | |||||||||||||||||||||
14
| Common Shares Owned Before Sale (1) | Shares | Common Shares Owned After Sale (2) | ||||||||||||||||||||||||||
Held Outright | Warrants/ Options | Amount | % of class | being registered | Amount | % of Class | ||||||||||||||||||||||
| Equity Trust Company, d.b.a. Sterling Trust, Custodian FBO: John Sanderford | 46,667 | 23,334 | 70,001 | * | 70,001 | - | * | |||||||||||||||||||||
| Peter Cunningham | 78,334 | 39,167 | 117,501 | * | 50,001 | 67,500 | * | |||||||||||||||||||||
| Gordon W. Clark, Jr. | - | 16,667 | 16,667 | * | 16,667 | - | * | |||||||||||||||||||||
| Edward J. Foley, III | 33,334 | 16,667 | 50,001 | * | 50,001 | - | * | |||||||||||||||||||||
| Held Under Will of Joan P. Foley FBO Edward J. Foley, III - Lifetime Trust | 45,834 | 22,917 | 68,751 | * | 50,001 | 18,750 | * | |||||||||||||||||||||
| Edward J. Foley, III, 2009 GRAT | 33,334 | 16,667 | 50,001 | * | 50,001 | - | * | |||||||||||||||||||||
| Francis O'Connor | - | 16,667 | 16,667 | * | 16,667 | - | * | |||||||||||||||||||||
| Frank E. Walsh, III | 33,334 | 16,667 | 50,001 | * | 50,001 | - | * | |||||||||||||||||||||
| Bass Family Trust | 58,334 | 29,167 | 87,501 | * | 50,001 | 37,500 | * | |||||||||||||||||||||
| Brian Thebault | 33,334 | 16,667 | 50,001 | * | 50,001 | - | * | |||||||||||||||||||||
| Voiceified Technologies, LLC (16) | - | 16,667 | 16,667 | * | 16,667 | - | * | |||||||||||||||||||||
| Kihong Kwon, M.D. | 33,334 | 16,667 | 50,001 | * | 50,001 | - | * | |||||||||||||||||||||
| Iroquois Master Fund, Ltd. (17) | 33,334 | 16,667 | 50,001 | * | 50,001 | - | * | |||||||||||||||||||||
| Roxy Transportation Co., Inc. (18) | 25,000 | 12,500 | 37,500 | * | 37,500 | - | * | |||||||||||||||||||||
| William Stewart | 42,223 | 21,112 | 63,335 | * | 33,335 | 30,000 | * | |||||||||||||||||||||
| Bernard B. Markey | 20,000 | 26,112 | 46,112 | * | 11,112 | 35,000 | * | |||||||||||||||||||||
| Diamond II Investments, LLC (19) | - | 11,112 | 11,112 | * | 11,112 | - | * | |||||||||||||||||||||
| Ravenwood Partners, LLC (20) | 19,446 | 19,723 | 39,169 | * | 10,000 | 29,169 | * | |||||||||||||||||||||
| John Sanderford | - | 10,000 | 10,000 | * | 10,000 | - | * | |||||||||||||||||||||
| Terry Sholty Strada | 16,667 | 8,334 | 25,001 | * | 25,001 | - | * | |||||||||||||||||||||
| John Amorosa | - | 8,334 | 8,334 | * | 8,334 | - | * | |||||||||||||||||||||
| Glen Bliwise | 16,667 | 8,334 | 25,001 | * | 25,001 | - | * | |||||||||||||||||||||
| Joseph C. Roselle | - | 8,334 | 8,334 | * | 8,334 | - | * | |||||||||||||||||||||
| Schuyler L. Merrihew | 44,445 | 22,223 | 66,668 | * | 25,001 | 41,667 | * | |||||||||||||||||||||
| Kihong Kwon, M.D., Custodian, UGMA for Connor Merrihew | 56,694 | 28,347 | 85,041 | * | 24,000 | 61,041 | * | |||||||||||||||||||||
| Kihong Kwon, M.D., Custodian, UGMA for Mason Kwon | 82,444 | 41,222 | 123,666 | * | 24,000 | 99,666 | * | |||||||||||||||||||||
| Timothy V. O'Connor | 10,000 | 5,000 | 15,000 | * | 15,000 | - | * | |||||||||||||||||||||
| Jarmila Cunningham | 8,334 | 4,167 | 12,501 | * | 12,501 | - | * | |||||||||||||||||||||
| Bernard B. Markey, Individual 401(K) ETRADE Custodian | 6,667 | 3,334 | 10,001 | * | 10,001 | - | * | |||||||||||||||||||||
| Timothy V. O'Connor Roth IRA | 6,667 | 3,334 | 10,001 | * | 10,001 | - | * | |||||||||||||||||||||
| Brandon Hill | 17,334 | 9,500 | 26,834 | * | 5,001 | 21,833 | * | |||||||||||||||||||||
| Sequoia Global Partners, LLC (21) | - | 83,228 | 83,228 | * | 73,228 | 10,000 | * | |||||||||||||||||||||
| Walter H. Bass, LLC (21) | 291,464 | 453,028 | 744,492 | 3.47 | % | 52,934 | 691,558 | 3.22 | % | |||||||||||||||||||
15
| Common Shares Owned Before Sale (1) | Shares | Common Shares Owned After Sale (2) | ||||||||||||||||||||||||||
Held Outright | Warrants/ Options | Amount | % of class | being registered | Amount | % of Class | ||||||||||||||||||||||
| Robert Scherne (22) | 3,334 | 81,667 | 85,001 | * | 5,001 | 80,000 | * | |||||||||||||||||||||
| Craig Petralia (22) | 1,667 | 834 | 2,501 | * | 2,501 | - | * | |||||||||||||||||||||
| Todd Shapiro (22) | 1,667 | 834 | 2,501 | * | 2,501 | - | * | |||||||||||||||||||||
| The Alec and Evelyn Sabo Trust (23) | 233,334 | 116,667 | 350,001 | 1.63 | % | 200,001 | 150,000 | * | ||||||||||||||||||||
| Cataracta Aps (24)(25) | 312,500 | 80,000 | 392,500 | 1.83 | % | 60,000 | 332,500 | 1.55 | % | |||||||||||||||||||
| Treskerby Clinical Solutions, LLC (24)(26) | 25,000 | - | 25,000 | * | 25,000 | - | * | |||||||||||||||||||||
| 4,235,231 | 5,094,619 | 9,329,850 | 43.51 | % | 6,397,507 | 2,932,343 | 13.67 | % | ||||||||||||||||||||
| Shares Outstanding as of 8/8/2011 | 21,443,735 | |||||||||||||||||||||||||||
16
* Represents less than 1%
**Unless otherwise stated, the individual(s) with voting and dispositive control of securities offered on behalf of trusts or custodial accounts is the individual or entity referenced in the name of such accounts.
(1) Pursuant to Rules 13d-3 and 13d-5 of the Exchange Act, beneficial ownership includes any common shares as to which a shareholder has sole or shared voting power or investment power, and also any common shares which the shareholder has the right to acquire within 60 days, including upon exercise of common shares purchase options or warrants. There were 21,443,735 common shares outstanding as of August 12, 2011.
(2) Assumes the sale of all common shares previously registered and included herein but does not include shares initially being registered which may be part of the Initial Registration shares contained above.
(3) Bristol Capital Advisors, LLC (“BCA”) is the investment advisor to Bristol Investment Fund, Ltd. (“Bristol”). Paul Kessler is the manager of BCA and as such has voting and investment control over the securities held by Bristol. Mr. Kessler disclaims beneficial ownership of these securities.
(4) G. Tyler Runnels and Jasmine Niklas Runnels, as Trustees, have voting and dispositive control with respect to the securities being offered.
(5) G. Tyler Runnels, as President, has voting and dispositive control with respect to the securities being offered. Mr. Runnels is an associated person of TR Winston & Company, LLC.
(6) Richard Stone, Managing Partner, has voting and dispositive control with respect to the securities being offered.
(7) James Coren, member, has voting and dispositive control with respect to the securities being offered.
(8) Leonard Pearlman, Managing Director, has voting and dispositive control with respect to the securities being offered.
(9) Andrew Margulies, General Partner, has voting and dispositive control with respect to the securities being offered.
(10) Stephen Chizzik has voting and dispositive control with respect to the securities being offered.
(11) John Scardino, Director, has voting and dispositive control with respect to the securities being offered.
(12) Peter F. Nejes and Dennis Powers, as Trustees, have voting and dispositive control with respect to the securities being offered.
(13) Rene de Villiers has voting and dispositive control with respect to the securities being offered.
17
(14) Steve Sciaretta has voting and dispositive control with respect to the securities being offered.
(15) Robert Stafford, Jr., has voting and dispositive control with respect to the securities being offered.
(16) Robert L. Magaletta has voting and dispositive control with respect to the securities being offered.
(17) Joshua Silverman has voting and dispositive control with respect to the securities being offered by Iroquois Master Fund Ltd. Mr. Silverman disclaims beneficial ownership of the shares.
(18) Peter C. Cunningham, has voting and dispositive control with respect to the securities being offered.
(19) Lorrie Allegra has voting and dispositive control with respect to the securities being offered.
(20) Greg Bolloten has voting and dispositive control with respect to the securities being offered.
(21) Walter Bass has voting and dispositive control with respect to the securities being offered.
(22) Issued pursuant to September 2, 2009 offering.
(23) Evelyn P. Sabo has voting and dispositive control with respect to the securities being offered.
(24) Consultant Warrants and Common Shares
(25) Søren Brøgger Christensen, PhD has voting and dispositive control with respect to the securities being offered.
(26) Suzanne Wilson has voting and dispositive control with respect to the securities being offered
18
PLAN OF DISTRIBUTION
The Selling Stockholders may sell their shares at prevailing market prices or privately negotiated prices. These sales may be at fixed or negotiated prices. A Selling Stockholder may use any one or more of the following methods when selling shares:
| · | ordinary brokerage transactions and transactions in which the broker-dealer solicits purchasers; |
| · | block trades in which the broker-dealer will attempt to sell the shares as agent but may position and resell a portion of the block as principal to facilitate the transaction; |
| · | purchases by a broker-dealer as principal and resale by the broker-dealer for its account; |
| · | an exchange distribution in accordance with the rules of the applicable exchange; |
| · | privately negotiated transactions; |
| · | settlement of short sales entered into after the effective date of the registration statement of which this prospectus is a part; |
| · | broker-dealers may agree with the Selling Stockholders to sell a specified number of such shares at a stipulated price per share; |
| · | through the writing or settlement of options or other hedging transactions, whether through an options exchange or otherwise; |
| · | a combination of any such methods of sale; or |
| · | any other method permitted pursuant to applicable law. |
The Selling Stockholders may also sell shares under Rule 144 under the Securities Act of 1933, as amended (the “Securities Act”), if available, rather than under this prospectus.
Broker-dealers engaged by the Selling Stockholders may arrange for other brokers-dealers to participate in sales. Broker-dealers may receive commissions or discounts from the Selling Stockholders (or, if any broker-dealer acts as agent for the purchaser of shares, from the purchaser) in amounts to be negotiated, but, except as set forth in a supplement to this Prospectus, in the case of an agency transaction not in excess of a customary brokerage commission in compliance with FINRA Rule 2440; and in the case of a principal transaction a markup or markdown in compliance with FINRA IM-2440.
In connection with the sale of the common stock or interests therein, the Selling Stockholders may enter into hedging transactions with broker-dealers or other financial institutions, which may in turn engage in short sales of the common stock in the course of hedging the positions they assume. The Selling Stockholders may also sell shares of the common stock short and deliver these securities to close out their short positions, or loan or pledge the common stock to broker-dealers that in turn may sell these securities. The Selling Stockholders may also enter into option or other transactions with broker-dealers or other financial institutions or the creation of one or more derivative securities which require the delivery to such broker-dealer or other financial institution of shares offered by this prospectus, which shares such broker-dealer or other financial institution may resell pursuant to this prospectus (as supplemented or amended to reflect such transaction).
The Selling Stockholders and any broker-dealers or agents that are involved in selling the shares may be deemed to be “underwriters” within the meaning of the Securities Act in connection with such sales. In such event, any commissions received by such broker-dealers or agents and any profit on the resale of the shares purchased by them may be deemed to be underwriting commissions or discounts under the Securities Act. Each Selling Stockholder has informed the Company that it does not have any written or oral agreement or understanding, directly or indirectly, with any person to distribute the Common Stock. In no event shall any broker-dealer receive fees, commissions and markups which, in the aggregate, would exceed eight percent (8%).
The Company is required to pay certain fees and expenses incurred by the Company incident to the registration of the shares. The Company has agreed to indemnify the Selling Stockholders against certain losses, claims, damages and liabilities, including liabilities under the Securities Act.
Because Selling Stockholders may be deemed to be “underwriters” within the meaning of the Securities Act, they will be subject to the prospectus delivery requirements of the Securities Act including Rule 172 thereunder.
We agreed to keep this prospectus effective until the earlier of (i) the date on which the shares may be resold by the Selling Stockholders without registration and without regard to any volume or manner-of-sale limitations by reason of Rule 144, without the requirement for the Company to be in compliance with the current public information under Rule 144 under the Securities Act or any other rule of similar effect or (ii) all of the shares have been sold pursuant to this prospectus or Rule 144 under the Securities Act or any other rule of similar effect. The resale shares will be sold only through registered or licensed brokers or dealers if required under applicable state securities laws. In addition, in certain states, the resale shares may not be sold unless they have been registered or qualified for sale in the applicable state or an exemption from the registration or qualification requirement is available and is complied with.
19
Under applicable rules and regulations under the Exchange Act, any person engaged in the distribution of the resale shares may not simultaneously engage in market making activities with respect to the common stock for the applicable restricted period, as defined in Regulation M, prior to the commencement of the distribution. In addition, the Selling Stockholders will be subject to applicable provisions of the Exchange Act and the rules and regulations thereunder, including Regulation M, which may limit the timing of purchases and sales of shares of the common stock by the Selling Stockholders or any other person. We will make copies of this prospectus available to the Selling Stockholders and have informed them of the need to deliver a copy of this prospectus to each purchaser at or prior to the time of the sale (including by compliance with Rule 172 under the Securities Act).
DESCRIPTION OF SECURITIES
General
As of September 1, 2011, our authorized capital stock consisted of:
| · | 80,000,000 shares of common stock, par value $0.0001; and |
| · | 10,000,000 shares of “blank check” preferred stock, par value $0.0001. |
As of September 1, 2011, 21,443,735 shares of common stock were issued and outstanding and 0 shares of preferred stock were issued and outstanding. All of our currently issued and outstanding shares of capital stock were validly issued, fully paid and non-assessable under the Delaware General Corporation Law, as amended, or the DGCL.
Set forth below is a summary description of all the material terms of our common stock and warrants. This description is qualified in its entirety by reference to our amended and restated certificate of incorporation, bylaws and form of warrants, each of which is filed as an exhibit to this registration statement.
Common Stock
The holders of our common stock are entitled to one vote per share on each matter submitted to a vote at a meeting of our stockholders, except to the extent that the voting rights of our shares of any class or series of stock are determined and specified as greater or lesser than one vote per share in the manner provided by our certificate of incorporation. Our stockholders have no pre-emptive rights to acquire additional shares of our common stock or other securities. Our common stock is not subject to redemption rights and carries no subscription or conversion rights. In the event of liquidation of our company, the shares of our common stock are entitled to share equally in corporate assets after satisfaction of all liabilities. All shares of our common stock now outstanding are fully paid and non-assessable. Our bylaws authorize the board of directors to declare dividends on our outstanding shares.
Our common stock may be considered to be a “penny stock” if it does not qualify for one of the exemptions from the definition of “penny stock” under Section 3a51-1 of the Securities Exchange Act for 1934, as amended (the “Exchange Act”). Our common stock may be a “penny stock” if it meets one or more of the following conditions (i) the stock trades at a price less than $5.00 per share; (ii) it is NOT traded on a “recognized” national exchange; (iii) it is NOT quoted on the Nasdaq Capital Market, or even if so, has a price less than $5.00 per share; or (iv) is issued by a company that has been in business less than three years with net tangible assets less than $5 million.
The principal result or effect of being designated a “penny stock” is that securities broker-dealers participating in sales of our common stock will be subject to the “penny stock” regulations set forth in Rules 15-2 through 15g-9 promulgated under the Exchange Act. For example, Rule 15g-2 requires broker-dealers dealing in penny stocks to provide potential investors with a document disclosing the risks of penny stocks and to obtain a manually signed and dated written receipt of the document at least two business days before effecting any transaction in a penny stock for the investor’s account. Moreover, Rule 15g-9 requires broker-dealers in penny stocks to approve the account of any investor for transactions in such stocks before selling any penny stock to that investor. This procedure requires the broker-dealer to (i) obtain from the investor information concerning his or her financial situation, investment experience and investment objectives; (ii) reasonably determine, based on that information, that transactions in penny stocks are suitable for the investor and that the investor has sufficient knowledge and experience as to be reasonably capable of evaluating the risks of penny stock transactions; (iii) provide the investor with a written statement setting forth the basis on which the broker-dealer made the determination in (ii) above; and (iv) receive a signed and dated copy of such statement from the investor, confirming that it accurately reflects the investor’s financial situation, investment experience and investment objectives. Compliance with these requirements may make it more difficult and time consuming for holders of our common stock to resell their shares to third parties or to otherwise dispose of them in the market or otherwise.
20
Preferred Stock
We may issue our preferred shares from time to time in one or more series as determined by our board of directors. The voting powers and preferences, the relative rights of each series, and the qualifications, limitations and restrictions thereof may be established by our board of directors without any further vote or action by our shareholders. As of May 30, 2011, there were no shares of our preferred stock issued and outstanding.
Warrants
We are registering common shares underlying warrants related to: (i) our 2009 September Offering, (ii) our 2009 June Offering; (iii) our 2009 February Offering; (iv) the Consultant Warrants; (v) the Anti-Dilution Warrants; and (vi) our 2008 July Offering. For a further description of the warrants, see the section of this prospectus entitled “Selling Stockholders.” The table provides an overview of the warrants:
Description of Securities | Exercise Price | Expiration Date | Price Adjustment | Callable | |||||
| Consultant Warrants | |||||||||
| 60,000 Warrants | $ | 0.50 | 1/31/2018 | Stock Splits and Dividends | No | ||||
| 84,000 Warrants | $ | 0.50 | 7/14/2013 | Stock Splits and Dividends | No | ||||
| 150,000 Warrants | $ | 3.00 | 2/19/2014 | Stock Splits, Dividends and Fundamental Transactions | No | ||||
| 100,000 Warrants | $ | 1.50 | 9/2/2014 | Stock Splits and Dividends | No | ||||
| 50,000 Warrants | $ | 2.00 | 10/6/2013 | Stock Splits and Dividends | No | ||||
| Offering Warrants | |||||||||
| 1,782,586 2008 July Offering Warrants | $ | 1.50 | 7/14/2013 | Stock Splits and Dividends, Subsequent Equity Offerings, Subsequent Rights Offerings, Pro-rata distributions and Fundamental Transactions | Yes | ||||
| 250,006 2009 February Offering Warrants | $ | 3.00 | 2/19/2014 | Stock Splits and Dividends and Fundamental Transactions | Yes | ||||
| 1,113,241 2009 June Offering Warrants | $ | 3.00 | 6/30/2014 & 7/31/2014 | Stock Splits and Dividends and Fundamental Transactions | Yes | ||||
| 92,269 2009 September Offering Warrants | $ | 3.00 | 9/2/2014 | Stock Splits and Dividends and Fundamental Transactions | Yes | ||||
DESCRIPTION OF BUSINESS
We are a pharmaceutical development stage company focused on the discovery and development of prodrug cancer therapeutics, which is an emerging medical science. A prodrug is an inactive precursor of a drug that is converted into its active form only at the site of the tumor.
Our History
We were incorporated in the state of Delaware in 2003. Our activities during the period of 2004-2007 were limited to the continued prosecution of our relevant patents and the development of our intellectual property. In early 2004, we obtained an exclusive option to secure an exclusive license to certain intellectual property rights developed by Johns Hopkins University and assigned to Drs. John Isaacs, Soren Christensen, Hans Lilja, and Samuel Denmeade, the co-inventors of our technology. Earlier this year, that option was formalized and we obtained an irrevocable, fully paid-up, exclusive license to all rights in that technology.
Dr. John Isaacs and Dr. Sam Denmeade serve on our Scientific Advisory Board as Chief Scientific Advisor and Chief Medical Advisor, respectively. Dr. Soren Christensen and Dr. Hans Lilja also serve on the Company’s Scientific Advisory Board.
The Potential of Our Prodrug Therapies
Cancer chemotherapy involves treating patients with cytotoxic drugs (compounds or agents that are toxic to cells). Chemotherapy is often combined with surgery or radiation in the treatment of early stage disease and it is the preferred, or only, treatment option for many forms of cancer in later stages of the disease. However, major drawbacks of chemotherapy include:
21
| Side effects | Non-cancer cells in the body are also affected, often leading to serious side effects. | |
| Incomplete tumor kill | Many of the leading chemotherapeutic agents act during the process of cell division - they might be effective with tumors comprised of rapidly-dividing cells, but are much less effective for tumors that contain cells that are slowly dividing. | |
| Resistance | Cancers will often develop resistance to current drugs after repeated exposure, limiting the number of times that a treatment can be effectively applied. |
Prodrug chemotherapy is a relatively new approach to cancer treatment that is being investigated as a means to get higher concentrations of cytotoxic agents at the tumor location while avoiding the toxicity of these high doses in the rest of the body. An inactive form of a cytotoxin (referred to as the “prodrug”) is administered to the patient. The prodrug is converted into the active cytotoxin only at the tumor site.
We believe that, if successfully developed, prodrug therapies have the potential to provide an effective therapeutic approach to a broad range of solid tumors. We have proprietary technologies that appear, in animal models, to meet the requirements for an effective prodrug. In addition, we believe that our cytotoxin addresses two drawbacks prevalent with current cancer drugs - it kills slowly- and non-dividing cancer cells as well as rapidly dividing cancer cells, and does not appear to trigger the development of resistance to its effects.
Our Technology
Our technology supports the creation of prodrugs by attaching “masking/targeting agents” (agents that simultaneously mask the toxicity of the cytotoxin and help target the cytotoxin to the tumor) to the cytotoxin “12ADT”, and does so in a way that allows conversion of the prodrug to its active form selectively at the site of tumors. We own patents that contain claims that cover 12ADT as a composition of matter.
Cytotoxin
12ADT is a chemically modified form of thapsigargin, a cytotoxin that kills fast-, slow- and non-dividing cells. Our two issued core patents, both entitled “Tissue Specific Prodrug,” contain claims which cover the composition of 12ADT.
Masking/Targeting Agent
We use peptides as our masking/targeting agents. Peptides are short strings of amino-acids, the building blocks of many components found in cells. When attached to 12ADT, they can make the cytotoxin inactive - once removed, the cytotoxin is active again. Our technology takes advantage of the fact that the masking peptides can be removed by chemical reactors in the body called enzymes, and that the recognition of particular peptides by particular enzymes can be very specific. The peptides also make 12ADT soluble in blood. When it is removed, 12ADT returns to its natural insoluble state and precipitates directly into nearby cells.
How we make our prodrugs

22
How our prodrugs work

Our Approach
Our approach is to identify specific enzymes that are found at high levels in tumors relative to other tissues in the body. Upon identifying these enzymes, we create peptides that are recognized predominantly by those enzymes in the tumor and not by enzymes in normal tissues. This double layer of recognition adds to the tumor-targeting found in our prodrugs. Because the exact nature of our masking/targeting peptides is so refined and specific, they form the basis for another set of our patents and patent applications on the combination of the peptides and 12ADT.
Our Prodrug Development Candidates
We currently have four prodrug candidates identified based on this technology, as summarized in the table below (at this time we are developing G-202 and G-115):
| Prodrug Candidate | Activating enzyme | Target location of activation enzyme | Status | ||||
| G-202 | Prostate Specific Membrane Antigen (PSMA) | The blood vessels of all solid tumors | · | Phase I Clinical Trial is underway | |||
| G-114 | Prostate Specific Antigen (PSA) | Prostate cancers | · | Validated efficacy in pre-clinical animal models (Johns Hopkins University) | |||
| G-115 | Prostate Specific Antigen (PSA) | Prostate cancers | · | Pilot toxicology completed | |||
G-301 (Ac-GKAFRR-L12ADT) | Human glandular kallikrein 2 (hK2) | Prostate cancers | · | Validated efficacy in pre-clinical animal models (Johns Hopkins University) | |||
23
Strategy
Business Strategy
We plan to develop a series of therapies based on our prodrug technology platform and bring them through Phase I/II clinical trials.
Manufacturing and Development Strategy
Under the planning and direction of key personnel, we expect to outsource all of our Good Laboratory Practices (“GLP”) preclinical development activities (e.g., toxicology) and Good Manufacturing Practices (“GMP”) manufacturing and clinical development activities to contract research organizations (“CROs”) and contract manufacturing organizations (“CMOs”). Manufacturing will also be outsourced to organizations with approved facilities and manufacturing practices.
Commercialization Strategy
We intend to license our drug compounds to third parties after Phase I/II clinical trials. It is expected that such third parties would then continue to develop, market, sell, and distribute the resulting products.
Market and Competitive Considerations
G-202
Our primary focus is the opportunity offered by our lead prodrug candidate, G-202. We believe that we have validated G-202 as a drug candidate to treat various forms of solid tumors; including breast, urinary bladder, kidney and prostate cancer based on the ability of G-202 to cause tumor regression in animal models. On January 19, 2010, we commenced our first Phase I Clinical Trial on G-202 at University of Wisconsin Carbone Cancer Center in Madison, Wisconsin. The clinical trial has since expanded to the Sidney Kimmel Comprehensive Cancer Center at Johns Hopkins University and the Cancer Therapy and Research Center at the University of Texas Health Science Center in San Antonio. We are currently conducting the Phase I study in refractory cancer patients (those who have relapsed after former treatments) with any type of solid tumors. This strategy is intended to facilitate enrollment and perhaps give us a glimpse of safety across a wider variety of patients. We expect to enroll up to 30 patients in this Phase I study of which we have already enrolled and dosed 19 patients as of June 21, 2011. Although our trials are underway, the outcome of the trials is uncertain and, if we are unable to satisfactorily complete such trials, or if such trials yield unsatisfactory results, we will be unable to commercialize G-202. Notwithstanding, we hope to eventually demonstrate that G-202 is more efficacious than current commercial products that treat solid tumors by disrupting their blood supply.
Potential Markets for G-202
We believe that if successfully developed, G-202 has the potential to treat a range of solid tumors by disrupting their blood supply. It is too early in the development process to determine target indications. The table below summarizes a number of the potential United States patient populations which we believe may be amenable to this therapy and represent potential target markets.
| Estimated Number of | Probability of Developing (birth to death) | |||||||
| Cancer | New Cases 2010 | Male | Female | |||||
| Prostate | 217,730 | 1 in 6 | - | |||||
| Breast | 207,090 | n/a | 1 in 8 | |||||
| Urinary Bladder | 70,530 | 1 in 26 | 1 in 84 | |||||
| Kidney & Renal Pelvis Cancer | 58,240 | n/a | n/a | |||||
Source: CA Cancer J. Clin 2010; 60; 277-300
G-115
We believe our second prodrug, G-115, will be useful in the treatment of prostate pathologies, specifically prostate cancer. We initiated pilot toxicology studies in the fourth quarter of 2010 with anticipated the filing of an Initial New Drug (“IND”) application with the FDA or equivalent Clinical Trial Application (CTA) in Europe in the first quarter of 2012.
24
We believe that G-202 is expected to be useful in the treatment of prostate cancer and recognize that the two prodrugs might appear to be competitive agents. However, we expect that this potential competition will be minimized as G-202 will be marketed to medical oncologists whereas G-115 would be marketed to urologists, who treat the majority of prostate cancer patients in this and other countries.
The clinical opportunity for our drug candidates
We believe that current anti-angiogenesis drugs (drugs that disrupt the blood supply to tumors) validate the clinical approach and market potential of our drug candidates. Angiogenesis is the physiological process involving the growth of new blood vessels from pre-existing vessels and is a normal process in growth and development, as well as in wound healing. Angiogenesis is also a fundamental step in the development of tumors from a clinically insignificant size to a malignant state because no tumor can grow beyond a few millimeters in size without the nutrition and oxygenation that comes from an associated blood supply. Interrupting this process has been targeted as a point of intervention for slowing or reversing tumor growth. A well-known example of a successful anti-angiogenic approach is the recently approved drug, AvastinTM , a monoclonal antibody that inhibits the activity of Vascular Endothelial Growth Factor, which is important for the growth and survival of endothelial cells.
These types of anti-angiogenic drugs have only a limited therapeutic effect with increased median patient survival times of only a few months. Our approach is designed to destroy both the existing and newly growing tumor vasculature, rather than just block new blood vessel formation. We anticipate that this approach will lead to a more immediate collapse of the tumors nutrient supply and consequently an enhanced rate of tumor destruction.
Our drugs destroy new and existing blood vessels in tumors
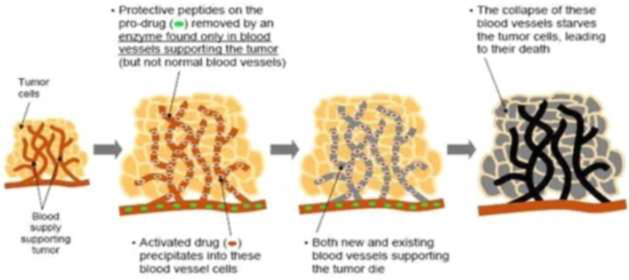
Competition
The pharmaceutical, biopharmaceutical and biotechnology industries are very competitive, fast moving and intense, and expected to be increasingly so in the future. Although we are not aware of any competitor who is developing a drug that is designed to destroy both the existing and newly growing tumor vasculature in a manner similar to our drug candidates, there are several marketed drugs and drugs in development that attack tumor-associated blood vessels to some degree. For example, AvastinTM is a marketed product that acts predominantly as an anti-angiogenic agent. ZybrestatTM is another drug in development that is described as a vascular-disrupting agent that inhibits blood flow to tumors. It is impossible to accurately ascertain how well our drug will compete against these or other products that may be in the marketplace until we have human patient data for comparison.
Other larger and well-funded companies have developed and are developing drug candidates that, if not similar in type to our drug candidates, are designed to address the same patient or subject population. Therefore, our lead product, other products in development, or any other products we may acquire or in-license may not be the best, the safest, the first to market, or the most economical to make or use. If a competitor’s product or product in development is better than ours, for whatever reason, then our ability to license our technology could be diminished and our sales could be lower than that of competing products, if we are able to generate sales at all.
25
Patents and Proprietary Rights
Our success will likely depend upon our ability to preserve our proprietary technologies and operate without infringing on the proprietary rights of other parties. However, we may rely on certain proprietary technologies and know-how that are not patentable or that we determine to keep as trade secrets. We protect our proprietary information, in part, by the use of confidentiality and assignment of invention agreements with our officers, directors, employees, consultants, significant scientific collaborators and sponsored researchers that generally provide that all inventions conceived by the individual in the course of rendering services to us shall be our exclusive property. The following table identifies our issued and pending patents which we own and/or have licensed:
| Number | Country | Filing Date | Issue Date | Expiration Date | Title | |||||
| Patents Issued | ||||||||||
| 6,265,540 | US | 5/19/1998 | 7/24/2001 | 5/19/2018 | Tissue specific prodrug (PSA) | |||||
| 6,410,514 | US | 6/7/2000 | 6/25/2002 | 6/7/2020 | Tissue specific prodrug (PSA) | |||||
| 6,504,014 | US | 6/7/2000 | 1/7/2003 | 6/7/2020 | Tissue specific prodrug (TG) | |||||
| 6,545,131 | US | 7/28/2000 | 4/8/2003 | 7/28/2020 | Tissue specific prodrug (TG) | |||||
| 7,053,042 | US | 7/28/2000 | 5/30/2006 | 7/28/2020 | Activation of peptide prodrugs by HK2 | |||||
| 7,468,354 | US | 11/30/2001 | 12/23/2008 | 11/30/2021 | Tissue specific prodrug (G-202, PSMA) | |||||
| 7,635,682 | US | 1/6/2006 | 12/22/2009 | 1/6/2026 | Tumor activated prodrugs (G-115) | |||||
| 7,767,648 | US | 11/25/2008 | 8/3/2010 | 11/25/2028 | Tissue specific prodrug (G-202, PSMA) | |||||
| 7,906,477 | US | 5/18/2005 | 3/15/2011 | 11/18/2023 | Activation of peptide prodrugs by HK2 | |||||
| Patents Pending | ||||||||||
| US 2008/0247950 | US | 3/15/2007 | Pending | N/A | Activation of peptide prodrugs by HK2 | |||||
| US 2010/0120697 | US | 11/5/2009 | Pending | N/A | Tumor Activated Prodrugs (PSA,G-115) | |||||
| WO 2010/107909 | PCT | 3/17/2010 | Pending | N/A | Methods and compositions for the detection of cancer | |||||
| Pending Divisional | US | 1/10/2011 | Pending | N/A | Activation of peptide prodrugs by HK2 |
When appropriate, we will continue to seek patent protection for inventions in our core technologies and in ancillary technologies that support our core technologies or which we otherwise believe will provide us with a competitive advantage. We will accomplish this by filing and maintaining patent applications for discoveries we make, either alone or in collaboration with scientific collaborators and strategic partners. Typically, we plan to file new patent applications worldwide. In addition, we plan to obtain licenses or options to acquire licenses to patent filings from other individuals and organizations that we anticipate could be useful in advancing our research, development and commercialization initiatives and our strategic business interest.
26
Manufacturing & Development
12ADT is manufactured by chemically modifying the cytotoxin thapsigargin, which is isolated from the seeds of Thapsia garganica, a plant predominantly found in countries bordering the Mediterranean Sea. Our prodrugs are manufactured by attaching a specific peptide to 12ADT.
Outsource Manufacturing
To leverage our experience and available financial resources, we do not plan to develop company-owned or company-operated manufacturing facilities. We plan to outsource all drug manufacturing to contract manufacturers that operate in compliance with GMP. We may also seek to refine the current manufacturing process to achieve improvements in efficiency, costs, purity and the like. We may also address different drug formulations to achieve improvements in stability and/or drug delivery.
Supply of Raw Materials – Thapsibiza SL
To our knowledge, there is only one commercial supplier of Thapsia garganica seeds. In April 2007, we obtained the proper permits from the United States Department of Agriculture (“USDA”) for the importation of Thapsia garganica seeds. In January 2008, we entered into a sole source agreement with, Thapsibiza, SL. (our supplier). The material terms of the agreement are as follows:
| Term | The term of the agreement is for 5 years. | |
| Exclusivity | Thapsibiza shall exclusively provide Thapsia garganica seeds to the Company. The Company has the ability to seek addition suppliers to supplement the supply from Thapsibiza, SL. | |
| Pricing | The price shall be 300 Euro/kg. Thapsibiza may, from time to time, without notice, increase the price to compensate for any increased governmental taxes. | |
Minimum Order | For so long as the Company continues to develop drugs derived from thapsigargin, the minimum purchase shall be 50kg per harvest period year. | |
| Indemnification | Once the product is delivered to an acceptable carrier, the Company shall be responsible for an injury or damage result from the handling of the product. Prior to delivery, Thapsibiza shall be solely responsible. |
Long-term Supply of Raw Materials
We believe that we can satisfy our needs for clinical development of G-202 through completion of Phase III clinical studies from Thapsia garganica that grows naturally in the wild. However, in order to secure a long-term stable supply of thapsigargin starting material, we are engaged in three ongoing research projects including traditional cultivation, aeroponic growth and metabolic engineering of moss cells.
We are funding an ongoing Thapsia garganica cultivation project with Thapsibiza, SL. It is known that thapsigargin is produced in the various body parts of the plant and we are evaluating the most cost-effective way to produce thapsigargin, whether it is extracted from seedlings, early roots, stems and/or shoots or from seeds of the mature plant. Reliable germination methods are established and transfer of plantings from greenhouse to fields appears straightforward. At the current time, we believe that traditional cultivation, farming and harvesting of Thapsia garganica will be the most reliable and straightforward source of thapsigargin starting material.
We have funded a project in an academic lab at the University of Arizona to evaluate growth of Thapsia garganica in an aeroponic setting. This would allow soil-less cultivation under humid conditions and potentially less complex media for extraction of thapsigargin from the plant material. This project is underway.
27
Lastly, we are co-funding a moss project at the University of Copenhagen. A major goal of the project entitled SPOTLight (Sustainable Production of Thapsigargin using Light) is to produce thapsigargin in high yields in genetically modified moss cells thus enabling an inexpensive year-round supply of thapsigargin for drug manufacture. The SPOTLight project is primarily funded by a DKK 18.3M (approximately $3.5M USD) grant from The Danish Council for Strategic Research and is directed by Dr. Soren Brogger Christensen, Professor at the University of Copenhagen, member of GenSpera’s Scientific Advisory Board and the scientist responsible for the initial isolation and characterization of thapsigargin. GenSpera has agreed to co-fund the project to a total sum of $100,000 paid in four annual installments of $25,000. Under the terms of the agreement, GenSpera has obtained an exclusive, milestone- and royalty-free, fully paid license to the resulting moss cell lines necessary to generate thapsigargin or its chemical precursors. The Company recognizes that this is an ambitious project and that the goal of having a thapsigargin-producing cell line may not be reached. However, even if the project can only generate cell lines that produce chemical precursors of thapsigargin, this might form the basis of a semi-synthetic route to thapsigargin on a commercially viable scale.
FDA Approval Process
Prior to commencement of clinical studies involving humans, preclinical testing of new pharmaceutical products is generally conducted on animals in the laboratory to evaluate the potential efficacy and safety of the product candidate. The results of these studies are submitted to the FDA as part of an IND application, which must become effective before clinical testing in humans can begin. Typically, human clinical evaluation involves a time-consuming and costly three-phase process. In Phase I, clinical trials are conducted with a small number of people to assess safety and to evaluate the pattern of drug distribution within the body. In Phase II, clinical trials are conducted with groups of patients afflicted with a specific disease in order to determine preliminary efficacy, optimal dosages and expanded evidence of safety. (In some cases, an initial trial is conducted in diseased patients to assess both preliminary efficacy and preliminary safety, in which case it is referred to as a Phase I/II trial.) In Phase III, large-scale, multi-center, comparative trials are conducted with patients afflicted with a target disease in order to provide enough data to demonstrate the efficacy and safety required by the FDA. The FDA closely monitors the progress of each of the three phases of clinical testing and may, at its discretion, re-evaluate, alter, suspend, or terminate the testing based upon the data which have been accumulated to that point and its assessment of the risk/benefit ratio to the patient. All adverse events must be reported to the FDA. Monitoring of all aspects of the study to minimize risks is a continuing process.
The results of the preclinical and clinical testing on non-biologic drugs and certain diagnostic drugs are submitted to the FDA in the form of a New Drug Application (“NDA”) for approval prior to commencement of commercial sales. In responding to an NDA submission, the FDA may grant marketing approval, may request additional information, may deny the application if it determines that the application does not provide an adequate basis for approval, and may also refuse to review an application that has been submitted if it determines that the application does not provide an adequate basis for filing and review. There can be no assurance that approvals will be granted on a timely basis, if at all, for any of our proposed products.
European and Other Regulatory Approval
Whether or not FDA approval has been obtained, approval of a product by comparable regulatory authorities in Europe and other countries will be necessary prior to commencement of marketing the product in such countries. The regulatory authorities in each country may impose their own requirements and may refuse to grant an approval, or may require additional data before granting it, even though the relevant product has been approved by the FDA or another authority. As with the FDA, the regulatory authorities in the European Union (“EU”) and other developed countries have lengthy approval processes for pharmaceutical products. The process for gaining approval in particular countries varies, but generally follows a similar sequence to that described for FDA approval. In Europe, the European Committee for Proprietary Medicinal Products provides a mechanism for EU-member states to exchange information on all aspects of product licensing. The EU has established a European agency for the evaluation of medical products, with both a centralized community procedure and a decentralized procedure, the latter being based on the principle of licensing within one member country followed by mutual recognition by the other member countries.
Other Regulations
We are also subject to various U.S. federal, state, local and international laws, regulations and recommendations relating to safe working conditions, laboratory and manufacturing practices and the use and disposal of hazardous or potentially hazardous substances, including radioactive compounds and infectious disease agents, used in connection with our business. We cannot accurately predict the extent of government regulation which might result from future legislation or administrative action.
Employees
As of June 30, 2011 we employed 2 individuals who are also our executive officers, both of whom hold advanced degrees.
28
DESCRIPTION OF PROPERTY
Our executive offices are located at 2511 N Loop 1604 W, Suite 204, San Antonio, TX 78258. We lease this facility consisting of approximately 853 square feet, for $1,635 per month. Our lease expires on September 15, 2012. There is no affiliation between us or any of our principals or agents and our landlords or any of their principals or agents.
LEGAL PROCEEDINGS
As of the date of this prospectus, there are no material pending legal or governmental proceedings relating to our company or properties to which we are a party, and to our knowledge there are no material proceedings to which any of our directors, executive officers or affiliates are a party adverse to us or which have a material interest adverse to us.
MARKET FOR COMMON EQUITY & RELATED STOCKHOLDER MATTERS
Market Information
Our common stock has been quoted over-the-counter on the OTC Bulletin Board and Pinksheets since September of 2009 under the designation GNSZ.OB. Prior to the first quarter of 2010, the market for the stock had been relatively inactive. Commencing during the first quarter of 2010, a limited market for our common stock developed although such market is still relatively illiquid. Any prospective investor in our common stock should consider the limited market when making an investment decision as our securities are still relatively illiquid. No assurances can be given that the trading volume of our common shares will increase or that a liquid public market will ever materialize. The quotations are taken from the OTC Bulletin Board. The prices reflect high and low inter-dealer bid prices, without retail mark-up, mark-down or commission, and may not necessarily represent actual transactions.
| Quarter Ended | High | Low | ||||||
| 2011: | ||||||||
| Second Quarter | $ | 2.00 | $ | 0.00 | ||||
| First Quarter | $ | 2.00 | $ | 1.10 | ||||
| 2010: | ||||||||
| Fourth Quarter | $ | 1.99 | $ | 1.50 | ||||
| Third Quarter | $ | 2.27 | $ | 1.50 | ||||
| Second Quarter | $ | 2.80 | $ | 2.00 | ||||
| First Quarter | $ | 3.45 | $ | 1.60 | ||||
| 2009: | ||||||||
| Fourth Quarter | $ | 2.45 | $ | 0.00 | ||||
Holders
As of September 1, 2011, there were 21,443,735 shares of our common stock issued and outstanding those were held by approximately 159 shareholders of record. We believe our shares are held by another 714 “nominees” with regard to shares held in street name.
Dividend Policy
We have never paid or declared cash dividends on our common stock, and we do not intend to pay or declare cash dividends on our common stock in the foreseeable future.
Options, Warrants and Convertible Securities
As of September 1, 2011, there were outstanding common share purchase options, warrants and convertible securities entitling the holders to purchase up to 12,113,089 common shares at exercise prices between $0.50 and $3.50with an average weighted exercise price of $2.13 per share.
Equity Compensation Plan Information
The following table sets forth information as of December 31, 2010 with respect to our compensation plans under which equity securities may be issued.
29
| (a) | (b) | (c) | ||||||||||
Number of Securities to be Issued upon Exercise of Outstanding Options, Warrants and Rights | Weighted-Average Exercise Price of Outstanding Options, Warrants and Rights | Number of Securities Remaining Available for Future Issuance under Equity Compensation Plans (Excluding Securities Reflected in Column (a)) | ||||||||||
| Equity compensation plans approved by security holders | ||||||||||||
2007 Stock Plan, as amended (1) | 837,500 | $ | 1.22 | 5,019,021 | ||||||||
| Equity compensation plans not approved by security holders | ||||||||||||
| 2009 Executive Compensation Plan | 1,775,000 | 1.58 | - | |||||||||
| Total | 2,612,500 | $ | 1.47 | 5,019,021 | ||||||||
| (1) | Our 2007 Stock Plan, as amended, provides for the issuance of up to 1,500,000 common shares during any calendar year. The plan provides for the issuance of up to 6,000,000 common shares in the aggregate. |
GenSpera2009Executive Compensation Plan
Our 2009 Executive Compensation Plan (“2009 Plan”) is administered by our Board or any of its committees. The purpose of our 2009 Plan is to advance the interests of GenSpera and our stockholders by attracting, retaining and rewarding persons performing services for us and to motivate such persons to contribute to our growth and profitability. The issuance of awards under our 2009 Plan is at the discretion of the administrator, which has the authority to determine the persons to whom any awards shall be granted and the terms, conditions and restrictions applicable to any award. Under our 2009 Plan, we may grant stock options, restricted stock, stock appreciation rights, restricted stock units, performance units, performance shares and other stock based awards. Our 2009 Plan authorizes the issuance of up to 1,775,000 shares of our common stock for the foregoing awards. As of December 31, 2010, we have granted awards under the plan equal to 1,775,000 common shares. Accordingly, there are no shares available for future awards under the plan.
Deferred Compensation Plan
In July of 2011, we adopted Executive Deferred Compensation Plan (the “Deferred Plan”). The Deferred Plan is intended to comply with the requirements of Section 409A of the Internal Revenue Code of 1986, as amended (the “Code”). The Deferred Plan is intended to be an unfunded “top hat” plan which is maintained primarily to provide deferred compensation benefits for a select group of our “management or highly compensated employees” within the meaning of Sections 201, 301, and 401 of the Employee Retirement Income Security Act of 1974, as amended (“ERISA”), and to therefore be exempt from the provisions of Parts 2, 3, and 4 of Title I of ERISA. The Deferred Plan is intended to help build a supplemental source of savings and retirement income through pre-tax deferrals of eligible compensation, which may include cash, option and stock bonus awards, discretionary cash, option and stock awards and/or any other payments which may be designated by the Deferred Plan administrator, as eligible, for deferral under the Deferred Plan from time to time. As administered, the Deferred Plan is used to defer compensation of stock awards granted under our other equity compensation plans and does not by its terms approve any grants or awards.
MANAGEMENT’S DISCUSSION AND ANALYSIS OF FINANCIAL
CONDITION AND RESULTS OF OPERATIONS
Our Management’s Discussion and Analysis of Financial Condition and Results of Operations (MD&A) is provided in addition to the accompanying consolidated financial statements and notes to assist readers in understanding our results of operations, financial condition, and cash flows. MD&A is organized as follows:
| · | Overview — Discussion of our business and plan of operations, overall analysis of financial and other highlights affecting the company in order to provide context for the remainder of MD&A. |
| · | Significant Accounting Policies — Accounting policies that we believe are important to understanding the assumptions and judgments incorporated in our reported financial results and forecasts. |
30
| · | Results of Operations — Analysis of our financial results comparing the three and six month periods ended June 30, 2011 to the comparable periods of 2010. |
| · | Liquidity and Capital Resources — An analysis of changes in our balance sheets and cash flows, and discussion of our financial condition and potential sources of liquidity. |
The various sections of this MD&A contain a number of forward-looking statements. Words such as “expects,” “goals,” “plans,” “believes,” “continues,” “may,” and variations of such words and similar expressions are intended to identify such forward-looking statements. In addition, any statements that refer to projections of our future financial performance, our anticipated growth and trends in our businesses, and other characterizations of future events or circumstances are forward-looking statements. Such statements are based on our current expectations and could be affected by the uncertainties and risk factors described throughout this filing and particularly in the “Overview” section (see also “Risk Factors” section of this Prospectus). Our actual results may differ materially.
Management's Plan of Operation
We are pursuing a business plan related to the development of targeted cancer therapeutics for the treatment of cancerous tumors, including breast, prostate, bladder, and kidney cancer. We are considered to be in the development stage as defined by Financial Accounting Standards Board (“FASB”) Accounting Standards Codification (“ASC”) Topic 915 “Development Stage Entities”.
Business Strategy
Our business strategy is to develop a series of therapeutics based on our target-activated pro drug technology platform and bring them through Phase I/II clinical trials. At that point, we plan to license the rights to further development of the drug candidates to major pharmaceutical companies. We believe that major pharmaceutical companies see significant value in drug candidates that have passed one or more phases of clinical trials, and these organizations have the resources and expertise to finalize drug development and market the drugs.
Plan of Operation
We have identified 4 prodrug candidates: G-202, G-114, G-115 and G-301 (formerly designated as Ac-GKAFRR-L12ADT). In our technology a prodrug is defined as an inactive form of a tumor-killing agent that is converted into an active form only within the tumor, thus minimizing side effects and maximizing anti-tumor efficacy. All of our drugs are based upon a unique cytotoxin called thapsigargin, which is isolated from the Mediterranean plant, Thapsia garganica.
Management believes that the best way to increase shareholder value is to remain focused on the efficient clinical development of G-202, already in Phase I clinical trials, as our highest priority. In addition to the development of G-202, we are also engaged in the preclinical development of G-115. It is anticipated that the development of the remaining candidates will not commence until we have sufficient resources to devote to their development.
Clinical Development of G-202
On June 23, 2009, we submitted our first IND for G-202 to the FDA. On September 4, 2009, we received approval from the FDA for our IND in order to commence clinical trials. Although we have received approval from the FDA to commence trials, the outcome of the trials is uncertain and, if we are unable to satisfactorily complete such trials, or if such trials yield unsatisfactory results, we will be unable to commercialize our proposed products. Over the next twelve months we plan to focus on clinical trials of G-202 in cancer patients.
For the manufacture of G-202, we have secured a stable supply of source material (Thapsia garganica seeds) from which thapsigargin is isolated, have a sole source agreement with a European supplier, Thapsibiza, SL, and have obtained the proper import permits from the USDA for these materials. We have also identified a clinically and commercially viable formulation for G-202 and have manufactured sufficient G-202 to supply our Phase I clinical needs. In anticipation of the upcoming G-202 Phase II clinical trials, we will complete manufacture of GMP grade G-202 over the next three months. The costs for manufacture of this clinical batch of drug are included in the current projected expenditures.
31
As of June 30, 2011, nineteen patients have been treated with G-202 in the ongoing Phase I clinical trial. We anticipate that the Phase I clinical trial of G-202 will continue through the fourth quarter of 2011. The purpose of the Phase I study of G-202 is to evaluate safety, understand the pharmacokinetics (the process by which a compound is absorbed, distributed, metabolized, and eliminated by the body) of the drug candidate in humans, and to determine an appropriate dosing regimen for the subsequent clinical studies. This is accomplished by exposing successive cohorts of three patients to escalating doses of the drug until a Maximally Tolerated Dose (MTD) is identified. We are currently conducting the Phase I study in refractory cancer patients (those who have relapsed after former treatments) with any type of solid tumors. This strategy is intended to facilitate enrollment and perhaps give us a glimpse of safety across a wider variety of patients. We expect to enroll up to 30 patients in this Phase I study at: (i) Sidney Kimmel Comprehensive Cancer Center at Johns Hopkins (Michael Carducci, MD as Principal Investigator); (ii) University of Wisconsin Carbone Cancer Center (George Wilding, MD as Principal Investigator); and (iii) Cancer Therapy and Research Center at the University of Texas Health Science Center in San Antonio (Devalingam Mahalingam, MD as Principal Investigator). The Phase I clinical protocol has been modified to accommodate enrollment of up to 18 additional patients in a Phase IB component of the study to evaluate the drug’s safety and tolerability and possible efficacy in a broader patient population consisting primarily of prostate cancer patients who have previously failed treatment with chemotherapeutic agents. It is expected that the Phase IB component of the study may give us an earlier glimpse of true anti-tumor activity as well as provide information on how to best design the subsequent Phase II study in this later stage prostate cancer patient population. It is anticipated that the ongoing Phase I clinical trial will be completed in the fourth quarter of 2011 whereas the Phase IB component of the trial will continue through the fourth quarter of 2012.
Upon completion of the dose escalation component of the Phase I clinical trial, we expect to conduct several Phase II clinical trials to determine the therapeutic efficacy of G-202 in cancer patients. The Phase II studies can be started while the Phase IB trial in late stage post-chemotherapy prostate cancer patients is ongoing. Although we believe that G-202 will be useful across a wide variety of cancer types, it is usually most efficient and medically prudent to evaluate a drug candidate in separate Phase II studies, each enrolling patients with a specific tumor type per individual study. We are developing a Phase II clinical protocol for the treatment of castrate-resistant chemotherapy-naïve prostate cancer patients to be conducted in the US with additional sites in the UK. This trial will have an advantage of demonstrating approval by European regulatory agencies for testing of G-202 in patients and is expected to launch in Q1 2012. We are also evaluating Phase II trial designs in other tumor types and expect to conduct up to four separate concurrent Phase II studies in different tumor types.
Development of G-115
We began development of G-115 in the fourth quarter of 2010 with an anticipated filing of an IND in the third quarter of 2011. The extra costs for preclinical development of G-115 to an IND submission may total up to $2.5 million. Because we wished to assure funding for an aggressive G-202 Phase II clinical program, we deferred full development of G-115 until we received additional monies via financings during the first four months of 2011. We now expect to file an IND in the United States or equivalent Clinical Trial Application (CTA) in Europe in the first quarter of 2012.
Anticipated Expenditures
We have budgeted $7,584,200 in cash expenditures for the twelve month period following June 30, 2011, including (1) $1,262,700 to cover our projected general and administrative expense during this period; and (2) $6,321,500 for research and development activities. Based on our cash at June 30, 2011 we believe we have sufficient cash on hand to fund our operations until July 2012, after which time we will need to undertake additional financings. These assumptions are based upon operations focused on completion of the G-202 Phase I clinical program, initiation of several G-202 Phase II clinical trials, full pre-clinical development of G-115, and initiation of a Phase I clinical trial for G-115.
We anticipate that we will license G-202 to a third party during or after Phase II clinical studies. In the event we are not able or decide not to license G-202, we will proceed with Phase III Clinical trials. We estimate that Phase III Clinical trials will cost approximately $25 million and will be completed in the fourth quarter of 2015. If all goes as planned, we may expect marketing approval in the first half of 2016 with an additional $3 million spent to get the NDA approved. We do not expect material net cash inflows from our own marketing efforts before the first half of 2017. The Phase III estimated costs are subject to major revision because we have not yet obtained any efficacy data for our drug in patients and therefore cannot accurately predict what may be the optimal Phase III patient population. The estimates will become more refined as we obtain more clinical data.
The amounts and timing of our actual expenditures and possible financings may vary significantly from our expectations depending upon numerous factors, including our results of operations and clinical trials, financial condition and capital requirements. Accordingly, we will retain the discretion to allocate the available funds among the identified uses described above, and we reserve the right to change the allocation of available funds among the uses described above.
Significant Accounting Policies
Our financial statements have been prepared in accordance with accounting principles generally accepted in the United States of America. The preparation of these financial statements requires management to make estimates and assumptions that affect the reported amounts of assets, liabilities, revenues and expenses. Note 1 of the Notes to Financial Statements describes significant accounting policies used in the preparation of the financial statements. Certain of these significant accounting policies are considered to be critical accounting policies, as defined below. We do not believe that there have been significant changes to our accounting policies during the three and six months ended June 30, 2011, as compared to those policies disclosed in the comparable period of 2010 and December 31, 2010 financial statements, except as disclosed in the notes to those financial statements.
32
A critical accounting policy is defined as one that is both material to the presentation of our financial statements and requires management to make difficult, subjective or complex judgments that could have a material effect on our financial condition and results of operations. Specifically, critical accounting estimates have the following attributes: 1) we are required to make assumptions about matters that are highly uncertain at the time of the estimate; and 2) different estimates we could reasonably have used, or changes in the estimate that are reasonably likely to occur, would have a material effect on our financial condition or results of operations.
Estimates and assumptions about future events and their effects cannot be determined with certainty. We base our estimates on historical experience and on various other assumptions believed to be applicable and reasonable under the circumstances. These estimates may change as new events occur, as additional information is obtained and as our operating environment changes. These changes have historically been minor and have been included in the financial statements as soon as they became known. Based on a critical assessment of our accounting policies and the underlying judgments and uncertainties affecting the application of those policies, management believes that our financial statements are fairly stated in accordance with accounting principles generally accepted in the United States, and present a meaningful presentation of our financial condition and results of operations. We believe the following critical accounting policies reflect our more significant estimates and assumptions used in the preparation of our financial statements:
Use of Estimates — These financial statements have been prepared in accordance with accounting principles generally accepted in the United States and, accordingly, require management to make estimates and assumptions that affect the reported amounts of assets and liabilities at the date of the financial statements and the reported amounts of expenses during the reporting period. Specifically, our management has estimated the expected economic life and value of our licensed technology, our net operating loss for tax purposes and our stock, option and warrant expenses related to compensation to employees and directors and consultants. Actual results could differ from those estimates.
Cash and Equivalents — Cash equivalents are comprised of certain highly liquid investments with maturity of three months or less when purchased. We maintain our cash in bank deposit accounts, which at times, may exceed federally insured limits. We have not experienced any losses in such accounts.
Intangible and Long-Lived Assets — We follow Financial Accounting Standards Board (“FASB”) Accounting Standards Codification (“ASC”) Topic 360, " Property, Plant and Equipment, " which established a "primary asset" approach to determine the cash flow estimation period for a group of assets and liabilities that represents the unit of accounting for a long lived asset to be held and used. Long-lived assets to be held and used are reviewed for impairment whenever events or changes in circumstances indicate that the carrying amount of an asset may not be recoverable. The carrying amount of a long-lived asset is not recoverable if it exceeds the sum of the undiscounted cash flows expected to result from the use and eventual disposition of the asset. Long-lived assets to be disposed of are reported at the lower of carrying amount or fair value less cost to sell. We have not recognized any impairment losses.
Research and Development Costs — Research and development costs include expenses incurred by the Company for research and development of therapeutic agents for the treatment of cancer and are charged to operations as incurred.
Stock Based Compensation — We account for our share-based compensation under the provisions of ASC Topic 718 “Compensation – Stock Compensation.”
Fair Value of Financial Instruments — Our short-term financial instruments, including cash, accounts payable and other liabilities, consist primarily of instruments without extended maturities, the fair value of which, based on management’s estimates, reasonably approximate their book value. The fair value of long term convertible notes is based on management estimates and reasonably approximates their book value after comparison to obligations with similar interest rates and maturities. The fair value of the Company’s derivative instruments is determined using option pricing models.
Recent Accounting Pronouncements
For a discussion of new accounting pronouncements affecting the Company, refer to Note 1 of Notes to Financial Statements.
Result of Operations
Our results of operations have varied significantly from year to year and quarter to quarter and may vary significantly in the future.
Revenue
We did not have revenues for the three or six months ended June 30, 2011 and 2010. We do not anticipate any revenues during 2011.
Operating Expenses
Operating expense totaled $1,695,126 and$1,514,850 for the three months ended June 30, 2011 and 2010, respectively. The increase in operating expenses results from increases in both research and development and general and administrative expenses.
33
Operating expense totaled $2,503,813 and $2,264,795 for the six months ended June 30, 2011 and 2010, respectively. The increase in operating expenses is primarily the result of an increase in general and administrative expenses.
| Three Months | Six Months | |||||||||||||||
| Ended June 30 | Ended June 30 | |||||||||||||||
| 2011 | 2010 | 2011 | 2010 | |||||||||||||
| Operating expenses: | ||||||||||||||||
| General and administrative expenses | $ | 893,889 | $ | 777,744 | $ | 1,525,939 | $ | 1,173,624 | ||||||||
| Research and development | 801,237 | 737,106 | 1,222,353 | 1,091,171 | ||||||||||||
| Research and development grant received | - | - | (244,479 | ) | - | |||||||||||
| Total operating expenses | $ | 1,695,126 | $ | 1,514,850 | $ | 2,503,813 | $ | 2,264,795 | ||||||||
General and Administrative Expenses
General and Administrative Expenses (“G&A”) expenses totaled $893,889 and $777,744 for the three months ended June 30, 2011 and 2010, respectively. The increase of $116,145 or 15% for the three months ended June 30, 2011 compared to the same period in 2010 was primarily attributable to a number of factors, including an increase in compensation of approximately $238,000 (resulting mainly from bonus compensation recorded in the second quarter of 2011 as opposed to the prior year’s bonus compensation being recorded in the first quarter of 2010) partially offset by a decrease in consulting and other fees of approximately $120,000.
G&A expenses totaled $1,525,939 and $1,173,624 for the six months ended June 30, 2011 and 2010, respectively. The increase of $352,315 or 30% for the six months ended June 30, 2011 compared to the same period in 2010 was primarily attributable to a number of factors, including increases in compensation expense of approximately $151,000 (resulting mainly from an increase in the current period bonus compensation compared to 2010), consulting and other fees of approximately $152,000 and travel and entertainment of approximately $36,000.
Research and Development Expenses
Research and development expenses totaled $801,237 and $737,106 for the three months ended June 30, 2011 and 2010, respectively. The increase of $64,131 or 9% for the three months ended June 30, 2011 compared to the same period in 2010 was attributable to an increase in compensation expense of approximately $220,000 (resulting mainly from bonus compensation recorded in the second quarter of 2011 as opposed to the prior year’s bonus compensation being recorded in the first quarter of 2010) offset by a decrease in development expense of approximately $156,000.
Research and development expenses totaled $1,222,353 and $1,091,171 for the six months ended June 30, 2011 and 2010, respectively. The increase of $131,182 or 12% for the six months ended June 30, 2011 compared to the same period in 2010 was attributable to an increase in compensation expense of approximately $107,000 (resulting mainly from an increase in the current period bonus compensation compared to 2010) and an increase in development expense of approximately $25,000.
Our research and development expenses consist primarily of expenditures for toxicology and other studies, manufacturing, clinical trials and compensation and consulting costs. Under the planning and direction of key personnel, we expect to outsource all of our Good Laboratory Practices (“GLP”) preclinical development activities (e.g., toxicology) and Good Manufacturing Practices (“GMP”) manufacturing and clinical development activities to contract research organizations (“CROs”) and contract manufacturing organizations (“CMOs”). Manufacturing will be outsourced to organizations with approved facilities and manufacturing practices.
Research and Development Grant
During 2010 we were awarded two Federal grants, totaling approximately $489,000, through the Patient Protection and Affordable Care Act, which supports investments in qualifying therapeutic discovery projects. Of this amount, we received $244,479 during the fourth quarter of 2010 and the balance of $244,479 during the first quarter of 2011. We will not receive any additional funding under these grants.
Other Income (Expenses)
Other income (expenses) totaled $1,119 of expense and $818,766 of income for the three months ended June 30, 2011 and 2010, respectively.
Other income (expenses) totaled $458,849 of income and 601,353 of expense for the six months ended June 30, 2011 and 2010, respectively.
34
| Three Months | Six Months | |||||||||||||||
| Ended June 30 | Ended June 30 | |||||||||||||||
| 2011 | 2010 | 2011 | 2010 | |||||||||||||
| Other expenses: | ||||||||||||||||
| Change in fair value of derivative liability | $ | (9,631 | ) | $ | 809,880 | $ | 443,959 | $ | (613,612 | ) | ||||||
| Interest income, net | 8,512 | 8,886 | 14,890 | 12,259 | ||||||||||||
| Total other income (expenses) | $ | (1,119 | ) | $ | 818,766 | $ | 458,849 | $ | (601,353 | ) | ||||||
Change in fair value of derivative liability
Change in fair value of derivative liability totaled $9,631 of expense during the three months ended June 30, 2011 and $809,880 of income for the three months ended June 30, 2010.
Change in fair value of derivative liability totaled $443,959 of income during the six months ended June 30, 2011 and $613,612 of expense for the six months ended June 30, 2010.
The change in the fair value of our warrant derivative liability resulted primarily from the changes in our stock price and the volatility of our common stock during the reported periods. Refer to Note 3 to the financial statements for further discussion on our warrant liabilities.
At June 30, 2011, we recalculated the fair value of our warrants subject to derivative accounting and have determined that their fair value at June 30, 2011 is $1,870,074. The value of the warrants was determined using the Black-Scholes method based on the following assumptions: (1) risk free interest rate of 0.375%; (2) dividend yield of 0%; (3) volatility factor of the expected market price of our common stock of 87%; and (4) an expected life of the warrants of 2 years. We have recorded an expense of $9,631 and a credit of $443,959 during the three and six months ended June 30, 2011, respectively, related to the change in fair value during those periods.
During the three months ended June 30, 2010, 16,667 of our warrants subject to derivative accounting were exercised into common stock. We have recorded income of $3,044 at the date of exercise related to the change in fair value from April 1, 2010 to the date of exercise. As a result of the exercise of the warrants, we have reclassified $27,516 of our warrant derivative liability to paid in capital.
At June 30, 2010, we recalculated the fair value of our remaining warrants subject to derivative accounting and have determined that their fair value at June 30, 2010 is $2,817,991. The value of the warrants was determined using the Black-Scholes method based on the following assumptions: (1) risk free interest rate of 0.625%; (2) dividend yield of 0%; (3) volatility factor of the expected market price of our common stock of 98%; and (4) an expected life of the warrants of 2 years. We have recorded income of $806,836 during the three months ended June 30, 2010 related to the change in fair value during that period.
Interest expense
We had net interest income of $8,512 and $8,886 for the three months ended June 30, 2011 and 2010, respectively. We had net interest income of $14,890 and $12,259 for the six months ended June 30, 2011 and 2010, respectively. The increase in net interest income was attributable to an increase in interest earned on deposits.
Liquidity and Capital Resources
Since our inception, we have financed our operations primarily through the private placement of our securities. Our current monthly cash burn rate is approximately $500,000. This will increase to $800,000 per month in the 4 th quarter 2011 primarily due to G-115 development costs. The monthly burn rate is expected to be $600,000 during the first half of 2012 as we embark upon Phase II clinical studies with G-202 and a Phase I study for G-115. We anticipate that our available cash and expected income will be sufficient to finance most of our current activities for at least the next 12 months from June 30, 2011.
| Six Months | ||||||||
| Ended June 30 | ||||||||
| 2011 | 2010 | |||||||
| Cash & Cash Equivalents | $ | 7,913,548 | $ | 4,498,942 | ||||
| Net cash used in operating activities | (1,360,612 | ) | (1,343,080 | ) | ||||
| Net cash provided by financing activities | 5,603,009 | 3,586,711 | ||||||
Cash and cash equivalents totaled $7,913,548 and $4,498,942 as of June 30, 2011 and 2010, respectively. The increase of $3,414,606 at June 30, 2011 compared to the same period in 2010 was attributable to capital raised through equity sales during the first 6 months of 2011.
35
Net Cash Used in Operating Activities
In our operating activities we used cash of $1,360,612 and $1,343,080 for the six months ended June 30, 2011 and 2010, respectively. The increase of $17,532 in cash used for operations during the six months ended June 30, 2011, compared to the same period in 2010, was primarily attributable to an increase in loss of $550,524 (after adjusting for non-cash items, partially offset by an increase in accounts payable of $532,992.
Net Cash Provided by Financing Activities
Cash provided by financing activities was $5,603,009 and $3,586,711 for the six months ended June 30, 2011 and 2010, respectively.
Listed below are key financing transactions we entered into during 2010 and year to date through June 30, 2011.
| · | In January and March of 2010, we sold 533,407 units resulting in gross proceeds of approximately $880,000. |
| · | In May of 2010, we sold 1,347,500 units resulting in gross proceeds of approximately $2,695,000. |
| · | In January and February of 2011, we sold 2,303,100 units resulting in gross proceeds of $4,146,000 (of which approximately $612,000 had been received as of December 31, 2010). |
| · | In April of 2011, we sold 1,363,622 units resulting in gross proceeds of $2,249,750. |
We have incurred significant operating losses and negative cash flows since inception. We have not achieved profitability and may not be able to realize sufficient revenue to achieve or sustain profitability in the future. We do not expect to be profitable in the next several years, but rather expect to incur additional operating losses. We have limited liquidity and capital resources and must obtain significant additional capital resources in order to sustain our product development efforts, for acquisition of technologies and intellectual property rights, for preclinical and clinical testing of our anticipated products, pursuit of regulatory approvals, acquisition of capital equipment, laboratory and office facilities, establishment of production capabilities, for general and administrative expenses and other working capital requirements. We rely on cash balances and the proceeds from the offering of our securities, the exercise of outstanding warrants and grants to fund our operations.
The source, timing and availability of any future financing will depend principally upon market conditions, interest rates and, more specifically, on our progress in our exploratory, preclinical and future clinical development programs. Funding may not be available when needed — at all, or on terms acceptable to us. Lack of necessary funds may require us, among other things, to delay, scale back or eliminate some or all of our research and product development programs, planned clinical trials, and/or our capital expenditures or to license our potential products or technologies to third parties.
MANAGEMENT
Directors
The following sets forth the current members of our board of directors (“Board”) and information concerning their ages and background. All directors hold office until the next annual meeting of stockholders or until their respective successors are elected, except in the case of death, resignation or removal:
| Name | Principal Occupation | Age | Director Since | |||
| Craig A. Dionne, PhD | Chief Executive Officer, Chief Financial Officer, President and Director of GenSpera | 54 | 11/2003 | |||
| Bo Jesper Hansen, MD, PhD | Executive Chairman of the Board of Swedish Orphan Biovitrum AB (STO: SOBI) | 52 | 08/2010 | |||
| Scott Ogilvie | President and CEO of AFin International, Inc. | 57 | 02/2008 |
36
Craig A. Dionne, PhD, age 54, has over 23 years of experience in the pharmaceutical industry, including direct experience of identifying promising oncology treatments and bringing them through the clinic. For example, he served for five years as VP Discovery Research at Cephalon, Inc. where he was responsible for its oncology and neurobiology drug discovery and development programs. Dr. Dionne has also recently served as EVP at the Prostate Cancer Research Foundation. In addition to extensive executive experience, Dr. Dionne’s productive scientific career has led to 6 issued patents and co-authorship of many scientific papers. In evaluating Mr. Dionne’s specific experience, qualifications, attributes and skills in connection with his appointment to our board, we took into account his 23 year career in pharmaceutical drug discovery and development, prior work for our company in additional to being one of our founders, familiarity with our technologies, and academic background.
Bo Jesper Hansen, MD, PhD, age 53, joined our board in August of 2010. Dr. Hansen is currently the Executive Chairman of the Board of Swedish Orphan Biovitrum AB (STO: SOBI), an international growth company specializing in the development, registration, marketing and distribution of pharmaceutical drugs for rare and life-threatening diseases. Dr. Hansen has held the position since January of 2010 as a result of the merger of Swedish Orphan International AB Group and Biovitrum. Prior to the merger, Dr. Hansen served in numerous positions with Swedish Orphan International AB Group, including, from 1998 to 2010, CEO, President and Director of the Board. Dr. Hanson’s responsibilities at the company include establishment, development and expansion of the company’s operations in Europe, Japan, the Americas and Australia. Dr. Hansen holds a Doctor of Medicine degree from the University of Copenhagen with a specialty in urology. Dr. Hansen also serves on the boards of CMC AB, MipSalus ApS, Incentive AB (Gambro), Orphazyme ApS, Novagali SAS and TopoTarget A/S (NASDAQ OMX: TOPO), Hyperion Therapeutics Inc. and Zymenex A/S. In evaluating Dr. Hansen’s specific experience, qualifications, attributes and skills in connection with his appointment to our board, we took into account his prior work with both public and private organizations including his experience in building biopharmaceutical organizations, his strong business development background and experience with mergers and acquisitions and his past experience and relationships in the biopharma and biotech field.
Scott Ogilvie, age 57, is President of AFIN International, Inc. a private equity/business advisory firm, which he founded in 2006. Prior to December 31, 2009, he was CEO of Gulf Enterprises International, Ltd, ("Gulf") a company that brings strategic partners, expertise and investment capital to the Middle East and North Africa. He held this position since August of 2006. Mr. Ogilvie previously served as Chief Operating Officer of CIC Group, Inc., an investment manager, a position he has held from 2001 to 2007. He began his career as a corporate and securities lawyer with Hill, Farrer & Burrill, and has extensive public and private corporate management and board experience in finance, real estate, and technology companies. Mr. Ogilvie currently serves on the board of directors of Neuralstem, Inc. (NYSE AMEX:CUR), Preferred Voice Inc., (OTCBB:PRFV) and Derycz Scientific, Inc. (OTCBB: DYSC) and National Healthcare Exchange (NHXS). In evaluating Mr. Ogilvie’s specific experience, qualifications, attributes and skills in connection with his appointment to our board, we took into account his prior work in both public and private organizations regarding corporate finance, securities and compliance and international business development.
Executive Officers and Significant Employees
The following sets forth our current executive officers and information concerning their age and background:
| Name | Position | Age | Position Since | |||
| Craig A. Dionne, PhD | Chief Executive Officer, Chief Financial Officer and President | 54 | 11/2003 | |||
| Russell Richerson, PhD | Chief Operating Officer and Secretary | 59 | 07/2008 |
Craig A. Dionne, PhD – See Bio in Directors Section
Russell Richerson, PhD, age 59, has over 25 years of experience in the Biotechnology/Diagnostics industry, including 11 years at Abbott Laboratories in numerous management roles. Most recently, he has served as Vice President of Diagnostic Research and Development at Prometheus Laboratories (2001-2004) and then as Chief Operating Officer of the Molecular Profiling Institute (2005-2008).
Family Relationships
There are no family relationships between any director, executive officer, or person nominated or chosen by the registrant to become a director or executive officer.
Code of Ethics
We have adopted a "Code of Ethics” that applies to our principal executive officer, principal financial officer, principal accounting officer or controller, or persons performing similar functions. A copy of our code can be viewed on our website at www.genspera.com .
37
Committees
The board of directors has established three standing committees: (1) an Audit Committee, (2) a Nominating and Corporate Governance Committee, and (3) a Leadership Development and Compensation Committee. Each of the committees operates under a written charter adopted by the board of directors. All of the committee charters are available on our web site at www.genspera.com. The committee membership and the function of each of the committees are described below.
| Director | Audit Committee | Nominating and Corporate Governance Committee | Leadership Development and Compensation Committee | |||
| Scott V. Ogilvie | Chair | Chair | Member | |||
| Bo Jesper Hansen, MD, PhD | Member | Member | Chair |
Executive compensation is determined by the Leadership Development and Compensation Committee.
Independent Directors
For purposes of determining independence, the Company has adopted the definition of independence as contained in NASDAQ Market Place Rules 4200. Pursuant to the definition, the Company has determined that Messrs. Ogilvie and Hansen qualify as independent.
EXECUTIVE COMPENSATION
Summary Compensation
The following table sets forth information for our most recently completed fiscal year concerning the compensation of Craig Dionne our Chief Executive Officer (“CEO”) and all other executive officers of GenSpera, Inc. who earned over $100,000 in salary and bonus during the last most recently completed fiscal years ended December 31, 2010 and 2009 (together the “Named Executive Officers”).
Name & Principal Position | Year | Salary ($) | Bonus ($) | Stock Awards ($) | Option Awards ($) | All Other Compensation ($) | Total ($) | |||||||||||||||||||
Craig Dionne, PhD | 2010 | 270,000 | 60,000 | - | 270,000 | (1) | 23,744 | 623,744 | ||||||||||||||||||
Chief Executive | 2009 | 240,000 | - | - | 918,413 | (2) | 23,369 | 1,181,782 | ||||||||||||||||||
| Officer/Chief | ||||||||||||||||||||||||||
| Financial Officer | ||||||||||||||||||||||||||
Russell Richerson, PhD | 2010 | 220,000 | 40,000 | - | 240,000 | (3) | 9,633 | 509,633 | ||||||||||||||||||
| Chief Operating Officer | 2009 | 200,000 | - | - | 720,415 | (4) | 10,796 | 931,211 | ||||||||||||||||||
(1) Mr. Dionne was awarded a long term incentive grant, aggregating 302,580 options, on July 1, 2011 as payment of additional 2010 compensation. The grant was valued using the Black-Sholes option pricing model with the following assumptions: (i) exercise price of $2.01 per share; (ii) fair value of a share of common stock of $1.83; (iii) volatility of 87%; (iv) dividend rate of 0%; (v) risk free interest rate of 0.375%; and (vi) estimated life of 2.5 years. The options vested upon grant and will lapse if unexercised on July 1, 2018.
(2) Mr. Dionne was awarded an option grant on September 2, 2009 in the amount of 1,000,000 shares. The grant was valued using the Black-Sholes option pricing model with the following assumptions: (i) exercise price of $1.65 per share; (ii) fair value of a share of common stock of $1.17; (iii) volatility of 188%; (iv) dividend rate of 0%; (v) risk free interest rate of 1%; and (vi) estimated life of 2 years. 500,000 options vested upon grant and 500,000 options will vest upon the attainment of certain milestones. The options lapse if unexercised on September 2, 2016.
(3) Mr. Richerson was awarded a long term incentive grant, aggregating 256,790 options, on July 1, 2011 as payment of additional 2010 compensation. The grant was valued using the Black-Sholes option pricing model with the following assumptions: (i) exercise price of $1.83 per share; (ii) fair value of a share of common stock of $1.83; (iii) volatility of 87%; (iv) dividend rate of 0%; (v) risk free interest rate of 0.375%; and (vi) estimated life of 2.5 years. The options vested upon grant and will lapse if unexercised on July 1, 2018.
38
(4) Mr. Richerson was awarded an option grant on September 2, 2009 in the amount of 775,000 shares. The grant was valued using the Black-Sholes option pricing model with the following assumptions: (i) exercise price of $1.50 per share; (ii) fair value of a share of common stock of $1.17; (iii) volatility of 188%; (iv) dividend rate of 0%; (v) risk free interest rate of 1%; and (vi) estimated life of 2 years. 400,000 options vested upon grant and 375,000 options will vest upon the attainment of certain milestones. The options lapse if unexercised on September 2, 2016.
Outstanding Equity Awards at Fiscal Year-End
| Option Awards | Stock Awards | ||||||||||||||||||||||||||||||||
| Name | Number of Securities Underlying Unexercised Options (#) Exercisable | Number of Securities Underlying Unexercised Options (#) Unexercisable | Equity Incentive Plan Awards: Number of Securities Underlying Unexercised Unearned Options (#) | Option Exercise Price ($) | Option Expiration Date | Number of Shares or Units of Stock That Have Not Vested (#) | Market Value of Shares or Units of Stock That Have Not Vested ($) | Equity Incentive Plan Awards: Number of Unearned Shares, Units or Other Rights That Have Not Vested (#) | Equity Incentive Plan Awards: Market or Payout Value of Unearned Shares, Units or Other Rights That Have Not Vested ($) | ||||||||||||||||||||||||
| Craig Dionne, PhD | 650,000 | - | 350,000 | $ | 1.65 | 09/02/16 | - | - | - | - | |||||||||||||||||||||||
| CEO/CFO | |||||||||||||||||||||||||||||||||
| Russell Richerson, PhD | 512,500 | - | 262,500 | $ | 1.50 | 09/02/16 | - | - | - | - | |||||||||||||||||||||||
| Chief Operating Officer | |||||||||||||||||||||||||||||||||
Director Compensation
| Name | Fees Earned or Paid in Cash ($) | Stock Awards ($) | Option Awards ($) | Non-quity Incentive Plan Compensation ($) | Non-Qualified Deferred Compensation Earnings ($) | All Other Compensation ($) | Total ($) | |||||||||||||||||||||
| Craig Dionne PhD | - | - | - | - | - | - | - | |||||||||||||||||||||
| John Farah PhD | - | - | 25,454 | (1) | - | - | - | 25,454 | ||||||||||||||||||||
| Scott Ogilvie | - | - | 28,625 | (2) | - | - | - | 28,625 | ||||||||||||||||||||
| Bo Jesper Hansen MD, PhD | - | - | 26,974 | (3) | - | - | - | 26,974 | ||||||||||||||||||||
| (1) | Mr. Farah was awarded an option grant on February 24, 2010 in the amount of 39,000 shares. The grant was valued using the Black-Sholes option pricing model with the following assumptions: (i) exercise price of $2.14 per share; (ii) fair value of a share of common stock of $2.14; (iii) volatility of 99%; (iv) dividend rate of 0%; (v) risk free interest rate of 0.245%; and (vi) estimated life of 0.625 years. The options vest quarterly over one year. The options became fully vested upon Mr. Farah's resignation as a director on August 16, 2010. |
| (2) | Mr. Ogilvie was awarded an option grant on March 1, 2010 in the amount of 38,000 shares. The grant was valued using the Black-Sholes option pricing model with the following assumptions: (i) exercise price of $2.47 per share; (ii) fair value of a share of common stock of $2.47; (iii) volatility of 99%; (iv) dividend rate of 0%; (v) risk free interest rate of 0.245%; and (vi) estimated life of 0.625 years. The options vest quarterly over one year. |
| (3) | Mr. Hansen was awarded an option grant on August 14, 2010 in the amount of 63,000 shares. The grant was valued using the Black-Sholes option pricing model with the following assumptions: (i) exercise price of $2.00 per share; (ii) fair value of a share of common stock of $2.00; (iii) volatility of 88%; (iv) dividend rate of 0%; (v) risk free interest rate of 0.193%; and (vi) estimated life of 0.38 years. Of these options, 25,000 vested upon grant and the remaining 38,000 vest quarterly over one year. |
Employment Agreements and Change in Control
On September 2, 2009, we entered into written employment agreements with Messrs. Dionne and Richerson.
Craig Dionne
39
In connection with Mr. Dionne’s employment, we have entered into: (i) an employment agreement; (ii) a severance agreement; (iii) a proprietary information, inventions and competition agreement; and (iv) an indemnification agreement.
Employment Agreement
We employ Craig Dionne as our Chief Executive Officer for a term of 5 years. As compensation for his services, Mr. Dionne receives a base salary of $300,000 per year effective January 1, 2011. During 2010, Mr. Dionne’s base salary was $270,000 per year. Such base salary is reviewed yearly with regard to possible increase. In addition, Mr. Dionne is eligible to receive annual and discretionary bonuses as determined by the Board. Mr. Dionne is also entitled to receive certain payments and acceleration of outstanding equity awards in the event his employment is terminated. As part of the agreement, Mr. Dionne was also granted options to purchase 1,000,000 shares of Common Stock with an exercise price of $1.65 per share and a term of seven years. The options were issued pursuant to our 2009 Plan and vest, if at all, upon the achievement of the following milestones:
| · | Options to purchase an aggregate of 500,000 shares were vested immediately. The options represent compensation for prior services and an inducement grant. |
| · | 150,000 options vest upon: (i) the Company’s Common Stock becoming listed on a national exchange or on the Over-the-Counter Bulletin Board; and (ii) the enrollment of the first patient in a Phase 1 clinical trial for G-202. ( This milestone was achieved on January 19, 2010 .) |
| · | 200,000 options vest upon: (i) enrollment of first patient in a second Phase 1 clinical trial; (ii) enrollment of first patient in a Phase II clinical trial or an expanded cohort in a Phase 1B clinical trial; or (iii) enrollment of tenth patient in a Phase II clinical trial or in an expanded cohort in a phase 1B clinical trial. |
| · | 150,000 options vest upon an additional: (i) enrollment of first patient in a second Phase 1 clinical trial; (ii) enrollment of first patient in a Phase II clinical trial or an expanded cohort in a Phase 1B clinical trial; or (iii) enrollment of tenth patient in a Phase II clinical trial or in an expanded cohort in a phase 1B clinical trial. (For purposes of clarity, these milestones are in addition to those required for the vesting of options to purchase 200,000 shares of Common Stock as contained in the paragraph immediately above.) |
Severance Agreement
The severance agreement provides for certain payments, as described below, in the event Mr. Dionne’s employment is terminated in connection with a change in control.
Proprietary Information, Inventions and Competition Agreement
The proprietary information, inventions and competition agreement requires Mr. Dionne to maintain the confidentiality of the Company’s intellectual property as well as the assignment of any inventions made by Mr. Dionne during his employment. The agreement also limits Mr. Dionne’s ability to compete within certain fields of interest, as defined in the agreement, for a period of 18 months following the end of his employment.
Indemnification Agreement
The indemnification agreement provides for the indemnification and defense of Mr. Dionne, in the event of litigation, to the fullest extent permitted by law. The Company has also adopted the form of indemnification agreement for use with its other executive officers, employees and directors.
Potential Payments upon Termination or Change-in-Control
As part of the agreements, Mr. Dionne shall be entitled to
| Officer | Salary | Bonus | Health | Accelerated Vesting | Total | |||||||||||||||
| Craig Dionne | ||||||||||||||||||||
| Terminated without cause (1) | $ | 900,000 | (2) | $ | 0 | (3) | $ | 72,000 | (4) | $ | 140,000 | (5) | $ | 1,112,000 | ||||||
| Terminated, change of control | $ | 1,440,000 | $ | 0 | (3) | $ | 72,000 | (4) | $ | 140,000 | (5) | $ | 1,652,000 | |||||||
| Termination for Cause, Death, Disability and by executive without Good Reason | $ | 300,000 | — | — | — | $ | 300,000 | |||||||||||||
40
| (1) | Also includes termination by Mr. Dionne with Good Reason |
| (2) | Represents 36 months of Mr. Dionne’s base salary of $300,000. |
| (3) | There has been no bonus established for the current year. |
| (4) | Represents 36 months of Mr. Dionne’s monthly health care reimbursement of $2,000. |
| (5) | Represents: (i) difference between the trading price of $2.05 as of December 31, 2010 and the options exercise price, and (ii) market value of restricted stock awards and units as of December 31, 2010. |
The foregoing summary of Mr. Dionne’s: (i) employment agreement; (ii) severance agreement; (iii) proprietary information, inventions and competition agreement; and (iv) indemnification agreement are qualified in their entirety by reference to the full text of the agreements which are attached hereto as exhibits and incorporated hereby by reference.
Russell Richerson
In connection with Mr. Richerson’s employment, we have entered into: (i) an employment agreement; (ii) a proprietary information, inventions and competition agreement; and (iii) an indemnification agreement.
Employment Agreement
We employ Russell Richerson as our Chief Operating Officer for a term of 3 years. As compensation for his services, Mr. Richerson receives a base salary of $270,000 per year, effective January 1, 2011. During 2010, Mr. Richerson’s base salary was $220,000 per year. Such base salary is reviewed yearly with regard to possible increase. In addition, Mr. Richerson is eligible to receive annual and discretionary bonuses as determined by the Board. Mr. Richerson is also entitled to receive certain payments and acceleration of outstanding equity awards in the event his employment is terminated and as described below. As part of the agreement, Mr. Richerson was also granted options to purchase 775,000 shares of Common Stock with an exercise price of $1.50 per share and have a term of 7 years. The options were issued pursuant to the 2009 Plan and vest upon the achievement of the following milestones:
| · | Options to purchase an aggregate of 350,000 shares were vested immediately. The options represent compensation for prior services and an inducement grant. |
| · | 112,500 options vest upon: (i) development of a plan acceptable to the Company’s CEO for the synthesis and/or purification of G-202 bulk from first synthesis to enough G-202 API to complete Phase I and Phase II clinical trials for G-202; (ii) develop and implement plan to define site and studies for G-202 propagation and determination of Thapsigargin distribution in plan parts; (iii) the Company’s Common Stock becoming listed on a national exchange or on the Over-the-Counter Bulletin Board; and (iv) the enrollment of the first patient in a Phase 1 clinical trial for G-202. (This milestone was achieved on January 19, 2010.) |
| · | 150,000 options vest upon: (i) enrollment of first patient in a second Phase 1 clinical trial; (ii) enrollment of first patient in a Phase II clinical trial or an expanded cohort in a Phase 1B clinical trial; or (iii) enrollment of tenth patient in a Phase II clinical trial or in an expanded cohort in a phase 1B clinical trial. |
| · | 112,500 options vest upon an additional: (i) enrollment of first patient in a second Phase 1 clinical trial; (ii) enrollment of first patient in a Phase II clinical trial or an expanded cohort in a Phase 1B clinical trial; or (iii) enrollment of tenth patient in a Phase II clinical trial or in an expanded cohort in a phase 1B clinical trial. (For purposes of clarity, these milestones are in additional to those required for the vesting of options to purchase 150,000 shares of Common Stock as contained in the paragraph immediately above.) |
Proprietary Information, Inventions and Competition Agreement
The proprietary information, inventions and competition agreement requires Mr. Richerson to maintain the confidentiality of the Company’s intellectual property as well as the assignment of any inventions made by Mr. Richerson during his employment. The agreement also limits Mr. Richerson’s ability to compete within certain fields of interest, as defined in the agreement, for a period of 18 months following end of his employment.
41
Indemnification Agreement
The indemnification agreement provides for the indemnification and defense of Mr. Richerson, in the event of litigation, to the fullest extent permitted by law.
Potential Payments Upon Termination or Change-in-Control
As part of the agreements, Mr. Richerson shall be entitled to
| Officer | Salary | Bonus | Health | Accelerated Vesting of Options | Total | |||||||||||||||
| Russell Richerson | ||||||||||||||||||||
| Terminated without cause (1) | $ | 405,000 | (2) | $ | 0 | (3) | $ | 27,000 | (4) | $ | 144,375 | (5) | $ | 576,375 | ||||||
| Terminated, change of control | $ | — | — | — | 144,375 | (5) | $ | 144,375 | ||||||||||||
| Disability | $ | 270,000 | — | — | — | $ | 270,000 | |||||||||||||
| (1) | Also includes termination by Mr. Richerson with Good Reason |
| (2) | Represents 18 months of Mr. Richerson’s base salary of $270,000. |
| (3) | There has been no bonus established for the current year. |
| (4) | Represents 18 months of Mr. Richerson’s monthly health care reimbursement of $1,500. |
| (5) | Represents: (i) difference between the trading price of $2.05 as of December 31, 2010 and the options exercise price, and (ii) market value of restricted stock awards and units as of December 31, 2010. |
The foregoing summary of Mr. Richerson’s: (i) employment agreement; (ii) proprietary information, inventions and competition agreement; and (iii) indemnification agreement are qualified in their entirety by reference to the full text of the agreements which are attached hereto as Exhibits and which are incorporated herein in their entirety by reference.
Director Compensation
Pursuant to the terms of our non-executive director compensation policy, non-employee directors will be entitled to the following compensation for service on our Board:
Inducement/First Year Grant. Upon joining the Board, individual will receive options to purchase 50,000 shares of our common stock. The options vest as follows: (i) 25,000 immediately upon appointment to the Board; and (ii) 25,000 vesting quarterly over the following 12 months.
Annual Grant. Subject to shareholder rights to elect any individual director, starting on the first year anniversary of service, and each subsequent anniversary thereafter, each eligible director will be granted options to purchase 25,000 shares of common stock. The annual grants vest quarterly during the grant year.
Committee and Committee Chairperson Grant. Each director will receive options to purchase an additional 4,000 shares of common stock for each committee on which he or she serves. Chairpersons of each committee will receive options to purchase an additional 1,000 share common stock. The committee grants vest quarterly during the grant year.
Special Committee Grants. From time to time, individual directors may be requested by the Board to provide extraordinary services. These services may include such items as the negotiation of key contracts, assistance with scientific issues, or such other items as the Board deems necessary and in the best interest of the Company and our shareholders. In such instances, the Board shall have the flexibility to issue special committee grants. The amount of such grants and terms will vary commensurate with the function and tasks of the special committee.
Exercise Price and Term. All options issued pursuant to the non-executive board compensation policy will have an exercise price equal to the fair market value of the Company’s common stock at close of market on the grant date. The term of the options shall be for a period of 5 years from the grant date.
Cash Compensation. Effective January 1, 2011, our eligible directors will also receive cash compensation equal to: (i) an annual cash retainer of $25,000, and (ii) a per committee cash award of $3,334. Cash compensation to directors is paid quarterly on each member’s 3 month anniversary of joining the Board or respective committees thereof.
42
CERTAIN RELATIONSHIPS AND RELATED TRANSACTIONS
Information regarding disclosure of an employment relationship or transaction involving an executive officer and any related compensation solely resulting from that employment relationship or transaction is incorporated by reference from the section of this Prospectus entitled “Executive Compensation.”
Information regarding disclosure of compensation to a director is incorporated by reference from the section of this Prospectus entitled “Director Compensation.”
| · | On January 7, 2008, we granted 100,000 shares of common stock, valued at $50,000, to a Mr. Burgoon, a former director, as compensation for serving on the board. The shares vested upon grant. |
| · | On February 1, 2008, we granted each of Messrs. Isaacs and Denmeade, our Scientific Advisors, common stock purchase options to purchased 60,000 shares, as compensation for joining the Company’s scientific advisory board. The options have an exercise price of $0.50 per share. The options vest in equal installments quarterly over a period of three years commencing March 31, 2008, and lapse if unexercised on January 31, 2018. |
| · | In March of 2008, we granted options to purchase an aggregate of 300,000 (100,000 each) common shares to our directors Messrs. Farah and Ogilvie as well as our former director Mr. Burgoon. Each director received options to purchase 100,000 common shares at an exercise price of $0.50 per share. Each director’s grant vests 50,000 upon grant with the balance vesting quarterly over a period of two years commencing March 31, 2008, and lapses if unexercised on April 1, 2018. |
| · | On March 7, 2008, we issued 31,718 shares of common stock to our Chief Executive Officer and President, Craig A. Dionne, PhD, as payment of accrued interest in the amount of $15,859. |
| · | On March 11, 2008 we exercised our option to license certain intellectual property from Messrs. Isaacs and Denmeade. As consideration for the option exercise, we paid each of Isaacs and Denmeade: (i) $37,995.90 which they immediately transferred to John Hopkins University as repayment of past patent costs; and (ii) $18,997 as a “gross-up” to pay for relevant tax consequences of the option exercise payment. |
| · | In April of 2008, Messrs. Isaacs and Denmeade transferred to the Company their interest in the intellectual property licensed on March 11, 2008. |
| · | In October of 2008, we granted options to purchase an aggregate of 15,000 common shares to our director Scott Ogilvie at an exercise price of $1.00 per share. The options vested on the date of grant and lapse if unexercised on October 16, 2018. |
| · | On February 17, 2009, we entered into a modification with Craig Dionne, our Chief Executive Officer and Chairman with regard to our 4% Convertible Promissory Note issued to Mr. Dionne in the amount of $35,000. Pursuant to the modification, Mr. Dionne agreed to extend the maturity date of the Note from December 2, 2008 to December 2, 2009. Mr. Dionne had previously deferred repayment of the note. As consideration for the modification, we issued Mr. Dionne a common stock purchase warrant entitling Mr. Dionne to purchase 11,000 shares of our common stock at a per share purchase price of $1.50. The warrant has a five year term and contains certain anti-dilution provisions requiring us to adjust the exercise price and number of shares upon the occurrence of a stock split, stock dividends or stock consolidation. |
| · | On September 2, 2009, we issued Messrs. Dionne and Richerson common stock purchase options to purchase an aggregate of 1,775,000 common shares. For a further description of the grant, refer to the section of this registration statement entitled “Employment Agreements and Change of Control.” |
| · | On September 2, 2009, we entered into indemnification agreements with our Executive Officers. |
| · | On September 28, 2009, we paid off the promissory note payable to Craig Dionne, our Chief Executive Officer, that was originally entered into on September 29, 2004. The balance of the note, including principal and interest was $15,996. |
| · | On December 2, 2009, we paid off the promissory note payable to Craig Dionne, our Chief Executive Officer, that was originally entered into on December 2, 2003. The balance of the note, including principal and interest was $37,462. |
43
| · | In February of 2010, we granted John M. Farah, Jr., PhD, one of our former outside directors, options to purchase 39,000 common shares. The options were granted pursuant to our director compensation plan as compensation for Dr. Farah’s service on our Board and related committees. The options have an exercise price of $2.14 per share, a term of 5 years and vest quarterly over the grant year. |
| · | In March of 2010, we granted Scott Ogilvie, one of our outside directors, options to purchase 38,000 common shares. The options were granted pursuant to our director compensation plan as compensation for Mr. Ogilvie’s service on our Board and related committees. The options have an exercise price of $2.47 per share, a term of 5 years and vest quarterly over the grant year. |
| · | In May of 2010, we issued our Craig Dionne, our CEO, and Russell Richerson, our COO, an aggregate of 43,479 common shares as payment for their 2009 discretionary bonuses. The shares were valued at $2.30 which represents their fair market value on the grant date of May 14, 2010. |
| · | On August 16, 2010, upon joining the board, we granted Bo Jesper Hansen MD PhD, options to purchase 63,000 common shares. The options were granted pursuant to our director compensation plan as compensation for Bo Jesper Hansen MD PhD’s service on our Board and related committees. The options have an exercise price of $2.00 per share and a term of 5 years. Of the Options granted, 25,000 vested upon grant with the balance vest quarterly over the grant year. Additionally, we also entered into our standard indemnification agreement with Bo Jesper Hansen MD PhD |
| · | On August 16, 2010, upon the effective date of John M. Farah, Jr. PhD’s resignation, we vested all of his unvested common stock purchase options. The options have a weighted average exercise price of $2.14. We also agreed to allow Mr. Farah to exercise such options at any time during their term. |
| · | During our January and February offerings, Kihong Kwon, MD, (including related and/or affiliated entities), purchased 1,773,804 units on the same terms and conditions as the other investors in the offering. Prior to the transaction, Dr. Kwon was not a related person. |
| · | In March of 2011, we granted Scott Ogilvie, one of our outside directors, options to purchase 39,000 common shares. The options were granted pursuant to our director compensation plan as compensation for Mr. Ogilvie’s service on our Board and related committees. The options have an exercise price of $1.90 per share, a term of 5 years and vest quarterly over the grant year. |
| · | During our April offerings, Kihong Kwon, MD, (including related and/or affiliated entities), purchased 1,212,122 units on the same terms and conditions as the other investors in the offering. |
| · | On May 18, 2011, we granted each of Messrs. Isaacs and Denmeade, our Scientific Advisors, common stock purchase options to purchased 20,000 shares, as compensation for serving on the Company’s scientific advisory board. The options have an exercise price of $1.85 per share. The options vest on the following schedule: 5,000 shares vested immediately and the rest vest in equal installments quarterly during the year beginning June 30, 2011, and lapse if unexercised on May 18, 2016. |
| · | As of September 1, 2011, we have 3 promissory notes payable to Mr. Dionne, or Chief Executive Officer. Each note accrues interest at 4.2% per annum. The loans were originally made in order to provide us with working capital. The aggregate balance of the notes is $105,000 in principal and $15,465 in accrued interest. The notes and accrued interest are convertible into common shares at a price per share of $0.50. |
PRINCIPAL STOCKHOLDERS
The following table sets forth, as of September 1, 2011, information regarding beneficial ownership of our capital stock by:
| · | each person, or group of affiliated persons, known by us to be the beneficial owner of 5% or more of any class of our voting securities; |
| · | each of our current directors and nominees; |
| · | each of our current named executive officers; and |
| · | all current directors and named executive officers as a group. |
44
Beneficial ownership is determined according to the rules of the SEC. Beneficial ownership means that a person has or shares voting or investment power of a security and includes any securities that person or group has the right to acquire within 60 days after the measurement date. This table is based on information supplied by officers, directors and principal stockholders. Except as otherwise indicated, we believe that each of the beneficial owners of the common stock listed below, based on the information such beneficial owner has given to us, has sole investment and voting power with respect to such beneficial owner’s shares, except where community property laws may apply.
| Common Stock | ||||||||||||||||
| Name and Address of Beneficial Owner(1) | Shares | Shares Underlying Convertible Securities(2) | Total | Percent of Class(2) | ||||||||||||
| Directors and named Executive Officers | ||||||||||||||||
| Craig Dionne, PhD | 2,464,749 | 1,204,510 | 3,669,259 | 16.2 | % | |||||||||||
| Russell B. Richerson, PhD(3) | 942,392 | 769,290 | 1,711,682 | 7.7 | % | |||||||||||
| John M. Farah, PhD(4) | — | 139,000 | 139,000 | * | ||||||||||||
| Bo Jesper Hansen, MD, PhD | — | 63,000 | 63,000 | * | ||||||||||||
| Scott Ogilvie | — | 172,500 | 172,500 | * | ||||||||||||
| All directors and executive officers as a group (5 persons) | 3,407,141 | 2,348,300 | 5,755,441 | 24.2 | % | |||||||||||
| Beneficial Owners of 5% or more | ||||||||||||||||
| John T. Isaacs, PhD(5) | 1,271,528 | 75,000 | 1,346,528 | 6.3 | % | |||||||||||
| Samuel R. Denmeade, MD(6) | 1,271,528 | 75,000 | 1,346,528 | 6.3 | % | |||||||||||
| Kihong Kwon, MD(7) | 3,151,260 | — | 3,151,260 | 14.7 | % | |||||||||||
| * | Less than one percent. |
| (1) | Except as otherwise indicated, the persons named in this table have sole voting and investment power with respect to all shares of common stock shown as beneficially owned by them, subject to community property laws where applicable and to the information contained in the footnotes to this table. Unless otherwise indicated, the address of the beneficial owner is GenSpera, Inc., 2511 N Loop 1604 W, Suite 204, San Antonio, TX 78258. |
| (2) | Pursuant to Rules 13d-3 and 13d-5 of the Exchange Act, beneficial ownership includes any shares as to which a shareholder has sole or shared voting power or investment power, and also any shares which the shareholder has the right to acquire within 60 days, including upon exercise of common shares purchase options or warrants. There are 21,443,735 shares of common stock issued and outstanding as of September 1, 2011. |
| (3) | 5050 East Gleneagles Drive, Tucson, AZ 85718 |
| (4) | Dr. Farah served as one of our directors from February of 2008 through August of 2010. |
| (5) | 13638 Poplar Hill Road, Phoenix, MD 21131 |
| (6) | 5112 Little Creek Drive, Ellicott City, MD 21043 |
| (7) | 1015 E. Chapman, Suite 201, Fullerton, CA 92831. Does not include warrants or convertible securities subject to exercise conditions based on percentage ownership. |
INDEMNIFICATION OF DIRECTORS AND OFFICERS
The Corporation Laws of the State of Delaware and the Company's Bylaws provide for indemnification of the Company's Directors for expenses actually and necessarily incurred by them in connection with the defense of any action, suit or proceeding in which they, or any of them, are made parties, or a party, by reason of having been Director(s) or Officer(s) of the corporation, or of such other corporation, except, in relation to matter as to which any such Director or Officer or former Director or Officer or person shall be adjudged in such action, suit or proceeding to be liable for negligence or misconduct in the performance of duty. Furthermore, the personal liability of the Directors is limited as provided in the Company's Articles of Incorporation.
45
Insofar as indemnification for liabilities arising under the Securities Act of 1933 may be permitted to directors, officers or persons controlling the Company pursuant to the foregoing provisions, the Company has been informed that in the opinion of the Securities and Exchange Commission such indemnification is against public policy as expressed in the Securities Act of 1933 and is therefore unenforceable.
EXPERTS
The financial statements as of December 31, 2010 and 2009 and for each interim period since December 31, 2010, included in this prospectus and in the registration statement of which it forms a part, have been so included in reliance on the report of RBSM LLP, our independent registered public accounting firm, appearing elsewhere in this prospectus and the registration statement of which it forms a part, given on the authority of said firm as experts in auditing and accounting.
INTERESTS OF NAMED EXPERTS AND COUNSEL
The Silvestre Law Group, P.C. has given us an opinion relating to the issuance of the common stock being registered. The Silvestre Law Group, P.C. or its various principals and/or affiliates, 225,000 shares of our common stock and options and/or warrants to purchase 165,000 shares.
WHERE YOU CAN FIND MORE INFORMATION
We will file annual, quarterly and other reports, proxy statements and other information with the SEC. You may read and copy any document we file at the public reference facilities of the SEC at 100 F Street, NE, Washington, D.C. 20549. Please call the SEC at 1-800-SEC-0330 for further information on the operation of the public reference rooms. Our SEC filings are also available to the public at the SEC’s web site at http://www.sec.gov and at our website at http://www.genspera.com. We will furnish our stockholders with annual reports containing audited financial statements.
This prospectus is part of a registration statement on Form S-1 that we filed with the SEC. Certain information in the registration statement has been omitted from this prospectus in accordance with the rules and regulations of the SEC. We have also filed exhibits and schedules with the registration statement that are excluded from this prospectus. For further information you may:
| · | read a copy of the registration statement, including the exhibits and schedules, without charge at the SEC’s public reference rooms; or |
| · | obtain a copy from the SEC upon payment of the fees prescribed by the SEC. |
46
INDEX TO FINANCIAL STATEMENTS
| Page | |
| Audited Consolidated Financial Statements: | |
| Report of RBSM, LLP, Independent Registered Public Accounting Firm | F-2 |
| Balance Sheets | F-3 |
| Statements of Losses | F-4 |
| Statements of Stockholders’ Equity | F-5 |
| Statements of Cash Flows | F-6 |
| Notes to Financial Statements | F-7 |
| Unaudited Consolidated Financial Statements: | |
| Consolidated Balance Sheets | F-22 |
| Consolidated Statements of Income | F-23 |
| Consolidated Statements of Cash Flows | F-25 |
| Notes to Unaudited Consolidated Financial Statements | F-26 |
F-1
REPORT OF INDEPENDENT REGISTERED PUBLIC ACCOUNTING FIRM
Board of Directors
GenSpera Inc.
San Antonio, TX
We have audited the accompanying balance sheets of GenSpera Inc., a development stage company, as of December 31, 2010 and 2009, and the related statements of losses, statement of stockholders' equity, and cash flows for each of the two years in the period ended December 31, 2010 and the period November 21, 2003 (date of inception) through December 31, 2010. These financial statements are the responsibility of the company's management. Our responsibility is to express an opinion on the financial statements based upon our audits.
We conducted our audits in accordance with standards of the Public Company Accounting Oversight Board (United States of America). Those standards require that we plan and perform the audit to obtain reasonable assurance about whether the financial statements are free of material misstatements. The Company is not required to have, nor were we engaged to perform, an audit of its internal control over financial reporting. Our audit included consideration of internal control over financial reporting as a basis for designing audit procedures that are appropriate in the circumstances, but not for the purpose of expressing an opinion on the effectiveness of the Company's internal control over financial reporting. Accordingly we express no such opinion. An audit includes examining, on a test basis, evidence supporting the amounts and disclosures in the financial statements. An audit also includes assessing the accounting principles used and significant estimates made by management, as well as evaluating the overall financial statement presentation. We believe our audits provide a reasonable basis for our opinion.
In our opinion, the financial statements referred to above present fairly, in all material respects, the financial position of GenSpera Inc., a development stage company, at December 31, 2010 and 2009 and the results of its operations and its cash flows for each of the two years in the period ended December 31, 2010 and the period November 21, 2003 (date of inception) through December 31, 2010 in conformity with accounting principles generally accepted in the United States of America.
/s/ RBSM LLP | |
| RBSM LLP | |
| New York, New York | |
| March 30, 2011 |
F-2
GENSPERA INC.
(A Development Stage Company)
BALANCE SHEETS
| December 31, | December 31, | |||||||
| 2010 | 2009 | |||||||
| Assets | ||||||||
| Current assets: | ||||||||
| Cash | $ | 3,671,151 | $ | 2,255,311 | ||||
| Total current assets | 3,671,151 | 2,255,311 | ||||||
| Fixed assets, net of accumulated depreciation of $3,874 and $708 | 11,959 | 15,125 | ||||||
| Prepaid fees | 3,500 | - | ||||||
| Intangible assets, net of accumulated amortization of $43,029 and $26,858 | 169,139 | 157,310 | ||||||
| Total assets | $ | 3,855,749 | $ | 2,427,746 | ||||
| Liabilities and stockholders' equity (deficit) | ||||||||
| Current liabilities: | ||||||||
| Accounts payable and accrued expenses | $ | 139,169 | $ | 78,198 | ||||
| Accrued interest - stockholder | 12,517 | 8,107 | ||||||
| Convertible note payable - stockholder, current portion | 105,000 | 35,000 | ||||||
| Total current liabilities | 256,686 | 121,305 | ||||||
| Convertible notes payable - stockholder, long term portion | - | 70,000 | ||||||
| Warrant derivative liabilities | 2,314,033 | 2,290,686 | ||||||
| Total liabilities | 2,570,719 | 2,481,991 | ||||||
| Commitments and contingencies | ||||||||
| Stockholders' equity (deficit): | ||||||||
Preferred stock, par value $.0001 per share; 10,000,000 shares authorized, none issued and outstanding | - | - | ||||||
Common stock, par value $.0001 per share; 80,000,000 shares authorized, 17,604,465 and 15,466,446 shares issued and outstanding, respectively as of December 31, 2010 and 2009 | 1,760 | 1,547 | ||||||
| Common stock subscribed | 611,846 | - | ||||||
| Additional paid-in capital | 15,120,792 | 10,135,737 | ||||||
| Deficit accumulated during the development stage | (14,449,368 | ) | (10,191,529 | ) | ||||
| Total stockholders' equity (deficit) | 1,285,030 | (54,245 | ) | |||||
| Total liabilities and stockholders' equity (deficit) | $ | 3,855,749 | $ | 2,427,746 | ||||
See accompanying notes to audited financial statements.
F-3
GENSPERA, INC.
(A Development Stage Company)
STATEMENTS OF LOSSES FOR THE YEARS ENDED DECEMBER 31, 2010 AND 2009
AND FOR THE PERIOD FROM INCEPTION (NOVEMBER 21, 2003) TO DECEMBER 31, 2010
| Cumulative Period | ||||||||||||
| from November 21, 2003 | ||||||||||||
| (date of inception) to | ||||||||||||
| Years ended December 31, | December 31, | |||||||||||
| 2010 | 2009 | 2010 | ||||||||||
| Operating expenses: | ||||||||||||
| General and administrative expenses | $ | 2,173,247 | $ | 1,424,847 | $ | 4,887,636 | ||||||
| Research and development | 2,243,866 | 2,087,134 | 7,755,407 | |||||||||
| Research and development grant received | (244,479 | ) | (244,479 | ) | ||||||||
| Total operating expenses | 4,172,634 | 3,511,981 | 12,398,564 | |||||||||
| Loss from operations | (4,172,634 | ) | (3,511,981 | ) | (12,398,564 | ) | ||||||
| Finance cost | - | (478,886 | ) | (518,675 | ) | |||||||
| Change in fair value of derivative liability | (109,654 | ) | (1,140,094 | ) | (1,540,204 | ) | ||||||
| Interest income (expense), net | 24,449 | (1,866 | ) | 8,075 | ||||||||
| Loss before provision for income taxes | (4,257,839 | ) | (5,132,827 | ) | (14,449,368 | ) | ||||||
| Provision for income taxes | - | - | - | |||||||||
| Net loss | $ | (4,257,839 | ) | $ | (5,132,827 | ) | $ | (14,449,368 | ) | |||
| Net loss per common share, basic and diluted | $ | (0.25 | ) | $ | (0.37 | ) | ||||||
| Weighted average shares outstanding | 16,909,610 | 14,035,916 | ||||||||||
See accompanying notes to audited financial statements.
F-4
GENSPERA, INC.
(A Development Stage Company)
STATEMENT OF STOCKHOLDERS' (DEFICIT) EQUITY
FROM DATE OF INCEPTION (NOVEMBER 21, 2003) TO DECEMBER 31, 2010
| Deficit | ||||||||||||||||||||||||
| Accumulated | ||||||||||||||||||||||||
| Additional | Common | During the | Stockholders' | |||||||||||||||||||||
| Common Stock | Paid-in | Stock | Development | Equity | ||||||||||||||||||||
| Shares | Amount | Capital | Subscribed | Stage | (Deficit) | |||||||||||||||||||
| Balance, November 21, 2003 | - | $ | - | $ | - | $ | - | $ | - | $ | - | |||||||||||||
| Sale of common stock to founders at $0.0001 per share in November, 2003 | 6,100,000 | 610 | (510 | ) | - | - | 100 | |||||||||||||||||
| Contributed services | - | - | 120,000 | - | - | 120,000 | ||||||||||||||||||
| Net loss | - | - | - | - | (125,127 | ) | (125,127 | ) | ||||||||||||||||
| Balance, December 31, 2003 | 6,100,000 | 610 | 119,490 | - | (125,127 | ) | (5,027 | ) | ||||||||||||||||
| Contributed services | - | - | 192,000 | - | - | 192,000 | ||||||||||||||||||
| Stock based compensation | - | - | 24,102 | - | - | 24,102 | ||||||||||||||||||
| Net loss | - | - | - | - | (253,621 | ) | (253,621 | ) | ||||||||||||||||
| Balance, December 31, 2004 | 6,100,000 | 610 | 335,592 | - | (378,748 | ) | (42,546 | ) | ||||||||||||||||
| Contributed services | - | - | 48,000 | - | - | 48,000 | ||||||||||||||||||
| Stock based compensation | - | - | 24,100 | - | - | 24,100 | ||||||||||||||||||
| Net loss | - | - | - | - | (126,968 | ) | (126,968 | ) | ||||||||||||||||
| Balance, December 31, 2005 | 6,100,000 | 610 | 407,692 | - | (505,716 | ) | (97,414 | ) | ||||||||||||||||
| Contributed services | - | - | 144,000 | - | - | 144,000 | ||||||||||||||||||
| Stock based compensation | - | - | 42,162 | - | - | 42,162 | ||||||||||||||||||
| Net loss | - | - | - | - | (245,070 | ) | (245,070 | ) | ||||||||||||||||
| Balance, December 31, 2006 | 6,100,000 | 610 | 593,854 | - | (750,786 | ) | (156,322 | ) | ||||||||||||||||
| Shares sold for cash at $0.50 per share in November, 2007 | 1,300,000 | 130 | 649,870 | - | - | 650,000 | ||||||||||||||||||
| Shares issued for services | 735,000 | 74 | 367,426 | - | - | 367,500 | ||||||||||||||||||
| Contributed services | - | - | 220,000 | - | - | 220,000 | ||||||||||||||||||
| Stock based compensation | - | - | 24,082 | - | - | 24,082 | ||||||||||||||||||
| Exercise of options for cash at $0.003 per share in March and June, 2007 | 900,000 | 90 | 2,610 | - | - | 2,700 | ||||||||||||||||||
| Net loss | - | - | - | - | (691,199 | ) | (691,199 | ) | ||||||||||||||||
| Balance, December 31, 2007 | 9,035,000 | 904 | 1,857,842 | - | (1,441,985 | ) | 416,761 | |||||||||||||||||
| Exercise of options for cash at $0.50 per share on March 7,2008 | 1,000,000 | 100 | 499,900 | - | - | 500,000 | ||||||||||||||||||
| Sale of common stock and warrants at $1.00 per share - July and August 2008 | 2,320,000 | 232 | 2,319,768 | - | - | 2,320,000 | ||||||||||||||||||
| Cost of sale of common stock and warrants | - | - | (205,600 | ) | - | - | (205,600 | ) | ||||||||||||||||
| Shares issued for accrued interest | 31,718 | 3 | 15,856 | - | - | 15,859 | ||||||||||||||||||
| Shares issued for services | 100,000 | 10 | 49,990 | - | - | 50,000 | ||||||||||||||||||
| Stock based compensation | - | - | 313,743 | - | - | 313,743 | ||||||||||||||||||
| Contributed services | - | - | 50,000 | - | - | 50,000 | ||||||||||||||||||
| Beneficial conversion feature of convertible debt | - | - | 20,675 | - | - | 20,675 | ||||||||||||||||||
| Net loss | - | - | - | - | (3,326,261 | ) | (3,326,261 | ) | ||||||||||||||||
| Balance, December 31, 2008 | 12,486,718 | 1,249 | 4,922,174 | - | (4,768,246 | ) | 155,177 | |||||||||||||||||
| Cumulative effect of change in accounting principle | - | - | (444,161 | ) | - | (290,456 | ) | (734,617 | ) | |||||||||||||||
| Warrants issued for extension of debt maturities | - | - | 51,865 | - | - | 51,865 | ||||||||||||||||||
| Stock based compensation | - | - | 1,530,536 | - | - | 1,530,536 | ||||||||||||||||||
| Common stock issued for services | 86,875 | 10 | 104,109 | - | - | 104,119 | ||||||||||||||||||
| Sale of common stock and warrants at $1.50 per share - February 2009 | 466,674 | 46 | 667,439 | - | - | 667,485 | ||||||||||||||||||
| Sale of common stock and warrants at $1.50 per share - April 2009 | 33,334 | 3 | 49,997 | - | - | 50,000 | ||||||||||||||||||
| Sale of common stock and warrants at $1.50 per share - June 2009 | 1,420,895 | 142 | 2,038,726 | - | - | 2,038,868 | ||||||||||||||||||
| Sale of common stock and warrants at $1.50 per share - July 2009 | 604,449 | 60 | 838,024 | - | - | 838,084 | ||||||||||||||||||
| Sale of common stock and warrants at $1.50 per share - September 2009 | 140,002 | 14 | 202,886 | - | - | 202,900 | ||||||||||||||||||
| Common stock and warrants issued as payment of placement fees | 53,334 | 5 | (5 | ) | - | - | - | |||||||||||||||||
| Common stock and warrants issued upon conversion of note and accrued interest | 174,165 | 18 | 174,147 | - | - | 174,165 | ||||||||||||||||||
| Net loss | - | - | - | - | (5,132,827 | ) | (5,132,827 | ) | ||||||||||||||||
| Balance, December 31, 2009 | 15,466,446 | 1,547 | 10,135,737 | - | (10,191,529 | ) | (54,245 | ) | ||||||||||||||||
| Stock based compensation | - | - | 1,165,450 | - | - | 1,165,450 | ||||||||||||||||||
| Sale of common stock and warrants at $1.65 per share - February and March 2010 | 533,407 | 53 | 806,157 | - | - | 806,210 | ||||||||||||||||||
| Sale of common stock and warrants at $2.00 per share - May 2010 | 1,347,500 | 135 | 2,655,365 | - | - | 2,655,500 | ||||||||||||||||||
| Common stock and warrants issued as payment of placement fees | 43,632 | 4 | (4 | ) | - | - | - | |||||||||||||||||
| Common stock issued as payment for patents and license | 20,000 | 2 | 46,798 | - | - | 46,800 | ||||||||||||||||||
| Common stock and warrants subscribed | - | - | - | 611,846 | - | 611,846 | ||||||||||||||||||
| Salaries paid with common stock | 43,479 | 4 | 99,996 | - | - | 100,000 | ||||||||||||||||||
| Exercise of options and warrants | 150,001 | 15 | 124,986 | - | - | 125,001 | ||||||||||||||||||
| Reclassification of derivative liability upon exercise of warrants | - | - | 86,307 | - | - | 86,307 | ||||||||||||||||||
| Net loss | - | - | - | - | (4,257,839 | ) | (4,257,839 | ) | ||||||||||||||||
| Balance, December 31, 2010 | 17,604,465 | $ | 1,760 | $ | 15,120,792 | $ | 611,846 | $ | (14,449,368 | ) | $ | 1,285,030 | ||||||||||||
See accompanying notes to audited financial statements.
F-5
GENSPERA, INC.
(A Development Stage Company)
STATEMENTS OF CASH FLOWS FOR THE YEARS ENDED DECEMBER 31, 2010 AND 2009
AND FOR THE PERIOD FROM INCEPTION (NOVEMBER 21, 2003) TO DECEMBER 31, 2010
| Cumulative Period | ||||||||||||
| from November 21, 2003 | ||||||||||||
| (date of inception) to | ||||||||||||
| Years ended December 31, | December 31, | |||||||||||
| 2010 | 2009 | 2010 | ||||||||||
| Cash flows from operating activities: | ||||||||||||
| Net loss | $ | (4,257,839 | ) | $ | (5,132,827 | ) | $ | (14,449,368 | ) | |||
| Adjustments to reconcile net loss to net cash used in operating activities: | ||||||||||||
| Depreciation and amortization | 19,337 | 16,055 | 46,903 | |||||||||
| Stock based compensation | 1,265,450 | 1,634,655 | 3,745,794 | |||||||||
| Common stock issued for acquisition of license | 28,800 | - | 28,800 | |||||||||
| Warrants issued for financing costs | - | 467,840 | 467,840 | |||||||||
| Change in fair value of derivative liability | 109,654 | 1,140,094 | 1,540,204 | |||||||||
| Contributed services | - | - | 774,000 | |||||||||
| Amortization of debt discount | - | 11,046 | 20,675 | |||||||||
| Changes in assets and liabilities: | ||||||||||||
| Increase (decrease) in accounts payable and accrued expenses | 65,381 | (147,346 | ) | 178,110 | ||||||||
| Cash used in operating activities | (2,769,217 | ) | (2,010,483 | ) | (7,647,042 | ) | ||||||
| Cash flows from investing activities: | ||||||||||||
| Acquisition of property and equipment | - | (15,833 | ) | (15,833 | ) | |||||||
| Acquisition of intangibles | (10,000 | ) | - | (194,168 | ) | |||||||
| Cash used in investing activities | (10,000 | ) | (15,833 | ) | (210,001 | ) | ||||||
| Cash flows from financing activities: | ||||||||||||
| Proceeds from sale of common stock and warrants | 4,073,556 | 3,797,337 | 11,301,693 | |||||||||
| Proceeds from exercise of warrants | 125,001 | 125,001 | ||||||||||
| Prepaid stock issue costs | (3,500 | ) | (3,500 | ) | ||||||||
| Proceeds from convertible notes - stockholder | - | - | 155,000 | |||||||||
| Repayments of convertible notes - stockholder | - | (50,000 | ) | (50,000 | ) | |||||||
| Cash provided by financing activities | 4,195,057 | 3,747,337 | 11,528,194 | |||||||||
| Net increase in cash | 1,415,840 | 1,721,021 | 3,671,151 | |||||||||
| Cash, beginning of period | 2,255,311 | 534,290 | - | |||||||||
| Cash, end of period | $ | 3,671,151 | $ | 2,255,311 | $ | 3,671,151 | ||||||
| Supplemental cash flow information: | ||||||||||||
| Cash paid for interest | $ | 45 | $ | 3,537 | ||||||||
| Cash paid for income taxes | $ | - | $ | - | ||||||||
| Non-cash financial activities: | ||||||||||||
| Derivative liability reclassified to equity upon exercise of warrants | $ | 86,307 | $ | - | ||||||||
| Common stock issued for acquisition of patent | $ | 18,000 | $ | - | ||||||||
| Common stock units issued as payment of placement fees | $ | - | $ | 80,000 | ||||||||
| Warrants issued as payment for due diligence expenses | $ | - | $ | 120,266 | ||||||||
| Warrants issued as payment of placement fees | $ | - | $ | 78,503 | ||||||||
| Common stock issued as payment of convertible note | $ | - | $ | 163,600 | ||||||||
| Accrued interest paid with common stock | $ | - | $ | 10,565 | ||||||||
See accompanying notes to audited financial statements.
F-6
GENSPERA, INC.
NOTES TO FINANCIAL STATEMENTS
FOR THE YEARS ENDED DECEMBER 31, 2010 AND 2009
AND FOR THE PERIOD FROM NOVEMBER 21, 2003
(INCEPTION) TO DECEMBER 31, 2010
NOTE 1 - SUMMARY OF ACCOUNTING POLICIES
A summary of the significant accounting policies applied in the preparation of the accompanying financial statements follows.
Business and Basis of Presentation
GenSpera Inc. (“we”, “us”, “our company “, “our”,“GenSpera” or the “Company” ) was formed under the laws of the State of Delaware in 2003. We are a development stage entity, as defined by the Financial Accounting Standards Board (“FASB”) Accounting Standards Codification (“ASC”) Topic 915. GenSpera, Inc. is a pharmaceutical company focused on the development of targeted cancer therapeutics for the treatment of cancerous tumors, including breast, prostate, bladder and kidney cancer. Our operations are based in San Antonio, Texas.
To date, we have generated no sales revenues, have incurred significant expenses and have sustained losses. Consequently, our operations are subject to all the risks inherent in the establishment of a new business enterprise. For the period from inception on November 21, 2003 through December 31, 2010, we have accumulated losses of $14,449,368.
Liquidity
Our financial statements have been prepared assuming that the Company will continue as a going concern. As of December 31, 2010, we had working capital (current assets in excess of current liabilities) of $3,414,465. Our cash flow used in operations was $2,769,217 and $2,010,483 for the years ended December 31, 2010 and 2009, respectively. At December 31, 2010, we had cash on hand of approximately $3,671,000 and raised an additional $3,534,000 in the first quarter of 2011. Based upon current cash flow projections, management believes the Company will have sufficient capital resources to meet projected cash flow requirements through 2011.
Use of Estimates
The preparation of financial statements in conformity with generally accepted accounting principles requires management to make estimates and assumptions that affect the amounts reported in the financial statements and accompanying disclosures. Although these estimates are based on management's best knowledge of current events and actions the Company may undertake in the future, actual results may differ from those estimates.
Research and Development
Research and development costs include expenses incurred by the Company for research and development of therapeutic agents for the treatment of cancer and are charged to operations as incurred. Our research and development expenses consist primarily of expenditures for toxicology and other studies, manufacturing, clinical trials and compensation and consulting costs.
GenSpera incurred research and development expenses of $2,243,866, $2,087,134 and $7,755,407 for the years ended December 31, 2010 and 2009, and from November 21, 2003 (inception) through December 31, 2010, respectively.
F-7
Cash Equivalents
For purposes of the statements of cash flows, we consider all highly liquid debt instruments purchased with a maturity date of three months or less to be cash equivalents. We maintain our cash in bank deposit accounts which, at times, may exceed insured limits. We have not experienced any losses in our accounts.
Concentrations of Credit Risk
Financial instruments and related items, which potentially subject the Company to concentrations of credit risk, consist primarily of cash and cash equivalents. The Company places its cash and temporary cash investments with credit quality institutions. At times, such investments may be in excess of applicable government mandated insurance limits. At December 31, 2010, deposits exceeded current insurance limits by approximately $3,057,000.
Intangible Assets
Intangible assets consist of issued patents and patent applications pending worldwide (see Note 5). These patents and patent applications cover the intellectual property underlying our technology. The assets are recorded at cost. The patents are being amortized on the straight line basis over their estimated useful lives of twelve to seventeen years.
Property and equipment
Property and equipment is stated at cost less accumulated depreciation. Depreciation is provided on the straight line basis over the estimated useful lives of the assets of five years
Expenditures for repair and maintenance which do not materially extend the useful lives of property and equipment are charged to operations. When property or equipment is sold or otherwise disposed of, the cost and related accumulated depreciation are removed from the respective accounts with the resulting gain or loss reflected in operations. Management periodically reviews the carrying value of its property and equipment for impairment.
Loss Per Share
We use ASC 260, “Earnings Per Share” for calculating the basic and diluted loss per share. We compute basic loss per share by dividing net loss and net loss attributable to common shareholders by the weighted average number of common shares outstanding. Basic and diluted loss per share are the same, in that any potential common stock equivalents would have the effect of being anti-dilutive in the computation of net loss per share. There were 9,159,371 common share equivalents at December 31, 2010 and 7,648,684 at December 31, 2009. For the years ended December 31, 2010 and 2009, these potential shares were excluded from the shares used to calculate diluted earnings per share as their inclusion would reduce net loss per share.
Fair value of financial instruments
In April 2009, we adopted new accounting guidance for our interim period ended June 30, 2009 which requires disclosures about fair value of financial instruments for interim reporting periods of publicly traded companies as well as in annual financial statements.
Our short-term financial instruments, including cash, accounts payable and other liabilities, consist primarily of instruments without extended maturities, the fair value of which, based on management’s estimates, reasonably approximate their book value. The fair value of long term convertible notes is based on management estimates and reasonably approximates their book value after comparison to obligations with similar interest rates and maturities. The fair value of the Company’s derivative instruments is determined using option pricing models.
F-8
Fair value measurements
Effective January 1, 2008, we adopted new accounting guidance pursuant to ASC 820 which established a framework for measuring fair value and expands disclosure about fair value measurements. The Company did not elect fair value accounting for any assets and liabilities allowed by previous guidance. Effective January 1, 2009, the Company adopted the provisions accounting guidance that relate to non-financial assets and liabilities that are not required or permitted to be recognized or disclosed at fair value on a recurring basis. Effective April 1, 2009, the Company adopted new accounting guidance which provides additional guidance for estimating fair value in accordance with ASC 820, when the volume and level of activity for the asset or liability have significantly decreased. The adoptions of the provisions of ASC 820 did not have a material impact on our financial position or results of operations.
ASC 820 defines fair value as the amount that would be received for an asset or paid to transfer a liability (i.e., an exit price) in the principal or most advantageous market for the asset or liability in an orderly transaction between market participants on the measurement date. ASC 820 also establishes a fair value hierarchy that requires an entity to maximize the use of observable inputs and minimize the use of unobservable inputs when measuring fair value. ASC 820 describes the following three levels of inputs that may be used:
Level 1: Quoted prices (unadjusted) in active markets that are accessible at the measurement date for identical assets and liabilities. The fair value hierarchy gives the highest priority to Level 1 inputs.
Level 2: Observable prices that are based on inputs not quoted on active markets but corroborated by market data.
Level 3: Unobservable inputs when there is little or no market data available, thereby requiring an entity to develop its own assumptions. The fair value hierarchy gives the lowest priority to Level 3 inputs.
The table below summarizes the fair values of our financial liabilities as of December 31, 2010:
| Fair Value at | Fair Value Measurement Using | |||||||||||||||
December 31, 2010 | Level 1 | Level 2 | Level 3 | |||||||||||||
| Warrant derivative liability | $ | 2,314,033 | $ | — | $ | — | $ | 2,314,033 | ||||||||
| $ | 2,314,033 | $ | — | $ | — | $ | 2,314,033 | |||||||||
The table below sets forth a summary of changes in the fair value of the Company’s Level 3 financial liabilities (warrant derivative liability) for the years ended December 31, 2010 and 2009.
| 2010 | 2009 | |||||||
| Balance at beginning of year | $ | 2,290,686 | $ | - | ||||
| Additions to derivative instruments | - | 1,150,593 | ||||||
| Change in fair value of warrant liability | 109,654 | 1,140,093 | ||||||
| Reclassification to equity upon exercise of warrants | (86,307 | ) | - | |||||
| Balance at end of period | $ | 2,314,033 | $ | 2,290,686 | ||||
F-9
The following is a description of the valuation methodologies used for these items:
Warrant derivative liability — these instruments consist of certain of our warrants with anti-dilution provisions. These instruments were valued using pricing models which incorporate the Company’s stock price, volatility, U.S. risk free rate, dividend rate and estimated life.
Income Taxes
We utilize ASC 740 “Income Taxes” which requires the recognition of deferred tax assets and liabilities for the expected future tax consequences of events that have been included in the financial statements or tax returns. Under this method, deferred income taxes are recognized for the tax consequences in future years of differences between the tax bases of assets and liabilities and their financial reporting amounts at each year-end based on enacted tax laws and statutory tax rates applicable to the periods in which the differences are expected to affect taxable income.
Stock-Based Compensation
We account for our stock based compensation under ASC 718 “Compensation – Stock Compensation” using the fair value based method. Under this method, compensation cost is measured at the grant date based on the value of the award and is recognized over the service period, which is usually the vesting period. This guidance establishes standards for the accounting for transactions in which an entity exchanges it equity instruments for goods or services. It also addresses transactions in which an entity incurs liabilities in exchange for goods or services that are based on the fair value of the entity’s equity instruments or that may be settled by the issuance of those equity instruments.
We use the fair value method for equity instruments granted to non-employees and use the Black-Scholes model for measuring the fair value of options. The stock based fair value compensation is determined as of the date of the grant or the date at which the performance of the services is completed (measurement date) and is recognized over the vesting periods.
Recent Accounting Pronouncements
In June 2009, the FASB issued new accounting guidance which will require more information about the transfer of financial assets where companies have continuing exposure to the risks related to transferred financial assets. This guidance is effective at the start of a company’s first fiscal year beginning after November 15, 2009, or January 1, 2010 for companies reporting earnings on a calendar-year basis. The adoption of this guidance did not have a material impact on the Company’s financial position or results of operations.
In June 2009, the FASB issued new accounting guidance which will change how a company determines when an entity that is insufficiently capitalized or is not controlled through voting (or similar rights) should be consolidated. Under this guidance, determining whether a company is required to consolidate an entity will be based on, among other things, an entity's purpose and design and a company's ability to direct the activities of the entity that most significantly impact the entity's economic performance. This guidance is effective at the start of a company’s first fiscal year beginning after November 15, 2009, or January 1, 2010 for companies reporting earnings on a calendar-year basis. The adoption of this guidance did not have a material impact on the Company’s financial position or results of operations.
In February 2010, the FASB issued FASB ASU 2010-09, “Subsequent Events, Amendments to Certain Recognition and Disclosure Requirements,” which clarifies certain existing evaluation and disclosure requirements in ASC 855 “Subsequent Events” related to subsequent events. FASB ASU 2010-09 requires SEC filers to evaluate subsequent events through the date in which the financial statements are issued and is effectively immediately. The new guidance does not have an effect on the Company’s results of operations and financial condition.
F-10
In January 2010, the FASB issued Accounting Standards Update (“ASU”) 2010-06, “Improving Disclosures about Fair Value Measurements” which clarifies certain existing disclosure requirements in ASC 820 “Fair Value Measurements and Disclosures,” and requires disclosures related to significant transfers between each level and additional information about Level 3 activity. FASB ASU 2010-06 begins phasing in the first fiscal period after December 15, 2009. The adoption of this guidance did not have a material impact on the Company’s financial position or results of operations.
Other recent accounting pronouncements issued by the FASB (including its Emerging Issues Task Force), the AICPA, and the SEC did not, or are not believed by management to, have a material impact on the Company's present or future financial statements.
NOTE 2 - CAPITAL STOCK AND STOCKHOLDER’S EQUITY
We are authorized to issue 80,000,000 shares of common stock with a par value of $.0001 per share and 10,000,000 shares of preferred stock with a par value of $.0001 per share.
During January and March 2010, we entered into securities purchase agreements with a number of accredited investors. Pursuant to the terms of the agreements, we sold 533,407 units resulting in gross proceeds of approximately $880,000. The price per unit was $1.65. Each unit consists of: (i) one share of common stock; and (ii) one half common stock purchase warrant. The warrants have a term of five years and allow the investors to purchase our common shares at a price per share of $3.10. The warrants also contain anti-dilution protection in the event of stock splits, stock dividends and other similar transactions. We incurred placement agent fees of $73,790 in connection with the transaction. We also issued a total of 42,673 additional common stock purchase warrants as compensation. The warrants have the same terms as the investor warrants except that 12,160 warrants have an exercise price of $2.20 and 30,513 warrants have an exercise price of $2.94.
During May 2010, we entered into securities purchase agreements with a number of accredited investors. Pursuant to the terms of the agreements, we sold 1,347,500 units resulting in gross proceeds of $2,695,000. The price per unit was $2.00. Each unit consists of: (i) one share of common stock; and (ii) one half common stock purchase warrant. The warrants have a term of five years and allow the investors to purchase our common shares at a price per share of $3.50. The warrants also contain anti-dilution protection in the event of stock splits, stock dividends and other similar transactions. We incurred placement agent and escrow fees of $39,500 in connection with the transaction. We issued an additional 43,632 units as payment of $87,264 of consulting fees. We also issued a total of 18,000 additional common stock purchase warrants as compensation. The warrants have the same terms as the investor warrants.
During December 2010 we entered into securities purchase agreements with a number of accredited investors. Pursuant to the terms of the agreements, we received $611,847 in proceeds from the subscriptions for 339,915 units. The price per unit was $1.80. Each unit consists of: (i) one share of common stock; and (ii) one half common stock purchase warrant. The warrants have a term of five years and allow the investors to purchase our common shares at a price per share of $3.30. The warrants also contain anti-dilution protection in the event of stock splits, stock dividends and other similar transactions.
During the third quarter of 2010 we issued 8,000 shares of common stock, valued at $18,000, for the acquisition of two patents and we issued 12,000 shares of common stock, valued at $28,800, as payment for a license.
During 2010, we issued 150,001 shares of common stock upon exercise of an equivalent number of options and warrants and received cash proceeds of $125,001.
As a result of the exercise of 50,001 of the warrants, we have reclassified $86,307 of our warrant derivative liability to paid in capital.
F-11
During February and March 2010, we granted a total of 77,000 common stock options to two directors. The options have a weighted average exercise price of $2.30 per share. The options will vest quarterly over one year. The options lapse if unexercised after five years. The options have an aggregate grant date fair value of $54,079, determined using the Black-Scholes method based on the following weighted average assumptions: (1) risk free interest rate of 0.245%; (2) dividend yield of 0%; (3) volatility factor of the expected market price of our common stock of 99%; and (4) an expected life of the options of 0.625 years.
During the year ended December 31, 2010 we have recorded an expense of $49,308 related to the fair value of the options that vested or are expected to vest.
On August 14, 2010, we granted a total of 63,000 common stock options to a director. The options have an exercise price of $2.00 per share. Of these options, 25,000 vested upon grant and the balance will vest quarterly over one year. The options lapse if unexercised after five years. The options have an aggregate grant date fair value of $26,974, determined using the Black-Scholes method based on the following weighted average assumptions: (1) risk free interest rate of 0.193%; (2) dividend yield of 0%; (3) volatility factor of the expected market price of our common stock of 88%; and (4) an expected life of the options of 0.38 years. During the year ended December 31, 2010 we have recorded an expense of $16,805 related to the fair value of the options that vested or are expected to vest.
During the year ended December 31, 2010 we have recorded an expense of $294,645 related to the fair value of the 2009 options granted to our chief executive officer and chief operating officer that vested or are expected to vest.
During the year ended December 31, 2010, we have recorded an expense of $145,926 related to the fair value of options granted to members of our Scientific Advisory Board that vested during that period.
During May and June 2010, we granted a total of 291,425 common stock warrants to consultants. The warrants have a weighted average exercise price of $1.99 per share. The warrants vested upon grant. The warrants lapse if unexercised after five years. We have recorded an expense of $389,275, determined using the Black-Scholes method based on the following weighted average assumptions: (1) risk free interest rate of 0.625%; (2) dividend yield of 0%; (3) volatility factor of the expected market price of our common stock of 100%; and (4) an expected life of the warrants of 2 years.
During December 2010, we granted a total of 157,500 common stock options and 40,000 common stock warrants for professional, legal and consulting services. The options and warrants have a weighted average exercise price of $2.00 per share. Of these options and warrants, 185,500 vested upon grant and 10,000 vests quarterly during 2011. The options and warrants lapse if unexercised after five years. We have recorded an expense of $269,491 related to the fair value of the options and warrants that vested or are expected to vest, determined using the Black-Scholes method based on the following weighted average assumptions: (1) risk free interest rate of 2.125%; (2) dividend yield of 0%; (3) volatility factor of the expected market price of our common stock of 93%; and (4) an expected life of the warrants of 5 years.
During May 2010 we issued an aggregate of 43,479 shares of common stock to our chief executive officer and chief operating officer as payment of discretionary bonuses aggregating $100,000. For purposes of calculating the number of shares to be issued as payment of the discretionary bonuses, the grant date is May 14, 2010.
On February 17, 2009, we entered into a modification with Dr. Dionne, our president and chief executive officer, with regard to our 4% Convertible Promissory Note issued to Dionne in the amount of $35,000 (“Note”). Pursuant to the modification, Dr. Dionne agreed to extend the maturity date of the Note from December 2, 2008 to December 2, 2009. As consideration for the modification, the Company issued Dr. Dionne a common stock purchase warrant entitling him to purchase 11,000 shares of our common stock at a per share purchase price of $1.50. The warrant has a five year term. The warrants also contain anti-dilution protection in the event of stock splits, stock dividends and other similar transactions. We have recorded a financing expense of $9,353 during 2009 related to the fair value of the warrants, using the Black-Scholes method based on the following assumptions: (1) risk free interest rate of 0.875%; (2) dividend yield of 0%; (3) volatility factor of the expected market price of our common stock of 156%; and (4) an expected life of the warrants of 2 years.
F-12
On February 17, 2009, we entered into a modification with TR Winston & Company, LLC (“TRW”) with regard to the Company’s 5% Convertible Debenture issued to TRW in the amount of $163,600. Pursuant to the modification, TRW agreed to extend the maturity date of the debenture from July 14, 2009 to July 14, 2010. As consideration for the modification, the we issued TRW a common stock purchase warrant entitling TRW to purchase 50,000 shares of our common stock at a per share purchase price of $1.50. The warrant has a five year term. The warrants also contain anti-dilution protection in the event of stock splits, stock dividends and other similar transactions. We have recorded a financing expense of $42,512 during 2009 related to the fair value of the warrants, using the Black-Scholes method based on the following assumptions: (1) risk free interest rate of 0.875%; (2) dividend yield of 0%; (3) volatility factor of the expected market price of our common stock of 156%; and (4) an expected life of the warrants of 2 years.
On February 19, 2009, we entered into a Securities Purchase Agreement with a number of accredited investors. Pursuant to the terms of the Securities Purchase Agreement, during February and April we sold the investors units aggregating approximately $750,000 (“Offering”). The price per unit was $1.50. Each unit consists of: (i) one share of the Company’s common stock; and (ii) one half Common Stock Purchase Warrant. The Warrants have a term of five years and allow the investors to purchase our common shares at a price per share of $3.00. The warrants also contain anti-dilution protection in the event of stock splits, stock dividends and other similar transactions.
As a result of this offering, the anti-dilution provisions in our warrants issued during the July and August 2008 financing were triggered. These anti-dilution provisions resulted in the exercise price of these warrants being reduced from $2.00 from $1.50. Additionally, we are obligated to issue holders of these warrants an additional 506,754 warrants, and we are obligated to file a registration statement for the common stock underlying such warrants pursuant to the registration rights agreement entered into in connection with the July and August 2008 financing. We have recorded a financing expense of $415,976 during 2009 related to the fair value of the additional warrants, using the Black-Scholes method based on the following assumptions: (1) risk free interest rate of 0.875%; (2) dividend yield of 0%; (3) volatility factor of the expected market price of our common stock of 149%; and (4) an expected life of the warrants of 2 years. Because these additional warrants are subject to the same anti-dilution provisions as the original 2008 warrants we have recorded the fair value of the warrants as a derivative liability.
On June 29, 2009, we entered into a Securities Purchase Agreement with a number of accredited investors. Pursuant to the terms of the Securities Purchase Agreement, we sold the investors units aggregating approximately $2,131,000. The price per unit was $1.50. Each unit consists of: (i) one share of the Company’s common stock; and (ii) one half Common Stock Purchase Warrant. The Warrants have a term of five years and allow the investors to purchase our common shares at a price per share of $3.00. The warrants also contain anti-dilution protection in the event of stock splits, stock dividends and other similar transactions. We incurred a total of $142,467 in fees and expenses incurred in connection with the transaction. Of this amount, $50,000 has been paid through the issuance of 33,334 units. We also issued a total of 43,894 additional common stock purchase warrants as compensation to certain finders. The warrants have the same terms as the investor warrants.
On July 10, 2009, we issued a common stock purchase warrant to purchase 150,000 common shares as reimbursement of due diligence expenses related to the June transaction. The warrant has a term of five years and entitles the holder to purchase our common shares at a price per share of $3.00.
On July 29, 2009, we entered into a Securities Purchase Agreement with a number of accredited investors. Pursuant to the terms of the Securities Purchase Agreement, we sold the investors units aggregating approximately $907,000. The price per unit was $1.50. Each unit consists of: (i) one share of the Company’s common stock; and (ii) one half Common Stock Purchase Warrant. The Warrants have a term of five years and allow the investors to purchase our common shares at a price per share of $3.00. The warrants also contain anti-dilution protection in the event of stock splits, stock dividends and other similar transactions. We incurred a total of $79,583 in fees and expenses incurred in connection with the transaction. Of this amount, $14,000 has been paid through the issuance of 9,333 units. We also issued a total of 40,001 additional common stock purchase warrants as compensation to certain finders. The warrants have the same terms as the investor warrants.
F-13
On September 2, 2009, we entered into a Securities Purchase Agreement with a number of accredited investors. Pursuant to the terms of the Securities Purchase Agreement, we sold the investors units aggregating approximately $210,000. The price per unit was $1.50. Each unit consists of: (i) one share of the Company’s common stock; and (ii) one half Common Stock Purchase Warrant. The Warrants have a term of five years and allow the investors to purchase our common shares at a price per share of $3.00. The warrants also contain anti-dilution protection in the event of stock splits, stock dividends and other similar transactions. We incurred a total of $23,100 in fees and expenses incurred in connection with the transaction. Of this amount, $16,000 has been paid through the issuance of 10,667 units. We also issued a total of 12,267 additional common stock purchase warrants as compensation to certain finders. The warrants have the same terms as the investor warrants.
On September 2, 2009, we granted a total of 125,000 common stock options for professional, legal and consulting services. The options have an exercise price of $1.50 per share. The options vested upon grant and lapse if unexercised on September 2, 2014. We have recorded an expense of $116,196 related to the fair value of the options, using the Black-Scholes method based on the following weighted average assumptions: (1) risk free interest rate of 1%; (2) dividend yield of 0%; (3) volatility factor of the expected market price of our common stock of 188%; and (4) an expected life of the options of 2 years.
On September 2, 2009, we granted a total of 120,000 common stock warrants for consulting services. The warrants have an exercise price of $1.50 per share. The warrants vested upon grant and lapse if unexercised on September 2, 2014. We have recorded an expense of $111,548 related to the fair value of the warrants, using the Black-Scholes method based on the following weighted average assumptions: (1) risk free interest rate of 1%; (2) dividend yield of 0%; (3) volatility factor of the expected market price of our common stock of 188%; and (4) an expected life of the options of 2 years.
On September 2, 2009, we granted a total of 1,000,000 common stock options to our chief executive officer. The options have an exercise price of $1.65 per share. Of these options, 500,000 options vested upon grant and 500,000 options will vest upon the attainment of various milestones. The options lapse if unexercised on September 2, 2016. The options have an aggregate grant date fair value of $918,413, determined using the Black-Scholes method based on the following weighted average assumptions: (1) risk free interest rate of 1%; (2) dividend yield of 0%; (3) volatility factor of the expected market price of our common stock of 188%; and (4) an expected life of the options of 2 years. During the year ended December 31, 2009 we have recorded an expense of $651,228 related to the fair value of the options that vested or are expected to vest.
On September 2, 2009, we granted a total of 775,000 common stock options to our chief operating officer. The options have an exercise price of $1.50 per share. Of these options, 400,000 options vested upon grant and 375,000 options will vest upon the attainment of various milestones. The options lapse if unexercised on September 2, 2016. The options have an aggregate grant date fair value of $720,415, determined using the Black-Scholes method based on the following weighted average assumptions: (1) risk free interest rate of 1%; (2) dividend yield of 0%; (3) volatility factor of the expected market price of our common stock of 188%; and (4) an expected life of the options of 2 years. During the year ended December 31, 2009 we have recorded an expense of $517,592 related to the fair value of the options that vested or are expected to vest.
During May 2009, we issued 61,875 shares of common stock, valued at $74,869, for services.
During September 2009, we issued 25,000 shares of common stock, valued at $29,250, for services.
F-14
During November 2009, we issued 174,165 shares of common stock as payment of a convertible note in the amount of $163,600, plus accrued interest of $10,565.
During 2009, we have recorded an expense of $92,906 related to the fair value of options granted to members of our Scientific Advisory Board that vested during that period, using the Black-Scholes method based on the following weighted average assumptions: (1) risk free interest rate of 1.0%; (2) dividend yield of 0%; (3) volatility factor of the expected market price of our common stock of 156%; and (4) an expected life of the options of 2 years.
During 2009, we have recorded an expense of $12,035 related to options granted to directors that vested during that period.
During 2009, we have recorded an expense of $29,032 related to the fair value of these options granted to a former director who is currently a consultant that vested during that period, using the Black-Scholes method based on the following assumptions: (1) risk free interest rate of 1.0%; (2) dividend yield of 0%; (3) volatility factor of the expected market price of our common stock of 156%; and (4) an expected life of the options of 2 years.
NOTE 3 -CONVERTIBLE NOTES PAYABLE
We have executed five convertible notes with our president and chief executive officer pursuant to which we have borrowed an aggregate of $155,000 ($105,000 principal balance outstanding at December 31, 2010). The notes bear an interest rate of 4.2% and mature at various dates through December 6, 2011. On March 7, 2008, we issued 31,718 shares of common stock as payment of accrued interest in the amount of $15,859. During 2009, we made cash payments aggregating $53,458, retiring two notes with a principal amount of $50,000, plus accrued interest of $3,458. Accrued interest at December 31, 2010 and 2009 was $12,517 and $8,107, respectively. The notes and accrued interest are convertible, at the option of the holder, into shares of our common stock at a conversion price of $0.50 per share.
As an accommodation to the Company, TR Winston & Company, LLC, our placement agent, agreed to receive a convertible debenture in the principal amount of $163,600 plus warrants to purchase an additional 81,800 common shares in lieu of $163,600 of its cash fee. The convertible debenture accrued interest at 5% per annum and had a maturity date of July 14, 2010 (extended from July 14, 2009). It is convertible into the shares of the Company’s common stock, at the sole discretion of the holder, at $1.00 per share subject to certain anti-dilution adjustments. During November 2009, we issued 174,165 shares of common stock as payment of the convertible note, plus accrued interest of $10,565.
In accordance with ASC 740 “Debt”, a portion of the proceeds were allocated to the warrants based on their relative fair value, which totaled $20,675 using the Black Scholes option pricing model. This amount has been recorded as a debt discount and has been amortized over the term of the debenture. We determined that there was no beneficial conversion feature attributable to the convertible debenture since the effective conversion price was greater than the value of our common shares on the date of issuance. The assumptions used in the Black Scholes model are as follows: (1) dividend yield of 0%; (2) expected volatility of 100%, (3) risk-free interest rate of 2.9%, and (4) expected life of 2 years.
Principal amounts of the notes mature as follows:
F-15
NOTE 4 – DERIVATIVE LIABILITY
In June 2008, the FASB issued new accounting guidance which requires entities to evaluate whether an equity-linked financial instrument (or embedded feature) is indexed to its own stock by assessing the instrument’s contingent exercise provisions and settlement provisions. Instruments not indexed to their own stock fail to meet the scope exception of ASC 815 “Derivative and Hedging” and should be classified as a liability and marked-to-market. The statement is effective for fiscal years beginning after December 15, 2008 and is to be applied to outstanding instruments upon adoption with the cumulative effect of the change in accounting principle recognized as an adjustment to the opening balance of retained earnings. The Company has assessed its outstanding equity-linked financial instruments and has concluded that effective January 1, 2009, warrants issued during 2008 with a fair value of $734,617 on January 1, 2009 will need to be reclassified from equity to a liability. Fair value at January 1, 2009 was determined using the Black-Scholes method based on the following assumptions: (1) risk free interest rate of 0.875%; (2) dividend yield of 0%; (3) volatility factor of the expected market price of our common stock of 144%; and (4) an expected life of the warrants of 2 years.
As a result of our February offering described in Note 2, the anti-dilution provisions in our warrants issued during the July and August 2008 financing were triggered. These anti-dilution provisions resulted in the exercise price of these warrants being reduced from $2.00 from $1.50. Additionally, we are obligated to issue holders of these warrants an additional 506,754 warrants, and we are obligated to file a registration statement for the common stock underlying such warrants pursuant to the registration rights agreement entered into in connection with the July and August 2008 financing. We have recorded the fair value of the additional warrants as a derivative liability upon issue. The fair value of the warrants of $415,976 was determined using the Black-Scholes method based on the following assumptions: (1) risk free interest rate of 0.875%; (2) dividend yield of 0%; (3) volatility factor of the expected market price of our common stock of 149%; and (4) an expected life of the warrants of 2 years.
During the three months ended March 31, 2010, 33,334 of our warrants subject to derivative accounting were exercised into common stock. We have recorded an expense of $21,119 at the date of exercise related to the change in fair value from January 1, 2010 to the date of exercise. As a result of the exercise of the warrants, we have reclassified $58,791 of our warrant derivative liability to paid in capital.
During the three months ended June 30, 2010, 16,667 of our warrants subject to derivative accounting were exercised into common stock. We have recorded a credit of $3,044 at the date of exercise related to the change in fair value from April 1, 2010 to the date of exercise. As a result of the exercise of the warrants, we have reclassified $27,516 of our warrant derivative liability to paid in capital.
At December 31, 2010, we recalculated the fair value of our remaining warrants subject to derivative accounting and have determined that their fair value at December 31, 2010 was $2,314,033. The value of the warrants was determined using the Black-Scholes method based on the following assumptions: (1) risk free interest rate of 0.625%; (2) dividend yield of 0%; (3) volatility factor of the expected market price of our common stock of 93%; and (4) an expected life of the warrants of 2 years. We have recorded an expense of $91,579 during the year ended December31, 2010related to the change in fair value during that period.
At December 31, 2009, we recalculated the fair value of our warrants subject to derivative accounting and have determined that their fair value at December 31, 2009 was $2,290,686. The value of the warrants was determined using the Black-Scholes method based on the following assumptions: (1) risk free interest rate of 1%; (2) dividend yield of 0%; (3) volatility factor of the expected market price of our common stock of 98%; and (4) an expected life of the warrants of 2 years. We have recorded an expense of $1,140,094 during the year ended December 31, 2009 related to the change in fair value during that period.
F-16
NOTE 5 – INTELLECTUAL PROPERTY
We have acquired know-how, pre-clinical data, development data and related patent portfolios for a series of technologies that relate to targeted, potentially curative treatments for a variety of human cancers. We currently own issued patents and patent applications. The previous owner of the intellectual property, John Hopkins University, agreed to assign the patents underlying the technology to our co-founders (the “Assignee Co-Founders”) in return for their assumption of future patent fees and costs, and patent attorney fees and costs, associated with all of the assigned technology. In exchange for us continuing to pay for these future costs, the Assignee Co-Founders entered into world-wide, exclusive option agreements with us. In April 2008, upon the reimbursement of approximately $122,778 in previously-paid patent costs, fees and expenses to John Hopkins University, the Assignee Co-Founders assigned to GenSpera all right, title, and interest in and to the intellectual property, and GenSpera subsequently recorded these assignments in the United States Patent & Trademark Office. By virtue of the April 2008 assignments, GenSpera has no further financial obligations to the Assignee Co-Founders or to John Hopkins University with regard to the assigned intellectual property. These reimbursement costs were required to be paid by the Assignee Co-Founders to Johns Hopkins University. As part of our agreements with the Assignee Co-Founders, we have provided these reimbursement costs directly to the Assignee Co-Founders specifically for reimbursement to Johns Hopkins University. Because these payments have been made by us to the Assignee Co-Founders, this may trigger a taxable event such that the Assignee Co-Founders may be required to pay Federal and state taxes (if any) based upon our payment of the reimbursement costs to the Assignee Co-Founders. Therefore, as part of our agreements with the Assignee Co-Founders, we have further provided additional funds to cover applicable Federal and state taxes (if any) associated with the reimbursement payments. Under our agreement with the Assignee Co-Founders, we will not be required to make any other future payments, including fees, milestone or royalty fees, to either Johns Hopkins University or the Assignee Co-Founders.
On March 10, 2008, we paid an aggregate of $184,167 to acquire the issued patents and patent applications described above. Additionally, during the third quarter of 2010 we issued 8,000 shares of common stock, valued at $18,000, for the acquisition of two patents.
Amortization expense recorded during the years ended December 31, 2010 and 2009 was $16,171 and $15,347, respectively.
Amortization expense for each on the next five fiscal years is estimated to be $16,995 per year.
NOTE 6 – PROPERTY AND EQUIPMENT
Property and equipment consists of the following:
December 31, 2009 | December 31, 2009 | |||||||
| Office equipment | $ | 15,833 | $ | 15,833 | ||||
| Accumulated depreciation | (3,874 | ) | (708 | ) | ||||
| Carrying value | $ | 11,959 | $ | 15,125 | ||||
Depreciation expense was $3,166 and $708 for the years ended December 31, 2010 and 2009, respectively.
F-17
NOTE 7- STOCK OPTIONS AND WARRANTS
GenSpera 2009 Executive Compensation Plan
Our 2009 Executive Compensation Plan (“2009 Plan”) is administered by our Board or any of its committee. The purpose of our 2009 Plan is to advance the interests of GenSpera and our stockholders by attracting, retaining and rewarding persons performing services for us and to motivate such persons to contribute to our growth and profitability. The issuance of awards under our 2009 Plan is at the discretion of the administrator, which has the authority to determine the persons to whom any awards shall be granted and the terms, conditions and restrictions applicable to any award. Under our 2009 Plan, we may grant stock options, restricted stock, stock appreciation rights, restricted stock units, performance units, performance shares and other stock based awards. Our 2009 Plan authorizes the issuance of up to 1,775,000 shares of our common stock for the foregoing awards.
GenSpera 2007 Equity Compensation Plan
Our 2007 Plan is administered by a committee of non-employee directors who are appointed by our board of directors (“Committee”). The purpose of our 2007 Plan is to advance the interests of GenSpera and our stockholders by attracting, retaining and rewarding persons performing services for us and to motivate such persons to contribute to our growth and profitability.
Under our 2007 Plan, we may grant stock options and restricted stock to employees, directors and consultants. Our 2007 Plan authorizes the issuance of up to 1,500,000 shares of our common stock per year for the foregoing awards. The exercise price of Nonqualified Stock Options shall not be less than 85% of the fair market value per share on the date of grant. The exercise price per share for Incentive Stock Option grants must be no less than 100% of the fair market value per share on the date of grant. The exercise price per share for an incentive stock option grant to an employee who, at the time of grant, owns stock representing more than 10% of the voting power of all classes of stock of GenSpera or any parent or subsidiary, must be no less than 110% of the fair market value per share on the date of grant.
Generally, the option exercise price may be paid in cash, by check, by cashless exercise, by net exercise or by tender or attestation of ownership of shares having a fair market value not less than the exercise price and that either (A) have been owned by the optionee for more than six months and not used for another exercise by tender or attestation, or (B) were not acquired, directly or indirectly, from us.
At the time an award is granted, the Committee must fix the period within which the award may be exercised and determine any conditions that must be satisfied before the award may be exercised. Notwithstanding, options shall vest over a period of not more than five years and at a rate of not less than 20% per year. The Committee may accelerate the exercisability of any or all outstanding options at any time for any reason. The maximum term of an option granted under our 2007 Plan is ten years.
Our 2007 Plan provides that in the event of our merger with or into another corporation, the sale of substantially all of our assets, or the sale or exchange of more than 50% of our voting stock, each outstanding award shall be assumed or an equivalent award substituted by the surviving, continuing, successor or purchasing corporation or a parent thereof. The Committee may also deem an award assumed if the award confers the right to the award-holder to receive, for each share of stock subject to an award immediately prior to the change in control, the consideration that a stockholder is entitled on the effective date of the change in control. Upon a change in control, all outstanding options shall automatically accelerate and become fully exercisable and all restrictions and conditions on all outstanding restricted stock grants shall immediately lapse.
The Committee may at any time amend, suspend or terminate our 2007 Plan. Notwithstanding the forgoing, the Committee shall not amend the Plan without shareholder approval if such approval is required by section 422 of the Internal Revenue Code or section 162(m) therein.
F-18
Transactions involving our stock options are summarized as follows:
| 2010 | 2009 | |||||||||||||||
| Number | Weighted Average Exercise Price | Number | Weighted Average Exercise Price | |||||||||||||
| Outstanding at beginning of the period | 2,415,000 | $ | 1.35 | 515,000 | $ | 0.51 | ||||||||||
| Granted during the period | 297,500 | 2.08 | 1,900,000 | 1.58 | ||||||||||||
| Exercised during the period | (100,000 | ) | 0.50 | — | — | |||||||||||
| Terminated during the period | — | — | — | — | ||||||||||||
| Outstanding at end of the period | 2,612,500 | $ | 1.47 | 2,415,000 | $ | 1.35 | ||||||||||
| Exercisable at end of the period | 1,952,750 | $ | 1.32 | 1,480,000 | $ | 1.25 | ||||||||||
At December 31, 2010 employee options outstanding totaled 2,130,000 with a weighted average exercise price of $1.52. These options had an intrinsic value of $1,155,150 and a weighted average remaining contractual term of 5.8 years. Of these options, 1,480,250 are exercisable at December 31, 2010, with an intrinsic value of $869,350 and a remaining weighted average contractual term of 5.8 years. Compensation cost related to the unvested employee options not yet recognized is $190,305 at December 31, 2010. We have estimated that $190,305 will be recognized during 2011.
The weighted average remaining life of the options is 5.7 years.
Transactions involving our stock warrants are summarized as follows:
| 2010 | 2009 | |||||||||||||||
| Number | Weighted Average Exercise Price | Number | Weighted Average Exercise Price | |||||||||||||
| Outstanding at beginning of the period | 5,007,470 | $ | 1.86 | 2,714,200 | $ | 1.27 | ||||||||||
| Granted during the period | 1,354,368 | 3.03 | 2,293,270 | 2.55 | ||||||||||||
| Exercised during the period | (50,001 | ) | 1.50 | — | — | |||||||||||
| Terminated during the period | — | — | — | — | ||||||||||||
| Outstanding at end of the period | 6,311,837 | $ | 2.11 | 5,007,470 | $ | 1.86 | ||||||||||
| Exercisable at end of the period | 6,311,837 | $ | 2.11 | 4,987,470 | $ | 1.86 | ||||||||||
The weighted average remaining life of the warrants is 3.1 years.
The number and weighted average exercise prices of our options and warrants outstanding as of December 31, 2010 are as follows:
| Range of Exercise Prices | Remaining Number Outstanding | Weighted Average Contractual Life (Years) | Weighted Average Exercise Price | |||||||||
| $0.50 - $1.00 | 1,559,000 | 3.7 | $ | 0.83 | ||||||||
| $1.50 - $2.00 | 4,603,453 | 4.1 | $ | 1.57 | ||||||||
| $2.20 - $3.00 | 1,730,989 | 3.5 | $ | 2.96 | ||||||||
| $3.10 - $3.50 | 1,030,895 | 4.3 | $ | 3.40 | ||||||||
F-19
NOTE 8 - INCOME TAXES
We utilize ASC 740 “Income Taxes”, which requires the recognition of deferred tax liabilities and assets for the expected future tax consequences of events that have been included in the financial statements or tax returns. Under this method, deferred tax liabilities and assets are determined based on the difference between financial statement and tax bases of assets and liabilities using enacted tax rates in effect for the year in which the differences are expected to reverse. Temporary differences between taxable income reported for financial reporting purposes and income tax purposes are insignificant.
Net operating losses for tax purposes of approximately $8,052,000 at December 31, 2010 are available or carryover. The net operating losses will expire from 2013 through 2030. We have provided a 100% valuation allowance for the deferred tax benefits resulting from the net operating loss carryover and our tax credits due to our limited operating history. In addressing the realizability of deferred tax assets, management considers whether it is more likely than not that some portion or all of the deferred tax assets will not be realized. The ultimate realization of deferred tax assets is dependent upon the generation of future taxable income during the periods in which those temporary differences are deductible. The valuation allowance increased by $1,064,000 and $706,000 during the years ended December 31, 2010 and 2009, respectively. A reconciliation of the statutory Federal income tax rate and the effective income tax rate for the years ended December 31, 2010 and 2009 follows.
Significant components of deferred tax assets and liabilities are as follows:
| 2010 | 2009 | |||||||
| Deferred tax assets: | ||||||||
| Net operating loss carryover | 2,738,000 | 1,730,000 | ||||||
| Tax credits | 215,000 | 159,000 | ||||||
| Valuation allowance | (2,953,000 | ) | (1,889,000 | ) | ||||
| Net deferred tax assets | $ | - | $ | - | ||||
| Statutory federal income tax rate | -34 | % | -34 | % | ||||
| State income taxes, net of federal taxes | -0 | % | -0 | % | ||||
| Non-deductible items | 10 | % | 21 | % | ||||
| Tax credits | 2 | % | 1 | % | ||||
| Valuation allowance | 22 | % | 12 | % | ||||
| Effective income tax rate | 0 | % | 0 | % | ||||
NOTE 9 - COMMITMENTS AND CONTINGENCIES
| (a) | Operating Leases |
The Company lease executive offices under an operating lease with lease term which expires on September 15, 2012. The following is a schedule of the future minimum lease payments required under the operating lease that has an initial non-cancelable lease term in excess of one year:
Fiscal year ending December 31, | Minimum Lease Commitments | |||
| 2011 | 18,764 | |||
| 2012 | 13,080 | |||
| $ | 31,844 | |||
F-20
Rent expense for office space amounted to $17,743 and $28,045 for the years ended December 31, 2010 and 2009, respectively.
| (b) | Employment Agreements |
On September 2, 2009, we entered into two employment agreements with the Chief Executive Officer and Chief Operating Officer. The employment agreements contain severance provision and indemnification clauses. The indemnification agreement provides for the indemnification and defense of the executive officers, in the event of litigation, to the fullest extent permitted by law. We also adopted the form of indemnification agreement for use with all other executive officers, employees and directors.
As part of the agreements, the executives shall be entitled to the following:
Chief Executive Officer | Chief Operating Officer | |||||||
| Terminated without cause | $ | 882,000 | $ | 330,000 | ||||
| Terminated, change of control without good reason | 1,512,000 | - | ||||||
| Terminated for cause, death, disability and by executive without good reason | 270,000 | 220,000 | ||||||
NOTE 10 – SUBSEQUENT EVENTS
On January 21, 2011, pursuant to a securities purchase agreement (the “Securities Purchase Agreement”), we sold 2,074,914 units resulting in gross proceeds to the Company of $3,734,840 (“Offering”). The price per unit was $1.80. Each unit consists of: (i) one (1) share of the Company’s common stock, par value $.0001 (“Shares”), and (ii) one half (1/2) Common Stock Purchase Warrant (“Warrant(s)”). Of these units, 339,915 were subscribed at December 31, 2010 with gross proceeds to the Company of $611,847 recorded in the December 31, 2010 financial statements as Common Stock Subscribed.
The Warrants have a term of five years and entitle the holders to purchase the Company’s common shares at a price per share of $3.30. In the event the shares underlying the Warrants are not subject to a registration statement, the warrants may be exercised on a cashless basis after 12 months from the issuance date. The Warrants also contain provisions providing for an adjustment in the underlying number of shares and exercise price in the event of stock splits or dividends and fundamental transactions. The Warrants do not contain any price protection provisions. The Warrants are callable by the Company assuming the following: (i) the Common Stock trades above $5.50 for ten (10) consecutive days; (ii) the daily average minimum volume over such ten (10) days is 15,000 or greater; and (iii) there is an effective registration statement covering the underlying shares. The Securities Purchase Agreement also grants the investors certain piggy-back registration rights.
In connection with the Offering, we incurred placement agent and finder’s fees in the amount of $114,295 in cash and issued warrants to purchase a total of 63,498 shares at an average exercise price per share of $3.26. Of the fees incurred, $110,695 was reinvested in the Offering on the same terms and conditions as the investors, resulting in the issuance of 61,498 units.
On February 16, 2011, pursuant to a securities purchase agreement, we sold an additional 166,691 units resulting in gross proceeds to the Company of $300,044. The units contain the same terms as the January 21, 2011 units described above.In connection with the offering, we incurred placement agent and finder’s fees in the amount of $6,403 in cash and issued warrants to purchase a total of 3,558 shares at an exercise price per share of $2.16.
As a result of the offerings, the reinvestment of fees, and the issuance of placement agent and finder’s warrants, we issued a total of 2,303,103 shares and 1,218,610 common stock purchase warrants.
F-21
GENSPERA INC.
(A Development Stage Company)
CONDENSED BALANCE SHEETS
| June 30, | December 31, | |||||||
| 2011 | 2010 | |||||||
| (Unaudited) | ||||||||
| Assets | ||||||||
| Current assets: | ||||||||
| Cash | $ | 7,913,548 | $ | 3,671,151 | ||||
| Total current assets | 7,913,548 | 3,671,151 | ||||||
| Fixed assets, net of accumulated depreciation of $5,458 and $3,874 | 10,375 | 11,959 | ||||||
| Prepaid fees | 126,354 | 3,500 | ||||||
| Intangible assets, net of accumulated amortization of $51,526 and $43,029 | 160,642 | 169,139 | ||||||
| Total assets | $ | 8,210,919 | $ | 3,855,749 | ||||
| Liabilities and stockholders' equity | ||||||||
| Current liabilities: | ||||||||
| Accounts payable and accrued expenses | $ | 683,771 | $ | 139,169 | ||||
| Accrued interest - stockholder | 14,704 | 12,517 | ||||||
| Convertible note payable - stockholder, current portion | 105,000 | 105,000 | ||||||
| Total current liabilities | 803,475 | 256,686 | ||||||
| Warrant derivative liabilities | 1,870,074 | 2,314,033 | ||||||
| Total liabilities | 2,673,549 | 2,570,719 | ||||||
| Commitments and contingencies | ||||||||
| Stockholders' equity: | ||||||||
| Preferred stock, par value $.0001 per share; 10,000,000 shares authorized, none issued and outstanding | - | - | ||||||
| Common stock, par value $.0001 per share; 80,000,000 shares authorized, 21,443,735 and 17,604,465 shares issued and outstanding, respectively | 2,144 | 1,760 | ||||||
| Common stock subscribed | - | 611,846 | ||||||
| Additional paid-in capital | 22,029,558 | 15,120,792 | ||||||
| Deficit accumulated during the development stage | (16,494,332 | ) | (14,449,368 | ) | ||||
| Total stockholders' equity | 5,537,370 | 1,285,030 | ||||||
| Total liabilities and stockholders' equity | $ | 8,210,919 | $ | 3,855,749 | ||||
See accompanying notes to unaudited condensed financial statements.
F-22
GENSPERA, INC.
(A Development Stage Company)
CONDENSED STATEMENTS OF LOSSES
FOR THE THREE AND SIX MONTHS ENDED JUNE 30, 2011 AND 2010
AND FOR THE PERIOD FROM INCEPTION (NOVEMBER 21, 2003) TO JUNE 30, 2011
(Unaudited)
| Cumulative Period | ||||||||||||||||||||
| from November 21, 2003 | ||||||||||||||||||||
| (date of inception) to | ||||||||||||||||||||
| Three Months ended June 30, | Six Months ended June 30, | June 30, | ||||||||||||||||||
| 2011 | 2010 | 2011 | 2010 | 2011 | ||||||||||||||||
| Operating expenses: | ||||||||||||||||||||
| General and administrative expenses | $ | 893,889 | $ | 777,744 | $ | 1,525,939 | $ | 1,173,624 | $ | 6,413,575 | ||||||||||
| Research and development | 801,237 | 737,106 | 1,222,353 | 1,091,171 | 8,977,760 | |||||||||||||||
| Research and development grant received | - | - | (244,479 | ) | - | (488,958 | ) | |||||||||||||
| Total operating expenses | 1,695,126 | 1,514,850 | 2,503,813 | 2,264,795 | 14,902,377 | |||||||||||||||
| Loss from operations | (1,695,126 | ) | (1,514,850 | ) | (2,503,813 | ) | (2,264,795 | ) | (14,902,377 | ) | ||||||||||
| Finance cost | - | - | - | - | (518,675 | ) | ||||||||||||||
| Change in fair value of derivative liability | (9,631 | ) | 809,880 | 443,959 | (613,612 | ) | (1,096,245 | ) | ||||||||||||
| Interest income, net | 8,512 | 8,886 | 14,890 | 12,259 | 22,965 | |||||||||||||||
| Loss before provision for income taxes | (1,696,245 | ) | (696,084 | ) | (2,044,964 | ) | (2,866,148 | ) | (16,494,332 | ) | ||||||||||
| Provision for income taxes | - | - | - | - | - | |||||||||||||||
| Net loss | $ | (1,696,245 | ) | $ | (696,084 | ) | $ | (2,044,964 | ) | $ | (2,866,148 | ) | $ | (16,494,332 | ) | |||||
| Net loss per common share, basic and diluted | $ | (0.08 | ) | $ | (0.04 | ) | $ | (0.10 | ) | $ | (0.18 | ) | ||||||||
| Weighted average shares outstanding | 20,991,614 | 16,752,200 | 20,179,914 | 16,203,123 | ||||||||||||||||
See accompanying notes to unaudited condensed financial statements.
F-23
GENSPERA, INC.
(A Development Stage Company)
CONDENSED STATEMENT OF STOCKHOLDERS' (DEFICIT) EQUITY
FROM DATE OF INCEPTION (NOVEMBER 21, 2003) TO JUNE 30, 2011
(Unaudited)
| Deficit | ||||||||||||||||||||||||
| Accumulated | ||||||||||||||||||||||||
| Additional | Common | During the | Stockholders' | |||||||||||||||||||||
| Common Stock | Paid-in | Stock | Development | Equity | ||||||||||||||||||||
| Shares | Amount | Capital | Subscribed | Stage | (Deficit) | |||||||||||||||||||
| Balance, November 21, 2003 | - | $ | - | $ | - | $ | - | $ | - | $ | - | |||||||||||||
| Sale of common stock to founders at $0.0001 per share in November, 2003 | 6,100,000 | 610 | (510 | ) | - | - | 100 | |||||||||||||||||
| Contributed services | - | - | 120,000 | - | - | 120,000 | ||||||||||||||||||
| Net loss | - | - | - | - | (125,127 | ) | (125,127 | ) | ||||||||||||||||
| Balance, December 31, 2003 | 6,100,000 | 610 | 119,490 | - | (125,127 | ) | (5,027 | ) | ||||||||||||||||
| Contributed services | - | - | 192,000 | - | - | 192,000 | ||||||||||||||||||
| Stock based compensation | - | - | 24,102 | - | - | 24,102 | ||||||||||||||||||
| Net loss | - | - | - | - | (253,621 | ) | (253,621 | ) | ||||||||||||||||
| Balance, December 31, 2004 | 6,100,000 | 610 | 335,592 | - | (378,748 | ) | (42,546 | ) | ||||||||||||||||
| Contributed services | - | - | 48,000 | - | - | 48,000 | ||||||||||||||||||
| Stock based compensation | - | - | 24,100 | - | - | 24,100 | ||||||||||||||||||
| Net loss | - | - | - | - | (126,968 | ) | (126,968 | ) | ||||||||||||||||
| Balance, December 31, 2005 | 6,100,000 | 610 | 407,692 | - | (505,716 | ) | (97,414 | ) | ||||||||||||||||
| Contributed services | - | - | 144,000 | - | - | 144,000 | ||||||||||||||||||
| Stock based compensation | - | - | 42,162 | - | - | 42,162 | ||||||||||||||||||
| Net loss | - | - | - | - | (245,070 | ) | (245,070 | ) | ||||||||||||||||
| Balance, December 31, 2006 | 6,100,000 | 610 | 593,854 | - | (750,786 | ) | (156,322 | ) | ||||||||||||||||
| Shares sold for cash at $0.50 per share in November, 2007 | 1,300,000 | 130 | 649,870 | - | - | 650,000 | ||||||||||||||||||
| Shares issued for services | 735,000 | 74 | 367,426 | - | - | 367,500 | ||||||||||||||||||
| Contributed services | - | - | 220,000 | - | - | 220,000 | ||||||||||||||||||
| Stock based compensation | - | - | 24,082 | - | - | 24,082 | ||||||||||||||||||
| Exercise of options for cash at $0.003 per share in March and June, 2007 | 900,000 | 90 | 2,610 | - | - | 2,700 | ||||||||||||||||||
| Net loss | - | - | - | - | (691,199 | ) | (691,199 | ) | ||||||||||||||||
| Balance, December 31, 2007 | 9,035,000 | 904 | 1,857,842 | - | (1,441,985 | ) | 416,761 | |||||||||||||||||
| Exercise of options for cash at $0.50 per share on March 7,2008 | 1,000,000 | 100 | 499,900 | - | - | 500,000 | ||||||||||||||||||
| Sale of common stock and warrants at $1.00 per share - July and August 2008 | 2,320,000 | 232 | 2,319,768 | - | - | 2,320,000 | ||||||||||||||||||
| Cost of sale of common stock and warrants | - | - | (205,600 | ) | - | - | (205,600 | ) | ||||||||||||||||
| Shares issued for accrued interest | 31,718 | 3 | 15,856 | - | - | 15,859 | ||||||||||||||||||
| Shares issued for services | 100,000 | 10 | 49,990 | - | - | 50,000 | ||||||||||||||||||
| Stock based compensation | - | - | 313,743 | - | - | 313,743 | ||||||||||||||||||
| Contributed services | - | - | 50,000 | - | - | 50,000 | ||||||||||||||||||
| Beneficial conversion feature of convertible debt | - | - | 20,675 | - | - | 20,675 | ||||||||||||||||||
| Net loss | - | - | - | - | (3,326,261 | ) | (3,326,261 | ) | ||||||||||||||||
| Balance, December 31, 2008 | 12,486,718 | 1,249 | 4,922,174 | - | (4,768,246 | ) | 155,177 | |||||||||||||||||
| Cumulative effect of change in accounting principle | - | - | (444,161 | ) | - | (290,456 | ) | (734,617 | ) | |||||||||||||||
| Warrants issued for extension of debt maturities | - | - | 51,865 | - | - | 51,865 | ||||||||||||||||||
| Stock based compensation | - | - | 1,530,536 | - | - | 1,530,536 | ||||||||||||||||||
| Common stock issued for services | 86,875 | 10 | 104,109 | - | - | 104,119 | ||||||||||||||||||
| Sale of common stock and warrants at $1.50 per share - February 2009 | 466,674 | 46 | 667,439 | - | - | 667,485 | ||||||||||||||||||
| Sale of common stock and warrants at $1.50 per share - April 2009 | 33,334 | 3 | 49,997 | - | - | 50,000 | ||||||||||||||||||
| Sale of common stock and warrants at $1.50 per share - June 2009 | 1,420,895 | 142 | 2,038,726 | - | - | 2,038,868 | ||||||||||||||||||
| Sale of common stock and warrants at $1.50 per share - July 2009 | 604,449 | 60 | 838,024 | - | - | 838,084 | ||||||||||||||||||
| Sale of common stock and warrants at $1.50 per share - September 2009 | 140,002 | 14 | 202,886 | - | - | 202,900 | ||||||||||||||||||
| Common stock and warrants issued as payment of placement fees | 53,334 | 5 | (5 | ) | - | - | - | |||||||||||||||||
| Common stock and warrants issued upon conversion of note and accrued interest | 174,165 | 18 | 174,147 | - | - | 174,165 | ||||||||||||||||||
| Net loss | - | - | - | - | (5,132,827 | ) | (5,132,827 | ) | ||||||||||||||||
| Balance, December 31, 2009 | 15,466,446 | 1,547 | 10,135,737 | - | (10,191,529 | ) | (54,245 | ) | ||||||||||||||||
| Stock based compensation | - | - | 1,165,450 | - | - | 1,165,450 | ||||||||||||||||||
| Sale of common stock and warrants at $1.65 per share - February and March 2010 | 533,407 | 53 | 806,157 | - | - | 806,210 | ||||||||||||||||||
| Sale of common stock and warrants at $2.00 per share - May 2010 | 1,347,500 | 135 | 2,655,365 | - | - | 2,655,500 | ||||||||||||||||||
| Common stock and warrants issued as payment of placement fees | 43,632 | 4 | (4 | ) | - | - | - | |||||||||||||||||
| Common stock issued as payment for patents and license | 20,000 | 2 | 46,798 | - | - | 46,800 | ||||||||||||||||||
| Common stock and warrants subscribed | - | - | - | 611,846 | - | 611,846 | ||||||||||||||||||
| Salaries paid with common stock | 43,479 | 4 | 99,996 | - | - | 100,000 | ||||||||||||||||||
| Exercise of options and warrants | 150,001 | 15 | 124,986 | - | - | 125,001 | ||||||||||||||||||
| Reclassification of derivative liability upon exercise of warrants | - | - | 86,307 | - | - | 86,307 | ||||||||||||||||||
| Net loss | - | - | - | - | (4,257,839 | ) | (4,257,839 | ) | ||||||||||||||||
| Balance, December 31, 2010 | 17,604,465 | 1,760 | 15,120,792 | 611,846 | (14,449,368 | ) | 1,285,030 | |||||||||||||||||
| Stock based compensation | - | - | 131,094 | - | - | 131,094 | ||||||||||||||||||
| Sale of common stock and warrants at $1.80 per share - January and February 2011 | 2,241,605 | 224 | 4,034,659 | (611,846 | ) | - | 3,423,037 | |||||||||||||||||
| Sale of common stock and warrants at $1.65 per share - April 2011 | 1,363,622 | 136 | 2,249,839 | - | - | 2,249,975 | ||||||||||||||||||
| Common stock and warrants issued as payment of placement fees | 61,498 | 6 | (6 | ) | - | - | - | |||||||||||||||||
| Common stock and warrants issued as payment of accrued consulting fees | 33,334 | 3 | 59,997 | - | - | 60,000 | ||||||||||||||||||
| Common stock and warrants issued as payment of consulting fees | 139,211 | 15 | 506,686 | - | - | 506,701 | ||||||||||||||||||
| Cost of sales of common stock and warrants | - | - | (73,503 | ) | - | - | (73,503 | ) | ||||||||||||||||
| Net loss | - | - | - | - | (2,044,964 | ) | (2,044,964 | ) | ||||||||||||||||
| Balance, June 30, 2011 | 21,443,735 | $ | 2,144 | $ | 22,029,558 | $ | - | $ | (16,494,332 | ) | $ | 5,537,370 | ||||||||||||
See accompanying notes to unaudited condensed financial statements.
F-24
GENSPERA, INC.
(A Development Stage Company)
CONDENSED STATEMENTS OF CASH FLOWS
FOR THE SIX MONTHS ENDED JUNE 30, 2011 AND 2010
AND FOR THE PERIOD FROM INCEPTION (NOVEMBER 21, 2003) TO JUNE 30, 2011
(Unaudited)
| Cumulative Period | ||||||||||||
| from November 21, 2003 | ||||||||||||
| (date of inception) to | ||||||||||||
| Six months ended June 30, | June 30, | |||||||||||
| 2011 | 2010 | 2011 | ||||||||||
| Cash flows from operating activities: | ||||||||||||
| Net loss | $ | (2,044,964 | ) | $ | (2,866,148 | ) | $ | (16,494,332 | ) | |||
| Adjustments to reconcile net loss to net cash used in operating activities: | ||||||||||||
| Depreciation and amortization | 10,081 | 9,257 | 56,984 | |||||||||
| Stock based compensation | 511,441 | 826,402 | 4,257,235 | |||||||||
| Common stock issued for acquisition of license | - | - | 28,800 | |||||||||
| Warrants issued for financing costs | - | - | 467,840 | |||||||||
| Change in fair value of derivative liability | (443,959 | ) | 613,612 | 1,096,245 | ||||||||
| Contributed services | - | - | 774,000 | |||||||||
| Amortization of debt discount | - | - | 20,675 | |||||||||
| Changes in assets and liabilities: | ||||||||||||
| Increase in accounts payable and accrued expenses | 606,789 | 73,797 | 784,899 | |||||||||
| Cash used in operating activities | (1,360,612 | ) | (1,343,080 | ) | (9,007,654 | ) | ||||||
| Cash flows from investing activities: | ||||||||||||
| Acquisition of property and equipment | - | - | (15,833 | ) | ||||||||
| Acquisition of intangibles | - | - | (194,168 | ) | ||||||||
| Cash used in investing activities | - | - | (210,001 | ) | ||||||||
| Cash flows from financing activities: | ||||||||||||
| Proceeds from sale of common stock and warrants | 5,673,012 | 3,461,710 | 16,974,705 | |||||||||
| Proceeds from exercise of warrants | - | 125,001 | 125,001 | |||||||||
| Cost of common stock and warrants sold | (70,003 | ) | (73,503 | ) | ||||||||
| Proceeds from convertible notes - stockholder | - | - | 155,000 | |||||||||
| Repayments of convertible notes - stockholder | - | - | (50,000 | ) | ||||||||
| Cash provided by financing activities | 5,603,009 | 3,586,711 | 17,131,203 | |||||||||
| Net increase in cash | 4,242,397 | 2,243,631 | 7,913,548 | |||||||||
| Cash, beginning of period | 3,671,151 | 2,255,311 | - | |||||||||
| Cash, end of period | $ | 7,913,548 | $ | 4,498,942 | $ | 7,913,548 | ||||||
| Supplemental cash flow information: | ||||||||||||
| Cash paid for interest | $ | - | $ | - | ||||||||
| Cash paid for income taxes | $ | - | $ | - | ||||||||
| Non-cash financial activities: | ||||||||||||
| Common stock units issued as payment of accrued consulting fees | $ | 60,000 | $ | - | ||||||||
| Common stock units issued as payment of placement fees | 110,695 | - | ||||||||||
| Common stock and warrants issued as payment of consulting fees | 498,701 | - | ||||||||||
| Derivative liability reclassified to equity upon exercise of warrants | - | 86,307 | ||||||||||
See accompanying notes to unaudited condensed financial statements.
F-25
GENSPERA, INC.
NOTES TO CONDENSED FINANCIAL STATEMENTS
FOR THE SIX MONTHS ENDED JUNE 30, 2011 AND 2010
AND FOR THE PERIOD FROM NOVEMBER 21, 2003
(INCEPTION) TO JUNE 30, 2011
(Unaudited)
NOTE 1 - SUMMARY OF ACCOUNTING POLICIES
A summary of the significant accounting policies applied in the preparation of the accompanying financial statements follows.
Business and Basis of Presentation
GenSpera Inc. (“we”, “us”, “our company”, “our”, “GenSpera” or the “Company”) was formed under the laws of the State of Delaware in 2003. We are a development stage entity, as defined by the Financial Accounting Standards Board (“FASB”) Accounting Standards Codification (“ASC”) Topic 915. GenSpera, Inc. is a pharmaceutical company focused on the development of targeted cancer therapeutics for the treatment of cancerous tumors, including breast, prostate, bladder and kidney cancer. Our operations are based in San Antonio, Texas.
To date, we have generated no sales revenues, have incurred significant expenses and have sustained losses. Consequently, our operations are subject to all the risks inherent in the establishment of a new business enterprise. For the period from inception on November 21, 2003 through June 30, 2011, we have accumulated losses of $16,494,332.
Liquidity
As of June 30, 2011, we had working capital (current assets in excess of current liabilities) of $7,110,073. Our cash flow used in operations was $1,360,612 and $1,343,080 for the six months ended June 30, 2011 and 2010, respectively. At June 30, 2011, we had cash on hand of approximately $7,914,000 and raised approximately $5,673,000 in the first six months of 2011. Based upon current cash flow projections, management believes the Company will have sufficient capital resources to meet projected cash flow requirements until July 2012.
Use of Estimates
The preparation of financial statements in conformity with generally accepted accounting principles requires management to make estimates and assumptions that affect the amounts reported in the financial statements and accompanying disclosures. Although these estimates are based on management's best knowledge of current events and actions the Company may undertake in the future, actual results may differ from those estimates.
Research and Development
Research and development costs include expenses incurred by the Company for research and development of therapeutic agents for the treatment of cancer and are charged to operations as incurred. Our research and development expenses consist primarily of expenditures for toxicology and other studies, manufacturing, clinical trials and compensation and consulting costs.
GenSpera incurred net research and development expenses of $801,237 and $737,106 for the three months ended June 30, 2011 and 2010, respectively, and $977,874 and $1,091,171 for the six months ended June 30, 2011 and 2010, respectively, and $8,488,802 from November 21, 2003 (inception) through June 30, 2011.
F-26
Loss Per Share
We use ASC 260, “Earnings Per Share” for calculating the basic and diluted loss per share. We compute basic loss per share by dividing net loss and net loss attributable to common shareholders by the weighted average number of common shares outstanding. Basic and diluted loss per share are the same, in that any potential common stock equivalents would have the effect of being anti-dilutive in the computation of net loss per share. There were 11,496,197 common share equivalents at June 30, 2011 and 8,894,425 at June 30, 2010. For the three and six months ended June 30, 2011 and 2010, these potential shares were excluded from the shares used to calculate diluted earnings per share as their inclusion would reduce net loss per share.
Fair value of financial instruments
Our short-term financial instruments, including cash, accounts payable and other liabilities, consist primarily of instruments without extended maturities, the fair value of which, based on management’s estimates, reasonably approximate their book value. The fair value of long term convertible notes is based on management estimates and reasonably approximates their book value after comparison to obligations with similar interest rates and maturities. The fair value of the Company’s derivative instruments is determined using option pricing models.
Fair value measurements
We follow the guidance established pursuant to ASC 820 which established a framework for measuring fair value and expands disclosure about fair value measurements. ASC 820 defines fair value as the amount that would be received for an asset or paid to transfer a liability (i.e., an exit price) in the principal or most advantageous market for the asset or liability in an orderly transaction between market participants on the measurement date. ASC 820 also establishes a fair value hierarchy that requires an entity to maximize the use of observable inputs and minimize the use of unobservable inputs when measuring fair value. ASC 820 describes the following three levels of inputs that may be used:
Level 1: Quoted prices (unadjusted) in active markets that are accessible at the measurement date for identical assets and liabilities. The fair value hierarchy gives the highest priority to Level 1 inputs.
Level 2: Observable prices that are based on inputs not quoted on active markets but corroborated by market data.
Level 3: Unobservable inputs when there is little or no market data available, thereby requiring an entity to develop its own assumptions. The fair value hierarchy gives the lowest priority to Level 3 inputs.
The table below summarizes the fair values of our financial liabilities as of June 30, 2011:
| Fair Value at | Fair Value Measurement Using | |||||||||||||||
June 30, 2011 | Level 1 | Level 2 | Level 3 | |||||||||||||
| Warrant derivative liability | $ | 1,870,074 | $ | — | $ | — | $ | 1,870,074 | ||||||||
| $ | 1,870,074 | $ | — | $ | — | $ | 1,870,074 | |||||||||
F-27
The table below sets forth a summary of changes in the fair value of the Company’s Level 3 financial liabilities (warrant derivative liability) for the six months ended June 30, 2011.
| 2011 | ||||
| Balance at beginning of year | $ | 2,314,033 | ||
| Change in fair value of warrant liability | (443,959 | ) | ||
| Balance at end of period | $ | 1,870,074 | ||
The following is a description of the valuation methodologies used for these items:
Warrant derivative liability — these instruments consist of certain of our warrants with anti-dilution provisions. These instruments were valued using pricing models which incorporate the Company’s stock price, volatility, U.S. risk free rate, dividend rate and estimated life.
Income Taxes
We utilize ASC 740 “Income Taxes” which requires the recognition of deferred tax assets and liabilities for the expected future tax consequences of events that have been included in the financial statements or tax returns. Under this method, deferred income taxes are recognized for the tax consequences in future years of differences between the tax bases of assets and liabilities and their financial reporting amounts at each year-end based on enacted tax laws and statutory tax rates applicable to the periods in which the differences are expected to affect taxable income.
Stock-Based Compensation
We account for our stock based compensation under ASC 718 “Compensation – Stock Compensation” using the fair value based method. Under this method, compensation cost is measured at the grant date based on the value of the award and is recognized over the service period, which is usually the vesting period. This guidance establishes standards for the accounting for transactions in which an entity exchanges it equity instruments for goods or services. It also addresses transactions in which an entity incurs liabilities in exchange for goods or services that are based on the fair value of the entity’s equity instruments or that may be settled by the issuance of those equity instruments.
We use the fair value method for equity instruments granted to non-employees and use the Black-Scholes model for measuring the fair value of options. The stock based fair value compensation is determined as of the date of the grant or the date at which the performance of the services is completed (measurement date) and is recognized over the vesting periods.
Recent Accounting Pronouncements
Recent accounting pronouncements issued by the FASB (including its Emerging Issues Task Force), the AICPA, and the SEC did not, or are not believed by management to, have a material impact on the Company's present or future financial statements.
NOTE 2 - CAPITAL STOCK AND STOCKHOLDER’S EQUITY
We are authorized to issue 80,000,000 shares of common stock with a par value of $.0001 per share and 10,000,000 shares of preferred stock with a par value of $.0001 per share.
F-28
On January 21, 2011, pursuant to a securities purchase agreement (the “Securities Purchase Agreement”), we sold 2,074,914 units resulting in gross proceeds to the Company of $3,734,840 (“Offering”). The price per unit was $1.80. Each unit consists of: (i) one (1) share of the Company’s common stock, par value $.0001 (“Shares”), and (ii) one half (1/2) Common Stock Purchase Warrant (“Warrant(s)”). Of these units, 339,915 were subscribed at December 31, 2010 with gross proceeds to the Company of $611,847 recorded in the December 31, 2010 financial statements as Common Stock Subscribed.
The Warrants have a term of five years and entitle the holders to purchase the Company’s common shares at a price per share of $3.30. In the event the shares underlying the Warrants are not subject to a registration statement, the warrants may be exercised on a cashless basis after 12 months from the issuance date. The Warrants also contain provisions providing for an adjustment in the underlying number of shares and exercise price in the event of stock splits or dividends and fundamental transactions. The Warrants do not contain any price protection provisions. The Warrants are callable by the Company assuming the following: (i) the Common Stock trades above $5.50 for ten (10) consecutive days; (ii) the daily average minimum volume over such ten (10) days is 15,000 or greater; and (iii) there is an effective registration statement covering the underlying shares. The Securities Purchase Agreement also grants the investors certain piggy-back registration rights.
In connection with the Offering, we incurred placement agent and finder’s fees in the amount of $114,295 in cash and issued warrants to purchase a total of 63,498 shares at an average exercise price per share of $3.26. Of the fees incurred, $110,695 was reinvested in the Offering on the same terms and conditions as the investors, resulting in the issuance of 61,498 units.
On February 16, 2011, pursuant to a securities purchase agreement, we sold an additional 166,691 units resulting in gross proceeds to the Company of $300,044. The units contain the same terms as the January 21, 2011 units described above. In connection with the offering, we incurred placement agent and finder’s fees in the amount of $6,403 in cash and issued warrants to purchase a total of 3,558 shares at an exercise price per share of $2.16.
On April 29, 2011, pursuant to a securities purchase agreement, we sold an additional 1,363,622 units resulting in gross proceeds of $2,249,750. The price per unit was $1.65. Each unit consists of: (i) one (1) share of the common stock, par value $.0001, and (ii) one half (1/2) common stock purchase warrant. The warrants have a term of five years and entitle the holders to purchase the common shares at a price per share of $3.15. In the event the shares underlying the warrants are not subject to a registration statement, the warrants may be exercised on a cashless basis after 12 months from the issuance date. The warrants also contain provisions providing for an adjustment in the underlying number of shares and exercise price in the event of stock splits or dividends and fundamental transactions. The warrants do not contain any price protection provisions. The warrants are callable assuming the following: (i) our common stock trades above $6.50 for ten (10) consecutive days; (ii) the daily average minimum volume over such ten (10) days is 15,000 or greater; and (iii) there is an effective registration statement covering the underlying shares. We also granted the investors certain piggy-back registration rights. In connection with the offering, we incurred finder’s fees in the amount of $60,000 in cash and issued warrants to purchase a total of 36,364 shares at an exercise price per share of $3.15. The warrants have the same terms and conditions as the investor warrants.
As a result of the offerings, the reinvestment of fees, and the issuance of placement agent and finder’s warrants, we issued a total of 3,666,725 shares and 1,936,785 common stock purchase warrants.
During March, 2011, we issued 33,334 units as payment of accrued consulting fees in the amount of $60,000. These fees had been accrued at December 31, 2010.
During March, 2011, we issued 82,500 shares of common stock and 144,000 warrants as payment of consulting fees. The warrants have an exercise price of $3.30 per share and have the same terms as the warrants issued with the offerings described above. The common shares have been valued at $144,375 based on the market price of our common stock. The warrants have been valued at $149,249, determined using the Black-Scholes method based on the following weighted average assumptions: (1) risk free interest rate of 2.25%; (2) dividend yield of 0%; (3) volatility factor of the expected market price of our common stock of 89%; and (4) an expected life of the warrants of 5 years.
F-29
On March 1, 2011, we granted 39,000 common stock options to a director. The options have an exercise price of $1.90 per share. The options will vest quarterly over one year. The options lapse if unexercised after five years. The options have a grant date fair value of $20,416, determined using the Black-Scholes method based on the following weighted average assumptions: (1) risk free interest rate of 0.225%; (2) dividend yield of 0%; (3) volatility factor of the expected market price of our common stock of 89%; and (4) an expected life of the options of 0.625 years. During the three and six months ended June 30, 2011 we have recorded an expense of $5,104 and $6,805 related to the fair value of the options that vested or are expected to vest.
During May 2011, we issued 52,500 shares of common stock and 91,000 warrants as payment of consulting fees. The warrants have an exercise price of $3.15 per share and have the same terms as the warrants issued with the offerings described above. The common shares have been valued at $100,800 based on the market price of our common stock. The warrants have been valued at $104,277, determined using the Black-Scholes method based on the following weighted average assumptions: (1) risk free interest rate of 1.50%; (2) dividend yield of 0%; (3) volatility factor of the expected market price of our common stock of 87%; and (4) an expected life of the warrants of 5 years. Of the aggregate value of the stock and warrants of $205,077, we have recorded a prepayment of $126,354 at June 30, 2011, with the balance of $78,723 charged to expense during the three months ended June 30, 2011.
During May 2011 we issued 4,211 shares of common stock, valued at $8,000, as payment for services.
On May 18, 2011, we granted a total of 80,000 common stock options to the four members of our Advisory Board. The options have an exercise price of $1.85 per share. The options will vest 20,000 upon grant and the balance quarterly over the remainder of 2011. The options lapse if unexercised after five years. During the three and six months ended June 30, 2011 we have recorded an expense of $50,966, respectively, related to the fair value of the options that vested, determined using the Black-Scholes method based on the following weighted average assumptions: (1) risk free interest rate of 1.5%; (2) dividend yield of 0%; (3) volatility factor of the expected market price of our common stock of 87%; and (4) an expected life of the options of 4.96 years.
During January 2011, we granted a total of 25,000 common stock options for legal and consulting services. The options have an exercise price of $1.90 per share. Of these options, 5,000 vested upon grant and 20,000 vests quarterly during 2011. The options and warrants lapse if unexercised after five years. We have recorded an expense of $5,980 and $18,928 during the three and six months ended June 30, 2011, respectively, related to the fair value of the options and warrants that vested or are expected to vest, determined using the Black-Scholes method based on the following weighted average assumptions: (1) risk free interest rate of 2.0%; (2) dividend yield of 0%; (3) volatility factor of the expected market price of our common stock of 90%; and (4) an expected life of the warrants of 4.8 years.
During the three and six months ended June 30, 2011 we have recorded a credit of $37,373 and an expense of $35,769, respectively, related to the fair value of the options granted to our chief executive officer and chief operating officer that vested or are expected to vest.
During the three and six months ended June 30, 2011 we have recorded an expense of $6,995 and $18,626 related to the fair value of the options granted to directors and consultants in prior years that vested or are expected to vest.
F-30
NOTE 3 – DERIVATIVE LIABILITY
At June 30, 2011, we recalculated the fair value of our warrants subject to derivative accounting and have determined that their fair value at June 30, 2011 is $1,870,074. The value of the warrants was determined using the Black-Scholes method based on the following assumptions: (1) risk free interest rate of 0.375%; (2) dividend yield of 0%; (3) volatility factor of the expected market price of our common stock of 87%; and (4) an expected life of the warrants of 2 years. We have recorded an expense of $9,631 and a credit of $443,959 during the three and six months ended June 30, 2011, respectively, related to the change in fair value during those periods.
On July 1, 2011, our compensation committee approved the 2011 annual base salaries and the 2010 Long Term Incentive Grants for our chief executive officer and chief operating officer. This action results in an increase in 2011 base salaries aggregating $80,000, retroactive to January 1, 2011. The 2010 Long Term Incentive Grants aggregate $510,000 and shall be paid via the issuance of common stock options in lieu of cash. For purposes of calculating the number of options to be issued as payment of the discretionary bonuses, determined using the Black-Scholes method based on the following weighted average assumptions: (1) risk free interest rate of 0.375%; (2) dividend yield of 0%; (3) volatility factor of the expected market price of our common stock of 87%; and (4) an expected life of the options of 2.5 years, the grant date is July 1, 2011. The aggregate number of options granted is 559,370, with a weighted average exercise price of $1.93. We have included an accrual of $550,000 at June 30, 2011 to reflect the 2010 Long Term Incentive Grants and the retroactive increase in salaries.
F-31
6,397,507
Shares of Common Stock
Prospectus
October 14, 2011
47