Exhibit 99.1
Investor Presentation October 2010 |
Certain statements in this presentation, and other written or oral statements made by or on behalf of us, are “forward-looking statements” within the meaning of the federal securities laws. Statements regarding future events and developments and our future performance, as well as management’s expectations, beliefs, plans, estimates or projections relating to the future, including statements regarding guidance, are forward-looking statements within the meaning of these laws. Although we believe that the expectations reflected in such forward-looking statements are based upon reasonable assumptions, there can be no assurance that the expectations will be realized. These forward-looking statements are subject to a number of known and unknown risks and uncertainties, many of which are beyond our control that could cause actual results to differ materially and adversely from such statements. These risks and uncertainties include: changes in the price of potash or Trio™; operational difficulties at our facilities; the ability to hire and retain qualified employees; changes in demand and/or production of potash or Trio™/langbeinite; changes in our reserve estimates; our ability to achieve the initiatives of our business strategy, including but not limited to the development of the HB Solar Solution Mine as a solution mine and the further development of our langbeinite recovery assets; changes in the prices of our raw materials, including but not limited to the price of chemicals, natural gas and power; fluctuations in the costs of transporting our products to customers; changes in labor costs and availability of labor with mining expertise; the impact of federal, state or local government regulations, including but not limited to environmental and mining regulations, and the enforcement of such regulations; competition in the fertilizer industry; declines in U.S. or world agricultural production; declines in oil and gas drilling; changes in economic conditions; adverse weather events at our facilities; our ability to comply with covenants inherent in our current and future debt obligations to avoid defaulting under those agreements; disruptions in credit markets; our ability to secure additional federal and state potash leases to expand our existing mining operations; governmental policy changes that may adversely affect our business and the risk factors detailed in our filings with the U.S. Securities and Exchange Commission. Please refer to those filings for more information on these risk factors. These forward-looking statements speak only as of the date of this press release, and we undertake no obligation to publicly update or revise any forward-looking statement, whether as the result of future events, new information or otherwise. Cautionary Statements Regarding Forward-Looking Information 2 |
Intrepid Potash Strategically Located, Potash-Only Company Intrepid currently has an intense margin focus: Improve reliability and efficiency Capital investment to increase recoveries and productivity which is designed to lower per ton production cost Innovate production methods Strategic marketing Our production focus combined with potash fundamentals delivers long-term margin opportunity 3 Florida New Mexico Texas Oklahoma Kansas Nebraska South Dakota Montana Wyoming Colorado Utah Idaho Arizona Nevada Washington California Oregon Kentucky Maine New York Pennsylvania Michigan Vermont New Hampshire Virginia West Virginia Ohio Indiana Illinois North Carolina Tennessee South Carolina Alabama Mississippi Arkansas Louisiana Missouri Iowa Minnesota Wisconsin Georgia North Dakota HB Solution Mine Developmental Asset Operating Solar Evaporation Solution Mine Operating Conventional Mine North Mine Developmental Asset ® |
Company Overview The largest U.S. producer of potassium fertilizer Only western world producer created and dedicated solely to potash-related products Supplies ~1.5% of global demand and ~9.4% of U.S. demand 1 of 2 global producers of sulfate of potash magnesia, marketed as Trio™ 5 active production facilities Productive capacity of approximately 0.9 million tons of potash and ~0.2 million tons of Trio™ Additional development and brownfield productive capacity of approximately 0.2 million tons of potash and ~0.2 million tons of Trio™ expected within 2 – 3 years Development projects should increase reliability and recoveries to lower our per ton production cost Balance sheet and cash from operations provide flexibility and stability 4 |
5 Solid Financial Performance EBITDA(1) (In millions) Balance Sheet as of June 30, 2010 (1) This is a financial measurement not calculated based on U.S. Generally Accepted Accounting Principles (Non GAAP). Non-GAAP reconciliation available in the appendix to this presentation. Net Income (In millions) Earnings Per Share (Diluted) Cash and Investments $136 million Total Assets $781 million Debt Outstanding $ - Stockholders’ Equity $726 million Availability Under the Credit Line $125 million $31.5 $20.8 $14.5 $26.6 $13.3 Q2 09 Q3 09 Q4 09 Q1 10 Q2 10 $17.4 $13.3 $12.3 $11.8 $3.7 Q2 09 Q3 09 Q4 09 Q1 10 Q2 10 $0.19 $0.13 $0.09 $0.16 $0.05 Q2 09 Q3 09 Q4 09 Q1 10 Q2 10 |
Potential industry consolidation has brought potash back into the spotlight BHP Billiton / Potash Corporation of Saskatchewan Inc. (“PCS” or “Potash Corp.”) Silvinit / Uralkali The timing of BHP Billiton’s offer for Potash Corp. has effectively called the bottom of the commodity market The agricultural demand cycle in the United States appears to have returned to normal Farmers recognize the need and value of potassium Commodity prices are supportive of farmer economics Dealers purchased potash for their own account during the summer, in anticipation of robust fall applications Current buying is expected to be for additional fall application and the beginning of traditional winter fill programs in anticipation of normal applications in the spring i.e. – more normal buying patterns 6 What Are We Seeing In Today’s Potash Market |
Current Inventory and Production Snapshot Demand from dealers has been robust ahead of what is expected to be a strong fall application season We are fully committed on granular potash through November and are currently sold out of granular Trio™ Potassium prices are rising: Potash Granular Effective October 1, 2010 - $380 per ton FOB Carlsbad Effective November 1, 2010 - $410 per ton FOB Carlsbad Trio™ Granular Effective September 1, 2010 - $211 per ton FOB Carlsbad Effective October 15, 2010 - $246 per ton FOB Carlsbad 7 Preliminary Sales Volumes Preliminary Average Net Realized Sales July 2010 (1) (short tons) August 2010 (1) (short tons) Prices 7/1/10 – 8/31/10 (1) Potash 52,000 75,000 $339 per ton Trio™ 9,000 23,000 $173 per ton (1) Unaudited results. Intrepid expects to release its third quarter 2010 financial results on November 3, 2010, and expects to file its Quarterly Report on Form 10-Q for the quarter ending September 30, 2010 with the U.S. Securities and Exchange Commission on November 4, 2010. |
Supply and Demand Conditions Lead to the Current Pricing Environment U.S. Midwest (fob warehouse) $430-440 spot Saskatchewan (fob mine) $400-405 spot E.C.L. America cfr $375-390 spot SE Asia cfr $400-405 spot W. Europe (cfr import) $399-412 spot India (cfr Indian port) (standard) $370 contract as of Aug. 2010 8 Granular Muriate of Potash (MOP) Midwest Pricing Midwest Granular MOP ($/ton) Source: Green Markets, Fertecon, International Plant Nutrition Institute (IPNI). Example Prices ($ / ton) Dec. 2006: Berezniki 1 mine flood removes 1.3MM tons of KCL 1991: Collapse of Soviet Union 2006: Canpotex concludes pricing negotiations with China 1997: Potacan mine flood removes 0.8MM tons of KCL 1986: Berezniki 3 mine flood removes 1.8MM tons of KCL 2000: Intrepid Acquisition of Moab 2004: Intrepid Acquisition of Carlsbad and Wendover Nov. 2008: Global buyer stand-off and significant reported production curtailments Aug. 2008: Record low potash inventories July 2009: Silvinit announces $417 per ton to India Dec. 2009: BPC announces $318 per ton to China Feb. 2010: BPC raises spot price to $366 per ton on uptick in demand Sept. 2010: PCS announces immediate $50 per ton price increase to $440 per ton 0 100 200 300 400 500 600 700 800 900 1985 1987 1989 1991 1993 1995 1997 1999 2001 2003 2005 2007 2009 |
Few Deposits, Fewer Global Producers 9 2008 & 2009– MM KCL Equivalent Tons (2) (3) (2) (2,5) Source: Public filings and select country data from Fertecon (1) Mosaic’s fiscal year ends on May 31. (2) PCS has ownership stake. (3) PCS markets Intrepid Potash’s products exclusively outside North America. (4) Compass Minerals produces potassium sulfate (SOP), which does not compete directly with MOP. Compass Minerals’ SOP is produced both directly and by reprocessing MOP purchased from other producers. Estimated reprocessed production is excluded from the figures for Compass Minerals. (5) Estimate for 2009 production. (1) (4) Production Share Canpotex BPC 1.5% 2009 2008 0 1 2 3 4 5 6 7 8 9 10 11 PCS Mosaic Agrium Belaruskali Uralkali K + S Silvinit ICL China APC Intrepid SQM Vale Compass PCS Affiliates BPC Canpotex RoW Intrepid 32.1% 18.6% 19.2% 28.6% |
Potash Deliveries Track Population Growth 10 In spite of financial crisis, population growth continues Utilizing the 1.1% growth rate, provided by the US Census Bureau, in world population of 6.9 billion people: Each year – 75 million more people or approximately nine more New York Cities This would require an additional 40 million acres of arable land (1.2x the farmland in Iowa)(1) A world yield increase of 1.1% per year, to maintain current rates of arable land Source: Fertecon, US Census Bureau. (1) State Data Center of Iowa; 2006 estimate. Collapse of Soviet Union Potash Deliveries 5-Year Forward CAGRS (2008 – 2012) 5.0% China 5.7% Brazil Historical Global Population or Potash Delivery Trendline 0 10 20 30 40 50 60 70 1981 1984 1987 1990 1993 1996 1999 2002 2005 2008E 2011E (000s Tons of Delivery in KCL Equivalent) 0 1 2 3 4 5 6 7 8 Global Midyear Population (in billions) World World ex. FSU |
Fundamentals of Increasing Population Continue to Drive Grain Demand Over the Long-Term 11 Note: Grains include corn, wheat, barley, oats and sorghum. Stock to use ratio is average inventory / consumption for that year; data updated monthly. Source: United Nations Food and Agriculture Organization (FAO), USDA, Potash & Phosphate Institute (PPI,) International Fertilizer Industry Association (IFA), Fertecon. (1) Futures prices based on closing price of Chicago Board of Trade futures contracts as of 9/9/10; futures prices for December delivery in forecast years. Hectares of Arable Land per Person Hectares per person Crop Prices Over Time(1) World Grain Production and Stock to Use Ratios Grain Production Stock to Use Ratio 5 Year Average Fall 2010 Futures Soybeans: $8.40 $11.35 Wheat: $5.14 $7.19 Corn: $3.45 $5.28 0.38 0.32 0.29 0.25 0.22 0.21 0.00 0.10 0.20 0.30 0.40 0.50 1970 1980 1990 2000 2010E 2020E 10 % 20% 30% 40 % 50 % 600 800 1 , 000 1 , 200 1 , 400 1 , 600 1 , 800 2 , 000 1980 1983 1986 1989 1992 1995 1998 2001 2004 2007 2010 E Stocks to Use Ratio Grain Production (Millions of Tons) |
United States Potash Consumption 12 Source : Fertecon, United States Department of Agriculture (USDA). Potash consumption is shown in fertilizer years (July – June). Grains stocks include: Barley, Corn, Oats, Sorghum, Wheat Potash fertilizer consumption has remained relatively constant, with an annual volatility of approximately ten percent, over the past 27 years Corn acres planted in the U.S. were 93.5MM acres in 2007, 86.0MM acres in 2008, 86.5 MM acres in 2009 and are estimated to be 87.9MM acres in 2010 1982: Recession leads to lower consumption; Payment In Kind program reduces planted acres 1991-1997: Low grain stocks lead to increased consumption 1998: Russian financial crisis impacts world markets 2001- mid 2008: Global economic expansion leads to increased demand (2006 delayed Chinese negotiations) 0 % 10 % 20 % 30 % 40 % 50 % 60 % 70 % 80 % 90 % 100 % - 2,000 4,000 6,000 8,000 10,000 12,000 Grains Stocks to Use Ratio KCL Tons (' 000 ) FERTECON U.S. Potash Consumption and Grains Stocks to Use Ratio KCL Tons Stocks to Use Ratio |
Strong Returns for Growers 13 - Non-land fixed costs include: labor, opportunity cost of unpaid labor, taxes, insurance, general overhead, and machine and equipment expenses. - Other variable costs include: seed, chemicals, fuel, lube, electricity, repairs, water, interest, custom operations, and drying. - Land costs are shown as the rental rate of land (opportunity cost). - Corn Farm Price is Dec. futures price minus $0.30 basis. - Potash consumption in shown in fertilizer years (2008/2009 included under 2008). Data is estimated for 2009. Source: USDA, Fertecon, Intrepid Potash . Corn Farm Price Potash (3%) Land (23%) Non-Land Fixed Costs (25%) Other Variable Costs (31%) Total Fertilizer (22%) Per Bushel Return Historical Corn Input Costs and Price Potash Consumption $ per bushel Potash Consumption (KCL tons ‘000) 2009 2010 as of 10/8/10 Farm Price $ 3.59 $ 4.98 Gross Margin $ 0.27 $ 1.45 Input Costs Potash $ 0.11 $ 0.09 Total Fertilizer $ 0.80 $ 0.77 Other Variable $ 1.00 $ 1.08 Non-Land $ 0.81 $ 0.88 Land $ 0.70 $ 0.80 Total $ 3.32 $ 3.53 0 2000 4000 6000 8000 10000 12000 - 0.50 1.00 1.50 2.00 2.50 3.00 3.50 4.00 4.50 5.00 1996 1997 1998 1999 2000 2001 2002 2003 2004 2005 2006 2007 2008 2009 2010 F |
Commodity Prices are Moving Up 14 70% 80% 90% 100% 110% 120% 130% Jan-10 Feb-10 Mar-10 Apr-10 May-10 Jun-10 Jul-10 Aug-10 Sep-10 Oct-10 Nov-10 Dec-10 Jan-11 Feb-11 Mar-11 Commodity Price Levels* Expressed as % of Jan. 4 2010 Prices Lean Hogs Live Cattle No. 2 Yellow Corn Soybeans Wheat No. 11 Sugar *5 Day Rolling Average of Benchmark Futures Contracts: Corn, Wheat, Hogs and Cattle-Dec. 2010; Soybeans-Nov. 2010; Sugar-Mar. 2011 Historic Future Source: BLoomberg, CME |
Farmers Understand the Agronomic Benefits of Potash Potash application rates were down in 2008 and 2009 A robust 2009 crop coupled with lower application rates meant that soils were being depleted of “banked” nutrients An equally strong 2010 crop should result in a significant nutrient draw down 15 Strong Crop Yields in 2009 Result in Removal of Nutrients from the Soil (1) (1) USDA projection for 2009/10 Corn yield of 162.5 bu/ac. . 2007 average K2O Application: 43.6 lbs/Acre 2007 average K2O Removal: 55.8 lbs/acre 2007 average K2O Balance: - 12.2 lbs/acre - 20.0 - 10.0 0.0 10.0 20.0 30.0 40.0 50.0 60.0 1985 1990 1995 2000 2005 2010 Lbs of K2O Per Acre US K2O Balance: 1987-2007 Application Removal Balance Source: IPNI Preliminary Nutrient Use Geographic Information System - 2010 |
Ethanol Has Become a Steady State Demand Driver USDA predicts corn use for ethanol to level off at around 35-40% of total use in the United States Renewable Fuels Standards effectively set a floor for ethanol production in the United States Upcoming EPA decision on E15 may potentially increase the United States ethanol market 16 Forecast Projected US Corn Utilization |
Why consider an investment in Intrepid Potash ? Strong Long-Term Industry Fundamentals The Only Western World Potash Pure-Play Strategically Located Assets Diversified Markets and Customer Base Well-Defined, Attractive Organic Growth Opportunities that Lower Per-Ton-Costs 17 ® |
Strategically Located Assets 18 Average Potash Consumption Greater than 5x Our Average Production in Our Markets Low High Source: Association of American Plant Food Control Officials (AAPFCO), The Fertilizer Institute (TFI), Intrepid Potash. (1) AAPFCO, Fertecon, USDA. New Mexico Texas Oklahoma Kansas Colorado Mississippi Arkansas Louisiana Idaho Washington Oregon Nebraska Missouri Iowa Illinois California Wyoming Utah Arizona Nevada Minnesota * Intrepid Mine Location |
The Intrepid Potash Advantage: Strategically Located and Lower Royalties 19 (2) Source: Green Markets and Fertecon Notes: (1) Based on Full Year 2009 for Intrepid Potash Inc., Potash Corp., Mosaic Co., Agrium Inc. (2) Total COGS include: Cash operating costs including all royalty, profit and capital taxes; Royalties of $20 per ton for Intrepid; Royalty, profit and capital taxes of $17 per ton for N. American Competitors. (3) Intrepid reports “average net realized sales price” which is an operating performance measure commonly used in the potash mining industry. Average net realized sales prices are derived by subtracting freight costs from gross sales revenue and then dividing this result by sales tons. Intrepid vs. North American Competitors Most Recently Reported Year ($ per ton) Intrepid’s Advantage Most Recently Reported Year ($ per ton) (1) Our 3.5% net sales royalty rate is significantly lower than royalty and resource tax burden of our principal competitors $151 $37 + = (2) ® $541 $390 $(234) $(197) $0 $100 $200 $300 $400 $500 $600 Average Net Realized Sales Price Total COGS Intrepid N. American Competitors $151 $(37) $114 ($40) ($10) $20 $50 $80 $110 Average Net Realized Sales Price Total COGS Gross Margin Advantage 2005 2006 2007 2008 2009 1H 2010 Intrepid average net realized sales price per ton advantage (3) 29.00 $ 43.00 $ 39.00 $ 88.00 $ 151.00 $ 61.00 $ |
Diversified Markets and Customer Base We sell potash into three different markets: Agricultural, Industrial and Animal Feed Agricultural represents ~70% of Intrepid sales compared to an industry average of 92%(1) Agricultural primarily consumes granular potash and Trio™, while industrial and animal feed primarily consume standard potash Standard potash costs less to produce Generates better netback per ton domestically Marketing flexibility is an important attribute Industrial is primarily deliveries of standard potash to distributors to oil and gas drillers Baker Hughes U.S. Rotary Rig Count has shown strong recovery over the last 18 months, with growth concentrated in the LA, NM, OK, PA and TX markets Industrial customers rely on spot market sales and just-in-time delivery 20 Intrepid Potash Sales for 2009 Industrial Agricultural Animal Feed Includes: Barley Corn Cotton Hay Nuts Rice Soybeans Vegetables Wheat (1) Source: Fertecon. FY 2008 FY 2009 1H 2010 Agricultural 62% 69% 81% Industrial 30% 18% 12% Animal Feed 8% 13% 7% ® |
Intrepid’s Focus is to Reduce Costs and Increase Production Flexibility Does operating potash assets in this way make sense for the BHP shareholder? Even if BHP does take this stance in the market, Intrepid is making operational and capital investment decisions to withstand this activity Continual effort towards increasing production rates from existing assets at sustainable levels Current and future capital projects address this focus Moab Compaction Project Langbeinite Recovery Improvement Project HB Solar Solution Mine 21 Well Before BHP Bid for Potash Corp., Intrepid’s Focus was on Reducing Costs and Increasing Production Flexibility Should BHP gain control of Potash Corp., it intends to run the assets at full capacity “Our basic philosophy is to run our assets at full capacity and take the market prices, which effectively means that we maintain full employment throughout the cycle.” Marius Kloppers - BHP Billiton CEO – August 18, 2010 - BHP Billiton Conference Call |
Well-Defined Attractive Growth Opportunities to Increase Production and Lower Per Ton Costs 22 Facility Estimated Key Benefits Estimated Capex Range for Future Projects (1) Estimated in service date Potash Debottlenecking and Expansion Projects at Existing Facilities Moab Compaction Project Moab 2010 Ability to granulate 100 percent of production from Moab Provides flexibility to respond to differing market demands ~$15MM 2010 Digital Control System Carlsbad 2010 Enhance both surface and underground operational performance of facilities Enhance underground safety at facilities $6-$7MM 2010 Additional Caverns Moab 2010 Provide more brine to solar evaporation ponds Increase production $5-$6MM 2010 Significant Future Recovery & Productivity Projects Langbeinite Recovery Improvement Project East 2011 Step change in langbeinite recoveries Reduced water consumption Lower East mine per ton cost structure Added flexibility to product mix $85-$90MM 2011 HB Solution Mine HB 2013 Convert inactive mine to low cost solution mine Utilize solar evaporation to create low cost tons Expected annual production of 150,000 – 200,000 tons Permitting expected fourth quarter 2011 $120-$130MM 2013 2010 Capex budget of $105 to $125 million $45 to $55 million likely to be allocated to sustaining and improvement capital $60 to $70 million likely to be allocated to fund portions of the projects listed below (1) All dollar amounts for future capital spending are estimates that are subject to change as projects are further developed, modified, deferred, or canceled. |
$15.5 million capital investment approved in early 2010 Ability to granulate 100 percent of annual production from Moab facility Project allows flexibility in production mixes to meet market demand Current compaction capacity at Moab is approximately 40 percent of annual production capacity All long-lead time materials (compactor and components) are currently in Utah and construction has begun Project expected to be complete and in service by early 2011 23 Moab Compaction Project Expected Project Benefits: Improve initial compaction efficiency Eliminate need for additional product handling Enhance flexibility to market production IRR expectations of greater than 20 percent |
Intrepid believes the market recognizes the combined value of the nutrients in Trio™, potassium, magnesium and sulfur, and, as a result, Intrepid expects the pricing opportunity in the premium market to strengthen Growing Langbeinite Business Presents a Key Opportunity for Intrepid Intrepid made the initial investment to recover langbeinite from the East mine Effectively a pilot project in 2005 The 2010 Langbeinite Recovery Improvement Project is the next step in the development of our langbeinite business Optionality to add on to the project to further increase productivity in the future Intrepid recently hired two full time employees, including a PhD agronomist, to further develop the langbeinite market domestically and internationally Demand for granular Trio™ continues to grow Intrepid has over 50 years of remaining langbeinite reserves 24 Our Commitment to Our Customers is Key |
Langbeinite Recovery Improvement Project Expected to increase Trio™ recoveries from 30-35 percent to approximately 50 percent, thereby reducing cash costs per ton Expected to reduce process water consumption Allows for production flexibility through the ability to granulate 100 percent of standard production Utilizes elements of our existing production assets Ability to increase production capacity in the future by adding flotation circuit to increase recoveries to approximately 70 percent with incremental investment Total project investment of approximately $85mm - $90mm $35mm to be incurred in 2010 Attractive IRR of ~17 percent at Trio™ pricing significantly lower than today 25 Project Benefits & Opportunities Project Economics |
$120 - $130 mm total estimated capital investment, results in, $700 per ton capex to reopen an existing mine compared to an estimated cost of ~$1,400 per ton for greenfield projects HB solution mine expected to be among the lower-cost potash mines in North America Same proven solar evaporation and solution mining technology as used in Moab Will share infrastructure with existing Carlsbad operations Production cost per ton estimated to be $65 to $75 per ton(1) Estimated annual production – 150,000-200,000 tons Filed permit application in March 2008; Proposed Mine plan submitted to the BLM in May 2008; BLM requested Environmental Impact Statement (EIS) in January 2009 We anticipate the BLM will complete the EIS process by fourth quarter 2011 Production planned to begin ~12 months after permit approval and full production two years after construction begins Total area available to be flooded: 1.3x size of Manhattan 26 HB Solution Mine: Incremental Low Cost Tons Potash Pillar (1) Based on third party feasibility study. |
HB Solution Mine: Project Timeline & EIS Process 27 Twenty months into the EIS process with the BLM Anticipate completing EIS review process in Q4 2011 BLM has issued its scoping summary report for the EIS and is moving forward on preparation of the draft EIS Received ground water discharge permit for the mine from the New Mexico Environment Department in July of 2010 HB Project Update |
28 Final Thoughts Strong Long-Term Industry Fundamentals The Only Western World Potash Pure-Play Strategically Located Assets Diversified Markets and Customer Base Well-Defined, Attractive Organic Growth Opportunities that Lower Per-Ton-Costs |
Appendix ® |
30 Conversion Rates 1 metric tonne = 1.102 short tons 1 product ton of potash (KCL or KCL Equivalent) = 61% K20 1 product ton of langbeinite = 22% K20 1 product ton of SOP = 50% K20 |
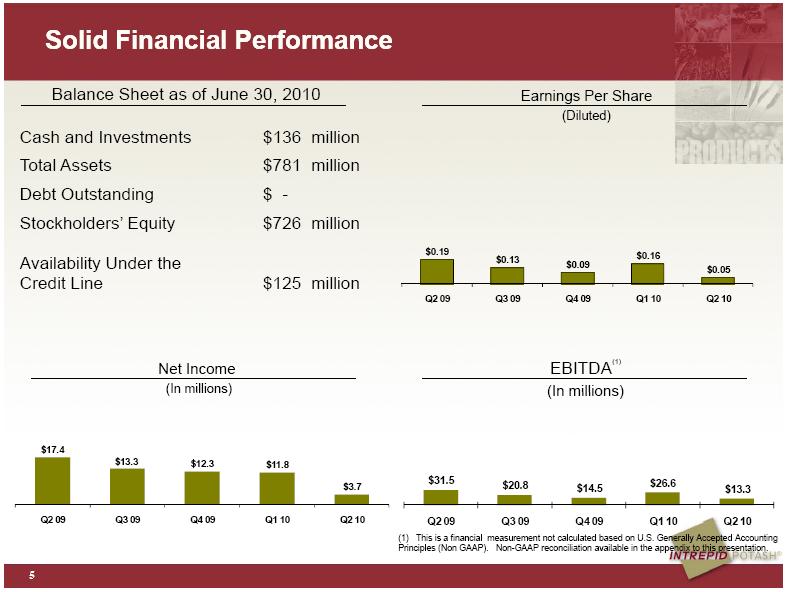
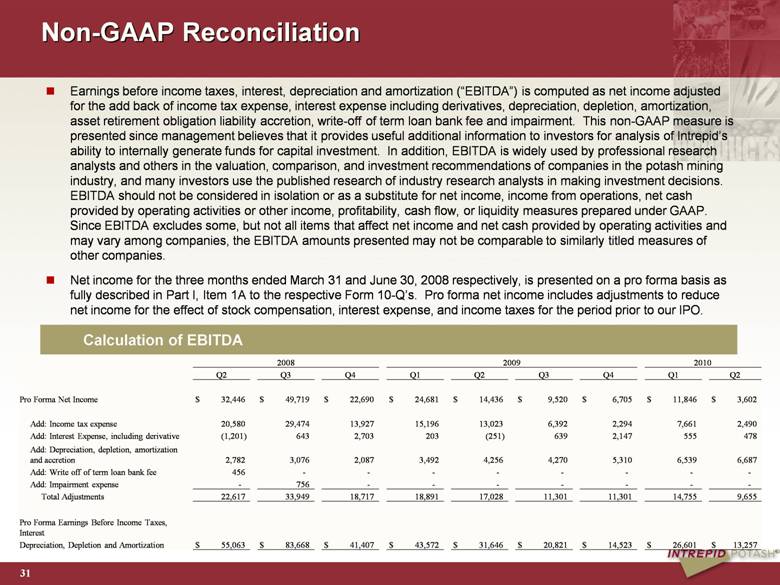
Calculation of EBITDA 31 Non-GAAP Reconciliation Earnings before income taxes, interest, depreciation and amortization (“EBITDA”) is computed as net income adjusted for the add back of income tax expense, interest expense including derivatives, depreciation, depletion, amortization, asset retirement obligation liability accretion, write-off of term loan bank fee and impairment. This non-GAAP measure is presented since management believes that it provides useful additional information to investors for analysis of Intrepid’s ability to internally generate funds for capital investment. In addition, EBITDA is widely used by professional research analysts and others in the valuation, comparison, and investment recommendations of companies in the potash mining industry, and many investors use the published research of industry research analysts in making investment decisions. EBITDA should not be considered in isolation or as a substitute for net income, income from operations, net cash provided by operating activities or other income, profitability, cash flow, or liquidity measures prepared under GAAP. Since EBITDA excludes some, but not all items that affect net income and net cash provided by operating activities and may vary among companies, the EBITDA amounts presented may not be comparable to similarly titled measures of other companies. Net income for the three months ended March 31 and June 30, 2008 respectively, is presented on a pro forma basis as fully described in Part I, Item 1A to the respective Form 10-Q’s. Pro forma net income includes adjustments to reduce net income for the effect of stock compensation, interest expense, and income taxes for the period prior to our IPO. 2008 2009 2010 Q2 Q3 Q4 Q1 Q2 Q3 Q4 Q1 Q2 Pro Forma Net Income $ 32,446 $ 49,719 $ 22,690 $ 24,681 $ 14,436 $ 9,520 $ 6,705 $ 11,846 $ 3,602 Add: Income tax expense 20,580 29,474 13,927 15,196 13,023 6,392 2,294 7,661 2,490 Add: Interest Expense, including derivative (1,201) 643 2,703 203 (251) 639 2,147 555 478 Add: Depreciation, depletion, amortization and accretion 2,782 3,076 2,087 3,492 4,256 4,270 5,310 6,539 6,687 Add: Write off of term loan bank fee 456 - - - - - - - - Add: Impairment expense - 756 - - - - - - - Total Adjustments 22,617 33,949 18,717 18,891 17,028 11,301 11,301 14,755 9,655 Pro Forma Earnings Before Income Taxes, Interest Depreciation, Depletion and Amortization $ 55,063 $ 83,668 $ 41,407 $ 43,572 $ 31,646 $ 20,821 $ 14,523 $ 26,601 $ 13,257 |
Calculation of Adjusted Net Income 32 Non-GAAP Reconciliation Adjusted net income is calculated as net income adjusted for significant non-cash and unusual items. Examples of non-cash and unusual charges include insurance settlements in excess of property losses, non-cash gains or losses associated with unrealized derivative adjustments, our abnormal production adjustment, and the write-off of costs associated with the delay in permitting for the HB Mine associated with contractor mobilization and demobilization. The non-GAAP measure of adjusted net income is presented because management believes it provides useful additional information to investors for analysis of Intrepid’s fundamental business on a recurring normal basis. In addition, management believes that the concept of adjusted net income is widely used by professional research analysts and others in the valuation, comparison, and investment recommendations of companies in the potash mining industry, and many investors use the published research of industry research analysts in making investment decisions. Adjusted net income should not be considered in isolation or as a substitute for net income, income from operations, cash provided by operating activities or other income, profitability, cash flow, or liquidity measures prepared under GAAP. Since adjusted net income excludes some, but not all items that affect net income and may vary among companies, the adjusted net income amounts presented may not be comparable to similarly titled measures of other companies. Net income for the three months ended March 31 and June 30, 2008 respectively, is presented on a pro forma basis as fully described in Part I, Item 1A to the respective Form 10-Q’s. Pro forma net income includes adjustments to reduce net income for the effect of stock compensation, interest expense, and income taxes for the period prior to our IPO. (1) Estimated effective tax rate of 39.3 percent for 2010, 38.1 percent for 2009 and 39.3 percent for 2008. 2008 2009 2010 Q2 Q3 Q4 Q1 Q2 Q3 Q4 Q1 Q2 Pro Forma Net Income $ 32,446 $ 49,719 $ 22,690 $ 24,681 $ 14,436 $ 9,520 $ 6,705 $ 11,846 $ 3,602 Adjustments Insurance Reimbursments 32 1 19 14 2 (5) (1) - - Unrealized derivative (gain) loss 1,499 209 2,609 (369) (846) 405 (631) (89) (28) Cost associated with abnormal production - - - 1,195 5,179 5,784 9,366 470 - Write-off mobilization costs associated with the delay of the HB Mine - - - - 586 - - - - Other - - - - - - 440 269 271 Calculated tax effect (1) 577 (83) (1,033) (320) (1,875) (2,356) 3,495 (255) (96) Total Adjustments (890) 127 1,595 520 3,046 3,828 5,679 395 147 Adjusted Net Income $ 31,556 $ 49,846 $ 24,285 $ 25,201 $ 17,482 $ 13,384 $ 12,384 $ 12,241 $ 3,749 |
33 Selected Financial Data Adjusted Net Income (1,2) (In millions) EBITDA (1,2) (In millions, except gross margin percentage) Net Sales(2) (In millions) Earnings Per Share (2) (Diluted) This is a financial measurement not calculated based on U.S. Generally Accepted Accounting Principles (Non GAAP). Non-GAAP reconciliation available in the appendix to this presentation. Results for the three months ended March 31 and June 30, 2008 respectively, are presented on a pro forma basis as fully described in Part I, Item 1A to the respective Form 10-Q’s. $31.6 $49.8 $24.3 $25.2 $17.4 $13.3 $12.3 $11.8 $3.7 Q2 08 Q3 08 Q4 08 Q1 09 Q2 09 Q3 09 Q4 09 Q1 10 Q2 10 $99.5 $141.2 $77.3 $88.9 $73.4 $66.4 $73.1 $107.4 $64.3 Q2 08 Q3 08 Q4 08 Q1 09 Q2 09 Q3 09 Q4 09 Q1 10 Q2 10 $55.1 $83.7 $41.4 $43.6 $31.5 $20.8 $14.5 $26.6 $13.3 57% 62% 60% 49% 43% 31% 20% 25% 21% Q2 08 Q3 08 Q4 08 Q1 09 Q2 09 Q3 09 Q4 09 Q1 10 Q2 10 $0.43 $0.66 $0.30 $0.33 $0.19 $0.13 $0.09 $0.16 $0.05 Q2 08 Q3 08 Q4 08 Q1 09 Q2 09 Q3 09 Q4 09 Q1 10 Q2 10 |
34 Historical Quarterly Production and Sales Summary 2008 2009 2010 June 30, September 30, December 31, March 31, June 30, September 30, December 31, March 31, June 30, Production Volume (in thousands of short tons) Potash 210 200 201 137 131 112 124 172 165 Langbeinite 56 50 34 42 45 60 45 57 39 Sales Volume (in thousands of short tons) Potash 213 204 94 99 80 111 150 243 129 Trio ™ 47 50 17 38 45 40 25 70 63 |
35 Estimated Long-Life Reserves (1) Product / Operations Date Mine Opened Current Extraction Method Minimum Remaining Life (years) Current Annual Estimated Productive Capacity in Potash Product Tons Muriate of Potash Solar Moab 1965 Solution 126 130 Wendover 1932 Shallow Brine 30 100 HB Solution Mine(2) N/A Solution 28 - Conventional Carlsbad West 1931 Underground 130 430 Carlsbad East 1965 Underground 57 250 Total Muriate of Potash 910 Sulfate of Potash Magnesia (Langbeinite) Carlsbad East 1965 Underground 51 210 (1) The determination of estimated reserves has been prepared by Intrepid and is based on an independent review and analysis of our mine plans, geologic, financial and other data by Agapito Associates, Inc. See our Annual Report on Form 10-K for the fiscal year ended December 31, 2009 for more information. (2) The Carlsbad HB Solution Mine reserves are based on the planned flooding of 4,400 of the 21,600 acres of the old mine workings and recovery of potash from the residual pillars only with the brine extracted using submersible pumps. Debottlenecking capacity brings efficiencies and lowers per ton costs |
36 Intrepid Production Volume History & Outlook Tons (000’s) Intrepid’s Potash Potassium Production Volume Growth Estimated Productive Capacity at Full Operating Rates Historical 0 200 400 600 800 1,000 1,200 1,400 1,600 2000 2001 2002 2003 2004 2005 2006 2007 2008 2009 2010 2011 2012 2013 Potash Production Trio Production Current Estimated Potash Productive Capacity Current Estimated Trio Productive Capacity LRIP Production HB Production |
Sales of Potash & Trio™ in the United States 37 Intrepid Sells Potash & Trio™ into Multiple Markets & Multiple End Users |
Intrepid Average Net Realized Sales Price Advantage 38 |
39 Potash Salt Nitrogen Complementary Business Agrium Potash Phosphates Other The Only Western World Potash Pure-Play K+S Potash Potash Phosphates Nitrogen Potash Corp Mosaic Uralkali Potash Intrepid Comparables Revenue by Product - North America Comparables Revenue by Product - International ICL Potash Fertilizer & Phosphates Chemicals & Others Advanced Technologies Nitrogen Phosphates Retail Potash Source: Intrepid Potash®, company websites and publicly available 2009 company financial statements. Other 35% 32% 33% 4% 28% 28% 40% 24% 27% 49% 100% 3% 4% 14% 5% 67% 7% |
40 Why Potash Only? (1) Potash Corp. (2) Potash percentage represents 2007, nitrogen and phosphate percentages represent 2005 figures from Integer Research Ltd. (3) Estimated by Intrepid Potash based on publicly available historic production data. Operating capacity rates for nitrogen and phosphate expressed as percentage of nameplate capacity. Productive capacity for potash estimated based on publicly available historic production data. (4) Does not include infrastructure outside the plant gates (e.g. rail, road networks, utility systems). (5) Includes all types of phosphate fertilizer production. Market Structure for Key Fertilizer Nutrients Potash Nitrogen Phosphate (5) Producing Countries 12 ~60 ~40 Key Inputs Potash ore Natural gas Phosphate rock Sulfuric acid Ammonia % of Overall Fertilizer Market (1) 17% 59% 24% Market Share of Top 5 Producers(2) 64% 13% Ammonia 39% Urea 41% Phosphoric Acid 49% Phosphate Rock % of Production Government Controlled(1) 19% 51% 50% Industry Nameplate Operating Rate (2) 85% Potash (93% Productive Capacity)(3) 86% Ammonia 89% Urea 81% Phosphoric Acid 82% Phosphate Rock Time for Greenfield Minimum 7 years 3 years 3 – 4 years Logistics for Greenfield Most Difficult Least Difficult More Difficult Estimated Cost for Greenfield (1,4) $2.6Bn for 2.0MM Tons $1.4Bn for 1.0MM Tons $1.5Bn for 1.0MM Tons |
41 Depleted Conventional Mines Mines Currently With Less than 15 Years Reserve Life Theodore, Amelie, Marie Louis mines in France Pasquasi and San Cataldo mines in Italy Salzdetfurth, Friedrichshall, Bergmannssegen-Hugo, Siegfried-Giesen, and Niedersachen-Riedel German mines Trona, California Several West German / East German mines Horizon-Amax, Wills-Weaver, Saunders in Carlsbad Potash operations at Mosaic’s Hersey facility will be discontinued in 2012 Boulby, England Soligorsk I, Belarussia Taquari, Brazil Source: Fertecon, Intrepid Potash®, and public filings Global Industry Susceptible to Production Interruptions & Supply “Shocks” Mine Closures Due to Water Inflows PCA (Patience Lake) (0.8MM tons KCL / yr) Potacan mine (0.8MM tons KCL / yr) Mines with Water Inflows K2 Mine Esterhazy Penobsquis Mine, Sussex St. Paul mine(Congo) (0.8MM tons KCL / yr) 1980 1984 1988 1996 2000 2010 2004 1992 1976 Berezniki I (1.3MM tons KCL / yr) Berezniki 3 mine (1.8MM tons KCL / yr) Mine Closures Due to Depletion Due to geology, in the 70 plus years of potash mining in the Carlsbad area, there has never been a mine lost to flooding or a water incursion |
42 Carlsbad Potash Area |
43 Potash Production and North American Inventory Levels N. American Inventory (000s Tons KCL Equivalent) Source: IPNI, Fertecon, Intrepid Potash®. Potash Production (000s Tons KCL Equivalent) Global Production North American Production 5,000 15,000 25,000 35,000 45,000 55,000 65,000 75,000 500 1,000 1,500 2,000 2,500 3,000 3,500 4,000 4,500 5,000 1995 1996 1997 1998 1999 2000 2001 2002 2003 2004 2005 2006 2007 2008 2009 2010 |
44 Demand Growth from Brazil, India & China Reaching Recommended Application Levels China Brazil India Source: IPNI, Potash Corp. (MM Tons KCL) Goal to attain self-sufficiency of food supply History of under-application of potash Need to increase yields Increasing land use for agricultural purposes ~15MM ~7MM ~5MM 0 5 10 15 20 25 30 35 Current Potential 0 2 4 6 8 10 12 Current Potential 0 2 4 6 8 10 12 Current Potential |
45 Fertilizer Use Below Recommended Rates Source: Morgan Stanley, Agricultural Products Research, September 4, 2008. 146% Shortfall 86% Shortfall 288% Shortfall Global Application Rates (lb/acre) 60 112 24 59 17 66 0 20 40 60 80 100 120 Nitrogen Phosphate Potash Current Application Rate Scientifically Recommended Rate |
46 Yield Response at Varying Soil Test Levels Average Yield Response to Potash Fertilization - No data for medium alfalfa yields. Response shown is an average of low and high yield responses. - Avg. relative yield assumes all other factors are non-limiting, yields approach 100% after fertilization, application rates are optimum, and crop response reflects a similar response estimated from many sites and years . Assumes 165 bu/acre yield for corn . Source: IPNI. Average Yield Response to Potash Yield (Bu/Acre) Yields improve as nutrients become available High 2009 yields will remove nutrients from the soil Estimated that 38% of fields are in the low or medium categories 0 20 40 60 80 100 120 140 160 180 0% 5% 10% 15% 20% 25% 30% 35% 40% Very High High Medium Very Low/Low Soil Test Level Corn/Soybeans Alfalfa Corn Yield (Bu/Acre) |
Return on Potash Investment for Corn & Soybeans 47 ROI assumes 165.0 bu/acre and $4.40/bu for corn, 44.0 bu/acre yield and $10.15 for soybeans, $376/ton KCL Input Costs for Corn ($/bu) Input Costs for Corn ($/acre) Return on Potash Investment Source: USDA, IPNI, & Intrepid Potash®. Corn Soybeans Input costs for corn use USDA estimate of 165.0 bu/acre for corn. 2010 Revenue $ 4.98 Gross Margin $ 1.45 % of Total Costs Input Costs Potash $ 0.09 3% Total Fertilizer $ 0.77 22% Other Variable $ 1.08 31% Non-Land $ 0.88 25% Land $ 0.80 23% Total $ 3.53 2010 Revenue $ 775.88 Gross Margin $ 225.90 % of Total Costs Input Costs Potash $ 14.18 3% Total Fertilizer $ 119.72 22% Other Variable $ 168.53 31% Non-Land $ 137.15 25% Land $ 124.58 23% Total $ 549.98 Soil Test Level Application Rate Value of Cost of Return from ROI % of U.S. Fields (ppm) Classification Yield Response to K (lbs/acre K20) Response Potash Potash $/$ 15% 0-80 Very Low/Low 35% 123.20 163.55 $ 37.97 $ 125.58 $ 4.31 $ 23% 81-130 Medium 13% 61.60 60.75 $ 18.98 $ 41.76 $ 3.20 $ 15% 131-160 High 2% 30.80 9.35 $ 9.49 $ (0.15) $ 0.98 $ 47% 161+ Very High 0% 0.00 - - - - Soil Test Level Application Rate Value of Cost of Return from ROI % of U.S. Fields (ppm) Classification Yield Response to K (lbs/acre K20) Response Potash Potash $/$ 15% 0-80 Very Low/Low 35% 124.32 171.72 $ 38.32 $ 133.40 $ 4.48 $ 23% 81-130 Medium 13% 62.16 63.78 $ 19.16 $ 44.62 $ 3.33 $ 15% 131-160 High 2% 31.08 9.81 $ 9.58 $ 0.23 $ 1.02 $ 47% 161+ Very High 0% 0.00 - - - - |
Intrepid Potash Management Structure 48 |