Exhibit 99.1
Investor Presentation February 2012 Supplying a Growing America™ |
Certain statements in this presentation, and other written or oral statements made by or on behalf of us, are “forward-looking statements” within the meaning of the federal securities laws. Statements regarding future events and developments and our future performance, as well as management’s expectations, beliefs, plans, estimates or projections relating to the future, including statements regarding our financial outlook, are forward-looking statements within the meaning of these laws. Although we believe that the expectations reflected in such forward-looking statements are based upon reasonable assumptions, there can be no assurance that the expectations will be realized. These forward-looking statements are subject to a number of known and unknown risks and uncertainties, many of which are beyond our control that could cause actual results to differ materially and adversely from such statements. These risks and uncertainties are detailed in our periodic filings with the U.S. Securities and Exchange Commission. Please refer to those filings for more information on these risk factors and uncertainties. All forward-looking statements are qualified in their entirety by such risk factors and uncertainties. Statements regarding our financial outlook speak only as of the date of our fourth quarter and full year 2011 earnings release (February 15, 2012), and all other forward-looking statements speak only as of the initial release date of this presentation (February 29, 2012). Subsequent events and developments may cause our forward-looking statements to change, and we will not undertake efforts to update or revise publicly any forward-looking statements to reflect new information or future events or circumstances after this date. Unless the context otherwise requires, when we use ‘‘Intrepid,’’ ‘‘our,’’ ‘‘we’’ or ‘‘us’’ during this presentation, we are referring to Intrepid Potash, Inc. and its consolidated subsidiaries. Cautionary Statements Regarding Forward-Looking Information 2 |
Intrepid Potash Strategically Located, Potash-Only Company Intense margin focus: Strategic marketing and production flexibility Commitment to reinvest in the business Capital investment is focused on production growth of incrementally lower per ton cash costs 3 Florida New Mexico Texas Oklahoma Kansas Nebraska South Dakota Montana Wyoming Colorado Utah Idaho Arizona Nevada Washington California Oregon Kentucky Maine New York Pennsylvania Michigan Vermont New Hampshire Virginia West Virginia Ohio Indiana Illinois North Carolina Tennessee South Carolina Alabama Mississippi Arkansas Louisiana Missouri Iowa Minnesota Wisconsin Georgia North Dakota Carlsbad Reserve Development Assets ® HB Solar Solution Mine Developmental Asset Operating Solar Evaporation Solution Mine Operating Conventional Mine |
Company Overview 4 The largest U.S. producer of potash Only western world producer created and dedicated solely to potassium- related products Supplies ~1.5 percent of global demand and ~9.4 percent of U.S. demand 1 of 2 global producers of sulfate of potash magnesia, marketed as Trio® 5 active production facilities Balance sheet strength provides ability to execute on robust capital investment program |
The solid crop economic environment and the overall fundamentals indicate that it is not a question of if farmers will buy, rather how much and when Retailers are risk adverse and are taking a guarded stance waiting for farmers to show interest in spring application Improvement in the outlook in Texas and Oklahoma markets given recent moisture in the area Trio® market remains under-supplied with a constructive pricing environment in all of our markets 5 Current Potash Market |
2011/12 2012/13 Farm Price $6.20 $5.00 Gross Margin $2.08 $1.31 Input Costs Potash $0.20 $0.18 Nitrogen $0.55 $0.44 Phosphate $0.16 $0.11 Other Fertilizer $0.03 $0.03 Other Variable $1.30 $1.20 Non-Land $0.96 $0.89 Land $0.92 $0.85 Total $4.12 $3.69 Current Crop Economics Offer Historically Strong Returns for Farmers 6 - Non-land fixed costs include: labor, opportunity cost of unpaid labor, taxes, insurance, general overhead, and machine and equipment expenses. - Other variable costs include: seed, chemicals, fuel, lube, electricity, repairs, water, interest, custom operations, and drying. - Land costs are shown as the rental rate of land (opportunity cost). - Corn Farm Price is USDA WASDE and baseline estimate as of 2/27/12 - Potash consumption in shown in fertilizer years (2009/2010 included under 2009). Sources: USDA, Fertecon, Green Markets, Intrepid Potash®. Corn Farm Price Potash (5%) Land (23%) Non-Land Fixed Costs (26%) Other Variable Costs (32%) Phosphate (4%) Per Bushel Return Historical Corn Input Costs and Price US Potash Fertilizer Consumption $ per bushel Potash Consumption (KCL tons ‘000) Nitrogen (9%) Bottom line: fertilizer is a small part of a famer’s cost Percentage of fertilizer cost is near historical lows 0 1,000 2,000 3,000 4,000 5,000 6,000 7,000 8,000 9,000 10,000 - 1.00 2.00 3.00 4.00 5.00 6.00 7.00 1996/97 1998/99 2000/01 2002/03 2004/05 2006/07 2008/09 2010/11E 2012/13F |
Potash Deliveries Track Population Growth and Global Demand is Growing 7 Long-term correlation of potash deliveries to historical global population growth Population growth continues Utilizing the 1.1% growth rate in world population of 7 billion people: Each year there are approximately 77 million more people in the world, the equivalent of nine more cities the size of New York City This would require an annual addition of 40 million acres of arable land (1.3x the farmland in Iowa)(2) A world yield increase of 1.1% per year to maintain current rates of arable land Sources: Fertecon, US Census Bureau. (1) Fertecon (2) State Data Center of Iowa; 2007 estimate. Collapse of Soviet Union Historical Global Population or Potash Deliveries 5-Year Forward Compound Annual Growth Rates (2012 – 2016) Brazil 1.7% China 1.3% India 11.7% (1) |
Fundamentals of Increasing Population Continue to Drive Grain and Ultimately Potash Demand Over the Long-term 8 Note: Grains include corn, wheat, barley, oats and sorghum. Stocks to use ratio is average inventory / consumption for that year; data updated monthly. Sources: United Nations Food and Agriculture Organization (FAO), US Census Bureau, USDA, Potash & Phosphate Institute (PPI,) International Fertilizer Industry Association (IFA), Fertecon. (1) Futures prices based on closing price of Chicago Board of Trade futures contracts as of 02/24/12; futures prices for December delivery in forecast years. Hectares of Arable Land per Person Hectares per person Crop Prices Over Time(1) World Grain Production and Stocks-to-Use Ratios Grain Production Stocks-to-Use Ratio 5 Year Average Dec. 2012 Futures Soybeans: $10.85 $12.71 Wheat: $6.23 $6.88 Corn: $4.75 $5.58 2011 E Grain Production (Millions of Tons) Stocks-to-Use Ratio Trend line 10% 20% 30% 40% 50% 600 800 1,000 1,200 1,400 1,600 1,800 2,000 1980 1982 1984 1986 1988 1990 1992 1994 1996 1998 2000 2002 2004 2006 2008 2010 |
Strategically Located Assets 9 Average Potash Consumption in Intrepid’s Markets is Greater than 5x of Intrepid’s Average Production Low High Sources: Association of American Plant Food Control Officials (AAPFCO), The Fertilizer Institute (TFI), Intrepid Potash. (1) AAPFCO, Fertecon, USDA. New Mexico Texas Oklahoma Kansas Colorado Mississippi Arkansas Louisiana Idaho Washington Oregon Nebraska Missouri Iowa Illinois California Wyoming Utah Arizona Nevada Minnesota |
2005 2006 2007 2008 2009 2010 2011 Intrepid average net realized sales price $162 $179 $194 $486 $541 $363 $472 Intrepid advantage vs. N.A. competitors $29 $43 $39 $88 $151 $61 $98 Intrepid’s Potash Price Advantage: Strategically Located and Lower Royalties 10 Sources: Green Markets and Fertecon Notes: (1) Average net realized sales price advantage is an operating performance measure calculated as the difference between our average net realized sales price and the combined average net realized sales prices of Potash Corporation of Saskatchewan Inc., The Mosaic Company, and Agrium Inc. ("Agrium") based on publicly available information. Average net realized sales price is an operating performance measure calculated as gross sales less freight costs, divided by the number of tons sold in the period. (2) Cash COGS, net of by-product credits, is an operating performance measure defined as total cost of goods sold including royalties, and excluding depreciation, depletion and amortization. (3) Intrepid Q4 2011 government payments were $18/ton, North American competitor average was $24 / ton Intrepid vs. North American Competitors Q4 2011 ($ per potash ton) Intrepid’s Potash Advantage Q4 2011 ($ per potash ton) Intrepid’s average net realized sales price advantage has been approximately 20 percent since 2005 Intrepid’s potash cash margin advantage has averaged $38 per ton over the last three years Intrepid’s four percent net sales royalty rate is significantly lower than royalty and resource tax burden of Intrepid’s principal competitors (2) (3) (1) (1) (2) (1) $97 ($75) $22 ($60) ($40) ($20) $0 $20 $40 $60 $80 Price Cash COGS Cash Margin Advantage |
Industrial market primarily consists of oil and gas drillers Ability to granulate ~80% of current production, providing flexibility to meet end market demand Diversified Markets and Customer Base with Increased Flexibility in Product Mix 11 Potash Sales for 2011 Industrial Agricultural Animal Feed Includes: Barley Corn Cotton Hay Nuts Rice Soybeans Vegetables Wheat Product Size FY 2008 FY 2009 FY 2010 FY 2011 Agricultural Granular 62% 69% 82% 79% Industrial Standard 30% 18% 11% 14% Animal Feed Standard 8% 13% 7% 7% |
Intrepid’s Capital Investment Strategy is Focused on Growth, Flexibility & Margin Flexibility via Additional Granulation Capacity Moab Compactor Wendover Compactor Langbeinite Granulation Plant North Compaction Upgrade 12 Growth in Mining Capacity HB Solar Solution Mine Additional Mine Panels Expansion of Moab Horizontal Potash Caverns Recovery Improvement Investments Langbeinite Dense Media Separation Plant Moab Brine Heater |
Major 2012 Capital Investments HB Solar Solution Mine North Compaction Execution on Capital is Foundational to Intrepid’s Growth 13 Since Inception Intrepid has Invested Nearly Half a Billion Dollars into its Mines and Facilities Major Capital Projects Milestones Facility Year Completed Horizontal Potash Caverns Moab, UT 2001 Langbeinite Plant (Original Plant) Carlsbad, NM - East 2005 Wash Thickener Upgrade Carlsbad, NM - East 2009 Coarse Tails Recovery Circuit Carlsbad, NM - West 2009 Underground Stacker / Reclaim Carlsbad, NM - West 2010 New Compaction Circuit Moab, UT 2010 New Brine Heater Moab, UT 2010 Wendover Compaction Circuit / Warehouse Wendover, UT 2011/2012E Langbeinite Recovery Improvement Project / Granulation Plant Carlsbad, NM - East 2011/2012E |
Our 2012 Capital Investment Budget of $225 - $300 million Represents the Highest Level of Capital Investment in Our History Capital Projects are Focused on Growth, Flexibility & Margin 14 Growth Flexibility Margin Incrementally lower cost tons HB represents a 25 percent increase in potash production volumes Project Benefits Capability to respond to changing market and customer demands Produce products with best margin profile Increased recoveries from Langbeinite ore Lower per ton operating costs Modernization of plant assets Focus on cash cost component of production Langbeinite Granulation North Compaction Wendover Compaction HB Solar Solution Mine Langbeinite Recovery Improvement Project Major Capital Projects |
Intrepid is focused on upgrading the capacity of its granulation capability throughout its operations Increased granulation efficiency and capacity provide flexibility of production between granular and standard and allows Intrepid to right size production to meet specific market demands This flexibility allows Intrepid to seek the highest returns on its products and improve profitability 15 Additional Granulation Capacity is Key to Marketing and Production Flexibility Granulation Projects Facility Product Anticipated Granulation Capacity Estimated In-Service Date Moab, Utah Potash 100 percent of annual production In Service Wendover, Utah Potash 100 percent of annual production In Service Carlsbad, New Mexico East Facility Trio® 100 percent of annual standard Trio® production Mid 2012 Carlsbad, New Mexico North Facility Potash 100 percent of annual production from West Mine and anticipated HB Solar Solution Mine production First Half 2013 |
Langbeinite Recovery Improvement Project – Focused on Capturing Growth & Margin Dense Media Separation component of project currently undergoing commissioning Anticipate project being fully operational during the first half of 2012 Expected to increase Trio® recoveries to approximately 50 percent Grow production by 100,000 – 120,000 additional tons per year representing a ~75% increase in Trio® production Expected to reduce cash production cost per ton Capacity to granulate 100 percent of standard Trio® production, effectively tripling our granular capacity Total project investment of approximately $85mm - $90mm Excellent IRR of ~25 percent 16 Project Benefits & Opportunities Project Economics |
HB Solar Solution Mine expected to be among the lower-cost potash mines in North America 5 million tons of proven and probable reserves Capital investment of $200-$230 million Production cost per ton estimated to be $60 to $80 per ton Estimated annual production – 150,000-200,000 tons with higher volumes in earlier years On track to receive Record of Decision from the BLM during Q1 2012 Total area available to be flooded: 1.3x size of Manhattan Acreage considered in the EIS represents only a fraction of the total HB acreage 17 HB Solar Solution Mine – Production Growth through Incrementally Low-Cost Tons Potash Pillar HB Solar Solution Mine Injection Area |
18 Final Thoughts The Only Western World Potash Pure-Play Macro Fundamentals Driving Real Demand Strategically Located Assets Serving Diversified Markets and Customer Base Growth, Flexibility and Margin- Focused Decision Making Executing on Capital Investment Program Targeting Growth Opportunities with Incrementally Lower Cash Cost Tons |
Appendix ® |
20 Solid Financial Performance Adjusted EBITDA(1) (In millions) Balance Sheet as of December 31, 2011 (1) This is a financial measurement not calculated based on U.S. Generally Accepted Accounting Principles (Non GAAP). Non-GAAP reconciliation available in the appendix to this presentation. Net Income (In millions) Earnings Per Share (Diluted) Cash and Investments $177 million Total Assets $933 million Debt Outstanding $ - Stockholders’ Equity $871 million Availability Under the Credit Line $250 million |
21 Financial Outlook as of February 15, 2012 * Due to commissioning of the LRIP costs for Trio® are expected to be above normal during the first quarter of 2012. Three Months Ended Year Ended March 31, 2012 December 31, 2012 Potash Production (tons) 190,000 - 210,000 790,000 - 830,000 Sales (tons) 190,000 - 220,000 850,000 - 900,000 Cash COGS, net of by - product credit ($/ton) $190 - $205 $175 - $195 Total COGS ($/ton) $250 - $265 $235 - $255 Trio ® Production (tons) 25,000 - 35,000 220,000 - 260,000 Sales (tons) 20,000 - 30,000 220,000 - 260,000 Cash COGS ($/ton)* $230 - $245 $120 - $140 Total COGS ($/ton)* $300 - $315 $160 - $180 Other Selling and Administrative $8 - $10 million $33 - $35 million Annual Estimated Capital Expenditure $225 - $300 million |
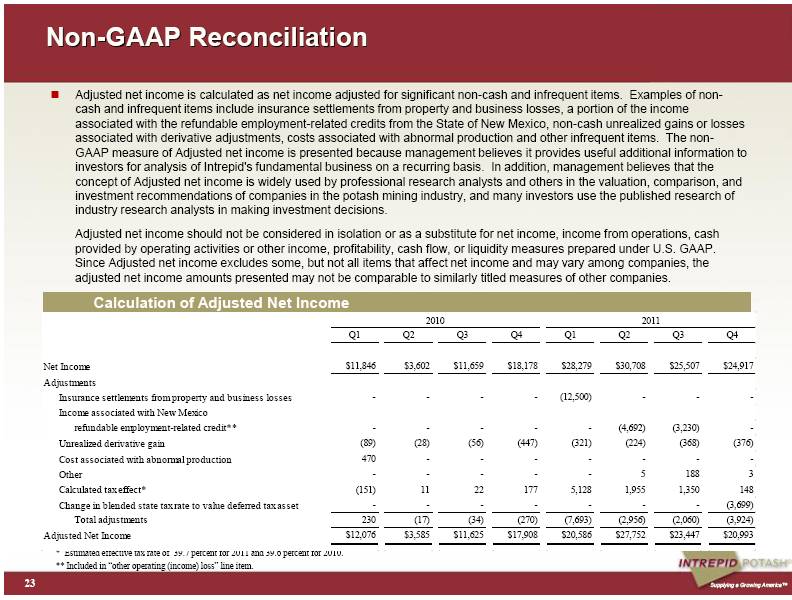
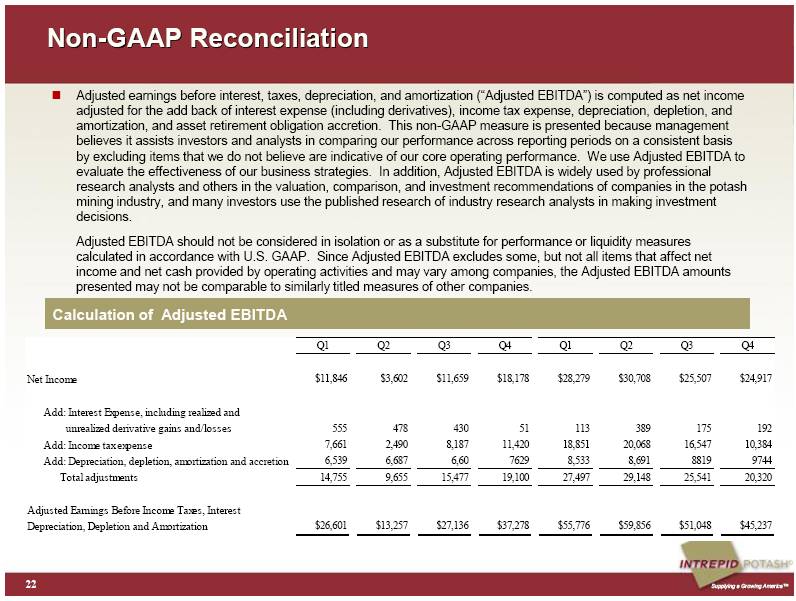
Calculation of Adjusted EBITDA 22 Non-GAAP Reconciliation Adjusted earnings before interest, taxes, depreciation, and amortization (“Adjusted EBITDA”) is computed as net income adjusted for the add back of interest expense (including derivatives), income tax expense, depreciation, depletion, and amortization, and asset retirement obligation accretion. This non-GAAP measure is presented because management believes it assists investors and analysts in comparing our performance across reporting periods on a consistent basis by excluding items that we do not believe are indicative of our core operating performance. We use Adjusted EBITDA to evaluate the effectiveness of our business strategies. In addition, Adjusted EBITDA is widely used by professional research analysts and others in the valuation, comparison, and investment recommendations of companies in the potash mining industry, and many investors use the published research of industry research analysts in making investment decisions. Adjusted EBITDA should not be considered in isolation or as a substitute for performance or liquidity measures calculated in accordance with U.S. GAAP. Since Adjusted EBITDA excludes some, but not all items that affect net income and net cash provided by operating activities and may vary among companies, the Adjusted EBITDA amounts presented may not be comparable to similarly titled measures of other companies. Q1 Q2 Q3 Q4 Q1 Q2 Q3 Q4 $11,846 $3,602 $11,659 $18,178 $28,279 $30,708 $25,507 $24,917 7,661 2,490 8,187 11,420 18,851 20,068 16,547 10,384 6,539 6,687 6,60 7629 8,533 8,691 8819 9744 Total adjustments 14,755 9,655 15,477 19,100 27,497 29,148 25,541 20,320 $26,601 $13,257 $27,136 $37,278 $55,776 $59,856 $51,048 $45,237 Depreciation, Depletion and Amortization 113 555 478 430 Add: Depreciation, depletion, amortization and accretion Adjusted Earnings Before Income Taxes, Interest 175 Net Income Add: Income tax expense Add: Interest Expense, including realized and unrealized derivative gains and/losses 192 51 389 |
Calculation of Adjusted Net Income 23 Non-GAAP Reconciliation Adjusted net income is calculated as net income adjusted for significant non-cash and infrequent items. Examples of non-cash and infrequent items include insurance settlements from property and business losses, a portion of the income associated with the refundable employment-related credits from the State of New Mexico, non-cash unrealized gains or losses associated with derivative adjustments, costs associated with abnormal production and other infrequent items. The non-GAAP measure of Adjusted net income is presented because management believes it provides useful additional information to investors for analysis of Intrepid's fundamental business on a recurring basis. In addition, management believes that the concept of Adjusted net income is widely used by professional research analysts and others in the valuation, comparison, and investment recommendations of companies in the potash mining industry, and many investors use the published research of industry research analysts in making investment decisions. Adjusted net income should not be considered in isolation or as a substitute for net income, income from operations, cash provided by operating activities or other income, profitability, cash flow, or liquidity measures prepared under U.S. GAAP. Since Adjusted net income excludes some, but not all items that affect net income and may vary among companies, the adjusted net income amounts presented may not be comparable to similarly titled measures of other companies. * Estimated effective tax rate of 39.7 percent for 2011 and 39.6 percent for 2010. ** Included in “other operating (income) loss” line item. Q1 Q2 Q3 Q4 Q1 Q2 Q3 Q4 $11,846 $3,602 $11,659 $18,178 $28,279 $30,708 $25,507 $24,917 - - - - (12,500) - - - refundable employment-related credit** - - - - - (4,692) (3,230) - (89) (28) (56) (447) (321) (224) (368) (376) 470 - - - - - - - - - - - - 5 188 3 (151) 11 22 177 5,128 1,955 1,350 148 - - - - - - - (3,699) Total adjustments 230 (17) (34) (270) (7,693) (2,956) (2,060) (3,924) $12,076 $3,585 $11,625 $17,908 $20,586 $27,752 $23,447 $20,993 2011 Calculated tax effect* Adjusted Net Income Unrealized derivative gain 2010 Net Income Adjustments Insurance settlements from property and business losses Income associated with New Mexico Change in blended state tax rate to value deferred tax asset Cost associated with abnormal production Other |
24 Historical Quarterly Production and Sales Summary March 31, June 30, September 30, December 31, March 31, June 30, September 30, December 31, March 31, June 30, September 30, December 31, Potash 137 131 112 124 172 165 166 224 234 209 173 197 Trio® 42 45 60 45 57 39 32 31 31 44 35 31 Potash 99 80 111 150 243 129 221 216 196 225 190 183 Trio® 38 45 40 25 70 63 45 27 52 39 39 28 2009 2010 2011 Production Volume (In thousands of short tons) Sales Volume (In thousands of short tons) |
25 Intrepid Production Volume History & Outlook Tons (000’s) Intrepid’s Potassium Production Volume Growth Estimated Productive Capacity at Full Operating Rates(1) Historical ® ® Productive capacity is affected by operating rates, recoveries, mining rates and the amount of development work that Intrepid performs and, therefore, actual production rates for mining companies tend to be lower than estimated total productive capacity. 0 200 400 600 800 1,000 1,200 1,400 1,600 2000 2001 2002 2003 2004 2005 2006 2007 2008 2009 2010 2011 2012 2013 2014 2015 Potash Production Trio Production Current Estimated Potash Productive Capacity Current Estimated Trio Productive Capacity LRIP Production HB Production |
26 Why Potash Only? (1) Potash Corp. (2) Potash percentage represents 2007, nitrogen and phosphate percentages represent 2005 figures from Integer Research Ltd. (3) Estimated by Intrepid Potash based on publicly available historic production data. Operating capacity rates for nitrogen and phosphate expressed as percentage of nameplate capacity. Productive capacity for potash estimated based on publicly available historic production data. (4) Includes infrastructure outside the plant gates (e.g. rail, road networks, utility systems). (5) Includes all types of phosphate fertilizer production. Market Structure for Key Fertilizer Nutrients Potash Nitrogen Phosphate (5) Producing Countries 12 ~60 ~40 Key Inputs Potash ore Natural gas Phosphate rock Sulfuric acid Ammonia % of Overall Fertilizer Market (1) 17% 59% 24% Market Share of Top 5 Producers(2) 64% 13% Ammonia 39% Urea 41% Phosphoric Acid 49% Phosphate Rock % of Production Government Controlled(1) 19% 51% 50% Industry Nameplate Operating Rate (2) 85% Potash (93% Productive Capacity)(3) 86% Ammonia 89% Urea 81% Phosphoric Acid 82% Phosphate Rock Time for Greenfield Minimum 7 years 3 years 3 – 4 years Logistics for Greenfield Most Difficult Least Difficult More Difficult Estimated Cost for Greenfield (1,4) $6.5 Bn for 2.2MM Tons $1.4Bn for 1.0MM Tons $1.5Bn for 1.0MM Tons |
27 Depleted Conventional Mines Mines Currently With Less than 15 Years Reserve Life Theodore, Amelie, Marie Louis mines- France Pasquasi and San Cataldo mines - Italy Salzdetfurth, Friedrichshall, Bergmannssegen-Hugo, Siegfried-Giesen, and Niedersachen-Riedel - Germany Trona, California Horizon-Amax, Wills-Weaver, Saunders – Carlsbad, NM Hersey, United States - Mosaic Boulby, England – ICL Soligorsk I, Belarussia - Belaruskali Taquari, Brazil – Vale sources: Fertecon, Intrepid Potash®, and public filings Global Industry Susceptible to Production Interruptions & Supply “Shocks” Mine Closures Due to Water Inflows PCA (Patience Lake) (0.8MM tons KCL / yr) Potacan mine (0.8MM tons KCL / yr) Mines with Water Inflows K2 Mine Esterhazy Penobsquis Mine, Sussex Belaruskali Mine #2 St. Paul mine(Congo) (0.8MM tons KCL / yr) 1980 1984 1988 1996 2000 2011 2004 1992 1976 Berezniki I (1.3MM tons KCL / yr) Berezniki 3 mine (1.8MM tons KCL / yr) Mine Closures Due to Depletion Due to geology, in the 70 plus years of potash mining in the Carlsbad area, there has never been a mine lost to flooding or a water incursion |
United States Potash Consumption 28 Sources : Fertecon, United States Department of Agriculture (USDA). Potash consumption is shown in fertilizer years (July – June). Grains stocks include: Barley, Corn, Oats, Sorghum, Wheat Potash fertilizer consumption has remained relatively constant with an annual volatility of approximately 9.7 percent over the past 27 years Corn acres planted in the U.S. in the years 2007 through 2011 were 93.5, 86.0, 86.4, 88.2 and 91.9 million acres. 2012 planted acreage is forecast at 94.0 MM acres. 1982: Recession leads to lower consumption; Payment In Kind program reduces planted acres 1991-1997: Low grain stocks lead to increased consumption 1998: Russian financial crisis impacts world markets 2001- mid 2008: Global economic expansion leads to increased demand (2006 delayed Chinese negotiations) 2010: Strong Recovery in US Agricultural Markets 0% 10% 20% 30% 40% 50% 60% 70% 80% 90% 100% - 2,000 4,000 6,000 8,000 10,000 12,000 Grains Stocks - to - Use Ratio KCL Tons ('000) FERTECON U.S. Potash Consumption and Grains Stocks - to - Use Ratio KCL Tons Average KCl Consumption Stocks-to-Use Ratio |
29 Potash Production and North American Inventory Levels N. American Inventory (000s Tons KCL Equivalent) Sources: IPNI, Fertecon, Intrepid Potash®. Potash Production (000s Tons KCL Equivalent) Global Production North American Production 5,000 15,000 25,000 35,000 45,000 55,000 65,000 75,000 500 1,500 2,500 3,500 4,500 1995 1996 1997 1998 1999 2000 2001 2002 2003 2004 2005 2006 2007 2008 2009 2010 2011 500 1000 1500 2000 2500 3000 3500 4000 Potash Inventory (000s tons KCl equivalent) North American Potash Inventory Since Jan. '09 Actual Inventory Level 5 yr avg. Monthly Inventory |
30 To Reach Recommended Application Levels, Brazil, India and China Must Increase Demand China Brazil India sources: IPNI, Potash Corp. (MM Tons KCL) Goal to attain self-sufficiency of food supply History of under-application of potash Need to increase yields Increasing land use for agricultural purposes ~15MM ↑ ~7MM ↑ ~5MM ↑ 0 5 10 15 20 25 30 35 Current Potential 0 2 4 6 8 10 12 Current Potential 0 2 4 6 8 10 12 Current Potential |
Return on Potash Investment for Corn & Soybeans 31 ROI assumes 147.2 bu/acre and $5.28/bu for corn, 41.5 bu/acre yield and $12.41 for soybeans, $540/ton KCL (crop prices based on Dec. 2012 futures price minus $0.30 basis as of 2/24/12, KCL price based on Green Markets Midwest FOB warehouse as of 2/27/12) Input Costs for Corn ($/bu) Input Costs for Corn ($/acre) Return on Potash Investment Sources: USDA, IPNI, CME, & Intrepid Potash®. Corn Soybeans Input costs for corn use USDA estimate of 147.2 bu/acre for corn and estimated farm price of $6.20 /bu from February WASDE Report. 2011/12 Revenue $6.20 Gross Margin $2.08 Input Costs Potash $0.20 5% Total Fertilizer $0.94 23% Other Variable $1.30 32% Non-Land $0.96 23% Land $0.92 22% Total $4.12 % of Total Costs Soil Test Level Application Rate Value of Cost of Return from ROI % of U.S. Fields (ppm) Classification Yield Response to K (lbs/acre K20) Response Potash Potash $/$ 15% 0-80 Very Low/Low 35% 116.20 180.26 $ 51.43 $ 128.82 $ 3.50 $ 23% 81-130 Medium 13% 58.10 66.95 $ 25.72 $ 41.24 $ 2.60 $ 15% 131-160 High 2% 29.05 10.30 $ 12.86 $ (2.56) $ 0.80 $ 47% 161+ Very High - 0.00 - - - - 2011/12 Revenue 912.64 $ Gross Margin 306.68 $ Input Costs Potash 29.16 $ 5% Total Fertilizer 138.14 $ 23% Other Variable 191.47 $ 32% Non-Land 141.11 $ 23% Land 135.24 $ 22% Total 605.96 $ % of Total Costs |