Exhibit 99.1
| Investor Presentation February 2013 |
| Cautionary Statements Regarding Forward Looking Information 2 Certain statements in this presentation, and other written or oral statements made by or on behalf of us, are “forward-looking statements” within the meaning of the federal securities laws. Statements regarding future events and developments and our future performance, as well as management’s expectations, beliefs, plans, estimates or projections relating to the future, including statements regarding our financial outlook, are forward-looking statements within the meaning of these laws. Although we believe that the expectations reflected in such forward-looking statements are based upon reasonable assumptions, there can be no assurance that the expectations will be realized. These forward-looking statements are subject to a number of known and unknown risks and uncertainties, many of which are beyond our control, that could cause actual results to differ materially and adversely from such statements. These risks and uncertainties are detailed in our periodic filings with the U.S. Securities and Exchange Commission. Please refer to those filings for more information on these risk factors and uncertainties. All forward-looking statements are qualified in their entirety by such risk factors and uncertainties. Statements regarding our financial outlook speak only as of the date of our fourth quarter 2012 earnings release (February 13, 2013), and all other forward-looking statements speak only as of the initial release date of this presentation (February 25, 2013). Subsequent events and developments may cause our forward-looking statements to change, and we will not undertake efforts to update or revise publicly any forward-looking statements to reflect new information or future events or circumstances after this date. Unless the context otherwise requires, when we use ‘‘Intrepid,’’ ‘‘our,’’ ‘‘we’’ or ‘‘us’’ during this presentation, we are referring to Intrepid Potash, Inc. and its consolidated subsidiaries. |
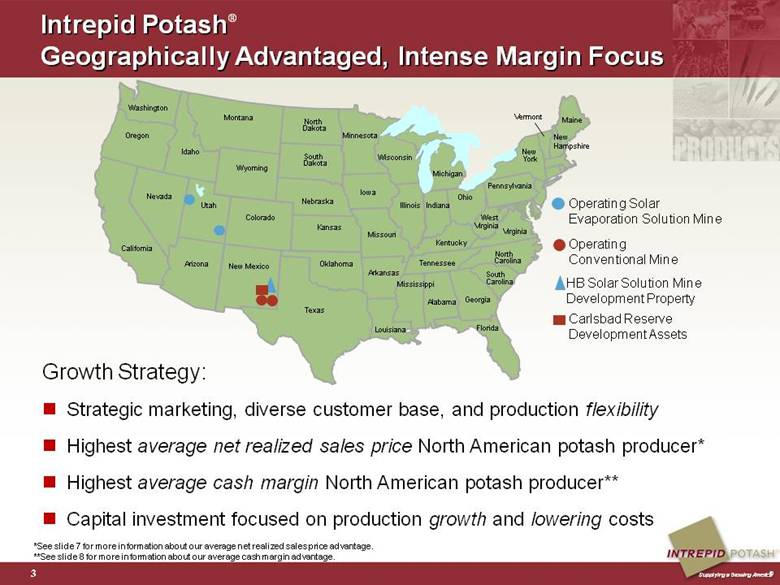
| Intrepid Potash Geographically Advantaged, Intense Margin Focus Growth Strategy: Strategic marketing, diverse customer base, and production flexibility Highest average net realized sales price North American potash producer* Highest average cash margin North American potash producer** Capital investment focused on production growth and lowering costs 3 ® Florida New Mexico Texas Oklahoma Kansas Nebraska South Dakota Montana Wyoming Colorado Utah Idaho Arizona Nevada Washington California Oregon Kentucky Maine New York Pennsylvania Michigan Vermont New Hampshire Virginia West Virginia Ohio Indiana Illinois North Carolina Tennessee South Carolina Alabama Mississippi Arkansas Louisiana Missouri Iowa Minnesota Wisconsin Georgia North Dakota Carlsbad Reserve Development Assets HB Solar Solution Mine Development Property Operating Solar Evaporation Solution Mine Operating Conventional Mine *See slide 7 for more information about our average net realized sales price advantage. **See slide 8 for more information about our average cash margin advantage. |
| Company Overview – Uniquely Positioned The largest U.S. producer of potash Only western-world producer created and dedicated solely to potassium- related products Supplies ~ 1.5% of global demand and ~ 9.2% of U.S. demand One of only two global producers of the specialty product, sulfate of potash magnesia, marketed as Trio® Five active production facilities – growing to six with the construction of the HB Solar Solution mine Balance sheet strength provides ability to execute on robust capital investment program and disciplined business development activity 4 |
| Farmers look to capitalize on favorable economics USDA forecasting highest farm income in past 40 years(1) Tight stocks-to-use ratio Strong commodity prices 97 million acre corn crop planting intentions estimate(2) Strong fall application...historically precedes strong spring Dealers’ strategy of minimizing risk continues Timing of spring fill is unpredictable Expect dealers to minimize inventory risk Industrial and animal feed demand is stable Demand remains strong for all sizes of Trio® product 5 Current Potash Market – Favorable Trends (1) Source: USDA, Feb. 11, 2013 (2) Source: CBO’s Agriculture Baseline Feb. 2013 |
| Geographically Advantaged Assets 6 Average Potash Consumption in Intrepid’s Markets is Greater than 5x of Intrepid’s Average Production Intrepid Conventional Mine Locations Low High Sources: Association of American Plant Food Control Officials (AAPFCO), The Fertilizer Institute (TFI), Fertecon, USDA, Intrepid Potash. New Mexico Texas Oklahoma Kansas Colorado Mississippi Arkansas Louisiana Idaho Washington Oregon Nebraska Missouri Iowa Illinois California Wyoming Utah Arizona Nevada Minnesota Intrepid Solution Mine Locations (including the HB Solar Solution Mine) |
| North American Price Leader 7 Notes: Average net realized sales price is an operating performance measure calculated as gross sales less freight costs, divided by the number of tons sold in the period. Average net realized sales price advantage is an operating performance measure calculated by us as the difference between our avg. net realized sales price and the combined estimated avg. net realized sales prices of Potash Corporation of Saskatchewan Inc.(PCS), The Mosaic Company (MOS), and Agrium Inc. (AGU) based on publicly available information. Intrepid’s average net realized sales price advantage for potash has averaged approximately 24 % since 2005 |
| North American Cash Margin Leader 8 (1) Cash Margin Advantage Notes: Average cash margin advantage is calculated as average per ton net realized sales price advantage plus cash COGS difference (calculated using the combined estimated average net realized sales prices and average estimated cash COGS of Potash Corporation of Saskatchewan Inc., The Mosaic Company, and Agrium Inc. based on publicly available quarterly information). Cash COGS, net of by-product credits, is an operating performance measure defined as total cost of goods sold including royalties, and excluding depreciation, depletion and amortization divided by the number of tons sold in the period. Average Cash Margin Advantage Intrepid’s average cash margin advantage for potash has averaged $41 per ton during the last 5 years |
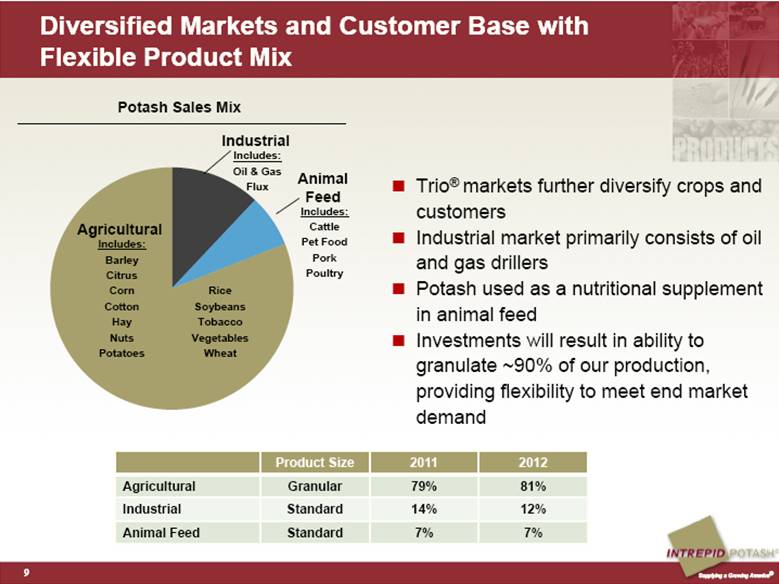
| Diversified Markets and Customer Base with Flexible Product Mix Trio® markets further diversify crops and customers Industrial market primarily consists of oil and gas drillers Potash used as a nutritional supplement in animal feed Investments will result in ability to granulate ~90% of our production, providing flexibility to meet end market demand 9 Potash Sales Mix Industrial Agricultural Animal Feed Product Size 2011 2012 Agricultural Granular 79% 81% Industrial Standard 14% 12% Animal Feed Standard 7% 7% |
| 10 We Have Successfully Increased Our Reserve Lives Ingredients for Growth – Extending Reserve Lives Extending reserves is a result of our lease acquisition and development strategy Expanding reserves at all of our existing sites Disciplined approach to core-hole drilling and reserve definition Minimum Remainng Life (in years) 2011 2012 Carlsbad West 157 165 Carlsbad East 58 61 HB Solar Solution Mine 28 28 Moab 123 134 Wendover 30 30 Carlsbad East Langbeinite 65 115 |
| Our 2012 Capital Investment of $253 Million Represents the Highest Level of Annual Capital Investment in Our History Capital Projects Are Focused on Growth, Flexibility & Margin 11 Growth Flexibility Margin HB will represent an estimated 20-25% increase in potash production volumes Incremental low cost tons through plant and mine expansion Project Benefits Capability to respond to changing market and customer demands Produce products with best margin profile for the market Increased recoveries from langbeinite ore Lower per ton operating costs Langbeinite dense media separation plant Modernization of plant assets Focus on cash cost component of production North compaction Wendover compaction Langbeinite granulation Moab compaction HB Solar Solution Mine Langbeinite Recovery Improvement Project Expansion and creation of new Moab horizontal potash caverns Major Capital Projects |
| Major 2013 Capital Investments HB Solar Solution Mine North Compaction Moab Cavern System Investing to Increase Production and Significantly Lower Costs 12 Intrepid has invested $750 million since inception underscoring our commitment to growth Major Capital Project Milestones Facility Year Completed / Estimated Completion HB Solar Solution Mine Carlsbad, NM – HB 2013E North Compaction Project Carlsbad, NM – North 2013E Horizontal Potash Cavern System Two Moab, UT 2012 Langbeinite Recovery Improvement Project / Granulation Plant Carlsbad, NM - East 2011/2012 Wendover Compaction Circuit / Warehouse Wendover, UT 2011/2012 New Warehouses Carlsbad, NM - East 2011 New Brine Heater Moab, UT 2010 New Compaction Circuit Moab, UT 2010 Underground Stacker / Reclaim Carlsbad, NM - West 2010 Coarse Tails Recovery Circuit Carlsbad, NM - West 2009 Wash Thickener Upgrade Carlsbad, NM - East 2009 Langbeinite Plant (Original Plant) Carlsbad, NM - East 2005 Horizontal Potash Cavern System One Moab, UT 2001 |
| Five million tons of proven and probable reserves Capital investment of $225-$245 million Cash production cost per ton estimated to be below $80 per ton, making HB one of the lowest cost potash mines in North America Estimated annual production potential of 150,000-200,000 tons Opportunity for further expansion of solution mining activities with existing newly acquired leaseholds 13 HB Solar Solution Mine – Driving Production Growth at Significantly Lower Cash Costs HB Solar Solution Mine Key Facts |
| 14 Construction commenced in March 2012, project currently on schedule Invested $128 million through Dec. 31, 2012 Well drilling - done Pipeline construction - done Pond construction – in process Mill construction – in process Leverages our solution mining and solar evaporation expertise Creative use of idled mine, non-potable water source and the sun’s energy Anticipated production timeline: First production to begin in late 2013 Ramp up of production expected in 2014 Production levels increasing into 2015 HB Solar Solution Mine – Driving Production Growth at Significantly Lower Cash Costs |
| Expand Moab Solar Solution Mining – Incremental Production at Low Cost Expand solution mining footprint Cavern 1 began producing in 2002, and was expanded in 2012 Cavern 2 constructed in 2012 and has begun to produce in 2013 Cavern 3 to be drilled in 2013 with the benefit expected in late 2014 Excellent team of geologists and drilling experts successfully using latest technologies Creating horizontal intersecting mining caverns Increasing reserve life Incremental production at lower costs 15 Expand Successful Operations Cavern 1 Cavern 2 Planned Cavern 3 |
| Increases capacity and improves quality Flexibility to place the highest margin product into market Capacity to handle all of the new production from HB Solar Solution mine and increased production from our West mine Total capital investment is expected to be approximately $95 to $100 million On budget, expected to come on-line in phases beginning in mid-2013 16 Additional Granulation Capacity Is Key to Marketing and Production Flexibility Focus on Increasing Granulation Capacity at all Facilities Facility Product Anticipated Granulation Capacity Estimated In-Service Date Moab, Utah Potash 100% of annual production In service Wendover, Utah Potash 100% of annual production In service Carlsbad, New Mexico North Facility Potash 100% of annual production from West Mine and anticipated HB Solar Solution Mine production Commenced construction in Q2 2012; estimated in service date for 1st compactor line is mid-2013 Carlsbad, New Mexico East Facility Trio® 100% of annual standard Trio® production Beginning to sell pellet production in 2013 Upgrade North Compaction Project |
| 17 Summary The Only Western World Potash Pure-Play The Highest Per Ton Average Net Realized Sales Price and Cash Margin of Any North American Potash Producer Geographically Advantaged Assets Serving Diversified Markets and Customer Base Decision Making Focused on Growth, Flexibility, and Margin Capital Investment Program Targeting Growth of Incremental Low Cost Tons from Our Growing Reserve Base |
| Appendix ® Supplying a Growing America® |
| Financial Outlook as of February 13, 2013 19 Three Months Ended Year Ended March 31, 2013 December 31, 2013 Potash Production (tons) 200,000 - 215,000 850,000 - 880,000 Sales (tons) 170,000 - 200,000 850,000 - 870,000 Cash COGS, net of by-product credit ($/ton) $185 - $195 $170 - $190 Total COGS ($/ton) $245 - $255 $240 - $260 Trio® Production (tons) 35,000 - 45,000 150,000 - 180,000 Sales (tons) 25,000 - 35,000 150,000 - 175,000 Cash COGS ($/ton) $175 - $190 $175 - $190 Total COGS ($/ton) $255 - $270 $240 - $280 Other Selling and Administrative $8 - $10 million $37 - $39 million Annual Estimated Capital Expenditure Not provided quarterly $235 -$285 million |
| Financial Overview 20 Adjusted EBITDA* (In millions) Balance Sheet as of December 31, 2012 * These are financial measurements not calculated based on U.S. Generally Accepted Accounting Principles (Non-GAAP). Non-GAAP reconciliations available in the appendix to this presentation. Adjusted Net Income* (In millions) Earnings Per Share (Diluted) Cash and Investments $ 58 million Current Assets $ 162 million Total Assets $ 995 million Debt Outstanding(1) $ - Total Liabilities $ 89 million Stockholders’ Equity $ 906 million Availability Under Unsecured Credit Facility $ 250 million (1) On August 28, 2012, Intrepid announced that it has agreed to issue $150 million aggregate principal amount of unsecured senior notes. The Notes are expected to be issued on April 16, 2013. |
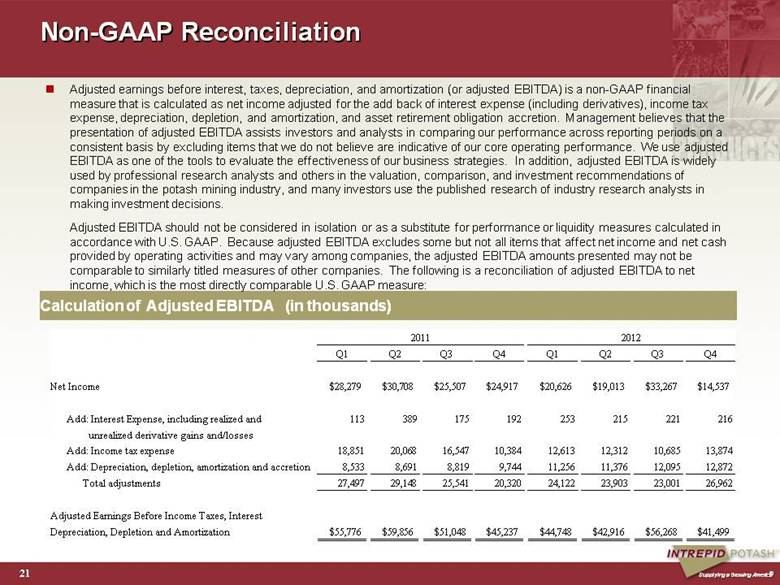
| Non-GAAP Reconciliation Calculation of Adjusted EBITDA (in thousands) 21 Adjusted earnings before interest, taxes, depreciation, and amortization (or adjusted EBITDA) is a non-GAAP financial measure that is calculated as net income adjusted for the add back of interest expense (including derivatives), income tax expense, depreciation, depletion, and amortization, and asset retirement obligation accretion. Management believes that the presentation of adjusted EBITDA assists investors and analysts in comparing our performance across reporting periods on a consistent basis by excluding items that we do not believe are indicative of our core operating performance. We use adjusted EBITDA as one of the tools to evaluate the effectiveness of our business strategies. In addition, adjusted EBITDA is widely used by professional research analysts and others in the valuation, comparison, and investment recommendations of companies in the potash mining industry, and many investors use the published research of industry research analysts in making investment decisions. Adjusted EBITDA should not be considered in isolation or as a substitute for performance or liquidity measures calculated in accordance with U.S. GAAP. Because adjusted EBITDA excludes some but not all items that affect net income and net cash provided by operating activities and may vary among companies, the adjusted EBITDA amounts presented may not be comparable to similarly titled measures of other companies. The following is a reconciliation of adjusted EBITDA to net income, which is the most directly comparable U.S. GAAP measure: Q1 Q2 Q3 Q4 Q1 Q2 Q3 Q4 Net Income $28,279 $30,708 $25,507 $24,917 $20,626 $19,013 $33,267 $14,537 Add: Interest Expense, including realized and 113 389 175 192 253 215 221 216 unrealized derivative gains and/losses Add: Income tax expense 18,851 20,068 16,547 10,384 12,613 12,312 10,685 13,874 Add: Depreciation, depletion, amortization and accretion 8,533 8,691 8,819 9,744 11,256 11,376 12,095 12,872 Total adjustments 27,497 29,148 25,541 20,320 24,122 23,903 23,001 26,962 Adjusted Earnings Before Income Taxes, Interest Depreciation, Depletion and Amortization $55,776 $59,856 $51,048 $45,237 $44,748 $42,916 $56,268 $41,499 2011 2012 |
| Non-GAAP Reconciliation Calculation of Adjusted Net Income (in thousands) 22 Adjusted net income is a non-GAAP financial measure that is calculated as net income adjusted for certain items that impact comparability of results from period to period including, among other items, insurance settlements from property and business losses, a portion of the income associated with the refundable employment-related credits from the State of New Mexico, non-cash unrealized gains or losses associated with derivative adjustments, and the effect of changes to our state income tax rates on the value of our net deferred tax asset. Management believes that the presentation of adjusted net income provides useful additional information to investors for analysis of Intrepid's fundamental business on a recurring basis. In addition, management believes that the concept of adjusted net income is widely used by professional research analysts and others in the valuation, comparison, and investment recommendations of companies in the potash mining industry, and many investors use the published research of industry research analysts in making investment decisions. Adjusted net income should not be considered in isolation or as a substitute for net income, income from operations, cash provided by operating activities or other income, profitability, cash flow, or liquidity measures prepared under U.S. GAAP. Because adjusted net income excludes some but not all items that affect net income and may vary among companies, the adjusted net income amounts presented may not be comparable to similarly titled measures of other companies. The following is a reconciliation of adjusted net income to net income, which is the most directly comparable U.S. GAAP measure: * Included in “other operating (income) loss” line item ** Estimated effective tax rate of 35.4 percent for 2012 and 39.7 percent for 2011. Q1 Q2 Q3 Q4 Q1 Q2 Q3 Q4 Net Income $28,279 $30,708 $25,507 $24,917 $20,626 $19,013 $33,267 $14,537 Adjustments Insurance settlements from property and business losses (12,500) - - - - - - - Income associated with New Mexico refundable employment-related credit* - (4,692) (3,230) - - - - - Unrealized derivative gain (321) (224) (368) (376) (224) (273) (272) (280) Other - 5 188 3 330 (3) 181 60 Calculated tax effect** 5,128 1,955 1,350 148 (40) 107 30 78 Change in blended state tax rate to value deferred tax asset - - - (3,699) - - (4,290) 5,271 Total adjustments (7,693) (2,956) (2,060) (3,924) 66 (169) (4,351) 5,129 Adjusted Net Income $20,586 $27,752 $23,447 $20,993 $20,692 $18,844 $28,916 $19,666 2012 2011 |
| Historical Quarterly Production and Sales Summary 23 Mar. 31, Jun. 30, Sep. 30, Dec. 31, Mar. 31, Jun. 30, Sep. 30, Dec. 31, Mar. 31, Jun. 30, Sep. 30, Dec. 31, Potash 172 165 166 224 234 209 173 197 218 170 189 218 Trio® 57 39 32 31 31 44 35 31 30 33 35 34 Potash 243 129 221 216 196 225 190 183 203 184 249 203 Trio® 70 63 45 27 52 39 39 28 28 26 27 43 Production Volume (In thousands of short tons) Sales Volume (In thousands of short tons) 2010 2012 2011 |
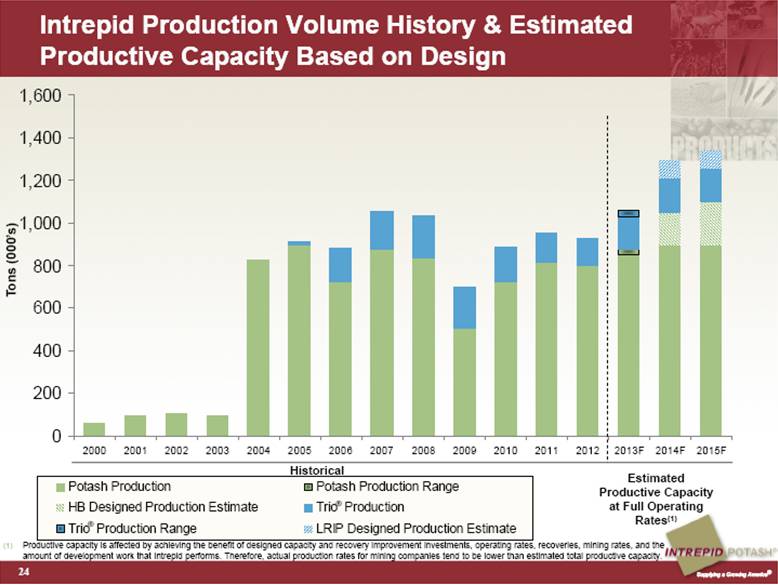
| Productive capacity is affected by achieving the benefit of designed capacity and recovery improvement investments, operating rates, recoveries, mining rates, and the amount of development work that Intrepid performs. Therefore, actual production rates for mining companies tend to be lower than estimated total productive capacity. Intrepid Production Volume History & Estimated Productive Capacity Based on Design 24 Tons (000’s) Estimated Productive Capacity at Full Operating Rates(1) Historical ® ® 0 200 400 600 800 1,000 1,200 1,400 1,600 2000 2001 2002 2003 2004 2005 2006 2007 2008 2009 2010 2011 2012 2013F 2014F 2015F Potash Production Potash Production Range HB Designed Production Estimate Trio Production Trio Production Range LRIP Designed Production Estimate |
| Depleted Conventional Mines Mines Currently With Less than 15 Years Reserve Life Theodore, Amelie, Marie Louis mines- France Pasquasi and San Cataldo mines - Italy Salzdetfurth, Friedrichshall, Bergmannssegen-Hugo, Siegfried-Giesen, and Niedersachen-Riedel - Germany Trona, California Horizon-Amax, Wills-Weaver, Saunders – Carlsbad, New Mexico Hersey, United States - Mosaic Boulby, England – ICL Soligorsk I, Belarussia - Belaruskali Taquari, Brazil – Vale 25 sources: Fertecon, Intrepid Potash®, and public filings Global Industry Susceptible to Production Interruptions & Supply “Shocks” Mine Closures Due to Water Inflows PCA (Patience Lake) (0.8MM tons KCL / yr) Potacan mine (0.8MM tons KCL / yr) Mines with Water Inflows K2 Mine Esterhazy Most recent 10-K indicated $250 million cost to mitigate Penobsquis Mine, Sussex Belaruskali Mine #2 St. Paul mine(Congo) (0.8MM tons KCL / yr) 1980 1984 1988 1996 2000 2013 2004 1992 1976 Berezniki I (1.3MM tons KCL / yr) Berezniki 3 mine (1.8MM tons KCL / yr) Mine Closures Due to Depletion Due to geology, in the 70 plus years of potash mining in the Carlsbad area, there has never been a mine lost to flooding or a water incursion |
| Fundamentals of Increasing Population Continue to Drive Grain and Ultimately Potash Demand Over the Long Term 26 Note: Grains include corn, wheat, barley, oats and sorghum. Stocks-to-use ratio is ending inventory / consumption for that crop year; data updated monthly. Sources: United Nations Food and Agriculture Organization (FAO), US Census Bureau, USDA, Potash & Phosphate Institute (PPI,) International Fertilizer Industry Association (IFA), Fertecon, (1) Futures prices based on closing price of Chicago Board of Trade futures contracts as of 2/21/13; futures prices for November/December delivery in forecast years. Hectares of Arable Land per Person Hectares per person Crop Prices Over Time(1) World Grain Production and Stocks-to-Use Ratios Grain Production Stocks-to-Use Ratio 5 Year Average Fall 2013 Futures Soybeans: $11.64 $12.77 Wheat: $6.50 $7.50 Corn: $5.39 $5.54 Grain Production (Millions of Tons) Stocks-to-Use Ratio Trend line Population Growth vs. Potash Demand 0.32 0.27 0.24 0.23 0.20 0.18 0 0.05 0.1 0.15 0.2 0.25 0.3 0.35 0.4 1970 1980 1990 2000 2010E 2020E |
| United States Potash Consumption 27 Sources : Fertecon, United States Department of Agriculture (USDA). Potash consumption is shown in fertilizer years (July – June). Grains stocks include barley, corn, oats, sorghum and wheat. Potash fertilizer consumption has remained relatively constant with an annual volatility of approximately 9.8 percent over the past 32 years Corn acres planted in the U.S. in the years 2007 through 2011 were 93.5, 86.0, 86.4, 88.2 and 91.9 million acres. 2012 planted acreage is estimated at 97.2 million acres. 1982: Recession leads to lower consumption; payment-in-kind program reduces planted acres 1991-1997: Low grain stocks lead to increased consumption 1998: Russian financial crisis impacts world markets 2001- mid 2008: Global economic expansion leads to increased demand (2006 delayed Chinese negotiations) 2010: Strong recovery in US agricultural markets 0% 10% 20% 30% 40% 50% 60% 70% 80% 90% - 2,000 4,000 6,000 8,000 10,000 12,000 Grains Stocks - to - Use Ratio KCL Tons ('000) FERTECON U.S. Potash Consumption and Grains Stocks - to - Use Ratio KCL Tons Average KCl Consumption Stocks-to-Use Ratio |