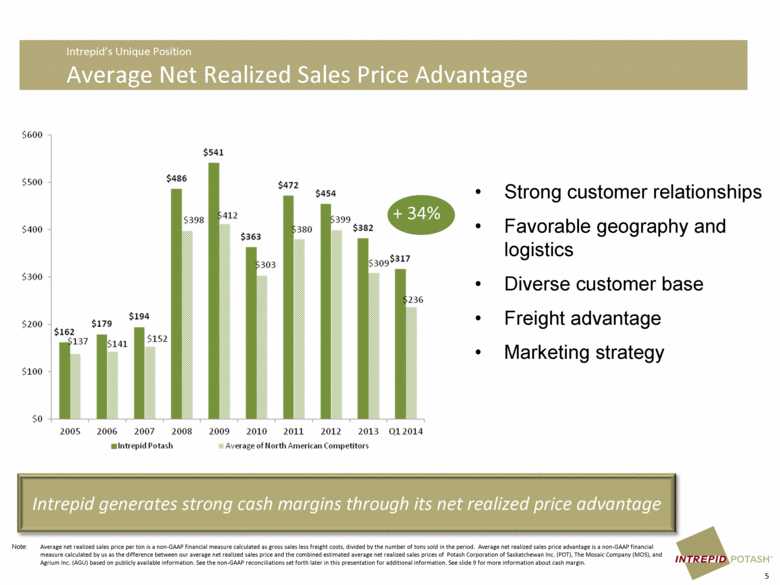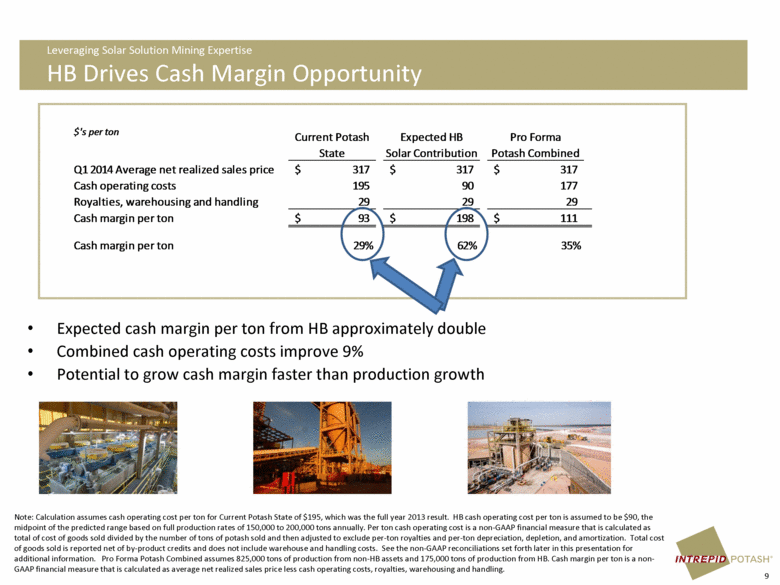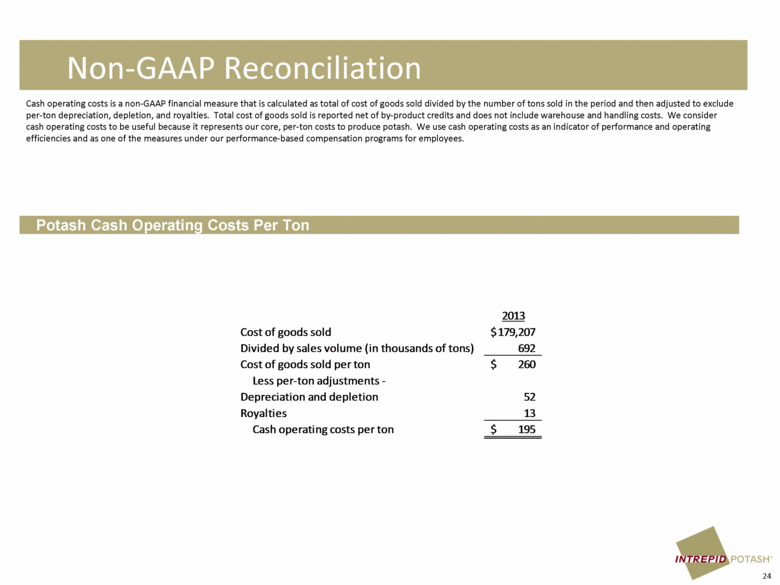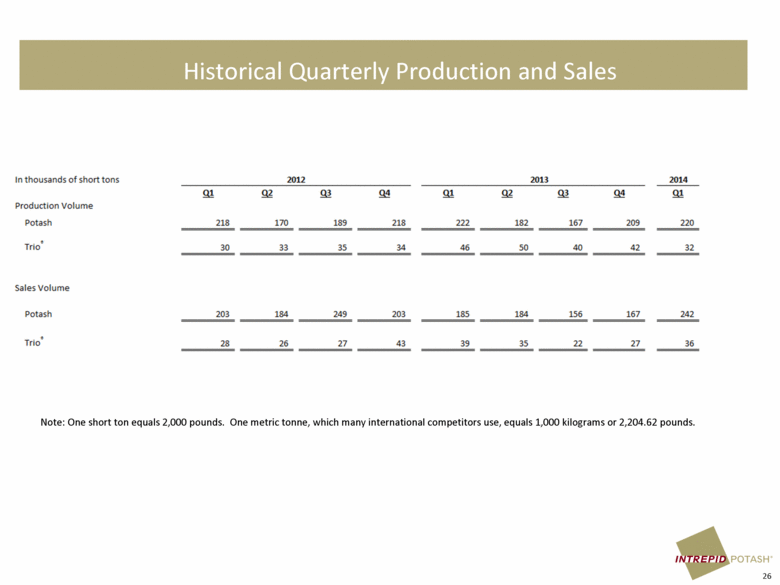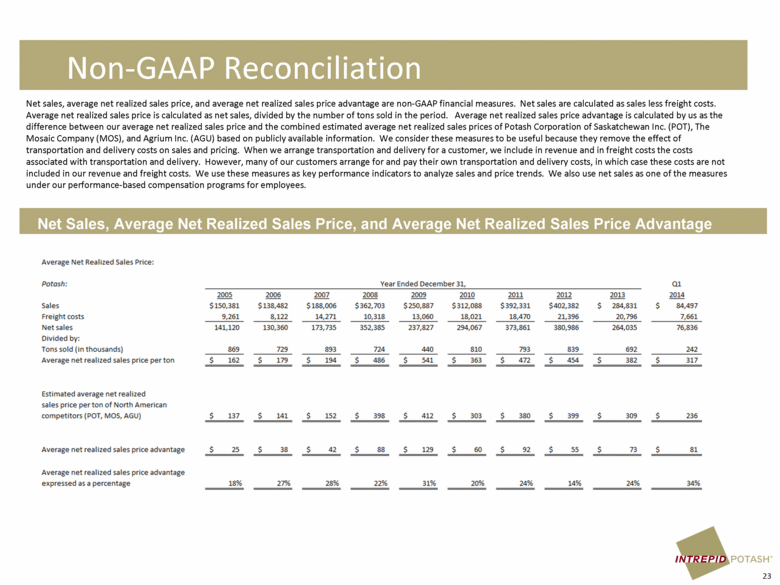
| Non-GAAP Reconciliation Net sales, average net realized sales price, and average net realized sales price advantage are non-GAAP financial measures. Net sales are calculated as sales less freight costs. Average net realized sales price is calculated as net sales, divided by the number of tons sold in the period. Average net realized sales price advantage is calculated by us as the difference between our average net realized sales price and the combined estimated average net realized sales prices of Potash Corporation of Saskatchewan Inc. (POT), The Mosaic Company (MOS), and Agrium Inc. (AGU) based on publicly available information. We consider these measures to be useful because they remove the effect of transportation and delivery costs on sales and pricing. When we arrange transportation and delivery for a customer, we include in revenue and in freight costs the costs associated with transportation and delivery. However, many of our customers arrange for and pay their own transportation and delivery costs, in which case these costs are not included in our revenue and freight costs. We use these measures as key performance indicators to analyze sales and price trends. We also use net sales as one of the measures under our performance-based compensation programs for employees. 23 Net Sales, Average Net Realized Sales Price, and Average Net Realized Sales Price Advantage Average Net Realized Sales Price: Potash: Year Ended December 31, Q1 2005 2006 2007 2008 2009 2010 2011 2012 2013 2014 Sales $150,381 $138,482 $188,006 $362,703 $250,887 $312,088 $392,331 $402,382 $ 284,831 $ 84,497 Freight costs 9,261 8,122 14,271 10,318 13,060 18,021 18,470 21,396 20,796 7,661 Net sales 141,120 130,360 173,735 352,385 237,827 294,067 373,86.1 380,986 264,035 76,836 Divided by: Tons sold (in thousands) 869 729 893 724- 440 810 793 S39 692 242 Average net realized sales price per ton $ 162 $ 179 $ 194 $ 486 $ 541 $ 363 $ 4-72 $ 454 5 382 $ 317 Estimated average net realized sales price perton of North American competitors (POT, MOS, AGU) $ 137 $ 141 $ 152 $ 398 $ 412 $ 303 380 $ 399 309 $ 236 Average net realized sales price advantage 25 38 42 SS 129 60 92 55 73 al Average net realized sales price advantage expressed as a percentage is% 27% zs% 22% 31% 20% 24% 14% 24% 34% |
