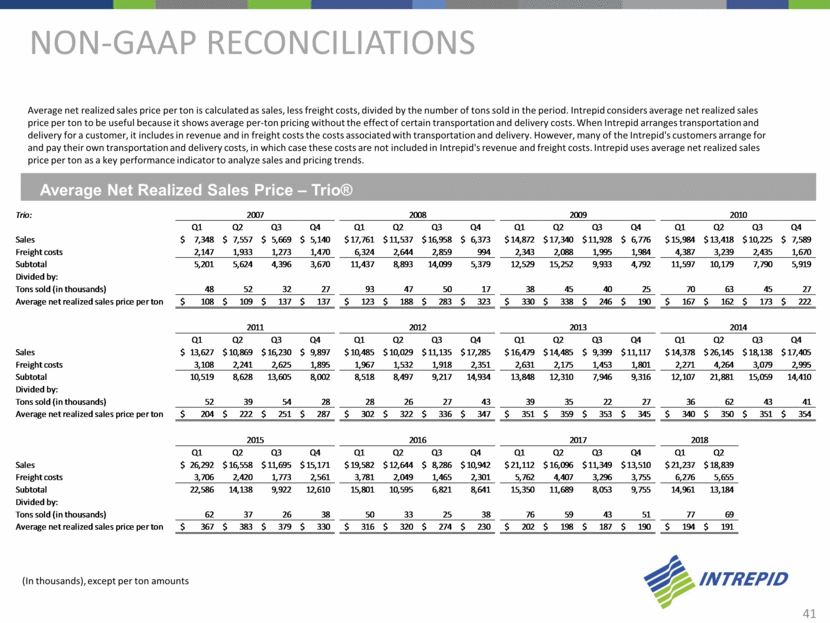
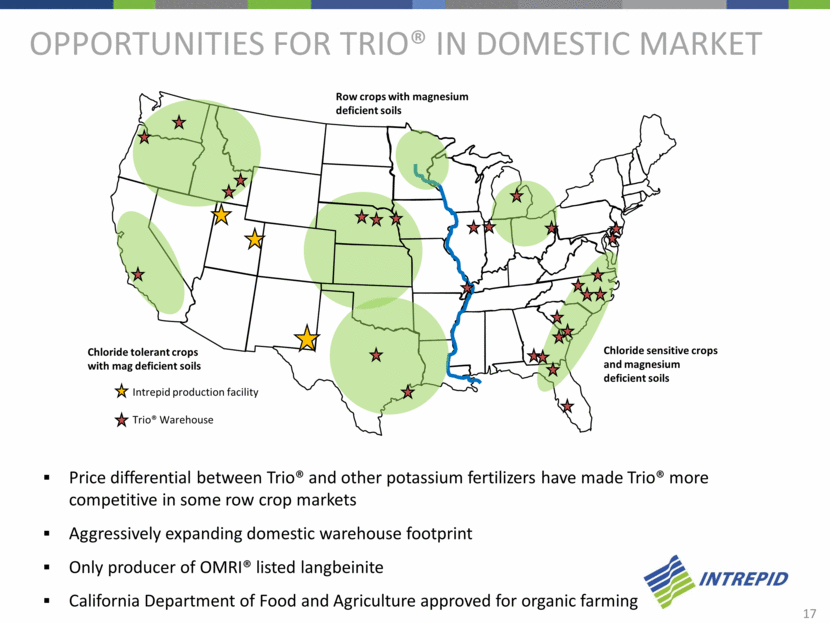
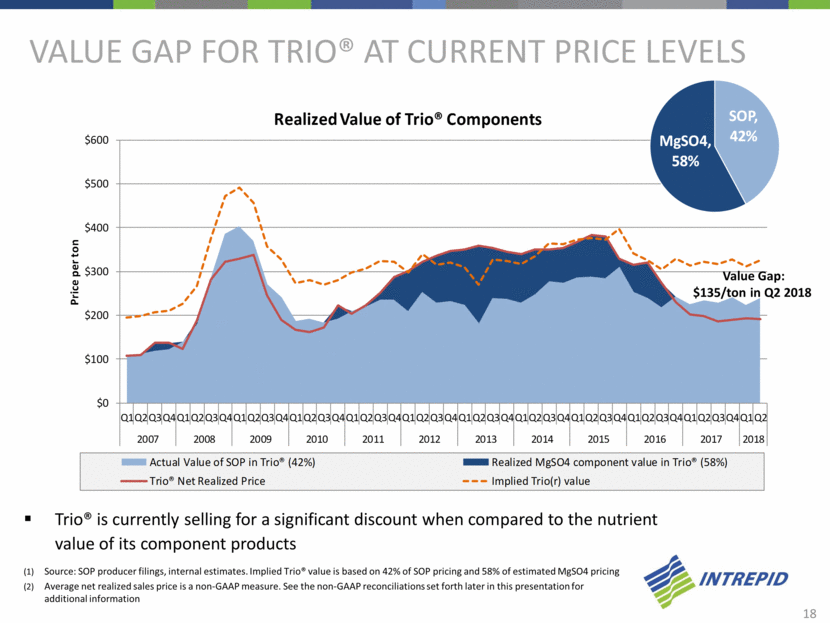
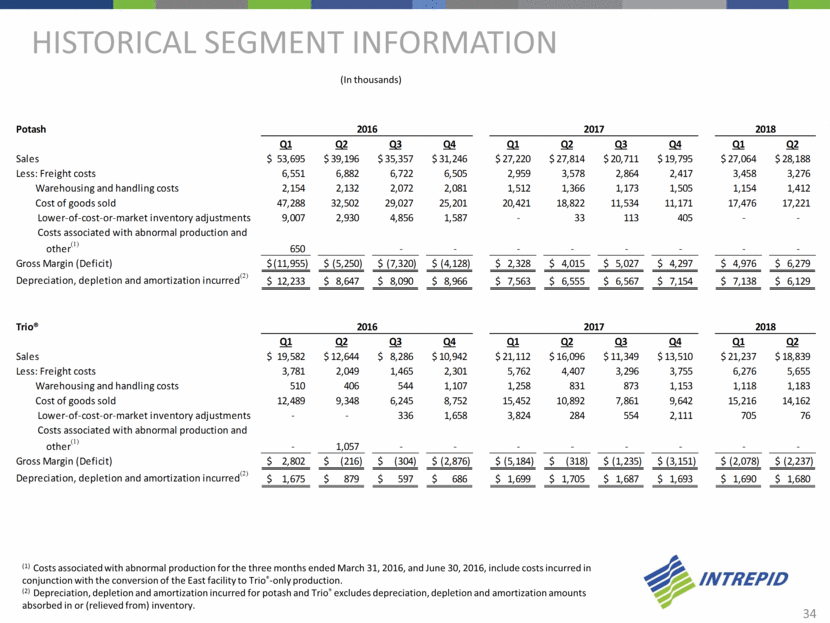
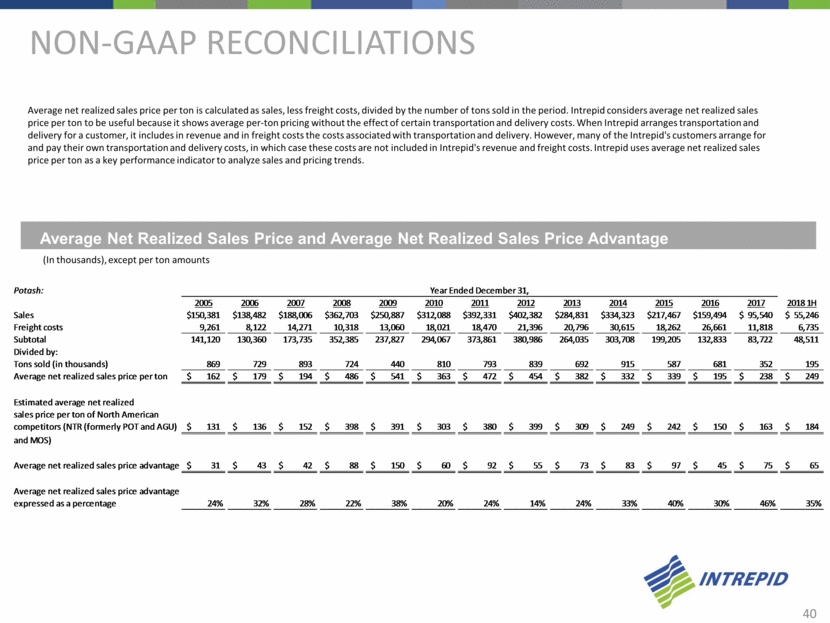
Average net realized sales price per ton is calculated as sales, less freight costs, divided by the number of tons sold in the period. Intrepid considers average net realized sales price per ton to be useful because it shows average per-ton pricing without the effect of certain transportation and delivery costs. When Intrepid arranges transportation and delivery for a customer, it includes in revenue and in freight costs the costs associated with transportation and delivery. However, many of the Intrepid's customers arrange for and pay their own transportation and delivery costs, in which case these costs are not included in Intrepid's revenue and freight costs. Intrepid uses average net realized sales price per ton as a key performance indicator to analyze sales and pricing trends. Average Net Realized Sales Price – Trio® (In thousands), except per ton amounts Non-GAAP Reconciliations 41 Trio: Q1 Q2 Q3 Q4 Q1 Q2 Q3 Q4 Q1 Q2 Q3 Q4 Q1 Q2 Q3 Q4 Sales 7,348 $ 7,557 $ 5,669 $ 5,140 $ 17,761 $ 11,537 $ 16,958 $ 6,373 $ 14,872 $ 17,340 $ 11,928 $ 6,776 $ 15,984 $ 13,418 $ 10,225 $ 7,589 $ Freight costs 2,147 1,933 1,273 1,470 6,324 2,644 2,859 994 2,343 2,088 1,995 1,984 4,387 3,239 2,435 1,670 Subtotal 5,201 5,624 4,396 3,670 11,437 8,893 14,099 5,379 12,529 15,252 9,933 4,792 11,597 10,179 7,790 5,919 Divided by: Tons sold (in thousands) 48 52 32 27 93 47 50 17 38 45 40 25 70 63 45 27 Average net realized sales price per ton 108 $ 109 $ 137 $ 137 $ 123 $ 188 $ 283 $ 323 $ 330 $ 338 $ 246 $ 190 $ 167 $ 162 $ 173 $ 222 $ Q1 Q2 Q3 Q4 Q1 Q2 Q3 Q4 Q1 Q2 Q3 Q4 Q1 Q2 Q3 Q4 Sales 13,627 $ 10,869 $ 16,230 $ 9,897 $ 10,485 $ 10,029 $ 11,135 $ 17,285 $ 16,479 $ 14,485 $ 9,399 $ 11,117 $ 14,378 $ 26,145 $ 18,138 $ 17,405 $ Freight costs 3,108 2,241 2,625 1,895 1,967 1,532 1,918 2,351 2,631 2,175 1,453 1,801 2,271 4,264 3,079 2,995 Subtotal 10,519 8,628 13,605 8,002 8,518 8,497 9,217 14,934 13,848 12,310 7,946 9,316 12,107 21,881 15,059 14,410 Divided by: Tons sold (in thousands) 52 39 54 28 28 26 27 43 39 35 22 27 36 62 43 41 Average net realized sales price per ton 204 $ 222 $ 251 $ 287 $ 302 $ 322 $ 336 $ 347 $ 351 $ 359 $ 353 $ 345 $ 340 $ 350 $ 351 $ 354 $ Q1 Q2 Q3 Q4 Q1 Q2 Q3 Q4 Q1 Q2 Q3 Q4 Q1 Q2 Sales 26,292 $ 16,558 $ 11,695 $ 15,171 $ 19,582 $ 12,644 $ 8,286 $ 10,942 $ 21,112 $ 16,096 $ 11,349 $ 13,510 $ 21,237 $ 18,839 $ Freight costs 3,706 2,420 1,773 2,561 3,781 2,049 1,465 2,301 5,762 4,407 3,296 3,755 6,276 5,655 Subtotal 22,586 14,138 9,922 12,610 15,801 10,595 6,821 8,641 15,350 11,689 8,053 9,755 14,961 13,184 Divided by: Tons sold (in thousands) 62 37 26 38 50 33 25 38 76 59 43 51 77 69 Average net realized sales price per ton 367 $ 383 $ 379 $ 330 $ 316 $ 320 $ 274 $ 230 $ 202 $ 198 $ 187 $ 190 $ 194 $ 191 $ 2018 2007 2008 2009 2010 2011 2012 2015 2016 2013 2014 2017