Exhibit (c)(3)
STRICTLY CONFIDENTIAL
Project Oslo
Fairness opinion materials
20 December 2007
Disclaimer
The accompanying material was compiled on a confidential basis for use solely by the Board of Directors of VimpelCom (the
“Company” or “VIP”) in evaluating the proposed transaction described therein. This material is not intended to provide the sole basis for evaluating the transaction, does not purport to contain all information that may be required and should not be considered a recommendation with respect to the transaction. This material was prepared for a specific use by specific persons and was not prepared with a view to public disclosure or to conform with any disclosure standards under securities laws or otherwise. Nothing contained in the accompanying material is, or shall be relied upon as, a promise or representation as to the past, the present or the future. UBS Limited (“UBS”) undertakes no obligation to update or revise the accompanying material.
It should be understood that any estimates, valuations and/or projections contained in the accompanying material were prepared or derived from information supplied by the Company and public sources without the assumption by UBS of responsibility for any independent verification thereof. Accordingly, neither UBS nor any of its officers, directors, employees, affiliates, advisors, agents or representatives warrants the accuracy or completeness of any such information, including, without limitation, the accuracy or achievability of any such estimates, valuations and/or projections. Actual results may vary from such estimates, valuations or projections and such variations may be material. This material must not be copied, reproduced, distributed or passed to others at any time without the prior written consent of UBS.
SECTION 1
Transaction background
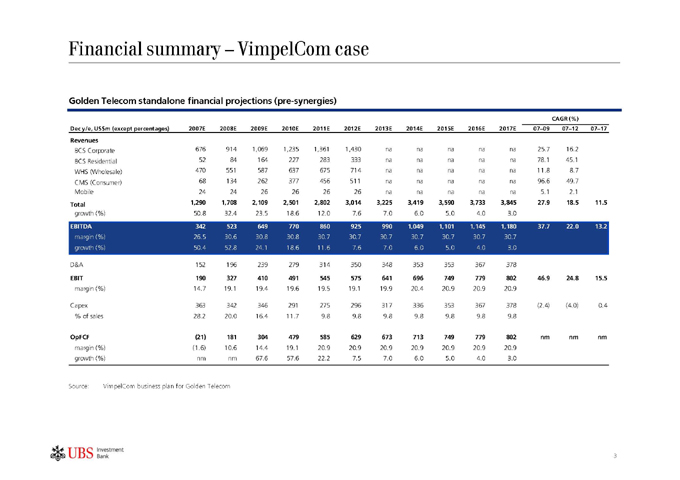
Financial summary – VimpelCom case
Golden Telecom standalone financial projections (pre-synergies)
CAGR (%)
Dec y/e, US$m (except percentages) 2007E 2008E 2009E 2010E 2011E 2012E 2013E 2014E 2015E 2016E 2017E 07–09 07–12 07–17
Revenues
BCS Corporate 676 914 1,069 1,235 1,361 1,430 na
BCS Residential 52 84 164 227 283 333 na
WHS (Wholesale) 470 551 587 637 675 714 na
CMS (Consumer) 68 134 262 377 456 511 na
Mobile 24 24 26 26 26 26 na
Total 1,290 1,708 2,109 2,501 2,802 3,014 3,225
growth (%) 50.8 32.4 23.5 18.6 12.0 7.6 7.0
na na na na 25.7 16.2
na na na na 78.1 45.1
na na na na 11.8 8.7
na na na na 96.6 49.7
na na na na 5.1 2.1
3,419 3,590 3,733 3,845 27.9 18.5 11.5
EBITDA 342 523 649 770 860 925 990 1,049 1,101 1,145 1,180 37.7 22.0 13.2
margin (%) 26.5 30.6 30.8 30.8 30.7 30.7 30.7 30.7 30.7 30.7 30.7
growth (%) 50.4 52.8 24.1 18.6 11.6 7.6 7.0 6.0 5.0 4.0 3.0
D&A 152 196 239 279 314 350 348 353 353 367 378
EBIT 190 327 410 491 545 575 641 696 749 779 802 46.9 24.8 15.5
margin (%) 14.7 19.1 19.4 19.6 19.5 19.1 19.9 20.4 20.9 20.9 20.9
Capex 363 342 346 291 275 296 317 336 353 367 378(2.4)(4.0) 0.4
% of sales 28.2 20.0 16.4 11.7 9.8 9.8 9.8 9.8 9.8 9.8 9.8
OpFCF(21) 181 304 479 585 629 673 713 749 779 802 nm nm nm
margin (%)(1.6) 10.6 14.4 19.1 20.9 20.9 20.9 20.9 20.9 20.9 20.9
growth (%) nm nm 67.6 57.6 22.2 7.5 7.0 6.0 5.0 4.0 3.0
Source: VimpelCom business plan for Golden Telecom
Share price performance
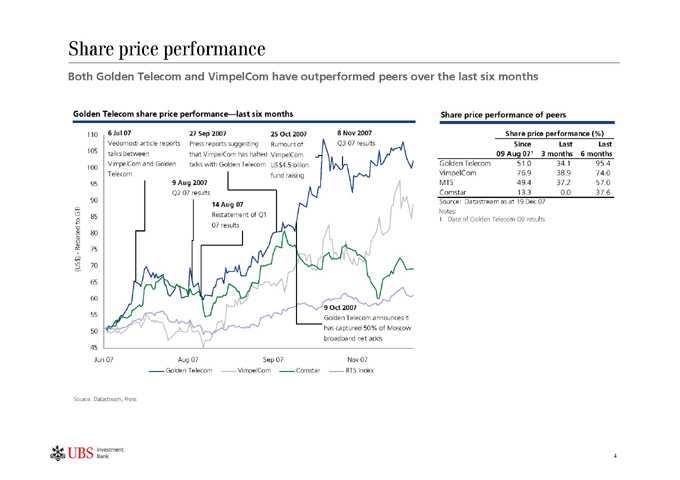
Both Golden Telecom and VimpelCom have outperformed peers over the last six months
Golden Telecom share price performance—last six months
Share price performance of peers
110
105
100
(US$ )—Rebased to GTI
Vedomosti article reports talks between VimpelCom and Golden Telecom
27 Sep 2007
Press reports suggesting that VimpelCom has halted talks with Golden Telecom
25 Oct 2007
Rumours of VimpelCom US$4.5 billion fund raising
Q3 07 results
9 Aug 2007
Q2 07 results
14 Aug 07
Restatement of Q1 07 results
Share price performance (%) Since Last Last 09 Aug 07¹ 3 months 6 months
Golden Telecom 51.0 34.1 95.4 VimpelCom 76.9 38.9 74.0 MTS 49.4 37.2 57.0 Comstar 13.3 0.0 37.6
Source: Datastream as at 19 Dec 07 Notes:
1 | | Date of Golden Telecom Q2 results |
9 Oct 2007
Golden Telecom announces it has captured 50% of Moscow broadband net adds
Jun 07 Aug 07 Sep 07 Nov 07 Golden Telecom VimpelCom Comstar RTS Index
Source: Datastream, Press
Golden Telecom market perception
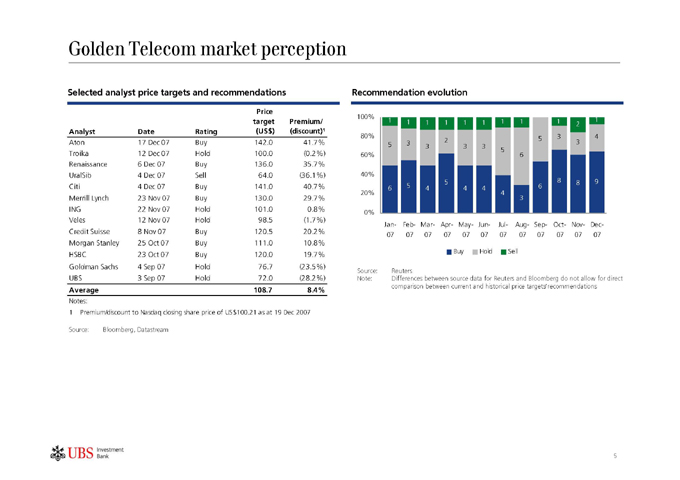
Selected analyst price targets and recommendations
Price
target Premium/
Analyst Date Rating(US$)(discount)¹
Aton 17 Dec 07 Buy 142.0 41.7%
Troika 12 Dec 07 Hold 100.0(0.2%)
Renaissance 6 Dec 07 Buy 136.0 35.7%
UralSib 4 Dec 07 Sell 64.0(36.1%)
Citi 4 Dec 07 Buy 141.0 40.7%
Merrill Lynch 23 Nov 07 Buy 130.0 29.7%
ING 22 Nov 07 Hold 101.0 0.8%
Veles 12 Nov 07 Hold 98.5(1.7%)
Credit Suisse 8 Nov 07 Buy 120.5 20.2%
Morgan Stanley 25 Oct 07 Buy 111.0 10.8%
HSBC 23 Oct 07 Buy 120.0 19.7%
Goldman Sachs 4 Sep 07 Hold 76.7(23.5%)
UBS 3 Sep 07 Hold 72.0(28.2%)
Average 108.7 8.4%
Notes:
Recommendation evolution
100% 80% 60% 40% 20% 0%
Jan- Feb- Mar- Apr- May- Jun- Jul- Aug- Sep- Oct- Nov- Dec-
07 07 07 07 07 07 07 07 07 07 07 07
Buy Hold Sell
Source: Reuters
Note: Differences between source data for Reuters and Bloomberg do not allow for direct comparison between current and historical price targets/recommendations
1 | | Premium/discount to Nasdaq closing share price of US$100.21 as at 19 Dec 2007 Source: Bloomberg, Datastream |
SECTION 2
Valuation analysis
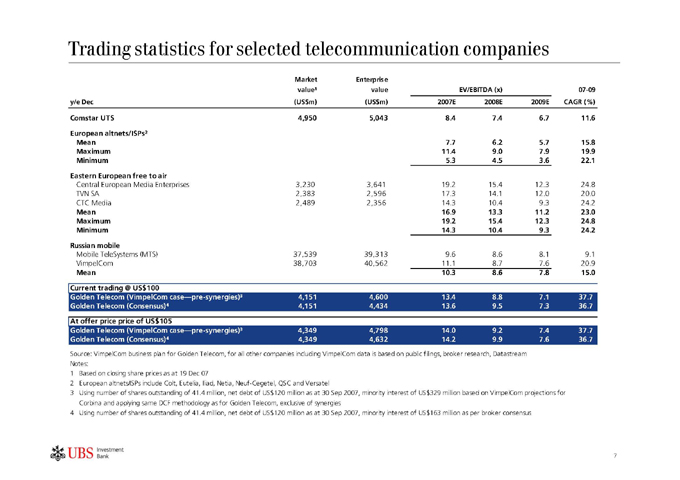
Trading statistics for selected telecommunication companies
Market Enterprise
value¹ value EV/EBITDA (x)
y/e Dec(US$m)(US$m) 2007E 2008E
Comstar UTS 4,950 5,043 8.4 7.4
European altnets/ISPs²
Mean 7.7 6.2
Maximum 11.4 9.0
Minimum 5.3 4.5
Eastern European free to air
Central European Media Enterprises 3,230 3,641 19.2 15.4
TVN SA 2,383 2,596 17.3 14.1
CTC Media 2,489 2,356 14.3 10.4
Mean 16.9 13.3
Maximum 19.2 15.4
Minimum 14.3 10.4
Russian mobile
Mobile TeleSystems (MTS) 37,539 39,313 9.6 8.6
VimpelCom 38,703 40,562 11.1 8.7
Mean 10.3 8.6
07-09
2009E CAGR (%)
Current trading @ US$100
Golden Telecom (VimpelCom case—pre-synergies)³ 4,151 4,600 13.4 8.8 7.1 37.7 Golden Telecom (Consensus)4 4,151 4,434 13.6 9.5 7.3 36.7 At offer price price of US$105 Golden Telecom (VimpelCom case—pre-synergies)³ 4,349 4,798 14.0 9.2 7.4 37.7 Golden Telecom (Consensus)4 4,349 4,632 14.2 9.9 7.6 36.7
Source: VimpelCom business plan for Golden Telecom, for all other companies including VimpelCom data is based on public filings, broker research, Datastream Notes:
1 | | Based on closing share prices as at 19 Dec 07 |
2 | | European altnets/ISPs include Colt, Eutelia, Iliad, Netia, Neuf-Cegetel, QSC and Versatel |
3 Using number of shares outstanding of 41.4 million, net debt of US$120 million as at 30 Sep 2007, minority interest of US$329 million based on VimpelCom projections for Corbina and applying same DCF methodology as for Golden Telecom, exclusive of synergies
4 Using number of shares outstanding of 41.4 million, net debt of US$120 million as at 30 Sep 2007, minority interest of US$163 million as per broker consensus
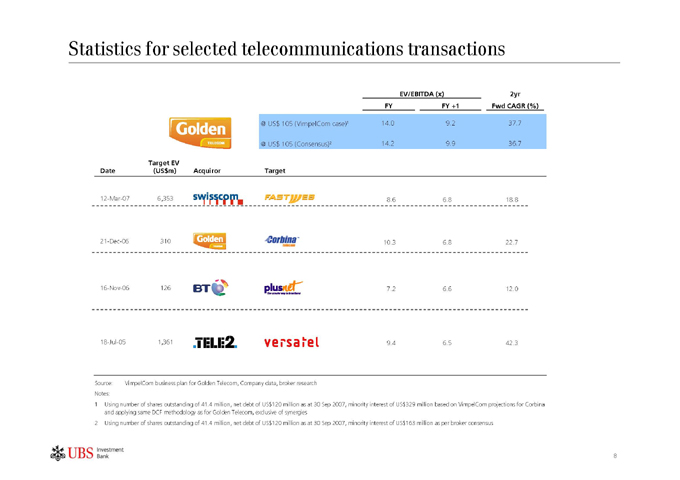
Statistics for selected telecommunications transactions
EV/EBITDA (x) 2yr
FY FY +1 Fwd CAGR (%)
@ US$ 105 (VimpelCom case)1 14.0 9.2 37.7
@ US$ 105 (Consensus)2 14.2 9.9 36.7
Target EV
Date (US$m) Acquiror Target
12-Mar-07 6,353 8.6 6.8 18.8 21-Dec-06 310 10.3 6.8 22.7 16-Nov-06 126 7.2 6.6 12.0 18-Jul-05 1,361 9.4 6.5 42.3
Source: VimpelCom business plan for Golden Telecom, Company data, broker research Notes:
1 Using number of shares outstanding of 41.4 million, net debt of US$120 million as at 30 Sep 2007, minority interest of US$329 million based on VimpelCom projections for Corbina and applying same DCF methodology as for Golden Telecom, exclusive of synergies
2 Using number of shares outstanding of 41.4 million, net debt of US$120 million as at 30 Sep 2007, minority interest of US$163 million as per broker consensus
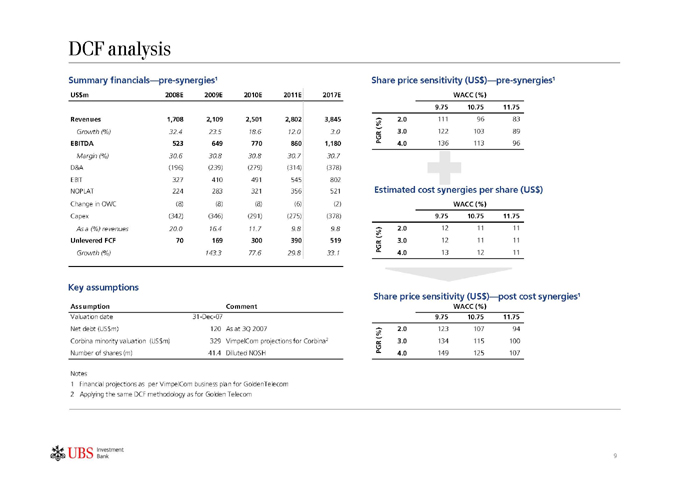
DCF analysis
Summary financials—pre-synergies¹
US$ m 2008E 2009E 2010E 2011E 2017E
Revenues 1,708 2,109 2,501 2,802 3,845
Growth (%) 32.4 23.5 18.6 12.0 3.0
EBITDA 523 649 770 860 1,180
Margin (%) 30.6 30.8 30.8 30.7 30.7
D&A(196)(239)(279)(314)(378)
EBIT 327 410 491 545 802
NOPLAT 224 283 321 356 521
Change in OWC(8)(8)(8)(6)(2)
Capex(342)(346)(291)(275)(378)
As a (%) revenues 20.0 16.4 11.7 9.8 9.8
Unlevered FCF 70 169 300 390 519
Growth (%) 143.3 77.6 29.8 33.1
Key assumptions
Assumption Comment
Valuation date 31-Dec-07
Net debt (US$m) 120 As at 3Q 2007
Corbina minority valuation(US$m) 329 VimpelCom projections for Corbina2
Number of shares (m) 41.4 Dilluted NOSH
Share price sensitivity (US$)—pre-synergies¹
WACC (%)
PGR (%) 3.0 122 103 89
Estimated cost synergies per share (US$)
WACC (%)
PGR (%) 3.0 12 11 11
Share price sensitivity (US$)—post cost synergies¹
WACC (%)
PGR (%) 3.0 134 115 100
Notes
1 | | Financial projections as per VimpelCom business plan for GoldenTelecom |
2 | | Applying the same DCF methodology as for Golden Telecom |
9
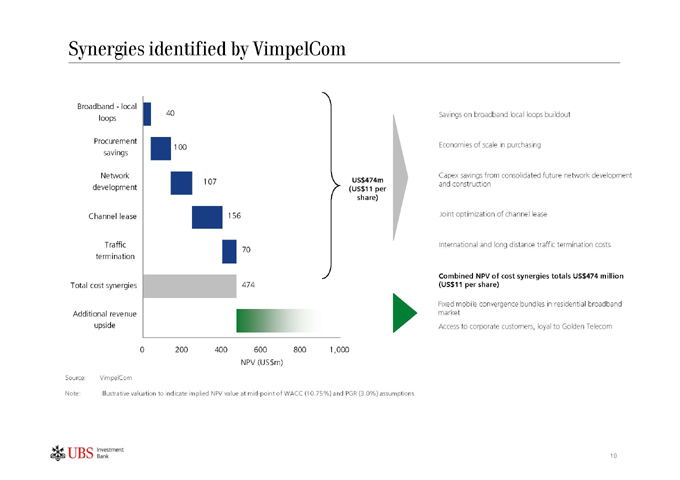
Synergies identified by VimpelCom
Broadband—local loops
Procurement savings
Network development
Channel lease
Traffic termination
Total cost synergies
Additional revenue upside
40
100
107
156
70
474
US$474m (US$11 per share)
Savings on broadband local loops buildout
Economies of scale in purchasing
Capex savings from consolidated future network development and construction
Joint optimization of channel lease
International and long distance traffic termination costs
Combined NPV of cost synergies totals US$474 million (US$11 per share)
Fixed mobile convergence bundles in residential broadband market Access to corporate customers, loyal to Golden Telecom
0 200 400 600 800 1,000 NPV (US$m)
Source: VimpelCom
Note: Illustrative valuation to indicate implied NPV value at mid-point of WACC (10.75%) and PGR (3.0%) assumptions
10
Contact information
UBS Limited
1 | | Finsbury Avenue London, EC2M 2PP Tel. +44-20-7567 8000 |
www.ubs.com
UBS Investment Bank is a business group of UBS AG UBS Limited is a subsidiary of UBS AG
11