 Noranda Aluminum Holding Corp August 12, 2010 Exhibit 99.1 |
 2 Forward Looking Statements The following information contains, or may be deemed to contain, "forward- looking statements" (as defined in the U.S. Private Securities Litigation Reform Act of 1995). By their nature, forward-looking statements involve risks and uncertainties because they relate to events and depend on circumstances that may or may not occur in the future. The future results of the issuer may vary from the results expressed in, or implied by, the following forward looking statements, possibly to a material degree. For a discussion of some of the important factors that could cause the issuer's results to differ from those expressed in, or implied by, the following forward-looking statements, please refer to our filings with the SEC, including our annual report on Form 10-K. |
 3 Management Attendees Mr. Mahoney was appointed Chief Financial Officer in May 2009 Mr. Mahoney has over 23 years of cyclical industry experience in senior financial management positions for semiconductor and electrical components companies including Hi-P International Limited and Molex Inc. Mr. Mahoney received a BA in Economics and History from the University of Virginia and an MBA from the University of Michigan President and Chief Executive Officer Chief Financial Officer Robert B. Mahoney Mr. Smith was appointed President, Chief Executive Officer and Director in 2008 Mr. Smith has diverse leadership experience, including various management assignments with The Dow Chemical Company and positions as COO of Resolution Performance Products and CEO of Covalence Specialty Materials Mr. Smith holds a BA in Chemistry and an MBA from Harvard University Layle “Kip” Smith |
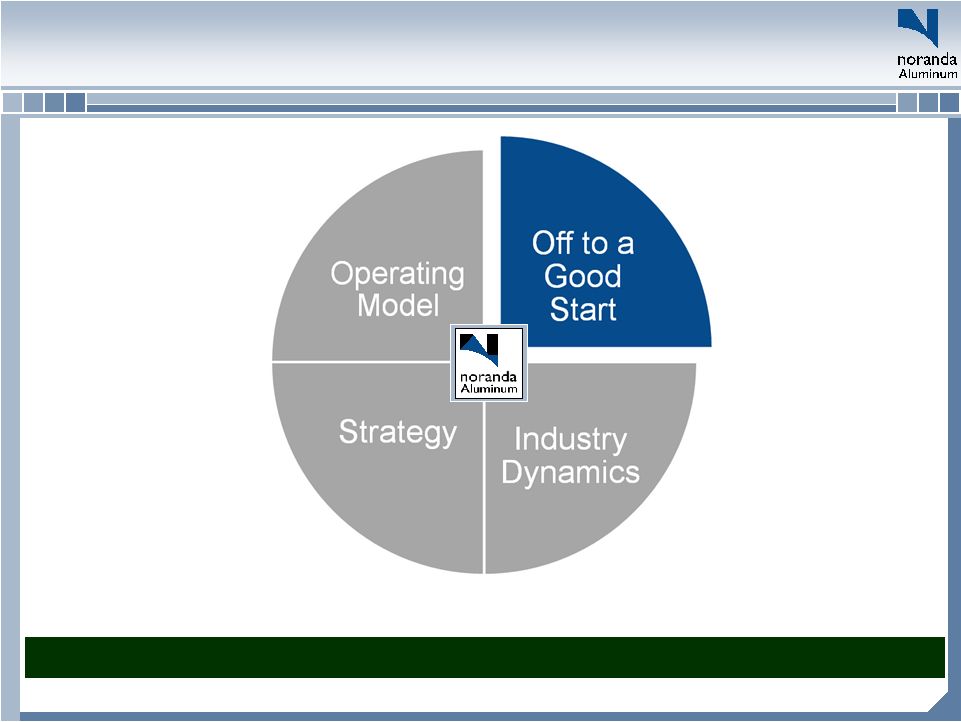    4 Second quarter results: Successful performance while completing foundational projects that strengthened Noranda |
 5 Second Quarter Highlights Noranda produced strong current quarter results… – Net income was $6.9 million ($0.14 per share), and includes the net negative impact of $11 million, or $0.21 per share, from special items – Operating cash flow was $118 million – Adjusted EBITDA was $79 million total, and $62 million excluding hedges – External volumes grew over 2Q-09 and 1Q-10 – Integrated cash cost for primary aluminum production improved to $0.66/lb – CORE contributed over $15 million in cost reduction, capital avoidance, and cash generation – Total indebtedness was $554 million, representing a 24% decrease from 1Q-10 – Cash and cash equivalents balances totaled $32 million. Senior revolving credit facility had no outstanding borrowings and $215 million available capacity … while setting a foundation for long-term value – Completed IPO as part of broad program to increase strategic flexibility, position company for growth and improve financial profile – Obtained favorable result in New Madrid power rate case – Signed final agreements for Jamaican fiscal regime |
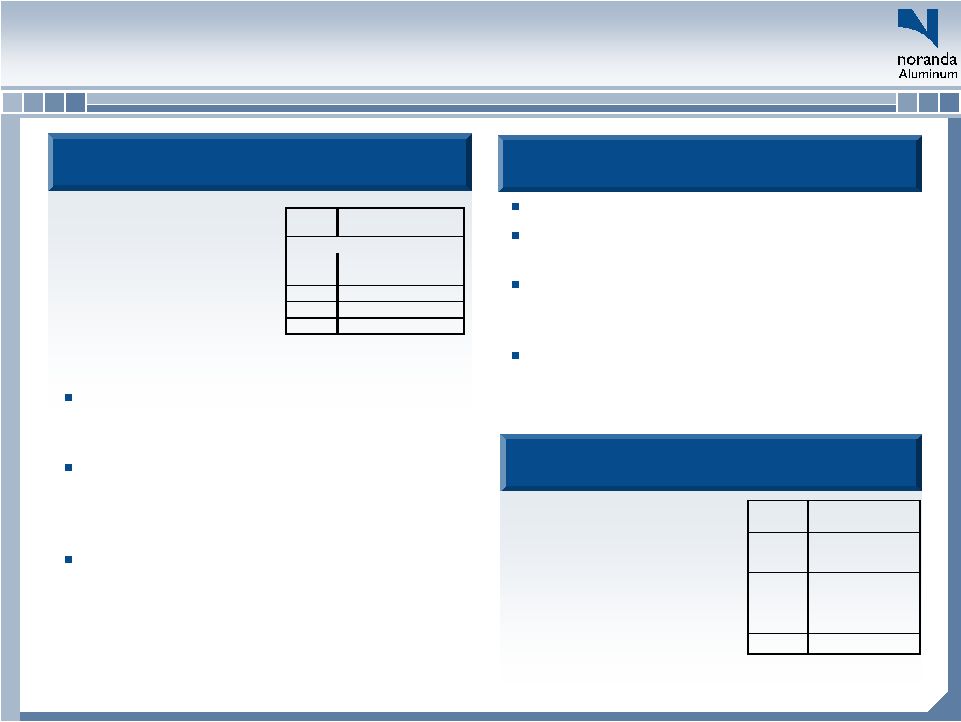 6 2009 Normalized(1) 3MOE 6/30/10 6MOE 6/30/10 Total primary aluminum shipments 580 147 267 Integrated upstream margin on cash cost 0.39 $ 0.38 $ 0.37 $ Integrated upstream EBITDA 224 $ 55 $ 99 $ Rolled products fabrication margin 35 15 26 Run-rate corporate expenses (29) (7) (14) Total Unhedged EBITDA 230 $ 62 $ 111 $ Summary by Business (1) Normalized based on $1.00 LME, $0.06 Mid-west Premium Rolled Products Business Rolled Products Business Upstream Business Upstream Business Business-wide summary 2009 Normalized 3MOE 6/30/10 6MOE 6/30/10 LME 1.00 0.97 0.98 Midwest Premium 0.06 0.06 0.06 Midwest Transaction Price 1.06 1.04 1.04 Net integrated cash cost of primary aluminum 0.67 0.66 0.67 Integrated upstream margin per pound 0.39 0.38 0.37 Dollars per Pound Integrated cash cost is $0.66 for Q2-10; normalizing Q1-10 for smelter volume and alumina ramp up, YTD cost is $0.67 Strong Q2-10 demand in key primary aluminum product groups. Billet and rod up 40% and 7% against Q2-09. Billet and rod shipments up 21% and 22% against Q1-10 CORE initiatives and favorable input prices offset bauxite shipping delays, alumina ramp-up, and legal costs related to power case Fabrication margin was $14.5 million YTD 2010 fabrication margin ahead of YTD 2009 by nearly $16 million Q2-10 fabrication margin was $0.15 per pound driven by greater leverage on fixed costs because of exceptional throughput and by CORE results CORE generated savings through purchasing efficiency, labor efficiency and labor cost reduction |
    7 Noranda is well positioned to take advantage of a recovery in Aluminum prices |
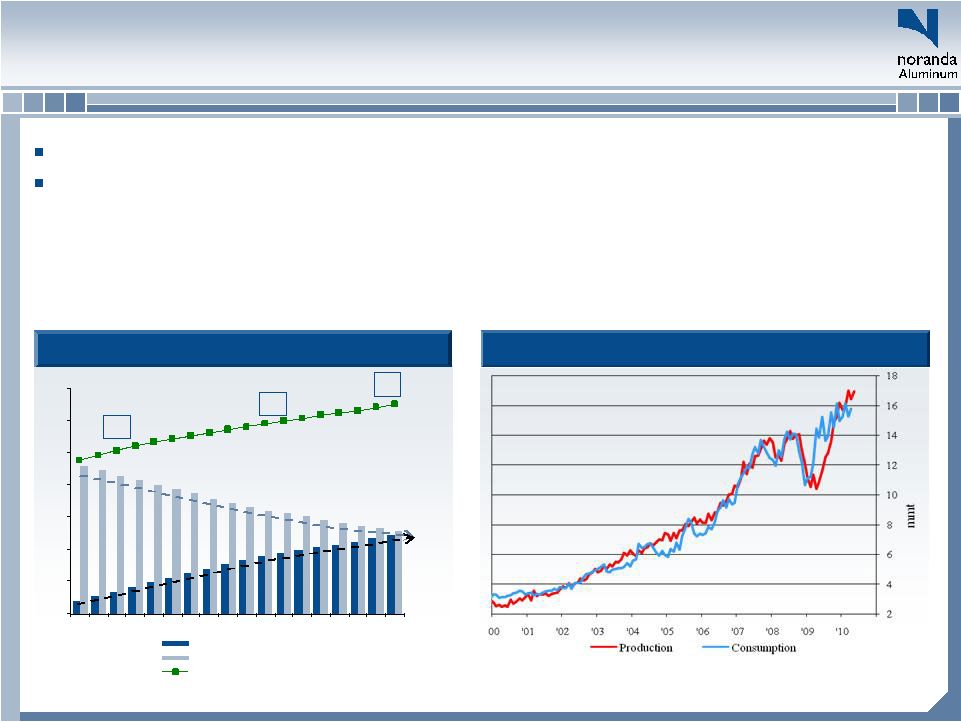
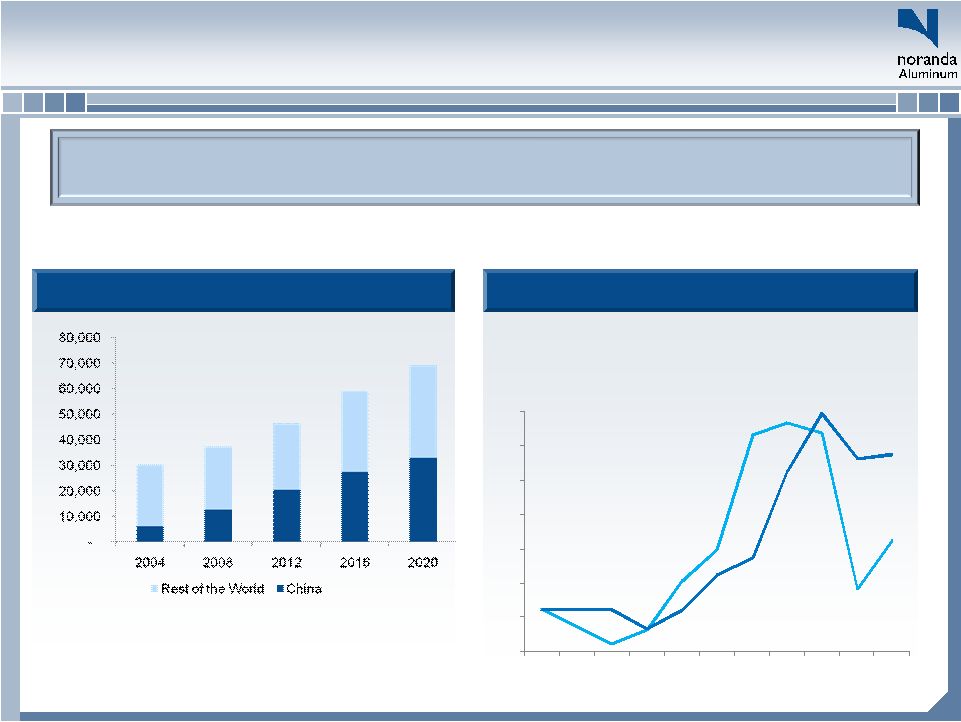 8 1300 1500 1700 1900 2100 2300 2500 2700 2000 2001 2002 2003 2004 2005 2006 2007 2008 2009 2010 Market Fundamentals – Medium to Long Term Global demand for aluminum is expected to continue to increase… Aluminum’s consensus estimated sustainable price is meaningfully above current prices… We hold a positive outlook for Aluminum’s fundamentals over the medium and long-term, based on two views: Prices Below Consensus Sustainable Level Source: Harbor intelligence ALUMINUM LONG TERM MINIMUM EQUILIBRIUM PRICE (annual average; consensus forecasts from up to 20 analysts) ESTIMATED LT MINIMUM EQUILIBRIUM $2,450 CASH PRICE $2,109 so far 2010 Consumption Growth Driven by China Source: CRU (1) In millions of tonnes Total Consumption (1) 30.4 37.4 46.5 59.1 69.2 % Growth -- 23% 24% 27% 17% China Consumption (1) 6.1 12.6 20.4 27.5 33.0 % Growth -- 108% 62% 35% 20% |
 9 0.80 0.90 1.00 1.10 1.20 1.30 1.40 25% 35% 45% 55% 65% 75% 85% 95% 1995 97 99 01 03 05 07 09 11 China Urban population, % China Rural population, % China Total population, bn Amplified Growth Globally, substitution trends favor aluminum China historically has produced at or near its aluminum consumption — China has imposed severe export taxes on aluminum; exports are highly unlikely — CRU forecasts China being net importers of aluminum in the medium term — Power is a key production constraint for China China Population & Urbanization _________________ Source: CRU. 1.4 1.3 1.2 Chinese Aluminum Consumption & Production _________________ Source: Davenport. |
    10 Though we can’t control the LME, we exercise significant control and influence over the basic drivers of our success |
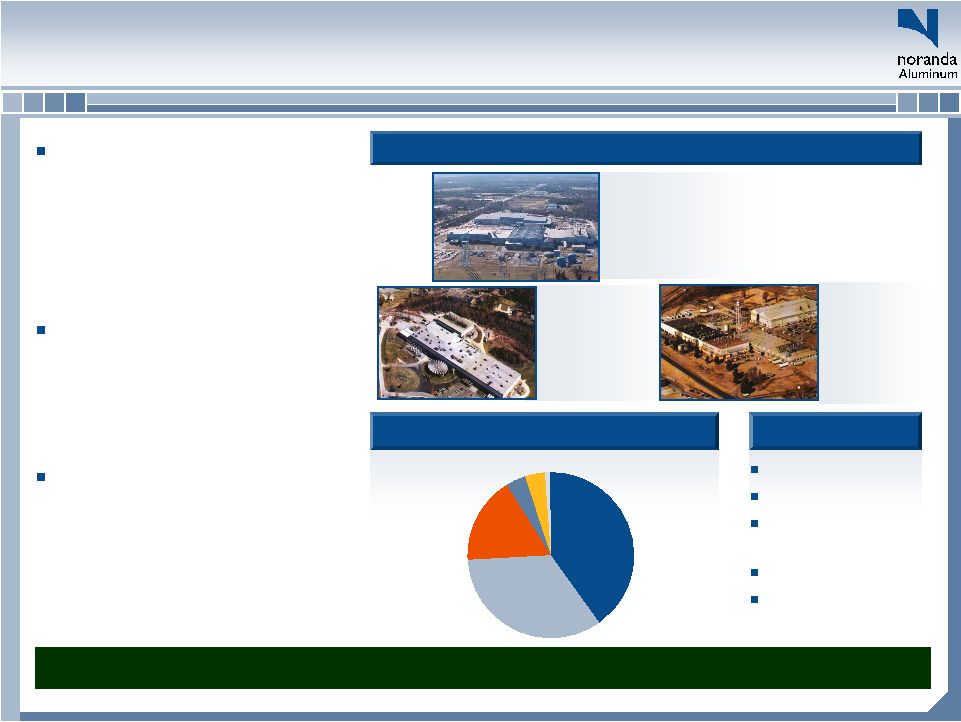
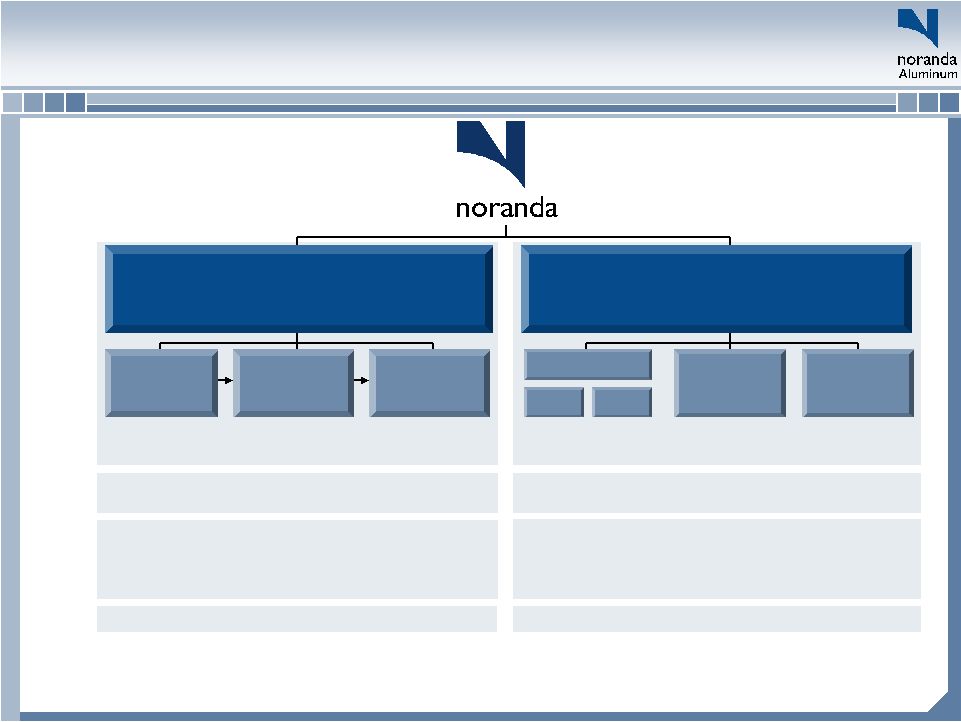 11 Noranda’s Integrated Operating Footprint Downstream Business Downstream Business Annual Capacity: 495mm lbs (2) St. Ann Bauxite Mine New Madrid Aluminum Smelter Newport Rolling Mills Salisbury Rolling Mills East Mill West Mill Huntingdon Rolling Mills Bauxite Discovery Bay, Jamaica 4.5mm Mt Alumina Gramercy, LA 1.2mm Mt Aluminum Primary Metal New Madrid, MO 263k Mt (580mm lbs) Fin stock (HVAC) and Auto, Semi-Rigid Container Stock, Flexible Packaging, Transformer Windings Huntingdon, TN Huntingdon West 235mm lbs (2) Huntingdon East 130mm lbs Newport, AR 35mm lbs Salisbury, NC 95mm lbs Products: Location: Annual Capacity: Upstream Business Upstream Business Annual Capacity: 580mm lbs 2009 Cash Cost at Full Production: $0.72 / lb (1) Gramercy Refinery Revenue Drivers: Volume & LME Residential construction / remodeling, packaging, U.S. consumer _______________________ (1) We estimate that due to lost production volume in 2009 from the smelter outage, which caused lost efficiency and fixed cost absorption, our upstream cash cost of primary aluminum for FYE 2009 of $0.77 per poundwas negatively impacted by $0.05 per pound. (2) Maximum capacity, with actual capacity depending upon production mix. |
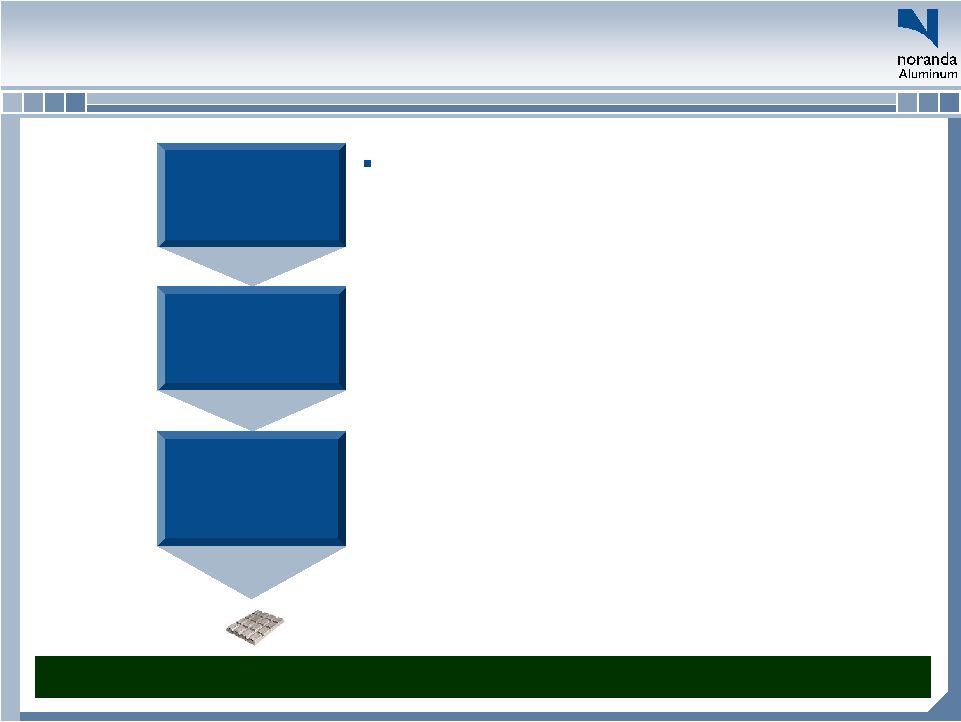 12 Primary Aluminum Alumina Noranda Bauxite Mine Noranda Alumina Refinery New Madrid Primary Aluminum Smelter Bauxite The integration of our Upstream Business is the lynchpin to our strategy and sustainability – Significant Operating Leverage to LME • Integration provides for a more “fixed” cost base relative to non-integrated producers whose margins may be eroded by rising input costs that are correlated to LME • Third party sales of excess raw materials (e.g., bauxite and alumina) enhance our leverage to LME – Secure Supply • For our smelter and refinery, we have the ability to provide over 100% of our needs of alumina and bauxite – Low Cost & Operating Flexibility • Expanded portfolio of opportunities to drive cost out and increase productivity and sales Our strategy is founded on integrated production, cost independence from the LME, growth & productivity Vertically Integrated Upstream Business |
 13 Geographic Mix Low Cost, Leading – Rolling Mill Operations Low cost Production – Huntingdon West is the foil mill with the lowest conversion cost in North America according to CRU – CORE Productivity – Footprint efficiency Flexibility – 10-30% of prime metal comes from New Madrid, but inter-company volume can be varied based on market conditions Focused Growth – Grow with key customers to “Win with Winners” – Increase share of demand – Top 10 customers 56% of sales Huntingdon, TN 2 plants, East and West Started 1967 & 2000 Max. East capacity: 130mm lbs Max. West capacity: 235mm lbs (1) Newport, AR Started 1951 Max. Capacity: 35mm lbs (1) Salisbury, NC Started 1965 Max. Capacity: 95mm lbs Four Rolling Mills in Three States _______________________ (1) Capacity includes intracompany reroll of approximately 45mm lbs. 40% 17% 4% 4% Southeast USA West USA Northeast USA Midwest USA 34% Southwest USA Mexico 1% HVAC fin stock Container Transformer sheet Foil products Light gauge sheet Products Downstream Segment is a stable free cash flow generator |
    14 We have two #1 Priorities: Get the Results, and Do the Right Things the Right Way |
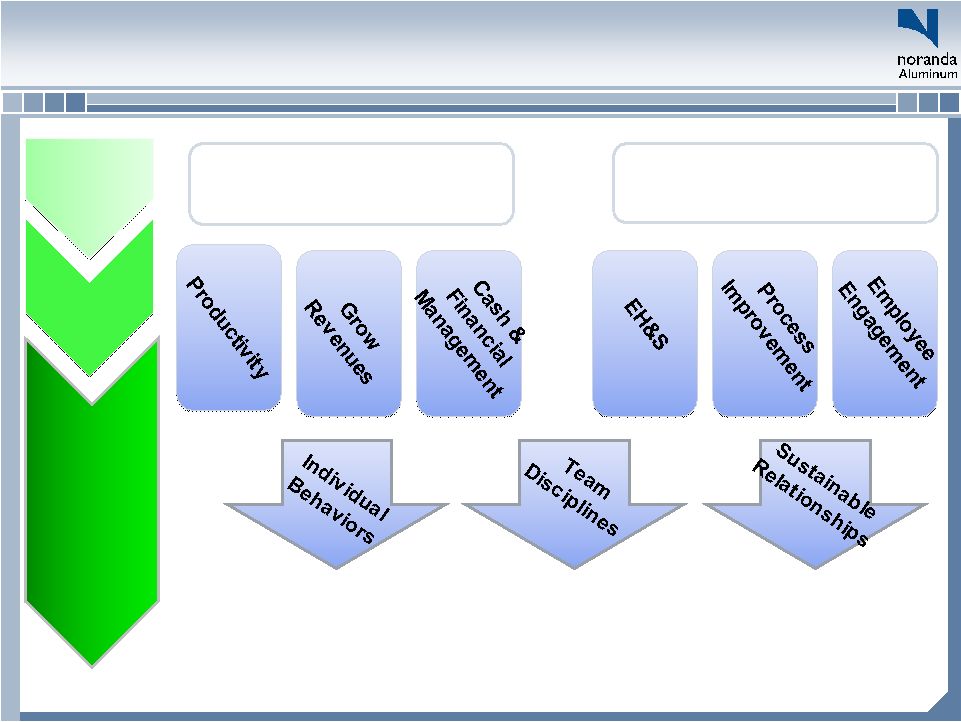          15 Get the Results Get the Results Do the Right Things Do the Right Things the Right Way the Right Way Action oriented Ethics and Values Drive for results Process Management Safety Focus Problem solving Peer relationships Priority setting Managing through systems Existing for Customers Caring for Customers Respecting Suppliers Enriching Communities Rewarding Investors Two #1 Two #1 Priorities Priorities Sustainable Sustainable Goals Goals Core Core Values Values Our Two #1 Priorities |
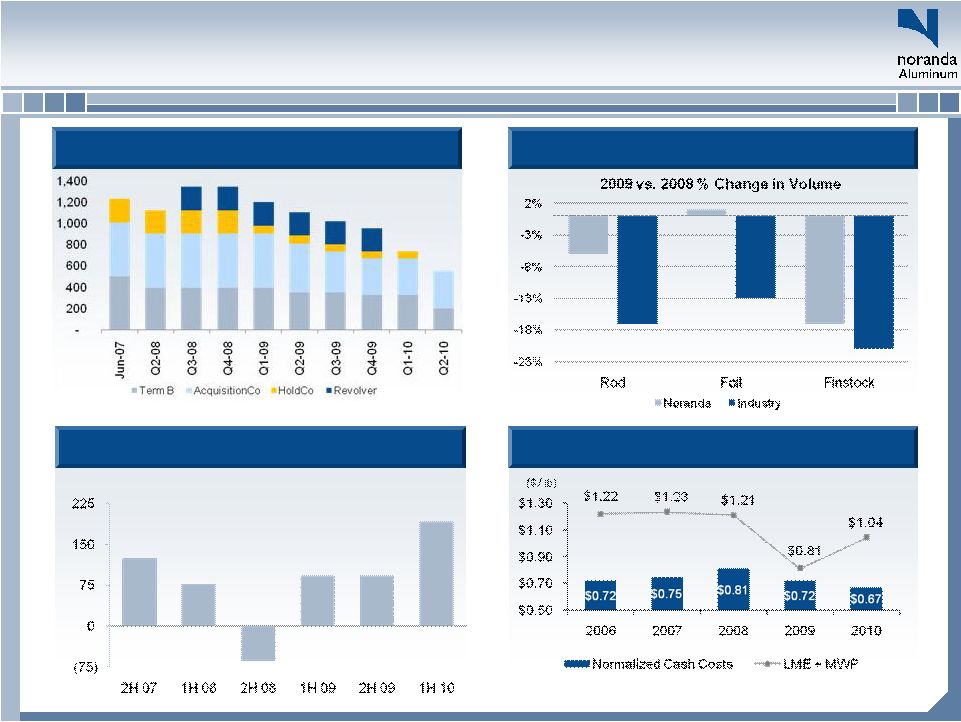 16 Financial Success in Adverse Conditions Reduced Production Cost Reduced Production Cost Improved Demand Share Improved Demand Share Reduced Debt Reduced Debt Generated More Cash (Free Cash Flow) Generated More Cash (Free Cash Flow) (Millions of dollars) |
 17 Experienced Management Team Management has created significant shareholder value at Noranda 13 members of the executive team have an average of more than 21 years of experience in cyclical and commodity industries – Layle “Kip” Smith, President and Chief Executive Officer, has 25 years of leadership experience, including in various management positions with The Dow Chemical Company, as COO of Resolution Performance Products and as CEO of Covalence Specialty Materials – Kyle D. Lorentzen, Chief Operating Officer, has 20 years of experience in cyclical industries, including senior positions at Berry Plastics, Covalence Specialty Materials and Hexion’s Epoxy and Phenolics Division – Robert B. Mahoney, Chief Financial Officer, has over 23 years of cyclical industry experience in senior financial management positions for semiconductor and electrical components companies – Gail E. Lehman, Vice President & General Counsel, has 22 years of corporate law experience, having held senior roles at industrial companies Honeywell, Covalence Specialty Materials and Hawker Beechcraft – Scott Croft, President of Norandal USA, Inc, has 24 years of experience in the rolling mill business – Richard Lapine, Vice President of Sales & Marketing, has over 30 years of experience in Chemicals, Plastics and Automotive segments as a former executive at The Dow Chemical Company – Charles Skoda, Vice President of Operations Support, has 9 years of experience in cyclical industries, including as an executive at Capital One, following a decorated career as an aviator in the U.S. Navy – Remaining executive team members bring strong experience and are experts in their functional areas Experienced management team with a proven track record will support Noranda’s continued success |
    18 |
 19 APPENDICES |
 20 Reconciliation of EBITDA to Net Income Comments Adjusted EBITDA for three months ended June 30, 2010 78.8 $ Interest (Expense)/Income, Net (8.5) Depreciation & Amortization (25.1) LIFO/LCM (9.9) Interest Rate Swap MTM (5.6) MTM (Loss)/Gain on NatGas (5.8) AOCI Reclassification of Alim. Hedges 22.2 AOCI Reclassification of NatGas Hedges (1.5) Stock Compensation Expense (3.8) Non-Cash Pension Expense (1.8) Other on-going items (1.0) Gain) loss on debt repurchase (2.5) Charges related to termination of derivatives (4.9) Restructuring and sponsor fees (20.3) Pre-Tax Income 10.3 Income tax expense 3.4 6.9 $ Weighted average shares 49.1 Diluted options 1.0 prospectively, based on post-IPO debt balances at applicable interest rates (1) 2Q is reasonable proxy going forward, at $25 million per quarter (2) Will vary from period-to-period with LME and inventory levels Will vary from period-to-period with change in notional and market LIBOR (3) Will vary from period-to-period with change in hedged volume and Henry Hub (3) Set amount, with next 12 months disclosed (4) Relatively predictable amount, with estimate for next 12 months disclosed (4) 2Q-10 contained $3.2 million of acceleration Approximately $1.8 million per quarter, based on 2Q amounts (5) Represents gains and losses on asset disposals, other, say $1 million per quarter (6) Would continue after 2Q-10 only when there are are debt paydowns Doesn't continue after 2Q-10 Doesn't continue after 2Q-10 At 2Q, forecasted annual GAAP rate was disclosed as 33.6% (7) 3Q will be based on amount outstanding at end of 2Q-10 (8) Will vary based on stock price, but Q2-10 is appropriate proxy (9) Diluted shares 50.1 Diluted EPS 0.14 $ (1) See page 12 of June 2010 Form 10-Q for balance and rate information. (2) See page 50 of June 2010 Form 10-Q for 2Q-10 actual amount. (3) See page 19 of June 2010 Form 10-Q for hedged quantities and rates. (4) See page 19 of June 2010 Form 10-Q for amounts to be reclassified in future. (5) See page 52 of June 2010 Form 10-Q for Q2-10 actual amount. (6) See page 52 of June 2010 Form 10-Q for LTM "Loss on disposal" (0.4 million) and "other" (0.6 million). (7) See page 17 of June 2010 Form 10-Q for 33.6% annual 2010 rate. (8) See cover of June 2010 Form 10-Q for most recent share number. (9) See page 23 of June 2010 Form 10-Q for Q2-10 impact of dilutive securities. Note: Amounts in millions, except per share data |