 NORANDA ALUMINUM HOLDING CORPORATION—NOVEMBER 2010 Exhibit 99.1 |
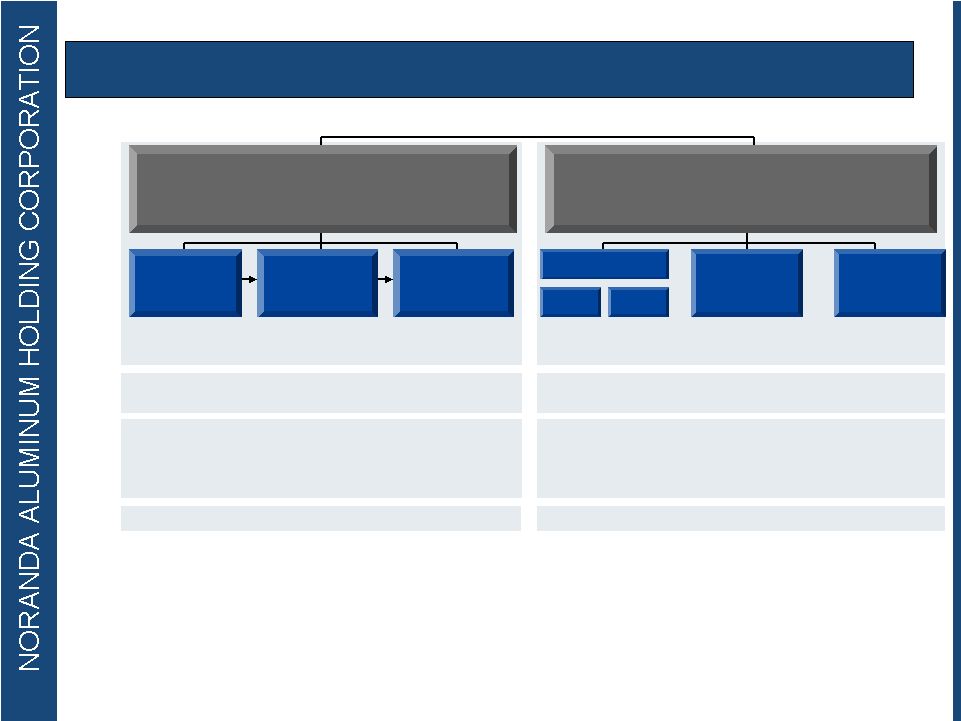
 Mr. Mahoney was appointed Chief Financial Officer in May 2009 Mr. Mahoney has over 23 years of cyclical industry experience in senior financial management positions for semiconductor and electrical components companies including Hi-P International Limited and Molex Inc. Mr. Mahoney received a BA in Economics and History from the University of Virginia and an MBA from the University of Michigan President and Chief Executive Officer Chief Financial Officer Robert B. Mahoney Mr. Smith was appointed President, Chief Executive Officer and Director in 2008 Mr. Smith has diverse leadership experience, including various management assignments with The Dow Chemical Company and positions as COO of Resolution Performance Products and CEO of Covalence Specialty Materials Mr. Smith holds a BA in Chemistry and an MBA from Harvard University Layle “Kip” Smith 2 |
 Forward Looking Statements The following information contains, or may be deemed to contain, "forward-looking statements" (as defined in the U.S. Private Securities Litigation Reform Act of 1995). By their nature, forward-looking statements involve risks and uncertainties because they relate to events and depend on circumstances that may or may not occur in the future. The future results of the issuer may vary from the results expressed in, or implied by, the following forward looking statements, possibly to a material degree. For a discussion of some of the important factors that could cause the issuer's results to differ from those expressed in, or implied by, the following forward-looking statements, please refer to our filings with the SEC, including our annual report on Form 10-K. 3 |
 Downstream Business Downstream Business Annual Capacity: 495mm lbs (2) St. Ann Bauxite Mine New Madrid Aluminum Smelter Newport Rolling Mills Salisbury Rolling Mills East Mill West Mill Huntingdon Rolling Mills Bauxite Discovery Bay, Jamaica 4.5mm Mt Alumina Gramercy, LA 1.2mm Mt Aluminum Primary Metal New Madrid, MO 263k Mt (580mm lbs) Fin stock (HVAC) and Auto, Semi-Rigid Container Stock, Flexible Packaging, Transformer Windings Huntingdon, TN Huntingdon West 235mm lbs (2) Huntingdon East 130mm lbs Newport, AR 35mm lbs (2) Salisbury, NC 95mm lbs (2) Products: Location: Annual Capacity: Upstream Business Upstream Business Annual Capacity: 580mm lbs YTD 2010 Cash Cost is $0.71 2009 Cash Cost at Full Production: $0.72 / lb (1) Gramercy Refinery Revenue Drivers: Volume & LME Residential construction / remodeling, packaging, U.S. consumer _______________________ (1) We estimate that due to lost production volume in 2009 from the smelter outage, which caused lost efficiency and fixed cost absorption, our upstream cash cost of primary aluminum for FYE 2009 of $0.77 per poundwas negatively impacted by approximately $0.05 per pound. (2) Maximum capacity, with actual capacity depending upon production mix. Noranda’s Integrated Footprint 4 |
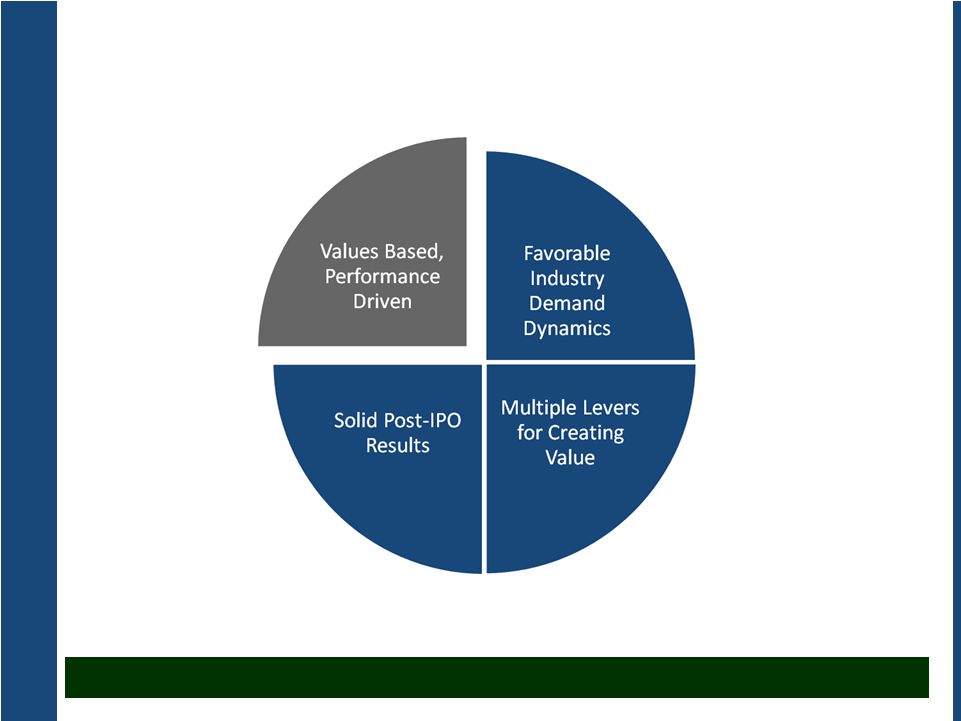
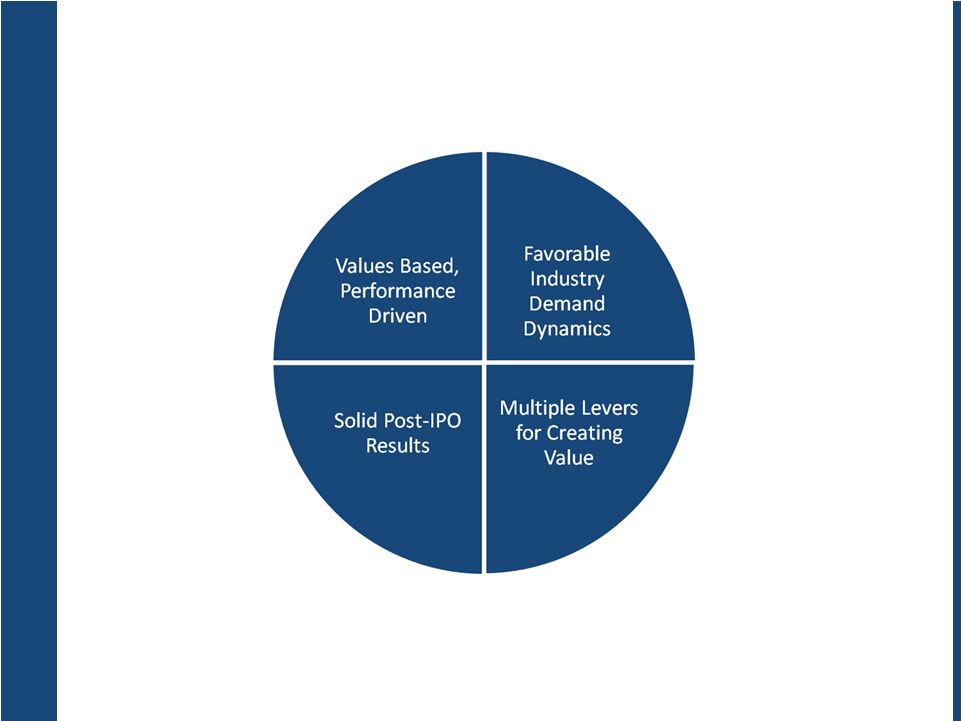
 Key Messages • Aluminum’s fundamentals support long term demand growth • Noranda is a pure aluminum play o We are highly leveraged to the LME o We are fully integrated, from bauxite to aluminum foil o We choose to manage with a passionate focus on productivity o We have a value-added growth strategy Demonstrated Ability to Create Value • During the 2008/2009 downturn, we o Lowered our cost of producing a pound of primary aluminum o Generated cash o Decreased our safety incidents o Decreased our debt o Increased our share of demand in key product segments • We have produced solid post-IPO results 5 |
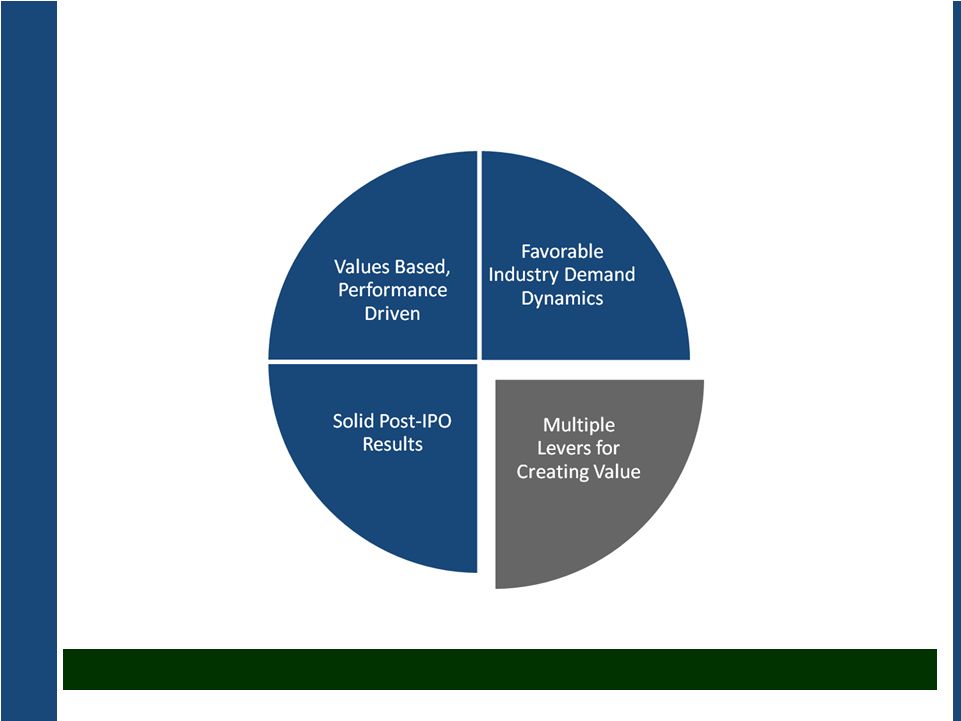
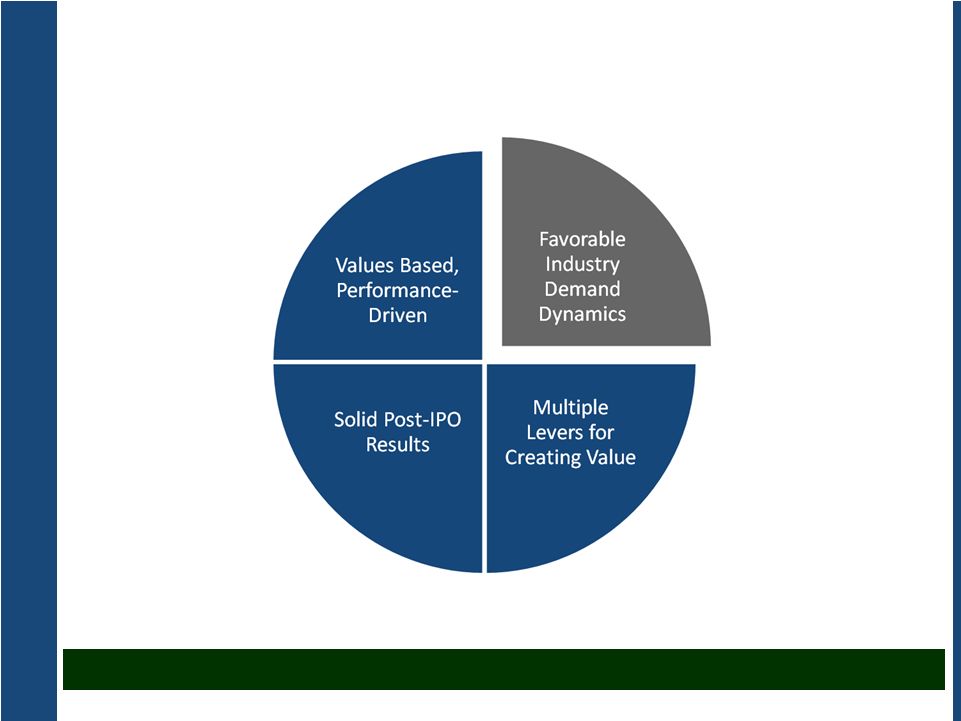 Noranda is well positioned to take advantage of demand growth and a recovery in Aluminum prices 6 |
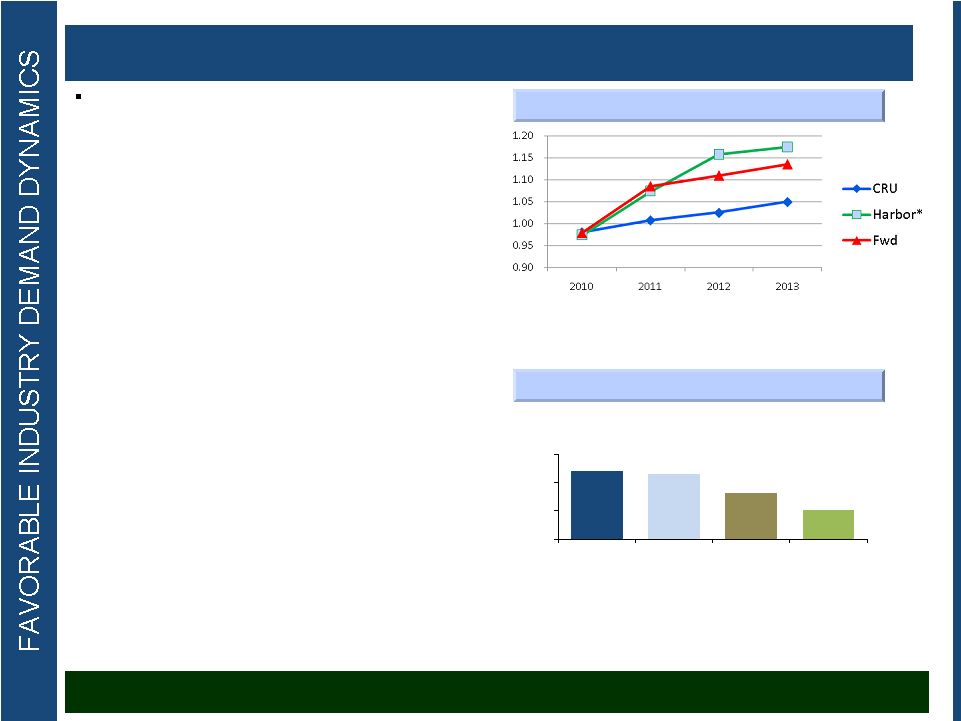 Global aluminum demand is expected to continue to grow o Global economic growth o Higher standards of living and increased demand from emerging markets • Substitution from other metals such as copper o CRU: Copper to aluminum price ratio has “hit new highs in recent months and is set to widen further in 2011” o Gains are occurring in wire and cable and bus- bars, heat transfer applications, commercial heat exchanger applications • Aluminum is highly correlated with o GDP growth o Rapid urbanization o Increasing environmental consciousness Beta to Global GDP (30 Years) Aluminum Consumption Growth vs. Global GDP Growth since 1976 2.4 2.3 1.6 1.0 0.0 1.0 2.0 3.0 Aluminum Nickel Copper Zinc 7 * Source: Harbor Intelligence; 5 Ali analysts most accurate from 2001 through 2009 We Hold a Positive Outlook For Aluminum Forecasts of Average Annual LME We see stable demand, at prices sufficient to support value creation |
 Though we can’t control the LME, we exercise significant control and influence over the basic drivers of our success 8 |
 The integration of our Upstream Business is the cornerstone to our strategy and sustainability – Significant Operating Leverage to LME Integration provides for a more stable cost base relative to non-integrated producers whose margins may be eroded by rising input costs that are correlated to LME Third party sales of excess raw materials (e.g., bauxite and alumina) enhance our leverage to LME – Low Cost & Operating Flexibility Expanded portfolio of opportunities to drive cost out and increase productivity and sales – Secure Supply For our smelter and refinery, we have the ability to provide over 100% of our alumina and bauxite needs Vertically Integrated Upstream Business Primary Aluminum Alumina Noranda Bauxite Mine Noranda Alumina Refinery New Madrid Primary Aluminum Smelter Bauxite Integration drives leverage to LME, secure supply and expanded cost-cutting opportunities 9 |
 New Madrid Smelter Has Returned to Full Operations • At full capacity, New Madrid is 15% of U.S. primary aluminum production (1) • Despite low capacity utilization, 2009 cash cost was $0.77/lb vs. $0.81/lb in 2008 • CRU ranked us near the midpoint of the 2009 global smelter power cost curve • We estimate that, at full production, 2009 cash cost would have been $0.72/lb (2) YTD 2010 cash cost is $0.71/lb We Are Focused on Cost Competitive Power • AmerenUE—Missouri’s largest electric utility provides electricity to New Madrid • New Madrid Contract Terms; Expires in 2020, with renewal options and notice periods; No "Take or Pay" provisions (except 5 MW) • Noranda is its own ratepayer class • Rate History—Proactively managed our rates since the divestiture from Xstrata. Most recent rate case had no impact to Noranda • Rate Outlook—In July 2010, AmerenUE filed a rate case. Time for a rate case to be decided by the MoPSC is eleven months _______________________ (1) CRU Aluminum Quarterly, October 2010 (2) Lost efficiency and fixed cost absorption, impacted our upstream cash cost of primary aluminum for FYE 2009 of $0.77 per pound by an estimated $0.05 per pound (3) Reflects impact of 2009 smelter outage due to January 2009 ice storm. Cost effective New Madrid smelter is leveraged to aluminum prices Production Volume 2006 to 2009 Strategic Drivers Enable Leverage to the LME • Grow production and value-added sales • CORE productivity o Re-launched New Madrid capacity expansion, adding 35 million pounds by 2013 • Drive cost independence from LME o Neither alumina supply nor power contract is tied to the LME price • According to CRU estimates, smelter expected to be in 2nd quartile globally for 2010 10 |
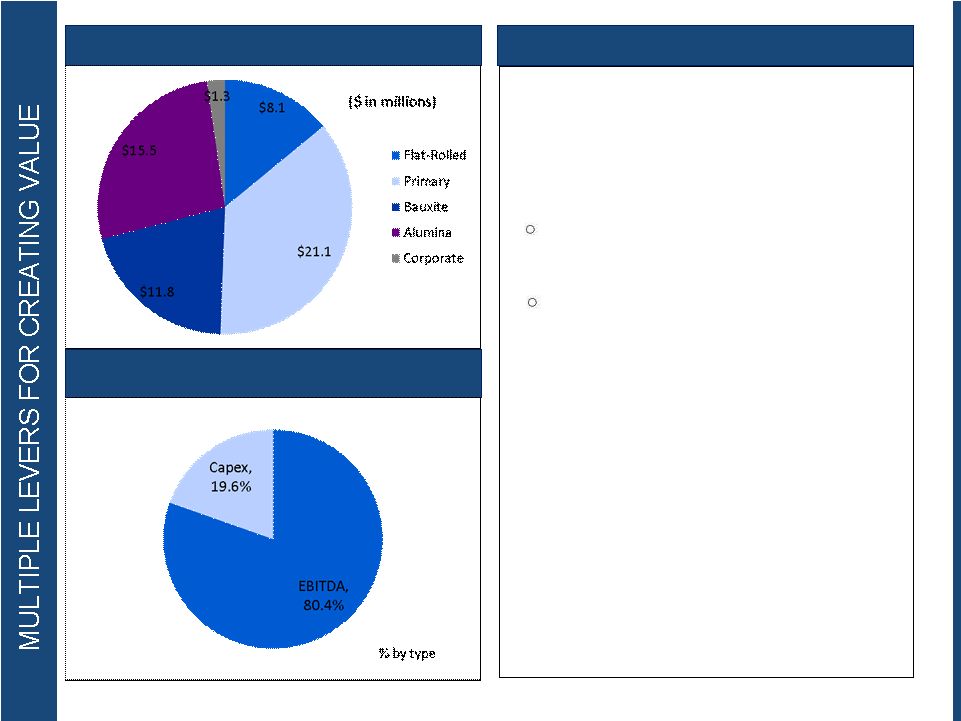
 • Low cost Production o Huntingdon West is the lowest conversion cost foil mill in North America according to CRU o CORE Productivity o Footprint efficiency • Flexibility o Provides more stable source of free cash flow o Maintenance capital expenditures average 25% of EBITDA o Historically, 10-30% of metal consumed by flat rolled products segment is purchased from New Madrid, but inter-company volume can be varied based on market conditions • Focused Growth o Grow with key customers to “Win with Winners” o Increase share of demand in 2009 o Top 10 customers 56% of sales in 2009 • HVAC fin stock • Container • Transformer winding • Foil products • Light gauge sheet Low Cost, Leading – Rolling Mill Operations Four Rolling Mills in Three States Products Huntingdon, TN 2 plants, East and West Started 1967 & 2000 Max. East capacity: 130mm lbs (1) Max. West capacity: 235mm lbs (1) Salisbury, NC Started 1965 Max. Capacity:95mm lbs (1) Newport, AR Started 1951 Max. Capacity: 35mm lbs (1) Downstream Segment is a stable free cash flow generator 11 (1) Maximum capacity, with actual capacity depending upon production mix. |
 YTD 2010 CORE Savings by Location YTD 2010 CORE Savings by Type Strong Record of Productivity 12 • CORE– Noranda’s comprehensive productivity program • Fundamental to our integrated strategy • Plan to generate $140 million of CORE savings during the period from 2009 through 2011 Through September 2010, our results reflect nearly $58 million in CORE productivity savings Cumulative ’09, ’10 total is $101 million • CORE will continue to be a key focus in 2011 as we expect to see inflation, particularly in carbon and caustic soda |
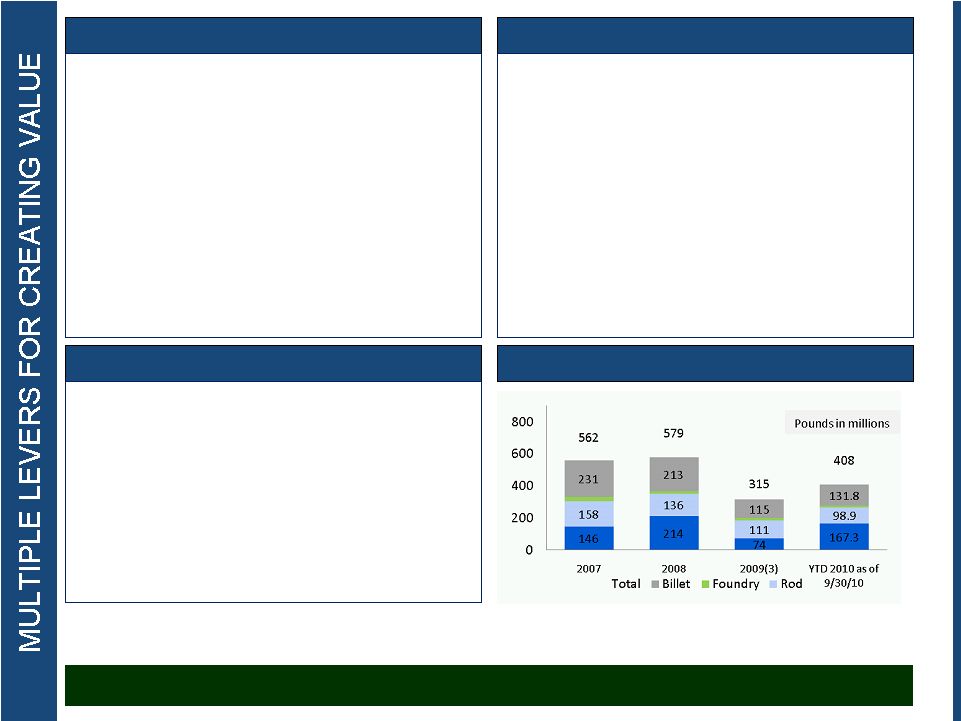
 Track Record of Growth • Noranda has several avenues through which to pursue growth o Capital Investment Invested over $410 million in our assets since 2003 o Debottlenecking Increased primary aluminum production capacity by 37m lbs in 5 years Re-launched New Madrid capacity expansion, adding 35 million pounds by 2013 Will complete St. Ann dredging project in 1Q of 2011 o Increase share of demand During economic downturn, gained share in key upstream (rod) and downstream (foil, finstock) product segments In 2010, gained share in billet o Acquisitions and Acquisition-related growth Purchased and consolidated the bauxite and alumina joint venture Long position in bauxite and alumina allows for commercial sale. Success with major customers Noranda continues to evaluate acquisition based growth opportunities Growth offers new opportunities to leverage a CORE competency – CORE productivity 13 |
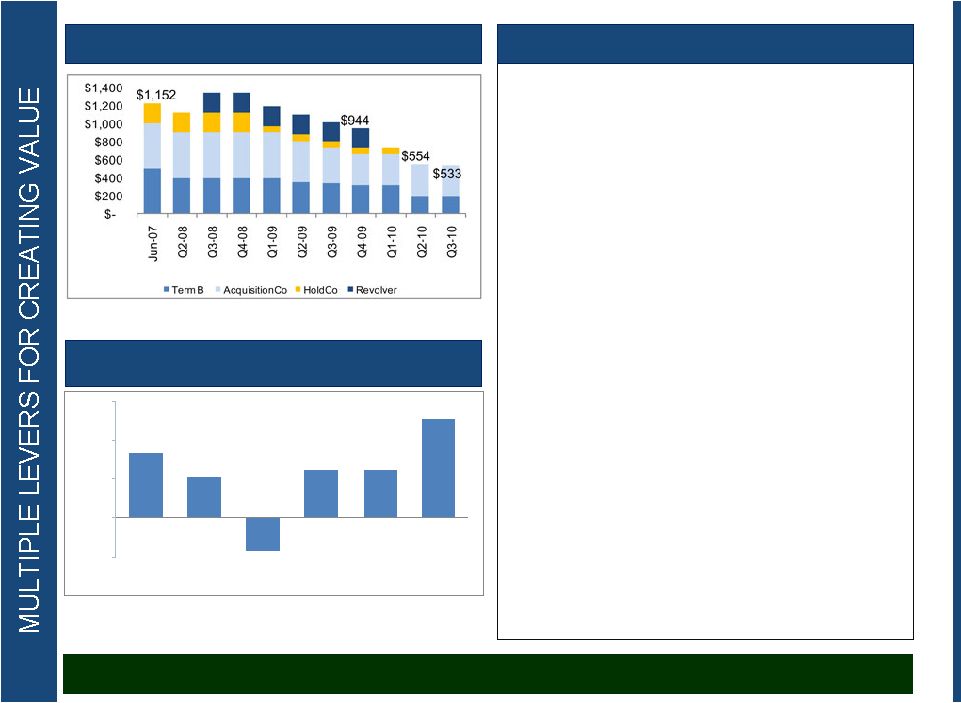 Debt Balances Trend Free Cash Flow Generation • From January 2009 through IPO – Repurchased or repaid $439 million of debt, primarily through proceeds of terminated aluminum hedges • IPO – Used $83 million IPO Proceeds and $96 million from terminating remaining aluminum hedges to purchase or repay $176 million of debt • 3Q-10—Used operating cash flow to repurchase $21 million of debt We Have Deleveraged Substantially Deleveraging is a part of our portfolio of growth and value creation opportunities -$75 $0 $75 $150 $225 2H 07 1H 08 2H 08 1H 09 2H 09 1H 10 14 |
 Post-IPO, we’ve done the right things the right way, and we’ve achieved results 15 |
 Third Quarter Highlights • Noranda produced solid 3Q results… • Reported $25.2 million net income ($0.45 per share, diluted), which includes $16.6 million ($0.29 per share) positive impact from hedge and debt repurchase gains • Business units produced $38.9 million combined segment profit; Adjusted EBITDA was $33.0 million. 3Q reflects a full quarter of seasonal peak power rates • CORE contributed $19.1 million in cost reduction and capital expenditure savings. Year-to-date CORE savings are $57.7 million • Grew share of demand in billet, with 15% 3Q growth and 33% YTD growth • Another quarter of outstanding performance in flat rolled products segment, with $14.4 million of segment profit • ...despite lower LME and seasonal peak power rates • Realized MWTP was $0.99 compared to $1.04 in 2Q-10 • Compared to 2Q-10, $0.77 integrated cash cost reflected seasonal peak power rates, fuel adjustment charge, and lower LME • Production and shipping timing differences in July caused 4% decrease in primary aluminum shipments from 2Q-10 • New Madrid achieved record metal production in September 16 |
 Third Quarter Highlights • We strengthened our balance sheet and preserved liquidity… • Generated $31.0 million of operating cash flow; ending cash balances totaled $33.0 million • No outstanding borrowing on senior revolving credit facility; $215.2 million available capacity • Repurchased $20.6 million AcquisitionCo notes, reducing total debt to $533.1 million • …while addressing key projects • Completed renegotiation of Gramercy labor agreement • Announced capacity expansion projects in New Madrid and Salisbury • Initiated dredging project at St. Ann bauxite mine 17 |
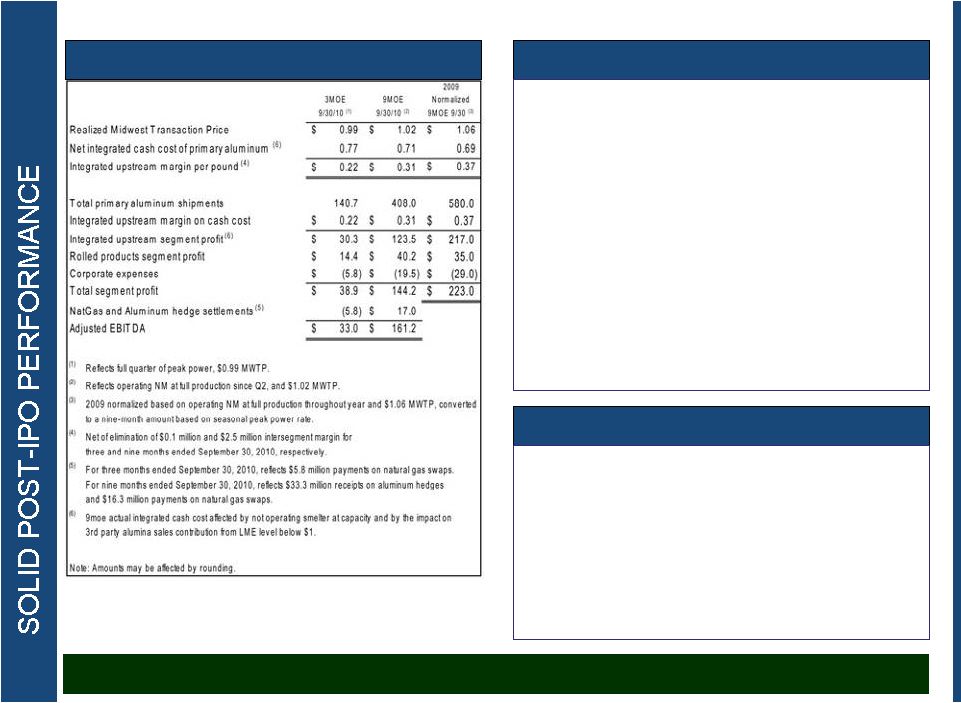 Corporate Overview Upstream Business • Seasonal peak power had $0.11 per pound total impact on cash cost in 3Q, $.08 incremental to 2Q • Record production in New Madrid in September • Billet shipments growth ahead of industry • Re-launched $38 million capital expansion to increase New Madrid capacity by 35 million pounds • Dredging project to be completed during 1Q-11, removing volume constraint and reducing shipping costs Flat Rolled Products Business We see stable demand, at prices sufficient to support value creation • $14.4 million 3Q segment profit reflects continued strong performance in favorable demand environment • Performance driven by improve throughput and by cost savings through CORE program 18 |
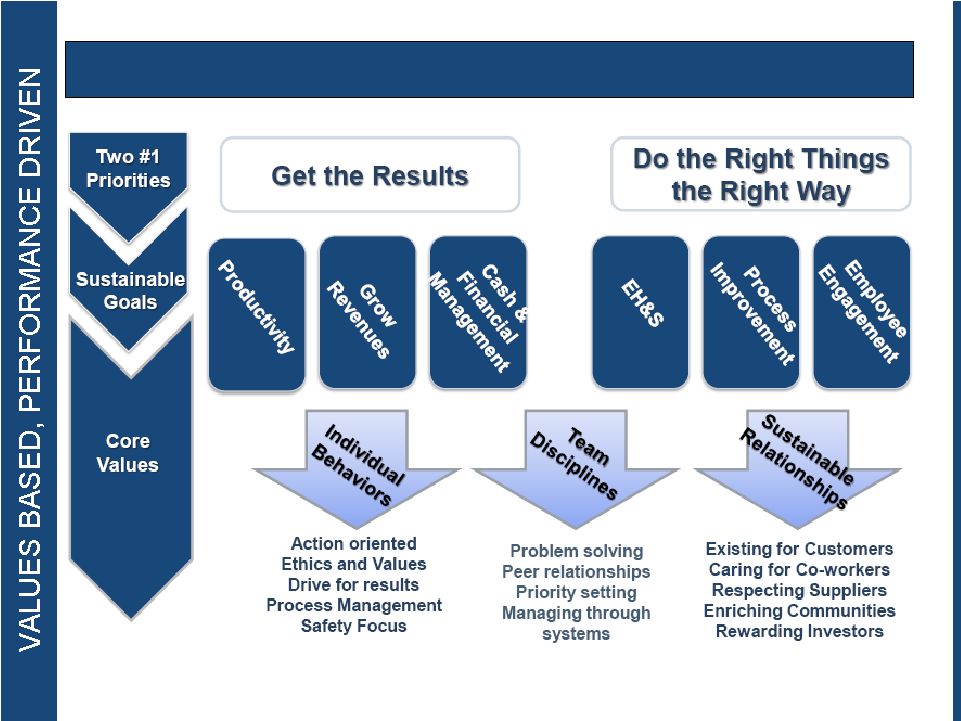
 We have two #1 Priorities: Get the Results, and Do the Right Things the Right Way 19 |
 Noranda Mission 20 |
 Experienced Management Team • Management has created significant shareholder value at Noranda • 13 members of the executive team have an average of more than 21 years of experience in cyclical and commodity industries o Layle “Kip” Smith, President and Chief Executive Officer, has 25 years of leadership experience, including in various management positions with The Dow Chemical Company, as COO of Resolution Performance Products and as CEO of Covalence Specialty Materials o Kyle D. Lorentzen, Chief Operating Officer, has 20 years of experience in cyclical industries, including senior positions at Berry Plastics, Covalence Specialty Materials and Hexion’s Epoxy and Phenolics Division o Robert B. Mahoney, Chief Financial Officer, has over 23 years of cyclical industry experience in senior financial management positions for semiconductor and electrical components companies o Gail E. Lehman, Vice President & General Counsel, has 22 years of corporate law experience, having held senior roles at industrial companies Honeywell, Covalence Specialty Materials and Hawker Beechcraft o Scott Croft, President of Norandal USA, Inc, has 24 years of experience in the rolling mill business o Richard Lapine, Vice President of Sales & Marketing, has over 30 years of experience in Chemicals, Plastics and Automotive segments as a former executive at The Dow Chemical Company o Charles Skoda, Vice President of Operations Support, has 9 years of experience in cyclical industries, including as an executive at Capital One, following a decorated career as an aviator in the U.S. Navy o Remaining executive team members bring strong experience and are experts in their functional areas 21 |
 22 |
 APPENDICES * * * * * |
 Non-GAAP Financial Measures This presentation contains non-GAAP financial measures as defined by SEC rules. We think that these measures are helpful to investors in measuring our financial performance and comparing our performance to our peers. However, our non-GAAP financial measures may not be comparable to similarly titled non-GAAP financial measures used by other companies. These non-GAAP financial measures have limitations as an analytical tool and should not be considered in isolation or as a substitute for GAAP financial measures. To the extent we discuss any non-GAAP financial measures on the earnings call, a reconciliation of each measure to the most directly comparable GAAP measure will be available the presentation slides filed as an Exhibit 99 to our Current Report on Form 8-K furnished to the SEC concurrent with the use of this presentation. Certain covenants contained in our debt instruments, which restrict our ability to take certain actions and determine in part interest rates, we pay under our senior secured credit facilities, use Adjusted EBITDA. Under our debt instruments, “Adjusted EBITDA” means net income before taxes, net interest expense and depreciation and amortization, adjusted to eliminate related party management fees, certain charges resulting from the use of purchase accounting and specified other non-cash items of income or expense. Adjusted EBITDA is not a measure of financial performance under GAAP, and may not be comparable to similarly titled measures used by other companies in our industry. Adjusted EBITDA should not be considered in isolation from or as an alternative to net income, income from continuing operations, operating income or any other performance measures derived in accordance with GAAP. Adjusted EBITDA has limitations as an analytical tool and you should not consider it in isolation or as a substitute for analysis of our results as reported under GAAP. For example, Adjusted EBITDA excludes certain tax payments that may represent a reduction in cash available to us; does not reflect any cash requirements for the assets being depreciated and amortized that may have to be replaced in the future; does not reflect capital cash expenditures, future requirements for capital expenditures or contractual commitments; does not reflect changes in, or cash requirements for, our working capital needs; and does not reflect the significant interest expense, or the cash requirements necessary to service interest or principal payments, on our indebtedness. Adjusted EBITDA also includes incremental stand-alone costs and adds back non-cash hedging gains and losses, and certain other non-cash charges that are deducted in calculating net income. However, these are expenses that may recur, vary greatly and are difficult to predict. In addition, certain of these expenses can represent the reduction of cash that could be used for other corporate purposes. You should not consider our Adjusted EBITDA as an alternative to operating or net income, determined in accordance with GAAP, as an indicator of our operating performance, or as an alternative to cash flows from operating activities, determined in accordance with GAAP, as an indicator of our cash flows or as a measure of liquidity. 24 |
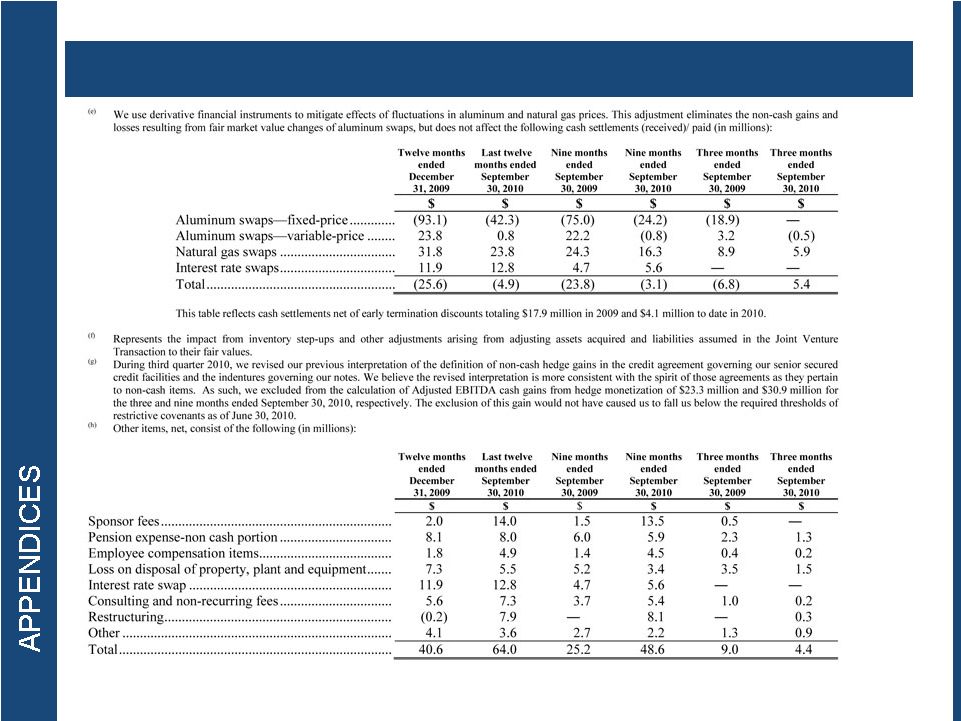
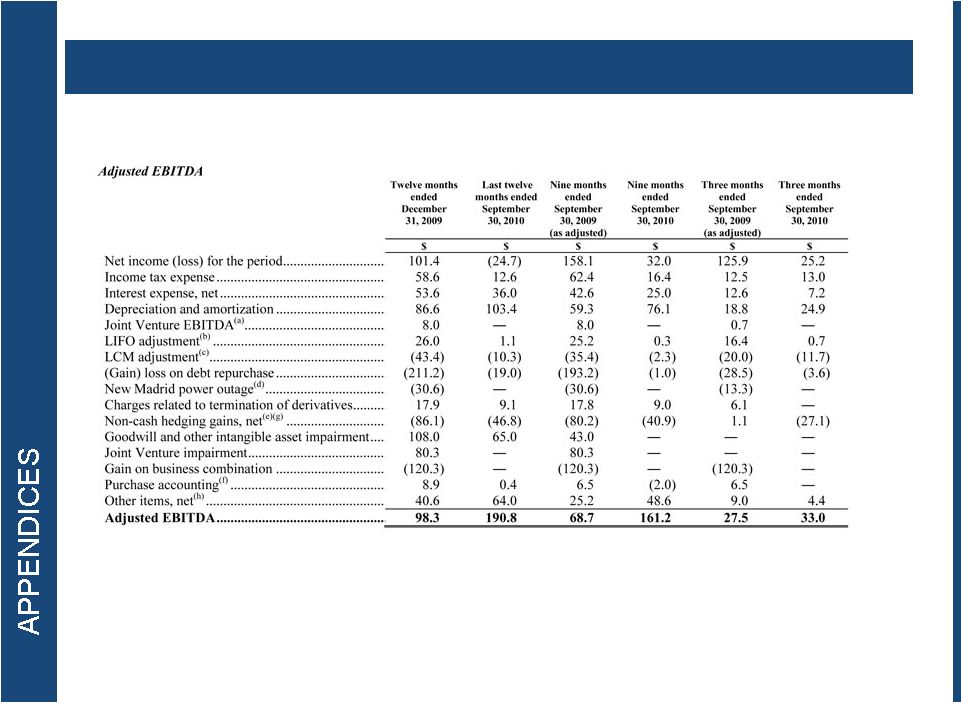 Non-GAAP Measure: Adjusted EBITDA 25 |
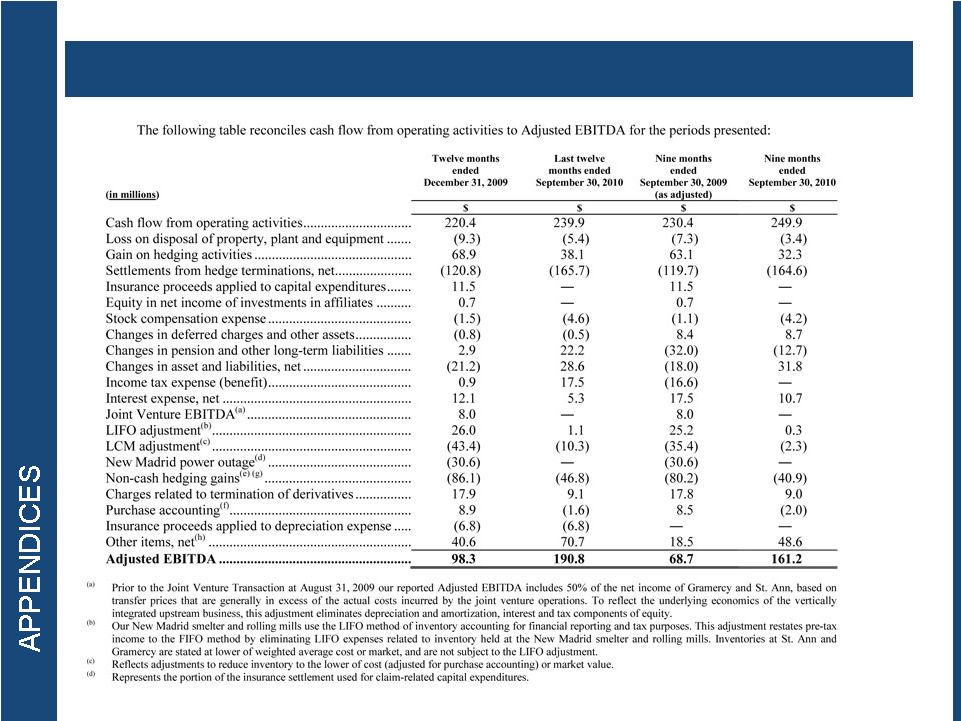 Non-GAAP Measure: Adjusted EBITDA (Cont’d) 26 |
 27 |
 28 |