 APRIL 2014 FS Investment Corporation AN INTRODUCTION TO FSIC PRESENTED BY: Exhibit 99.2 Franklin Square Capital Partners is not affiliated with Franklin Resources/Franklin Templeton Investments or the Franklin Funds. |
 Important Considerations 2 An investment in the common stock of FS Investment Corporation (FSIC, we or us) involves a high degree of risk and may be considered speculative. The following are some of the risks an investment in our common stock involves; however, you should carefully consider all of the information found in the section of our Forms 10-Q and 10-K filings entitled “Risk Factors” and in our other public filings before deciding to invest in shares of our common stock. • An investment strategy focused primarily on privately held companies presents certain challenges, including the lack of available information about these companies. • Investing in middle-market companies involves a number of significant risks, any one of which could have a material adverse effect on our operating results. • A lack of liquidity in certain of our investments may adversely affect our business. • We are subject to financial market risks, including changes in interest rates, which may have a substantial negative impact on our investments. • We have borrowed funds to make investments, which increases the volatility of our investments and may increase the risks of investing in our securities. • We have limited operating history and are subject to the business risks and uncertainties associated with any new business. • Our distributions may be funded from unlimited amounts of offering proceeds or borrowings, which may constitute a return of capital and reduce the amount of capital available to us for investment. This presentation is for informational purposes only and is not an offer to buy or the solicitation of an offer to sell any securities of FSIC. The tender offer will be made only pursuant to an offer to purchase, letter of transmittal and related materials (the Tender Materials) that FSIC intends to distribute to its stockholders and file with the Securities and Exchange Commission (SEC). The full details of the tender offer, including complete instructions on how to tender shares of common stock, will be included in the Tender Materials, which FSIC will distribute to stockholders and file with the SEC upon the commencement of the tender offer. Stockholders are urged to carefully read the Tender Materials when they become available because they will contain important information, including the terms and conditions of the tender offer. Stockholders may obtain free copies of the Tender Materials that FSIC files with the SEC at the SEC’s website at: www.sec.gov or by calling the information agent who will be identified in the Tender Materials. In addition, stockholders may obtain free copies of FSIC’s filings with the SEC from FSIC’s website at: www.fsinvestmentcorp.com or by contacting FSIC at Cira Centre, 2929 Arch Street, Suite 675, Philadelphia, PA 19104 or by phone at (877) 628-8575. |
 Forward-Looking Statements 3 Some of the statements in this presentation constitute forward-looking statements because they relate to future events or the future performance or financial condition of FSIC. The forward-looking statements contained in this presentation may include statements as to: our future operating results; our business prospects and the prospects of our portfolio companies; the impact of the investments that we expect to make; the ability of our portfolio companies to achieve their objectives; our current and expected financings and investments; the adequacy of our cash resources, financing sources and working capital; the timing and amount of cash flows, distributions and dividends, if any, from our portfolio companies; our contractual arrangements and relationships with third parties; actual and potential conflicts of interest with FB Income Advisor, LLC (FB Advisor), FS Investment Advisor, LLC, FS Energy and Power Fund, FSIC II Advisor, LLC, FS Investment Corporation II, GSO / Blackstone Debt Funds Management LLC or any of their respective affiliates; the dependence of our future success on the general economy and its effect on the industries in which we may invest; our use of financial leverage; the ability of FB Advisor to locate suitable investments for us and to monitor and administer our investments; the ability of FB Advisor or its affiliates to attract and retain highly talented professionals; our ability to maintain our qualification as a regulated investment company (RIC) and as a business development company (BDC); the impact on our business of the Dodd-Frank Wall Street Reform and Consumer Protection Act and the rules and regulations issued thereunder; the effect of changes to tax legislation and our tax position; the tax status of the enterprises in which we invest; our ability to complete the listing of our shares of common stock on the New York Stock Exchange LLC (NYSE); our ability to complete the related tender offer; and the price at which shares of our common stock may trade on the NYSE, which may be higher or lower than the purchase price in the tender offer. In addition, words such as “anticipate,” “believe,” “expect” and “intend” indicate a forward-looking statement, although not all forward-looking statements include these words. The forward-looking statements contained in this presentation involve risks and uncertainties. Our actual results could differ materially from those implied or expressed in the forward-looking statements for any reason. Factors that could cause actual results to differ materially include: changes in the economy; risks associated with possible disruption in our operations or the economy generally due to terrorism or natural disasters; and future changes in laws or regulations and conditions in our operating areas. We have based the forward-looking statements included in this presentation on information available to us on the date of this presentation. Except as required by the federal securities laws, we undertake no obligation to revise or update any forward-looking statements, whether as a result of new information, future events or otherwise. You are advised to consult any additional disclosures that we may make directly to stockholders or through reports that we have filed and may file in the future with the Securities and Exchange Commission (SEC), including annual reports on Form 10-K, quarterly reports on Form 10-Q and current reports on Form 8-K. In addition, information related to past performance, while helpful as an evaluative tool, is not necessarily indicative of future results, the achievement of which cannot be assured. Investors should not view the past performance of FSIC, or information about the market, as indicative of FSIC’s future results. Credit ratings may not reflect the potential impact of risks relating to the structure or trading of FSIC’s common stock and are provided solely for informational purposes. Credit ratings are not recommendations to buy, sell or hold any security, and may be revised or withdrawn at any time by the issuing organization in its sole discretion. FSIC does not undertake any obligation to maintain the ratings or to advise of any change in ratings. Each agency’s rating should be evaluated independently of any other agency’s rating. An explanation of the significance of the ratings may be obtained from each of the rating agencies. |
 FSIC Listing Details COMPANY NAME FS Investment Corporation TICKER / EXCHANGE FSIC / NYSE ANTICIPATED TIMING 1 April 16, 2014 USE OF PROCEEDS No new proceeds are being raised LAST REPORTED NET ASSET VALUE PER SHARE (NAV) 2 $10.27 SHARES OUTSTANDING 2 260,351,067 – all shares will be listed CURRENT MONTHLY DISTRIBUTION AMOUNT 3 $0.07425 per share declared in April 2014; 8.68% annualized distribution rate based on last reported NAV ADVISER / SUB-ADVISER Adviser: FB Income Advisor, an affiliate of Franklin Square Capital Partners (Franklin Square) 4 Sub-adviser: GSO / Blackstone Debt Funds Management (GSO / Blackstone), a subsidiary of GSO Capital Partners, the credit platform of The Blackstone Group POST-LISTING TENDER 5 Up to $250 million tender at expected listing FEE STRUCTURE ON LISTING 6 1.75% management fee on assets 20% incentive fee on capital gains, net of all unrealized and realized losses 20% incentive fee on income, subject to an 8% hurdle and a 3-year high water mark POTENTIAL POST-TENDER SHARE PURCHASES 7 Up to $175 million being considered: 4 – $100 million by Franklin Square Holdings – $25 million by management of FSIC and Franklin Square Holdings – $50 million by GSO Capital Partners There can be no assurance FSIC will list in this time frame or at all. As of February 28, 2014. On March 31, 2014, FSIC’s board of directors determined to increase the amount of the regular monthly cash distribution payable to stockholders of record from $0.0720 per share to $0.07425 per share effective as of the regular cash distribution payable for April 2014. Distributions are not guaranteed and are subject to the discretion of the board of directors of FSIC. Franklin Square Holdings, L.P. (Franklin Square Holdings) does business as Franklin Square Capital Partners. Terms of the FSIC tender offer, including size thereof, are subject to the discretion of FSIC’s board of directors. FB Income Advisor has recommended that the investment advisory agreement be amended to (i) reduce the annualized hurdle rate used in connection with the calculation of the subordinated incentive fee on income from 8% to 7.5% and (ii) assuming the reduction to the hurdle rate is approved, reduce the base management fee from 2.0% to 1.75% of the average value of FSIC’s gross assets. Pending board and stockholder approvals of both of these proposals, FB Income Advisor has agreed, effective April 1, 2014, to waive a portion of the base management fee to which it is entitled so that the fee received equals 1.75% of the average value of FSIC’s gross assets. Franklin Square Holdings, members of management of FSIC and Franklin Square Holdings and GSO Capital Partners do not intend to participate in the tender offer. There can be no assurance that Franklin Square Holdings, any member of management of FSIC and Franklin Square Holdings or GSO Capital Partners will purchase any shares. Any such purchases may be conducted in open market transactions (which may include purchases pursuant to 10b5-1 plans), subject to restrictions under applicable law. 1 2 3 4 5 6 7 |
 FS Investment Corporation: A Proven BDC PROVEN MANAGEMENT • Franklin Square: Leading BDC manager with $10 billion in AUM 1 • GSO: Leading alternative credit manager with $65 billion in AUM 2 • Partnership delivers competitive advantage and strong performance PROVEN STRATEGY • Global sourcing and execution capabilities across GSO / Blackstone’s entire platform • Focus on direct lending ($3.1 billion originated since FSIC’s inception) 3 • Invest opportunistically in situations with potential for capital appreciation ($1.1 billion) 4 PROVEN PERFORMANCE • Average annual GAAP return of 16.0% since inception 7 • 8.68% annualized distribution yield based on the last reported NAV 8 • Seven distribution increases since inception 1 Assets under management include FSIC, FS Investment Corporation II (FSIC II) and FS Energy & Power Fund (FSEP) as of December 31, 2013. 2 GSO assets under management as of December 31, 2013. 3 Capital deployed in directly originated portfolio companies from inception to February 28, 2014. 4 Based on fair value as of February 28, 2014. 5 Senior debt includes senior secured loans – first lien, senior secured loans – second lien and senior secured bonds. Based on fair value as of February 28, 2014. 6 Weighted average effective interest rate as of December 31, 2013. 7 Average annual GAAP returns since inception through the quarter ended December 31, 2013. These returns are calculated in accordance with GAAP and equal the NAV per share as of the end of the applicable period, plus cash distributions declared during the relevant period, divided by the NAV per share as of the beginning of the applicable period. These returns represent the return on the fund’s investment portfolio rather than an actual return to stockholders. Past performance is not indicative of future results. 8 On March 31, 2014, FSIC’s board of directors determined to increase the amount of the regular monthly cash distribution payable to stockholders of record from $0.0720 per share to $0.07425 per share effective as of the regular cash distribution payable for April 2014. Distributions are not guaranteed and are subject to the discretion of the board of directors of FSIC. 5 • Fully invested, floating-rate focused (72%) 4 , senior debt portfolio (83%) 5 • Mature leverage profile with low-cost funding (2.8%) 6 and a BBB- rating with a positive outlook from S&P • Strong credit history PROVEN PORTFOLIO |
 Proven Management PROVEN MANAGEMENT • Franklin Square: Leading BDC manager with $10 billion in AUM 1 • GSO: Leading alternative credit manager with $65 billion in AUM 2 • Partnership delivers competitive advantage and strong performance PROVEN STRATEGY PROVEN PERFORMANCE 1 Assets under management include FSIC, FSIC II and FSEP as of December 31, 2013. 2 GSO assets under management as of December 31, 2013. 6 PROVEN PORTFOLIO |
 • LEADING MANAGER OF ALTERNATIVE INVESTMENTS • LEADING FRANCHISES in credit, private equity, real estate, hedge fund solutions and financial advisory • BRAND AND SCALE provides exceptional access • BLACKSTONE’S GROUP PURCHASING ORGANIZATION available to FSIC portfolio companies • LEADING MANAGER OF ALTERNATIVE CREDIT focused on non-investment grade corporate debt • GLOBAL PRESENCE with over 250 employees 2 • INVESTMENTS IN MORE THAN 1,100 corporate credits 2 • $17.9 BILLION in directly originated transactions 2 • LARGEST MANAGER OF BDCs 1 • 60 BDC PROFESSIONALS 2 • SCALE allows for one-stop financing solutions and low cost structure • 310 PORTFOLIO COMPANIES across entire BDC platform 3 Platform Provides a Competitive Advantage SCALE BRAND INVESTMENT EXPERTISE COMPETITIVE ADVANTAGE 1 Based on total balance sheet assets as of December 31, 2013. Includes the assets of FSIC, FSIC II and FSEP. 2 As of December 31, 2013. 3 Includes portfolio companies of FSIC, FSIC II and FSEP as of December 31, 2013. 7 |
 Franklin Square and GSO: Five Years of Successful Collaboration The sub-adviser Identifies and originates investments Diligences and recommends investments to the adviser Monitors and manages credit aspects of investments Provides trade execution, settlement and back-office support DUAL LEVEL RISK MANAGEMENT SPECIALIZATION IN AREAS OF EXPERTISE The adviser Directs all fund activities Establishes investment guidelines Reviews, approves and monitors all investments Monitors the performance of the sub-adviser Reports directly to the FSIC board 8 |
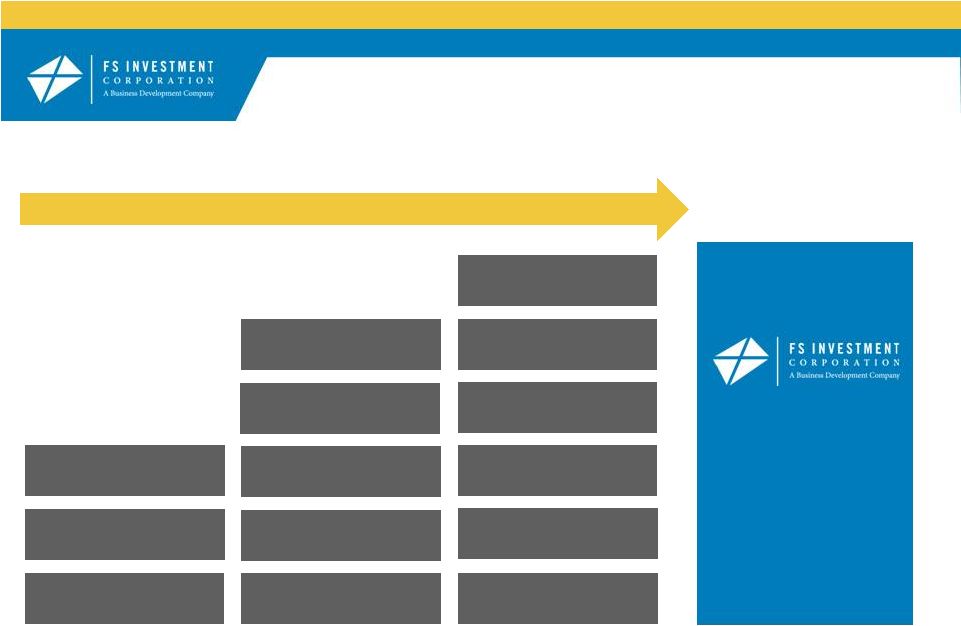
 Adviser/Sub-Adviser Structure Creates Accountability SYSTEM OF CHECKS AND BALANCES FOR OPTIMAL EXECUTION OF INVESTMENT STRATEGY AND GOVERNANCE FRANKLIN SQUARE’S ROLE AS ADVISER: • Responsible for making all investment decisions based on recommendations from the sub-adviser • Directly accountable to the board of directors • Provides oversight and direction to the sub-adviser – Pipeline Reports – Watch Lists – Portfolio concentrations and diversification – Management reporting – Portfolio compliance testing (BDC and RIC) • Oversees and manages all aspects and activities of FSIC – SEC reporting – Valuation and NAV calculation – Budgeting and cash management – Compliance – Transfer agent – Financial reporting and controls 9 Board of Directors • Approves the investment advisory and sub- advisory agreements annually Franklin Square • Registered investment adviser • Manages all aspects of the fund • Monitors sub-adviser to meet investment objectives GSO / Blackstone • Registered investment adviser • Identifies and originates investments • Monitors and manages credit aspects of investments |
 Adviser/Sub-Adviser Structure Creates Dual Levels of Risk Management INVESTMENT APPROVAL PROCESS • Franklin Square and GSO / Blackstone separately review and approve investments at each stage of the underwriting process • Typically, an investment is rejected in Stage 1 or Stage 2 as most issues are generally surfaced early in the process • The process for broadly syndicated investments is usually abbreviated, depending on the situation and risk profile 10 • GSO / Blackstone sources opportunities and conducts preliminary due diligence • GSO / Blackstone provides Franklin Square an investment overview and recommendation to dedicate additional resources for due diligence • GSO / Blackstone continues due diligence and prepares a “Head’s Up” memo • Members of Franklin Square investment, finance and legal teams work with GSO / Blackstone to determine the optimal structure • GSO / Blackstone’s Investment Committee reviews the investment. If unanimously approved, GSO / Blackstone sends its recommendation and a credit approval memo to Franklin Square • Franklin Square’s Investment Committee reviews all materials and makes a final investment decision Stage 1: Sourcing Stage 2: Diligence Stage 3: Final Approval |
 Franklin Square: An Overview MANAGER OF THREE OF THE LARGEST BDCs $10 billion IN ASSETS UNDER MANAGEMENT Largest BDC manager IN THE WORLD Over 170 employees 60 BDC PROFESSIONALS Over 125,000 INVESTORS • Leading manager of business development companies • Commitment to transparency and best practices • Investor-friendly incentive fee structure for FSIC • Meaningful and ongoing sponsor commitment to all managed funds 1 Based on total balance sheet assets as of December 31, 2013. Total balance sheet assets include the assets of FSIC, FSIC II and FSEP. 11 1 1 1 |
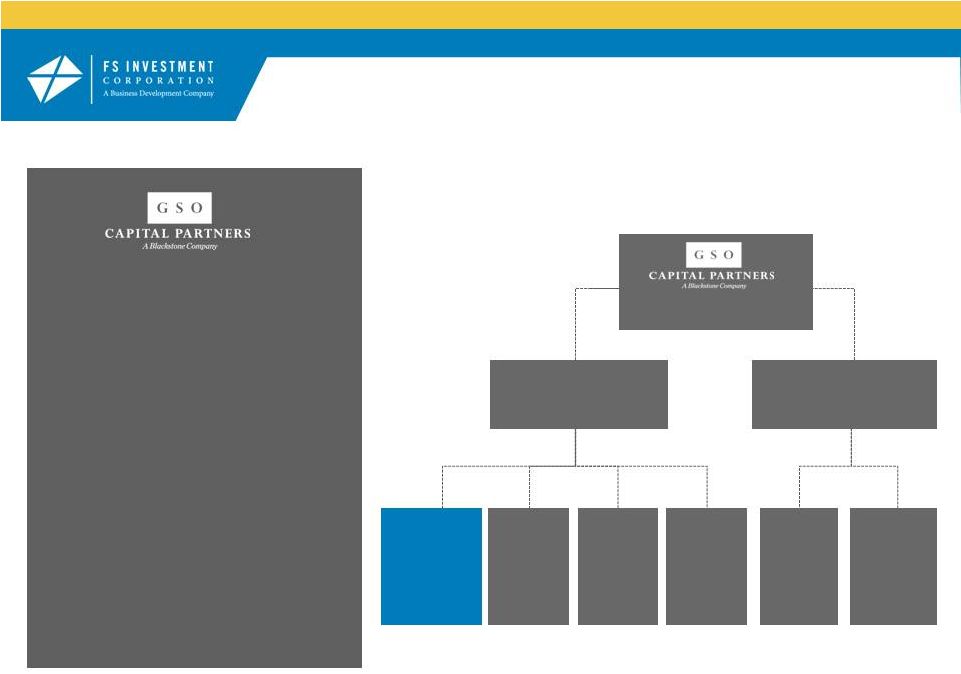 GSO Capital Partners: An Overview $65 BILLION IN ASSETS, MANAGED PRIMARILY ON BEHALF OF INSTITUTIONAL INVESTORS, WITH A FOCUS ON BELOW INVESTMENT GRADE CREDIT 1 12 Alternative Investment Funds $33.9 billion AUM Customized Credit Strategies – Long Only $31.0 billion AUM $65.0 billion AUM Rescue Lending $9.4bn Mezzanine Fund $7.9bn Event Driven Credit $6.4bn CLOs $20.5bn Listed and Commingled Funds, SMAs $10.5bn FRANKLIN SQUARE BDCs $10.2bn AUM 1 GSO assets under management, employee and investment figures as of December 31, 2013. Credit platform of The Blackstone Group ONE OF THE LARGEST ALTERNATIVE ASSET MANAGERS IN THE WORLD Over 250 employees LOCATED IN NEW YORK, HOUSTON, LONDON AND DUBLIN Over 100 investment professionals 60+ FOCUSED ON ORIGINATIONS 25+ DEDICATED FULL TIME TO BDCs (LARGEST FUND TEAM AT GSO / BLACKSTONE) Over 1,100 investments IN CORPORATE CREDITS |
 Proven Strategy • Global sourcing and execution capabilities across GSO / Blackstone’s entire platform • Focus on direct lending ($3.1 billion originated since FSIC’s inception) 1 • Invest opportunistically in situations with potential for capital appreciation ($1.1 billion) 2 13 PROVEN MANAGEMENT PROVEN STRATEGY PROVEN PORTFOLIO PROVEN PERFORMANCE Capital deployed in directly originated portfolio companies from inception to February 28, 2014. Opportunistic investments based on fair value as of February 28, 2014. 1 2 |
 GSO / Blackstone Resources Available to Help Maximize Returns for FSIC Investors 14 PLATFORM INVESTMENT EXPERTISE Direct Originations Global Leveraged Finance Event Driven Credit Rescue Lending Mezzanine Structured Credit (CLO) Investments in over 1,100 corporate credits Access to Blackstone’s intellectual libraries Access to Blackstone’s Group Purchasing Organization PEOPLE 250+ GSO employees 100+ investment professionals 60+ professionals focused on originations 47 industry specialists 6 traders PERFORMANCE 16.0% average annual GAAP return since FSIC’s inception 1 Average annual GAAP return since FSIC’s inception through the quarter ended December 31, 2013. These returns are calculated in accordance with GAAP and equal the NAV per share as of the end of the applicable period, plus cash distributions declared during the relevant period, divided by the NAV per share as of the beginning of the applicable period. These returns represent the return on the fund’s investment portfolio rather than an actual return to stockholders. Past performance is not indicative of future results. 1 |
 DIRECT ORIGINATIONS Investment Portfolio by Strategy 81% CORE INVESTMENT STRATEGIES 19% BROADLY SYNDICATED 15 OPPORTUNISTIC • Average originated loan commitment for the year ended 12/31/2013: $55.7 million • Average EBITDA of portfolio companies 1 : $39.0 million • Average leverage through tranche 1 : 4.1x • Annualized yield 2 : 10.0% • Examples: – Safariland – Audio Visual Services – American Energy – CoSentry – Klune • Market price inefficiencies where the market price is lower than the value determined by our fundamental analysis • Opportunities may include event driven investments, anchor orders and CLOs • Annualized yield 2 : 11.3% • Source of liquidity to be used to fund future core investments • Potential source for direct origination deal flow • Annualized yield 2 : 9.4% • Examples: – McGraw-Hill Global Education – Smile Brands – Totes Isotoner • Examples: – Eastman Kodak – Sorenson Communications – ERC Ireland – Caesars Entertainment Resort Properties $3.1 BILLION OF CAPITAL DEPLOYED IN DIRECT ORIGINATIONS SINCE INCEPTION ACROSS 51 PORTFOLIO COMPANIES 3 1 As of February 28, 2014. 2 Gross portfolio yield prior to leverage (based on amortized cost) – excluding non-income producing assets as of February 28, 2014. 3 Capital deployed in directly originated portfolio companies from inception to February 28, 2014. |
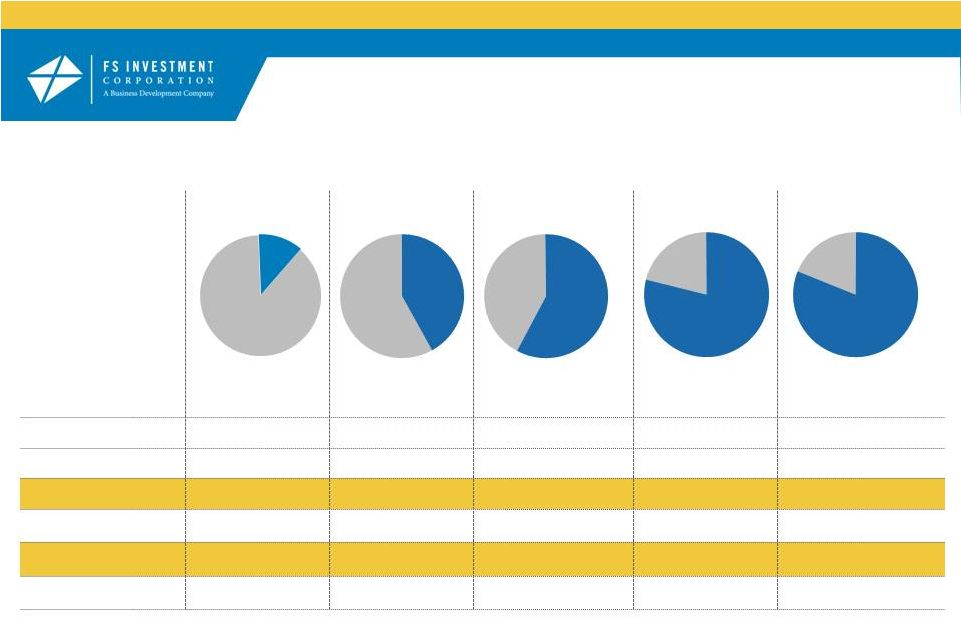 Portfolio Transition Has Delivered Higher Investment Yields and Higher Distributions to Investors CORE INVESTMENT STRATEGIES AS % OF PORTFOLIO 1 2010 2011 2012 2013 1 Core investment strategies include investments classified as Directly Originated and Opportunistic as of December 31, 2010, 2011, 2012 and 2013, respectively, and February 28, 2014. 2 Yield spread is the difference between FSIC's gross annualized portfolio yield prior to leverage as disclosed in the company’s quarterly SEC filings and the Credit Suisse Leveraged Loan Index yield to a 3-year life. FSIC yield spread based on fair value as of December 31, 2010, 2011, 2012 and 2013, respectively, and February 28, 2014. The data regarding the Credit Suisse Leveraged Loan Index is for illustrative purposes only and is not indicative of any investment. An investment cannot be made directly in an index. 3 On March 31, 2014, FSIC’s board of directors determined to increase the amount of the regular monthly cash distribution payable to stockholders of record from $0.0720 per share to $0.07425 per share effective as of the regular cash distribution payable for April 2014. Distributions are not guaranteed and are subject to the discretion of the board of directors of FSIC. 4 Percentage increase in per share regular cash distributions during respective calendar year. 5 Based on fair value as of the relevant period end. 12% 42% 58% 79% FSIC unlevered portfolio yield 2 8.5% 10.4% 10.4% 10.1% 10.1% Credit Suisse Leveraged Loan Index Yield, 3-year life 6.6% 7.3% 5.9% 5.3% 5.1% FSIC Spread Over Syndicated Index 2 190 bps 310 bps 450 bps 480 bps 500 bps Monthly Distribution Amount per share 3 $0.064312 $0.067188 $0.0675 $0.072 $0.07425 Annualized Increase in Distributions 4 +4.47% +0.46% +6.67% +3.13% % Senior Secured of Total Portfolio 5 89% 83% 81% 82% 83% 16 81% FEBRUARY 28, 2014 |
 GSO / Blackstone Has Long-Standing Relationships with Private Equity Sponsors and Corporate Clients GSO / BLACKSTONE’S SELECT NETWORK OF CLIENTS PROVIDES SIGNIFICANT SOURCING OPPORTUNITIES AEA Investors Access Capital Advisors AIG Highstar Altamont Amaya Gaming Group American Capital Apex Ares Areva Audax Group Avista Axa Private Equity Bain Capital Beecken Petty O’Keefe Behrman Capital Blackstone Bruckman, Rosser, Sherrill Carlyle CD&R Cerberus Charlesbank Capital Partners Chesapeake CHS Capital CIVC and Management Clarion Clayton Dubilier & Rice Clearlake Capital Crestview Partners CVC Capital Partners Cypress Group Diamond Castle DLJ Merchant Banking Dunes Point EIG First Atlantic Genstar Golden Gate Capital Goldman Sachs Goldner Hawn Johnson Morrison Gordon Brothers Gores Capital Graham Partners Harvest Partners Hellman & Friedman Insight Equity Investcorp Jeff Gural JLL Partners Jupiter Partners Kanders Kolhberg Kravis Roberts Leonard Green & Partners Lincolnshire Lion Capital LS Power Mid Europa Partners Monitor Clipper Partners Morgan Stanley NANA Regional Corp. Natural Gas Partners Nautic Partners NBC Nova Capital Management Oak Hill Odyssey Investment Partners Parthenon Capital Permira Plain Exploration Platinum Equity Quicksilver Resources Ripplewood Riverstone Rockland Capital Sequel Holdings Siris Capital Snow, Phipps Group Sony / ATV Southfield Capital SPC Partners Starwood Capital Stephens Capital Partners Summit Partners TA Associates Tailwind Capital Tenaska Power Fund Thomas Lee TPG Triangle Management Vance Street Vector Vestar Capital Victor Homes Warburg Pincus Wellspring 17 |
 Proven Portfolio PROVEN MANAGEMENT PROVEN STRATEGY PROVEN PERFORMANCE 18 • Fully invested, floating-rate focused (72%) 1 , senior debt portfolio (83%) 2 PROVEN PORTFOLIO • Mature leverage profile with low-cost funding (2.8%) 3 and a BBB- rating with a positive outlook from S&P • Strong credit history 1 Based on fair value as of February 28, 2014. 2 Senior debt includes senior secured loans – first lien, senior secured loans – second lien and senior secured bonds. Based on fair value as of February 28, 2014. 3 Weighted average effective interest rate as of December 31, 2013. |
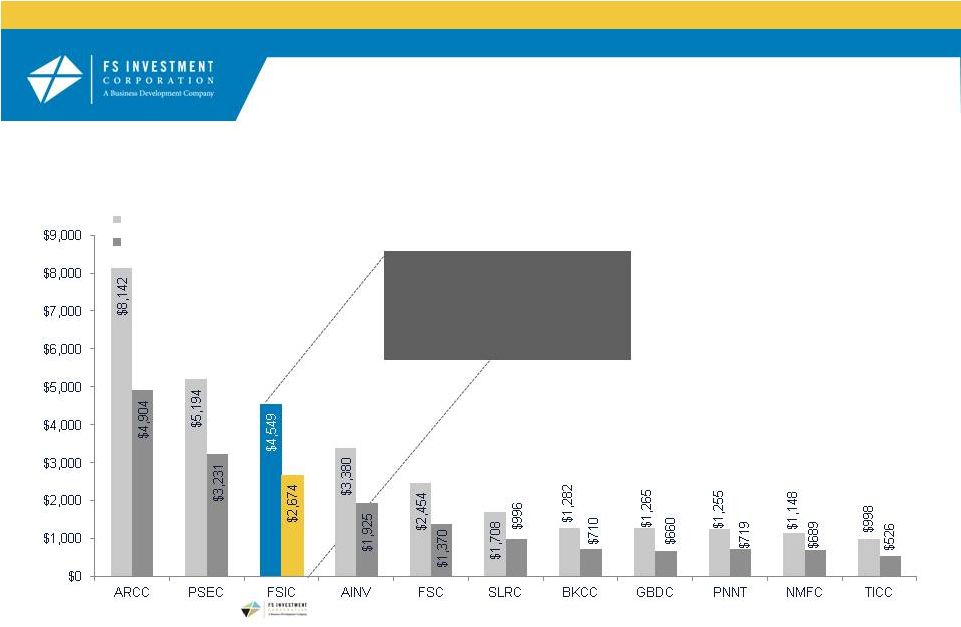 FSIC’s Size Makes It an Immediately Relevant BDC TOTAL ASSETS AND BOOK EQUITY OF SELECT BDCs 1 19 3rd largest EXTERNALLY MANAGED BDC Total assets and book equity of the ten largest externally managed BDCs by total assets. ARCC: Ares Capital Corporation; PSEC: Prospect Capital Corporation; FSIC: FS Investment Corporation; AINV: Apollo Investment Corporation; FSC: Fifth Street Finance Corp.; SLRC: Solar Capital Ltd.; BKCC: BlackRock Kelso Capital Corp.; GBDC: Golub Capital BDC, Inc.; PNNT: PennantPark Investment Corporation; NMFC: New Mountain Finance Corporation; TICC: TICC Capital Corp. Total assets and book equity shown for FSIC in millions as of February 28, 2014. Total assets and book equity shown for ARCC, PSEC, AINV, FSC, SLRC, BKCC, GBDC, PNNT, NMFC and TICC in millions as of December 31, 2013. 1 2 Total Assets (in millions) 2 Total Book Equity (in millions) 2 |
 DIVERSIFIED ACROSS 20 INDUSTRIES 3 Floating-Rate, Senior Debt Focused Portfolio FULLY-RAMPED PORTFOLIO HISTORY OF DOWNSIDE PROTECTION ASSET CLASS 2/28/2014 12/31/2013 Senior Secured Loans — First Lien 51% 51% Senior Secured Loans — Second Lien 22% 22% Senior Secured Bonds 10% 9% Subordinated Debt 10% 10% Collateralized Securities 3% 4% Equity/Other 4% 4% TOP 5 INDUSTRIES, BASED ON FAIR VALUE Capital Goods 21% Energy 11% Consumer Services 11% Software & Services 9% Commercial & Professional Services 8% INVESTMENT PORTFOLIO 20 159 PORTFOLIO COMPANIES 1 10.1% UNLEVERED PORTFOLIO YIELD 2 72% OF INVESTMENTS PAY FLOATING INTEREST RATES 1 0% OF INVESTMENTS ON NON-ACCRUAL 1 $203 million OF CUMULATIVE GAINS IN EXCESS OF CUMULATIVE LOSSES 4 91% OF INVESTMENTS PERFORMING BETTER OR ACCORDING TO PLAN 5 1 As of February 28, 2014. 2 Gross portfolio yield prior to leverage based on amortized cost as of February 28, 2014. 3 As of December 31, 2013. 4 Cumulative realized and unrealized gains less cumulative realized and unrealized losses, excluding gains and losses associated with a total return swap and foreign exchange transactions, since inception through December 31, 2013. 5 Based on FB Income Advisor’s investment rating system. As of December 31, 2013, 12% of investments at fair value were exceeding expectations, 79% of investments were performing according to plan, 8% of investments required closer monitoring, 1% of investments were underperforming with some loss of interest or dividend possible and 0% of investments were underperforming with expected loss of interest and some principal. For more information on FB Income Advisor’s investment rating system, please refer to FSIC’s SEC filings. |
 Low Cost of Leverage Allows for Focus on Senior Debt FACILITIES AS OF FEBRUARY 28, 2014 TYPE OF FACILITY RATE FACILITY AMOUNT MATURITY DATE (in thousands) Citibank Credit Facility Revolving L + 1.75% $550,000 August 29, 2015 Deutsche Bank Credit Facility Revolving L + 1.50% $125,000 December 20, 2014 J.P. Morgan Facility Repurchase 3.25% $950,000 April 15, 2017 Wells Fargo Credit Facility 1 Revolving L + 1.50% to 2.50% $300,000 May 17, 2017 Total debt outstanding under debt facilities $1,688,482 Debt/equity ratio 63.1% % of debt outstanding at fixed interest rates 56.3% % of debt outstanding at variable interest rates 43.7% Gross annualized portfolio yield prior to leverage 2 10.1% Weighted average effective interest rate 3 2.8% Net interest margin 730 bps 21 CREDIT PROFILE • On March 28, 2014, FSIC received a BBB- rating with a positive outlook from S&P • 56.3% of debt outstanding as of February 28, 2014 was at a fixed interest rate of 3.25% 1 On March 11, 2014, FSIC entered into an amendment to the Wells Fargo Credit Facility. The amendment increased the maximum commitments under the credit facility from $250 million to $300 million and decreased from 2.75% to 2.50% the applicable spread above LIBOR that is payable on the portion of outstanding advances under the credit facility attributable to “Traditional Middle Market Loans,” “Fixed Rate Loans” and “Second Lien Loans,” in each case as defined in the credit facility. No other material terms of the credit facility changed in connection with the amendment. 2 Gross portfolio yield prior to leverage based on amortized cost as of February 28, 2014. 3 Weighted average effective interest rate as of December 31, 2013. |
 Proven Performance PROVEN MANAGEMENT PROVEN STRATEGY PROVEN PERFORMANCE • Average annual GAAP return of 16.0% since inception 1 • 8.68% annualized distribution yield based on the last reported NAV 2 • Seven distribution increases since inception 22 PROVEN PORTFOLIO 1 2 Average annual GAAP returns since inception through the quarter ended December 31, 2013. These returns are calculated in accordance with GAAP and equal the NAV per share as of the end of the applicable period, plus cash distributions declared during the relevant period, divided by the NAV per share as of the beginning of the applicable period. These returns represent the return on the fund’s investment portfolio rather than an actual return to stockholders. Past performance is not indicative of future results. On March 31, 2014, FSIC’s board of directors determined to increase the amount of the regular monthly cash distribution payable to stockholders of record from $0.0720 per share to $0.07425 per share effective as of the regular cash distribution payable for April 2014. Distributions are not guaranteed and are subject to the discretion of the board of directors of FSIC. |
 FSIC’s Performance Compares Favorably to Its Peers TOTAL RETURN COMPARISON OF FSIC TO PUBLIC BDC PEERS • FSIC has generated a 16.0% average annual GAAP return since inception 1 • FSIC has been able to achieve market leading returns while maintaining a focus on senior debt (83% of investments) by consistently generating realized gains in the portfolio (cumulative gains exceed cumulative losses since inception by $203 million 2 ) TOTAL RETURN SINCE 2009 % OF SECURED DEBT 3 ARES CAPITAL CORPORATION 19.6% 85% 4 FS INVESTMENT CORPORATION 16.0% 83% BLACKROCK KELSO CAPITAL CORPORATION 12.2% 62% PENNANTPARK INVESTMENT CORPORATION 11.6% 60% APOLLO INVESTMENT CORPORATION 8.2% 51% FIFTH STREET FINANCE CORP. 7.4% 81% PROSPECT CAPITAL CORPORATION 7.0% 75% AVERAGE OF COMPETITORS (EXCLUDES FSIC) 11.0% 69% 23 1 2 3 4 Returns shown are GAAP returns, which are calculated by adding NAV per share as of the end of the applicable period, plus cash distributions declared during the relevant period, and dividing the total by NAV per share as of the beginning of the applicable period. The total return represents the total return on an investment portfolio during the applicable period and does not represent an actual return to stockholders. GAAP returns shown are from FSIC inception on January 2, 2009 through December 31, 2013. Based on public filings. Past performance is not indicative of future results. Cumulative realized and unrealized gains less cumulative realized and unrealized losses, excluding gains and losses associated with a total return swap and foreign exchange transactions, since inception through December 31, 2013. Percentage of secured debt for FSIC based on fair value as of February 28, 2014. Percentage of secured debt for Ares Capital Corporation, BlackRock Kelso Capital Corporation, PennantPark Investment Corporation, Apollo Investment Corporation, Fifth Street Finance Corp. and Prospect Capital Corporation based on fair value as of December 31, 2013. Secured debt consists of first lien senior secured loans, second lien senior secured loans and senior secured bonds. Based on public filings. Ares Capital Corporation secured debt percentage includes subordinated certificates of the Senior Secured Loan Fund LLC (“SSLP”). Excluding SSLP subordinated certificates, Ares’s secured debt percentage based on fair value is 62%. |
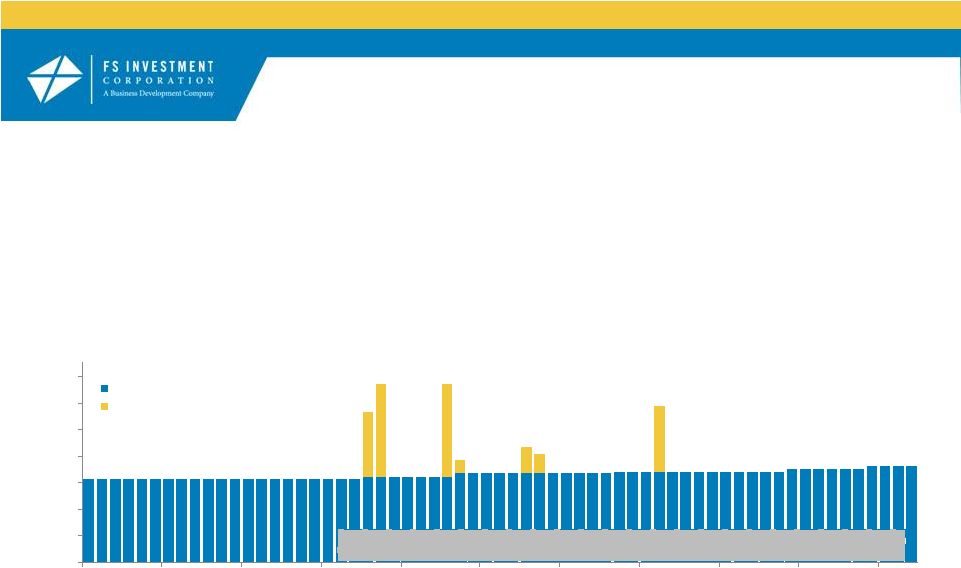 $0.05 $0.07 $0.07 $0.01 $0.02 $0.015 $0.05 $0.00 $0.02 $0.04 $0.06 $0.08 $0.10 $0.12 $0.14 Jan-09 Jul-09 Jan-10 Jul-10 Jan-11 Jul-11 Jan-12 Jul-12 Jan-13 Jul-13 Jan-14 Regular cash distributions per share Special cash distributions per share Consistent Distributions with a History of Growth FSIC DISTRIBUTION HISTORY 1 • Since inception, FSIC investors have received: - 9 special cash distributions 2 (with intent to declare 2 additional special cash distributions) 3 - 8 special stock distributions - 7 regular cash distribution increases 4 • All distributions have been paid from net investment income and/or capital gains • Last declared a monthly distribution of $0.07425 per share 4 ; 8.68% annualized distribution yield based on last reported NAV • As of December 31, 2013, FSIC had approximately $0.53 per share of undistributed net investment income and realized capital gains - On March 31, 2014, FSIC’s board of directors expressed its intent to declare two $0.10 per share special cash distributions 3 24 $4.28 CUMULATIVE CASH DISTRIBUTIONS PER SHARE SINCE INCEPTION 5 1 Distributions are not guaranteed and are subject to the discretion of FSIC’s board of directors. 2 The months of April 2010 and October 2011 each included two declared special cash distributions. 3 On March 31, 2014, FSIC’s board of directors expressed its intent to declare two special cash distributions, each in the amount of $0.10 per share, that will be paid on August 15, 2014 and November 14, 2014 to stockholders of record as of July 31, 2014 and October 31, 2014, respectively. 4 On March 31, 2014, FSIC’s board of directors determined to increase the amount of the regular monthly cash distribution payable to stockholders of record from $0.0720 per share to $0.07425 per share effective as of the regular cash distribution payable for April 2014. Distributions are not guaranteed and are subject to the discretion of the board of directors of FSIC. 5 Cumulative distributions per share since FSIC inception through March 3, 2014. Assumes an investor participated in the distribution reinvestment plan and includes all regular cash distributions and special cash distributions and is adjusted for special stock distributions. |
 Opportunities for Future Growth 25 STRONG DISTRIBUTION COVERAGE • Currently distribute $0.22 per share per quarter ($0.07425 per month) versus Q4 2013 adjusted NII per share of $0.24 • Distributions covered 100% from adjusted net investment income in 2013 • FSIC has accumulated $0.53 per share of undistributed NII and realized capital gains on a tax basis OPTIMIZE USE OF NON-QUALIFIED ASSETS • 16% of FSIC’s investments are classified as non-qualified assets, well below the regulatory limit (30%) • Excess capacity gives flexibility to pursue quality growth investment opportunities across the entire investment universe, not simply those that are qualified BDC assets • Non-U.S. based opportunities are one area of potential interest given GSO’s position as a leading non-bank lender in Europe CONTINUED MIGRATION INTO CORE STRATEGIES • Future core investments are expected to be funded from the monetization of syndicated investments (19% at fair value) • Transition to core strategies expected to allow portfolio yield to grow without need for additional debt or new equity ACCESS TO GSO’S GLOBAL PLATFORM • GSO / Blackstone’s investment expertise, people and platform bring unique investment opportunities to FSIC • Access to Blackstone’s Group Purchasing Organization program is a competitive advantage in winning new business • Opportunistic investments ($1.1 billion at fair value) have meaningfully higher yields (11.3%) and potential for capital appreciation • Equity co-investment opportunities ($180 million at fair value) can lead to further NAV appreciation 2 1 3 3 3 4 1 Adjusted net investment income is the net per share increase (decrease) in net investment income excluding the capital gains incentive fee attributable to unrealized gains and excise taxes. 2 As of December 31, 2013. On March 31, 2014, FSIC’s board of directors expressed its intent to declare two special cash distributions, each in the amount of $0.10 per share, that will be paid on August 15, 2014 and November 14, 2014 to stockholders of record as of July 31, 2014 and October 31, 2014, respectively. 3 As of February 28, 2014. 4 As of December 31, 2013. |
 FSIC's Value Proposition PROVEN STRATEGY PROVEN PORTFOLIO PROVEN PERFORMANCE 110% cumulative total return 2 8.68% annualized distribution rate 1 16.0% average annual GAAP return 2 • Fully invested, floating-rate focused, senior debt portfolio • Mature leverage profile with low cost funding • Strong credit history • Global sourcing and execution capabilities across GSO / Blackstone platform • Focus on direct lending • Invest opportunistically in situations with potential for capital appreciation PROVEN MANAGEMENT 1 Based on FSIC’s last reported NAV per share of $10.27 and FSIC’s monthly distribution amount of $0.07425 per share. Distributions are not guaranteed and are subject to the discretion of FSIC’s board of directors. 2 Cumulative and average annual GAAP returns since inception through the quarter ended December 31, 2013. These returns are calculated in accordance with GAAP using NAV performance and cash distributions declared during the relevant period and represent the return on the fund’s investment portfolio rather than an actual return to stockholders. Past performance is not indicative of future results. 26 |
 Appendix – MANAGEMENT TEAM BIOGRAPHIES |
 Franklin Square Capital Partners Executives MICHAEL C. FORMAN CHAIRMAN & CEO FS INVESTMENT CORPORATION GERALD F. STAHLECKER PRESIDENT, FS INVESTMENT CORPORATION ZACHARY KLEHR EXECUTIVE VICE PRESIDENT, FS INVESTMENT CORPORATION SEAN COLEMAN MANAGING DIRECTOR, FS INVESTMENT CORPORATION WILLIAM GOEBEL CHIEF FINANCIAL OFFICER, FS INVESTMENT CORPORATION Michael Forman is the Chairman, CEO and co-founding partner of Franklin Square Capital Partners and FS Investment Corporation and Chairs the Investment Committee of the Adviser for FS Investment Corporation. Prior to founding Franklin Square, Mr. Forman built a number of other successful businesses in the private equity and debt, financial services and investment management industries. He was previously a senior partner in the Corporate and Securities Department at the Philadelphia- based law firm of Klehr, Harrison, Harvey, Branzburg & Ellers LLP, where he practiced for over 15 years. Mr. Forman is also a member of a number of civic and charitable boards in the Philadelphia community. Mr. Forman received a B.A. from the University of Rhode Island, where he graduated summa cum laude and was elected Phi Beta Kappa, and received a J.D. from Rutgers University. Gerald F. Stahlecker is the President and serves on the Investment Committee of the Adviser for FS Investment Corporation. Prior to joining Franklin Square, Mr. Stahlecker was a founding partner, Managing Director, Chief Operating Officer and Co-Chair of the Investment Committee of Radcliffe Capital Management, an investment advisory firm that manages hedge funds and separately managed accounts for institutional investors. Prior to Radcliffe, Mr. Stahlecker practiced corporate and securities law as an attorney at Klehr, Harrison, Harvey, Branzburg & Ellers LLP representing institutional investors pursuing structured equity and debt investments in public and private companies. Mr. Stahlecker received a B.S. from the Tepper School of Business at Carnegie Mellon University and a J.D. from Villanova University Law School. Zachary Klehr is an Executive Vice President and serves on the Investment Committee of the Adviser for FS Investment Corporation. Prior to joining Franklin Square, Mr. Klehr was a Vice President at Versa Capital Management, a private equity firm with approximately $1 billion in assets under management. At Versa, he sourced, underwrote, negotiated, structured and managed investments in middle-market distressed companies, special situations and distressed debt. Prior to Versa, Mr. Klehr spent five years at Goldman, Sachs & Co. where he worked on leveraged buyouts, acquisitions and equity and debt financings for Goldman Sachs' private equity clients. Mr. Klehr received an M.B.A. with honors from the Wharton School of the University of Pennsylvania and a B.A. (cum laude), also from the University of Pennsylvania. Sean Coleman is a Managing Director and serves on the Investment Committee of the Adviser for FS Investment Corporation. Before joining Franklin Square, Mr. Coleman worked at Golub Capital for eight years, where he served in various capacities, including as a managing director in the direct lending group and as chief financial officer and treasurer of Golub Capital BDC. Before he joined Golub Capital in 2005, Mr. Coleman worked in merchant banking and investment banking, including at Goldman, Sachs & Co. and Wasserstein Perella & Co. Mr. Coleman earned a B.A. in History from Princeton University and an M.B.A. with Distinction from Harvard Business School. William Goebel joined Franklin Square in February 2011 where he serves as Chief Financial Officer of FS Investment Corporation. Mr. Goebel brings over 13 years of accounting and auditing experience with areas of focus in fair valuation, SEC reporting and new fund offerings. Prior to joining the company, Mr. Goebel held a senior manager audit position with Ernst & Young LLP in the firm's asset management practice and was responsible for the audits of RICs, private investment partnerships, investment advisers and broker dealers. Mr. Goebel began his career as an auditor at Tait, Weller and Baker. Mr. Goebel received a B.S. in Economics from the Wharton School of the University of Pennsylvania. He is a CFA Charterholder and a certified public accountant. 28 |
 GSO Capital Partners Executives Focused on FSIC DOUGLAS I. OSTROVER SENIOR MANAGING DIRECTOR AND CO-FOUNDER, GSO / BLACKSTONE Before co-founding GSO Capital Partners in 2005, Mr. Ostrover was a Managing Director and Chairman of the Leveraged Finance Group of CSFB where he was responsible for all of CSFB's origination, distribution and trading activities relating to high yield securities, leveraged loans, high yield credit derivatives and distressed securities. Mr. Ostrover joined CSFB in November 2000 when CSFB acquired DLJ, where he was a Managing Director in charge of High Yield and Distressed Sales, Trading and Research. Mr. Ostrover received a B.A. in Economics from the University of Pennsylvania and an M.B.A. from the Stern School of Business of New York University. BENNETT J. GOODMAN SENIOR MANAGING DIRECTOR AND CO-FOUNDER, GSO / BLACKSTONE Bennett Goodman is a Senior Managing Director of The Blackstone Group, and current member of the Blackstone Management Committee. Before co-founding GSO Capital Partners in 2005, Mr. Goodman was a Founder and Managing Partner of the Alternative Capital Division of Credit Suisse (CSFB) where he was responsible for overseeing $33 billion of assets under management in private equity and credit oriented strategies. He joined CSFB in November 2000 when CSFB acquired DLJ, where he joined in 1988 as the founder of the High Yield Capital Markets Group and Served as Global Head of Leveraged Finance. Mr. Goodman graduated from Lafayette College and the Harvard Business School. TRIPP SMITH SENIOR MANAGING DIRECTOR AND CO-FOUNDER, GSO / BLACKSTONE Before co-founding GSO Capital Partners in 2005, Mr. Smith was Global Head of the Capital Markets Group within the Alternative Capital Division of CSFB. Mr. Smith joined CSFB in November 2000 when it acquired DLJ, where he was Global Head of High Yield Capital Markets. Mr. Smith had been a member of DLJ's high yield team since he joined the firm in 1993. Prior to that, Mr. Smith worked for Smith Barney and Drexel Burnham Lambert. Mr. Smith received a B.B.A. in Accounting from the University of Notre Dame. BRAD MARSHALL MANAGING DIRECTOR, GSO / BLACKSTONE SENIOR PORTFOLIO MANAGER, FS INVESTMENT CORPORATION Mr. Marshall serves as a Senior Portfolio Manager for FS Investment Corporation and is a member of GSO / Blackstone Debt Funds Management’s Investment Committee. Before joining GSO Capital Partners in 2005, Mr. Marshall worked in various roles at RBC Capital Market’s Alternative Investments Unit at Royal Bank of Canada, including fixed income high yield research and business development within RBC's private equity funds effort. Prior to RBC, Mr. Marshall helped develop a private equity funds business for TAL Global, a Canadian asset management division of CIBC, and prior to that, he co-founded a microchip verification software company where he served as chief financial officer. Mr. Marshall received an M.B.A. from McGill University in Montreal and a B.A. with honors in Economics from Queen's University in Kingston, Canada. DANIEL H. SMITH SENIOR MANAGING DIRECTOR, GSO / BLACKSTONE Mr. Smith is the Group Head of GSO / Blackstone Debt Funds Management and is a member of its Investment Committee. Before joining GSO Capital in 2005, Mr. Smith was Managing Partner and Co- head of RBC Capital Market’s Alternative Investments Unit at Royal Bank of Canada in New York. Mr. Smith joined RBC in 2001 from Indosuez Capital, a division of Crédit Agricole Indosuez, where he was a Co-Head and Managing Director overseeing the firm’s debt investments business and merchant banking activities. He began his career in investment management in 1987 at Van Kampen American Capital where he focused on below investment grade corporate debt. Mr. Smith received a B.S. in Petroleum Engineering from the University of Southern California and a Masters in Management from the J.L. Kellogg Graduate School of Management at Northwestern University. 29 |