UNITED STATES
SECURITIES AND EXCHANGE COMMISSION
Washington, D.C. 20549
FORM N-CSR
CERTIFIED SHAREHOLDER REPORT OF REGISTERED MANAGEMENT
INVESTMENT COMPANIES
Investment Company Act file number | 811-22169 | |||||
|
| |||||
| Dreyfus Institutional Reserves Fund |
| ||||
| (Exact name of Registrant as specified in charter) |
| ||||
|
|
| ||||
|
c/o The Dreyfus Corporation 200 Park Avenue New York, New York 10166 |
| ||||
| (Address of principal executive offices) (Zip code) |
| ||||
|
|
| ||||
| Bennett A. MacDougall, Esq. 200 Park Avenue New York, New York 10166 |
| ||||
| (Name and address of agent for service) |
| ||||
| ||||||
Registrant's telephone number, including area code: | (212) 922-6000 | |||||
|
| |||||
Date of fiscal year end:
| 12/31 |
| ||||
Date of reporting period: | 12/31/2015
|
| ||||
FORM N-CSR
Item 1. Reports to Stockholders.
| Dreyfus |
| Institutional Reserves Funds |
| Dreyfus Institutional Preferred Government Money Market Fund |
| Dreyfus Institutional Treasury and Agency Cash Advantage Fund |
| Dreyfus Institutional Treasury Prime Cash Advantage Fund |

| Contents | |
| The Funds | |
| A Letter from the President | 3 |
| Discussion of Fund Performance | 4 |
| UnderstandingYour Fund’s Expenses | 6 |
| ComparingYour Fund’s Expenses | |
| With Those of Other Funds | 7 |
| Statements of Investments | 8 |
| Statements of Assets and Liabilities | 13 |
| Statements of Operations | 14 |
| Statements of Changes in Net Assets | 15 |
| Financial Highlights | 17 |
| Notes to Financial Statements | 20 |
| Report of Independent Registered | |
| Public Accounting Firm | 25 |
| Important Tax Information | 26 |
| Board Members Information | 27 |
| Officers of the Fund | 29 |
| For More Information | |
| Back cover | |
The views expressed in this report reflect those of the portfolio manager only through the end of the period covered and do not necessarily represent the views of Dreyfus or any other person in the Dreyfus organization. Any such views are subject to change at any time based upon market or other conditions and Dreyfus disclaims any responsibility to update such views. These views may not be relied on as investment advice and, because investment decisions for a Dreyfus fund are based on numerous factors, may not be relied on as an indication of trading intent on behalf of any Dreyfus fund.
| • Not FDIC-Insured • Not Bank-Guaranteed • May LoseValue |
Dreyfus Institutional Reserves Funds
The Funds

A LETTER FROM THE PRESIDENT
Dear Shareholder:
We are pleased to present this annual report for Dreyfus Institutional Reserves Funds, covering the 12-month period from January 1, 2015, through December 31, 2015. For information about how the fund performed during the reporting period, as well as general market perspectives, we provide a Discussion of Fund Performance on the pages that follow.
2015 was a year of varied and, at times, conflicting economic influences. On one hand, the U.S. economy continued to grow as domestic labor markets posted significant gains, housing markets recovered, and lower fuel prices put cash in consumers’ pockets. Indeed, these factors, along with low inflation, prompted the Federal Reserve Board in December to raise short-term interest rates for the first time in nearly a decade. On the other hand, the global economy continued to disappoint, particularly in China and other emerging markets, when reduced industrial demand and declining currency values sparked substantial declines in commodity prices.
Although several broad measures of stock and bond performance ended 2015 roughly unchanged, high levels of volatility prevailed across most financial markets. Among U.S. equities, moderate gains from consumer discretionary and health care stocks were balanced by pronounced weakness in the energy and materials sectors. Bonds also saw bifurcated performance, with municipal bonds and intermediate-term U.S. government securities faring well compared to high yield and emerging-markets debt.
Market volatility is likely to persist until investors see greater clarity from the global economy.We expect to see wide differences in underlying fundamental and technical influences across various asset classes, economic sectors, and regional markets in 2016, suggesting that selectivity may be an important determinant of investment success. As always, we encourage you to discuss the implications of our observations with your financial advisor.
Thank you for your continued confidence and support.
Sincerely,

J. Charles Cardona
President
The Dreyfus Corporation
January 15, 2016
The Funds 3

DISCUSSION OF
FUND PERFORMANCE
For the period of January 1, 2015, through December 31, 2015, as provided by Patricia A. Larkin, Senior Portfolio Manager
Fund and Market Performance Overview
For the 12-month period ended December 31, 2015, the three Dreyfus Institutional Reserves funds listed below produced the following yields and effective yields:1
| Effective | ||
| Yield (%) | Yield (%) | |
| Dreyfus Institutional Preferred | ||
| Government Money Fund | ||
| Institutional Shares | 0.07 | 0.07 |
| Hamilton Shares | 0.02 | 0.02 |
| Premier Shares | 0.00 | 0.00 |
| Classic Shares | 0.00 | 0.00 |
| Agency Shares | 0.00 | 0.00 |
| Dreyfus Institutional Treasury and | ||
| Agency Cash Advantage Fund | ||
| Institutional Shares | 0.00 | 0.00 |
| Hamilton Shares | 0.00 | 0.00 |
| Premier Shares | 0.00 | 0.00 |
| Classic Shares | 0.00 | 0.00 |
| Agency Shares | 0.00 | 0.00 |
| Dreyfus Institutional Treasury | ||
| Prime Cash Advantage Fund | ||
| Institutional Shares | 0.00 | 0.00 |
| Hamilton Shares | 0.00 | 0.00 |
| Premier Shares | 0.00 | 0.00 |
Although the Federal Reserve Board (the “Fed”) raised the federal funds rate by 25 basis points in mid-December 2015, it was unchanged during most of the reporting period, and money market yields remained low.
Uneven U.S. Economic Recovery Continued
After a sustained economic rebound driven by domestic labor market gains over the fall of 2014, U.S. GDP moderated to a 0.6% annualized rate for the first quarter of 2015 due to severe winter weather and the dampening impact of an appreciating U.S. dollar on exports. Nonetheless, job creation generally remained robust during the first quarter of the year, and the unemployment rate fell to 5.5% at the end of March 2015.
The economic recovery regained traction in the spring. The unemployment rate dipped to 5.4% in April, and 187,000 new jobs were created. In May, employers added 260,000 jobs and average hourly wages rose 0.3%, yet the unemployment rate ticked higher to 5.5%. Meanwhile, stabilizing currency exchange rates enabled the U.S. trade deficit to shrink significantly. Sentiment in the financial markets deteriorated in June during a debt crisis in Greece, but the U.S. economy continued to grow. 245,000 new jobs were added, the unemployment rate fell to 5.3%, and consumer spending rose.The U.S. economy expanded at a 3.9% annualized rate over the second quarter.
July brought more good economic news when 223,000 jobs were added and the unemployment rate stayed steady. Average hourly wages and retail sales increased, and the manufacturing and service sectors continued to grow. In contrast, equity investors reacted nervously to economic weakness in China. While the unemployment rate fell to 5.1% in August, only 153,000 jobs were added. Stock and commodity prices fell sharply after China unexpectedly devalued its currency. On a brighter note, U.S. wages and personal incomes grew at a healthy pace.
Disappointing job creation continued in September with 145,000 new positions. Average hourly wages declined slightly, and the unemployment rate stayed at 5.1%. On the other hand, personal incomes and real
4
personal consumption expenditures climbed during the month. U.S. GDP growth decelerated to a 2.0% annualized rate during the third quarter, reflecting high business inventory levels and lower exports.
October brought generally good domestic economic news with 307,000 new jobs and a 5.0% unemployment rate. Meanwhile, average annual wages increased at a 4.3% rate compared to September. Fuel prices fell, putting more money in consumers’ pockets, and retail sales moved mildly higher. Conversely, housing starts declined sharply, ending the month below year-ago levels. In November, the service sector continued to expand, but manufacturing activity contracted for the first time in three years due to weaker overseas demand. The U.S. labor market continued to gain strength with 252,000 new jobs and an unchanged unemployment rate.
Manufacturing activity continued to shrink as commodity prices fell in December, yet holiday retail sales proved robust, especially for online sellers. 292,000 new jobs were created during the month and the unemployment rate stayed steady at 5.0%. The Fed responded to the strengthening U.S. labor market by raising the federal funds rate by 25 basis points to between 0.25% and 0.50%.The move was widely expected by investors, and yields of money market instruments had already repriced slightly higher by the time of the Fed’s announcement.
Fed to Raise Rates Gradually
In its statement on December 16, 2015, the Fed said, “The Committee currently expects that, with gradual adjustments in the stance of monetary policy, economic activity will continue to expand at a moderate pace and labor market indicators will continue to strengthen.” This suggests to us that a limited number of modest increases are likely during 2016, depending on “realized and expected economic conditions.” Therefore, we have continued to set the fund’s weighted average maturity in a range we consider to be in line with industry averages, and we have maintained our longstanding focus on well-established issuers with sound quality and liquidity characteristics.
January 15, 2016
| Investments in the funds are not insured or guaranteed by the FDIC or any | |
| other government agency.Although each fund seeks to preserve the value of | |
| your investment at $1.00 per share, it is possible to lose money by investing | |
| in the fund. | |
| Short-term corporate and asset-backed securities holdings, while rated in the | |
| highest rating category by one or more NRSRO (or unrated, if deemed of | |
| comparable quality by Dreyfus), involve credit and liquidity risks and risk of | |
| principal loss. | |
| 1 | Effective yield is based upon dividends declared daily and reinvested |
| monthly. Past performance is no guarantee of future results.Yields fluctuate. | |
| Yields provided for the funds reflect the absorption of certain fund expenses | |
| by The Dreyfus Corporation pursuant to an undertaking in effect that may | |
| be extended, terminated, or modified at any time. Had these expenses not | |
| been absorbed, fund yields would have been lower, and in some cases, 7-day | |
| yields during the reporting period would have been negative absent the | |
| expense absorption. |
The Funds 5
UNDERSTANDING YOUR FUND’S EXPENSES (Unaudited)
As a mutual fund investor, you pay ongoing expenses, such as management fees and other expenses. Using the information below, you can estimate how these expenses affect your investment and compare them with the expenses of other funds.You also may pay one-time transaction expenses, including sales charges (loads) and redemption fees, which are not shown in this section and would have resulted in higher total expenses. For more information, see your fund’s prospectus or talk to your financial adviser.
Review your fund’s expenses
The table below shows the expenses you would have paid on a $1,000 investment in each class of each fund from July 1, 2015 to December 31, 2015. It also shows how much a $1,000 investment would be worth at the close of the period, assuming actual returns and expenses.
| Expenses and Value of a $1,000 Investment | |||||||||||
| assuming actual returns for the six months ended December 31, 2015 | |||||||||||
| Institutional | Hamilton | Agency | Premier | Classic | |||||||
| Shares | Shares | Shares | Shares | Shares | |||||||
| Dreyfus Institutional Preferred | |||||||||||
| Government Money Market Fund | |||||||||||
| Expenses paid per $1,000† | $ .66 | $ .86 | $ 1.01 | $ 1.01 | $ 1.06 | ||||||
| Ending value (after expenses) | $ 1,000.40 | $ 1,000.10 | $ 1,000.00 | $ 1,000.00 | $ 1,000.00 | ||||||
| Annualized expense ratio (%) | .13 | .17 | .20 | .20 | .21 | ||||||
| Dreyfus Institutional Treasury and | |||||||||||
| Agency Cash Advantage Fund | |||||||||||
| Expenses paid per $1,000† | $ .40 | $ .45 | $ .45 | $ .45 | $ .45 | ||||||
| Ending value (after expenses) | $ 1,000.00 | $ 1,000.00 | $ 1,000.00 | $ 1,000.00 | $ 1,000.00 | ||||||
| Annualized expense ratio (%) | .08 | .09 | .09 | .09 | .09 | ||||||
| Dreyfus Institutional Treasury | |||||||||||
| Prime Cash Advantage Fund | |||||||||||
| Expenses paid per $1,000† | $ .25 | $ .20 | — | $ .25 | — | ||||||
| Ending value (after expenses) | $ 1,000.00 | $ 1,000.00 | — | $ 1,000.00 | — | ||||||
| Annualized expense ratio (%) | .05 | .04 | — | .05 | — | ||||||
| † Expenses are equal to each fund’s annualized expense ratios as shown above, multiplied by the average account value over the period, multiplied by 184/365 (to reflect the one-half |
| year period). |
6
COMPARING YOUR FUND’S EXPENSES WITH THOSE OF OTHER FUNDS (Unaudited)
Using the SEC’s method to compare expenses
The Securities and Exchange Commission (SEC) has established guidelines to help investors assess fund expenses. Per these guidelines, the table below shows your fund’s expenses based on a $1,000 investment, assuming a hypothetical 5% annualized return.You can use this information to compare the ongoing expenses (but not transaction expenses or total cost) of investing in the fund with those of other funds. All mutual fund shareholder reports will provide this information to help you make this comparison. Please note that you cannot use this information to estimate your actual ending account balance and expenses paid during the period.
| Expenses and Value of a $1,000 Investment | |||||||||||
| assuming a hypothetical 5% annualized return for the six months ended December 31, 2015 | |||||||||||
| Institutional | Hamilton | Agency | Premier | Classic | |||||||
| Shares | Shares | Shares | Shares | Shares | |||||||
| Dreyfus Institutional Preferred | |||||||||||
| Government Money Market Fund | |||||||||||
| Expenses paid per $1,000† | $ .66 | $ .87 | $ 1.02 | $ 1.02 | $ 1.07 | ||||||
| Ending value (after expenses) | $ 1,024.55 | $ 1,024.35 | $ 1,024.20 | $1,024.20 | $ 1,024.15 | ||||||
| Annualized expense ratio (%) | .13 | .17 | .20 | .20 | .21 | ||||||
| Dreyfus Institutional Treasury and | |||||||||||
| Agency Cash Advantage Fund | |||||||||||
| Expenses paid per $1,000† | $ .41 | $ .46 | $ .46 | $ .46 | $ .46 | ||||||
| Ending value (after expenses) | $ 1,024.80 | $ 1,024.75 | $ 1,024.75 | $ 1,024.75 | $ 1,024.75 | ||||||
| Annualized expense ratio (%) | .08 | .09 | .09 | .09 | .09 | ||||||
| Dreyfus Institutional Treasury | |||||||||||
| Prime Cash Advantage Fund | |||||||||||
| Expenses paid per $1,000† | $.26 | $ .20 | — | $ .26 | — | ||||||
| Ending value (after expenses) | $1,024.95 | $ 1,025.00 | — | $ 1,024.95 | — | ||||||
| Annualized expense ratio (%) | .05 | .04 | — | .05 | — | ||||||
| † Expenses are equal to each fund’s annualized expense ratios as shown above, multiplied by the average account value over the period, multiplied by 184/365 (to reflect the one-half |
| year period). |
The Funds 7
STATEMENT OF INVESTMENTS
December 31, 2015
| Principal | |||||
| Dreyfus Institutional Preferred Government Money Market Fund | Amount ($) | Value ($) | |||
| U.S. Government Agencies—46.9% | |||||
| Federal Home Loan Bank | |||||
| 0.15%—0.46%, 2/18/16—6/6/16 | 710,000,000 | 709,513,792 | |||
| Federal Home Loan Mortgage Corp. | |||||
| 0.25%, 1/27/16 | 100,000,000 | a | 99,981,944 | ||
| Federal National Mortgage Association | |||||
| 0.25%—0.27%, 2/16/16—4/8/16 | 250,000,000 | a | 249,899,361 | ||
| Total U.S. Government Agencies | |||||
| (cost $1,059,395,097) | 1,059,395,097 | ||||
| U.S. Treasury Bills—5.8% | |||||
| 0.00%—0.15%, 1/21/16—1/28/16 | |||||
| (cost $131,994,375) | 132,000,000 | 131,994,375 | |||
| U.S. Treasury Notes—1.8% | |||||
| 0.58%, 6/30/16 | |||||
| (cost $40,519,182) | 40,000,000 | 40,519,182 | |||
| Repurchase Agreements—45.4% | |||||
| Bank of Nova Scotia | |||||
| 0.29%, dated 12/31/15, due 1/4/16 in the amount of | |||||
| $100,003,222 (fully collateralized by $2,489,033 | |||||
| U.S. Treasury Bills, due 1/21/16-9/15/16, value | |||||
| $2,484,368, $17,073,748 U.S. Treasury Bonds, | |||||
| 3%-9.25%, due 2/15/16-5/15/45, value $22,146,064, | |||||
| $52,852,023 U.S. Treasury Inflation Protected Securities, | |||||
| 0.13%-3.88%, due 4/15/16-2/15/44, value $56,990,002 | |||||
| and $20,540,776 U.S. Treasury Notes, 0.38%-5.13%, | |||||
| due 2/29/16-8/15/25, value $20,379,566) | 100,000,000 | 100,000,000 | |||
| BNP Paribas | |||||
| 0.26%, dated 12/31/15, due 1/4/16 in the amount of | |||||
| $160,004,622 (fully collateralized by $5,633,000 | |||||
| U.S. Treasury Bonds, 4.38%, due 5/15/40, value | |||||
| $7,084,719 and $149,958,200 U.S. Treasury Notes, | |||||
| 1%-3.63%, due 2/15/18-11/15/23, value $156,115,380) | 160,000,000 | 160,000,000 | |||
| Credit Agricole CIB | |||||
| 0.33%, dated 12/31/15, due 1/4/16 in the amount of | |||||
| $65,002,383 (fully collateralized by $20 U.S. Treasury Bills, | |||||
| due 1/7/16, value $20, $6,053,645 U.S. Treasury Bonds, | |||||
| 2.88%-9.25%, due 2/15/16-8/15/45, value $6,615,099, | |||||
| $40,959,105 U.S. Treasury Inflation Protected Securities, | |||||
| 0.13%-3.63%, due 1/15/17-2/15/45, value $46,813,075 | |||||
| and $12,936,380 U.S. Treasury Notes, 0.63%-2%, | |||||
| due 7/15/17-7/31/22, value $12,871,807) | 65,000,000 | 65,000,000 | |||
8
| Principal | |||
| Dreyfus Institutional Preferred Government Money Market Fund (continued) | Amount ($) | Value ($) | |
| Repurchase Agreements (continued) | |||
| HSBC USA Inc. | |||
| 0.27%, dated 12/31/15, due 1/4/16 in the amount of | |||
| $150,004,500 (fully collateralized by $157,647,700 | |||
| U.S. Treasury Bonds, 2.75%-2.88%, due 8/15/42-8/15/45, | |||
| value $153,001,111) | 150,000,000 | 150,000,000 | |
| Merrill Lynch & Co. Inc. | |||
| 0.29%, dated 12/31/15, due 1/4/16 in the amount of | |||
| $100,003,222 (fully collateralized by $102,255,700 | |||
| U.S. Treasury Notes, 1.75%, due 12/31/20 value $102,000,061) | 100,000,000 | 100,000,000 | |
| TD Securities (USA) LLC | |||
| 0.32%, dated 12/31/15, due 1/4/16 in the amount of | |||
| $450,016,000 (fully collateralized by $6,674,700 | |||
| U.S. Treasury Floating Rate Notes, 0.31%-0.34%, | |||
| due 4/30/16-7/31/17, value $6,675,953, $15,224,500 | |||
| U.S. Treasury Notes, 1.38%, due 5/31/20, value $15,003,206 | |||
| and $995,318,933 U.S. Treasury Strips due 5/15/28-8/15/45, | |||
| value $437,320,841) | 450,000,000 | 450,000,000 | |
| Total Repurchase Agreements | |||
| (cost $1,025,000,000) | 1,025,000,000 | ||
| Total Investments (cost $2,256,908,654) | 99.9 | % | 2,256,908,654 |
| Cash and Receivables (Net) | .1 | % | 2,410,045 |
| Net Assets | 100.0 | % | 2,259,318,699 |
| a The Federal Housing Finance Agency (“FHFA”) placed the Federal Home Loan Mortgage Corporation and Federal National Mortgage Association into conservatorship with FHFA as |
| the conservator.As such, the FHFA oversees the continuing affairs of these companies. |
| Portfolio Summary (Unaudited)† | |||
| Value (%) | Value (%) | ||
| U.S. Government Agencies | 46.9 | U.S. Treasury Notes | 1.8 |
| Repurchase Agreements | 45.4 | ||
| U.S. Treasury Bills | 5.8 | 99.9 | |
| † Based on net assets. | |||
| See notes to financial statements. | |||
The Funds 9
STATEMENT OF INVESTMENTS
December 31, 2015
| Annualized | |||||
| Yield on | |||||
| Dreyfus Institutional | Date of | Principal | |||
| Treasury and Agency Cash Advantage Fund | Purchase (%) | Amount ($) | Value ($) | ||
| U.S. Treasury Bills—41.9% | |||||
| 1/14/16 | 0.08 | 65,000,000 | 64,998,122 | ||
| 1/28/16 | 0.01 | 150,000,000 | 149,998,875 | ||
| 2/4/16 | 0.17 | 75,000,000 | 74,987,959 | ||
| 4/28/16 | 0.20 | 50,000,000 | 49,967,222 | ||
| Total U.S. Treasury Bills | |||||
| (cost $339,952,178) | 339,952,178 | ||||
| U.S. Treasury Notes—5.0% | |||||
| 6/30/16 | |||||
| (cost $40,519,181) | 0.58 | 40,000,000 | 40,519,181 | ||
| Repurchase Agreements—46.9% | |||||
| ABN AMRO Bank N.V. | |||||
| dated 12/31/15, due 1/4/16 in the amount of | |||||
| $80,002,756 (fully collateralized by $80,821,840 | |||||
| U.S. Treasury Notes, 1.38%-2.63%, | |||||
| due 7/31/18-11/15/20, value $81,600,012) | 0.31 | 80,000,000 | 80,000,000 | ||
| Bank of Nova Scotia | |||||
| dated 12/31/15, due 1/4/16 in the amount of | |||||
| $100,003,222 (fully collateralized by $2,489,033 | |||||
| U.S. Treasury Bills, due 1/21/16-9/15/16, value | |||||
| $2,484,368, $17,073,748 U.S. Treasury Bonds, | |||||
| 3%-9.25%, due 2/15/16-5/15/45, value $22,146,064, | |||||
| $52,852,023 U.S. Treasury Inflation Protected Securities, | |||||
| 0.13%-3.88%, due 4/15/16-2/15/44, value $56,990,002 | |||||
| and $20,540,776 U.S. Treasury Notes, 0.38%-5.13%, | |||||
| due 2/29/16-8/15/25, value $20,379,566) | 0.29 | 100,000,000 | 100,000,000 | ||
| Citibank, NA | |||||
| dated 12/31/15, due 1/4/16 in the amount of | |||||
| $100,003,556 (fully collateralized by$376,600 | |||||
| U.S. Treasury Bills, due 5/26/16, value $376,065, | |||||
| $10,792,200 U.S. Treasury Bonds, 3.88%, due 8/15/40, | |||||
| value $12,707,829 and $90,906,700 U.S. Treasury Notes, | |||||
| 1.38%-1.63%, due 11/30/18-8/15/22, value $88,916,112) | 0.32 | 100,000,000 | 100,000,000 | ||
10
| Annualized | ||||
| Yield on | ||||
| Dreyfus Institutional | Date of | Principal | ||
| Treasury and Agency Cash Advantage Fund (continued) | Purchase (%) | Amount ($) | Value ($) | |
| Repurchase Agreements (continued) | ||||
| Credit Agricole CIB | ||||
| dated 12/31/15, due 1/4/16 in the amount of $100,003,667 | ||||
| (fully collateralized by $31 U.S. Treasury Bills, due 1/7/16, | ||||
| value $31, $9,313,300 U.S. Treasury Bonds, 2.88%-9.25%, | ||||
| due 2/15/16-8/15/45, value $10,177,075, $63,014,008 | ||||
| U.S. Treasury Inflation Protected Securities, 0.13%-3.63%, | ||||
| due 1/15/17-2/15/45, value $72,020,115 and $19,902,123 | ||||
| U.S. Treasury Notes, 0.63%-2% due 7/15/17-7/31/22, | ||||
| value $19,802,779) | 0.33 | 100,000,000 | 100,000,000 | |
| Total Repurchase Agreements | ||||
| (cost $380,000,000) | 380,000,000 | |||
| Total Investments (cost $760,471,359) | 93.8 | % | 760,471,359 | |
| Cash and Receivables (Net) | 6.2 | % | 50,385,036 | |
| Net Assets | 100.0 | % | 810,856,395 | |
| Portfolio Summary (Unaudited)† | |||
| Value (%) | Value (%) | ||
| Repurchase Agreements | 46.9 | U.S. Treasury Notes | 5.0 |
| U.S. Treasury Bills | 41.9 | 93.8 |
| † Based on net assets. |
| See notes to financial statements. |
The Funds 11
STATEMENT OF INVESTMENTS
December 31, 2015
| Annualized | ||||
| Yield on | ||||
| Date of | Principal | |||
| Dreyfus Institutional Treasury Prime Cash Advantage Fund | Purchase (%) | Amount ($) | Value ($) | |
| U.S. Treasury Bills—88.7% | ||||
| 1/7/16 | 0.05 | 155,000,000 | 154,998,825 | |
| 1/14/16 | 0.20 | 60,000,000 | 59,995,580 | |
| 1/21/16 | 0.06 | 56,000,000 | 55,998,006 | |
| 1/28/16 | 0.05 | 119,000,000 | 118,995,099 | |
| 2/4/16 | 0.07 | 30,000,000 | 29,998,158 | |
| 2/11/16 | 0.13 | 4,000,000 | 3,999,396 | |
| 3/10/16 | 0.27 | 80,000,000 | 79,958,983 | |
| 3/24/16 | 0.22 | 17,000,000 | 16,991,573 | |
| 3/31/16 | 0.27 | 150,000,000 | 149,900,625 | |
| Total U.S. Treasury Bills | ||||
| (cost $670,836,245) | 670,836,245 | |||
| U.S. Treasury Notes—11.1% | ||||
| 1/31/16 | 0.22 | 30,000,000 | 30,043,572 | |
| 1/31/16 | 0.23 | 3,000,000 | 3,000,335 | |
| 2/29/16 | 0.10 | 51,000,000 | 51,208,529 | |
| Total U.S. Treasury Notes | ||||
| (cost $84,252,436) | 84,252,436 | |||
| Total Investments (cost $755,088,681) | 99.8 | % | 755,088,681 | |
| Cash and Receivables (Net) | .2 | % | 1,758,159 | |
| Net Assets | 100.0 | % | 756,846,840 | |
| Portfolio Summary (Unaudited)† | |||
| Value (%) | Value (%) | ||
| U.S. Treasury Bills | 88.7 | U.S. Treasury Notes | 11.1 |
| 99.8 |
| † Based on net assets. |
| See notes to financial statements. |
12
STATEMENTS OF ASSETS AND LIABILITIES
December 31, 2015
| Dreyfus | Dreyfus | Dreyfus | ||||
| Institutional | Institutional | Institutional | ||||
| Preferred | Treasury and | Treasury Prime | ||||
| Government | Agency Cash | Cash Advantage | ||||
| Money Market Fund | Advantage Fund | Fund | ||||
| Assets ($): | ||||||
| Investments in securities at value—Note 1(a,b)† | 2,256,908,654 | a | 760,471,359 | a | 755,088,681 | |
| Cash | 2,646,332 | 50,461,978 | 1,138,041 | |||
| Interest receivable | 12,020 | 6,833 | 707,764 | |||
| Receivable for shares of Beneficial Interest subscribed | — | 559 | — | |||
| 2,259,567,006 | 810,940,729 | 756,934,486 | ||||
| Liabilities ($): | ||||||
| Due to The Dreyfus Corporation and affiliates—Note 2(b) | 248,307 | 84,334 | 45,195 | |||
| Payable for shares of Beneficial Interest redeemed | — | — | 42,451 | |||
| 248,307 | 84,334 | 87,646 | ||||
| Net Assets ($) | 2,259,318,699 | 810,856,395 | 756,846,840 | |||
| Composition of Net Assets ($): | ||||||
| Paid-in capital | 2,259,318,699 | 810,856,395 | 756,850,007 | |||
| Accumulated net realized gain (loss) on investments | — | — | (3,167 | ) | ||
| Net Assets ($) | 2,259,318,699 | 810,856,395 | 756,846,840 | |||
| Net Asset Value Per Share | ||||||
| Institutional Shares | ||||||
| Net Assets ($) | 984,688,237 | 126,785,234 | 351,360,564 | |||
| Shares Outstanding | 983,853,637 | 126,675,700 | 351,365,234 | |||
| Net Asset Value Per Share ($) | 1.00 | 1.00 | 1.00 | |||
| Hamilton Shares | ||||||
| Net Assets ($) | 1,093,087,213 | 195,153,470 | 4,394,720 | |||
| Shares Outstanding | 1,092,188,479 | 194,998,625 | 4,394,760 | |||
| Net Asset Value Per Share ($) | 1.00 | 1.00 | 1.00 | |||
| Agency Shares | ||||||
| Net Assets ($) | 11,340,110 | 3,693,460 | — | |||
| Shares Outstanding | 11,332,498 | 3,690,477 | — | |||
| Net Asset Value Per Share ($) | 1.00 | 1.00 | — | |||
| Premier Shares | ||||||
| Net Assets ($) | 168,074,007 | 482,653,768 | 401,091,556 | |||
| Shares Outstanding | 167,929,587 | 482,280,390 | 401,090,013 | |||
| Net Asset Value Per Share ($) | 1.00 | 1.00 | 1.00 | |||
| Classic Shares | ||||||
| Net Assets ($) | 2,129,132 | 2,570,463 | — | |||
| Shares Outstanding | 2,127,353 | 2,568,386 | — | |||
| Net Asset Value Per Share ($) | 1.00 | 1.00 | — | |||
| † Investments at cost ($) | 2,256,908,654 | 760,471,359 | 755,088,681 |
| a Amount includes repurchase agreements of $1,025,000,000 and $380,000,000 for Dreyfus Institutional Preferred Government Money Market Fund and Dreyfus Institutional |
| Treasury and Agency Cash Advantage Fund, respectively. See Note 1(b). |
See notes to financial statements.
The Funds 13
STATEMENTS OF OPERATIONS
Year Ended December 31, 2015
| Dreyfus | Dreyfus | Dreyfus | ||||
| Institutional | Institutional | Institutional | ||||
| Preferred | Treasury and | Treasury Prime | ||||
| Government | Agency Cash | Cash Advantage | ||||
| Money Market Fund | Advantage Fund | Fund | ||||
| Investment Income ($): | ||||||
| Interest Income | 5,134,524 | 756,980 | 292,158 | |||
| Expenses: | ||||||
| Management fee—Note 2(a) | 3,569,594 | 1,259,895 | 1,173,340 | |||
| Service Plan fees—Note 2(b) | 1,465,095 | 1,733,671 | 1,157,007 | |||
| Trustees' fees—Note 2(a,c) | 30,958 | 14,749 | 9,164 | |||
| Legal fees—Note 2(a) | 27,986 | 11,822 | 8,237 | |||
| Total Expenses | 5,093,633 | 3,020,137 | 2,347,748 | |||
| Less—reduction in expenses due to undertakings—Note 2(a) | (908,779 | ) | (2,244,496 | ) | (2,041,560 | ) |
| Less—Trustees’ fees reimbursed by the Manager—Note 2(a) | (30,958 | ) | (14,749 | ) | (9,164 | ) |
| Less—Legal fees reimbursed by the Manager—Note 2(a) | (27,986 | ) | (11,822 | ) | (8,237 | ) |
| Net Expenses | 4,125,910 | 749,070 | 288,787 | |||
| Investment Income—Net | 1,008,614 | 7,910 | 3,371 | |||
| Net Realized Gain (Loss) on Investments—Note 1(b) ($) | 28,431 | 88,660 | 5,630 | |||
| Net Increase in Net Assets Resulting from Operations | 1,037,045 | 96,570 | 9,001 | |||
| See notes to financial statements. | ||||||
14
STATEMENTS OF CHANGES IN NET ASSETS
| Dreyfus Institutional Preferred | ||||
| Government Money Market Fund | ||||
| Year Ended December 31, | ||||
| 2015 | 2014 | |||
| Operations ($): | ||||
| Investment income—net | 1,008,614 | 322,715 | ||
| Net realized gain (loss) on investments | 28,431 | 63,292 | ||
| Net Increase (Decrease) in Net Assets | ||||
| Resulting from Operations | 1,037,045 | 386,007 | ||
| Dividends to Shareholders from ($): | ||||
| Investment income—net: | ||||
| Institutional Shares | (739,060 | ) | (316,409 | ) |
| Hamilton Shares | (268,575 | ) | (6,151 | ) |
| Agency Shares | (77 | ) | (4 | ) |
| Premier Shares | (888 | ) | (123 | ) |
| Classic Shares | (14 | ) | (28 | ) |
| Total Dividends | (1,008,614 | ) | (322,715 | ) |
| Beneficial Interest Transactions ($1.00 per share): | ||||
| Net proceeds from shares sold: | ||||
| Institutional Shares | 6,324,228,345 | 6,653,712,857 | ||
| Hamilton Shares | 4,100,729,611 | 5,308,965,896 | ||
| Agency Shares | 96,841,422 | 48,210,758 | ||
| Premier Shares | 768,487,739 | 940,059,059 | ||
| Classic Shares | 186,409,095 | 1,032,592,433 | ||
| Dividends reinvested: | ||||
| Institutional Shares | 4,311 | 433 | ||
| Hamilton Shares | 895 | 18 | ||
| Premier Shares | 15 | 1 | ||
| Classic Shares | 11 | 28 | ||
| Cost of shares redeemed: | ||||
| Institutional Shares | (6,562,376,083 | ) | (6,615,526,400 | ) |
| Hamilton Shares | (4,199,241,193 | ) | (5,789,075,409 | ) |
| Agency Shares | (98,000,674 | ) | (49,573,517 | ) |
| Premier Shares | (838,996,149 | ) | (1,102,390,937 | ) |
| Classic Shares | (212,085,073 | ) | (1,134,028,510 | ) |
| Increase (Decrease) in Net Assets from | ||||
| Beneficial Interest Transactions | (433,997,728 | ) | (707,053,290 | ) |
| Total Increase (Decrease) In Net Assets | (433,969,297 | ) | (706,989,998 | ) |
| Net Assets ($): | ||||
| Beginning of Period | 2,693,287,996 | 3,400,277,994 | ||
| End of Period | 2,259,318,699 | 2,693,287,996 | ||
| See notes to financial statements. | ||||
The Funds 15
STATEMENTS OF CHANGES IN NET ASSETS (continued)
| Dreyfus Institutional Treasury and | Dreyfus Institutional Treasury | |||||||
| Agency Cash Advantage Fund | Prime Cash Advantage Fund | |||||||
| Year Ended December 31, | Year Ended December 31, | |||||||
| 2015 | 2014 | 2015 | 2014 | |||||
| Operations ($): | ||||||||
| Investment income—net | 7,910 | 410 | 3,371 | 271 | ||||
| Net realized gain (loss) on investments | 88,660 | 242,983 | 5,630 | (5,233 | ) | |||
| Net Increase (Decrease) in Net Assets | ||||||||
| Resulting from Operations | 96,570 | 243,393 | 9,001 | (4,962 | ) | |||
| Dividends to Shareholders from ($): | ||||||||
| Investment income—net: | ||||||||
| Institutional Shares | (4,400 | ) | (55 | ) | (1,525 | ) | (123 | ) |
| Hamilton Shares | (3,067 | ) | (62 | ) | (18 | ) | (1 | ) |
| Agency Shares | (38 | ) | —a | — | — | |||
| Premier Shares | (5,060 | ) | (221 | ) | (1,828 | ) | (147 | ) |
| Classic Shares | (30 | ) | (72 | ) | — | — | ||
| Total Dividends | (12,595 | ) | (410 | ) | (3,371 | ) | (271 | ) |
| Beneficial Interest Transactions ($1.00 per share): | ||||||||
| Net proceeds from shares sold: | ||||||||
| Institutional Shares | 3,351,472,318 | 1,113,562,215 | 829,592,094 | 797,188,999 | ||||
| Hamilton Shares | 879,654,788 | 943,881,071 | 77,245,687 | 71,841,002 | ||||
| Agency Shares | 3,691,369 | 14,334,540 | — | — | ||||
| Premier Shares | 2,765,906,976 | 3,295,113,278 | 1,177,535,708 | 1,125,681,879 | ||||
| Classic Shares | 74,032,072 | 556,933,762 | — | — | ||||
| Dividends reinvested: | ||||||||
| Institutional Shares | 2,244 | 22 | 425 | 32 | ||||
| Hamilton Shares | 119 | 9 | 1 | — | ||||
| Premier Shares | 2 | 2 | — | �� | — | |||
| Classic Shares | 4 | 70 | — | — | ||||
| Cost of shares redeemed: | ||||||||
| Institutional Shares | (3,426,115,848 | ) | (1,087,033,955 | ) | (814,175,996 | ) | (803,994,062 | ) |
| Hamilton Shares | (902,558,589 | ) | (966,300,790 | ) | (79,739,163 | ) | (71,942,421 | ) |
| Agency Shares | (4,505,567 | ) | (13,240,871 | ) | — | — | ||
| Premier Shares | (2,951,425,461 | ) | (3,721,088,659 | ) | (1,160,835,296 | ) | (1,163,368,383 | ) |
| Classic Shares | (84,557,467 | ) | (738,494,124 | ) | — | — | ||
| Increase (Decrease) in Net Assets from | ||||||||
| Beneficial Interest Transactions | (294,403,040 | ) | (602,333,430 | ) | 29,623,460 | (44,592,954 | ) | |
| Total Increase (Decrease) In Net Assets | (294,319,065 | ) | (602,090,447 | ) | 29,629,090 | (44,598,187 | ) | |
| Net Assets ($): | ||||||||
| Beginning of Period | 1,105,175,460 | 1,707,265,907 | 727,217,750 | 771,815,937 | ||||
| End of Period | 810,856,395 | 1,105,175,460 | 756,846,840 | 727,217,750 | ||||
| a Amount represents less than $1. | ||||||||
| See notes to financial statements. | ||||||||
16
FINANCIAL HIGHLIGHTS
The following tables describe the performance for each share class of each fund for the fiscal periods indicated. All information reflects financial results for a single fund share.Total return shows how much your investment in the fund would have increased (or decreased) during each period, assuming you had reinvested all dividends and distributions.These figures have been derived from the funds’ financial statements.
| Per Share Data ($) | Ratios/Supplemental Data (%) | ||||||||||||
| Ratio of | Ratio of | Ratio of Net | |||||||||||
| Net Asset | Dividends | Net Asset | Total | Net | Investment | Net Assets | |||||||
| Value | Net | from Net | Value | Expenses | Expenses | Income to | End of | ||||||
| Beginning | Investment | Investment | End | Total | to Average | to Average | Average | Period | |||||
| of Period | Income | Income | of Period | Return (%) | Net Assets | Net Assets | Net Assets | ($x1,000) | |||||
| Dreyfus Institutional Preferred | |||||||||||||
| Government Money Market Fund | |||||||||||||
| Institutional Shares | |||||||||||||
| Year Ended December 31, | |||||||||||||
| 2015 | 1.00 | .001 | (.001 | ) | 1.00 | .07 | .14 | .13 | .07 | 984,688 | |||
| 2014 | 1.00 | .000 | a | (.000 | )a | 1.00 | .03 | .14 | .14 | .03 | 1,222,787 | ||
| 2013 | 1.00 | .000 | a | (.000 | )a | 1.00 | .04 | .14 | .14 | .04 | 1,184,394 | ||
| 2012 | 1.00 | .001 | (.001 | ) | 1.00 | .12 | .14 | .14 | .12 | 760,601 | |||
| 2011 | 1.00 | .001 | (.001 | ) | 1.00 | .11 | .14 | .14 | .12 | 767,737 | |||
| Hamilton Shares | |||||||||||||
| Year Ended December 31, | |||||||||||||
| 2015 | 1.00 | .000 | a | (.000 | )a | 1.00 | .02 | .19 | .18 | .02 | 1,093,087 | ||
| 2014 | 1.00 | .000 | a | (.000 | )a | 1.00 | .00 | b | .19 | .17 | .00 | b | 1,191,569 |
| 2013 | 1.00 | .000 | a | (.000 | )a | 1.00 | .01 | .19 | .17 | .01 | 1,671,719 | ||
| 2012 | 1.00 | .001 | (.001 | ) | 1.00 | .07 | .19 | .19 | .07 | 1,469,811 | |||
| 2011 | 1.00 | .001 | (.001 | ) | 1.00 | .07 | .19 | .19 | .08 | 1,823,501 | |||
| Agency Shares | |||||||||||||
| Year Ended December 31, | |||||||||||||
| 2015 | 1.00 | .000 | a | (.000 | )a | 1.00 | .00 | b | .29 | .20 | .00 | b | 11,340 |
| 2014 | 1.00 | .000 | a | (.000 | )a | 1.00 | .00 | b | .29 | .17 | .00 | b | 12,500 |
| 2013 | 1.00 | .000 | a | (.000 | )a | 1.00 | .00 | b | .29 | .18 | .00 | b | 13,861 |
| 2012 | 1.00 | .000 | a | (.000 | )a | 1.00 | .00 | b | .29 | .26 | .00 | b | 22,295 |
| 2011 | 1.00 | .000 | a | (.000 | )a | 1.00 | .01 | .29 | .24 | .01 | 21,794 | ||
| Premier Shares | |||||||||||||
| Year Ended December 31, | |||||||||||||
| 2015 | 1.00 | .000 | a | (.000 | )a | 1.00 | .00 | b | .44 | .20 | .00 | b | 168,074 |
| 2014 | 1.00 | .000 | a | (.000 | )a | 1.00 | .00 | b | .44 | .17 | .00 | b | 238,608 |
| 2013 | 1.00 | .000 | a | (.000 | )a | 1.00 | .00 | b | .44 | .18 | .00 | b | 400,990 |
| 2012 | 1.00 | .000 | a | (.000 | )a | 1.00 | .00 | b | .44 | .26 | .00 | b | 337,837 |
| 2011 | 1.00 | .000 | a | (.000 | )a | 1.00 | .00 | b | .44 | .26 | .00 | b | 416,300 |
| Classic Shares | |||||||||||||
| Year Ended December 31, | |||||||||||||
| 2015 | 1.00 | .000 | a | (.000 | )a | 1.00 | .00 | b | .69 | .21 | .00 | b | 2,129 |
| 2014 | 1.00 | .000 | a | (.000 | )a | 1.00 | .00 | b | .69 | .17 | .00 | b | 27,824 |
| 2013 | 1.00 | .000 | a | (.000 | )a | 1.00 | .00 | b | .69 | .18 | .00 | b | 129,314 |
| 2012 | 1.00 | .000 | a | (.000 | )a | 1.00 | .00 | b | .69 | .26 | .00 | b | 169,866 |
| 2011 | 1.00 | .000 | a | (.000 | )a | 1.00 | .00 | b | .69 | .26 | .00 | b | 177,397 |
| a | Amount represents less than $.001 per share. |
| b | Amount represents less than .01%. |
See notes to financial statements.
The Funds 17
FINANCIAL HIGHLIGHTS (continued)
| Per Share Data ($) | Ratios/Supplemental Data (%) | ||||||||||||
| Ratio of | Ratio of | Ratio of Net | |||||||||||
| Net Asset | Dividends | Net Asset | Total | Net | Investment | Net Assets | |||||||
| Value | Net | from Net | Value | Expenses | Expenses | Income to | End of | ||||||
| Beginning | Investment | Investment | End | Total | to Average | to Average | Average | Period | |||||
| of Period | Income | Income | of Period | Return (%) | Net Assets | Net Assets | Net Assets | ($x1,000) | |||||
| Dreyfus Institutional Treasury and | |||||||||||||
| Agency Cash Advantage Fund | |||||||||||||
| Institutional Shares | |||||||||||||
| Year Ended December 31, | |||||||||||||
| 2015 | 1.00 | .000 | a | (.000 | )a | 1.00 | .00 | b | .14 | .08 | .00 | b | 126,785 |
| 2014 | 1.00 | .000 | a | (.000 | )a | 1.00 | .00 | b | .14 | .06 | .00 | b | 201,407 |
| 2013 | 1.00 | .000 | a | (.000 | )a | 1.00 | .00 | b | .14 | .07 | .00 | b | 174,820 |
| 2012 | 1.00 | .000 | a | (.000 | )a | 1.00 | .01 | .14 | .12 | .02 | 112,618 | ||
| 2011 | 1.00 | .000 | a | (.000 | )a | 1.00 | .01 | .14 | .10 | .01 | 125,472 | ||
| Hamilton Shares | |||||||||||||
| Year Ended December 31, | |||||||||||||
| 2015 | 1.00 | .000 | a | (.000 | )a | 1.00 | .00 | b | .19 | .08 | .00 | b | 195,153 |
| 2014 | 1.00 | .000 | a | (.000 | )a | 1.00 | .00 | b | .19 | .06 | .00 | b | 218,027 |
| 2013 | 1.00 | .000 | a | (.000 | )a | 1.00 | .00 | b | .19 | .07 | .00 | b | 240,368 |
| 2012 | 1.00 | .000 | a | (.000 | )a | 1.00 | .00 | b | .19 | .14 | .00 | b | 129,501 |
| 2011 | 1.00 | .000 | a | (.000 | )a | 1.00 | .00 | b | .19 | .10 | .00 | b | 281,715 |
| Agency Shares | |||||||||||||
| Year Ended December 31, | |||||||||||||
| 2015 | 1.00 | .000 | a | (.000 | )a | 1.00 | .00 | b | .29 | .08 | .00 | b | 3,693 |
| 2014 | 1.00 | .000 | a | (.000 | )a | 1.00 | .00 | b | .29 | .06 | .00 | b | 4,507 |
| 2013 | 1.00 | .000 | a | (.000 | )a | 1.00 | .00 | b | .29 | .08 | .00 | b | 3,412 |
| 2012 | 1.00 | .000 | a | (.000 | )a | 1.00 | .00 | b | .29 | .14 | .00 | b | 3,467 |
| 2011 | 1.00 | .000 | a | (.000 | )a | 1.00 | .00 | b | .29 | .12 | .00 | b | 3,464 |
| Premier Shares | |||||||||||||
| Year Ended December 31, | |||||||||||||
| 2015 | 1.00 | .000 | a | (.000 | )a | 1.00 | .00 | b | .44 | .08 | .00 | b | 482,654 |
| 2014 | 1.00 | .000 | a | (.000 | )a | 1.00 | .00 | b | .44 | .06 | .00 | b | 668,132 |
| 2013 | 1.00 | .000 | a | (.000 | )a | 1.00 | .00 | b | .44 | .08 | .00 | b | 1,093,976 |
| 2012 | 1.00 | .000 | a | (.000 | )a | 1.00 | .00 | b | .44 | .14 | .00 | b | 819,532 |
| 2011 | 1.00 | .000 | a | (.000 | )a | 1.00 | .00 | b | .44 | .09 | .00 | b | 1,024,524 |
| Classic Shares | |||||||||||||
| Year Ended December 31, | |||||||||||||
| 2015 | 1.00 | .000 | a | (.000 | )a | 1.00 | .00 | b | .69 | .09 | .00 | b | 2,570 |
| 2014 | 1.00 | .000 | a | (.000 | )a | 1.00 | .00 | b | .69 | .06 | .00 | b | 13,102 |
| 2013 | 1.00 | .000 | a | (.000 | )a | 1.00 | .00 | b | .69 | .08 | .00 | b | 194,691 |
| 2012 | 1.00 | .000 | a | (.000 | )a | 1.00 | .00 | b | .69 | .14 | .00 | b | 164,935 |
| 2011 | 1.00 | .000 | a | (.000 | )a | 1.00 | .00 | b | .69 | .10 | .00 | b | 203,642 |
| a | Amount represents less than $.001 per share. |
| b | Amount represents less than .01%. |
See notes to financial statements.
18
| Per Share Data ($) | Ratios/Supplemental Data (%) | ||||||||||||
| Ratio of | Ratio of | Ratio of Net | |||||||||||
| Net Asset | Dividends | Net Asset | Total | Net | Investment | Net Assets | |||||||
| Value | Net | from Net | Value | Expenses | Expenses | Income to | End of | ||||||
| Beginning | Investment | Investment | End | Total | to Average | to Average | Average | Period | |||||
| of Period | Income | Income | of Period | Return (%) | Net Assets | Net Assets | Net Assets | ($x1,000) | |||||
| Dreyfus Institutional Treasury | |||||||||||||
| Prime Cash Advantage Fund | |||||||||||||
| Institutional Shares | |||||||||||||
| Year Ended December 31, | |||||||||||||
| 2015 | 1.00 | .000 | a | (.000 | )a | 1.00 | .00 | b | .16 | .04 | .00 | b | 351,361 |
| 2014 | 1.00 | .000 | a | (.000 | )a | 1.00 | .00 | b | .16 | .03 | .00 | b | 335,941 |
| 2013 | 1.00 | .000 | a | (.000 | )a | 1.00 | .00 | b | .16 | .05 | .00 | b | 342,749 |
| 2012 | 1.00 | .000 | a | (.000 | )a | 1.00 | .00 | b | .16 | .07 | .00 | b | 273,337 |
| 2011 | 1.00 | .000 | a | (.000 | )a | 1.00 | .00 | b | .16 | .07 | .00 | b | 579,982 |
| Hamilton Shares | |||||||||||||
| Year Ended December 31, | |||||||||||||
| 2015 | 1.00 | .000 | a | (.000 | )a | 1.00 | .00 | b | .20 | .04 | .00 | b | 4,395 |
| 2014 | 1.00 | .000 | a | (.000 | )a | 1.00 | .00 | b | .20 | .03 | .00 | b | 6,888 |
| 2013 | 1.00 | .000 | a | (.000 | )a | 1.00 | .00 | b | .20 | .06 | .00 | b | 6,990 |
| 2012 | 1.00 | .000 | a | (.000 | )a | 1.00 | .00 | b | .20 | .08 | .00 | b | 43,442 |
| 2011 | 1.00 | .000 | a | (.000 | )a | 1.00 | .00 | b | .20 | .08 | .00 | b | 24,633 |
| Premier Shares | |||||||||||||
| Year Ended December 31, | |||||||||||||
| 2015 | 1.00 | .000 | a | (.000 | )a | 1.00 | .00 | b | .45 | .04 | .00 | b | 401,092 |
| 2014 | 1.00 | .000 | a | (.000 | )a | 1.00 | .00 | b | .45 | .03 | .00 | b | 384,388 |
| 2013 | 1.00 | .000 | a | (.000 | )a | 1.00 | .00 | b | .45 | .05 | .00 | b | 422,077 |
| 2012 | 1.00 | .000 | a | (.000 | )a | 1.00 | .00 | b | .45 | .08 | .00 | b | 332,522 |
| 2011 | 1.00 | .000 | a | (.000 | )a | 1.00 | .00 | b | .45 | .07 | .00 | b | 244,127 |
| a | Amount represents less than $.001 per share. |
| b | Amount represents less than .01%. |
See notes to financial statements.
The Funds 19
NOTES TO FINANCIAL STATEMENTS
NOTE 1—Significant Accounting Policies:
Dreyfus Institutional Preferred Government Money Market Fund, Dreyfus Institutional Treasury and Agency Cash Advantage Fund and Dreyfus Institutional Treasury Prime Cash Advantage Fund (each, a “fund” and collectively, the “funds”), each a separate series of Dreyfus Institutional Reserves Funds (the “Company”), are diversified open-end management investment companies registered under the Investment Company Act of 1940, as amended (the “Act”). Each fund’s investment objective is to seek to provide investors with as high a level of current income as is consistent with the preservation of capital and the maintenance of liquidity. The Dreyfus Corporation (the “Manager” or “Dreyfus”), a wholly-owned subsidiary of The Bank of New York Mellon Corporation (“BNY Mellon”), serves as the funds’ investment adviser.
The Company’s Board of Trustees (the “Board”) approved changes in the funds’ names. The Board approved, on April 30, 2015, effective November 1, 2015, a change from “Dreyfus Institutional Reserves Money Fund” to “Dreyfus Institutional Preferred Government Money Market Fund”. The Board also approved, on April 30, 2015, effective September 1, 2015, changes from “Dreyfus Institutional Reserves Treasury Fund” and “Dreyfus Institutional Reserves Treasury Prime Fund” to “Dreyfus Institutional Treasury and Agency Cash Advantage Fund” and “Dreyfus Institutional Treasury Prime Cash Advantage Fund”, respectively.
The Board approved, on December 14, 2015, effective January 1 2016, changes in the funds’ fiscal year ends from December 31 to March 31 for Dreyfus Institutional Preferred Government Money Market Fund and April 30 for Dreyfus Institutional Treasury and Agency Cash Advantage Fund and Dreyfus Institutional Treasury Prime Cash Advantage Fund.
MBSC Securities Corporation (the “Distributor”), a wholly-owned subsidiary of Dreyfus, is the distributor of each fund’s shares, which are sold to the public without a sales charge. Each fund offers Institutional shares, Hamilton shares, and Premier shares. In addition, Dreyfus Institutional Preferred Government Money Market Fund and Dreyfus Institutional Treasury and Agency Cash Advantage Fund also offer Agency shares and Classic shares. Each fund is authorized to issue an unlimited number of $.001 par value shares of Beneficial Interest. Hamilton shares, Agency shares, Premier shares and Classic shares are subject to a Service Plan adopted pursuant to Rule 12b-1 under the Act. Other differences between the classes include the services offered to and the expenses borne by each class, and certain voting rights. Income, expenses (other than expenses attributable to a specific class), and realized and unrealized gains or losses on investments are allocated to each class of shares based on its relative net assets.
It is each fund’s policy to maintain a continuous net asset value per share of $1.00; the funds have adopted certain investment, portfolio valuation and dividend and distribution policies to enable it to do so.There is no assurance, however, that the funds will be able to maintain a stable net asset value per share of $1.00.
The Company accounts separately for the assets, liabilities and operations of each series. Expenses directly attributable to each series are charged to that series’ operations; expenses which are applicable to all series are allocated among them on a pro rata basis.
The Financial Accounting Standards Board (“FASB”) Accounting Standards Codification (“ASC”) is the exclusive reference of authoritative U.S. generally accepted accounting principles (“GAAP”) recognized by the FASB to be applied by nongovernmental entities. Rules and interpretive releases of the Securities and Exchange Commission (“SEC”) under authority of federal laws are also sources of authoritative GAAP for SEC registrants.The funds’ financial statements are prepared in accordance with GAAP, which may require the use of management estimates and assumptions. Actual results could differ from those estimates.
The Company enters into contracts that contain a variety of indemnifications.The funds’ maximum exposure under these arrangements is unknown. The funds do not anticipate recognizing any loss related to these arrangements.
20
(a) Portfolio valuation: Investments in securities are valued at amortized cost in accordance with Rule 2a-7 under the Act. If amortized cost is determined not to approximate market value, the fair value of the portfolio securities will be determined by procedures established by and under the general supervision of the Board.
The fair value of a financial instrument is the amount that would be received to sell an asset or paid to transfer a liability in an orderly transaction between market participants at the measurement date (i.e., the exit price). GAAP establishes a fair value hierarchy that prioritizes the inputs of valuation techniques used to measure fair value. This hierarchy gives the highest priority to unadjusted quoted prices in active markets for identical assets or liabilities (Level 1 measurements) and the lowest priority to unobservable inputs (Level 3 measurements).
Additionally, GAAP provides guidance on determining whether the volume and activity in a market has decreased significantly and whether such a decrease in activity results in transactions that are not orderly. GAAP requires enhanced disclosures around valuation inputs and techniques used during annual and interim periods.
Various inputs are used in determining the value of each fund’s investments relating to fair value measurements.These inputs are summarized in the three broad levels listed below:
Level 1—unadjusted quoted prices in active markets for identical investments.
Level 2—other significant observable inputs (including quoted prices for similar investments, interest rates, prepayment speeds, credit risk, etc.).
Level 3—significant unobservable inputs (including the fund’s own assumptions in determining the fair value of investments).
The inputs or methodology used for valuing securities are not necessarily an indication of the risk associated with investing in those securities. For example, money market securities are valued using amortized cost, in accordance with rules under the Act. Generally, amortized cost approximates the current fair value of a security, but since the value is not obtained from a quoted price in an active market, such securities are reflected within Level 2 of the fair value hierarchy.
At December 31, 2015, all of the securities in each fund were considered Level 2 of the fair value hierarchy.
At December 31, 2015, there were no transfers between levels of the fair value hierarchy.
(b) Securities transactions and investment income:
Securities transactions are recorded on a trade date basis. Interest income, adjusted for accretion of discount and amortization of premium on investments, is earned from settlement date and is recognized on the accrual basis. Realized gains and losses from securities transactions are recorded on the identified cost basis. Cost of investments represents amortized cost.
Dreyfus Institutional Preferred Government Money Market Fund and Dreyfus Institutional Treasury and Agency Cash Advantage Fund may enter into repurchase agreements with financial institutions, deemed to be creditworthy by Dreyfus, subject to the seller’s agreement to repurchase and the funds’ agreement to resell such securities at a mutually agreed upon price. Pursuant to the terms of the repurchase agreement, such securities must have an aggregate market value greater than or equal to the terms of the repurchase price plus accrued interest at all times. If the value of the underlying securities falls below the value of the repurchase price plus accrued interest, the funds will require the seller to deposit additional collateral by the next business day. If the request for additional collateral is not met, or the seller defaults on its repurchase obligation, the funds maintain their right to sell the underlying securities at market value and may claim any resulting loss against the seller. The funds may also jointly enter into one or more repurchase agreements with other Dreyfus-managed funds in accordance with an exemptive order granted by the SEC pursuant to section 17(d) and Rule
The Funds 21
NOTES TO FINANCIAL STATEMENTS (continued)
17d-1 under the Act. Any joint repurchase agreements must be collateralized fully by U.S. Government securities.
(c) Dividends to shareholders: It is the policy of each fund to declare dividends daily from investment income-net. Such dividends are paid monthly. Dividends from net realized capital gains, if any, are normally declared and paid annually, but each fund may make distributions on a more frequent basis to comply with the distribution requirements of the Internal Revenue Code of 1986, as amended (the “Code”). To the extent that net realized capital gains can be offset by capital loss carryovers, it is the policy of each fund not to distribute such gains.
(d) Federal income taxes: It is the policy of each fund to continue to qualify as a regulated investment company, if such qualification is in the best interests of its shareholders, by complying with the applicable provisions of the Code, and to make distributions of taxable income sufficient to relieve it from substantially all federal income and excise taxes. For federal tax purposes, each fund is treated as a separate entity for the purpose of determining such qualification.
As of and during the period ended December 31, 2015, the funds did not have any liabilities for any uncertain tax positions. Each fund recognizes interest and penalties, if any, related to uncertain tax positions as income tax expense in the Statements of Operations. During the period ended December 31, 2015, the funds did not incur any interest or penalties.
Each tax year in the four-year period ended December 31, 2015 remains subject to examination by the Internal Revenue Service and state taxing authorities.
At December 31, 2015, the components of accumulated earnings on a tax basis for each fund were substantially the same as for financial reporting purposes.
Under the Regulated Investment Company Modernization Act of 2010 (the “2010 Act”), each fund is permitted to carry forward capital losses incurred in taxable years beginning after December 22, 2010 (“post-enactment losses”) for an unlimited period. Furthermore, post-enactment capital loss carryovers retain their character as either short-term or long-term capital losses rather than short-term as they were under previous statute. The 2010 Act requires post-enactment losses to be utilized before the utilization of losses incurred in taxable years prior to the effective date of the 2010 Act (“pre-enactment losses”). As a result of this ordering rule, pre-enactment losses may be more likely to expire unused.
Dreyfus Institutional Treasury Prime Cash Advantage Fund’s accumulated capital loss carryover is available for federal income tax purposes to be applied against future net realized capital gains, if any, realized subsequent to December 31, 2015. If not applied, $3,151 of the carryover expires in fiscal year 2016 and $16 expires in fiscal year 2018.
The tax character of distributions paid to shareholders for each fund during the fiscal periods ended December 31, 2015 and December 31, 2014 were all ordinary income.
During the period ended December 31, 2015, as a result of permanent book to tax differences, primarily due to the tax treatment for a capital loss carryover expiration, Dreyfus Institutional Preferred Government Money Market Fund increased accumulated net realized gain (loss) on investments by $11,572 and decreased paid-in capital by the same amount. Net assets and net asset value per share were not affected by this reclassification.
During the period ended December 31, 2015, as a result of permanent book to tax differences, primarily due to dividend reclassification, Dreyfus Institutional Treasury and Agency Cash Advantage Fund increased accumulated undistributed investment income-net by $4,685 and decreased accumulated net realized gain (loss) on investments by the same amount. Net assets and net asset value per share were not affected by this reclassification.
At December 31, 2015, the cost of investments for federal income tax purposes for each fund was substantially the same as the cost for financial reporting purposes (see the Statements of Investments).
22
NOTE 2—Management Fee and Other Transactions with Affiliates:
(a) Pursuant to a management agreement with Dreyfus, the management fee for Dreyfus Institutional Preferred Government Money Market Fund, Dreyfus Institutional Treasury and Agency Cash Advantage Fund and Dreyfus Institutional Treasury Prime Cash Advantage Fund is computed at the annual rates of .14%, .14% and .16%, respectively, of the value of each fund’s average daily net assets and is payable monthly. Pursuant to each fund’s management agreement, Dreyfus has agreed to reduce its management fee in an amount equal to the Trustees’ fees and expenses of independent counsel of each fund. For Dreyfus Institutional Preferred Government Money Market Fund, Dreyfus has also contractually agreed, from November 1, 2015 through May 1, 2017 to waive receipt of its fees and/or assume the expenses of the fund so that annual fund operating expenses (excluding certain expenses as described above) do not exceed .10% of the value of the fund’s average daily net assets. During the period ended December 31, 2015, fees reimbursed by Dreyfus amounted to $58,944 for Dreyfus Institutional Preferred Government Money Market Fund, $26,571 for Dreyfus Institutional Treasury and Agency Cash Advantage Fund and $17,401 for Dreyfus Institutional Treasury Prime Cash Advantage Fund.
As to each fund, unless Dreyfus gives a fund’s investors 90 days notice to the contrary, Dreyfus, and not the fund, will be liable for fund expenses (exclusive of taxes, brokerage commissions and extraordinary expenses) other than the following expenses, which will be borne by the fund: the management fee, and with respect to the funds’ Hamilton shares, Agency shares, Premier shares and Classic shares, Service Plan expenses.
Dreyfus has undertaken to waive receipt of the management fee and/or reimburse operating expenses in order to facilitate a daily yield at or above a certain level which may change from time to time. These undertakings are voluntary and not contractual, and may be terminated at any time. Table 1 summarizes the reduction in expenses for each fund, pursuant to these undertakings, during the period ended December 31, 2015.
| Table 1—Expense Reductions | ||
| Dreyfus Institutional Preferred | ||
| Government Money Market Fund | $ 908,779 | |
| Dreyfus Institutional Treasury and | ||
| Agency Cash Advantage Fund | 2,244,496 | |
| Dreyfus Institutional Treasury | ||
| Prime Cash Advantage Fund | 2,041,560 | |
(b) Under each fund’s Service Plan adopted pursuant to Rule 12b-1 under the Act, with respect to each fund’s applicable Hamilton shares, Agency shares, Premier shares and Classic shares, each fund pays the Distributor for distributing such classes of shares, for servicing and/or maintaining shareholder accounts and for advertising and marketing. For Dreyfus Institutional Preferred Government Money Market Fund and Dreyfus Institutional Treasury and Agency Cash Advantage Fund, the Service Plan provides for payments to be made at annual rates of .05%, .15%, .30% and .55% of the value of such class’ average daily net assets of the Hamilton,Agency, Premier and Classic shares, respectively. The Service Plan provides for payments to be made at annual rates of .04% and .29% for Dreyfus Institutional Treasury Prime Cash Advantage Fund’s Hamilton and Premier shares’ average daily net assets, respectively. The fees payable under the Service Plan are payable without regard to actual expenses incurred. Table 2 summarizes the amount each fund was charged pursuant to the Service Plan during the period ended December 31, 2015.
Table 2—Service Plan Fees
| Hamilton | Agency | Premier | Classic | |
| Shares ($) | Shares ($) | Shares ($) | Shares ($) | |
| Dreyfus Institutional Preferred Government Money Market Fund | 591,530 | 15,158 | 711,718 | 146,689 |
| Dreyfus Institutional Treasury and Agency Cash Advantage Fund | 84,803 | 5,664 | 1,575,607 | 67,597 |
| Dreyfus Institutional Treasury Prime Cash Advantage Fund | 1,857 | — | 1,155,150 | — |
The Funds 23
NOTES TO FINANCIAL STATEMENTS (continued)
Table 3 summarizes the components of “Due to The Dreyfus Corporation and affiliates” in the Statements of Assets and Liabilities for each fund.
(c) Each Board member also serves as a Board member of other funds within the Dreyfus complex. Annual retainer fees and attendance fees are allocated to each fund based on net assets.
NOTE 3—Regulatory Developments:
On July 23, 2014, the SEC adopted amendments to the rules that govern the operations of money market mutual
funds. The degree to which a fund will be impacted by the amendments will depend upon the type of fund and the type of investors (retail or institutional). The amendments have staggered compliance dates, but funds must be in compliance with all amendments by October 14, 2016. At this time, management continues to evaluate the implications of the amendments and their impact to the funds’ operations, financial statements and accompanying notes.
| Table 3—Due to The Dreyfus Corporation and Affiliates | ||||
| Management | Service Plan | Less Expense | ||
| Fees ($) | Fees ($) | Reimbursement ($) | ||
| Dreyfus Institutional Preferred Government Money Market Fund | 267,529 | 98,408 | (117,630 | ) |
| Dreyfus Institutional Treasury and Agency Cash Advantage Fund | 82,433 | 129,012 | (127,111 | ) |
| Dreyfus Institutional Treasury Prime Cash Advantage Fund | 95,111 | 99,268 | (149,184 | ) |
24
REPORT OF INDEPENDENT REGISTERED PUBLIC ACCOUNTING FIRM
Shareholders and Board of Trustees
Dreyfus Institutional Reserves Funds:
Dreyfus Institutional Preferred
Government Money Market Fund
Dreyfus Institutional Treasury and
Agency Cash Advantage Fund
Dreyfus Institutional Treasury
Prime Cash Advantage Fund
We have audited the accompanying statements of assets and liabilities, including the statements of investments, of Dreyfus Institutional Reserves Funds (comprising, respectively, Dreyfus Institutional Preferred Government Money Market Fund (formerly, Dreyfus Institutional Reserves Money Fund), Dreyfus Institutional Treasury and Agency Cash Advantage Fund (formerly, Dreyfus Institutional Reserves Treasury Fund), and Dreyfus Institutional Treasury Prime Cash Advantage Fund (formerly, Dreyfus Institutional Reserves Treasury Prime Fund)) as of December 31, 2015, and the related statements of operations for the year then ended, the statements of changes in net assets for each of the two years in the period then ended, and the financial highlights for each of the five years in the period then ended. These financial statements and financial highlights are the responsibility of the Funds’ management. Our responsibility is to express an opinion on these financial statements and financial highlights based on our audits.
We conducted our audits in accordance with the standards of the Public Company Accounting Oversight Board (United States).Those standards require that we plan and perform the audit to obtain reasonable assurance about whether the financial statements and financial highlights are free of material misstatement.We were not engaged to perform an audit of the Funds’ internal control over financial reporting. Our audits included consideration of internal control over financial reporting as a basis for designing audit procedures that are appropriate in the circumstances, but not for the purpose of expressing an opinion on the effectiveness of the Funds’ internal control over financial reporting. Accordingly, we express no such opinion. An audit also includes examining, on a test basis, evidence supporting the amounts and disclosures in the financial statements and financial highlights, assessing the accounting principles used and significant estimates made by management, and evaluating the overall financial statement presentation. Our procedures included confirmation of securities owned as of December 31, 2015 by correspondence with the custodian and others. We believe that our audits provide a reasonable basis for our opinion.
In our opinion, the financial statements and financial highlights referred to above present fairly, in all material respects, the financial position of each of the respective series constituting Dreyfus Institutional Reserves Funds at December 31, 2015, the results of their operations for the year then ended, the changes in their net assets for each of the two years in the period then ended, and the financial highlights for each of the five years in the period then ended, in conformity with U.S. generally accepted accounting principles.

The Funds 25
IMPORTANT TAX INFORMATION (Unaudited)
Dreyfus Institutional Preferred Government Money Market Fund
For federal tax purposes, the fund hereby reports 88.82% of ordinary income dividends paid during the fiscal year ended December 31, 2015 as qualifying “interest-related dividends”.
Dreyfus Institutional Treasury and Agency Cash Advantage Fund
For federal tax purposes, the fund hereby reports 100% of ordinary income dividends paid during the fiscal year ended December 31, 2015 as qualifying “interest-related dividends”.
Dreyfus Institutional Treasury Prime Cash Advantage Fund
For federal tax purposes, the fund hereby reports 100% of ordinary income dividends paid during the fiscal year ended December 31, 2015 as qualifying interest-related dividends. For state individual income tax purposes, the fund hereby reports 100% of the ordinary income dividends paid during its fiscal year ended December 31, 2015 as attributable to interest income from direct obligations of the United States. Such dividends are currently exempt from taxation for individual income tax purposes in most states, including New York, California, Connecticut and the District of Columbia.
26
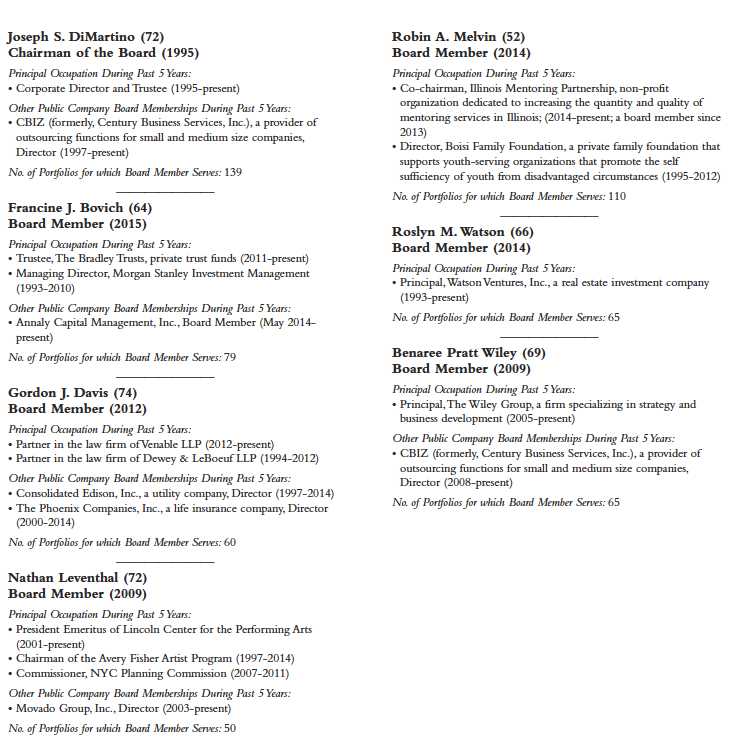
BOARD MEMBERS INFORMATION (Unaudited)
INDEPENDENT BOARD MEMBERS
The Funds 27
BOARD MEMBERS INFORMATION (Unaudited) (continued)
INTERESTED BOARD MEMBERS

28
OFFICERS OF THE FUND (Unaudited)
BRADLEY J. SKAPYAK, President since January 2010.
Chief Operating Officer and a director of the Manager since June 2009, Chairman of Dreyfus Transfer, Inc., an affiliate of the Manager and the transfer agent of the funds, since May 2011 and Executive Vice President of the Distributor since June 2007. From April 2003 to June 2009, Mr. Skapyak was the head of the Investment Accounting and Support Department of the Manager. He is an officer of 65 investment companies (comprised of 139 portfolios) managed by the Manager. He is 57 years old and has been an employee of the Manager since February 1988.
BENNETT A. MACDOUGALL, Chief Legal Officer since October 2015
Chief Legal Officer of the Manager since June 2015; from June 2005 to June 2015, Director and Associate General Counsel of Deutsche Bank –Asset & Wealth Management Division, and Chief Legal Officer of Deutsche Investment Management Americas Inc. He is an officer of 66 investment companies (comprised of 164 portfolios) managed by the Manager. He is 44 years old and has been an employee of the Manager since June 2015.
JANETTE E. FARRAGHER, Vice President and Secretary since December 2011.
Assistant General Counsel of BNY Mellon, and an officer of 66 investment companies (comprised of 164 portfolios) managed by the Manager. She is 53 years old and has been an employee of the Manager since February 1984.
JAMES BITETTO, Vice President and Assistant Secretary since January 2008.
Managing Counsel of BNY Mellon and Secretary of the Manager, and an officer of 66 investment companies (comprised of 164 portfolios) managed by the Manager. He is 49 years old and has been an employee of the Manager since December 1996.
JONI LACKS CHARATAN, Vice President and Assistant Secretary since January 2008.
Managing Counsel of BNY Mellon, and an officer of 66 investment companies (comprised of 164 portfolios) managed by the Manager. She is 60 years old and has been an employee of the Manager since October 1988.
JOSEPH M. CHIOFFI, Vice President and Assistant Secretary since January 2008.
Managing Counsel of BNY Mellon, and an officer of 66 investment companies (comprised of 164 portfolios) managed by the Manager. He is 54 years old and has been an employee of the Manager since June 2000.
MAUREEN E. KANE, Vice President and Assistant Secretary since April 2015.
Managing Counsel of BNY Mellon since July 2014; from October 2004 until July 2014, General Counsel, and from May 2009 until July 2014, Chief Compliance Officer of Century Capital Management. She is an officer of 66 investment companies (comprised of 164 portfolios) managed by the Manager. She is 53 years old and has been an employee of the Manager since July 2014.
SARAH S. KELLEHER, Vice President and Assistant Secretary since April 2014.
Senior Counsel of BNY Mellon, and an officer of 66 investment companies (comprised of 164 portfolios) managed by the Manager; from January 2008 to March 2013, Associate General Counsel of Third Avenue Management. She is 40 years old and has been an employee of the Manager since March 2013.
JEFF PRUSNOFSKY, Vice President and Assistant Secretary since January 2008.
Senior Managing Counsel of BNY Mellon, and an officer of 66 investment companies (comprised of 164 portfolios) managed by the Manager. He is 50 years old and has been an employee of the Manager since October 1990.
JAMES WINDELS, Treasurer since January 2008.
Director – Mutual Fund Accounting of the Manager, and an officer of 66 investment companies (comprised of 164 portfolios) managed by the Manager. He is 57 years old and has been an employee of the Manager since April 1985.
RICHARD CASSARO, Assistant Treasurer since January 2008.
Senior Accounting Manager – Money Market and Municipal Bond Funds of the Manager, and an officer of 66 investment companies (comprised of 164 portfolios) managed by the Manager. He is 56 years old and has been an employee of the Manager since September 1982.
GAVIN C. REILLY, Assistant Treasurer since January 2008.
Tax Manager of the Investment Accounting and Support Department of the Manager, and an officer of 66 investment companies (comprised of 164 portfolios) managed by the Manager. He is 47 years old and has been an employee of the Manager since April 1991.
The Funds 29
OFFICERS OF THE FUND (Unaudited) (continued)
ROBERT S. ROBOL, Assistant Treasurer since January 2008.
Senior Accounting Manager – Fixed Income Funds of the Manager, and an officer of 66 investment companies (comprised of 164 portfolios) managed by the Manager. He is 51 years old and has been an employee of the Manager since October 1988.
ROBERT SALVIOLO, Assistant Treasurer since January 2008.
Senior Accounting Manager – Equity Funds of the Manager, and an officer of 66 investment companies (comprised of 164 portfolios) managed by the Manager. He is 48 years old and has been an employee of the Manager since June 1989.
ROBERT SVAGNA, Assistant Treasurer since January 2008.
Senior Accounting Manager – Equity Funds of the Manager, and an officer of 66 investment companies (comprised of 164 portfolios) managed by the Manager. He is 48 years old and has been an employee of the Manager since November 1990.
JOSEPH W. CONNOLLY, Chief Compliance Officer since January 2008.
Chief Compliance Officer of the Manager and The Dreyfus Family of Funds (66 investment companies, comprised of 164 portfolios). He is 58 years old and has served in various capacities with the Manager since 1980, including manager of the firm’s Fund Accounting Department from 1997 through October 2001.
CARI M. CAROSELLA, Anti-Money Laundering Compliance Officer since January 2016
Anti-Money Laundering Compliance Officer of the Dreyfus Family of Funds and BNY Mellon Funds Trust since January 2016; from May 2015 to December 2015, Interim Anti-Money Laundering Compliance Officer of the Dreyfus Family of Funds and BNY Mellon Funds Trust and the Distributor; from January 2012 to May 2015, AML Surveillance Officer of the Distributor and from 2007 to December 2011, Financial Processing Manager of the Distributor. She is an officer of 62 investment companies (comprised of 160 portfolios) managed by the Manager. She is 47 years old and has been an employee of the Distributor since 1997.
30
The Funds 31
For More Information
| Dreyfus Institutional Reserves Funds | Transfer Agent & |
| 200 Park Avenue | Dividend Disbursing Agent |
| NewYork, NY 10166 | Dreyfus Transfer, Inc. |
| Manager | 200 Park Avenue |
| NewYork, NY 10166 | |
| The Dreyfus Corporation | |
| 200 Park Avenue | Distributor |
| NewYork, NY 10166 | MBSC Securities Corporation |
| Custodian | 200 Park Avenue |
| NewYork, NY 10166 | |
| The Bank of NewYork Mellon | |
| 225 Liberty Street | |
| NewYork, NY 10286 |
| Ticker Symbols: | Institutional | Hamilton | Agency | Premier | Classic |
| Dreyfus Institutional Preferred Government Money Market Fund | DSVXX | DSHXX | DRGXX | DERXX | DLSXX |
| Dreyfus Institutional Treasury and Agency Cash Advantage Fund | DNSXX | DHLXX | DGYXX | DRRXX | DSSXX |
| Dreyfus Institutional Treasury Prime Cash Advantage Fund | DUPXX | DHMXX | DMEXX |
| Telephone Call your Dreyfus Cash Investment Services Division representative or 1-800-346-3621 |
| E-mail Access Dreyfus Cash Investment Services Division at www.dreyfus.com. |
| You can obtain product information and E-mail requests for information or literature. |
| Mail Dreyfus Cash Investment Services Division, 144 Glenn Curtiss Boulevard, Uniondale, NY 11556-0144 |
Each fund will disclose daily, on www.dreyfus.com, the complete schedule of each fund’s holdings as of the end of the previous business day. The schedule of holdings will remain on the website until the fund files its Form N-Q or Form N-CSR for the period that includes the date of the posted holdings.
Each fund files its complete schedule of portfolio holdings with the Securities and Exchange Commission (“SEC”) for the first and third quarters of each fiscal year on Form N-Q. Each fund’s Forms N-Q are available on the SEC’s website at http://www.sec.gov and may be reviewed and copied at the SEC’s Public Reference Room in Washington, DC. Information on the operation of the Public Reference Room may be obtained by calling 1-800-SEC-0330.
Information regarding how each fund voted proxies relating to portfolio securities for the most recent 12-month period ended June 30 is available on the SEC’s website at http://www.sec.gov and without charge, upon request, by calling 1-800-DREYFUS.

Item 2. Code of Ethics.
The Registrant has adopted a code of ethics that applies to the Registrant's principal executive officer, principal financial officer, principal accounting officer or controller, or persons performing similar functions. There have been no amendments to, or waivers in connection with, the Code of Ethics during the period covered by this Report.
Item 3. Audit Committee Financial Expert.
The Registrant's Board has determined that Joseph S. Martino, a member of the Audit Committee of the Board, is an audit committee financial expert as defined by the Securities and Exchange Commission (the "SEC"). Joseph S. Martino, is "independent" as defined by the SEC for purposes of audit committee financial expert determinations.
Item 4. Principal Accountant Fees and Services.
(a) Audit Fees. The aggregate fees billed for each of the last two fiscal years (the "Reporting Periods") for professional services rendered by the Registrant's principal accountant (the "Auditor") for the audit of the Registrant's annual financial statements or services that are normally provided by the Auditor in connection with the statutory and regulatory filings or engagements for the Reporting Periods, were $96,678 in 2014 and $99,093in 2015.
(b) Audit-Related Fees. The aggregate fees billed in the Reporting Periods for assurance and related services by the Auditor that are reasonably related to the performance of the audit of the Registrant's financial statements and are not reported under paragraph (a) of this Item 4 were $18,360 in 2014 and $18,819 in 2015. These services consisted of one or more of the following: (i) agreed upon procedures related to compliance with Internal Revenue Code section 817(h), (ii) security counts required by Rule 17f-2 under the Investment Company Act of 1940, as amended, (iii) advisory services as to the accounting or disclosure treatment of Registrant transactions or events and (iv) advisory services to the accounting or disclosure treatment of the actual or potential impact to the Registrant of final or proposed rules, standards or interpretations by the Securities and Exchange Commission, the Financial Accounting Standards Boards or other regulatory or standard-setting bodies.
The aggregate fees billed in the Reporting Periods for non-audit assurance and related services by the Auditor to the Registrant's investment adviser (not including any sub-investment adviser whose role is primarily portfolio management and is subcontracted with or overseen by another investment adviser), and any entity controlling, controlled by or under common control with the investment adviser that provides ongoing services to the Registrant ("Service Affiliates"), that were reasonably related to the performance of the annual audit of the Service Affiliate, which required pre-approval by the Audit Committee were $0 in 2014 and $0 in 2015.
(c) Tax Fees. The aggregate fees billed in the Reporting Periods for professional services rendered by the Auditor for tax compliance, tax advice, and tax planning ("Tax Services") were $8,872 in 2014 and $10, 437 in 2015. These services consisted of: (i) review or preparation of U.S. federal, state, local and excise tax returns; (ii) U.S. federal, state and local tax planning, advice and assistance regarding statutory, regulatory or administrative developments; (iii) tax advice regarding tax qualification matters and/or treatment of various financial instruments held or proposed to be acquired or held. The aggregate fees billed in the Reporting Periods for Tax Services by the Auditor to Service Affiliates, which required pre-approval by the Audit Committee were $0 in 2014 and $0 in 2015.
(d) All Other Fees. The aggregate fees billed in the Reporting Periods for products and services provided by the Auditor, other than the services reported in paragraphs (a) through (c) of this Item, were $631 in 2014 and $115 in 2015. [These services consisted of a review of the Registrant's anti-money laundering program].
The aggregate fees billed in the Reporting Periods for Non-Audit Services by the Auditor to Service Affiliates, other than the services reported in paragraphs (b) through (c) of this Item, which required pre-approval by the Audit Committee, were $0 in 2014 and $0 in 2015.
(e)(1) Audit Committee Pre-Approval Policies and Procedures. The Registrant's Audit Committee has established policies and procedures (the "Policy") for pre-approval (within specified fee limits) of the Auditor's engagements for non-audit services to the Registrant and Service Affiliates without specific case-by-case consideration. The pre-approved services in the Policy can include pre-approved audit services, pre-approved audit-related services, pre-approved tax services and pre-approved all other services. Pre-approval considerations include whether the proposed services are compatible with maintaining the Auditor's independence. Pre-approvals pursuant to the Policy are considered annually.
(e)(2) Note: None of the services described in paragraphs (b) through (d) of this Item 4 were approved by the Audit Committee pursuant to paragraph (c)(7)(i)(C) of Rule 2-01 of Regulation S-X.
(f) None of the hours expended on the principal accountant's engagement to audit the registrant's financial statements for the most recent fiscal year were attributed to work performed by persons other than the principal account's full-time, permanent employees.
Non-Audit Fees. The aggregate non-audit fees billed by the Auditor for services rendered to the Registrant, and rendered to Service Affiliates, for the Reporting Periods were $23,307,177 in 2014 and $20,055,582 in 2015.
Auditor Independence. The Registrant's Audit Committee has considered whether the provision of non-audit services that were rendered to Service Affiliates, which were not pre-approved (not requiring pre-approval), is compatible with maintaining the Auditor's independence.
Item 5. Audit Committee of Listed Registrants.
Not applicable. [CLOSED-END FUNDS ONLY]
Item 6. Investments.
(a) Not applicable.
Item 7. Disclosure of Proxy Voting Policies and Procedures for Closed-End Management Investment Companies.
Not applicable.
Item 8. Portfolio Managers of Closed-End Management Investment Companies.
Not applicable.
Item 9. Purchases of Equity Securities by Closed-End Management Investment Companies and Affiliated Purchasers.
Not applicable.
Item 10. Submission of Matters to a Vote of Security Holders.
There have been no material changes to the procedures applicable to Item 10.
Item 11. Controls and Procedures.
(a) The Registrant's principal executive and principal financial officers have concluded, based on their evaluation of the Registrant's disclosure controls and procedures as of a date within 90 days of the filing date of this report, that the Registrant's disclosure controls and procedures are reasonably designed to ensure that information required to be disclosed by the Registrant on Form N-CSR is recorded, processed, summarized and reported within the required time periods and that information required to be disclosed by the Registrant in the reports that it files or submits on Form N-CSR is accumulated and communicated to the Registrant's management, including its principal executive and principal financial officers, as appropriate to allow timely decisions regarding required disclosure.
(b) There were no changes to the Registrant's internal control over financial reporting that occurred during the second fiscal quarter of the period covered by this report that have materially affected, or are reasonably likely to materially affect, the Registrant's internal control over financial reporting.
Item 12. Exhibits.
(a)(1) Code of ethics referred to in Item 2.
(a)(2) Certifications of principal executive and principal financial officers as required by Rule 30a-2(a) under the Investment Company Act of 1940.
(a)(3) Not applicable.
(b) Certification of principal executive and principal financial officers as required by Rule 30a-2(b) under the Investment Company Act of 1940.
SIGNATURES
Pursuant to the requirements of the Securities Exchange Act of 1934 and the Investment Company Act of 1940, the Registrant has duly caused this Report to be signed on its behalf by the undersigned, thereunto duly authorized.
Dreyfus Institutional Reserves Fund
By: /s/ Bradley J. Skapyak
Bradley J. Skapyak,
President
Date: February 23, 2016
Pursuant to the requirements of the Securities Exchange Act of 1934 and the Investment Company Act of 1940, this Report has been signed below by the following persons on behalf of the Registrant and in the capacities and on the dates indicated.
By: /s/ Bradley J. Skapyak
Bradley J. Skapyak,
President
Date: February 23, 2016
By: /s/James Windels
James Windels,
Treasurer
Date: February 23, 2016
EXHIBIT INDEX
(a)(1) Code of ethics referred to in Item 2.
(a)(2) Certifications of principal executive and principal financial officers as required by Rule 30a-2(a) under the Investment Company Act of 1940. (EX-99.CERT)
(b) Certification of principal executive and principal financial officers as required by Rule 30a-2(b) under the Investment Company Act of 1940. (EX-99.906CERT)