- PCB Dashboard
- Financials
- Filings
-
Holdings
-
Transcripts
- ETFs
- Insider
- Institutional
- Shorts
-
FWP Filing
PCB Bancorp (PCB) FWPFree writing prospectus
Filed: 2 Aug 18, 6:16am

Initial Public Offering August 2018 Free Writing Prospectus Filed Pursuant to Rule 433 Registration Statement No. 333-226208 Dated August 2, 2018
Disclaimer / Safe Harbor Pacific City Financial Corporation (“Pacific City,” “PCB,” the “Company,” “we,” “us” or “our”) has filed a registration statement (including a prospectus, which is preliminary and subject to completion) with the U.S. Securities and Exchange Commission (the “SEC”) for the offering to which this communication relates. Before you invest, you should read the prospectus in that registration statement and other documents the Company has filed with the SEC for more complete information about the Company and the offering. You may obtain these documents for free by visiting EDGAR on the SEC website at www.sec.gov. Alternatively, the Company, any underwriter or any dealer participating in the offering will arrange to send you the prospectus if you request it by contacting Keefe, Bruyette & Woods, Inc., toll-free at (800) 966-1559 or by emailing kbwsyndicatedesk@kbw.com, Raymond James & Associates, Inc., toll-free at (800) 248-8863 or by emailing prospectus@raymondjames.com, or Sandler O’Neill & Partners, L.P., toll-free at (866) 805-4128 or by emailing syndicate@sandleroneill.com Certain of the information contained herein may be derived from information provided by industry sources. The Company believes that such information is accurate and the sources from which it has been obtained are reliable; however, the Company cannot guaranty the accuracy of such information and has not independently verified such information. This presentation is not an offer to sell any securities and it is not soliciting an offer to buy any securities in any state or jurisdiction where the offer or sale is not permitted. Neither the SEC nor any state securities commission has approved or disapproved of the securities of the Company or passed upon the accuracy or adequacy of this presentation. Any representation to the contrary is a criminal offense. Except as otherwise indicated, this presentation speaks as of the date hereof. The delivery of this presentation shall not, under any circumstances, create any implication that there has been no change in the affairs of the Company after the date hereof. Our common stock is not a deposit or savings account. Our common stock is not insured by the Federal Deposit Insurance Corporation or any governmental agency or instrumentality. This presentation (and oral statements made regarding the subject of this presentation) contains certain “forward-looking statements” that are based on various facts and derived utilizing numerous important assumptions and are subject to known and unknown risks, uncertainties and other factors that may cause our actual results, performance or achievements to be materially different from any future results, performance or achievements expressed or implied by such forward-looking statements. Forward-looking statements include the information concerning our preliminary financial results as of and for the three and six months ended June 30, 2018, our future financial performance, business and growth strategy, projected plans and objectives, as well as projections of macroeconomic and industry trends, which are inherently unreliable due to the multiple factors that impact economic trends, and any such variations may be material. Statements preceded by, followed by or that otherwise include the words “believes,” “expects,” “anticipates,” “intends,” “projects,” “estimates,” “plans” and similar expressions or future or conditional verbs such as “will,” “should,” “would,” “may” and “could” are generally forward-looking in nature and not historical facts, although not all forward-looking statements include the foregoing. Forward-looking statements are based on management’s current expectations and involve risks and uncertainties that could cause actual results to differ materially from the Company’s historical results or those described in our forward-looking statements. This presentation contains certain non-GAAP financial measures intended to supplement, not substitute for, comparable GAAP measures. Reconciliations of non-GAAP financial measures to GAAP financial measures are provided at the end of this presentation. Numbers in the presentation may not sum due to rounding.
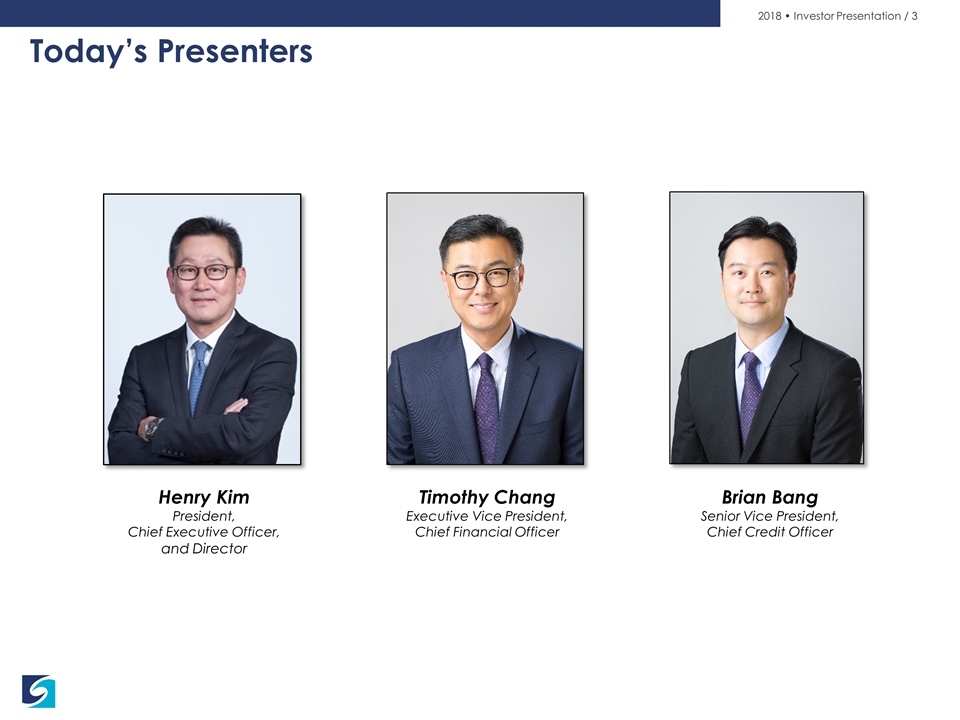
Today’s Presenters Timothy Chang Executive Vice President, Chief Financial Officer Henry Kim President, Chief Executive Officer, and Director Brian Bang Senior Vice President, Chief Credit Officer
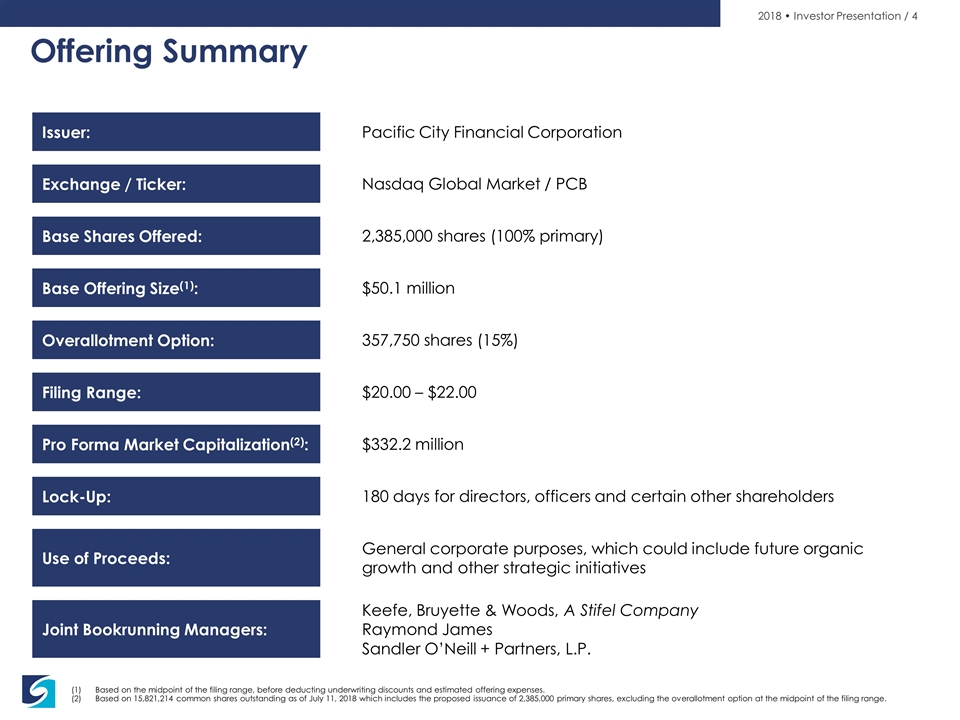
Based on the midpoint of the filing range, before deducting underwriting discounts and estimated offering expenses. Based on 15,821,214 common shares outstanding as of July 11, 2018 which includes the proposed issuance of 2,385,000 primary shares, excluding the overallotment option at the midpoint of the filing range. Offering Summary Issuer: Exchange / Ticker: Base Offering Size(1): Overallotment Option: Filing Range: Base Shares Offered: Pro Forma Market Capitalization(2): Lock-Up: Use of Proceeds: Joint Bookrunning Managers: Pacific City Financial Corporation Nasdaq Global Market / PCB 2,385,000 shares (100% primary) $50.1 million 357,750 shares (15%) $20.00 – $22.00 $332.2 million 180 days for directors, officers and certain other shareholders General corporate purposes, which could include future organic growth and other strategic initiatives Keefe, Bruyette & Woods, A Stifel Company Raymond James Sandler O’Neill + Partners, L.P.
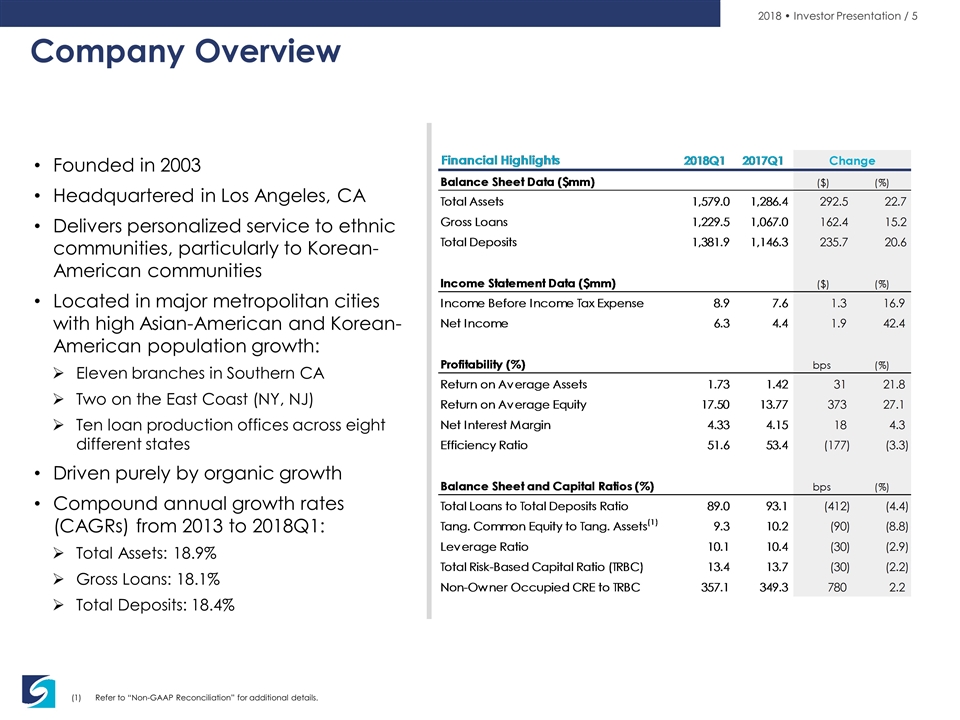
Company Overview Founded in 2003 Headquartered in Los Angeles, CA Delivers personalized service to ethnic communities, particularly to Korean-American communities Located in major metropolitan cities with high Asian-American and Korean-American population growth: Eleven branches in Southern CA Two on the East Coast (NY, NJ) Ten loan production offices across eight different states Driven purely by organic growth Compound annual growth rates (CAGRs) from 2013 to 2018Q1: Total Assets: 18.9% Gross Loans: 18.1% Total Deposits: 18.4% Refer to “Non-GAAP Reconciliation” for additional details.

Investment Highlights 1 2 5 4 3 6 Cohesive and Experienced Management Team History of Organic Growth and Proven Financial Performance Proven Branch and LPO Network Covering Top Korean-American Markets Conservative Credit Culture and Risk Profile with Diversified Loan Portfolio Customer Service Focus with Relationship Banking Core Deposit Funded Franchise 1 Cohesive and Experienced Management Team 2 History of Organic Growth and Proven Financial Performance 3 Conservative Credit Culture and Risk Profile with Diversified Loan Portfolio 7 Scalable Operating Platform 4 Proven Branch and LPO Network Covering Seven Top Korean-American Markets 5 Core Deposit Funded Franchise 6 Customer Service Focus with Relationship Banking
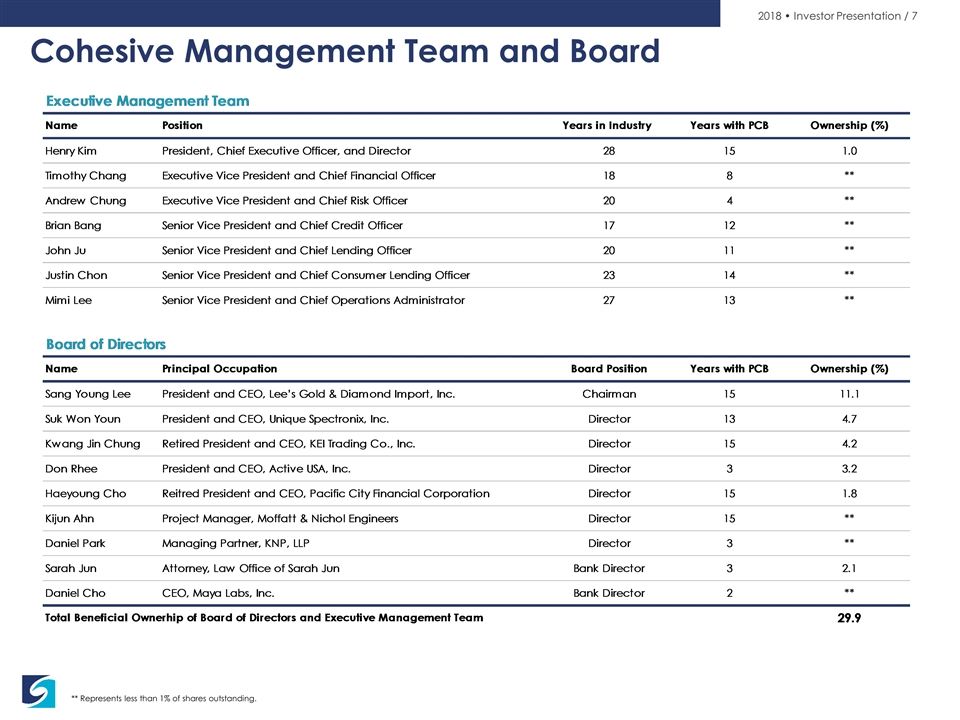
** Represents less than 1% of shares outstanding. Cohesive Management Team and Board
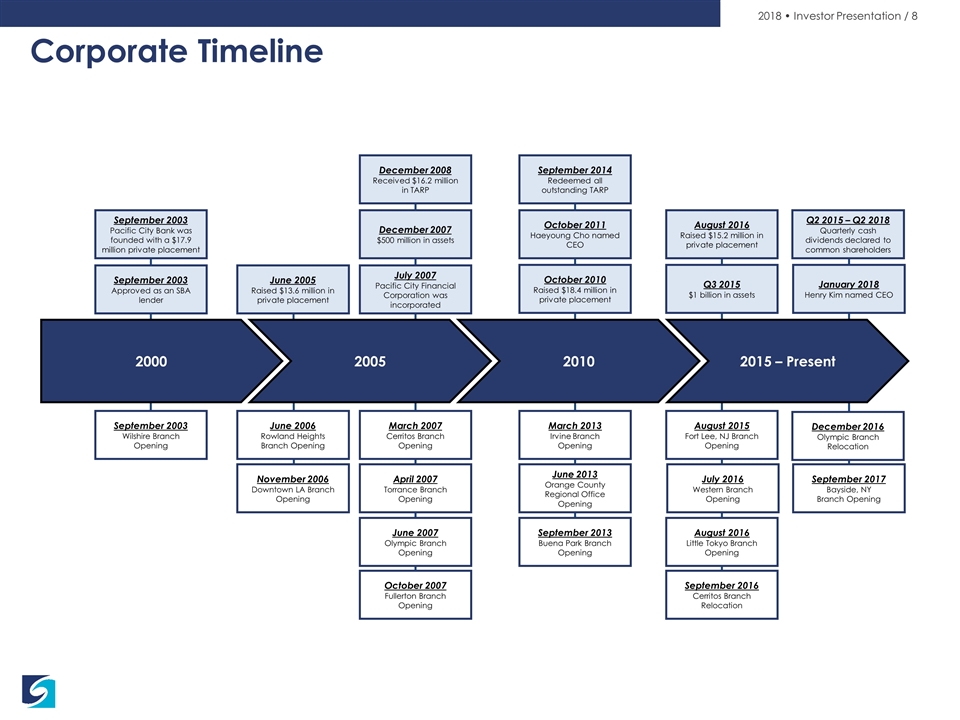
Corporate Timeline December 2016 Olympic Branch Relocation 2005 2010 2015 – Present 2000 September 2003 Wilshire Branch Opening June 2006 Rowland Heights Branch Opening November 2006 Downtown LA Branch Opening September 2003 Pacific City Bank was founded with a $17.9 million private placement March 2007 Cerritos Branch Opening April 2007 Torrance Branch Opening June 2007 Olympic Branch Opening July 2007 Pacific City Financial Corporation was incorporated October 2007 Fullerton Branch Opening October 2011 Haeyoung Cho named CEO March 2013 Irvine Branch Opening June 2013 Orange County Regional Office Opening September 2013 Buena Park Branch Opening August 2015 Fort Lee, NJ Branch Opening Q3 2015 $1 billion in assets August 2016 Little Tokyo Branch Opening September 2016 Cerritos Branch Relocation September 2017 Bayside, NY Branch Opening January 2018 Henry Kim named CEO July 2016 Western Branch Opening December 2007 $500 million in assets June 2005 Raised $13.6 million in private placement December 2008 Received $16.2 million in TARP October 2010 Raised $18.4 million in private placement September 2014 Redeemed all outstanding TARP August 2016 Raised $15.2 million in private placement September 2003 Approved as an SBA lender Q2 2015 – Q2 2018 Quarterly cash dividends declared to common shareholders
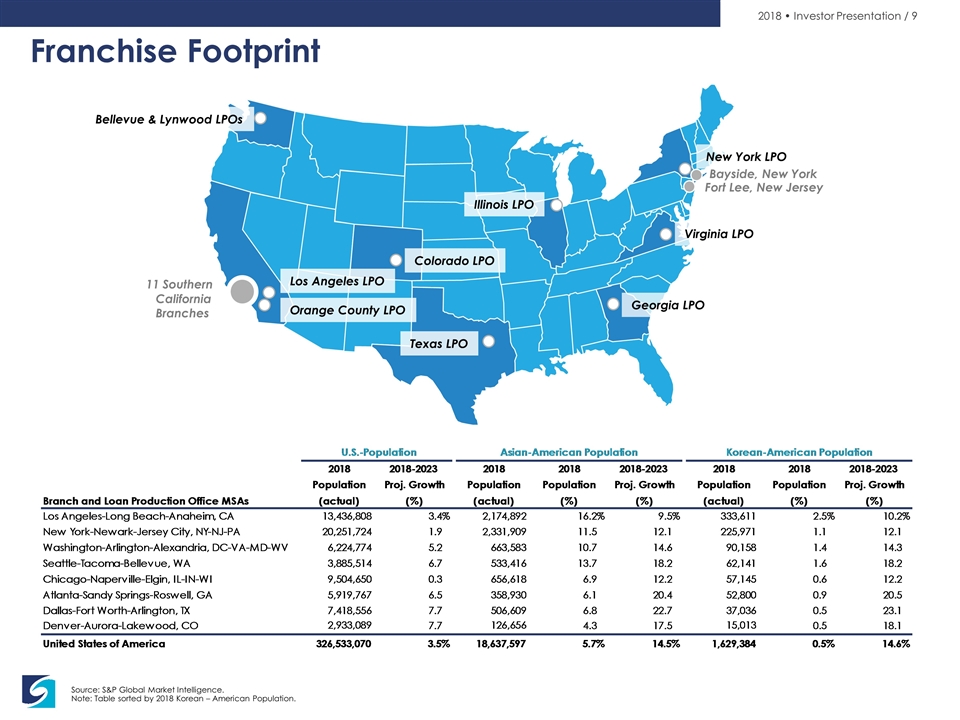
Source: S&P Global Market Intelligence. Note: Table sorted by 2018 Korean – American Population. Franchise Footprint Bellevue & Lynwood LPOs New York LPO Bayside, New York Fort Lee, New Jersey Virginia LPO Georgia LPO Texas LPO Orange County LPO Los Angeles LPO Colorado LPO 11 Southern California Branches Illinois LPO
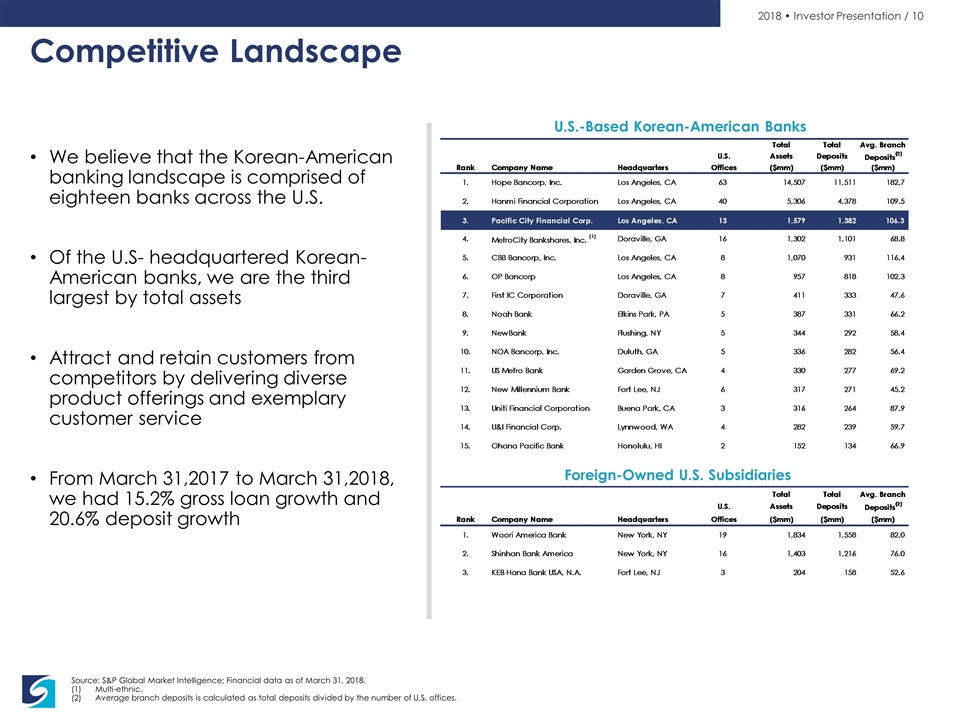
Competitive Landscape We believe that the Korean-American banking landscape is comprised of eighteen banks across the U.S. Of the U.S- headquartered Korean- American banks, we are the third largest by total assets Attract and retain customers from competitors by delivering diverse product offerings and exemplary customer service From March 31,2017 to March 31,2018, we had 15.2% gross loan growth and 20.6% deposit growth Source: S&P Global Market Intelligence; Financial data as of March 31, 2018. Multi-ethnic. Average branch deposits is calculated as total deposits divided by the number of U.S. offices. U.S.-Based Korean-American Banks Foreign-Owned U.S. Subsidiaries
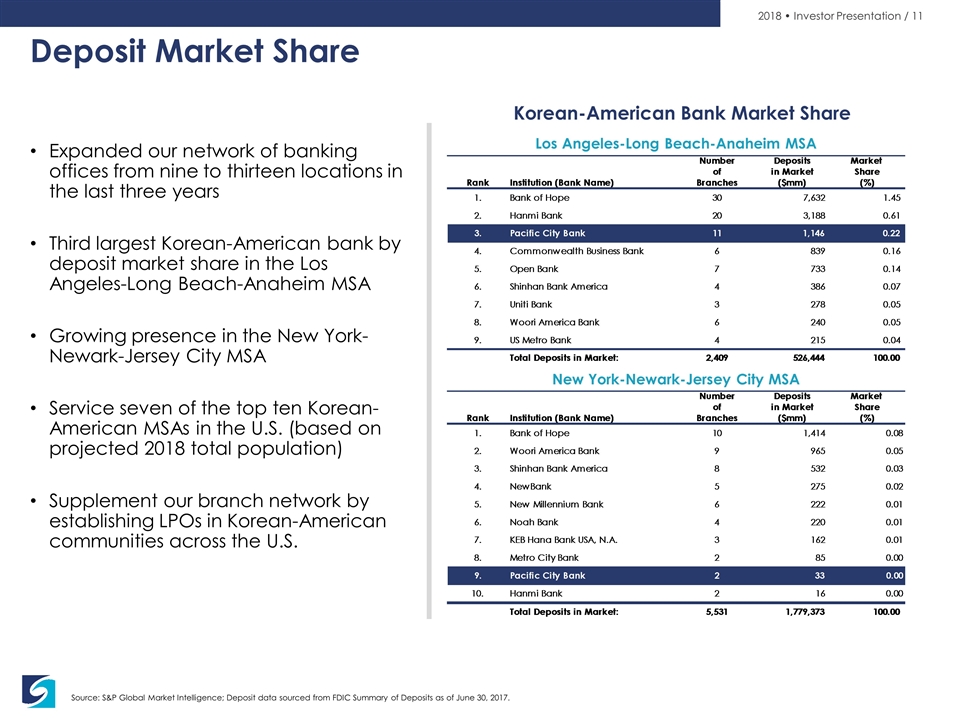
Deposit Market Share Expanded our network of banking offices from nine to thirteen locations in the last three years Third largest Korean-American bank by deposit market share in the Los Angeles-Long Beach-Anaheim MSA Growing presence in the New York-Newark-Jersey City MSA Service seven of the top ten Korean-American MSAs in the U.S. (based on projected 2018 total population) Supplement our branch network by establishing LPOs in Korean-American communities across the U.S. Source: S&P Global Market Intelligence; Deposit data sourced from FDIC Summary of Deposits as of June 30, 2017. Los Angeles-Long Beach-Anaheim MSA New York-Newark-Jersey City MSA Korean-American Bank Market Share
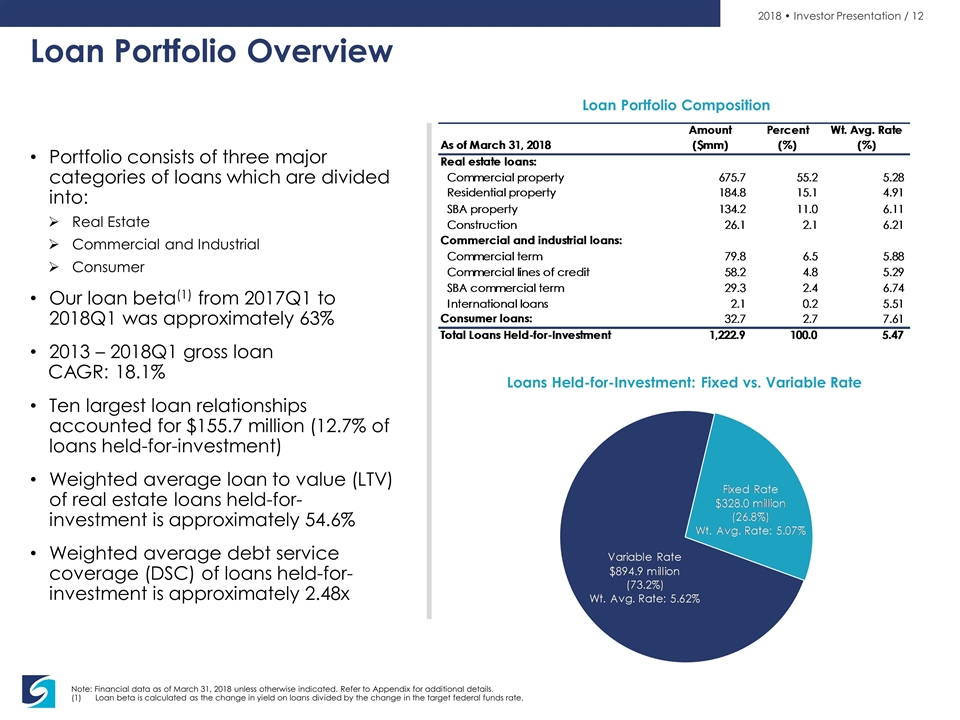
Loan Portfolio Overview Portfolio consists of three major categories of loans which are divided into: Real Estate Commercial and Industrial Consumer Our loan beta(1) from 2017Q1 to 2018Q1 was approximately 63% 2013 – 2018Q1 gross loan CAGR: 18.1% Ten largest loan relationships accounted for $155.7 million (12.7% of loans held-for-investment) Weighted average loan to value (LTV) of real estate loans held-for-investment is approximately 54.6% Weighted average debt service coverage (DSC) of loans held-for-investment is approximately 2.48x Note: Financial data as of March 31, 2018 unless otherwise indicated. Refer to Appendix for additional details. Loan beta is calculated as the change in yield on loans divided by the change in the target federal funds rate. Loan Portfolio Composition Loans Held-for-Investment: Fixed vs. Variable Rate
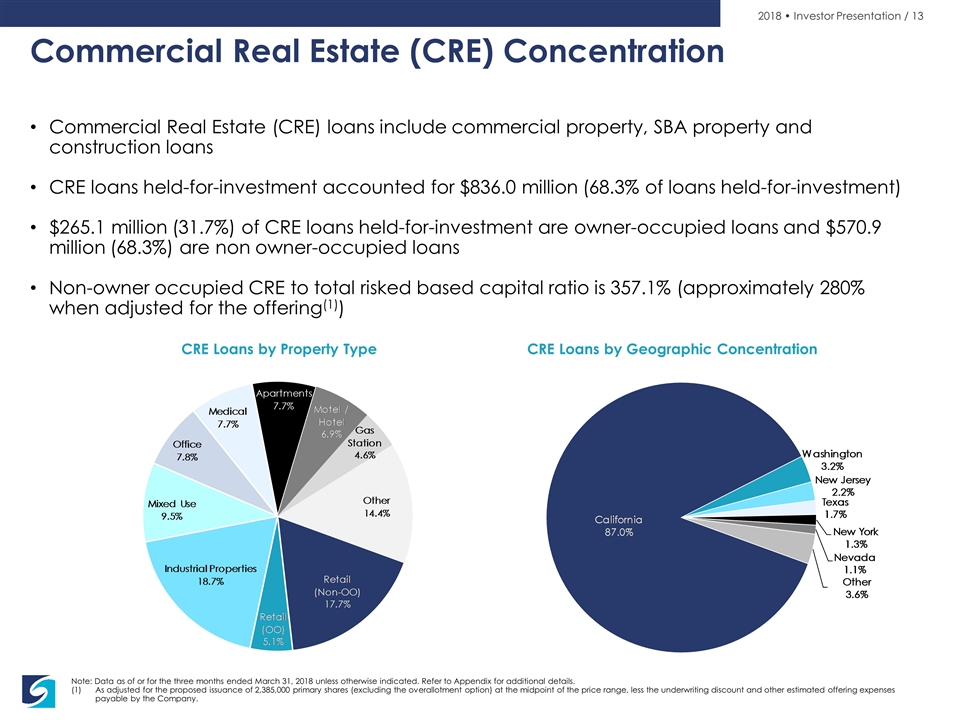
Note: Data as of or for the three months ended March 31, 2018 unless otherwise indicated. Refer to Appendix for additional details. As adjusted for the proposed issuance of 2,385,000 primary shares (excluding the overallotment option) at the midpoint of the price range, less the underwriting discount and other estimated offering expenses payable by the Company. Commercial Real Estate (CRE) Concentration Commercial Real Estate (CRE) loans include commercial property, SBA property and construction loans CRE loans held-for-investment accounted for $836.0 million (68.3% of loans held-for-investment) $265.1 million (31.7%) of CRE loans held-for-investment are owner-occupied loans and $570.9 million (68.3%) are non owner-occupied loans Non-owner occupied CRE to total risked based capital ratio is 357.1% (approximately 280% when adjusted for the offering(1)) CRE Loans by Property Type CRE Loans by Geographic Concentration
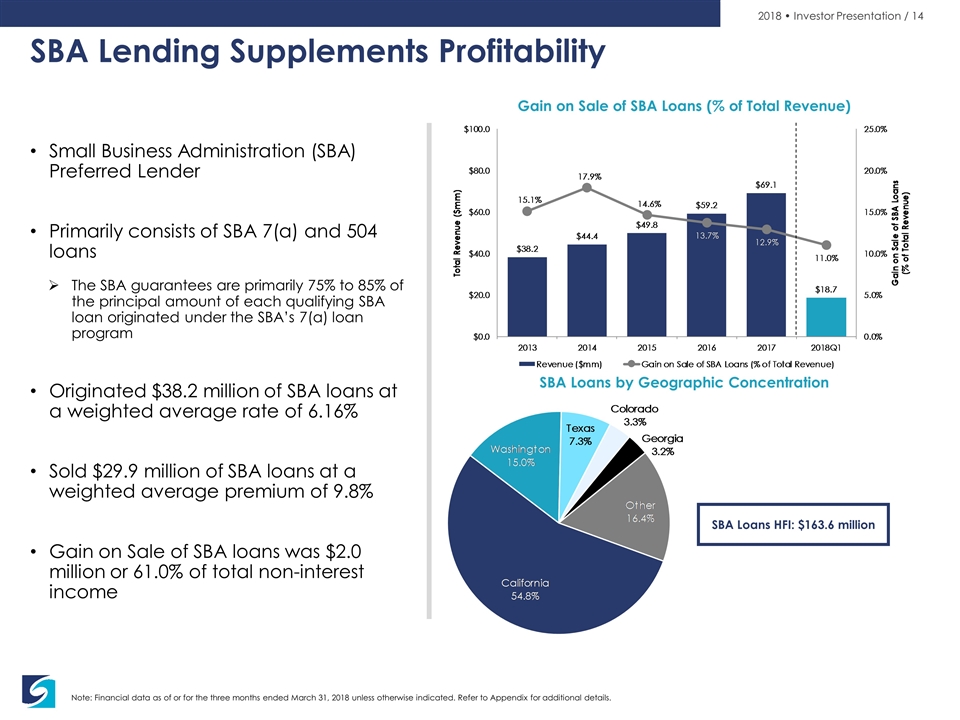
SBA Lending Supplements Profitability Small Business Administration (SBA) Preferred Lender Primarily consists of SBA 7(a) and 504 loans The SBA guarantees are primarily 75% to 85% of the principal amount of each qualifying SBA loan originated under the SBA’s 7(a) loan program Originated $38.2 million of SBA loans at a weighted average rate of 6.16% Sold $29.9 million of SBA loans at a weighted average premium of 9.8% Gain on Sale of SBA loans was $2.0 million or 61.0% of total non-interest income Note: Financial data as of or for the three months ended March 31, 2018 unless otherwise indicated. Refer to Appendix for additional details. Gain on Sale of SBA Loans (% of Total Revenue) SBA Loans by Geographic Concentration SBA Loans HFI: $163.6 million
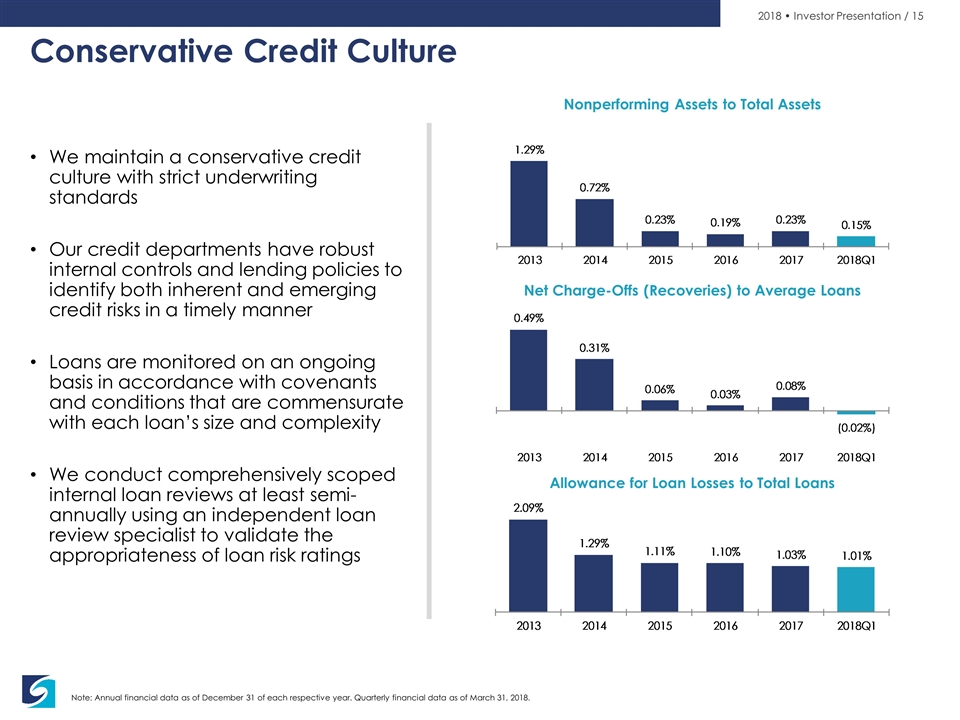
Conservative Credit Culture We maintain a conservative credit culture with strict underwriting standards Our credit departments have robust internal controls and lending policies to identify both inherent and emerging credit risks in a timely manner Loans are monitored on an ongoing basis in accordance with covenants and conditions that are commensurate with each loan’s size and complexity We conduct comprehensively scoped internal loan reviews at least semi-annually using an independent loan review specialist to validate the appropriateness of loan risk ratings Note: Annual financial data as of December 31 of each respective year. Quarterly financial data as of March 31, 2018. Nonperforming Assets to Total Assets Net Charge-Offs (Recoveries) to Average Loans Allowance for Loan Losses to Total Loans
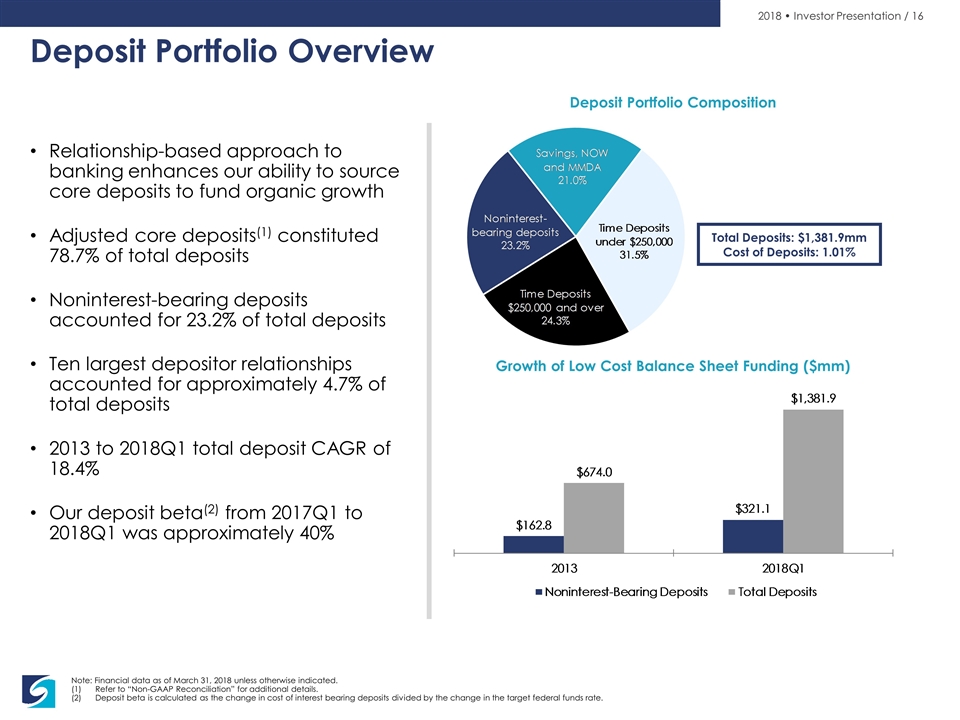
Deposit Portfolio Overview Relationship-based approach to banking enhances our ability to source core deposits to fund organic growth Adjusted core deposits(1) constituted 78.7% of total deposits Noninterest-bearing deposits accounted for 23.2% of total deposits Ten largest depositor relationships accounted for approximately 4.7% of total deposits 2013 to 2018Q1 total deposit CAGR of 18.4% Our deposit beta(2) from 2017Q1 to 2018Q1 was approximately 40% Note: Financial data as of March 31, 2018 unless otherwise indicated. Refer to “Non-GAAP Reconciliation” for additional details. Deposit beta is calculated as the change in cost of interest bearing deposits divided by the change in the target federal funds rate. Deposit Portfolio Composition Growth of Low Cost Balance Sheet Funding ($mm) Total Deposits: $1,381.9mm Cost of Deposits: 1.01%
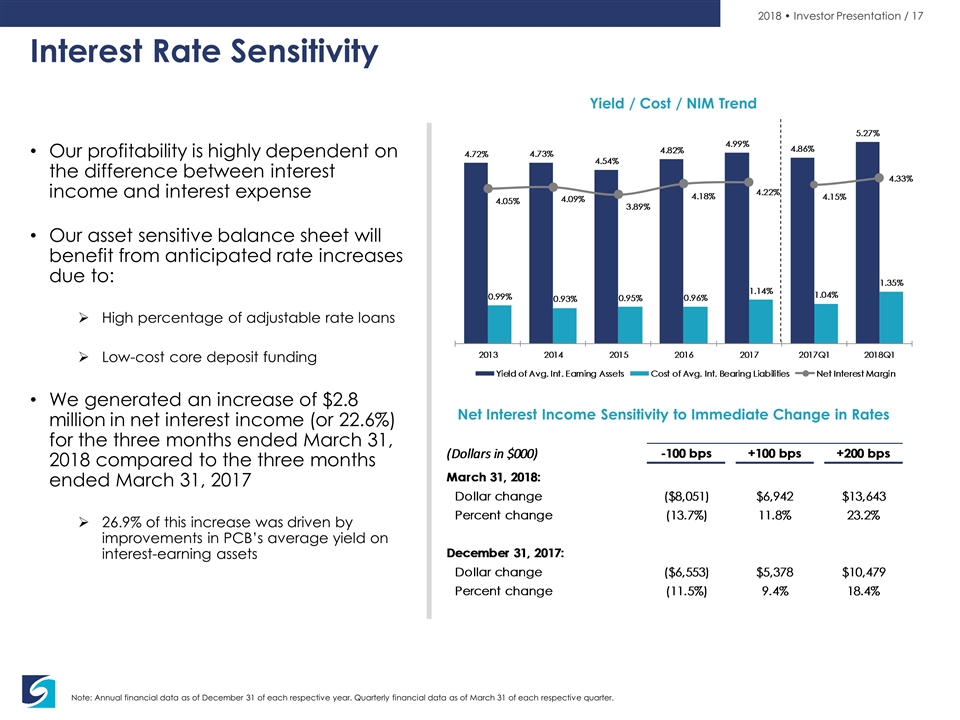
Interest Rate Sensitivity Our profitability is highly dependent on the difference between interest income and interest expense Our asset sensitive balance sheet will benefit from anticipated rate increases due to: High percentage of adjustable rate loans Low-cost core deposit funding We generated an increase of $2.8 million in net interest income (or 22.6%) for the three months ended March 31, 2018 compared to the three months ended March 31, 2017 26.9% of this increase was driven by improvements in PCB’s average yield on interest-earning assets Note: Annual financial data as of December 31 of each respective year. Quarterly financial data as of March 31 of each respective quarter. Yield / Cost / NIM Trend Net Interest Income Sensitivity to Immediate Change in Rates
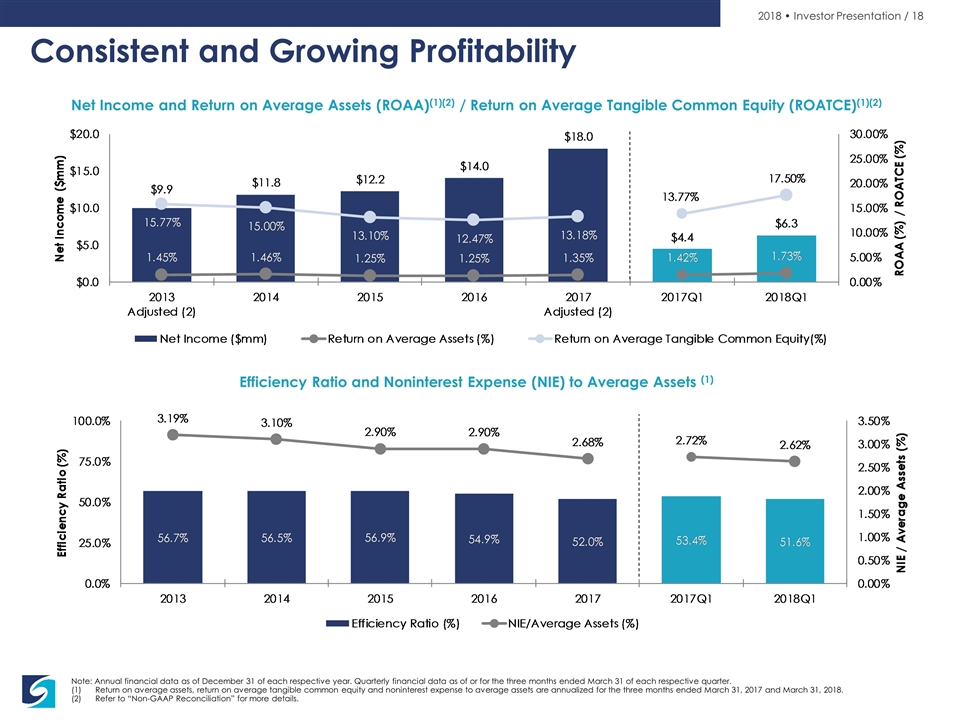
Note: Annual financial data as of December 31 of each respective year. Quarterly financial data as of or for the three months ended March 31 of each respective quarter. Return on average assets, return on average tangible common equity and noninterest expense to average assets are annualized for the three months ended March 31, 2017 and March 31, 2018. Refer to “Non-GAAP Reconciliation” for more details. Consistent and Growing Profitability Net Income and Return on Average Assets (ROAA)(1)(2) / Return on Average Tangible Common Equity (ROATCE)(1)(2) Efficiency Ratio and Noninterest Expense (NIE) to Average Assets (1)
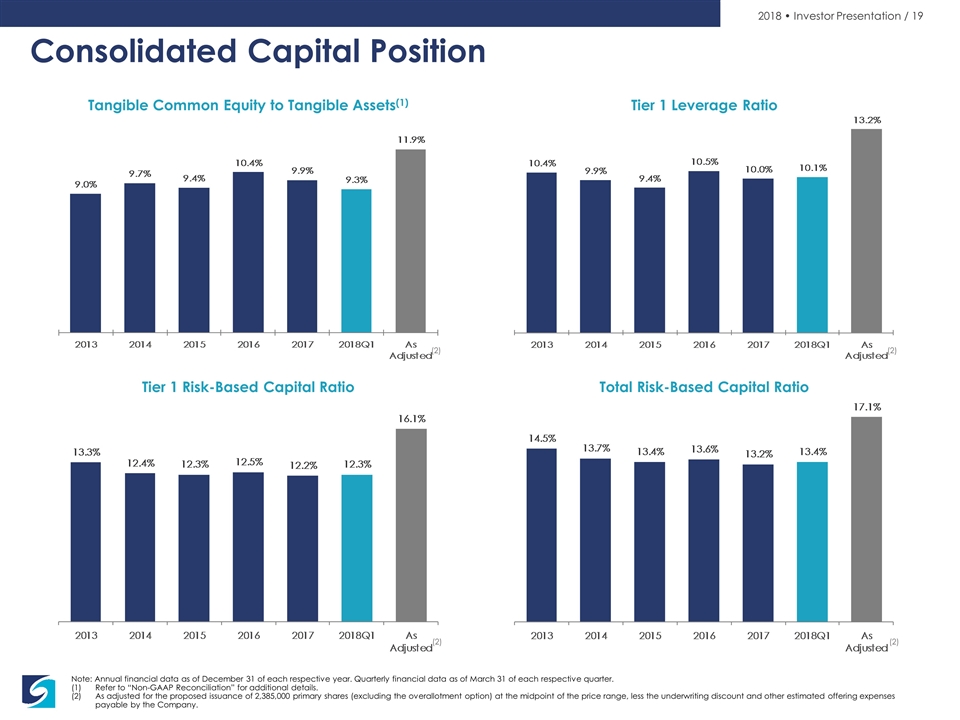
Tier 1 Leverage Ratio Tangible Common Equity to Tangible Assets(1) Note: Annual financial data as of December 31 of each respective year. Quarterly financial data as of March 31 of each respective quarter. Refer to “Non-GAAP Reconciliation” for additional details. As adjusted for the proposed issuance of 2,385,000 primary shares (excluding the overallotment option) at the midpoint of the price range, less the underwriting discount and other estimated offering expenses payable by the Company. Consolidated Capital Position Total Risk-Based Capital Ratio Tier 1 Risk-Based Capital Ratio (2) (2) (2) (2)
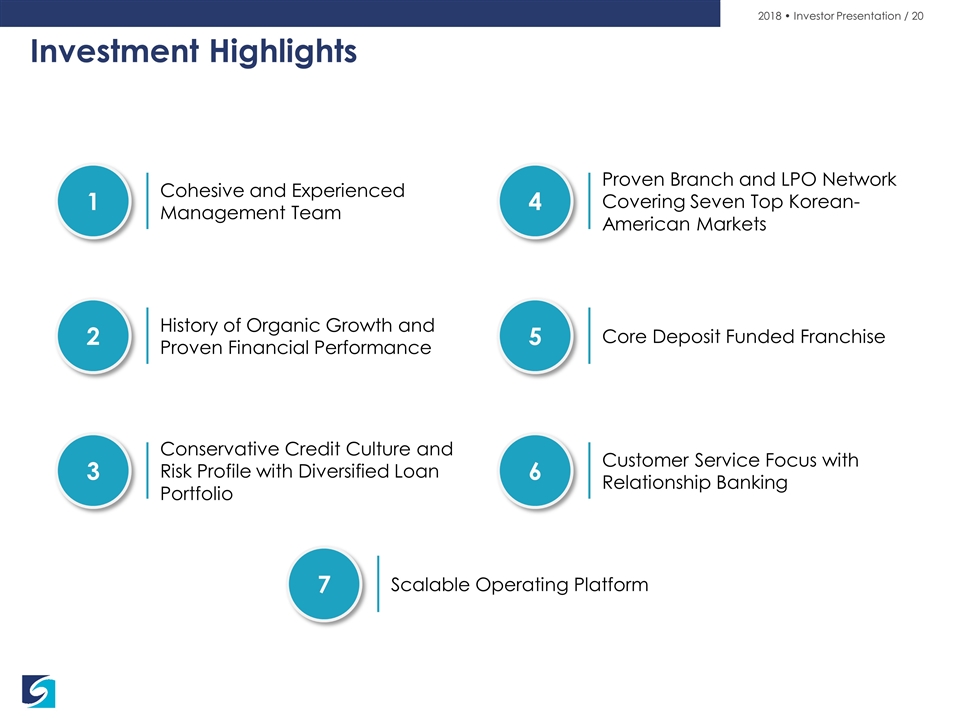
Investment Highlights 1 2 5 4 3 6 Cohesive and Experienced Management Team History of Organic Growth and Proven Financial Performance Proven Branch and LPO Network Covering Top Korean-American Markets Conservative Credit Culture and Risk Profile with Diversified Loan Portfolio Customer Service Focus with Relationship Banking Core Deposit Funded Franchise 1 Cohesive and Experienced Management Team 2 History of Organic Growth and Proven Financial Performance 3 Conservative Credit Culture and Risk Profile with Diversified Loan Portfolio 7 Scalable Operating Platform 4 Proven Branch and LPO Network Covering Seven Top Korean-American Markets 5 Core Deposit Funded Franchise 6 Customer Service Focus with Relationship Banking
Appendix
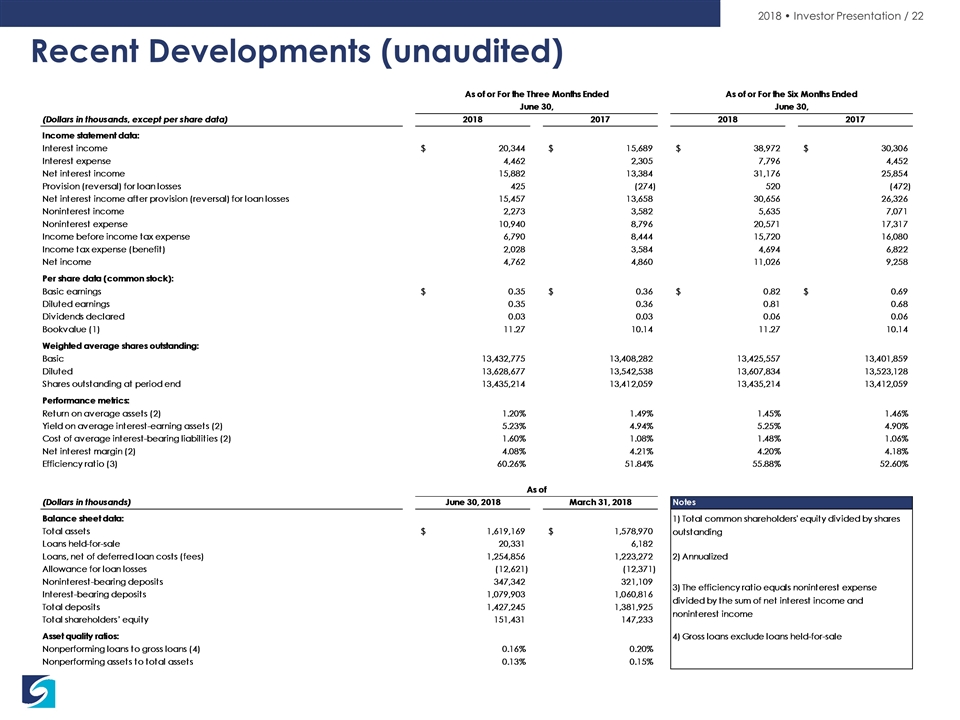
Recent Developments (unaudited)
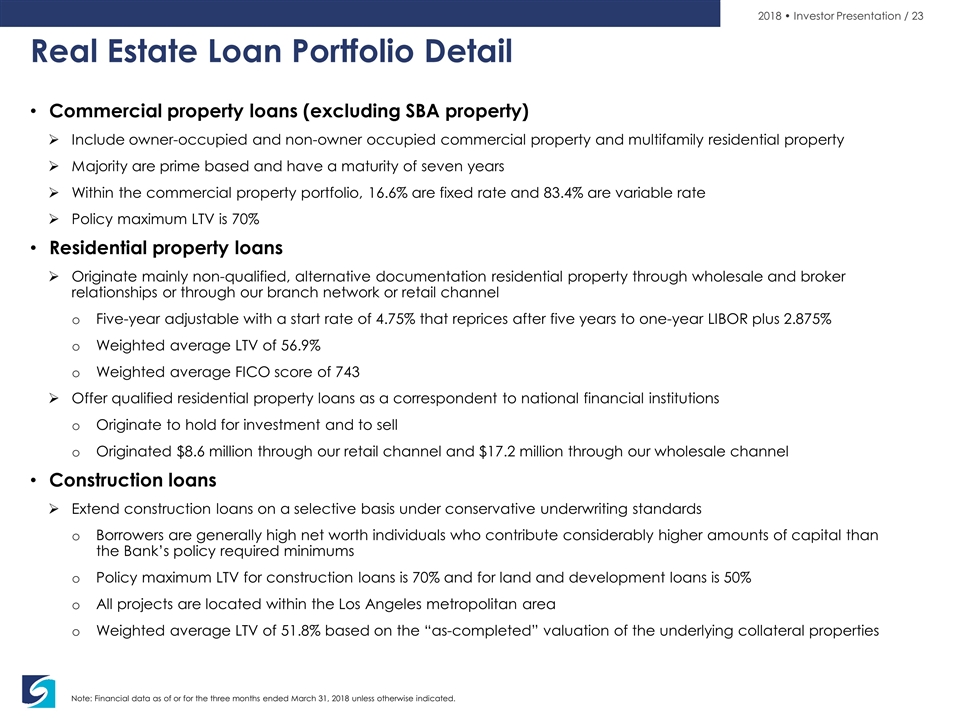
Note: Financial data as of or for the three months ended March 31, 2018 unless otherwise indicated. Real Estate Loan Portfolio Detail Commercial property loans (excluding SBA property) Include owner-occupied and non-owner occupied commercial property and multifamily residential property Majority are prime based and have a maturity of seven years Within the commercial property portfolio, 16.6% are fixed rate and 83.4% are variable rate Policy maximum LTV is 70% Residential property loans Originate mainly non-qualified, alternative documentation residential property through wholesale and broker relationships or through our branch network or retail channel Five-year adjustable with a start rate of 4.75% that reprices after five years to one-year LIBOR plus 2.875% Weighted average LTV of 56.9% Weighted average FICO score of 743 Offer qualified residential property loans as a correspondent to national financial institutions Originate to hold for investment and to sell Originated $8.6 million through our retail channel and $17.2 million through our wholesale channel Construction loans Extend construction loans on a selective basis under conservative underwriting standards Borrowers are generally high net worth individuals who contribute considerably higher amounts of capital than the Bank’s policy required minimums Policy maximum LTV for construction loans is 70% and for land and development loans is 50% All projects are located within the Los Angeles metropolitan area Weighted average LTV of 51.8% based on the “as-completed” valuation of the underlying collateral properties
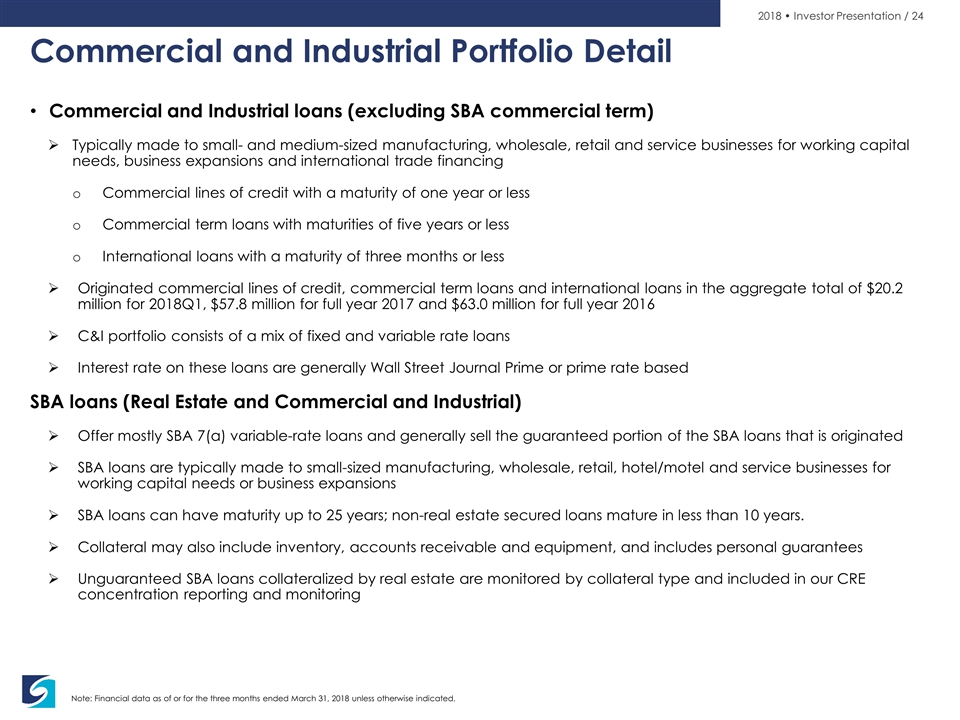
Note: Financial data as of or for the three months ended March 31, 2018 unless otherwise indicated. Commercial and Industrial Portfolio Detail Commercial and Industrial loans (excluding SBA commercial term) Typically made to small- and medium-sized manufacturing, wholesale, retail and service businesses for working capital needs, business expansions and international trade financing Commercial lines of credit with a maturity of one year or less Commercial term loans with maturities of five years or less International loans with a maturity of three months or less Originated commercial lines of credit, commercial term loans and international loans in the aggregate total of $20.2 million for 2018Q1, $57.8 million for full year 2017 and $63.0 million for full year 2016 C&I portfolio consists of a mix of fixed and variable rate loans Interest rate on these loans are generally Wall Street Journal Prime or prime rate based SBA loans (Real Estate and Commercial and Industrial) Offer mostly SBA 7(a) variable-rate loans and generally sell the guaranteed portion of the SBA loans that is originated SBA loans are typically made to small-sized manufacturing, wholesale, retail, hotel/motel and service businesses for working capital needs or business expansions SBA loans can have maturity up to 25 years; non-real estate secured loans mature in less than 10 years. Collateral may also include inventory, accounts receivable and equipment, and includes personal guarantees Unguaranteed SBA loans collateralized by real estate are monitored by collateral type and included in our CRE concentration reporting and monitoring
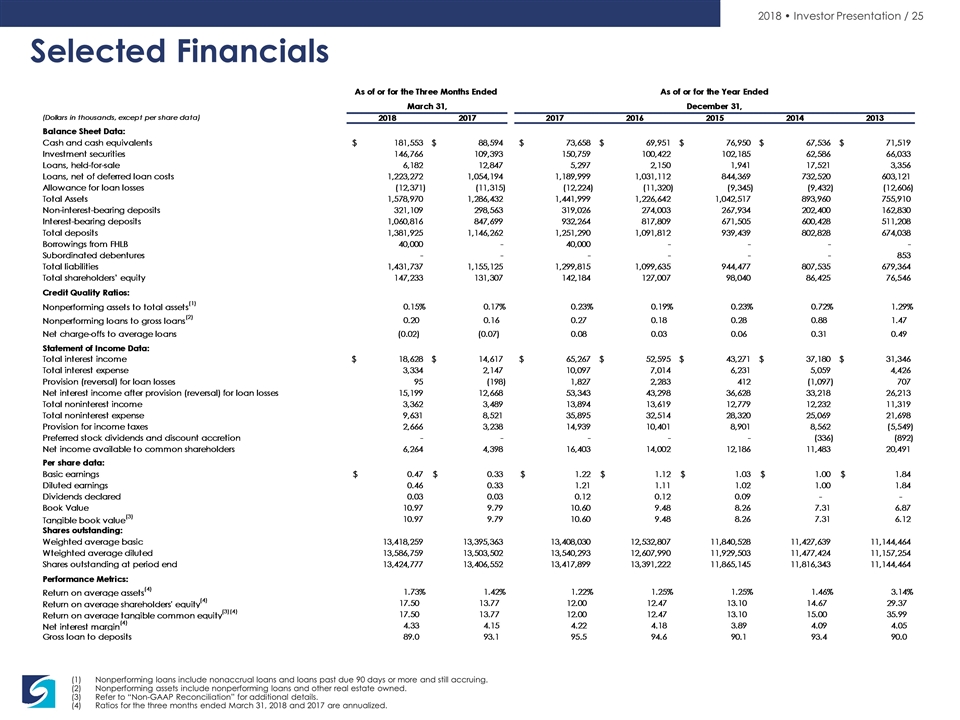
Nonperforming loans include nonaccrual loans and loans past due 90 days or more and still accruing. Nonperforming assets include nonperforming loans and other real estate owned. Refer to “Non-GAAP Reconciliation” for additional details. Ratios for the three months ended March 31, 2018 and 2017 are annualized. Selected Financials
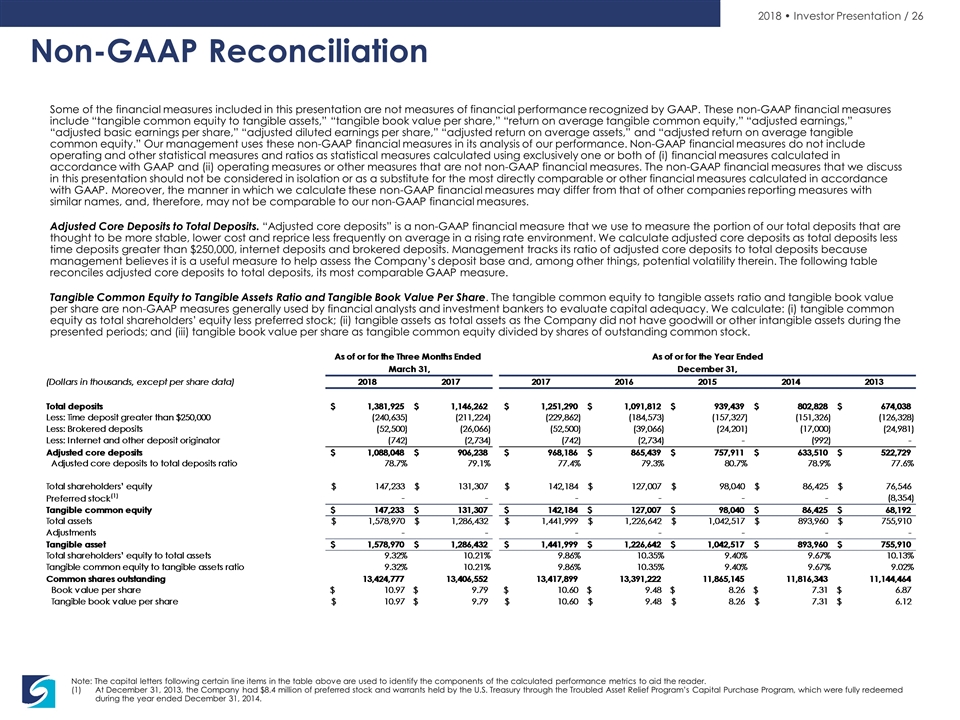
Note: The capital letters following certain line items in the table above are used to identify the components of the calculated performance metrics to aid the reader. At December 31, 2013, the Company had $8.4 million of preferred stock and warrants held by the U.S. Treasury through the Troubled Asset Relief Program’s Capital Purchase Program, which were fully redeemed during the year ended December 31, 2014. Non-GAAP Reconciliation Some of the financial measures included in this presentation are not measures of financial performance recognized by GAAP. These non-GAAP financial measures include “tangible common equity to tangible assets,” “tangible book value per share,” “return on average tangible common equity,” “adjusted earnings,” “adjusted basic earnings per share,” “adjusted diluted earnings per share,” “adjusted return on average assets,” and “adjusted return on average tangible common equity.” Our management uses these non-GAAP financial measures in its analysis of our performance. Non-GAAP financial measures do not include operating and other statistical measures and ratios as statistical measures calculated using exclusively one or both of (i) financial measures calculated in accordance with GAAP and (ii) operating measures or other measures that are not non-GAAP financial measures. The non-GAAP financial measures that we discuss in this presentation should not be considered in isolation or as a substitute for the most directly comparable or other financial measures calculated in accordance with GAAP. Moreover, the manner in which we calculate these non-GAAP financial measures may differ from that of other companies reporting measures with similar names, and, therefore, may not be comparable to our non-GAAP financial measures. Adjusted Core Deposits to Total Deposits. “Adjusted core deposits” is a non-GAAP financial measure that we use to measure the portion of our total deposits that are thought to be more stable, lower cost and reprice less frequently on average in a rising rate environment. We calculate adjusted core deposits as total deposits less time deposits greater than $250,000, internet deposits and brokered deposits. Management tracks its ratio of adjusted core deposits to total deposits because management believes it is a useful measure to help assess the Company’s deposit base and, among other things, potential volatility therein. The following table reconciles adjusted core deposits to total deposits, its most comparable GAAP measure. Tangible Common Equity to Tangible Assets Ratio and Tangible Book Value Per Share. The tangible common equity to tangible assets ratio and tangible book value per share are non-GAAP measures generally used by financial analysts and investment bankers to evaluate capital adequacy. We calculate: (i) tangible common equity as total shareholders’ equity less preferred stock; (ii) tangible assets as total assets as the Company did not have goodwill or other intangible assets during the presented periods; and (iii) tangible book value per share as tangible common equity divided by shares of outstanding common stock.
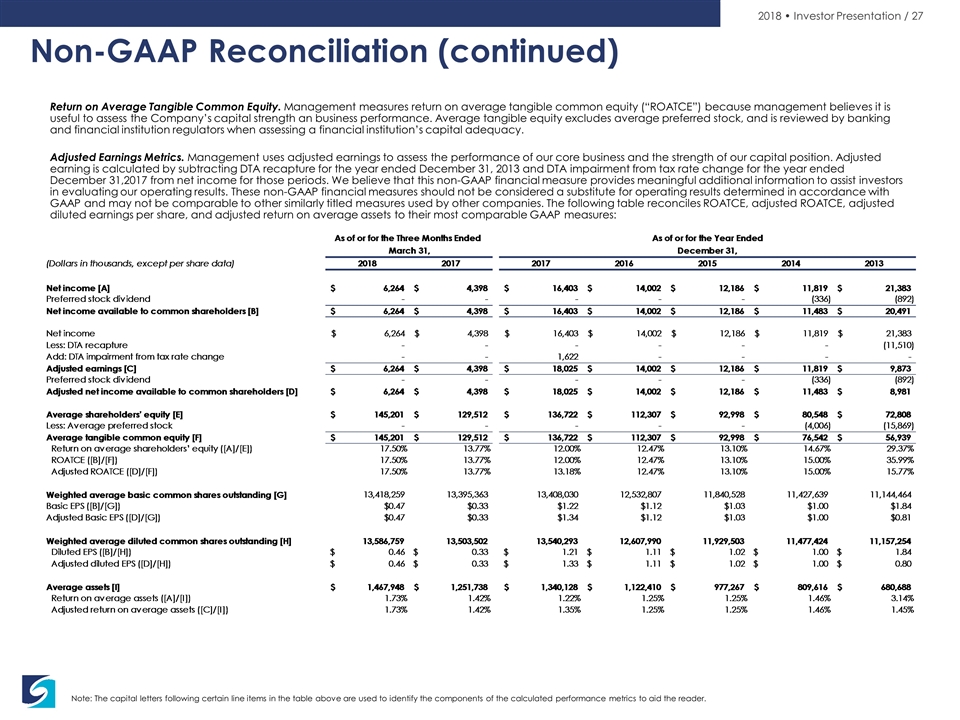
Note: The capital letters following certain line items in the table above are used to identify the components of the calculated performance metrics to aid the reader. Non-GAAP Reconciliation (continued) Return on Average Tangible Common Equity. Management measures return on average tangible common equity (“ROATCE”) because management believes it is useful to assess the Company’s capital strength an business performance. Average tangible equity excludes average preferred stock, and is reviewed by banking and financial institution regulators when assessing a financial institution’s capital adequacy. Adjusted Earnings Metrics. Management uses adjusted earnings to assess the performance of our core business and the strength of our capital position. Adjusted earning is calculated by subtracting DTA recapture for the year ended December 31, 2013 and DTA impairment from tax rate change for the year ended December 31,2017 from net income for those periods. We believe that this non-GAAP financial measure provides meaningful additional information to assist investors in evaluating our operating results. These non-GAAP financial measures should not be considered a substitute for operating results determined in accordance with GAAP and may not be comparable to other similarly titled measures used by other companies. The following table reconciles ROATCE, adjusted ROATCE, adjusted diluted earnings per share, and adjusted return on average assets to their most comparable GAAP measures: