SANDLER O’NEILL + PARTNERS 2019 West Coast Financial Service Conferences March 5, 2019
Safe Harbor Statement This presentation (and oral statements made regarding the subject of this presentation) contains certain “forward- looking statements” that are based on various facts and derived utilizing numerous important assumptions and are subject to known and unknown risks, uncertainties and other factors that may cause our actual results, performance or achievements to be materially different from any future results, performance or achievements expressed or implied by such forward-looking statements. Forward-looking statements include information about our future financial performance, business and growth strategy, projected plans and objectives, as well as projections of macroeconomic and industry trends, which are inherently unreliable due to the multiple factors that impact economic trends, and any such variations may be material. Statements preceded by, followed by or that otherwise include the words “believes,” “expects,” “anticipates,” “intends,” “projects,” “estimates,” “plans” and similar expressions or future or conditional verbs such as “will,” “should,” “would,” “may” and “could” are generally forward-looking in nature and not historical facts, although not all forward-looking statements include the foregoing. Forward-looking statements are based on management’s current expectations and involve risks and uncertainties that could cause actual results to differ materially from the Company’s historical results or those described in our forward-looking statements. Pacific City Financial Corporation disclaims any obligation to update any forward-looking statement. This presentation contains certain non-GAAP financial measures intended to supplement, not substitute for, comparable GAAP measures. Reconciliations of non-GAAP financial measures to GAAP financial measures are provided at the end of this presentation. Numbers in the presentation may not sum due to rounding. 2 your Partner • Choice • Bank
Pacific City Profile (1) Company Overview Organic Growth Founded in 2003 $1.70 billion in assets: Purely driven by organic growth Headquartered in Los Angeles, CA Diversified loan portfolio IPO in August 2018 ($45.0 million) Net CRE to Total Risk-based Capital 253.6% Third largest US based Korean-American Bank Compounded annual growth rates (CAGRs) Located in major metropolitan cities with high from 2014 to 2018 Korean-American population growth: Total Assets: 17.4% Eleven branches in Southern CA Total Loans: 15.7% Two on the East Coast (NY, NJ) Total Deposits: 15.8% Ten loan production offices Excellent Asset Quality Well Capitalized Ratios(1) (2) Conservative credit culture and strict underwriting Total risk based capital ratio of 17.31% standards Common tier 1 capital ratio of 16.28% (1) Nonperforming assets to total assets of 0.06% Tier 1 risk based capital ratio of 16.28% Net charge-offs to average held-for investment Tier 1 leverage capital ratio of 12.60% (1) loan ratio of 0.02% (1) As of 12/31/18 (2) Consolidated basis *2018, and any quarterly financials are unaudited. 3 your Partner • Choice • Bank
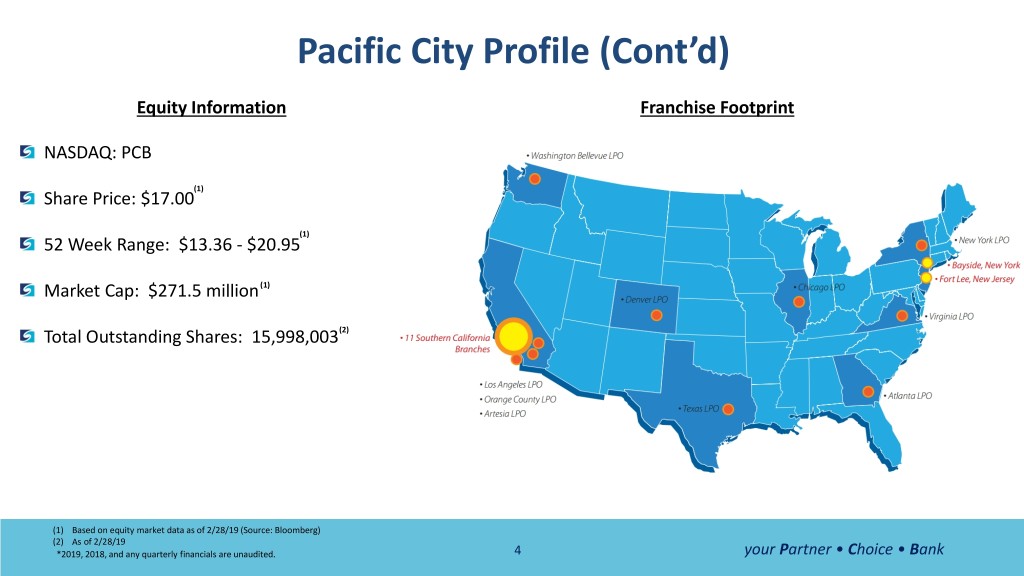
Pacific City Profile (Cont’d) Equity Information Franchise Footprint NASDAQ: PCB (1) Share Price: $17.00 (1) 52 Week Range: $13.36 - $20.95 Market Cap: $271.5 million (1) Total Outstanding Shares: 15,998,003(2) (1) Based on equity market data as of 2/28/19 (Source: Bloomberg) (2) As of 2/28/19 *2019, 2018, and any quarterly financials are unaudited. 4 your Partner • Choice • Bank
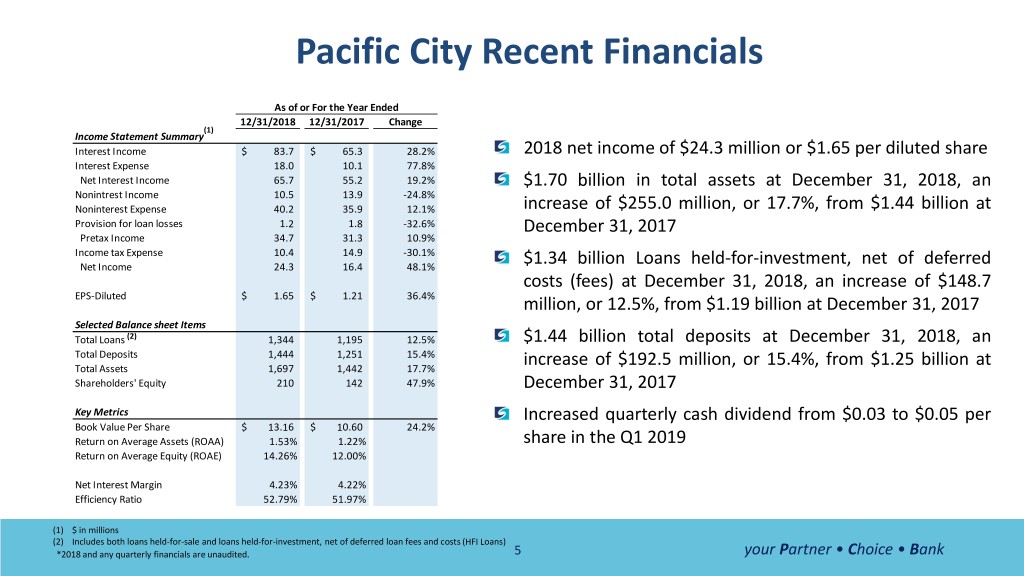
Pacific City Recent Financials As of or For the Year Ended 12/31/2018 12/31/2017 Change (1) Income Statement Summary Interest Income $ 83.7 $ 65.3 28.2% 2018 net income of $24.3 million or $1.65 per diluted share Interest Expense 18.0 10.1 77.8% Net Interest Income 65.7 55.2 19.2% $1.70 billion in total assets at December 31, 2018, an Nonintrest Income 10.5 13.9 -24.8% Noninterest Expense 40.2 35.9 12.1% increase of $255.0 million, or 17.7%, from $1.44 billion at Provision for loan losses 1.2 1.8 -32.6% December 31, 2017 Pretax Income 34.7 31.3 10.9% Income tax Expense 10.4 14.9 -30.1% Net Income 24.3 16.4 48.1% $1.34 billion Loans held-for-investment, net of deferred costs (fees) at December 31, 2018, an increase of $148.7 EPS-Diluted $ 1.65 $ 1.21 36.4% million, or 12.5%, from $1.19 billion at December 31, 2017 Selected Balance sheet Items Total Loans (2) 1,344 1,195 12.5% $1.44 billion total deposits at December 31, 2018, an Total Deposits 1,444 1,251 15.4% Total Assets 1,697 1,442 17.7% increase of $192.5 million, or 15.4%, from $1.25 billion at Shareholders' Equity 210 142 47.9% December 31, 2017 Key Metrics Increased quarterly cash dividend from $0.03 to $0.05 per Book Value Per Share $ 13.16 $ 10.60 24.2% Return on Average Assets (ROAA) 1.53% 1.22% share in the Q1 2019 Return on Average Equity (ROAE) 14.26% 12.00% Net Interest Margin 4.23% 4.22% Efficiency Ratio 52.79% 51.97% (1) $ in millions (2) Includes both loans held-for-sale and loans held-for-investment, net of deferred loan fees and costs (HFI Loans) *2018 and any quarterly financials are unaudited. 5 your Partner • Choice • Bank
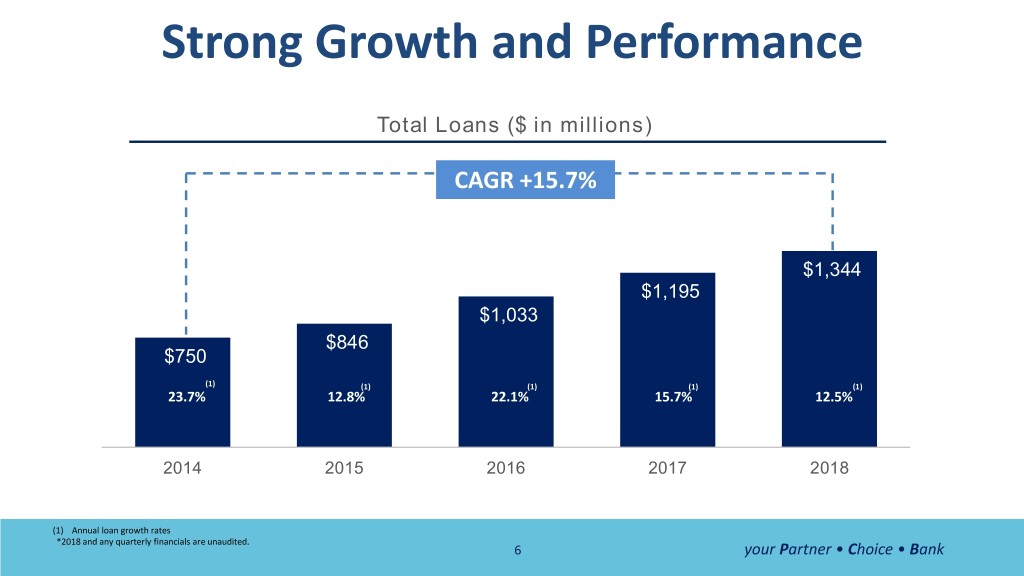
Strong Growth and Performance Total Loans ($ in millions) CAGR +15.7% $1,344 $1,195 $1,033 $846 $750 (1) (1) (1) (1) (1) 23.7% 12.8% 22.1% 15.7% 12.5% 2014 2015 2016 2017 2018 (1) Annual loan growth rates *2018 and any quarterly financials are unaudited. 6 your Partner • Choice • Bank
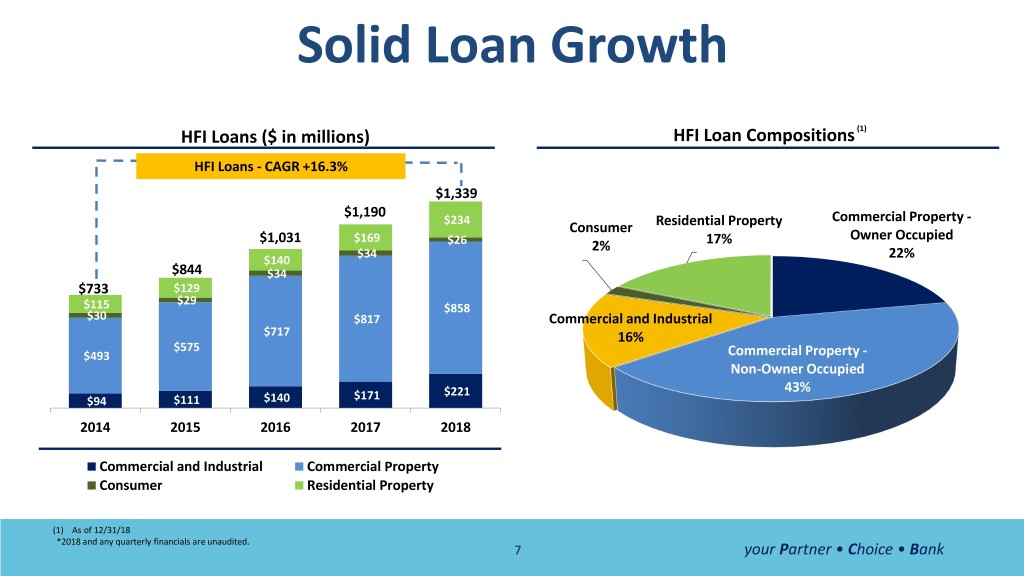
Solid Loan Growth HFI Loans ($ in millions) HFI Loan Compositions (1) HFI Loans - CAGR +16.3% $1,339 $1,190 $234 Commercial Property - Consumer Residential Property $1,031 $169 Owner Occupied $26 2% 17% $34 $140 22% $844 $34 $733 $129 $29 $115 $858 $30 $817 Commercial and Industrial $717 16% $575 $493 Commercial Property - Non-Owner Occupied $221 43% $94 $111 $140 $171 2014 2015 2016 2017 2018 Commercial and Industrial Commercial Property Consumer Residential Property (1) As of 12/31/18 *2018 and any quarterly financials are unaudited. 7 your Partner • Choice • Bank

Fixed vs. Variable Loans (1) New Loan: Fixed vs. Variable ($ in millions) Fixed vs. Variable (2) Fixed Rate Loans 5.91% 13% (3) 5.48% 5.52% @ 5.41% 5.29% 5.42% Hybrid Loans Variable Rate Loans 21% (3) @ 4.96% $103.7 66% $85.7 (3) $98.0 $99.0 $63.9 @ 6.31% $38.4 $33.8 $32.0 $22.9 $24.6 $13.3 $10.0 $15.0 $24.2 $23.2 4Q17 1Q18 2Q18 3Q18 4Q18 (3) Fixed Loans Hybrid Loans Variable Loans Wtd. Avg. Rates (1) Total commitment basis (2) As of 12/31/2018 (3) Weighted average contractual interest rates 8 your Partner • Choice • Bank *2018 and any quarterly financials are unaudited.
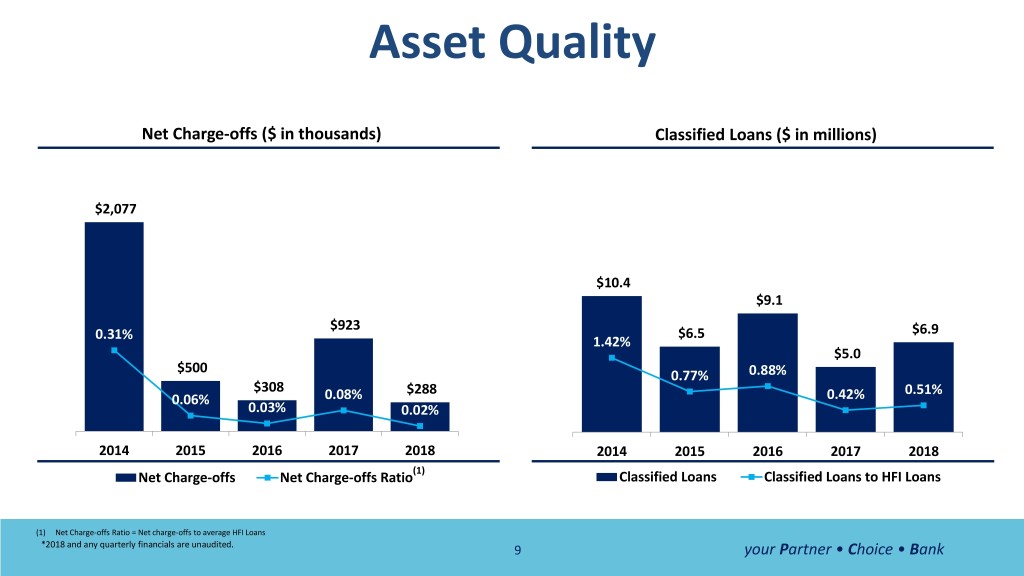
Asset Quality Net Charge-offs ($ in thousands) Classified Loans ($ in millions) $2,077 $10.4 $9.1 $923 0.31% $6.5 $6.9 1.42% $5.0 $500 0.77% 0.88% $308 $288 0.51% 0.06% 0.08% 0.42% 0.03% 0.02% 2014 2015 2016 2017 2018 2014 2015 2016 2017 2018 Net Charge-offs Net Charge-offs Ratio(1) Classified Loans Classified Loans to HFI Loans (1) Net Charge-offs Ratio = Net charge-offs to average HFI Loans *2018 and any quarterly financials are unaudited. 9 your Partner • Choice • Bank

Asset Quality (1) Nonperforming Assets (NPAs) NPAs/ Total Assets $6.5 0.72% $3.3 $2.4 $2.4 0.23% 0.23% $1.1 0.19% 0.06% 2014 2015 2016 2017 2018 2014 2015 2016 2017 2018 (2) Allowance for Loan Losses to HFI Loans Nonperforming Loan (NPL) Coverage 1.29% 1.11% 1.10% 1,241% 1.03% 0.98% 612.6% 394.0% 378.0% 146.2% 2014 2015 2016 2017 2018 2014 2015 2016 2017 2018 (1) $ in millions (2) NPL Coverage = Allowance for loan losses / NPL. *2018 and any quarterly financials are unaudited. 10 your Partner • Choice • Bank
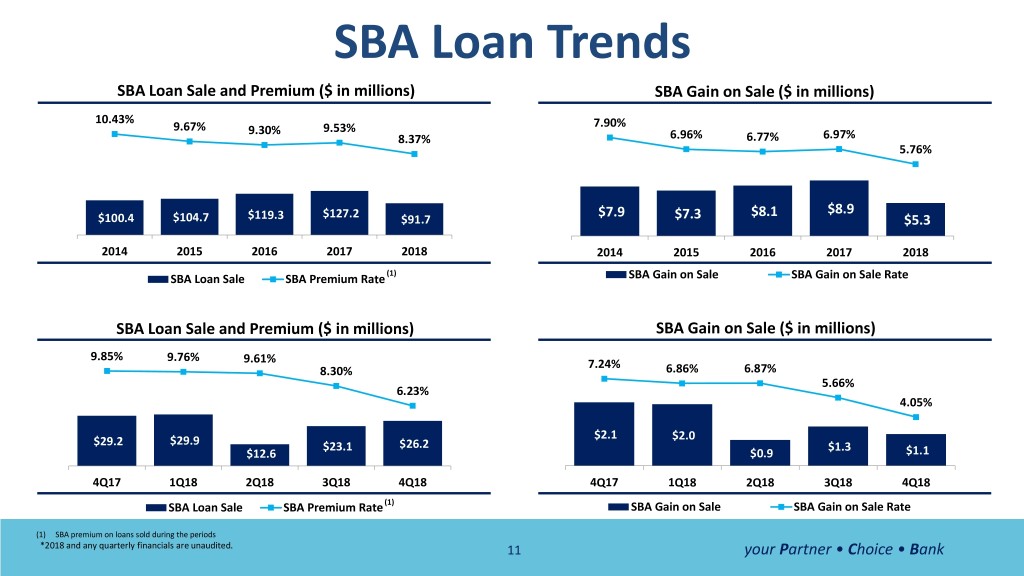
SBA Loan Trends SBA Loan Sale and Premium ($ in millions) SBA Gain on Sale ($ in millions) 10.43% 7.90% 9.67% 9.30% 9.53% 8.37% 6.96% 6.77% 6.97% 5.76% $7.9 $8.1 $8.9 $100.4 $104.7 $119.3 $127.2 $91.7 $7.3 $5.3 2014 2015 2016 2017 2018 2014 2015 2016 2017 2018 (1) SBA Loan Sale SBA Premium Rate SBA Gain on Sale SBA Gain on Sale Rate SBA Loan Sale and Premium ($ in millions) SBA Gain on Sale ($ in millions) 9.85% 9.76% 9.61% 7.24% 8.30% 6.86% 6.87% 5.66% 6.23% 4.05% $2.1 $2.0 $29.2 $29.9 $23.1 $26.2 $1.3 $12.6 $0.9 $1.1 4Q17 1Q18 2Q18 3Q18 4Q18 4Q17 1Q18 2Q18 3Q18 4Q18 SBA Loan Sale SBA Premium Rate (1) SBA Gain on Sale SBA Gain on Sale Rate (1) SBA premium on loans sold during the periods *2018 and any quarterly financials are unaudited. 11 your Partner • Choice • Bank
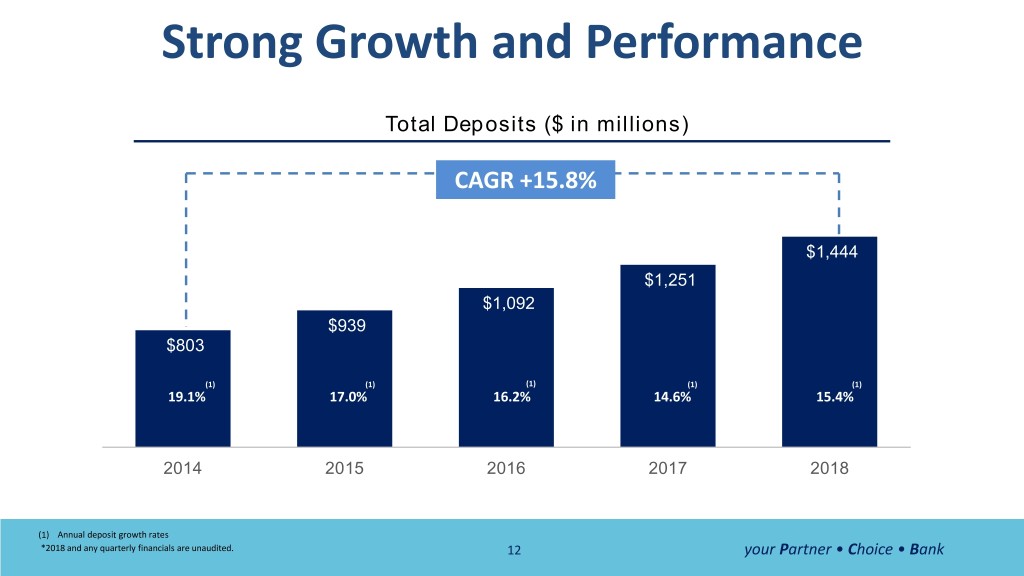
Strong Growth and Performance Total Deposits ($ in millions) CAGR +15.8% $1,444 $1,251 $1,092 $939 $803 (1) (1) (1) (1) (1) 19.1% 17.0% 16.2% 14.6% 15.4% 2014 2015 2016 2017 2018 (1) Annual deposit growth rates *2018 and any quarterly financials are unaudited. 12 your Partner • Choice • Bank
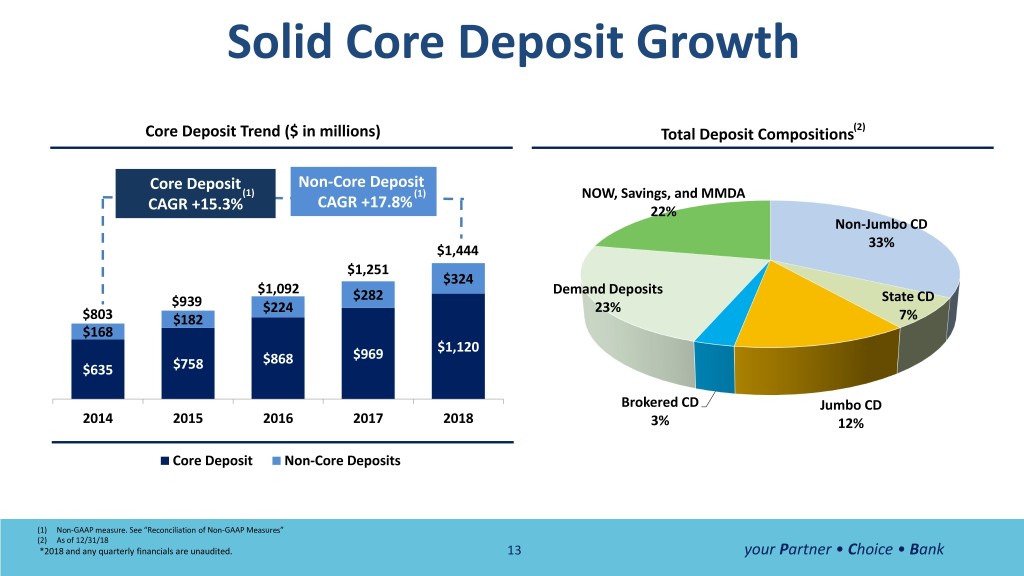
Solid Core Deposit Growth Core Deposit Trend ($ in millions) Total Deposit Compositions(2) Core Deposit Non-Core Deposit (1) (1) NOW, Savings, and MMDA CAGR +17.8% CAGR +15.3% 22% Non-Jumbo CD 33% $1,444 $1,251 $324 $1,092 Demand Deposits $282 State CD $939 $224 23% $803 $182 7% $168 $1,120 $868 $969 $635 $758 Brokered CD Jumbo CD 2014 2015 2016 2017 2018 3% 12% Core Deposit Non-Core Deposits (1) Non-GAAP measure. See “Reconciliation of Non-GAAP Measures” (2) As of 12/31/18 *2018 and any quarterly financials are unaudited. 13 your Partner • Choice • Bank
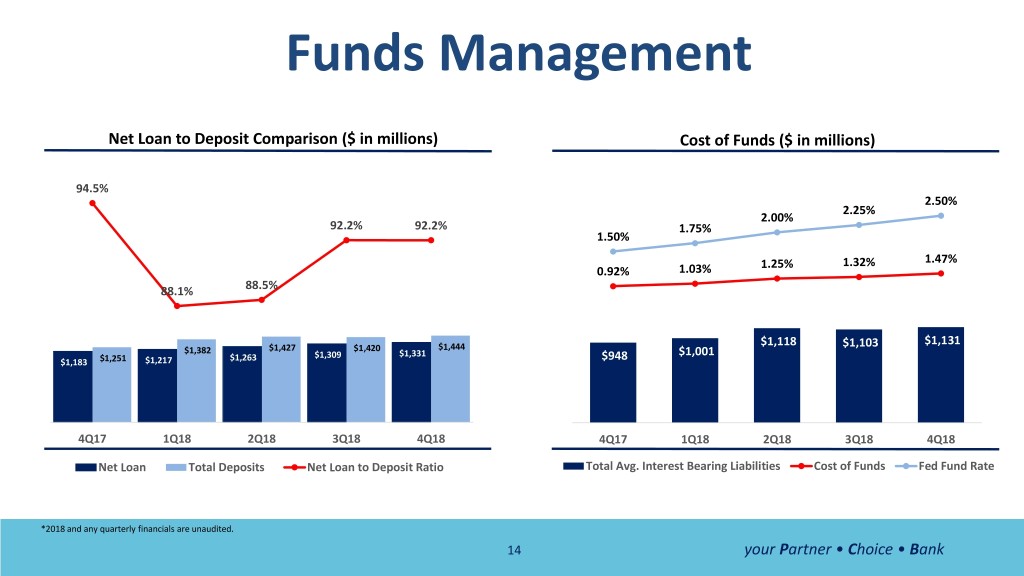
Funds Management Net Loan to Deposit Comparison ($ in millions) Cost of Funds ($ in millions) 94.5% 2.50% 2.25% 2.00% 92.2% 92.2% 1.75% 1.50% 1.25% 1.32% 1.47% 0.92% 1.03% 88.1% 88.5% $1,118 $1,131 $1,427 $1,420 $1,444 $1,103 $1,382 $1,309 $1,331 $948 $1,001 $1,183 $1,251 $1,217 $1,263 4Q17 1Q18 2Q18 3Q18 4Q18 4Q17 1Q18 2Q18 3Q18 4Q18 Net Loan Total Deposits Net Loan to Deposit Ratio Total Avg. Interest Bearing Liabilities Cost of Funds Fed Fund Rate *2018 and any quarterly financials are unaudited. 14 your Partner • Choice • Bank
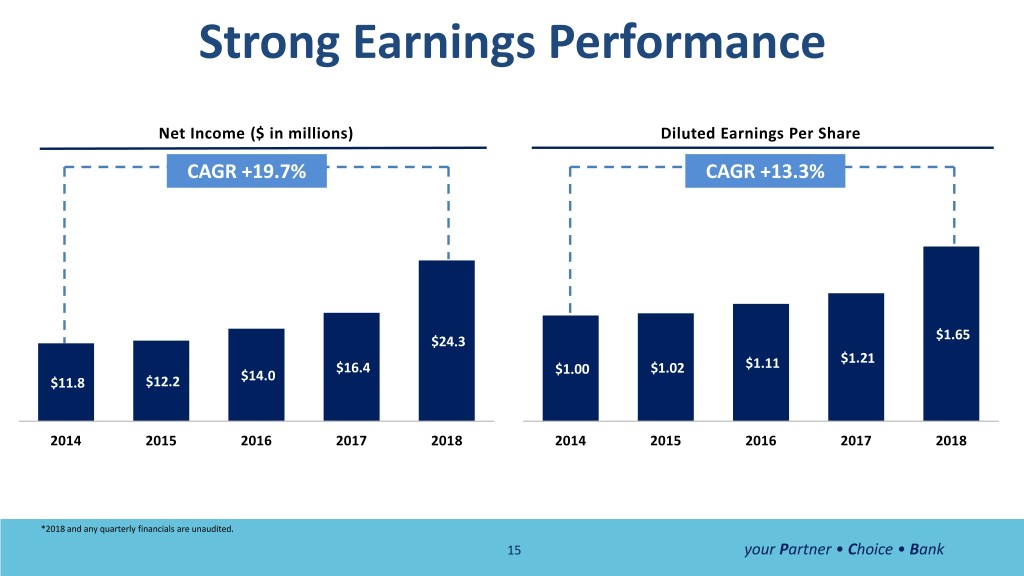
Strong Earnings Performance Net Income ($ in millions) Diluted Earnings Per Share CAGR +19.7% CAGR +13.3% $24.3 $1.65 $1.21 $16.4 $1.00 $1.02 $1.11 $11.8 $12.2 $14.0 2014 2015 2016 2017 2018 2014 2015 2016 2017 2018 *2018 and any quarterly financials are unaudited. 15 your Partner • Choice • Bank
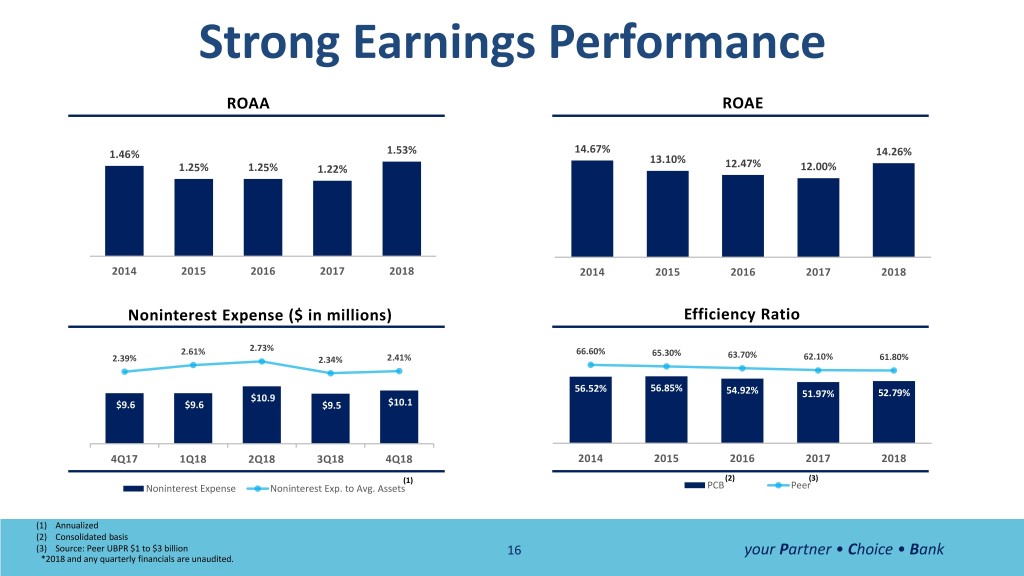
Strong Earnings Performance ROAA ROAE 1.53% 14.67% 14.26% 1.46% 13.10% 1.25% 1.25% 1.22% 12.47% 12.00% 2014 2015 2016 2017 2018 2014 2015 2016 2017 2018 Noninterest Expense ($ in millions) Efficiency Ratio 2.73% 2.61% 66.60% 65.30% 63.70% 2.39% 2.34% 2.41% 62.10% 61.80% 56.52% 56.85% 54.92% $10.9 51.97% 52.79% $9.6 $9.6 $9.5 $10.1 4Q17 1Q18 2Q18 3Q18 4Q18 2014 2015 2016 2017 2018 (1) (2) (3) Noninterest Expense Noninterest Exp. to Avg. Assets PCB Peer (1) Annualized (2) Consolidated basis (3) Source: Peer UBPR $1 to $3 billion 16 your Partner • Choice • Bank *2018 and any quarterly financials are unaudited.
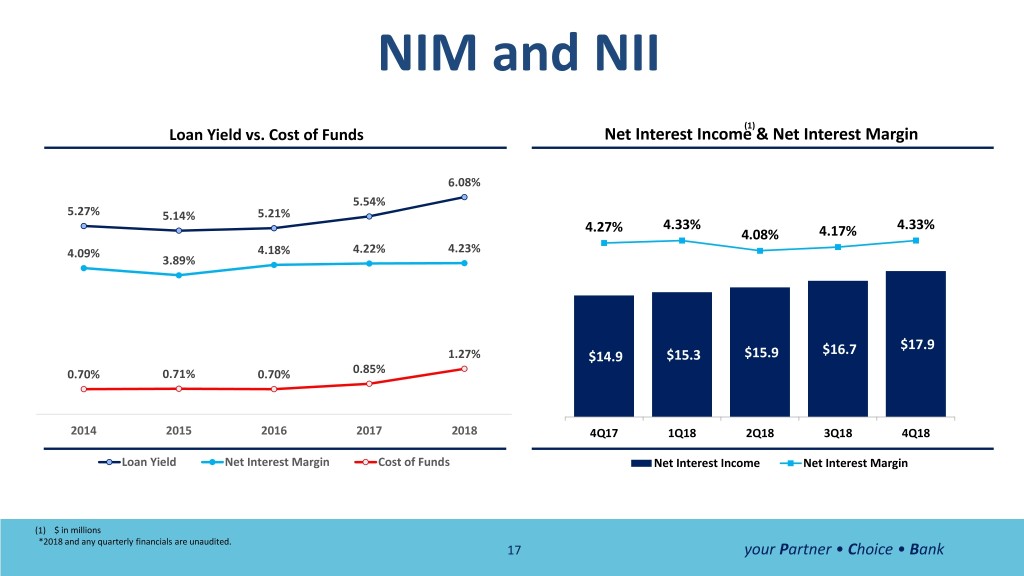
NIM and NII (1) Loan Yield vs. Cost of Funds Net Interest Income & Net Interest Margin 6.08% 5.54% 5.27% 5.14% 5.21% 4.27% 4.33% 4.33% 4.08% 4.17% 4.09% 4.18% 4.22% 4.23% 3.89% $17.9 1.27% $14.9 $15.3 $15.9 $16.7 0.70% 0.71% 0.70% 0.85% 2014 2015 2016 2017 2018 4Q17 1Q18 2Q18 3Q18 4Q18 Loan Yield Net Interest Margin Cost of Funds Net Interest Income Net Interest Margin (1) $ in millions *2018 and any quarterly financials are unaudited. 17 your Partner • Choice • Bank
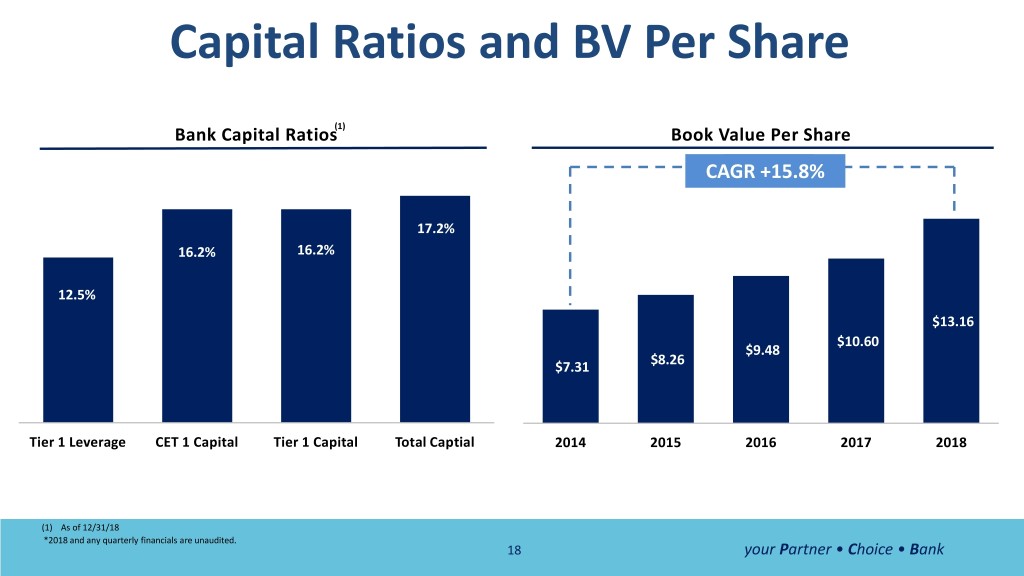
Capital Ratios and BV Per Share Bank Capital Ratios(1) Book Value Per Share CAGR +15.8% 17.2% 16.2% 16.2% 12.5% $13.16 $10.60 $9.48 $7.31 $8.26 Tier 1 Leverage CET 1 Capital Tier 1 Capital Total Captial 2014 2015 2016 2017 2018 (1) As of 12/31/18 *2018 and any quarterly financials are unaudited. 18 your Partner • Choice • Bank
Financial Highlights & Investment Opportunities Cohesive and Experienced Management Team Proven Track Record of Organic Growth Excellent Asset Quality and Strong Earnings Performance Conservative Credit Culture and Risk Profile with Diversified Loan Portfolio Increased Quarterly Cash Dividend from $0.03 to $0.05 per share in Q1 2019 19 your Partner • Choice • Bank
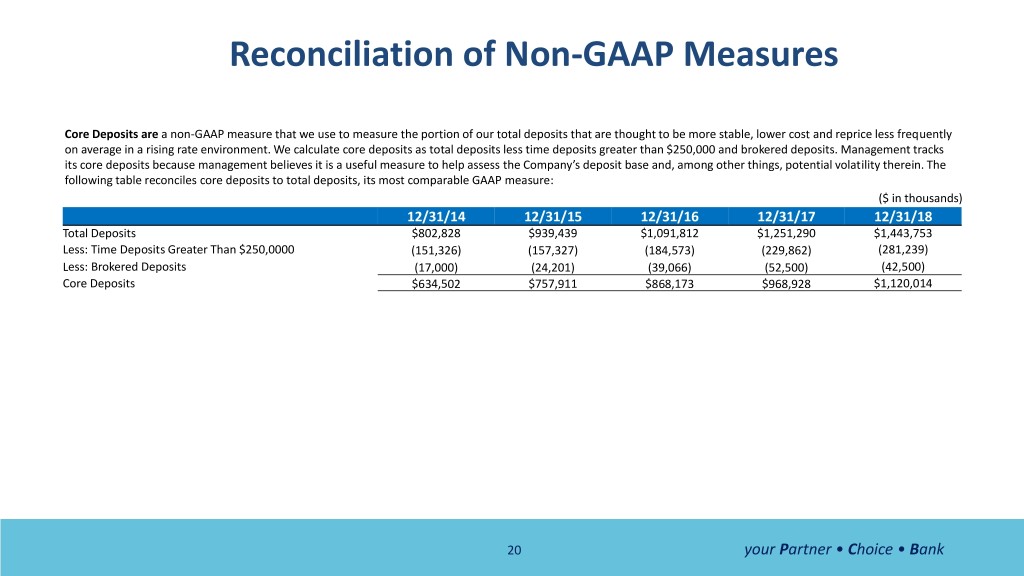
Reconciliation of Non-GAAP Measures Core Deposits are a non-GAAP measure that we use to measure the portion of our total deposits that are thought to be more stable, lower cost and reprice less frequently on average in a rising rate environment. We calculate core deposits as total deposits less time deposits greater than $250,000 and brokered deposits. Management tracks its core deposits because management believes it is a useful measure to help assess the Company’s deposit base and, among other things, potential volatility therein. The following table reconciles core deposits to total deposits, its most comparable GAAP measure: ($ in thousands) 12/31/14 12/31/15 12/31/16 12/31/17 12/31/18 Total Deposits $802,828 $939,439 $1,091,812 $1,251,290 $1,443,753 Less: Time Deposits Greater Than $250,0000 (151,326) (157,327) (184,573) (229,862) (281,239) Less: Brokered Deposits (17,000) (24,201) (39,066) (52,500) (42,500) Core Deposits $634,502 $757,911 $868,173 $968,928 $1,120,014 20 your Partner • Choice • Bank
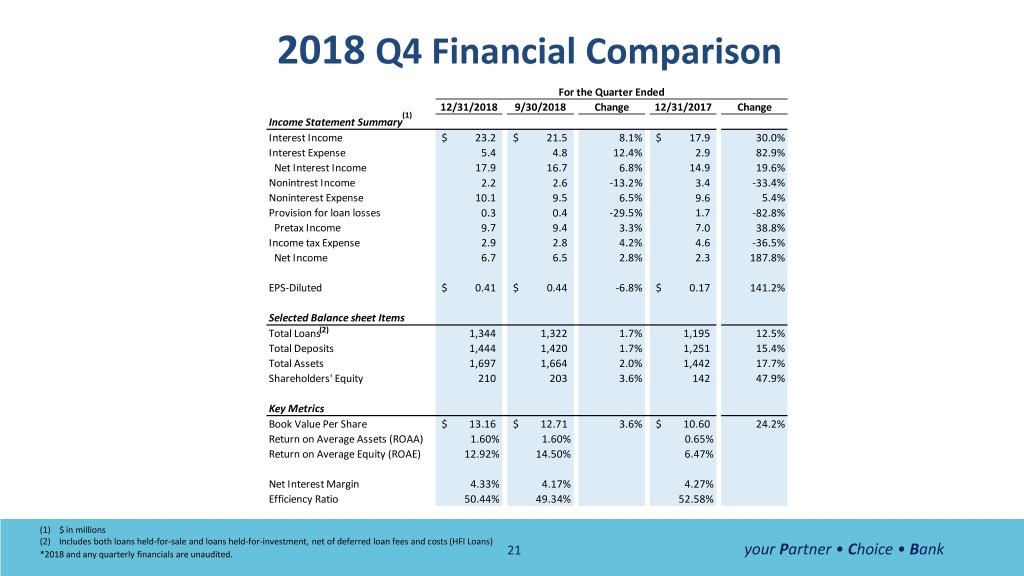
2018 Q4 Financial Comparison For the Quarter Ended 12/31/2018 9/30/2018 Change 12/31/2017 Change (1) Income Statement Summary Interest Income $ 23.2 $ 21.5 8.1% $ 17.9 30.0% Interest Expense 5.4 4.8 12.4% 2.9 82.9% Net Interest Income 17.9 16.7 6.8% 14.9 19.6% Nonintrest Income 2.2 2.6 -13.2% 3.4 -33.4% Noninterest Expense 10.1 9.5 6.5% 9.6 5.4% Provision for loan losses 0.3 0.4 -29.5% 1.7 -82.8% Pretax Income 9.7 9.4 3.3% 7.0 38.8% Income tax Expense 2.9 2.8 4.2% 4.6 -36.5% Net Income 6.7 6.5 2.8% 2.3 187.8% EPS-Diluted $ 0.41 $ 0.44 -6.8% $ 0.17 141.2% Selected Balance sheet Items Total Loans(2) 1,344 1,322 1.7% 1,195 12.5% Total Deposits 1,444 1,420 1.7% 1,251 15.4% Total Assets 1,697 1,664 2.0% 1,442 17.7% Shareholders' Equity 210 203 3.6% 142 47.9% Key Metrics Book Value Per Share $ 13.16 $ 12.71 3.6% $ 10.60 24.2% Return on Average Assets (ROAA) 1.60% 1.60% 0.65% Return on Average Equity (ROAE) 12.92% 14.50% 6.47% Net Interest Margin 4.33% 4.17% 4.27% Efficiency Ratio 50.44% 49.34% 52.58% (1) $ in millions (2) Includes both loans held-for-sale and loans held-for-investment, net of deferred loan fees and costs (HFI Loans) *2018 and any quarterly financials are unaudited. 21 your Partner • Choice • Bank


