
Annual Meeting of Shareholders May 25, 2023
Forward-Looking Statement & Non-GAAP Forward-Looking Statement This presentation contains forward-looking statements. These forward-looking statements represent plans, estimates, objectives, goals, guidelines, expectations, intentions, projections and statements of our beliefs concerning future events, business plans, objectives, expected operating results and the assumptions upon which those statements are based. Forward-looking statements include without limitation, any statement that may predict, forecast, indicate or imply future results, performance or achievements, and are typically identified with words such as “may,” “could,” “should,” “will,” “would,” “believe,” “anticipate,” “estimate,” “expect,” “aim,” “intend,” “plan,” or words or phases of similar meaning. We caution that the forward-looking statements are based largely on our expectations and are subject to a number of known and unknown risks and uncertainties that are subject to change based on factors which are, in many instances, beyond our control, including but not limited to the health of the national and local economies including the impact to the Company and its customers resulting from changes to, and the level of, inflation and interest rates; the Company’s ability to maintain and grow its deposit base; loan demand and continued portfolio performance; the impact of adverse developments at other banks, including bank failures, that impact general sentiment regarding the stability and liquidity of banks that could affect our financial performance and our stock price; changes to valuations of the Company’s assets and liabilities including the allowance for credit losses, earning assets, and intangible assets; changes to the availability of liquidity sources including borrowing lines and the ability to pledge or sell certain assets; the Company's ability to attract and retain skilled employees, customers' service expectations; cyber security risks: the Company's ability to successfully deploy new technology, the success of acquisitions and branch expansion; operational risks including the ability to detect and prevent errors and fraud; the effectiveness of the Company’s enterprise risk management framework; costs related to litigation; changes in laws, rules, regulations, or interpretations to which the Company is subject; the effects of severe weather events, pandemics, other public health crises, acts of war or terrorism, and other external events on our business. These and other important factors are detailed in various securities law filings made periodically by the Company, copies of which are available from the Company without charge. Actual results, performance or achievements could differ materially from those contemplated, expressed, or implied by the forward-looking statements. Any forward-looking statements presented herein are made only as of the date of this presentation, and we do not undertake any obligation to update or revise any forward-looking statements to reflect changes in assumptions, the occurrence of unanticipated events, or otherwise, except as required by law. Non-GAAP Financial Measures This presentation contains non-GAAP financial measures. For purposes of the SEC Regulation G, a non-GAAP financial measure is a numerical measure of the registrant’s historical or future financial performance, financial position or cash flows that excludes amounts or is subject to adjustments that have the effect of excluding amounts that are included in the most directly comparable measure calculated and presented in accordance with GAAP. Pursuant to the requirements of the SEC regulation G, reconciliation of non-GAAP measures to the most directly comparable GAAP measures are provided in the Non-GAAP Section of this presentation.
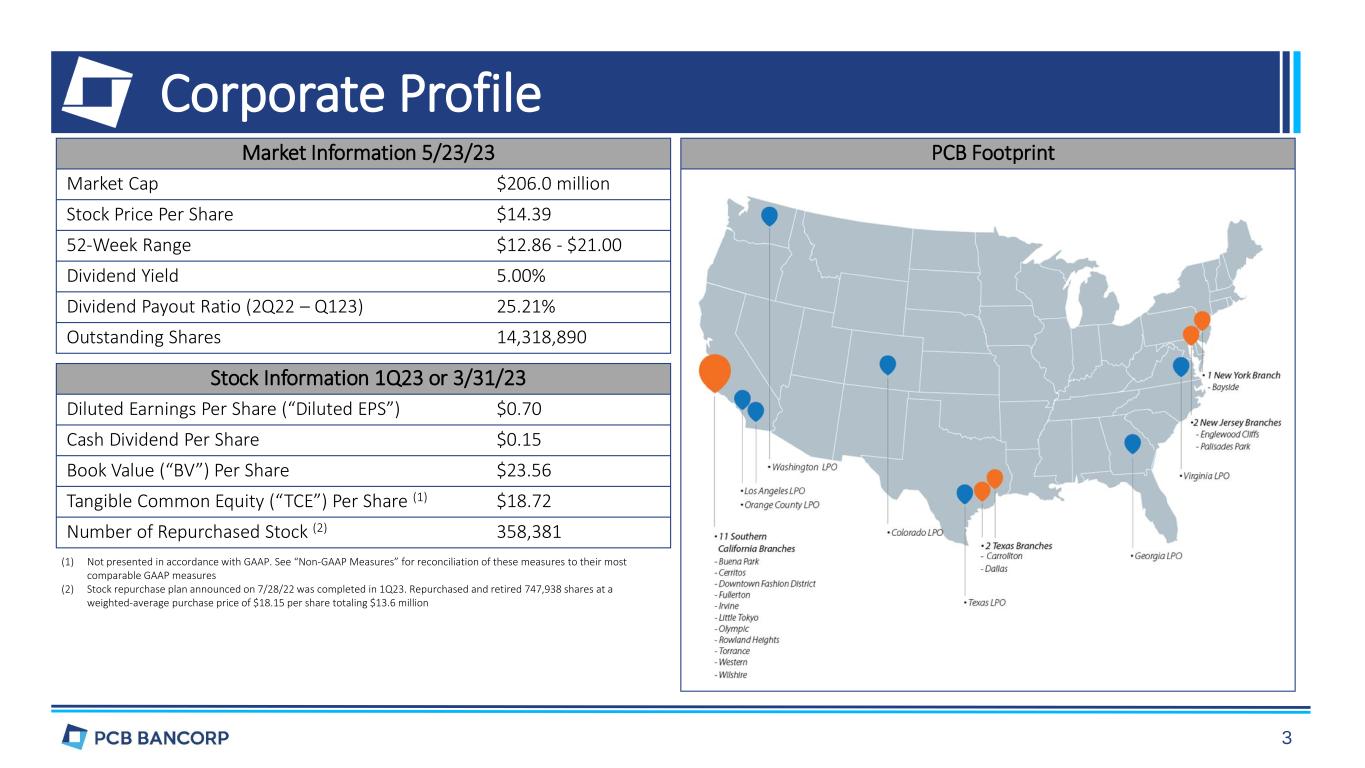
Market Information 5/23/23 Market Cap $206.0 million Stock Price Per Share $14.39 52-Week Range $12.86 - $21.00 Dividend Yield 5.00% Dividend Payout Ratio (2Q22 – Q123) 25.21% Outstanding Shares 14,318,890 Stock Information 1Q23 or 3/31/23 Diluted Earnings Per Share (“Diluted EPS”) $0.70 Cash Dividend Per Share $0.15 Book Value (“BV”) Per Share $23.56 Tangible Common Equity (“TCE”) Per Share (1) $18.72 Number of Repurchased Stock (2) 358,381 (1) Not presented in accordance with GAAP. See “Non-GAAP Measures” for reconciliation of these measures to their most comparable GAAP measures (2) Stock repurchase plan announced on 7/28/22 was completed in 1Q23. Repurchased and retired 747,938 shares at a weighted-average purchase price of $18.15 per share totaling $13.6 million PCB Footprint Corporate Profile
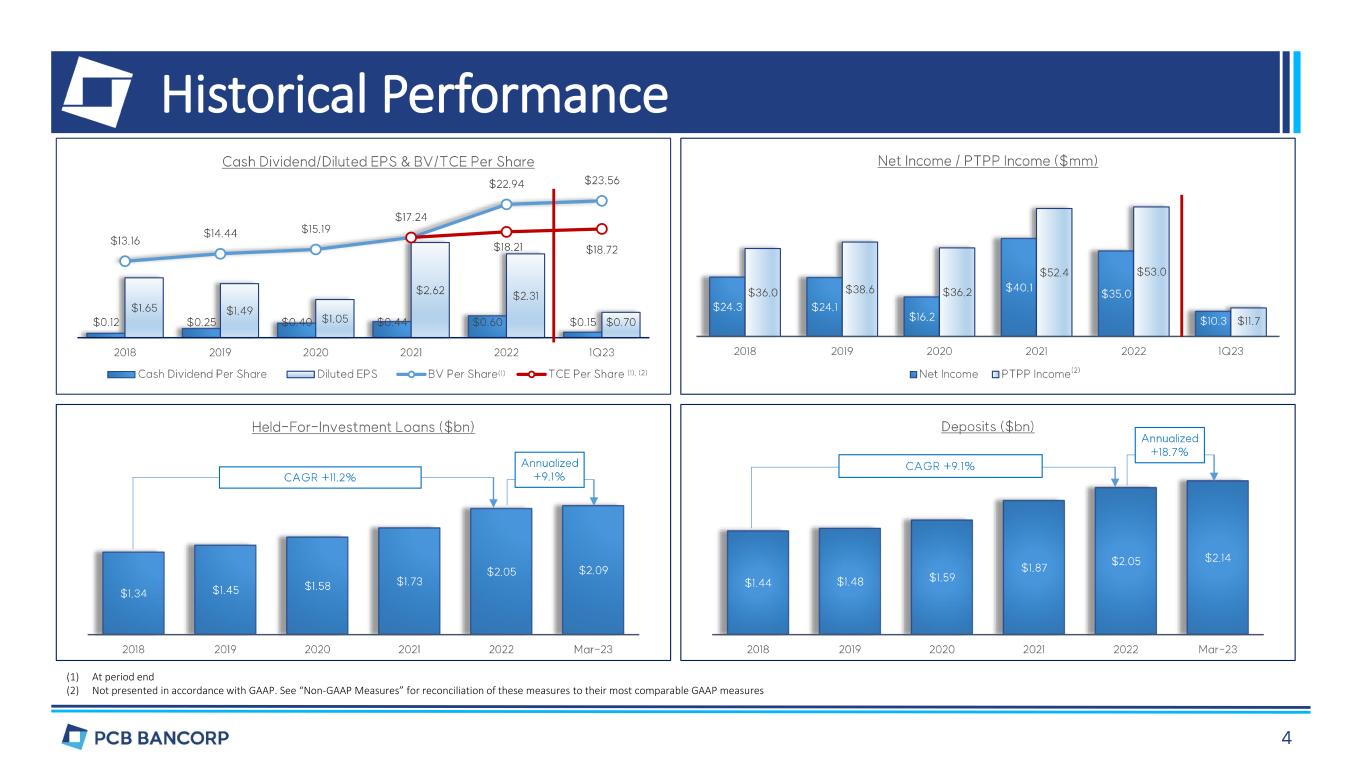
Historical Performance (1) At period end (2) Not presented in accordance with GAAP. See “Non-GAAP Measures” for reconciliation of these measures to their most comparable GAAP measures

2022 & 1Q23 Highlights • #1 - Recognized as the #1 performing bank among 300 largest publicly traded banks in the U.S. by BankDirector based on our overall 2021 performance. • Rebranding – Unveiled our new name “PCB BANK” with a new logo. People, Community, and Business banking. • Strong Financial Performance – For the 2023 first quarter o Net income of $10.3 million, or $0.70 per diluted share o Return on average assets (“ROAA”)(1) of 1.69% and Return on Average TCE (“ROATCE”)(1), (2) of 15.70% o Net interest margin(1) of 3.79% and efficiency ratio(3) of 54.1% • Branch Expansions – Opened 3 full-service branches o Palisades Park, New Jersey o Dallas and Carrollton, Texas • Mortgage Warehouse Lending – Established a new mortgage warehousing lending department in Georgia. • Community – In addition to countless volunteer hours by our employees, 2023 will be our six continuous year of scholarship program • Strong Capital Ratios – One of the highest among peers at March 31, 2023 o Bank Regulatory Capital Ratios Tier 1 Leverage – 13.62% Common Equity Tier 1 (“CET 1”) – 16.03% Tier 1 – 16.03% Total Capital – 17.27% o TCE(2) to total assets – 10.71% • Robust Liquidity – As of March 31, 2023 o 7.6% of our total assets is in cash o Borrowing capacity of 28.0% of total assets o 47.6% of the deposits are uninsured (1) Annualized. (2) Not presented in accordance with GAAP. See “Non-GAAP Measures” for reconciliation of these measures to their most comparable GAAP measures. (3) Calculated by dividing noninterest expense by the sum of net interest income and noninterest income.
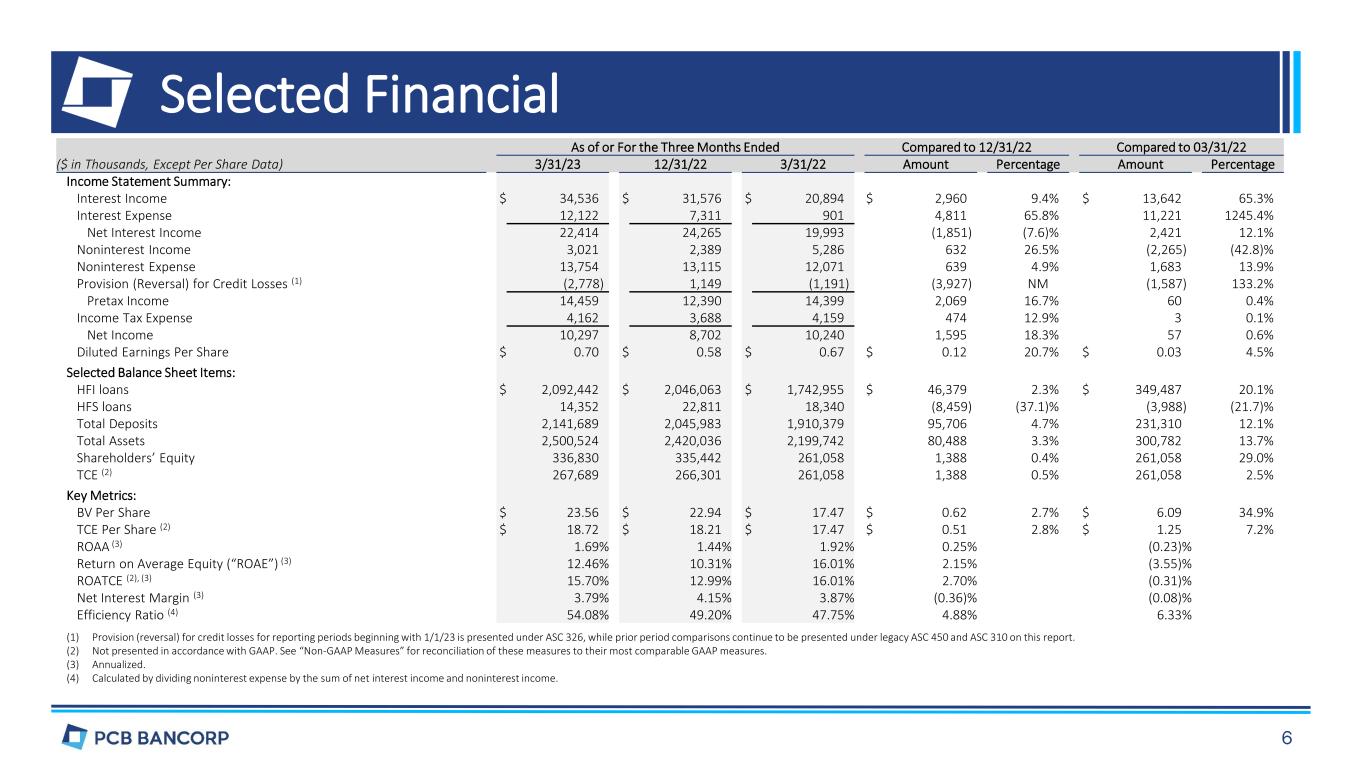
Selected Financial As of or For the Three Months Ended Compared to 12/31/22 Compared to 03/31/22 ($ in Thousands, Except Per Share Data) 3/31/23 12/31/22 3/31/22 Amount Percentage Amount Percentage Income Statement Summary: Interest Income $ 34,536 $ 31,576 $ 20,894 $ 2,960 9.4% $ 13,642 65.3% Interest Expense 12,122 7,311 901 4,811 65.8% 11,221 1245.4% Net Interest Income 22,414 24,265 19,993 (1,851) (7.6)% 2,421 12.1% Noninterest Income 3,021 2,389 5,286 632 26.5% (2,265) (42.8)% Noninterest Expense 13,754 13,115 12,071 639 4.9% 1,683 13.9% Provision (Reversal) for Credit Losses (1) (2,778) 1,149 (1,191) (3,927) NM (1,587) 133.2% Pretax Income 14,459 12,390 14,399 2,069 16.7% 60 0.4% Income Tax Expense 4,162 3,688 4,159 474 12.9% 3 0.1% Net Income 10,297 8,702 10,240 1,595 18.3% 57 0.6% Diluted Earnings Per Share $ 0.70 $ 0.58 $ 0.67 $ 0.12 20.7% $ 0.03 4.5% Selected Balance Sheet Items: HFI loans $ 2,092,442 $ 2,046,063 $ 1,742,955 $ 46,379 2.3% $ 349,487 20.1% HFS loans 14,352 22,811 18,340 (8,459) (37.1)% (3,988) (21.7)% Total Deposits 2,141,689 2,045,983 1,910,379 95,706 4.7% 231,310 12.1% Total Assets 2,500,524 2,420,036 2,199,742 80,488 3.3% 300,782 13.7% Shareholders’ Equity 336,830 335,442 261,058 1,388 0.4% 261,058 29.0% TCE (2) 267,689 266,301 261,058 1,388 0.5% 261,058 2.5% Key Metrics: BV Per Share $ 23.56 $ 22.94 $ 17.47 $ 0.62 2.7% $ 6.09 34.9% TCE Per Share (2) $ 18.72 $ 18.21 $ 17.47 $ 0.51 2.8% $ 1.25 7.2% ROAA (3) 1.69% 1.44% 1.92% 0.25% (0.23)% Return on Average Equity (“ROAE”) (3) 12.46% 10.31% 16.01% 2.15% (3.55)% ROATCE (2), (3) 15.70% 12.99% 16.01% 2.70% (0.31)% Net Interest Margin (3) 3.79% 4.15% 3.87% (0.36)% (0.08)% Efficiency Ratio (4) 54.08% 49.20% 47.75% 4.88% 6.33% (1) Provision (reversal) for credit losses for reporting periods beginning with 1/1/23 is presented under ASC 326, while prior period comparisons continue to be presented under legacy ASC 450 and ASC 310 on this report. (2) Not presented in accordance with GAAP. See “Non-GAAP Measures” for reconciliation of these measures to their most comparable GAAP measures. (3) Annualized. (4) Calculated by dividing noninterest expense by the sum of net interest income and noninterest income.

Loan Overview (1) Per regulatory definition in the Commercial Real Estate (“CRE”) Concentration Guidance 1Q23 Highlights • HFI loans increased $46.4MM (2.3%) to $2.09B • CRE loans increased $5.0MM (0.3%), C&I loans increased $18.4MM (7.4%) & residential mortgage loans increased $23.2MM (7.0%)
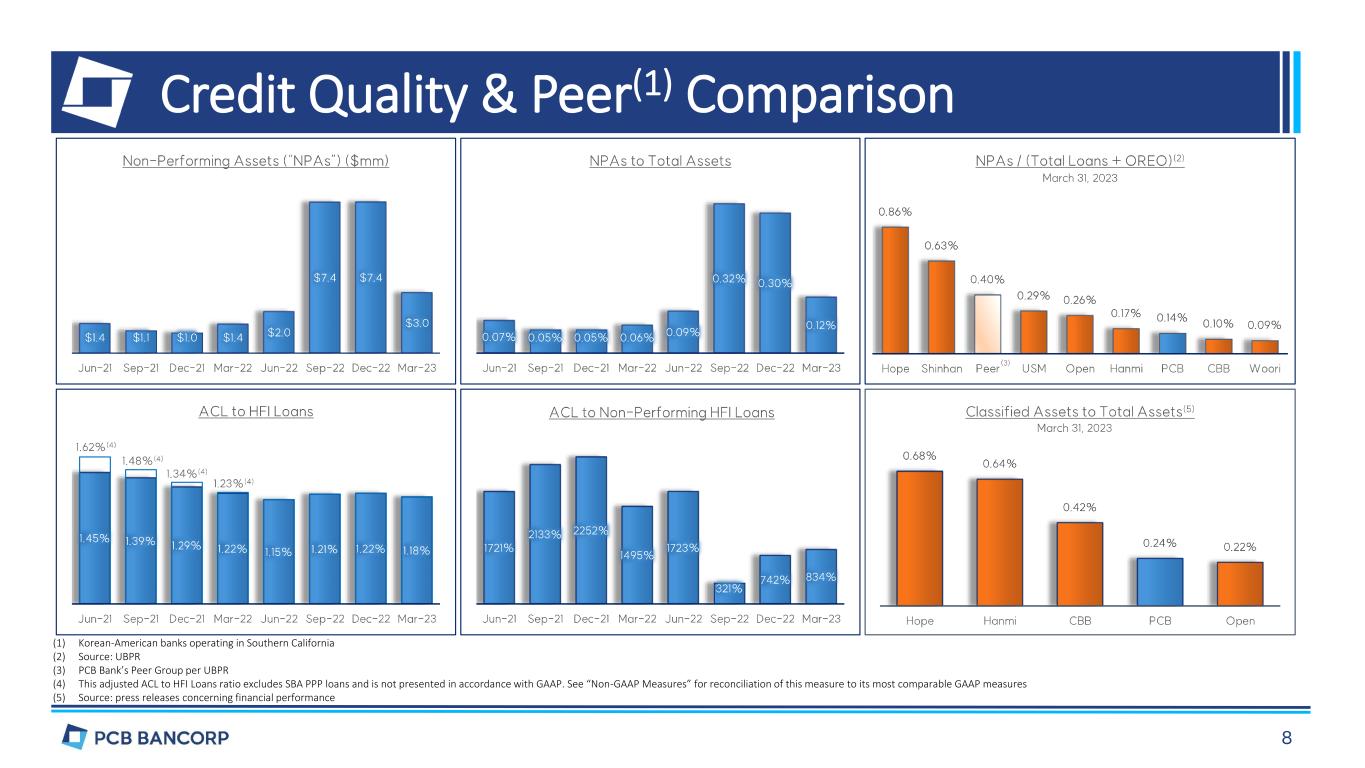
Credit Quality & Peer(1) Comparison (1) Korean-American banks operating in Southern California (2) Source: UBPR (3) PCB Bank’s Peer Group per UBPR (4) This adjusted ACL to HFI Loans ratio excludes SBA PPP loans and is not presented in accordance with GAAP. See “Non-GAAP Measures” for reconciliation of this measure to its most comparable GAAP measures (5) Source: press releases concerning financial performance
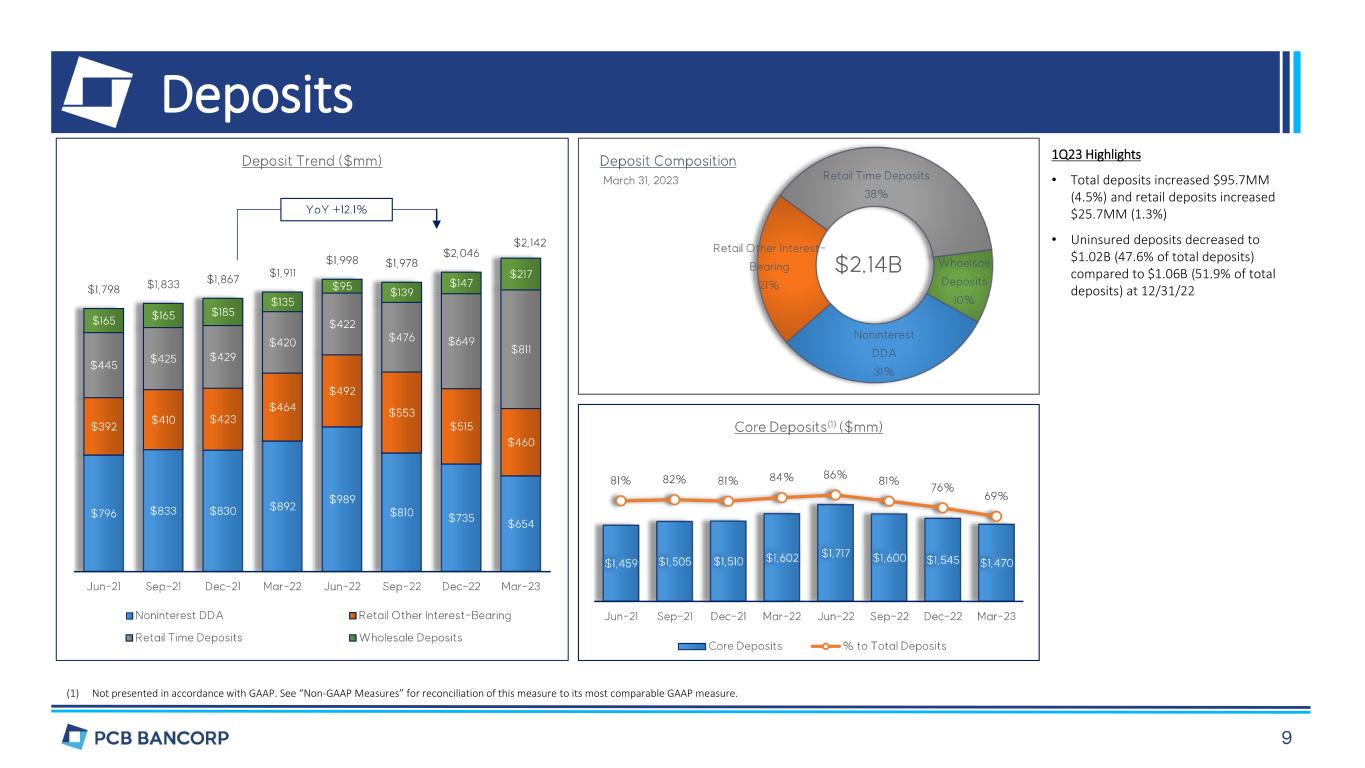
Deposits (1) Not presented in accordance with GAAP. See “Non-GAAP Measures” for reconciliation of this measure to its most comparable GAAP measure. 1Q23 Highlights • Total deposits increased $95.7MM (4.5%) and retail deposits increased $25.7MM (1.3%) • Uninsured deposits decreased to $1.02B (47.6% of total deposits) compared to $1.06B (51.9% of total deposits) at 12/31/22
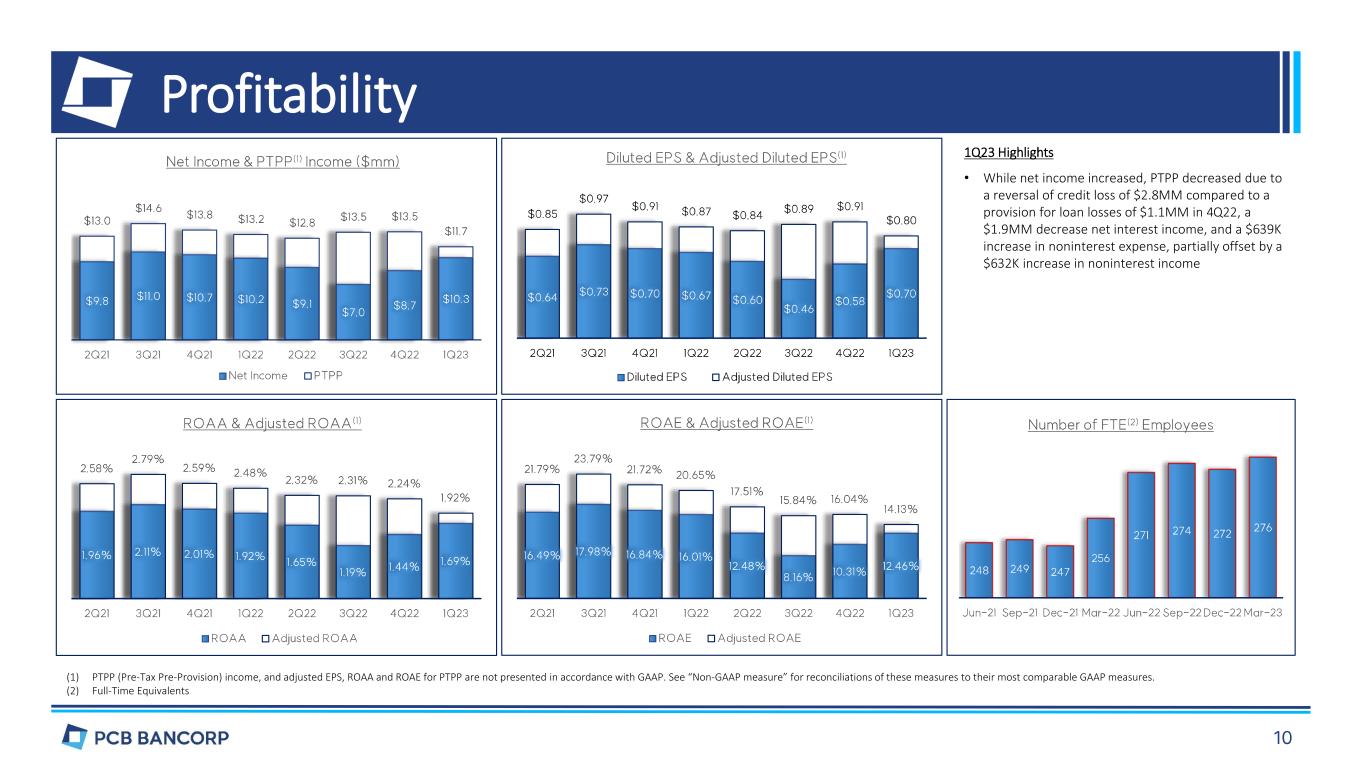
Profitability (1) PTPP (Pre-Tax Pre-Provision) income, and adjusted EPS, ROAA and ROAE for PTPP are not presented in accordance with GAAP. See “Non-GAAP measure” for reconciliations of these measures to their most comparable GAAP measures. (2) Full-Time Equivalents 1Q23 Highlights • While net income increased, PTPP decreased due to a reversal of credit loss of $2.8MM compared to a provision for loan losses of $1.1MM in 4Q22, a $1.9MM decrease net interest income, and a $639K increase in noninterest expense, partially offset by a $632K increase in noninterest income
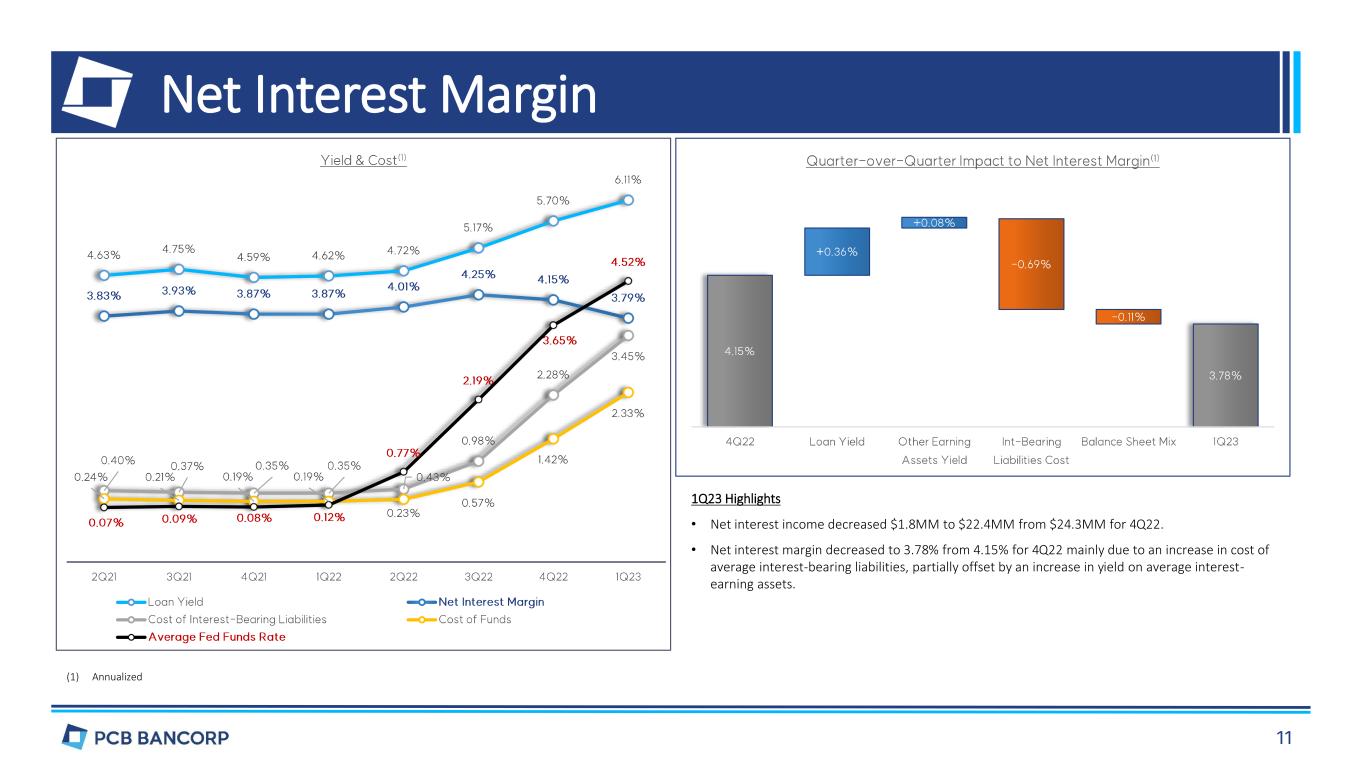
Net Interest Margin (1) Annualized 1Q23 Highlights • Net interest income decreased $1.8MM to $22.4MM from $24.3MM for 4Q22. • Net interest margin decreased to 3.78% from 4.15% for 4Q22 mainly due to an increase in cost of average interest-bearing liabilities, partially offset by an increase in yield on average interest- earning assets.
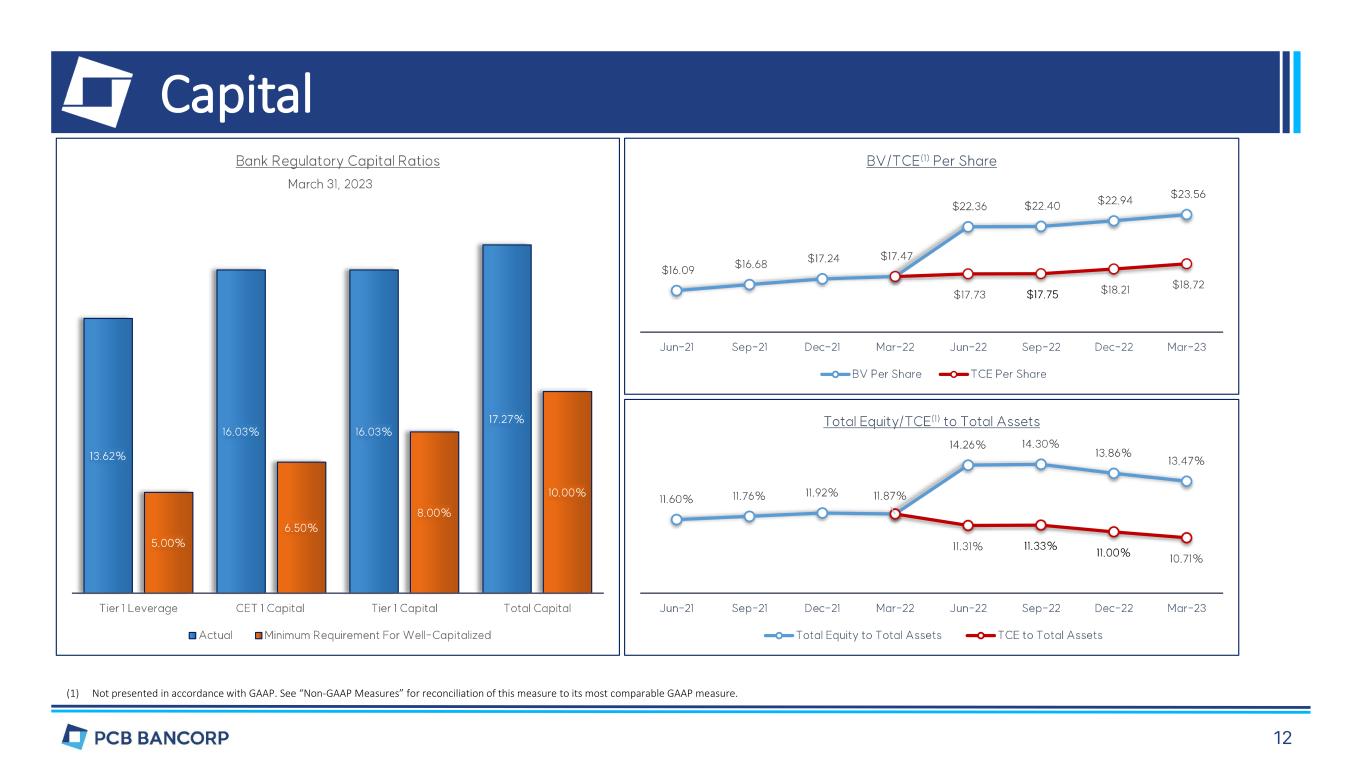
Capital (1) Not presented in accordance with GAAP. See “Non-GAAP Measures” for reconciliation of this measure to its most comparable GAAP measure.
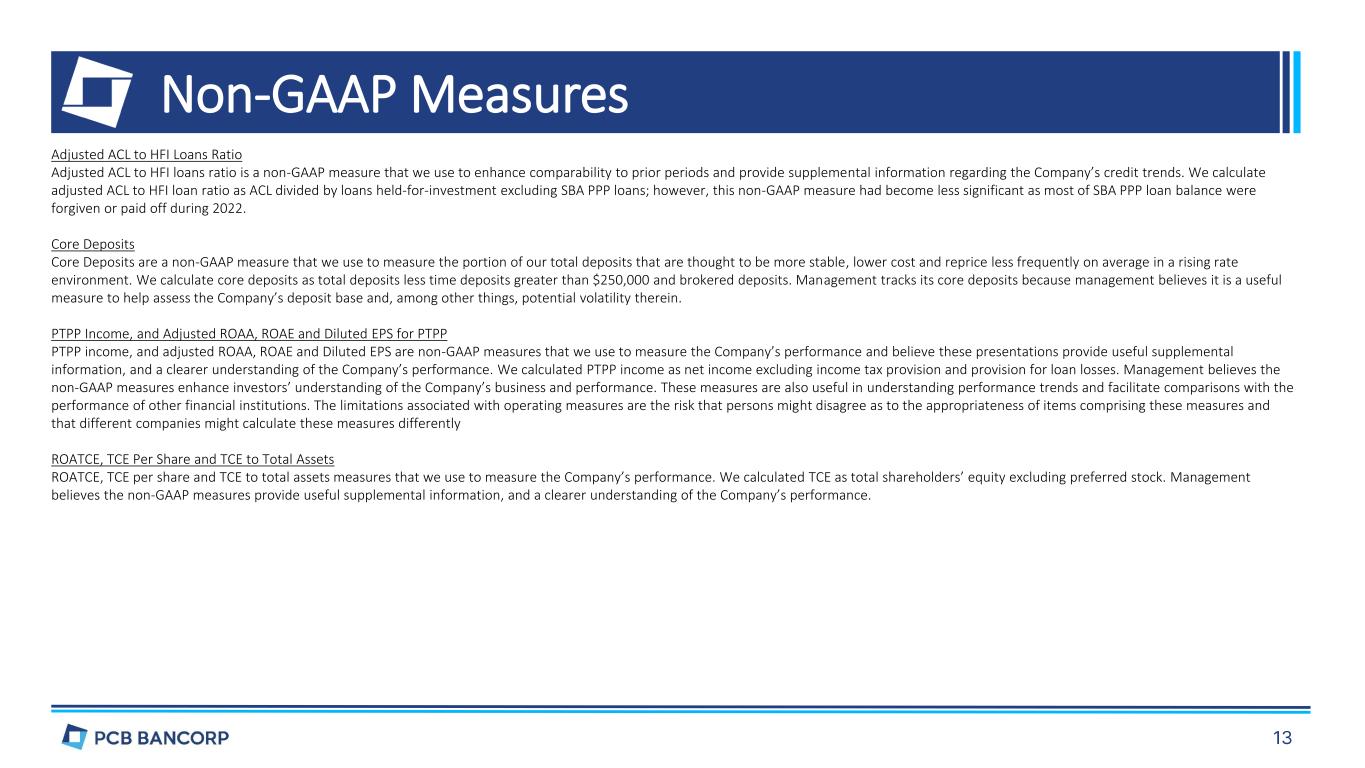
Non-GAAP Measures Adjusted ACL to HFI Loans Ratio Adjusted ACL to HFI loans ratio is a non-GAAP measure that we use to enhance comparability to prior periods and provide supplemental information regarding the Company’s credit trends. We calculate adjusted ACL to HFI loan ratio as ACL divided by loans held-for-investment excluding SBA PPP loans; however, this non-GAAP measure had become less significant as most of SBA PPP loan balance were forgiven or paid off during 2022. Core Deposits Core Deposits are a non-GAAP measure that we use to measure the portion of our total deposits that are thought to be more stable, lower cost and reprice less frequently on average in a rising rate environment. We calculate core deposits as total deposits less time deposits greater than $250,000 and brokered deposits. Management tracks its core deposits because management believes it is a useful measure to help assess the Company’s deposit base and, among other things, potential volatility therein. PTPP Income, and Adjusted ROAA, ROAE and Diluted EPS for PTPP PTPP income, and adjusted ROAA, ROAE and Diluted EPS are non-GAAP measures that we use to measure the Company’s performance and believe these presentations provide useful supplemental information, and a clearer understanding of the Company’s performance. We calculated PTPP income as net income excluding income tax provision and provision for loan losses. Management believes the non-GAAP measures enhance investors’ understanding of the Company’s business and performance. These measures are also useful in understanding performance trends and facilitate comparisons with the performance of other financial institutions. The limitations associated with operating measures are the risk that persons might disagree as to the appropriateness of items comprising these measures and that different companies might calculate these measures differently ROATCE, TCE Per Share and TCE to Total Assets ROATCE, TCE per share and TCE to total assets measures that we use to measure the Company’s performance. We calculated TCE as total shareholders’ equity excluding preferred stock. Management believes the non-GAAP measures provide useful supplemental information, and a clearer understanding of the Company’s performance.
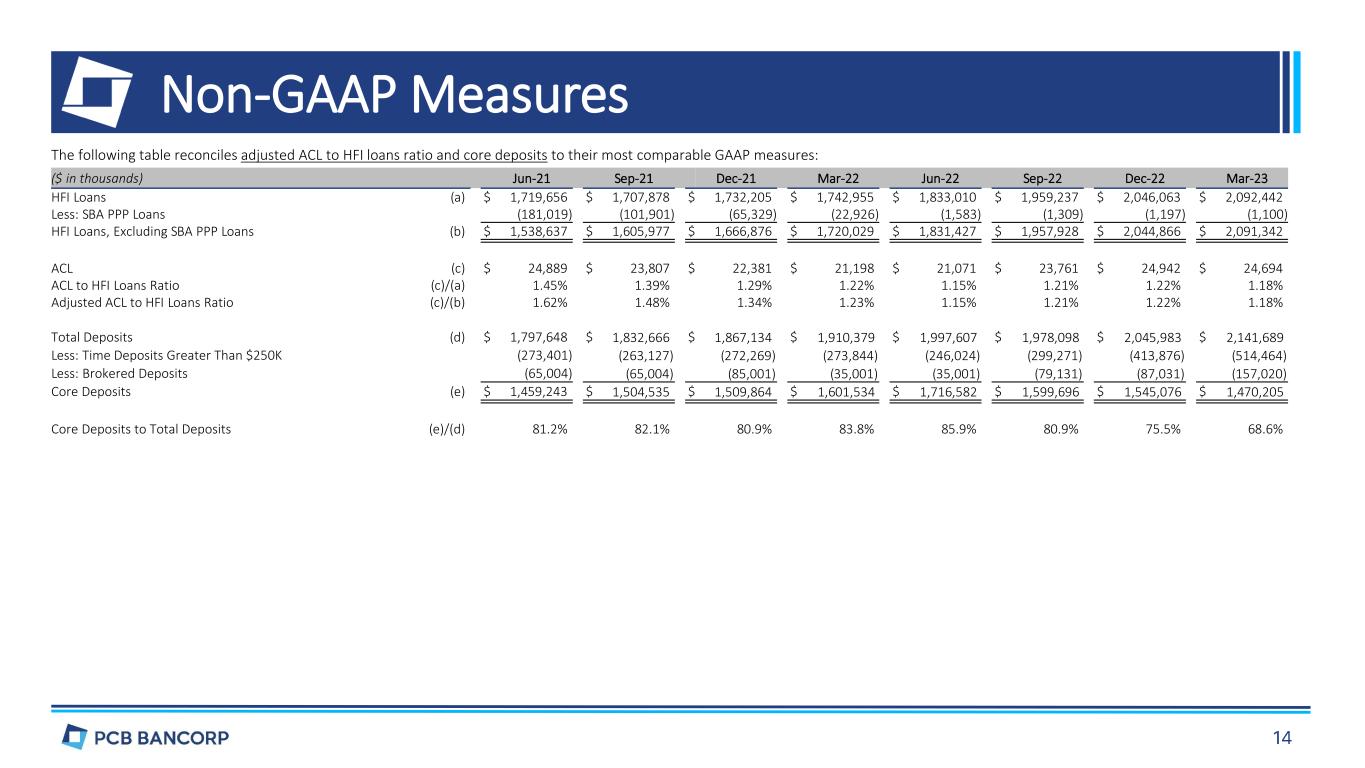
Non-GAAP Measures The following table reconciles adjusted ACL to HFI loans ratio and core deposits to their most comparable GAAP measures: ($ in thousands) Jun-21 Sep-21 Dec-21 Mar-22 Jun-22 Sep-22 Dec-22 Mar-23 HFI Loans (a) $ 1,719,656 $ 1,707,878 $ 1,732,205 $ 1,742,955 $ 1,833,010 $ 1,959,237 $ 2,046,063 $ 2,092,442 Less: SBA PPP Loans (181,019) (101,901) (65,329) (22,926) (1,583) (1,309) (1,197) (1,100) HFI Loans, Excluding SBA PPP Loans (b) $ 1,538,637 $ 1,605,977 $ 1,666,876 $ 1,720,029 $ 1,831,427 $ 1,957,928 $ 2,044,866 $ 2,091,342 ACL (c) $ 24,889 $ 23,807 $ 22,381 $ 21,198 $ 21,071 $ 23,761 $ 24,942 $ 24,694 ACL to HFI Loans Ratio (c)/(a) 1.45% 1.39% 1.29% 1.22% 1.15% 1.21% 1.22% 1.18% Adjusted ACL to HFI Loans Ratio (c)/(b) 1.62% 1.48% 1.34% 1.23% 1.15% 1.21% 1.22% 1.18% Total Deposits (d) $ 1,797,648 $ 1,832,666 $ 1,867,134 $ 1,910,379 $ 1,997,607 $ 1,978,098 $ 2,045,983 $ 2,141,689 Less: Time Deposits Greater Than $250K (273,401) (263,127) (272,269) (273,844) (246,024) (299,271) (413,876) (514,464) Less: Brokered Deposits (65,004) (65,004) (85,001) (35,001) (35,001) (79,131) (87,031) (157,020) Core Deposits (e) $ 1,459,243 $ 1,504,535 $ 1,509,864 $ 1,601,534 $ 1,716,582 $ 1,599,696 $ 1,545,076 $ 1,470,205 Core Deposits to Total Deposits (e)/(d) 81.2% 82.1% 80.9% 83.8% 85.9% 80.9% 75.5% 68.6%
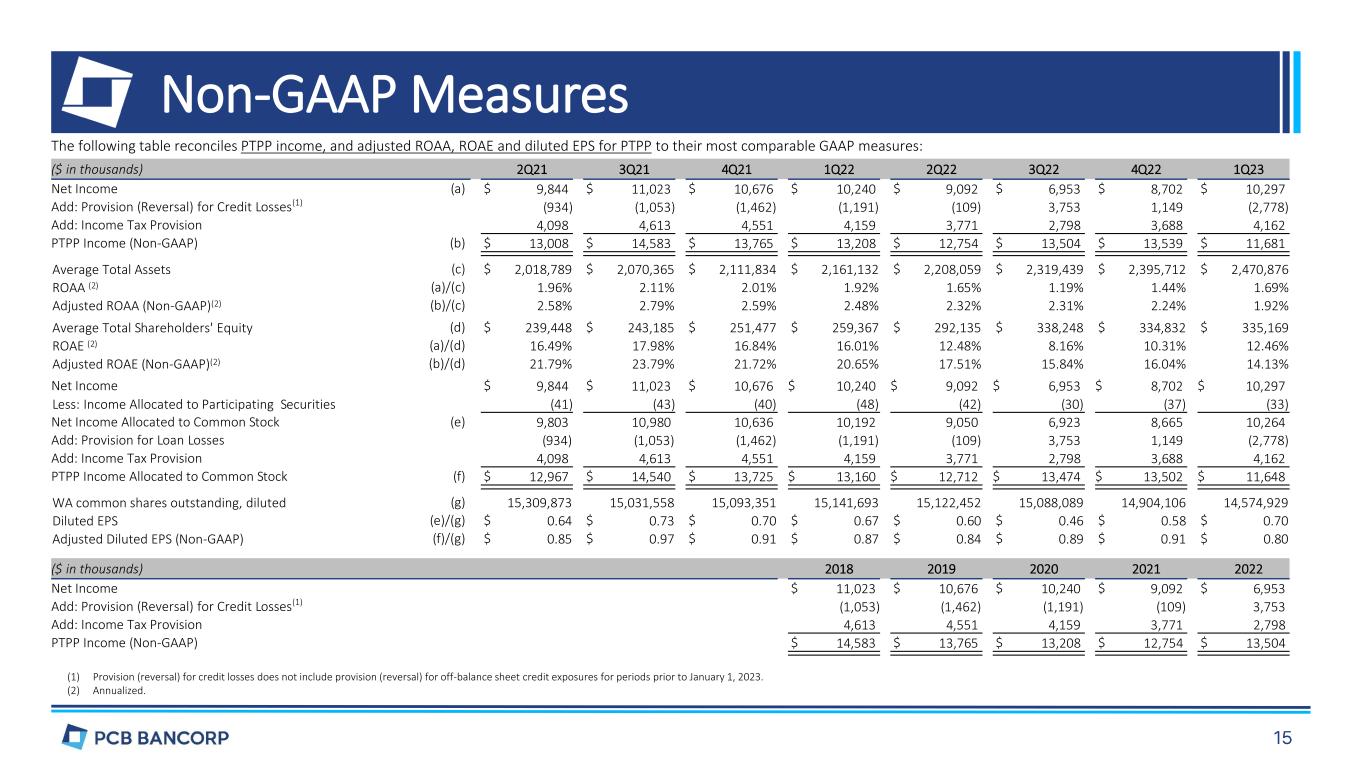
Non-GAAP Measures (1) Provision (reversal) for credit losses does not include provision (reversal) for off-balance sheet credit exposures for periods prior to January 1, 2023. (2) Annualized. The following table reconciles PTPP income, and adjusted ROAA, ROAE and diluted EPS for PTPP to their most comparable GAAP measures: ($ in thousands) 2Q21 3Q21 4Q21 1Q22 2Q22 3Q22 4Q22 1Q23 Net Income (a) $ 9,844 $ 11,023 $ 10,676 $ 10,240 $ 9,092 $ 6,953 $ 8,702 $ 10,297 Add: Provision (Reversal) for Credit Losses(1) (934) (1,053) (1,462) (1,191) (109) 3,753 1,149 (2,778) Add: Income Tax Provision 4,098 4,613 4,551 4,159 3,771 2,798 3,688 4,162 PTPP Income (Non-GAAP) (b) $ 13,008 $ 14,583 $ 13,765 $ 13,208 $ 12,754 $ 13,504 $ 13,539 $ 11,681 Average Total Assets (c) $ 2,018,789 $ 2,070,365 $ 2,111,834 $ 2,161,132 $ 2,208,059 $ 2,319,439 $ 2,395,712 $ 2,470,876 ROAA (2) (a)/(c) 1.96% 2.11% 2.01% 1.92% 1.65% 1.19% 1.44% 1.69% Adjusted ROAA (Non-GAAP)(2) (b)/(c) 2.58% 2.79% 2.59% 2.48% 2.32% 2.31% 2.24% 1.92% Average Total Shareholders' Equity (d) $ 239,448 $ 243,185 $ 251,477 $ 259,367 $ 292,135 $ 338,248 $ 334,832 $ 335,169 ROAE (2) (a)/(d) 16.49% 17.98% 16.84% 16.01% 12.48% 8.16% 10.31% 12.46% Adjusted ROAE (Non-GAAP)(2) (b)/(d) 21.79% 23.79% 21.72% 20.65% 17.51% 15.84% 16.04% 14.13% Net Income $ 9,844 $ 11,023 $ 10,676 $ 10,240 $ 9,092 $ 6,953 $ 8,702 $ 10,297 Less: Income Allocated to Participating Securities (41) (43) (40) (48) (42) (30) (37) (33) Net Income Allocated to Common Stock (e) 9,803 10,980 10,636 10,192 9,050 6,923 8,665 10,264 Add: Provision for Loan Losses (934) (1,053) (1,462) (1,191) (109) 3,753 1,149 (2,778) Add: Income Tax Provision 4,098 4,613 4,551 4,159 3,771 2,798 3,688 4,162 PTPP Income Allocated to Common Stock (f) $ 12,967 $ 14,540 $ 13,725 $ 13,160 $ 12,712 $ 13,474 $ 13,502 $ 11,648 WA common shares outstanding, diluted (g) 15,309,873 15,031,558 15,093,351 15,141,693 15,122,452 15,088,089 14,904,106 14,574,929 Diluted EPS (e)/(g) $ 0.64 $ 0.73 $ 0.70 $ 0.67 $ 0.60 $ 0.46 $ 0.58 $ 0.70 Adjusted Diluted EPS (Non-GAAP) (f)/(g) $ 0.85 $ 0.97 $ 0.91 $ 0.87 $ 0.84 $ 0.89 $ 0.91 $ 0.80 ($ in thousands) 2018 2019 2020 2021 2022 Net Income $ 11,023 $ 10,676 $ 10,240 $ 9,092 $ 6,953 Add: Provision (Reversal) for Credit Losses(1) (1,053) (1,462) (1,191) (109) 3,753 Add: Income Tax Provision 4,613 4,551 4,159 3,771 2,798 PTPP Income (Non-GAAP) $ 14,583 $ 13,765 $ 13,208 $ 12,754 $ 13,504
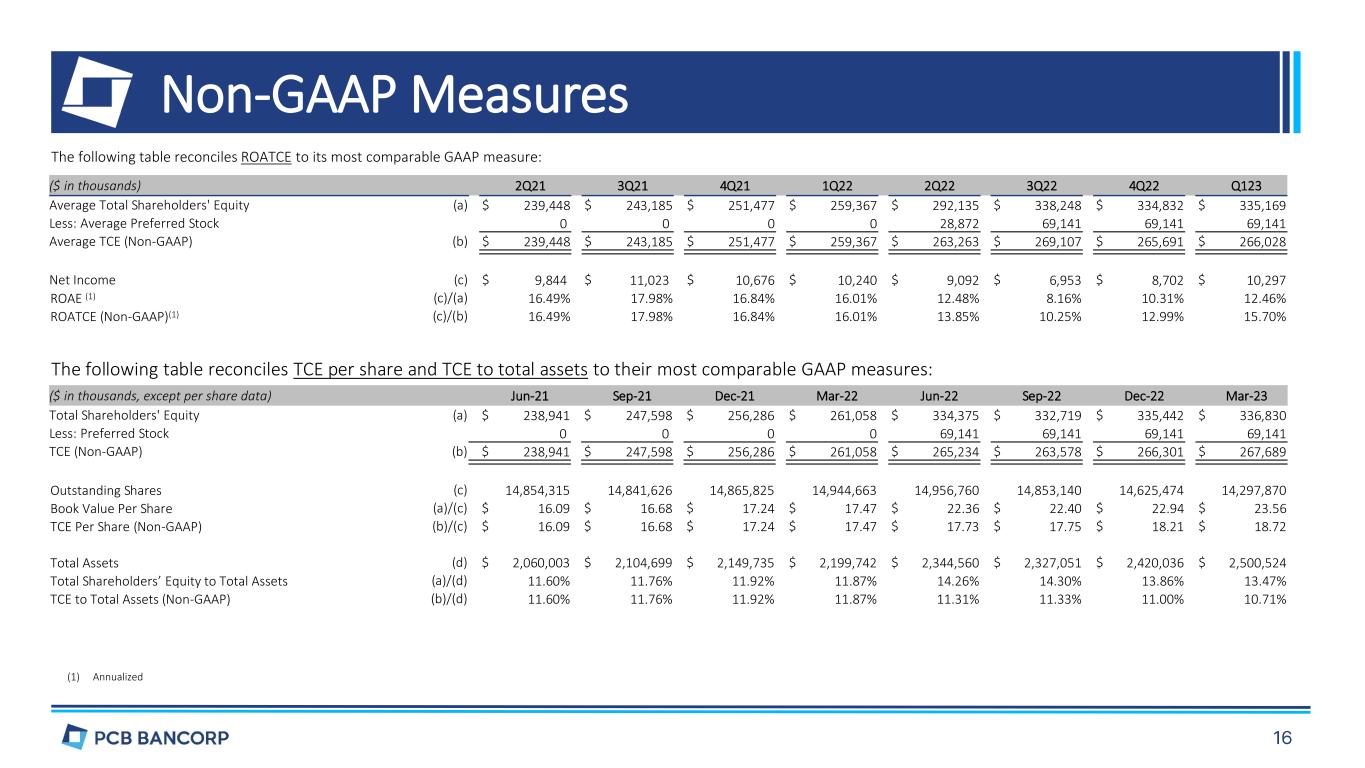
Non-GAAP Measures (1) Annualized The following table reconciles ROATCE to its most comparable GAAP measure: ($ in thousands) 2Q21 3Q21 4Q21 1Q22 2Q22 3Q22 4Q22 Q123 Average Total Shareholders' Equity (a) $ 239,448 $ 243,185 $ 251,477 $ 259,367 $ 292,135 $ 338,248 $ 334,832 $ 335,169 Less: Average Preferred Stock 0 0 0 0 28,872 69,141 69,141 69,141 Average TCE (Non-GAAP) (b) $ 239,448 $ 243,185 $ 251,477 $ 259,367 $ 263,263 $ 269,107 $ 265,691 $ 266,028 Net Income (c) $ 9,844 $ 11,023 $ 10,676 $ 10,240 $ 9,092 $ 6,953 $ 8,702 $ 10,297 ROAE (1) (c)/(a) 16.49% 17.98% 16.84% 16.01% 12.48% 8.16% 10.31% 12.46% ROATCE (Non-GAAP)(1) (c)/(b) 16.49% 17.98% 16.84% 16.01% 13.85% 10.25% 12.99% 15.70% The following table reconciles TCE per share and TCE to total assets to their most comparable GAAP measures: ($ in thousands, except per share data) Jun-21 Sep-21 Dec-21 Mar-22 Jun-22 Sep-22 Dec-22 Mar-23 Total Shareholders' Equity (a) $ 238,941 $ 247,598 $ 256,286 $ 261,058 $ 334,375 $ 332,719 $ 335,442 $ 336,830 Less: Preferred Stock 0 0 0 0 69,141 69,141 69,141 69,141 TCE (Non-GAAP) (b) $ 238,941 $ 247,598 $ 256,286 $ 261,058 $ 265,234 $ 263,578 $ 266,301 $ 267,689 Outstanding Shares (c) 14,854,315 14,841,626 14,865,825 14,944,663 14,956,760 14,853,140 14,625,474 14,297,870 Book Value Per Share (a)/(c) $ 16.09 $ 16.68 $ 17.24 $ 17.47 $ 22.36 $ 22.40 $ 22.94 $ 23.56 TCE Per Share (Non-GAAP) (b)/(c) $ 16.09 $ 16.68 $ 17.24 $ 17.47 $ 17.73 $ 17.75 $ 18.21 $ 18.72 Total Assets (d) $ 2,060,003 $ 2,104,699 $ 2,149,735 $ 2,199,742 $ 2,344,560 $ 2,327,051 $ 2,420,036 $ 2,500,524 Total Shareholders’ Equity to Total Assets (a)/(d) 11.60% 11.76% 11.92% 11.87% 14.26% 14.30% 13.86% 13.47% TCE to Total Assets (Non-GAAP) (b)/(d) 11.60% 11.76% 11.92% 11.87% 11.31% 11.33% 11.00% 10.71%


