
Earnings Results 4Q24 January 30, 2025
2 Forward-Looking Statements & Non-GAAP Cautionary Note Regarding Forward-Looking Statements This presentation contains forward-looking statements. These forward-looking statements represent plans, estimates, objectives, goals, guidelines, expectations, intentions, projections and statements of our beliefs concerning future events, business plans, objectives, expected operating results and the assumptions upon which those statements are based. Forward-looking statements include without limitation any statement that may predict, forecast, indicate or imply future results, performance or achievements, and are typically identified with words such as “may,” “could,” “should,” “will,” “would,” “believe,” “anticipate,” “estimate,” “expect,” “aim,” “intend,” “plan,” or words or phases of similar meaning. We caution that the forward-looking statements are based largely on our expectations and are subject to a number of known and unknown risks and uncertainties that are subject to change based on factors which are, in many instances, beyond our control, including but not limited to the health of the national and local economies including the impact on the Company and its customers resulting from any adverse developments in real estate markets and the level of, inflation and interest rates; the Company’s ability to maintain and grow its deposit base; loan demand and continued portfolio performance; the impact of adverse developments at other banks, including bank failures, that impact general sentiment regarding the stability and liquidity of banks that could affect our financial performance and our stock price; changes to valuations of the Company’s assets and liabilities including the allowance for credit losses, earning assets, and intangible assets; changes to the availability of liquidity sources including borrowing lines and the ability to pledge or sell certain assets; the Company's ability to attract and retain skilled employees; customers' service expectations; cyber security risks; the Company's ability to successfully deploy new technology; the success of acquisitions and branch expansion; operational risks including the ability to detect and prevent errors and fraud; the effectiveness of the Company’s enterprise risk management framework; litigation costs and outcomes; changes in laws, rules, regulations, or interpretations to which the Company is subject; the effects of severe weather events, pandemics, wildfires and other disasters, other public health crises, acts of war or terrorism, and other external events on our business. These and other important factors are detailed in various securities law filings made periodically by the Company, copies of which are available without charge on the SEC’s website at www.sec.gov and the on the investor relations section of the Company’s website at www.mypcbbank.com. Actual results, performance or achievements could differ materially from those contemplated, expressed, or implied by the forward-looking statements. Any forward-looking statements presented herein are made only as of the date of this presentation, and we do not undertake any obligation to update or revise any forward-looking statements to reflect changes in assumptions, the occurrence of unanticipated events, or otherwise, except as required by law. Non-GAAP Financial Measures This presentation contains non-GAAP financial measures. A non-GAAP financial measure is a numerical measure of historical or future financial performance, financial position or cash flows that excludes amounts or is subject to adjustments that have the effect of excluding amounts that are included in the most directly comparable measure calculated and presented in accordance with GAAP. Reconciliations of non-GAAP measures to the most directly comparable GAAP measures are provided in the Non-GAAP Measures section of this presentation. References to the “Company,” “we,” or “us” refer to PCB Bancorp and references to the “Bank” refer to the Company’s subsidiary, PCB Bank.
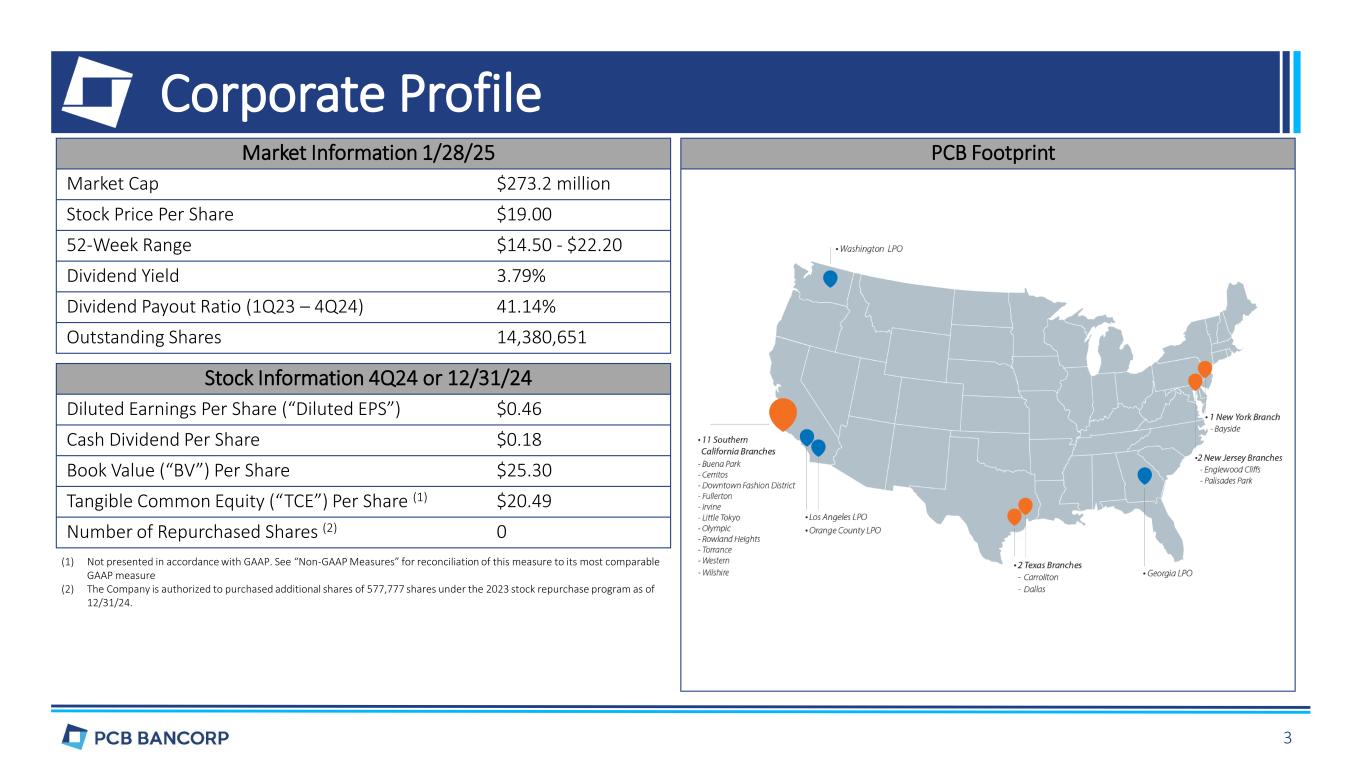
Market Information 1/28/25 Market Cap $273.2 million Stock Price Per Share $19.00 52-Week Range $14.50 - $22.20 Dividend Yield 3.79% Dividend Payout Ratio (1Q23 – 4Q24) 41.14% Outstanding Shares 14,380,651 Stock Information 4Q24 or 12/31/24 Diluted Earnings Per Share (“Diluted EPS”) $0.46 Cash Dividend Per Share $0.18 Book Value (“BV”) Per Share $25.30 Tangible Common Equity (“TCE”) Per Share (1) $20.49 Number of Repurchased Shares (2) 0 (1) Not presented in accordance with GAAP. See “Non-GAAP Measures” for reconciliation of this measure to its most comparable GAAP measure (2) The Company is authorized to purchased additional shares of 577,777 shares under the 2023 stock repurchase program as of 12/31/24. PCB Footprint Corporate Profile 3
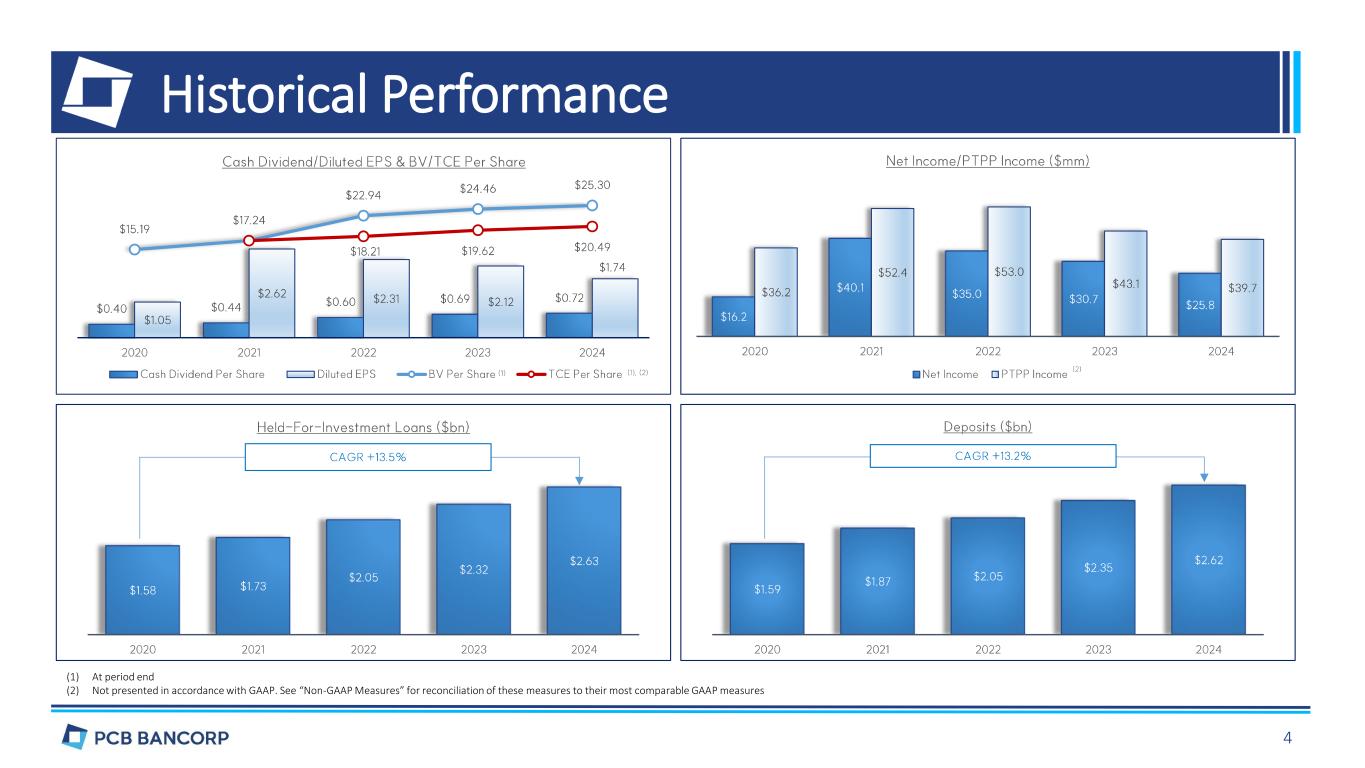
Historical Performance (1) At period end (2) Not presented in accordance with GAAP. See “Non-GAAP Measures” for reconciliation of these measures to their most comparable GAAP measures 4
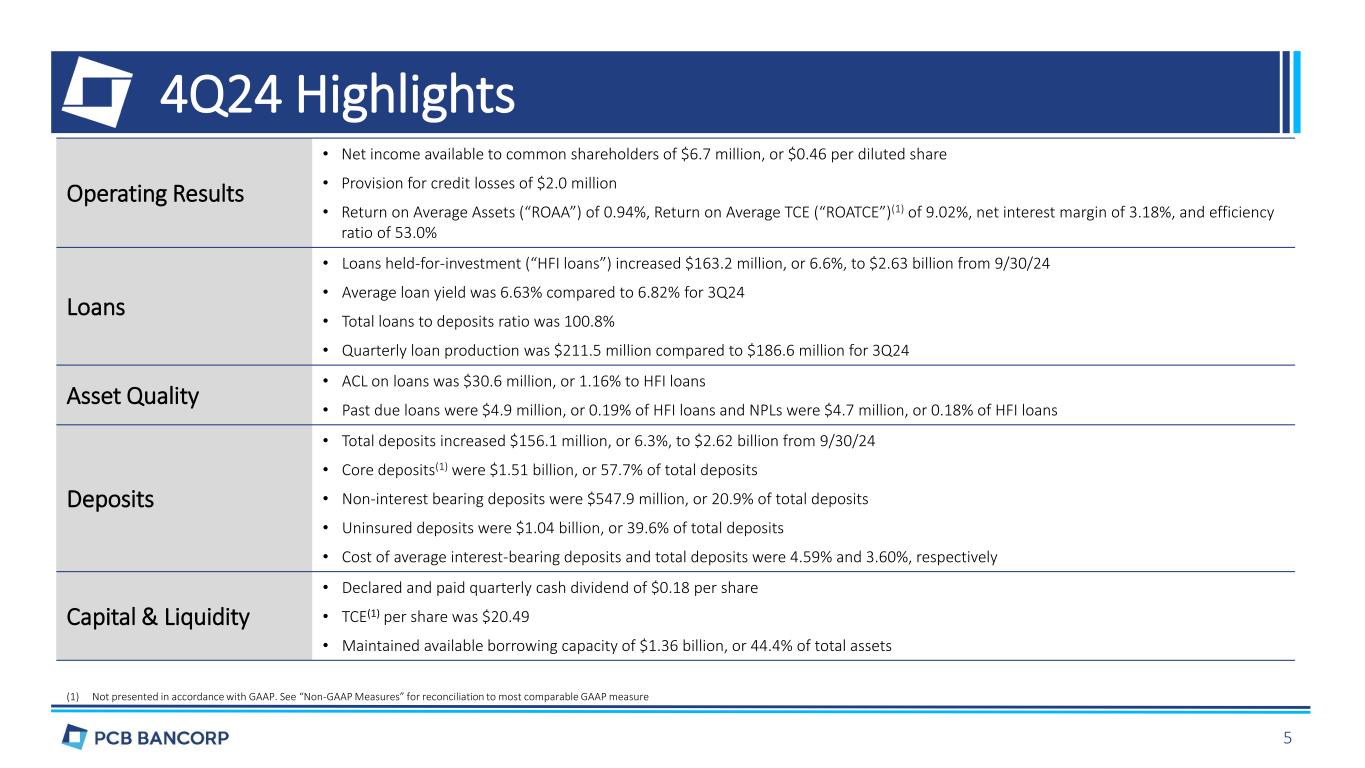
4Q24 Highlights Operating Results • Net income available to common shareholders of $6.7 million, or $0.46 per diluted share • Provision for credit losses of $2.0 million • Return on Average Assets (“ROAA”) of 0.94%, Return on Average TCE (“ROATCE”)(1) of 9.02%, net interest margin of 3.18%, and efficiency ratio of 53.0% Loans • Loans held-for-investment (“HFI loans”) increased $163.2 million, or 6.6%, to $2.63 billion from 9/30/24 • Average loan yield was 6.63% compared to 6.82% for 3Q24 • Total loans to deposits ratio was 100.8% • Quarterly loan production was $211.5 million compared to $186.6 million for 3Q24 Asset Quality • ACL on loans was $30.6 million, or 1.16% to HFI loans • Past due loans were $4.9 million, or 0.19% of HFI loans and NPLs were $4.7 million, or 0.18% of HFI loans Deposits • Total deposits increased $156.1 million, or 6.3%, to $2.62 billion from 9/30/24 • Core deposits(1) were $1.51 billion, or 57.7% of total deposits • Non-interest bearing deposits were $547.9 million, or 20.9% of total deposits • Uninsured deposits were $1.04 billion, or 39.6% of total deposits • Cost of average interest-bearing deposits and total deposits were 4.59% and 3.60%, respectively Capital & Liquidity • Declared and paid quarterly cash dividend of $0.18 per share • TCE(1) per share was $20.49 • Maintained available borrowing capacity of $1.36 billion, or 44.4% of total assets (1) Not presented in accordance with GAAP. See “Non-GAAP Measures” for reconciliation to most comparable GAAP measure 5

Selected Financial As of or For the Three Months Ended Compared to 9/30/24 Compared to 12/31/23 ($ in Thousands, Except Per Share Data) 12/31/24 9/30/24 12/31/23 Amount Percentage Amount Percentage Income Statement Summary: Interest Income $ 46,319 $ 45,998 $ 40,951 $ 321 0.7% $ 5,368 13.1% Interest Expense 23,155 23,279 19,027 (124) -0.5% 4,128 21.7% Net Interest Income 23,164 22,719 21,924 445 2.0% 1,240 5.7% Noninterest Income 3,043 2,620 2,503 423 16.1% 540 21.6% Noninterest Expense 13,894 14,602 14,469 (708) -4.8% (575) -4.0% Provision (Reversal) for Credit Losses 2,002 50 1,698 1,952 3904.0% 304 17.9% Pretax Income 10,311 10,687 8,260 (376) -3.5% 2,051 24.8% Income Tax Expense 3,281 2,873 2,352 408 14.2% 929 39.5% Net Income 7,030 7,814 5,908 (784) -10.0% 1,122 19.0% Preferred Stock Dividends 346 346 0 0 0.0% 346 NM Net Income Available to Common Shareholders 6,684 7,468 5,908 (784) -10.5% 776 13.1% Diluted EPS $ 0.46 $ 0.52 $ 0.41 $ (0.06) -11.5% $ 0.05 12.2% Selected Balance Sheet Items: HFI loans $ 2,629,387 $ 2,466,174 $ 2,323,452 $ 163,213 6.6% $ 305,935 13.2% HFS loans 6,292 5,170 5,155 1,122 21.7% 1,137 22.1% Total Deposits 2,615,791 2,459,682 2,351,612 156,109 6.3% 264,179 11.2% Total Assets 3,063,971 2,889,833 2,789,506 174,138 6.0% 274,465 9.8% Shareholders’ Equity 363,814 362,300 348,872 1,514 0.4% 14,942 4.3% TCE (2) 294,673 293,159 279,731 1,514 0.5% 14,942 5.3% Key Metrics: BV Per Share $ 25.30 $ 25.39 $ 24.46 $ (0.09) -0.4% $ 0.84 3.4% TCE Per Share (1) $ 20.49 $ 20.55 $ 19.62 $ (0.06) -0.3% $ 0.87 4.4% ROAA (2) 0.94% 1.08% 0.89% -0.14% 0.05% Return on Average Equity (“ROAE”) (2) 7.69% 8.70% 6.82% -1.01% 0.87% ROATCE (1), (2) 9.02% 10.31% 8.54% -1.28% 0.49% Net Interest Margin (2) 3.18% 3.25% 3.40% -0.07% -0.22% Efficiency Ratio (3) 53.02% 57.63% 59.23% -4.61% -6.21% (1) Not presented in accordance with GAAP. See “Non-GAAP Measures” for reconciliation of these measures to their most comparable GAAP measures (2) Annualized (3) Calculated by dividing noninterest expense by the sum of net interest income and noninterest income 6

7 Loan Overview (1) Per regulatory definition in the Commercial Real Estate (“CRE”) Concentration Guidance 4Q24 Highlights • HFI loans increased $163.2 million, or 6.6%, to $2.63 billion from 9/30/24 • CRE loans increased $91.6 million (5.5%), C&I loans increased $65.7 million (16.2%) and consumer loans increased $5.8 million (1.5%)
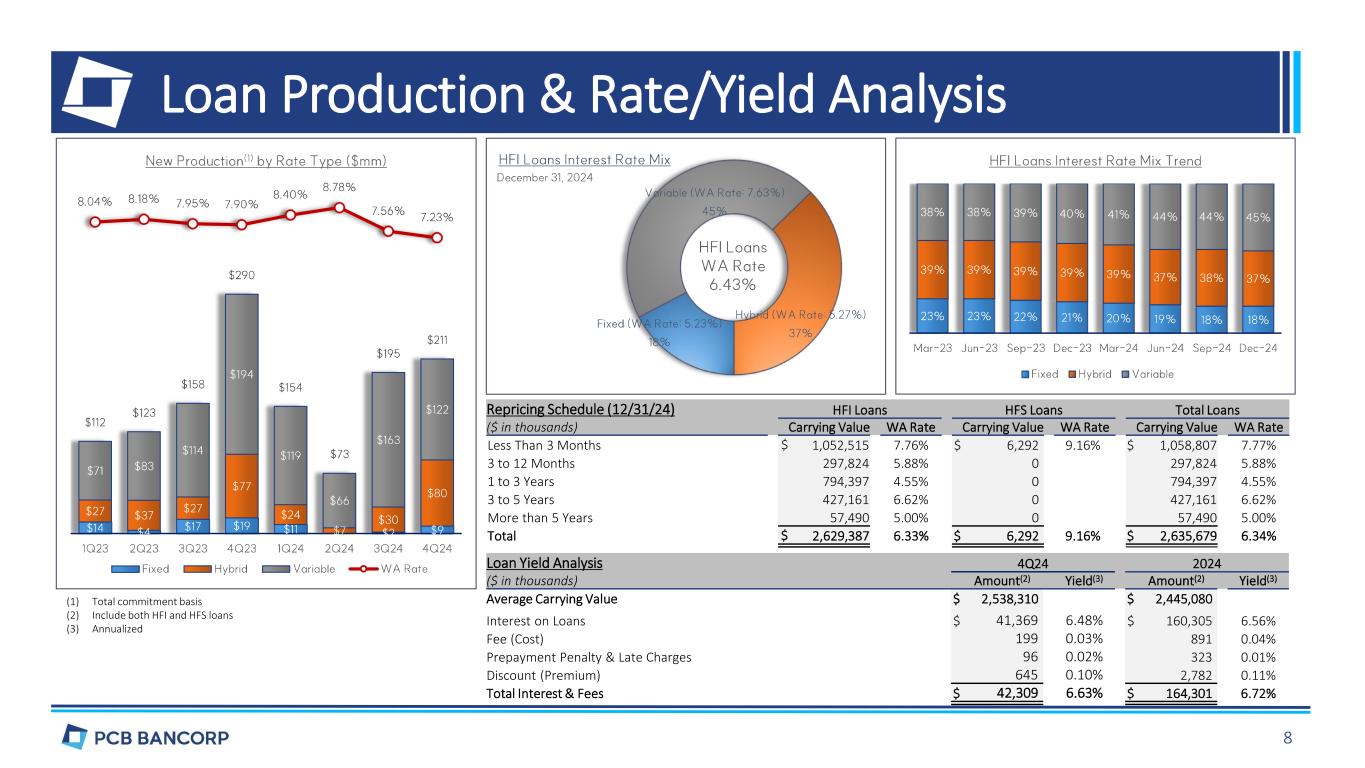
8 Loan Production & Rate/Yield Analysis (1) Total commitment basis (2) Include both HFI and HFS loans (3) Annualized Repricing Schedule (12/31/24) HFI Loans HFS Loans Total Loans ($ in thousands) Carrying Value WA Rate Carrying Value WA Rate Carrying Value WA Rate Less Than 3 Months $ 1,052,515 7.76% $ 6,292 9.16% $ 1,058,807 7.77% 3 to 12 Months 297,824 5.88% 0 297,824 5.88% 1 to 3 Years 794,397 4.55% 0 794,397 4.55% 3 to 5 Years 427,161 6.62% 0 427,161 6.62% More than 5 Years 57,490 5.00% 0 57,490 5.00% Total $ 2,629,387 6.33% $ 6,292 9.16% $ 2,635,679 6.34% Loan Yield Analysis 4Q24 2024 ($ in thousands) Amount(2) Yield(3) Amount(2) Yield(3) Average Carrying Value $ 2,538,310 $ 2,445,080 Interest on Loans $ 41,369 6.48% $ 160,305 6.56% Fee (Cost) 199 0.03% 891 0.04% Prepayment Penalty & Late Charges 96 0.02% 323 0.01% Discount (Premium) 645 0.10% 2,782 0.11% Total Interest & Fees $ 42,309 6.63% $ 164,301 6.72%

Carrying Value % to Total Count WA LTV(1) WA Rate Maturing ($ in thousands) <= 1 Year 2-3 Years 3-5 Years > 5 Years Retail (More Than 50%) $ 383,184 22.0% 312 47.9% 6.08% $ 79,037 $ 79,082 $ 115,281 $ 109,784 Industrial 276,010 15.8% 162 49.5% 5.74% 33,492 61,433 89,211 91,874 Mixed Use 181,157 10.3% 140 44.2% 5.86% 38,717 50,391 52,304 39,745 Apartments 176,093 10.0% 60 54.6% 5.72% 44,660 40,894 72,696 17,843 Motel & Hotel 144,628 8.3% 106 46.3% 7.23% 9,326 21,134 37,504 76,664 Office 121,192 6.9% 57 52.7% 6.20% 40,113 23,258 33,283 24,538 Gas Station 107,955 6.2% 118 53.7% 6.79% 1,149 20,890 36,849 49,067 Medical 56,377 3.2% 30 40.7% 7.24% 10,063 31,996 8,868 5,450 Auto (Sales, Repair, & etc.) 36,838 2.1% 30 53.1% 5.54% 10,210 38 22,033 4,557 Golf Course 35,606 2.0% 8 48.3% 5.05% 0 22,764 7,612 5,230 Commercial Condominium 33,994 1.9% 39 51.1% 5.89% 6,063 5,823 13,484 8,624 Car Wash 33,731 1.9% 27 48.3% 5.96% 10,730 7,480 8,315 7,206 Spa, Sauna, & Oher Self-Care 30,540 1.7% 7 48.5% 6.24% 13,238 0 8,352 8,950 Nursing Facility 26,670 1.5% 8 51.4% 6.82% 0 3,065 16,110 7,495 Wholesale 24,449 1.4% 15 40.4% 5.69% 4,217 1,906 17,331 995 Construction 21,854 1.2% 5 55.3% 8.74% 21,854 0 0 0 Others 62,274 3.6% 75 48.2% 6.31% 9,149 12,050 20,852 20,223 Total $ 1,752,552 100.0% 1,199 49.0% 6.16% $ 332,018 $ 382,204 $ 560,085 $ 478,245 Loan Concentration (1) Collateral value at origination Commercial Real Estate Loans by Property Type (12/31/24) ($ in thousands) Carrying Value WA LTV(1) WA FICO Residential Mortgage $ 392,456 59.2% 759 Residential Mortgage Loans (12/31/24) 9
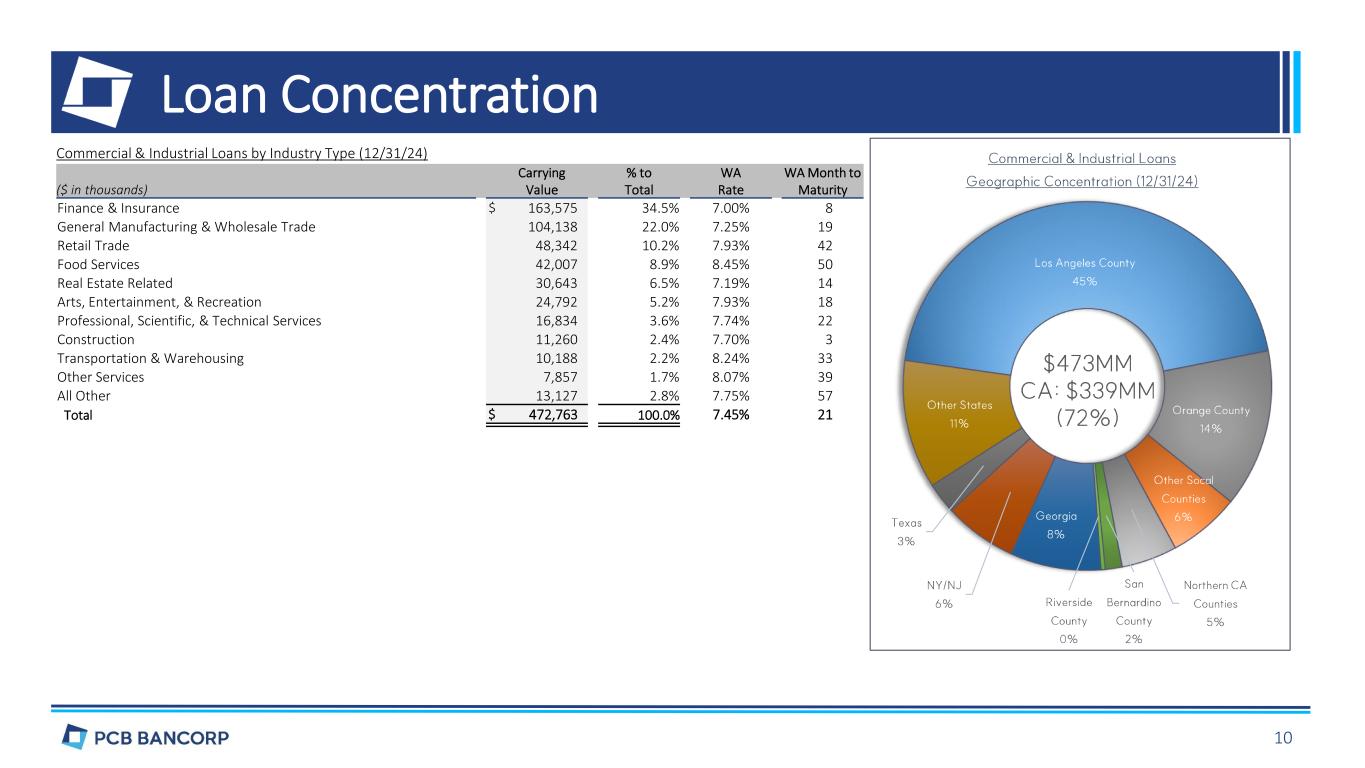
Loan Concentration Carrying Value % to Total WA Rate WA Month to Maturity($ in thousands) Finance & Insurance $ 163,575 34.5% 7.00% 8 General Manufacturing & Wholesale Trade 104,138 22.0% 7.25% 19 Retail Trade 48,342 10.2% 7.93% 42 Food Services 42,007 8.9% 8.45% 50 Real Estate Related 30,643 6.5% 7.19% 14 Arts, Entertainment, & Recreation 24,792 5.2% 7.93% 18 Professional, Scientific, & Technical Services 16,834 3.6% 7.74% 22 Construction 11,260 2.4% 7.70% 3 Transportation & Warehousing 10,188 2.2% 8.24% 33 Other Services 7,857 1.7% 8.07% 39 All Other 13,127 2.8% 7.75% 57 Total $ 472,763 100.0% 7.45% 21 Commercial & Industrial Loans by Industry Type (12/31/24) 10
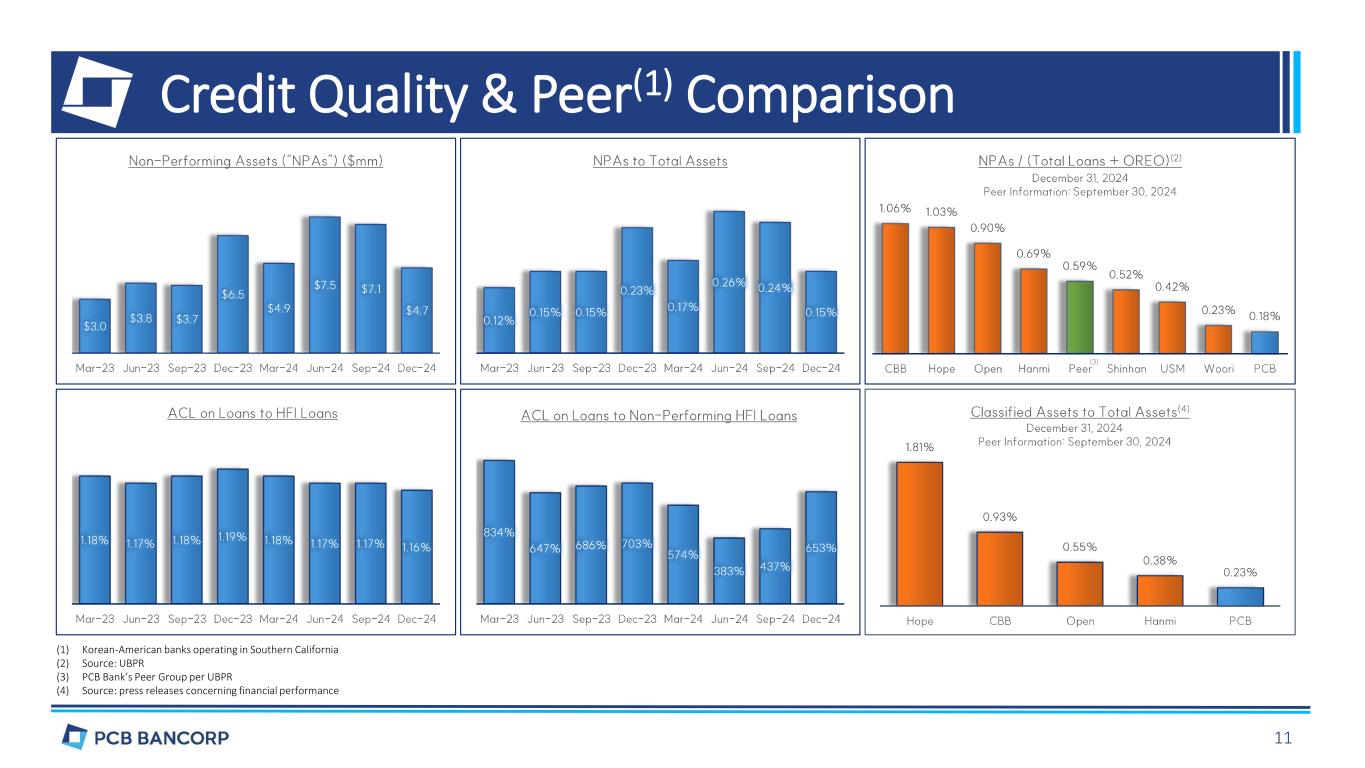
Credit Quality & Peer(1) Comparison (1) Korean-American banks operating in Southern California (2) Source: UBPR (3) PCB Bank’s Peer Group per UBPR (4) Source: press releases concerning financial performance 11
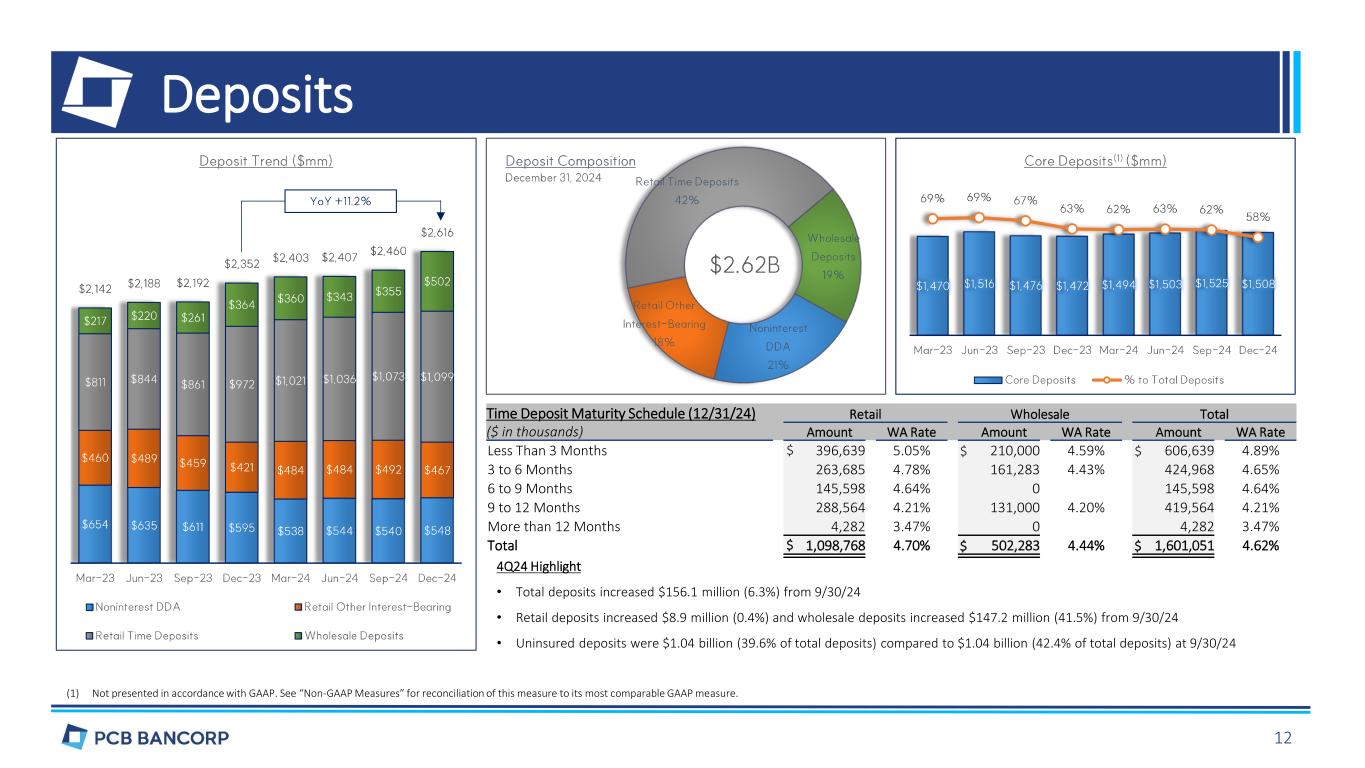
Deposits (1) Not presented in accordance with GAAP. See “Non-GAAP Measures” for reconciliation of this measure to its most comparable GAAP measure. Time Deposit Maturity Schedule (12/31/24) Retail Wholesale Total ($ in thousands) Amount WA Rate Amount WA Rate Amount WA Rate Less Than 3 Months $ 396,639 5.05% $ 210,000 4.59% $ 606,639 4.89% 3 to 6 Months 263,685 4.78% 161,283 4.43% 424,968 4.65% 6 to 9 Months 145,598 4.64% 0 145,598 4.64% 9 to 12 Months 288,564 4.21% 131,000 4.20% 419,564 4.21% More than 12 Months 4,282 3.47% 0 4,282 3.47% Total $ 1,098,768 4.70% $ 502,283 4.44% $ 1,601,051 4.62% 4Q24 Highlight • Total deposits increased $156.1 million (6.3%) from 9/30/24 • Retail deposits increased $8.9 million (0.4%) and wholesale deposits increased $147.2 million (41.5%) from 9/30/24 • Uninsured deposits were $1.04 billion (39.6% of total deposits) compared to $1.04 billion (42.4% of total deposits) at 9/30/24 12
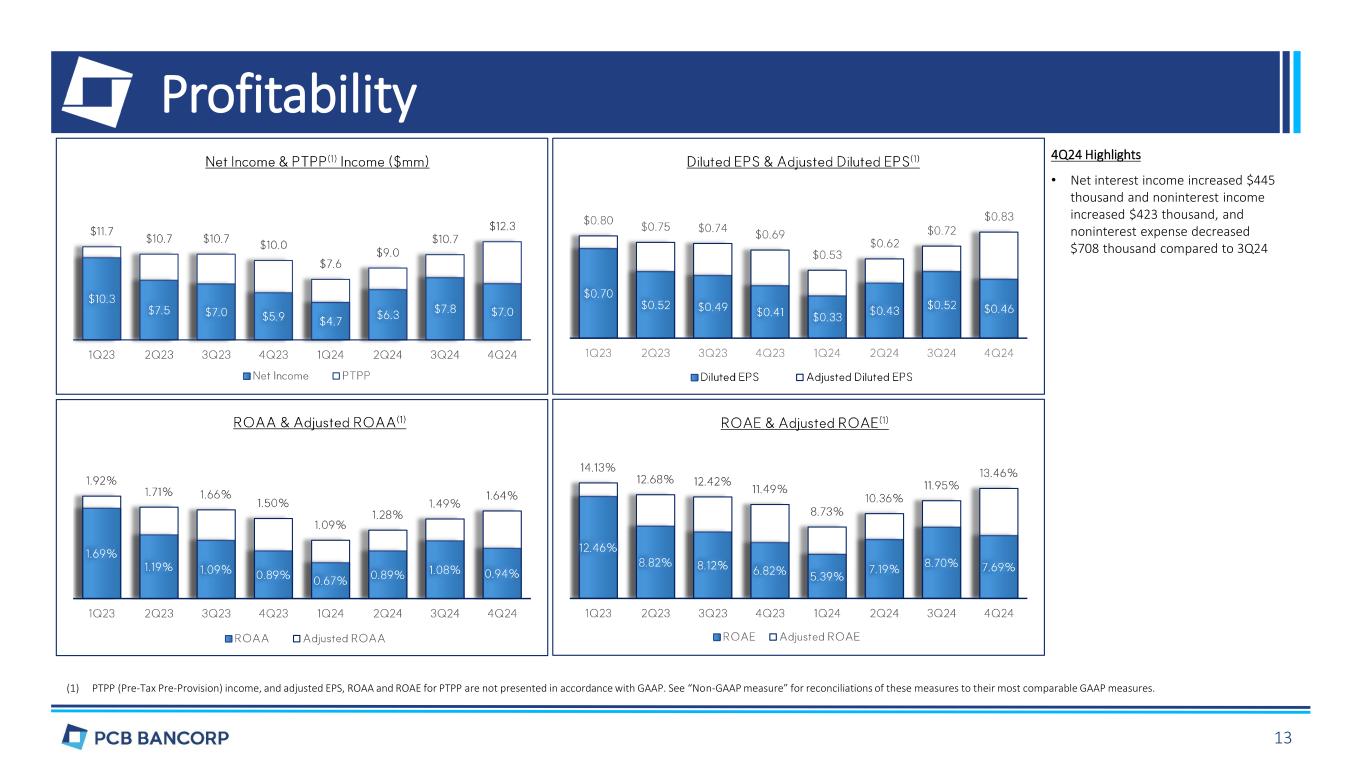
Profitability (1) PTPP (Pre-Tax Pre-Provision) income, and adjusted EPS, ROAA and ROAE for PTPP are not presented in accordance with GAAP. See “Non-GAAP measure” for reconciliations of these measures to their most comparable GAAP measures. 4Q24 Highlights • Net interest income increased $445 thousand and noninterest income increased $423 thousand, and noninterest expense decreased $708 thousand compared to 3Q24 13

Noninterest Income & Expense (1) Annualized (2) Calculated by dividing noninterest expense by the sum of net interest income and noninterest income. Peer average data from UBPR (3) Full-time equivalent
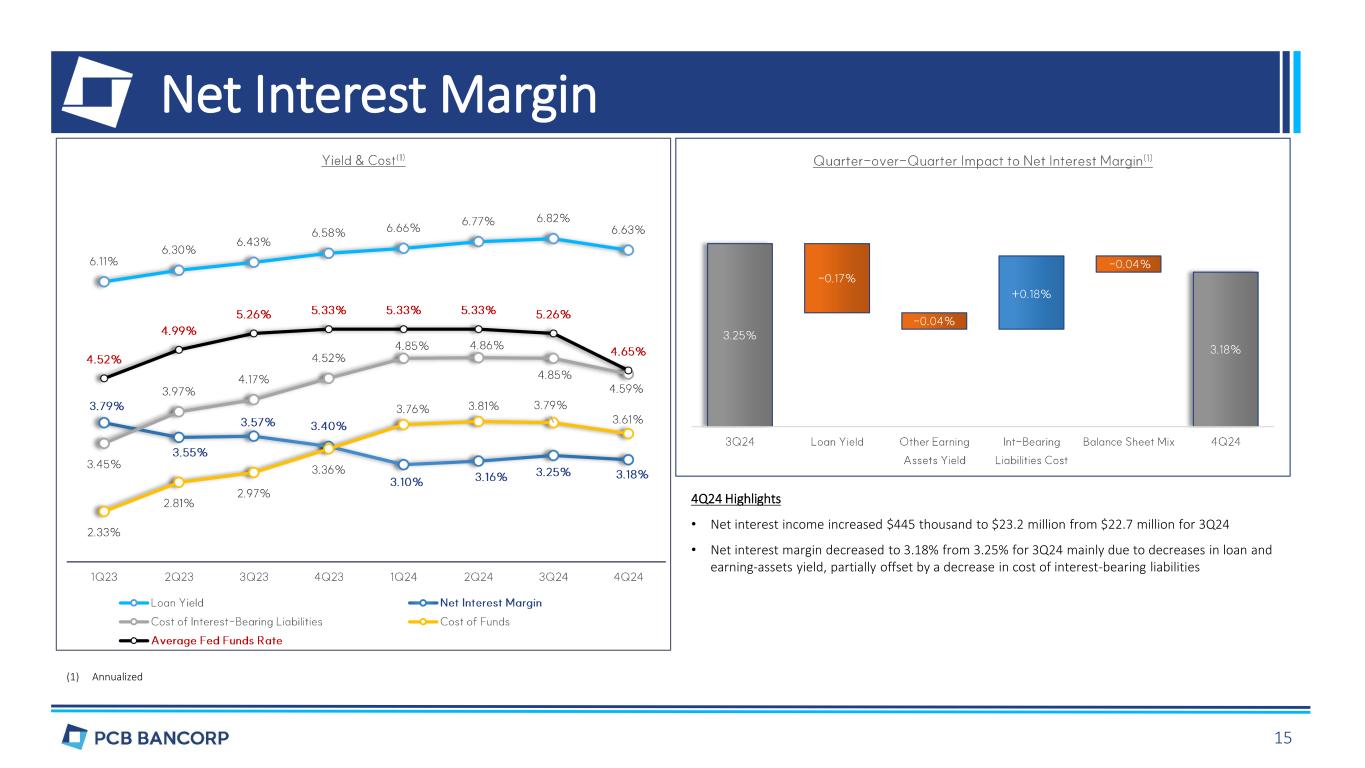
Net Interest Margin (1) Annualized 4Q24 Highlights • Net interest income increased $445 thousand to $23.2 million from $22.7 million for 3Q24 • Net interest margin decreased to 3.18% from 3.25% for 3Q24 mainly due to decreases in loan and earning-assets yield, partially offset by a decrease in cost of interest-bearing liabilities 15

Capital (1) Not presented in accordance with GAAP. See “Non-GAAP Measures” for reconciliation of this measure to its most comparable GAAP measure. 16
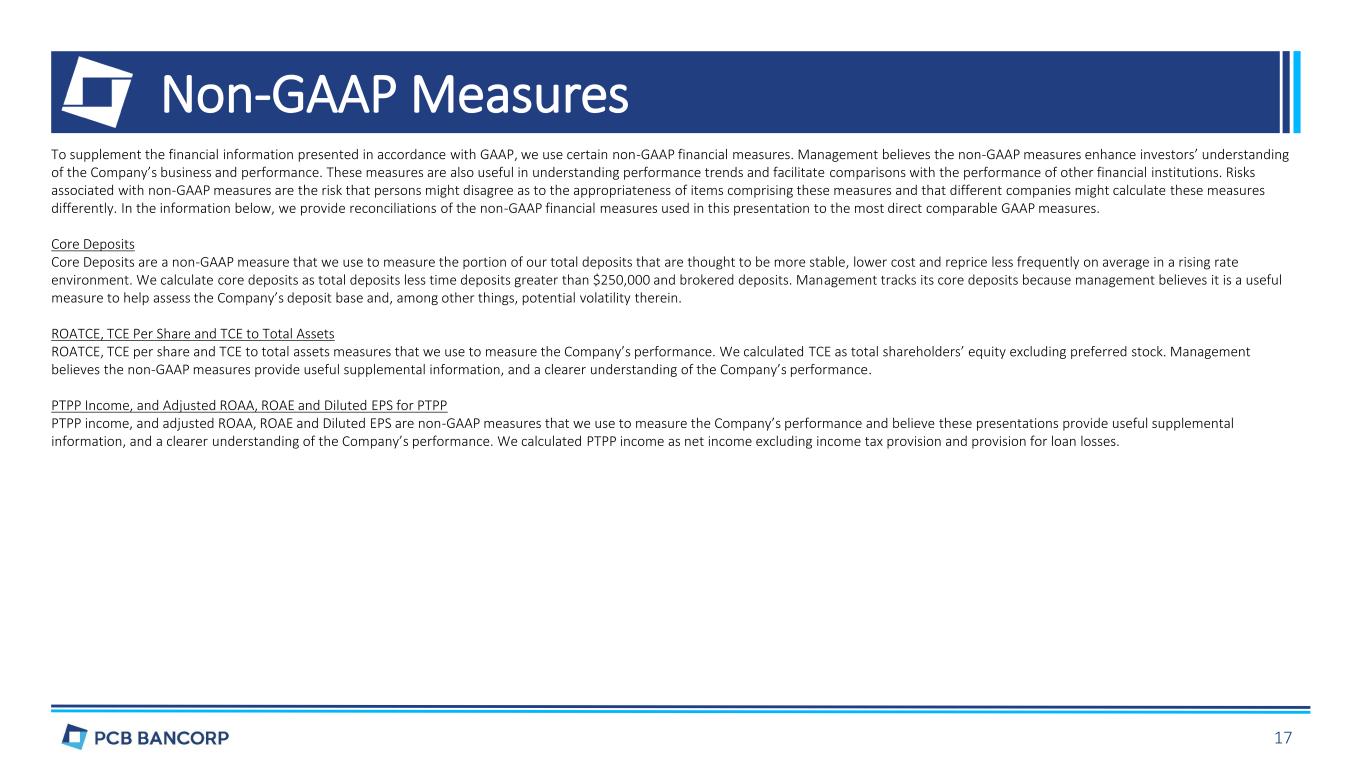
Non-GAAP Measures To supplement the financial information presented in accordance with GAAP, we use certain non-GAAP financial measures. Management believes the non-GAAP measures enhance investors’ understanding of the Company’s business and performance. These measures are also useful in understanding performance trends and facilitate comparisons with the performance of other financial institutions. Risks associated with non-GAAP measures are the risk that persons might disagree as to the appropriateness of items comprising these measures and that different companies might calculate these measures differently. In the information below, we provide reconciliations of the non-GAAP financial measures used in this presentation to the most direct comparable GAAP measures. Core Deposits Core Deposits are a non-GAAP measure that we use to measure the portion of our total deposits that are thought to be more stable, lower cost and reprice less frequently on average in a rising rate environment. We calculate core deposits as total deposits less time deposits greater than $250,000 and brokered deposits. Management tracks its core deposits because management believes it is a useful measure to help assess the Company’s deposit base and, among other things, potential volatility therein. ROATCE, TCE Per Share and TCE to Total Assets ROATCE, TCE per share and TCE to total assets measures that we use to measure the Company’s performance. We calculated TCE as total shareholders’ equity excluding preferred stock. Management believes the non-GAAP measures provide useful supplemental information, and a clearer understanding of the Company’s performance. PTPP Income, and Adjusted ROAA, ROAE and Diluted EPS for PTPP PTPP income, and adjusted ROAA, ROAE and Diluted EPS are non-GAAP measures that we use to measure the Company’s performance and believe these presentations provide useful supplemental information, and a clearer understanding of the Company’s performance. We calculated PTPP income as net income excluding income tax provision and provision for loan losses. 17
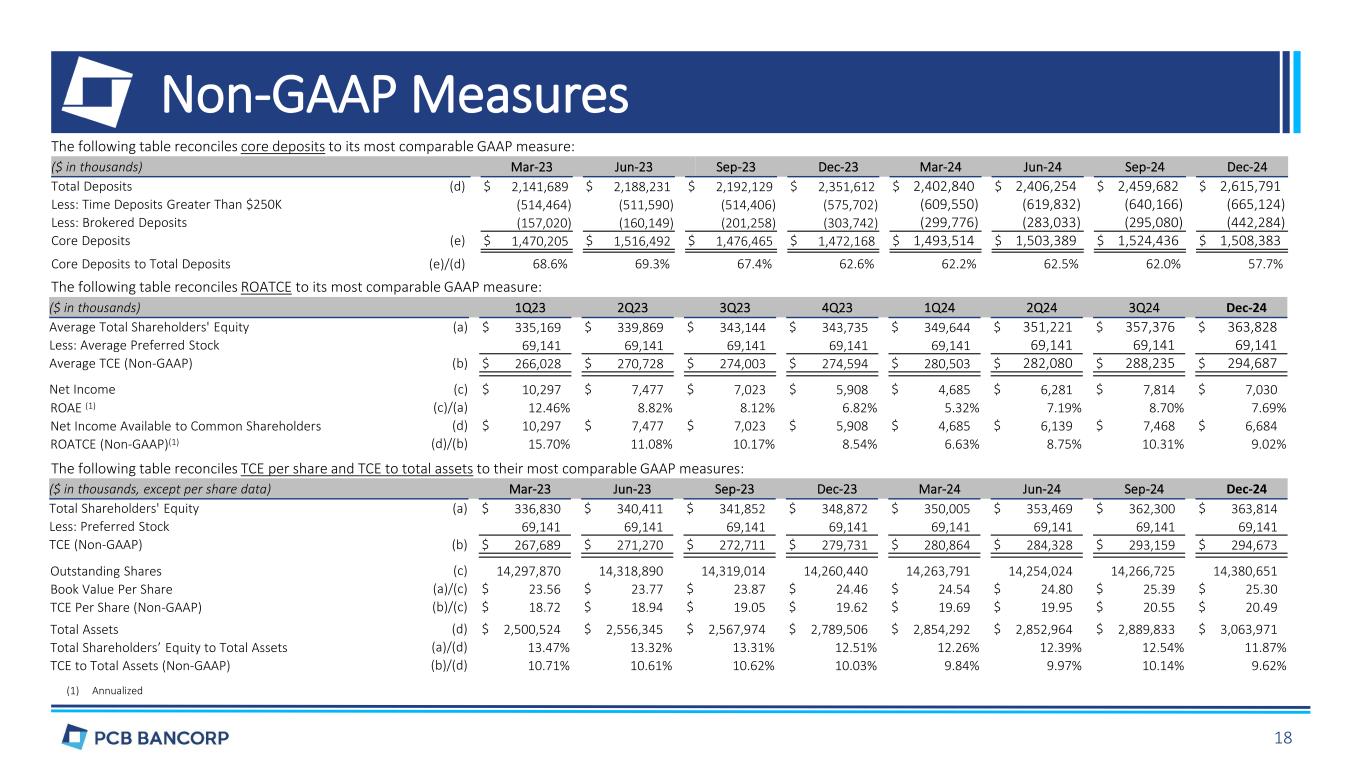
Non-GAAP Measures The following table reconciles core deposits to its most comparable GAAP measure: ($ in thousands) Mar-23 Jun-23 Sep-23 Dec-23 Mar-24 Jun-24 Sep-24 Dec-24 Total Deposits (d) $ 2,141,689 $ 2,188,231 $ 2,192,129 $ 2,351,612 $ 2,402,840 $ 2,406,254 $ 2,459,682 $ 2,615,791 Less: Time Deposits Greater Than $250K (514,464) (511,590) (514,406) (575,702) (609,550) (619,832) (640,166) (665,124) Less: Brokered Deposits (157,020) (160,149) (201,258) (303,742) (299,776) (283,033) (295,080) (442,284) Core Deposits (e) $ 1,470,205 $ 1,516,492 $ 1,476,465 $ 1,472,168 $ 1,493,514 $ 1,503,389 $ 1,524,436 $ 1,508,383 Core Deposits to Total Deposits (e)/(d) 68.6% 69.3% 67.4% 62.6% 62.2% 62.5% 62.0% 57.7% The following table reconciles ROATCE to its most comparable GAAP measure: ($ in thousands) 1Q23 2Q23 3Q23 4Q23 1Q24 2Q24 3Q24 Dec-24 Average Total Shareholders' Equity (a) $ 335,169 $ 339,869 $ 343,144 $ 343,735 $ 349,644 $ 351,221 $ 357,376 $ 363,828 Less: Average Preferred Stock 69,141 69,141 69,141 69,141 69,141 69,141 69,141 69,141 Average TCE (Non-GAAP) (b) $ 266,028 $ 270,728 $ 274,003 $ 274,594 $ 280,503 $ 282,080 $ 288,235 $ 294,687 Net Income (c) $ 10,297 $ 7,477 $ 7,023 $ 5,908 $ 4,685 $ 6,281 $ 7,814 $ 7,030 ROAE (1) (c)/(a) 12.46% 8.82% 8.12% 6.82% 5.32% 7.19% 8.70% 7.69% Net Income Available to Common Shareholders (d) $ 10,297 $ 7,477 $ 7,023 $ 5,908 $ 4,685 $ 6,139 $ 7,468 $ 6,684 ROATCE (Non-GAAP)(1) (d)/(b) 15.70% 11.08% 10.17% 8.54% 6.63% 8.75% 10.31% 9.02% The following table reconciles TCE per share and TCE to total assets to their most comparable GAAP measures: ($ in thousands, except per share data) Mar-23 Jun-23 Sep-23 Dec-23 Mar-24 Jun-24 Sep-24 Dec-24 Total Shareholders' Equity (a) $ 336,830 $ 340,411 $ 341,852 $ 348,872 $ 350,005 $ 353,469 $ 362,300 $ 363,814 Less: Preferred Stock 69,141 69,141 69,141 69,141 69,141 69,141 69,141 69,141 TCE (Non-GAAP) (b) $ 267,689 $ 271,270 $ 272,711 $ 279,731 $ 280,864 $ 284,328 $ 293,159 $ 294,673 Outstanding Shares (c) 14,297,870 14,318,890 14,319,014 14,260,440 14,263,791 14,254,024 14,266,725 14,380,651 Book Value Per Share (a)/(c) $ 23.56 $ 23.77 $ 23.87 $ 24.46 $ 24.54 $ 24.80 $ 25.39 $ 25.30 TCE Per Share (Non-GAAP) (b)/(c) $ 18.72 $ 18.94 $ 19.05 $ 19.62 $ 19.69 $ 19.95 $ 20.55 $ 20.49 Total Assets (d) $ 2,500,524 $ 2,556,345 $ 2,567,974 $ 2,789,506 $ 2,854,292 $ 2,852,964 $ 2,889,833 $ 3,063,971 Total Shareholders’ Equity to Total Assets (a)/(d) 13.47% 13.32% 13.31% 12.51% 12.26% 12.39% 12.54% 11.87% TCE to Total Assets (Non-GAAP) (b)/(d) 10.71% 10.61% 10.62% 10.03% 9.84% 9.97% 10.14% 9.62% (1) Annualized 18
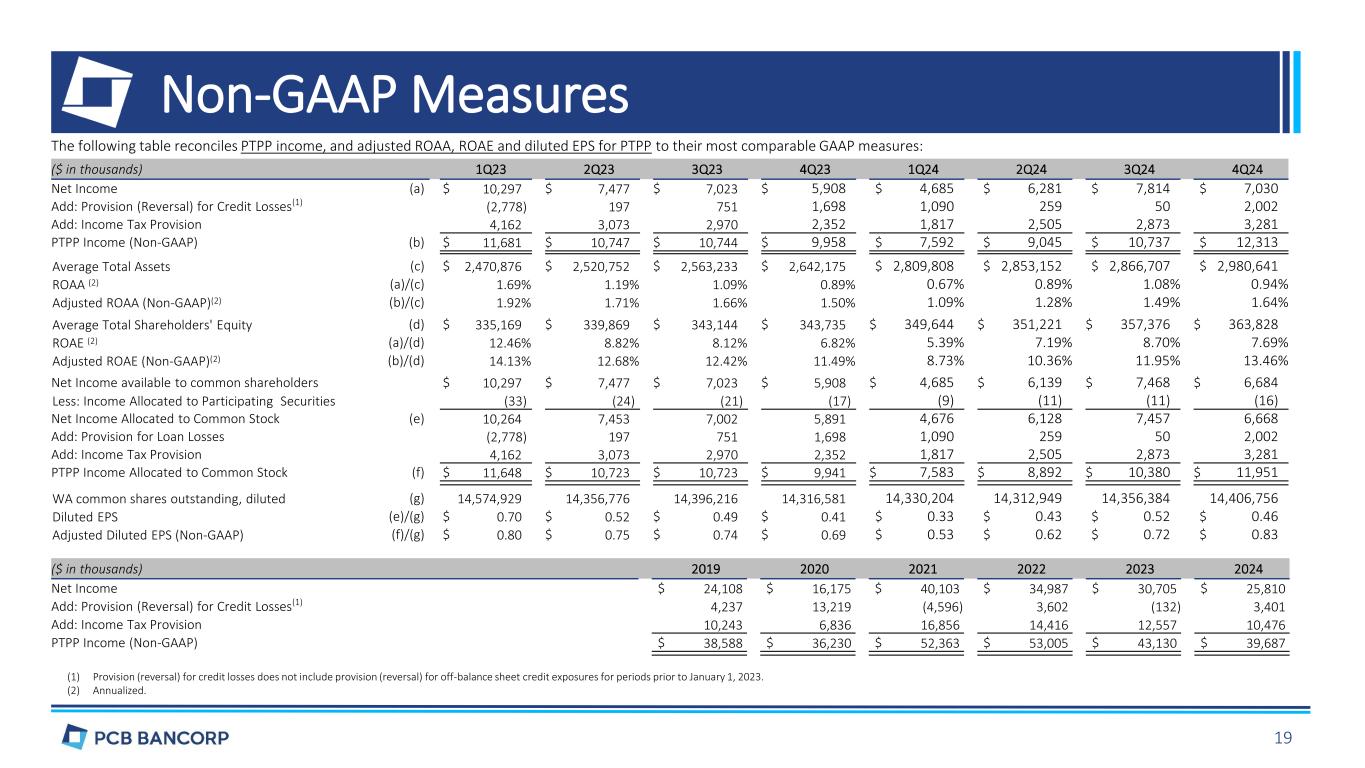
Non-GAAP Measures (1) Provision (reversal) for credit losses does not include provision (reversal) for off-balance sheet credit exposures for periods prior to January 1, 2023. (2) Annualized. The following table reconciles PTPP income, and adjusted ROAA, ROAE and diluted EPS for PTPP to their most comparable GAAP measures: ($ in thousands) 1Q23 2Q23 3Q23 4Q23 1Q24 2Q24 3Q24 4Q24 Net Income (a) $ 10,297 $ 7,477 $ 7,023 $ 5,908 $ 4,685 $ 6,281 $ 7,814 $ 7,030 Add: Provision (Reversal) for Credit Losses(1) (2,778) 197 751 1,698 1,090 259 50 2,002 Add: Income Tax Provision 4,162 3,073 2,970 2,352 1,817 2,505 2,873 3,281 PTPP Income (Non-GAAP) (b) $ 11,681 $ 10,747 $ 10,744 $ 9,958 $ 7,592 $ 9,045 $ 10,737 $ 12,313 Average Total Assets (c) $ 2,470,876 $ 2,520,752 $ 2,563,233 $ 2,642,175 $ 2,809,808 $ 2,853,152 $ 2,866,707 $ 2,980,641 ROAA (2) (a)/(c) 1.69% 1.19% 1.09% 0.89% 0.67% 0.89% 1.08% 0.94% Adjusted ROAA (Non-GAAP)(2) (b)/(c) 1.92% 1.71% 1.66% 1.50% 1.09% 1.28% 1.49% 1.64% Average Total Shareholders' Equity (d) $ 335,169 $ 339,869 $ 343,144 $ 343,735 $ 349,644 $ 351,221 $ 357,376 $ 363,828 ROAE (2) (a)/(d) 12.46% 8.82% 8.12% 6.82% 5.39% 7.19% 8.70% 7.69% Adjusted ROAE (Non-GAAP)(2) (b)/(d) 14.13% 12.68% 12.42% 11.49% 8.73% 10.36% 11.95% 13.46% Net Income available to common shareholders $ 10,297 $ 7,477 $ 7,023 $ 5,908 $ 4,685 $ 6,139 $ 7,468 $ 6,684 Less: Income Allocated to Participating Securities (33) (24) (21) (17) (9) (11) (11) (16) Net Income Allocated to Common Stock (e) 10,264 7,453 7,002 5,891 4,676 6,128 7,457 6,668 Add: Provision for Loan Losses (2,778) 197 751 1,698 1,090 259 50 2,002 Add: Income Tax Provision 4,162 3,073 2,970 2,352 1,817 2,505 2,873 3,281 PTPP Income Allocated to Common Stock (f) $ 11,648 $ 10,723 $ 10,723 $ 9,941 $ 7,583 $ 8,892 $ 10,380 $ 11,951 WA common shares outstanding, diluted (g) 14,574,929 14,356,776 14,396,216 14,316,581 14,330,204 14,312,949 14,356,384 14,406,756 Diluted EPS (e)/(g) $ 0.70 $ 0.52 $ 0.49 $ 0.41 $ 0.33 $ 0.43 $ 0.52 $ 0.46 Adjusted Diluted EPS (Non-GAAP) (f)/(g) $ 0.80 $ 0.75 $ 0.74 $ 0.69 $ 0.53 $ 0.62 $ 0.72 $ 0.83 ($ in thousands) 2019 2020 2021 2022 2023 2024 Net Income $ 24,108 $ 16,175 $ 40,103 $ 34,987 $ 30,705 $ 25,810 Add: Provision (Reversal) for Credit Losses(1) 4,237 13,219 (4,596) 3,602 (132) 3,401 Add: Income Tax Provision 10,243 6,836 16,856 14,416 12,557 10,476 PTPP Income (Non-GAAP) $ 38,588 $ 36,230 $ 52,363 $ 53,005 $ 43,130 $ 39,687 19


