Exhibit 99.2
Q2 2021 QUARTERLY SUPPLEMENTAL INFORMATION Broadstone Net Lease, Inc. (NYSE: BNL) is a Real Estate Investment Trust (REIT) that acquires, owns, and manages single-tenant commercial real estate properties that are net leased on a long-term basis to a diversified group of tenants. www.broadstone.com
Table of Contents
| | |
Section | Page | 

|
About the Data | 3 |
Company Overview | 4 |
Quarterly Financial Summary | 5 |
Balance Sheet | 6 |
Income Statement Summary | 7 |
Funds From Operations (FFO) and Adjusted Funds From Operations (AFFO) | 8 |
EBITDA, EBITDAre, and Other Non-GAAP Operating Measures | 9 |
Lease Revenues Detail | 10 |
Capital Structure | 11 |
Equity Rollforward | 12 |
Debt Outstanding | 13 |
Net Debt Metrics | 14 |
Covenants | 14 |
Debt Maturities and Interest Rate Exposure | 15 |
Acquisitions | 16 |
Dispositions | 16 |
Portfolio at a Glance: Key Metrics | 17 |
Diversification: Tenants and Brands | 18-19 |
Diversification: Property Type | 20-21 |
Key Statistics by Property Type | 22 |
Diversification: Tenant Industry | 23 |
Diversification: Geography | 24 |
Lease Expirations | 25 |
Portfolio Occupancy | 26 |
Definitions and Explanations | 27-28 |
| |
| |
| |
| |
| |
| |
BROADSTONE NET LEASE, INC. | www.broadstone.com | © 2021 Broadstone Net Lease, LLC. All rights reserved. 2
About the Data
This data and other information described herein are as of and for the three months ended June 30, 2021 unless otherwise indicated. Future performance may not be consistent with past performance and is subject to change and inherent risks and uncertainties. This information should be read in conjunction with Broadstone Net Lease, Inc.'s Quarterly Report on Form 10-Q for the quarter ended June 30, 2021, including the financial statements and the management's discussion and analysis of financial condition and results of operations sections.
Stock Split
All share and per share data as of June 30, 2020, contained herein, have been adjusted to reflect the four-for-one stock split that was effected on September 18, 2020.
Forward Looking Statements
Information set forth herein contains forward-looking statements, which reflect our current views regarding our business, financial performance, growth prospects and strategies, market opportunities, and market trends. Forward-looking statements include all statements that are not historical facts. In some cases, you can identify these forward-looking statements by the use of words such as “outlook,” “believes,” “expects,” “potential,” “continues,” “may,” “will,” “should,” “could,” “seeks,” “approximately,” “projects,” “predicts,” “intends,” “plans,” “estimates,” “anticipates,” or the negative version of these words or other comparable words. All of the forward-looking statements herein are subject to various risks and uncertainties. Assumptions relating to the foregoing involve judgments with respect to, among other things, future economic, competitive and market conditions, and future business decisions, all of which are difficult or impossible to predict accurately and many of which are beyond our control. Although we believe that the expectations reflected in such forward-looking statements are based on reasonable assumptions, our actual results, performance, and achievements could differ materially from those expressed in or by the forward-looking statements and may be affected by a variety of risks and other factors. Accordingly, there are or will be important factors that could cause actual outcomes or results to differ materially from such forward-looking statements. These factors include, but are not limited to, risks and uncertainties related to the COVID-19 pandemic and its related impacts on us and our tenants, general economic conditions, local real estate conditions, tenant financial health, and property acquisitions and the timing of these acquisitions. These and other risks, assumptions, and uncertainties are described in our filings with the SEC, which are available on the SEC’s website at www.sec.gov.
You are cautioned not to place undue reliance on any forward-looking statements included herein. All forward-looking statements are made as of the date of this document and the risk that actual results, performance, and achievements will differ materially from the expectations expressed or referenced herein will increase with the passage of time. We undertake no obligation to publicly update or review any forward-looking statement, whether as a result of new information, future developments, or otherwise, except as required by law.
BROADSTONE NET LEASE, INC. | www.broadstone.com | © 2021 Broadstone Net Lease, LLC. All rights reserved. 3
Company Overview
Broadstone Net Lease, Inc. (NYSE:BNL) (the “Company,” “BNL,” “us,” “our” and “we”) is an internally-managed REIT, formed as a Maryland corporation in 2007 that acquires, owns, and manages primarily single-tenant commercial real estate properties that are net leased on a long-term basis to a diversified group of tenants. Since our inception, we have selectively invested in real estate across the industrial, healthcare, restaurant, retail, and office property types. We target properties with credit-worthy tenants in industries characterized by positive business drivers and trends, where the properties are an integral part of the tenants’ businesses and there are opportunities to secure long-term net leases. Through long-term net leases, our tenants are able to retain operational control of their strategically important locations, while allocating their debt and equity capital to fund their core business operations rather than real estate ownership.
| | |
Executive Team Christopher J. Czarnecki Chief Executive Officer, President, and Director Ryan M. Albano Executive Vice President and Chief Financial Officer John D. Moragne Executive Vice President and Chief Operating Officer John D. Callan, Jr Senior Vice President and General Counsel Michael B. Caruso Senior Vice President, Corporate Finance & Investor Relations Timothy D. Dieffenbacher Senior Vice President, Chief Accounting Officer and Treasurer Kristen Duckles Senior Vice President, Chief Administrative Officer Kevin M. Fennell Senior Vice President, Capital Markets & Credit Risk Laurier James Lessard, Jr. Senior Vice President, Asset Management Roderick A. Pickney Senior Vice President, Acquisitions Molly Kelly Wiegel Senior Vice President, Human Resources Andrea T. Wright Senior Vice President, Property Management | | Board of Directors Laurie A. Hawkes Chairman of the Board Christopher J. Czarnecki Chief Executive Officer and President Denise Brooks-Williams Michael A. Coke David M. Jacobstein Agha S. Khan Shekar Narasimhan Geoffrey H. Rosenberger James H. Waters |
| |
Company Contact Information Michael Caruso
SVP, Corporate Finance & Investor Relations michael.caruso@broadstone.com 585-402-7842 Transfer Agent Computershare Trust Company, N.A. 250 Royall Street Canton, Massachusetts 02021 800-736-3001 | |
BROADSTONE NET LEASE, INC. | www.broadstone.com | © 2021 Broadstone Net Lease, LLC. All rights reserved. 4
Quarterly Financial Summary
(unaudited, dollars in thousands, except per share data)
| | | | | | | | | | | | | | | | | | | | |
| | Q2 2021 | | | Q1 2021 | | | Q4 2020 | | | Q3 2020 | | | Q2 2020 | |
Financial Summary | | | | | | | | | | | | | | | |
Investment in rental property | | $ | 3,954,597 | | | $ | 3,794,850 | | | $ | 3,734,121 | | | $ | 3,666,961 | | | $ | 3,690,679 | |
Less accumulated depreciation | | | (390,236 | ) | | | (369,683 | ) | | | (349,977 | ) | | | (332,057 | ) | | | (312,934 | ) |
Investment in rental property, net | | | 3,564,361 | | | | 3,425,167 | | | | 3,384,144 | | | | 3,334,904 | | | | 3,377,745 | |
Cash and cash equivalents | | | 78,987 | | | | 10,205 | | | | 100,486 | | | | 101,787 | | | | 9,241 | |
Restricted cash | | | 8,021 | | | | 8,145 | | | | 10,242 | | | | 7,200 | | | | 601 | |
Total assets | | | 4,423,611 | | | | 4,206,045 | | | | 4,258,483 | | | | 4,204,469 | | | | 4,144,055 | |
Mortgage and notes payable, net | | | 105,748 | | | | 106,559 | | | | 107,382 | | | | 108,752 | | | | 109,512 | |
Unsecured term notes, net and
revolver | | | 1,383,631 | | | | 1,398,283 | | | | 1,433,796 | | | | 1,433,495 | | | | 1,921,392 | |
Total liabilities | | | 1,700,103 | | | | 1,713,348 | | | | 1,779,402 | | | | 1,782,762 | | | | 2,267,408 | |
Total mezzanine equity | | | — | | | | — | | | | — | | | | — | | | | 178,535 | |
Total Broadstone Net Lease, Inc.
stockholders' equity | | | 2,554,653 | | | | 2,312,532 | | | | 2,299,105 | | | | 2,191,794 | | | | 1,591,633 | |
Total equity (book value) | | | 2,723,508 | | | | 2,492,697 | | | | 2,479,081 | | | | 2,421,707 | | | | 1,698,112 | |
Revenues | | | 84,759 | | | | 82,698 | | | | 82,291 | | | | 80,744 | | | | 80,371 | |
General and administrative -
other | | | 7,704 | | | | 8,864 | | | | 8,039 | | | | 6,418 | | | | 5,700 | |
Stock based compensation | | | 951 | | | | 1,769 | | | | 1,193 | | | | 796 | | | | — | |
General and administrative | | | 8,655 | | | | 10,633 | | | | 9,232 | | | | 7,214 | | | | 5,700 | |
Total operating expenses | | | 44,452 | | | | 47,963 | | | | 46,078 | | | | 57,496 | | | | 50,345 | |
Interest expense | | | 15,430 | | | | 16,108 | | | | 17,123 | | | | 18,511 | | | | 19,513 | |
Net income | | | 22,820 | | | | 23,960 | | | | 17,619 | | | | 9,711 | | | | 17,098 | |
Net earnings per common share,
diluted | | $ | 0.14 | | | $ | 0.15 | | | $ | 0.11 | | | $ | 0.08 | | | $ | 0.14 | |
FFO | | | 50,184 | | | | 51,929 | | | | 44,198 | | | | 54,726 | | | | 56,485 | |
FFO per share, diluted | | $ | 0.32 | | | $ | 0.33 | | | $ | 0.28 | | | $ | 0.44 | | | $ | 0.47 | |
AFFO | | | 52,024 | | | | 49,410 | | | | 46,894 | | | | 47,077 | | | | 46,056 | |
AFFO per share, diluted | | $ | 0.33 | | | $ | 0.31 | | | $ | 0.30 | | | $ | 0.38 | | | $ | 0.38 | |
Net cash provided by operating
activities | | | 47,235 | | | | 51,780 | | | | 46,064 | | | | 53,506 | | | | 39,139 | |
Net cash (used in) provided by
investing activities | | | (175,051 | ) | | | (67,661 | ) | | | (76,443 | ) | | | 5,469 | | | | 6,264 | |
Net cash (used in) provided by
financing activities | | | 196,474 | | | | (76,497 | ) | | | 32,120 | | | | 40,170 | | | | (132,273 | ) |
Distributions declared | | | 43,484 | | | | 39,653 | | | | 39,299 | | | | 20,477 | | | | 13,099 | |
Distributions declared per diluted
share | | $ | 0.255 | | | $ | 0.250 | | | $ | 0.250 | | | $ | 0.135 | | | $ | 0.110 | |
| | | | | | | | | | | | | | | |
Portfolio Metrics | | | | | | | | | | | | | | | |
Properties | | | 684 | | | | 661 | | | | 641 | | | | 628 | | | | 633 | |
Rentable square feet | | 30.2M | | | 28.4M | | | 28.2M | | | 27.3M | | | 27.4M | |
Occupancy | | | 99.7 | % | | | 99.7 | % | | | 99.2 | % | | | 99.8 | % | | | 99.6 | % |
Weighted average remaining lease
term (years) | | | 10.4 | | | | 10.6 | | | | 10.7 | | | | 10.8 | | | | 11.0 | |
BROADSTONE NET LEASE, INC. | www.broadstone.com | © 2021 Broadstone Net Lease, LLC. All rights reserved. 5
Balance Sheet
(unaudited, in thousands)
| | | | | | | | | | | | | | | | | | | | |
| | June 30,
2021 | | | March 31,
2021 | | | December 31,
2020 | | | September 30,
2020 | | | June 30,
2020 | |
Assets | | | | | | | | | | | | | | | |
Accounted for using the operating
method, net of accumulated
depreciation | | $ | 3,534,884 | | | $ | 3,395,609 | | | $ | 3,354,511 | | | $ | 3,304,002 | | | $ | 3,346,792 | |
Accounted for using the direct financing
method | | | 28,911 | | | | 28,991 | | | | 29,066 | | | | 30,902 | | | | 30,953 | |
Accounted for using the sales type
method | | | 566 | | | | 567 | | | | 567 | | | | — | | | | — | |
Investment in rental property, net | | | 3,564,361 | | | | 3,425,167 | | | | 3,384,144 | | | | 3,334,904 | | | | 3,377,745 | |
Cash and cash equivalents | | | 78,987 | | | | 10,205 | | | | 100,486 | | | | 101,787 | | | | 9,241 | |
Accrued rental income | | | 109,278 | | | | 105,674 | | | | 102,117 | | | | 97,517 | | | | 90,545 | |
Tenant and other receivables, net | | | 618 | | | | 1,022 | | | | 1,604 | | | | 3,957 | | | | 5,045 | |
Prepaid expenses and other assets | | | 18,846 | | | | 18,862 | | | | 22,277 | | | | 19,522 | | | | 9,819 | |
Interest rate swap, assets | | | — | | | | 239 | | | | — | | | | — | | | | — | |
Goodwill | | | 339,769 | | | | 339,769 | | | | 339,769 | | | | 339,769 | | | | 339,769 | |
Intangible lease assets, net | | | 296,134 | | | | 288,592 | | | | 290,913 | | | | 288,971 | | | | 298,741 | |
Debt issuance costs – unsecured
revolving credit facility, net | | | 5,250 | | | | 5,842 | | | | 6,435 | | | | 7,027 | | | | 1,782 | |
Leasing fees, net | | | 10,368 | | | | 10,673 | | | | 10,738 | | | | 11,015 | | | | 11,368 | |
Total assets | | $ | 4,423,611 | | | $ | 4,206,045 | | | $ | 4,258,483 | | | $ | 4,204,469 | | | $ | 4,144,055 | |
Liabilities and equity | | | | | | | | | | | | | | | |
Unsecured revolving credit facility | | $ | — | | | $ | 15,000 | | | $ | — | | | $ | — | | | $ | 248,300 | |
Mortgages and notes payable, net | | | 105,748 | | | | 106,559 | | | | 107,382 | | | | 108,752 | | | | 109,512 | |
Unsecured term notes, net | | | 1,383,631 | | | | 1,383,283 | | | | 1,433,796 | | | | 1,433,495 | | | | 1,673,092 | |
Interest rate swap, liabilities | | | 46,335 | | | | 43,662 | | | | 72,103 | | | | 81,326 | | | | 85,678 | |
Earnout liability | | | 10,063 | | | | 6,385 | | | | 7,509 | | | | 13,177 | | | | 37,975 | |
Accounts payable and other liabilities | | | 75,463 | | | | 71,072 | | | | 74,936 | | | | 55,339 | | | | 25,550 | |
Accrued interest payable | | | 3,885 | | | | 9,896 | | | | 4,023 | | | | 9,453 | | | | 4,144 | |
Intangible lease liabilities, net | | | 74,978 | | | | 77,491 | | | | 79,653 | | | | 81,220 | | | | 83,157 | |
Total liabilities | | | 1,700,103 | | | | 1,713,348 | | | | 1,779,402 | | | | 1,782,762 | | | | 2,267,408 | |
Mezzanine equity | | | | | | | | | | | | | | | |
Common stock | | | — | | | | — | | | | — | | | | — | | | | 66,376 | |
Non-controlling interests | | | — | | | | — | | | | — | | | | — | | | | 112,159 | |
Total mezzanine equity | | | — | | | | — | | | | — | | | | — | | | | 178,535 | |
Equity | | | | | | | | | | | | | | | |
Broadstone Net Lease, Inc. stockholders'
equity: | | | | | | | | | | | | | | | |
Preferred stock, $0.001 par value | | | — | | | | — | | | | — | | | | — | | | | — | |
Common stock, $0.00025 par value | | | 40 | | | | 36 | | | | 27 | | | | 27 | | | | 26 | |
Class A Common Stock, $0.00025 par
value | | | — | | | | — | | | | 9 | | | | 8 | | | | — | |
Additional paid-in capital | | | 2,890,131 | | | | 2,625,320 | | | | 2,624,997 | | | | 2,506,008 | | | | 1,899,751 | |
Cumulative distributions in excess of
retained earnings | | | (293,622 | ) | | | (274,140 | ) | | | (259,673 | ) | | | (239,520 | ) | | | (229,531 | ) |
Accumulated other comprehensive
income | | | (41,896 | ) | | | (38,684 | ) | | | (66,255 | ) | | | (74,729 | ) | | | (78,613 | ) |
Total Broadstone Net Lease, Inc.
stockholders’ equity | | | 2,554,653 | | | | 2,312,532 | | | | 2,299,105 | | | | 2,191,794 | | | | 1,591,633 | |
Non-controlling interests | | | 168,855 | | | | 180,165 | | | | 179,976 | | | | 229,913 | | | | 106,479 | |
Total equity | | | 2,723,508 | | | | 2,492,697 | | | | 2,479,081 | | | | 2,421,707 | | | | 1,698,112 | |
Total liabilities, mezzanine
and equity | | $ | 4,423,611 | | | $ | 4,206,045 | | | $ | 4,258,483 | | | $ | 4,204,469 | | | $ | 4,144,055 | |
BROADSTONE NET LEASE, INC. | www.broadstone.com | © 2021 Broadstone Net Lease, LLC. All rights reserved. 6
Income Statement Summary
(unaudited, in thousands, except per share data)
| | | | | | | | | | | | | | | | | | | | |
| | Three Months Ended | |
| | June 30,
2021 | | | March 31,
2021 | | | December 31,
2020 | | | September 30,
2020 | | | June 30,
2020 | |
Revenues | | | | | | | | | | | | | | | |
Lease revenues, net | | $ | 84,759 | | | $ | 82,698 | | | $ | 82,291 | | | $ | 80,744 | | | $ | 80,371 | |
Operating expenses | | | | | | | | | | | | | | | |
Depreciation and amortization | | | 31,225 | | | | 30,713 | | | | 30,182 | | | | 31,363 | | | | 39,921 | |
Property and operating
expense | | | 4,572 | | | | 4,605 | | | | 4,986 | | | | 4,187 | | | | 4,190 | |
General and administrative | | | 8,655 | | | | 10,633 | | | | 9,232 | | | | 7,214 | | | | 5,700 | |
Provision for impairment of
investment in rental
properties | | | — | | | | 2,012 | | | | 1,678 | | | | 14,732 | | | | 534 | |
Total operating expenses | | | 44,452 | | | | 47,963 | | | | 46,078 | | | | 57,496 | | | | 50,345 | |
Other income (expenses) | | | | | | | | | | | | | | | |
Interest income | | | 6 | | | | 5 | | | | 4 | | | | — | | | | 11 | |
Interest expense | | | (15,430 | ) | | | (16,108 | ) | | | (17,123 | ) | | | (18,511 | ) | | | (19,513 | ) |
Cost of debt extinguishment | | | — | | | | (126 | ) | | | (3 | ) | | | (392 | ) | | | — | |
Gain on sale of real estate | | | 3,838 | | | | 4,733 | | | | 5,260 | | | | 1,060 | | | | 1,046 | |
Income taxes | | | (301 | ) | | | (413 | ) | | | 141 | | | | (129 | ) | | | (402 | ) |
Internalization expenses | | | — | | | | — | | | | (182 | ) | | | (1,929 | ) | | | (389 | ) |
Change in fair value of earnout
liability | | | (5,604 | ) | | | 1,124 | | | | (6,706 | ) | | | 6,362 | | | | 6,321 | |
Other income (expenses) | | | 4 | | | | 10 | | | | 15 | | | | 2 | | | | (2 | ) |
Net income | | | 22,820 | | | | 23,960 | | | | 17,619 | | | | 9,711 | | | | 17,098 | |
Net income attributable to
non-controlling interests | | | (1,606 | ) | | | (1,737 | ) | | | (1,357 | ) | | | (961 | ) | | | (1,745 | ) |
Net income attributable to
Broadstone Net Lease, Inc. | | $ | 21,214 | | | $ | 22,223 | | | $ | 16,262 | | | $ | 8,750 | | | $ | 15,353 | |
| | | | | | | | | | | | | | | |
Weighted average number of common shares outstanding | |
Basic1 | | | 146,119 | | | | 145,338 | | | | 143,916 | | | | 111,155 | | | | 107,422 | |
Diluted1 | | | 157,430 | | | | 156,724 | | | | 155,956 | | | | 123,381 | | | | 119,648 | |
Net earnings per common share2 | | | | | | | |
Basic and diluted | | $ | 0.14 | | | $ | 0.15 | | | $ | 0.11 | | | $ | 0.08 | | | $ | 0.14 | |
1 Excludes 387, 334, 341 and 216 weighted average shares of unvested restricted common stock for the three months ended June 30, 2021, March 31, 2021, December 31, 2020 and September 30, 2020, respectively.
2 Excludes $97, $104, $85 and $46 from the numerator for the three months ended June 30, 2021, March 31, 2021, December 31, 2020 and September 30, 2020, respectively, related to dividends declared on shares of unvested restricted common stock.
BROADSTONE NET LEASE, INC. | www.broadstone.com | © 2021 Broadstone Net Lease, LLC. All rights reserved. 7
Funds From Operations (FFO) and Adjusted Funds From Operations (AFFO)
(unaudited, in thousands, except per share data)
| | | | | | | | | | | | | | | | | | | | |
| | Three Months Ended | |
| | June 30,
2021 | | | March 31,
2021 | | | December 31,
2020 | | | September 30,
2020 | | | June 30,
2020 | |
Net income | | $ | 22,820 | | | $ | 23,960 | | | $ | 17,619 | | | $ | 9,711 | | | $ | 17,098 | |
Real property depreciation and
amortization | | | 31,202 | | | | 30,690 | | | | 30,161 | | | | 31,343 | | | | 39,899 | |
Gain on sale of real estate | | | (3,838 | ) | | | (4,733 | ) | | | (5,260 | ) | | | (1,060 | ) | | | (1,046 | ) |
Provision for impairment of investment
in rental properties | | | — | | | | 2,012 | | | | 1,678 | | | | 14,732 | | | | 534 | |
FFO | | $ | 50,184 | | | $ | 51,929 | | | $ | 44,198 | | | $ | 54,726 | | | $ | 56,485 | |
Capital improvements / reserves | | | — | | | | — | | | | — | | | | 1,662 | | | | — | |
Straight-line rent adjustment | | | (4,979 | ) | | | (4,632 | ) | | | (5,125 | ) | | | (6,943 | ) | | | (6,151 | ) |
Adjustment to provision for credit losses | | | — | | | | (1 | ) | | | (6 | ) | | | (15 | ) | | | (110 | ) |
Cost of debt extinguishment | | | — | | | | 126 | | | | 3 | | | | 392 | | | | — | |
Amortization of debt issuance costs | | | 956 | | | | 914 | | | | 917 | | | | 819 | | | | 821 | |
Amortization of net mortgage premiums | | | (37 | ) | | | (35 | ) | | | (36 | ) | | | (34 | ) | | | (37 | ) |
Gain on interest rate swaps and other
non-cash interest expense | | | (42 | ) | | | (41 | ) | | | (41 | ) | | | (42 | ) | | | (41 | ) |
Amortization of lease intangibles | | | (641 | ) | | | (728 | ) | | | (1,150 | ) | | | 151 | | | | 1,019 | |
Internalization expenses | | | — | | | | — | | | | 182 | | | | 1,929 | | | | 389 | |
Stock-based compensation | | | 951 | | | | 1,769 | | | | 1,193 | | | | 796 | | | | — | |
Severance | | | 32 | | | | 1,243 | | | | 68 | | | | — | | | | — | |
Change in fair value of earnout liability | | | 5,604 | | | | (1,124 | ) | | | 6,706 | | | | (6,362 | ) | | | (6,321 | ) |
Other (income) expenses | | | (4 | ) | | | (10 | ) | | | (15 | ) | | | (2 | ) | | | 2 | |
AFFO | | $ | 52,024 | | | $ | 49,410 | | | $ | 46,894 | | | $ | 47,077 | | | $ | 46,056 | |
| | | | | | | | | | | | | | | |
Diluted weighted average shares
outstanding1 | | | 157,430 | | | | 156,724 | | | | 155,956 | | | | 123,381 | | | | 119,648 | |
Net earnings per diluted share2 | | $ | 0.14 | | | $ | 0.15 | | | $ | 0.11 | | | $ | 0.08 | | | $ | 0.14 | |
FFO per diluted share2 | | | 0.32 | | | | 0.33 | | | | 0.28 | | | | 0.44 | | | | 0.47 | |
AFFO per diluted share2 | | | 0.33 | | | | 0.31 | | | | 0.30 | | | | 0.38 | | | | 0.38 | |
1 Excludes 387, 334, 341 and 216 weighted average shares of unvested restricted common stock for the three months ended June 30, 2021, March 31, 2021, December 31, 2020 and September 30, 2020, respectively.
2 Excludes $97, $104, $85 and $46 from the numerator for the three months ended June 30, 2021, March 31, 2021, December 31, 2020 and September 30, 2020, respectively, related to dividends declared on shares of unvested restricted common stock.
BROADSTONE NET LEASE, INC. | www.broadstone.com | © 2021 Broadstone Net Lease, LLC. All rights reserved. 8
EBITDA, EBITDAre, and Other-Non GAAP Operating Measures
(unaudited, in thousands)
| | | | | | | | | | | | | | | | | | | | |
| | Three Months Ended | |
| | June 30,
2021 | | | March 31,
2021 | | | December 31,
2020 | | | September 30,
2020 | | | June 30,
2020 | |
Net income | | $ | 22,820 | | | $ | 23,960 | | | $ | 17,619 | | | $ | 9,711 | | | $ | 17,098 | |
Depreciation and amortization | | | 31,225 | | | | 30,713 | | | | 30,182 | | | | 31,363 | | | | 39,921 | |
Interest expense | | | 15,430 | | | | 16,108 | | | | 17,123 | | | | 18,511 | | | | 19,513 | |
Income taxes | | | 301 | | | | 413 | | | | (141 | ) | | | 129 | | | | 402 | |
EBITDA | | $ | 69,776 | | | $ | 71,194 | | | $ | 64,783 | | | $ | 59,714 | | | $ | 76,934 | |
Provision for impairment of investment in
rental properties | | | — | | | | 2,012 | | | | 1,678 | | | | 14,732 | | | | 534 | |
Gain on sale of real estate | | | (3,838 | ) | | | (4,733 | ) | | | (5,260 | ) | | | (1,060 | ) | | | (1,046 | ) |
EBITDAre | | $ | 65,938 | | | $ | 68,473 | | | $ | 61,201 | | | $ | 73,386 | | | $ | 76,422 | |
Adjustment for current quarter acquisition
activity 1 | | | 2,761 | | | | 1,365 | | | | 1,703 | | | | — | | | | — | |
Adjustment for current quarter disposition
activity 2 | | | (353 | ) | | | (278 | ) | | | (318 | ) | | | (78 | ) | | | (52 | ) |
Adjustment to exclude non-recurring and other
expenses (income) 3 | | | — | | | | 2,100 | | | | 182 | | | | 1,929 | | | | 389 | |
Adjustment to exclude change in fair value
of earnout liability | | | 5,604 | | | | (1,124 | ) | | | 6,706 | | | | (6,362 | ) | | | (6,321 | ) |
Adjustment to exclude write-off of accrued
rental income | | | — | | | | 442 | | | | 242 | | | | — | | | | — | |
Adjustment to exclude cost of debt
extinguishments | | | — | | | | 126 | | | | — | | | | 392 | | | | — | |
Adjustment to exclude lease termination
fees | | | — | | | | — | | | | — | | | | — | | | | (276 | ) |
Adjusted EBITDAre | | $ | 73,950 | | | $ | 71,104 | | | $ | 69,716 | | | $ | 69,267 | | | $ | 70,162 | |
General and administrative | | | 8,650 | | | | 10,632 | | | | 9,219 | | | | 7,214 | | | | 5,700 | |
Adjusted Net Operating Income ("NOI") | | $ | 82,600 | | | $ | 81,736 | | | $ | 78,935 | | | $ | 76,481 | | | $ | 75,862 | |
Straight-line rental revenue, net | | | (5,245 | ) | | | (4,762 | ) | | | (5,339 | ) | | | (6,947 | ) | | | (6,151 | ) |
Other amortization and non-cash charges | | | (642 | ) | | | (737 | ) | | | (1,170 | ) | | | 1,810 | | | | 911 | |
Adjusted Cash NOI | | $ | 76,713 | | | $ | 76,237 | | | $ | 72,426 | | | $ | 71,344 | | | $ | 70,622 | |
Annualized EBITDAre | | $ | 263,761 | | | $ | 273,888 | | | $ | 244,805 | | | $ | 293,544 | | | $ | 305,688 | |
Annualized Adjusted EBITDAre | | | 295,808 | | | | 284,414 | | | | 278,867 | | | | 277,068 | | | | 280,648 | |
Annualized Adjusted NOI | | | 330,410 | | | | 326,944 | | | | 315,743 | | | | 305,924 | | | | 303,448 | |
Annualized Adjusted Cash NOI | | | 306,863 | | | | 304,948 | | | | 289,704 | | | | 285,376 | | | | 282,488 | |
1 Reflects an adjustment to give effect to all acquisition during the quarter as if they had been acquired as of the beginning of the quarter.
2 Reflects an adjustment to give effect to all dispositions during the quarter as if they had been sold as of the beginning of the quarter.
3 Amounts include $1.2 million of severance and $0.9 million of accelerated stock-based compensation associated with the departure of executive officers during the three months ended March 31, 2021, and expenses directly associated with the Internalization in 2020.
BROADSTONE NET LEASE, INC. | www.broadstone.com | © 2021 Broadstone Net Lease, LLC. All rights reserved. 9
Lease Revenues Detail
(unaudited, in thousands)
| | | | | | | | | | | | | | | | | | | | |
| | Three Months Ended | |
| | June 30,
2021 | | | March 31,
2021 | | | December 31,
2020 | | | September 30,
2020 | | | June 30,
2020 | |
Contractual rental amounts billed for
operating leases | | $ | 75,011 | | | $ | 73,245 | | | $ | 72,558 | | | $ | 69,270 | | | $ | 67,342 | |
Adjustment to recognize contractual
operating lease billings on a straight-
line basis | | | 4,724 | | | | 4,367 | | | | 4,256 | | | | 6,768 | | | | 8,276 | |
Variable rental amounts earned | | | 114 | | | | 91 | | | | 455 | | | | 234 | | | | 51 | |
Earned income from direct financing
leases | | | 728 | | | | 730 | | | | 756 | | | | 757 | | | | 855 | |
Earned income from sales-type
leases | | | 15 | | | | 14 | | | | 5 | | | | — | | | | — | |
Operating expenses billed to tenants | | | 4,196 | | | | 4,388 | | | | 4,389 | | | | 3,389 | | | | 4,335 | |
Other income from real estate
transactions | | | 28 | | | | 5 | | | | (16 | ) | | | 64 | | | | 702 | |
Adjustment to revenue recognized for
uncollectible rental amounts billed | | | (57 | ) | | | (142 | ) | | | (112 | ) | | | 262 | | | | (1,190 | ) |
Total Lease revenues, net | | $ | 84,759 | | | $ | 82,698 | | | $ | 82,291 | | | $ | 80,744 | | | $ | 80,371 | |
BROADSTONE NET LEASE, INC. | www.broadstone.com | © 2021 Broadstone Net Lease, LLC. All rights reserved. 10
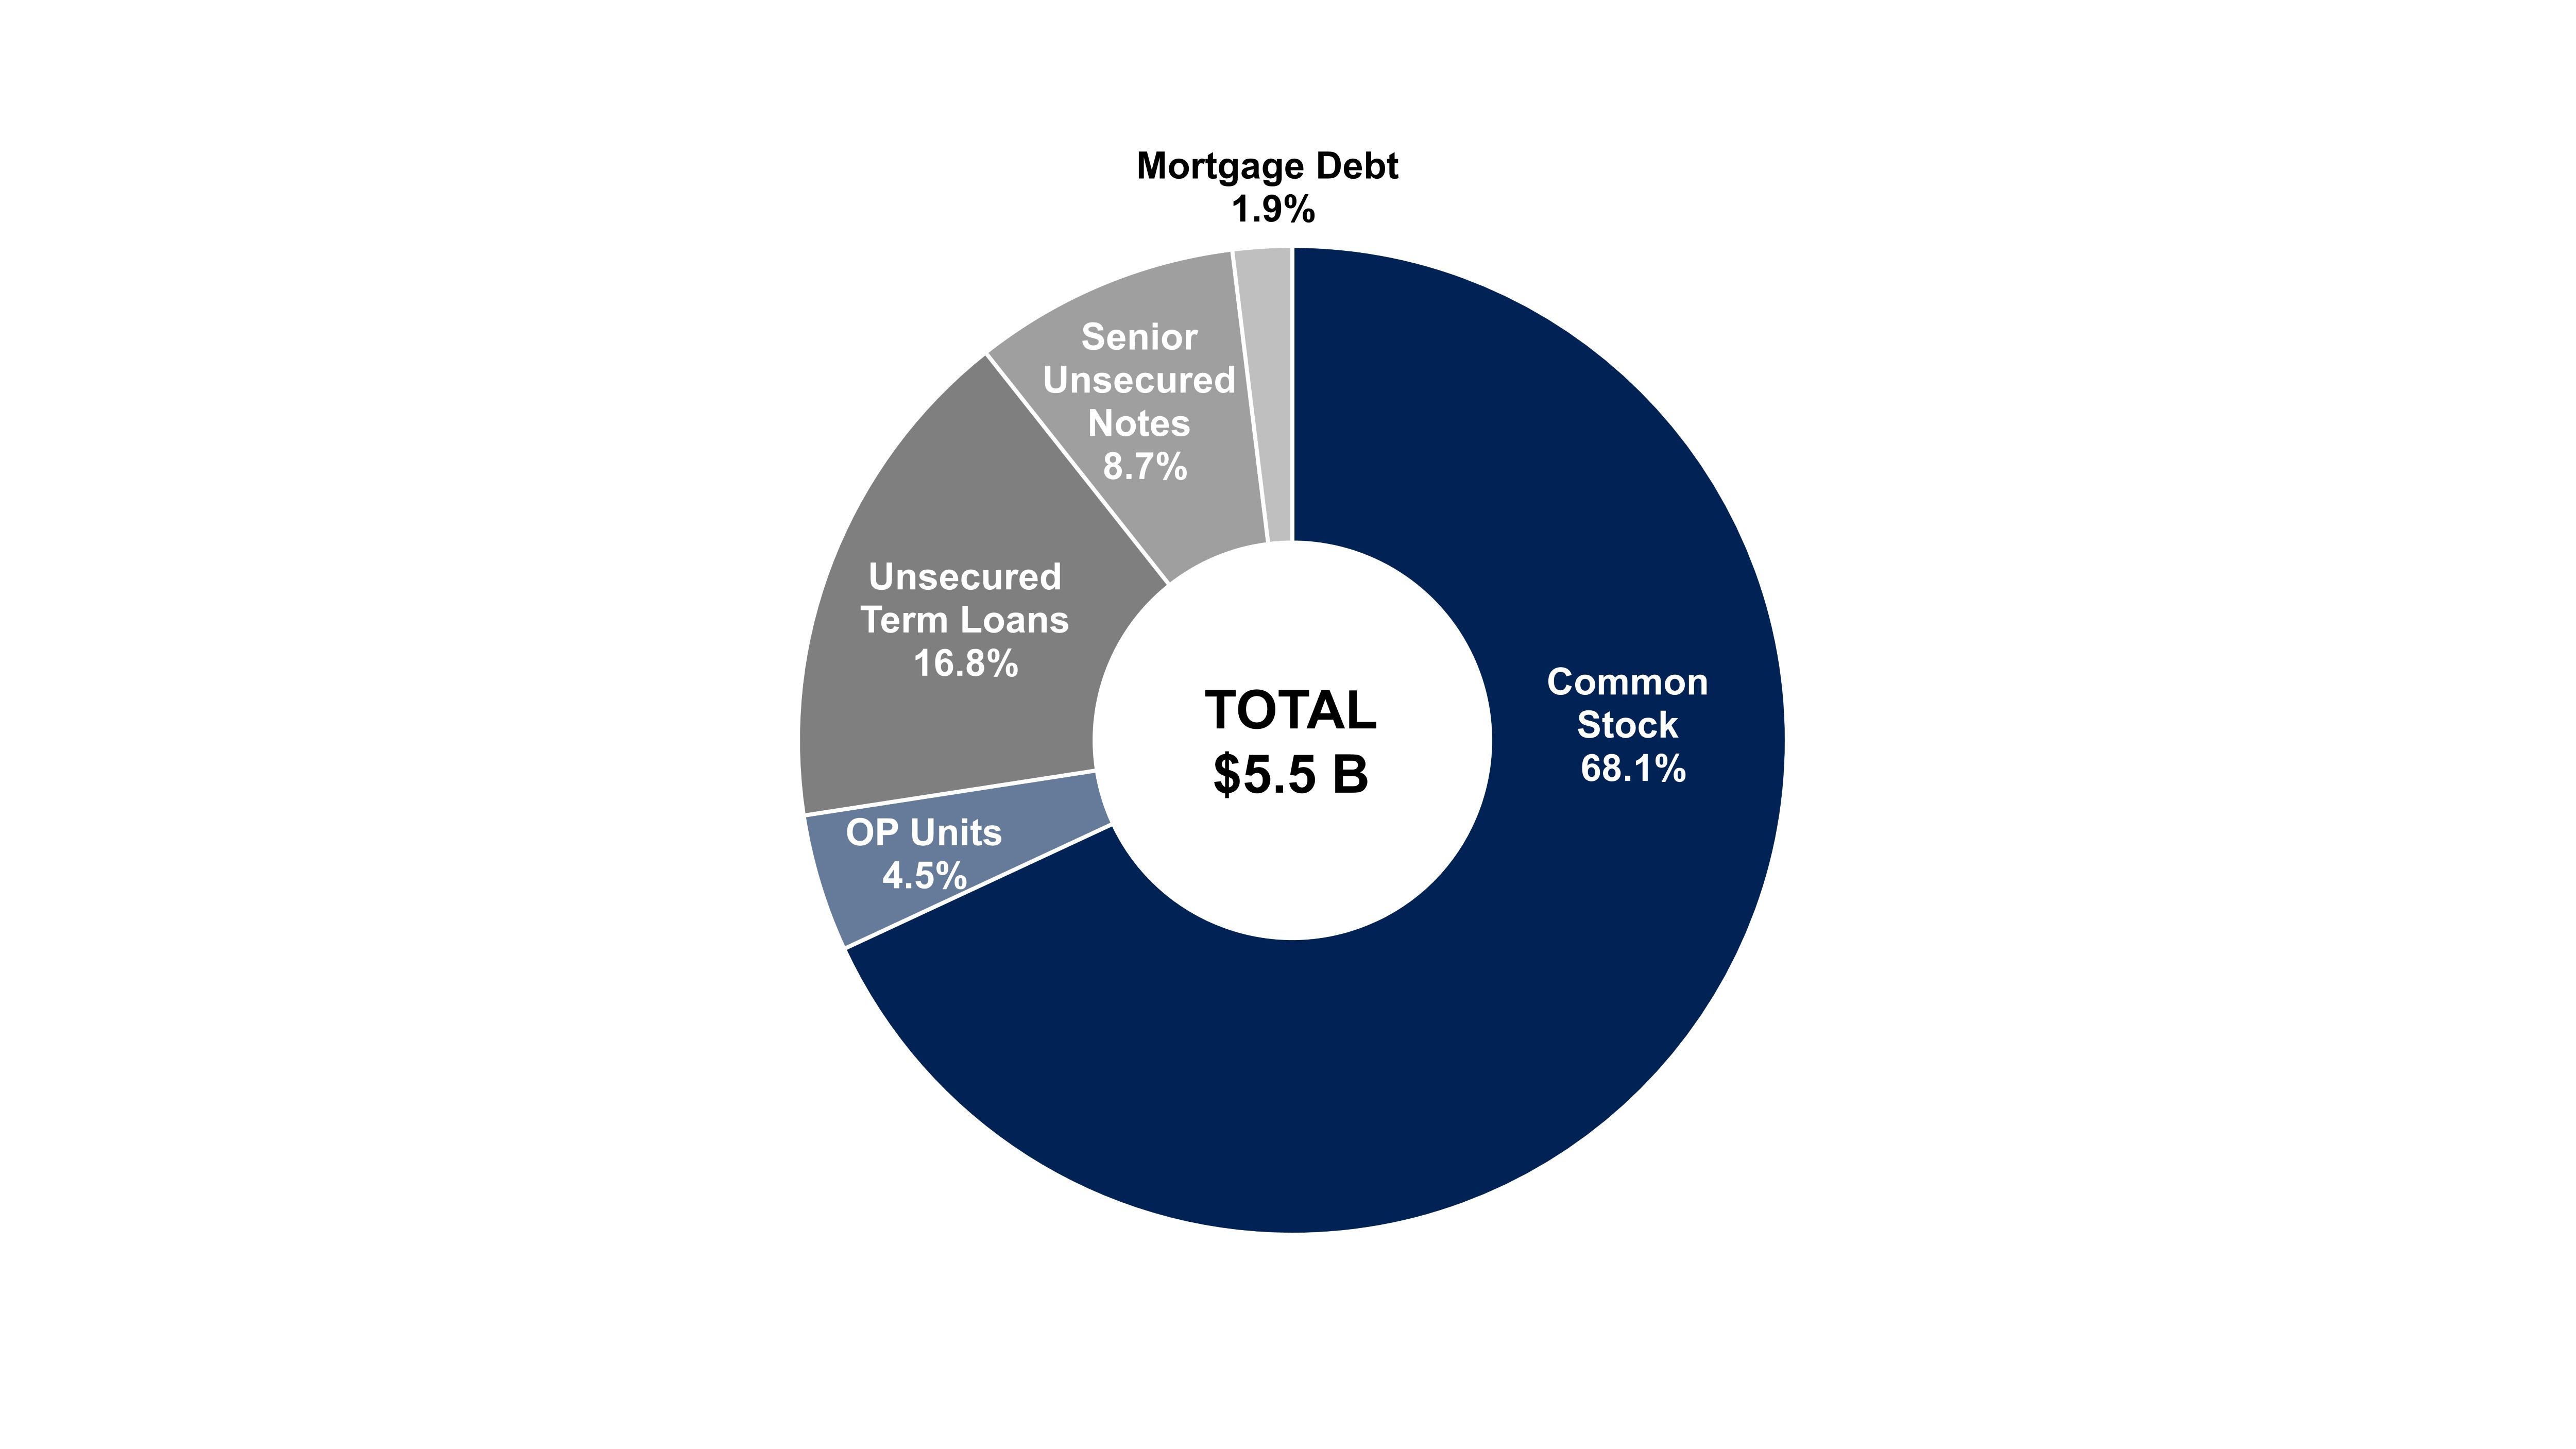
Capital Structure
(unaudited, in thousands, except per share data)
| | | | |
EQUITY | | | |
Shares of Common Stock | | | 158,583 | |
OP Units | | | 10,482 | |
Common Stock & OP Units | | | 169,065 | |
Price Per Share / Unit at June 30, 2021 | | $ | 23.41 | |
IMPLIED EQUITY MARKET CAPITALIZATION | | $ | 3,957,800 | |
% of Total Capitalization | | | 72.6 | % |
DEBT | | | |
Unsecured Revolving Credit Facility - 2023 | | $ | — | |
Unsecured Term Loan Facilities | | | 915,000 | |
Unsecured Term Loan - 2022 | | | 60,000 | |
Unsecured Term Loan - 2023 | | | 265,000 | |
Unsecured Term Loan - 2024 | | | 190,000 | |
Unsecured Term Loan - 2026 | | | 400,000 | |
Senior Unsecured Notes | | | 475,000 | |
Senior Unsecured Notes - 2027 | | | 150,000 | |
Senior Unsecured Notes - 2028 | | | 225,000 | |
Senior Unsecured Notes - 2030 | | | 100,000 | |
Mortgage Debt - Various | | | 106,004 | |
TOTAL DEBT | | $ | 1,496,004 | |
% of Total Capitalization | | | 27.4 | % |
% of Total Capitalization Floating Rate Debt | | | 1.7 | % |
% of Total Capitalization Fixed Rate Debt | | | 25.7 | % |
| | | |
ENTERPRISE VALUE | | | |
Total Capitalization | | $ | 5,453,804 | |
Less: Cash and Cash Equivalents | | | (78,987 | ) |
Enterprise Value | | $ | 5,374,817 | |
BROADSTONE NET LEASE, INC. | www.broadstone.com | © 2021 Broadstone Net Lease, LLC. All rights reserved. 11
Equity Rollforward
(unaudited, in thousands)
| | | | | | | | | | | | | |
| | | Shares of Common Stock | | | OP Units | | | Total Diluted Shares | |
Balance, January 1, 2021 | | | | 145,609 | | | | 11,399 | | | | 157,008 | |
Q1 2021 board of directors fees | | | | 12 | | | | — | | | | 12 | |
Q1 2021 stock-based compensation activity | | | | 154 | | | | — | | | | 154 | |
Q1 2021 OP Unit conversions | | | | 38 | | | | (38 | ) | | | — | |
Balance, March 31, 2021 | | | | 145,813 | | | | 11,361 | | | | 157,174 | |
Q2 2021 board of directors fees | | | | 13 | | | | — | | | | 13 | |
Q2 2021 stock-based compensation activity | | | | (15 | ) | | | — | | | | (15 | ) |
Q2 2021 OP Unit conversions | | | | 1,127 | | | | (1,127 | ) | | | — | |
Q2 2021 Earnout tranche 1 issuance | | | | 145 | | | | 248 | | | | 393 | |
Q2 2021 Public follow-on equity offering | | | | 11,500 | | | | — | | | | 11,500 | |
Balance, June 30, 2021 | | | | 158,583 | | | | 10,482 | | | | 169,065 | |
Percentage ownership of OP at June 30, 2021 | | | 93.8 | % | | | 6.2 | % | | | 100 | % |
Subsequent to quarter-end, on July 14, 2021, the Company achieved a 40-day VWAP of $23.75, thereby triggering tranche 2 of the earnout and the issuance of 217 shares of common stock and 372 OP Units.
BROADSTONE NET LEASE, INC. | www.broadstone.com | © 2021 Broadstone Net Lease, LLC. All rights reserved. 12
Debt Outstanding
(unaudited, in thousands)
| | | | | | | | | | | | |
| | Outstanding Balance | | | | | |
| | June 30, | | | December 31, | | | | | |
| | 2021 | | | 2020 | | | Interest Rate | | Maturity Date |
Revolving Credit Facility | $ | — | | | $ | — | | | one-month LIBOR + 1.00% | | Sep. 2023 |
2022 Unsecured Term Loan | | | 60,000 | | | | 60,000 | | | one-month LIBOR + 1.00% | | Feb. 2022 |
2023 Unsecured Term Loan | | 265,000 | | | | 265,000 | | | one-month LIBOR + 1.10% | | Jan. 2023 |
2024 Unsecured Term Loan | | 190,000 | | | | 190,000 | | | one-month LIBOR + 1.00% | | Jun. 2024 |
2026 Unsecured Term Loan | | | 400,000 | | | | 450,000 | | | one-month LIBOR + 1.00% | | Feb. 2026 |
Senior Notes | | | | | | | | | | |
Series A | | 150,000 | | | | 150,000 | | | 4.84% | | Apr. 2027 |
Series B | | 225,000 | | | | 225,000 | | | 5.09% | | Jul. 2028 |
Series C | | 100,000 | | | | 100,000 | | | 5.19% | | Jul. 2030 |
| | | 475,000 | | | | 475,000 | | | | | |
Total, unsecured debt | | | 1,390,000 | | | | 1,440,000 | | | | | |
Debt issuance costs, net | | | (6,369 | ) | | | (6,204 | ) | | | | |
Total unsecured debt, net | | $ | 1,383,631 | | | $ | 1,433,796 | | | | | |
| | | | | | | | | | | | | | |
| | Origination | | Maturity | | | | | | | | |
| | Date | | Date | | Interest | | June 30, | | | December 31, | |
Lender | | (Month/Year) | | (Month/Year) | | Rate | | 2021 | | | 2020 | |
Wilmington Trust National Association | | Apr-19 | | Feb-28 | | 4.92% | | $ | 47,357 | | | $ | 47,945 | |
Wilmington Trust National Association | | Jun-18 | | Aug-25 | | 4.36% | | | 19,753 | | | | 19,947 | |
PNC Bank | | Oct-16 | | Nov-26 | | 3.62% | | | 17,297 | | | | 17,498 | |
Sun Life | | Mar-12 | | Oct-21 | | 5.13% | | | 10,252 | | | | 10,469 | |
Aegon | | Apr-12 | | Oct-23 | | 6.38% | | | 6,650 | | | | 7,039 | |
M&T Bank | | Oct-17 | | Aug-21 | | one - month
LIBOR+3% | | | 4,695 | | | | 4,769 | |
Total mortgages | | | | | | | | | 106,004 | | | | 107,667 | |
Debt issuance costs, net | | | | | | | | | (256 | ) | | | (285 | ) |
Mortgages, net | | | | | | | | $ | 105,748 | | | $ | 107,382 | |
| | | | | | | | | | | | | | | | | | | | |
Year of Maturity | | Revolving Credit Facility | | | Term Loans | | | Senior Notes | | | Mortgages | | | Total | |
2021 | | $ | — | | | $ | — | | | $ | — | | | $ | 16,343 | | | $ | 16,343 | |
2022 | | | — | | | | 60,000 | | | | — | | | | 2,907 | | | | 62,907 | |
2023 | | | — | | | | 265,000 | | | | — | | | | 7,582 | | | | 272,582 | |
2024 | | | — | | | | 190,000 | | | | — | | | | 2,260 | | | | 192,260 | |
2025 | | | — | | | | — | | | | — | | | | 20,195 | | | | 20,195 | |
Thereafter | | | — | | | | 400,000 | | | | 475,000 | | | | 56,717 | | | | 931,717 | |
Total | | $ | — | | | $ | 915,000 | | | $ | 475,000 | | | $ | 106,004 | | | $ | 1,496,004 | |
BROADSTONE NET LEASE, INC. | www.broadstone.com | © 2021 Broadstone Net Lease, LLC. All rights reserved. 13
Net Debt Metrics
(unaudited, in thousands)
| | | | | | | | | | | | | | | | | | | | |
| | | | | | | | | | | | | | | |
| | June 30,
2021 | | | March 31,
2021 | | | December 31,
2020 | | | September 30,
2020 | | | June 30,
2020 | |
Debt | | | | | | | | | | | | | | | |
Revolving Credit Facility | | $ | — | | | $ | 15,000 | | | $ | — | | | $ | — | | | $ | 248,300 | |
Unsecured term notes, net | | | 1,383,631 | | | | 1,383,283 | | | | 1,433,796 | | | | 1,433,495 | | | | 1,673,092 | |
Mortgages and notes payable, net | | | 105,748 | | | | 106,559 | | | | 107,382 | | | | 108,752 | | | | 109,512 | |
Debt issuance costs | | | 6,625 | | | | 6,988 | | | | 6,489 | | | | 6,829 | | | | 7,268 | |
Gross Debt | | | 1,496,004 | | | | 1,511,830 | | | | 1,547,667 | | | | 1,549,076 | | | | 2,038,172 | |
Cash and cash equivalents | | | (78,987 | ) | | | (10,205 | ) | | | (100,486 | ) | | | (101,787 | ) | | | (9,241 | ) |
Restricted cash | | | (8,021 | ) | | | (8,145 | ) | | | (10,242 | ) | | | (7,200 | ) | | | (601 | ) |
Net Debt | | $ | 1,408,996 | | | $ | 1,493,480 | | | $ | 1,436,939 | | | $ | 1,440,089 | | | $ | 2,028,330 | |
Net Debt to Annualized EBITDAre | | 5.34x | | | 5.45x | | | 5.87x | | | 4.91x | | | 6.64x | |
Net Debt to Annualized Adjusted
EBITDAre | | 4.76x | | | 5.25x | | | 5.15x | | | 5.20x | | | 7.23x | |
Covenants
(unaudited)
The following is a summary of key financial covenants for the Company’s unsecured credit facility and unsecured term loans and senior notes. These calculations, which are not based on U.S. GAAP measurements, are presented to investors to show that as of June 30, 2021, the Company believes it is in compliance with the covenants.
| | | | | | | | | | |
Covenants | | Required | | Revolving Credit Facility and Unsecured Term Loans | | | Senior Notes | |
Leverage ratio | | ≤ 0.60 to 1.00 | | | 0.33 | | | | 0.33 | |
Secured indebtedness ratio | | ≤ 0.40 to 1.00 | | | 0.02 | | | | 0.02 | |
Unencumbered coverage ratio | | ≥ 1.75 to 1.00 | | | 7.63 | | | Not Applicable | |
Fixed charge coverage ratio | | ≥ 1.50 to 1.00 | | | 4.06 | | | | 4.06 | |
Total unsecured indebtedness to total
unencumbered eligible property value | | ≤ 0.60 to 1.00 | | | 0.34 | | | | 0.35 | |
Dividends and other restricted payments | | Only applicable in case of default | | Not Applicable | | | Not Applicable | |
BROADSTONE NET LEASE, INC. | www.broadstone.com | © 2021 Broadstone Net Lease, LLC. All rights reserved. 14
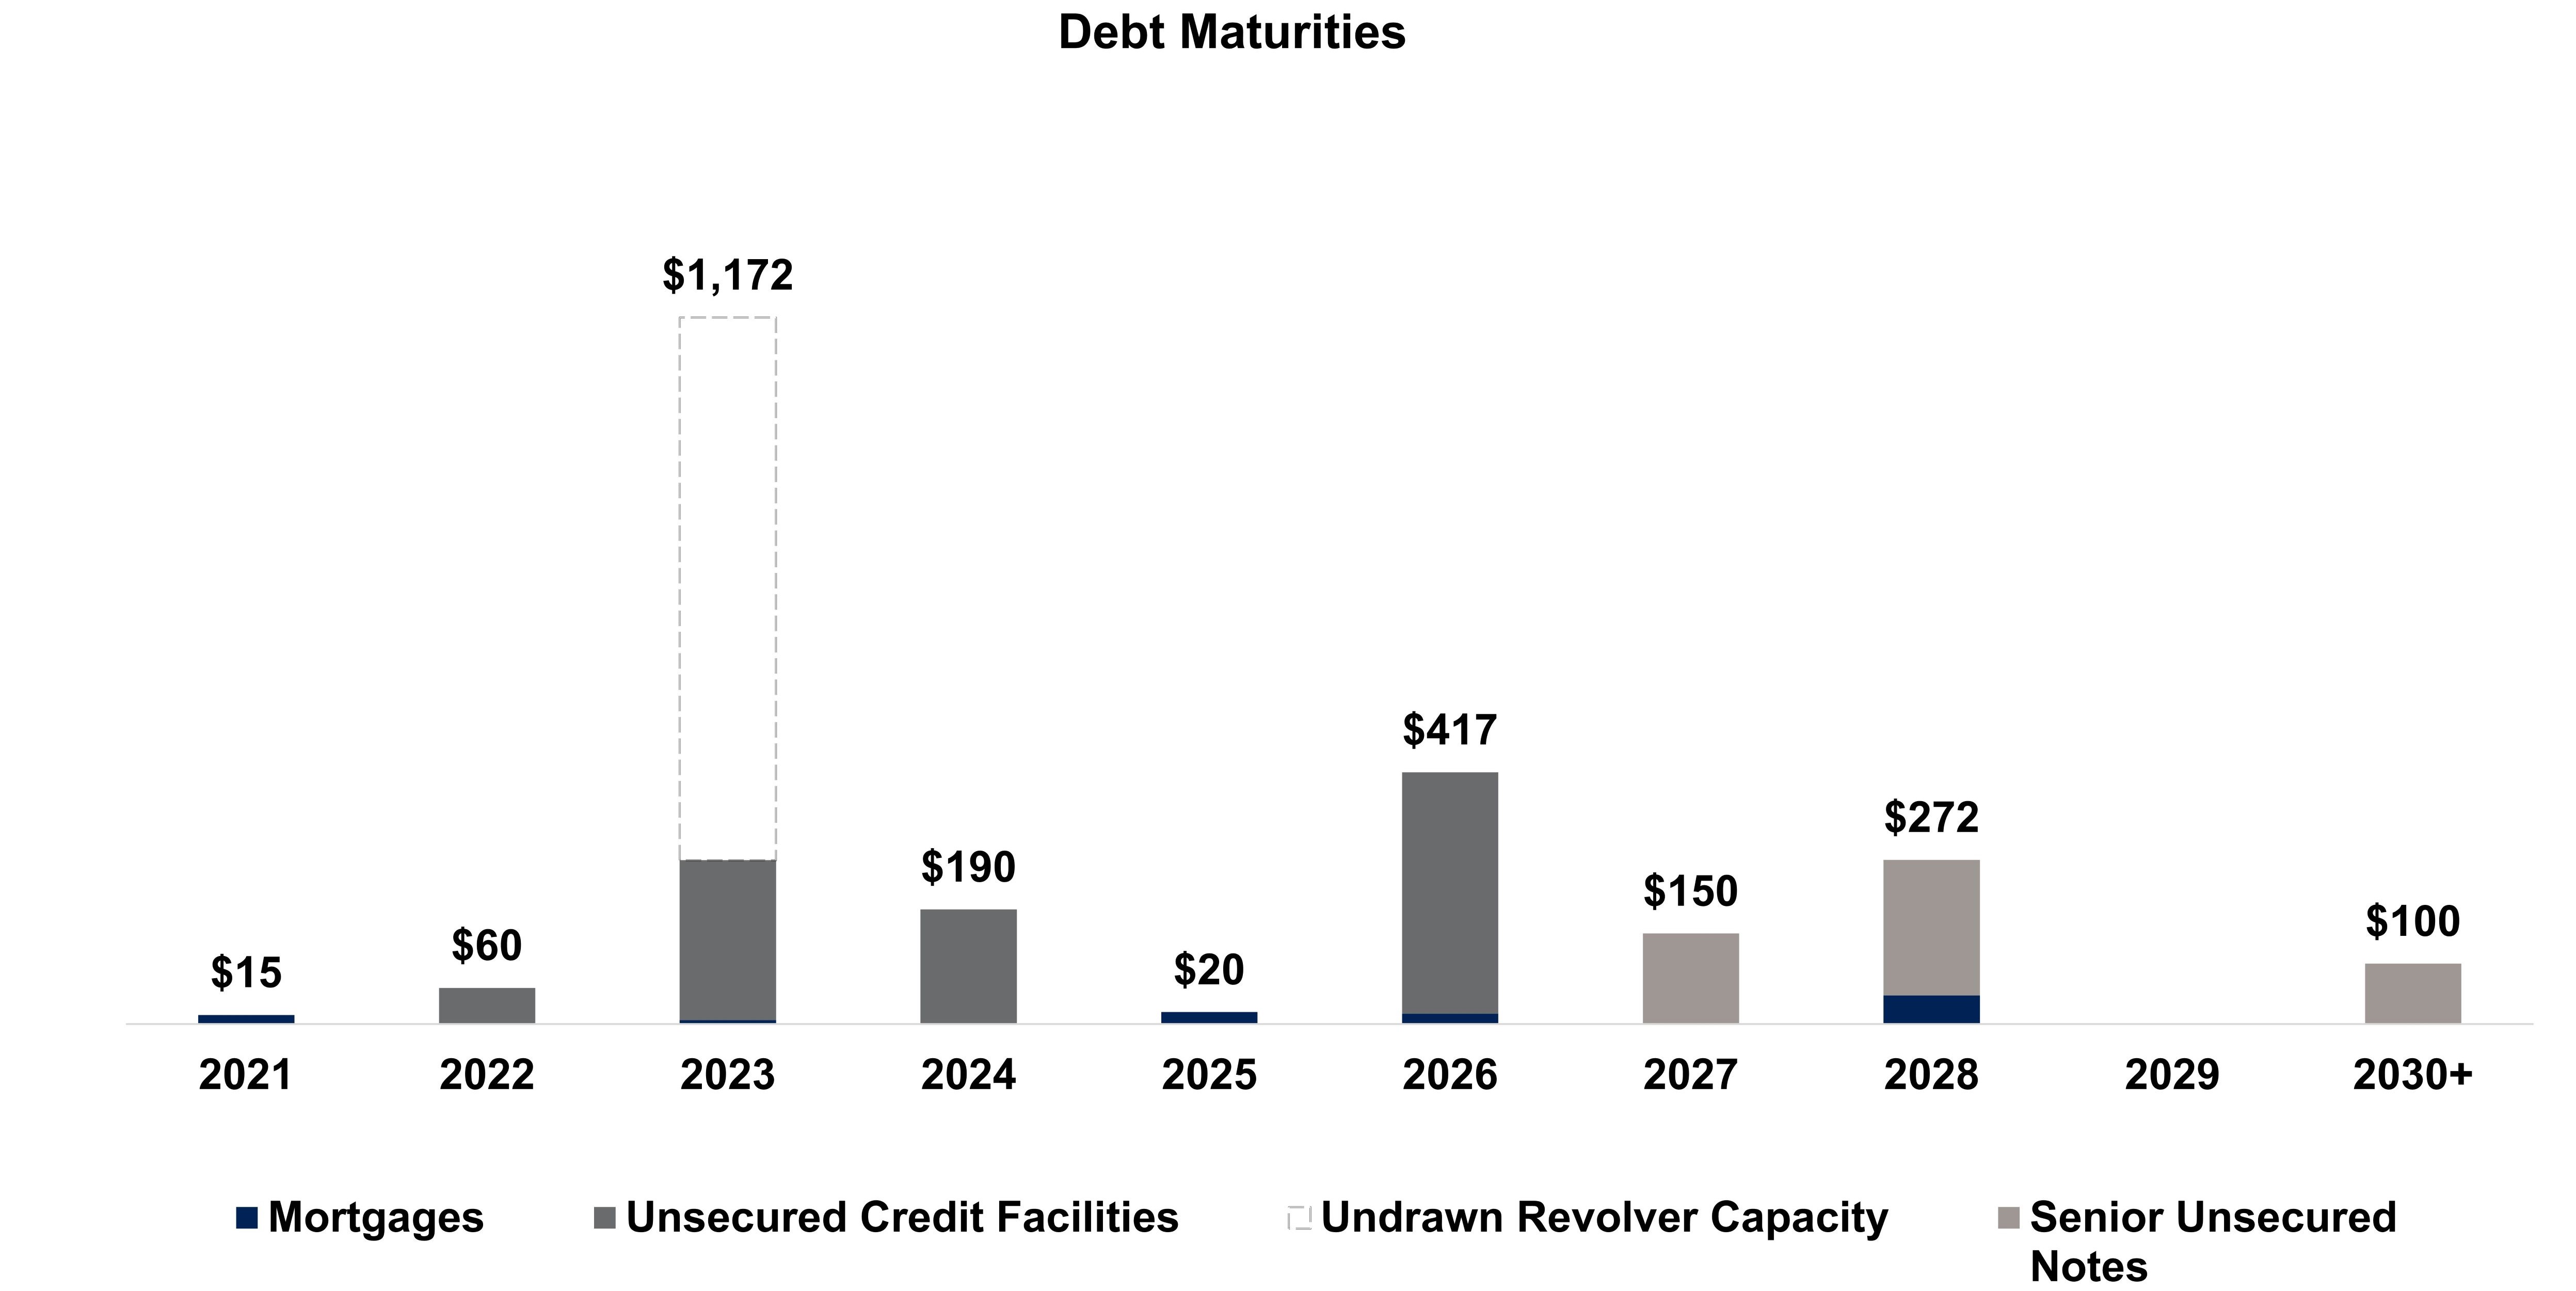
Debt Maturities and Interest Rate Exposure
(unaudited, dollars in millions)
Debt Maturities
The Company utilizes diversified sources of debt capital including unsecured bank debt, unsecured notes, and secured mortgages (where appropriate).
Interest Rate Exposure
The Company uses interest rate swaps, fixed-rate private placement notes, and fixed-rate mortgages to mitigate the impact of interest rate variability.
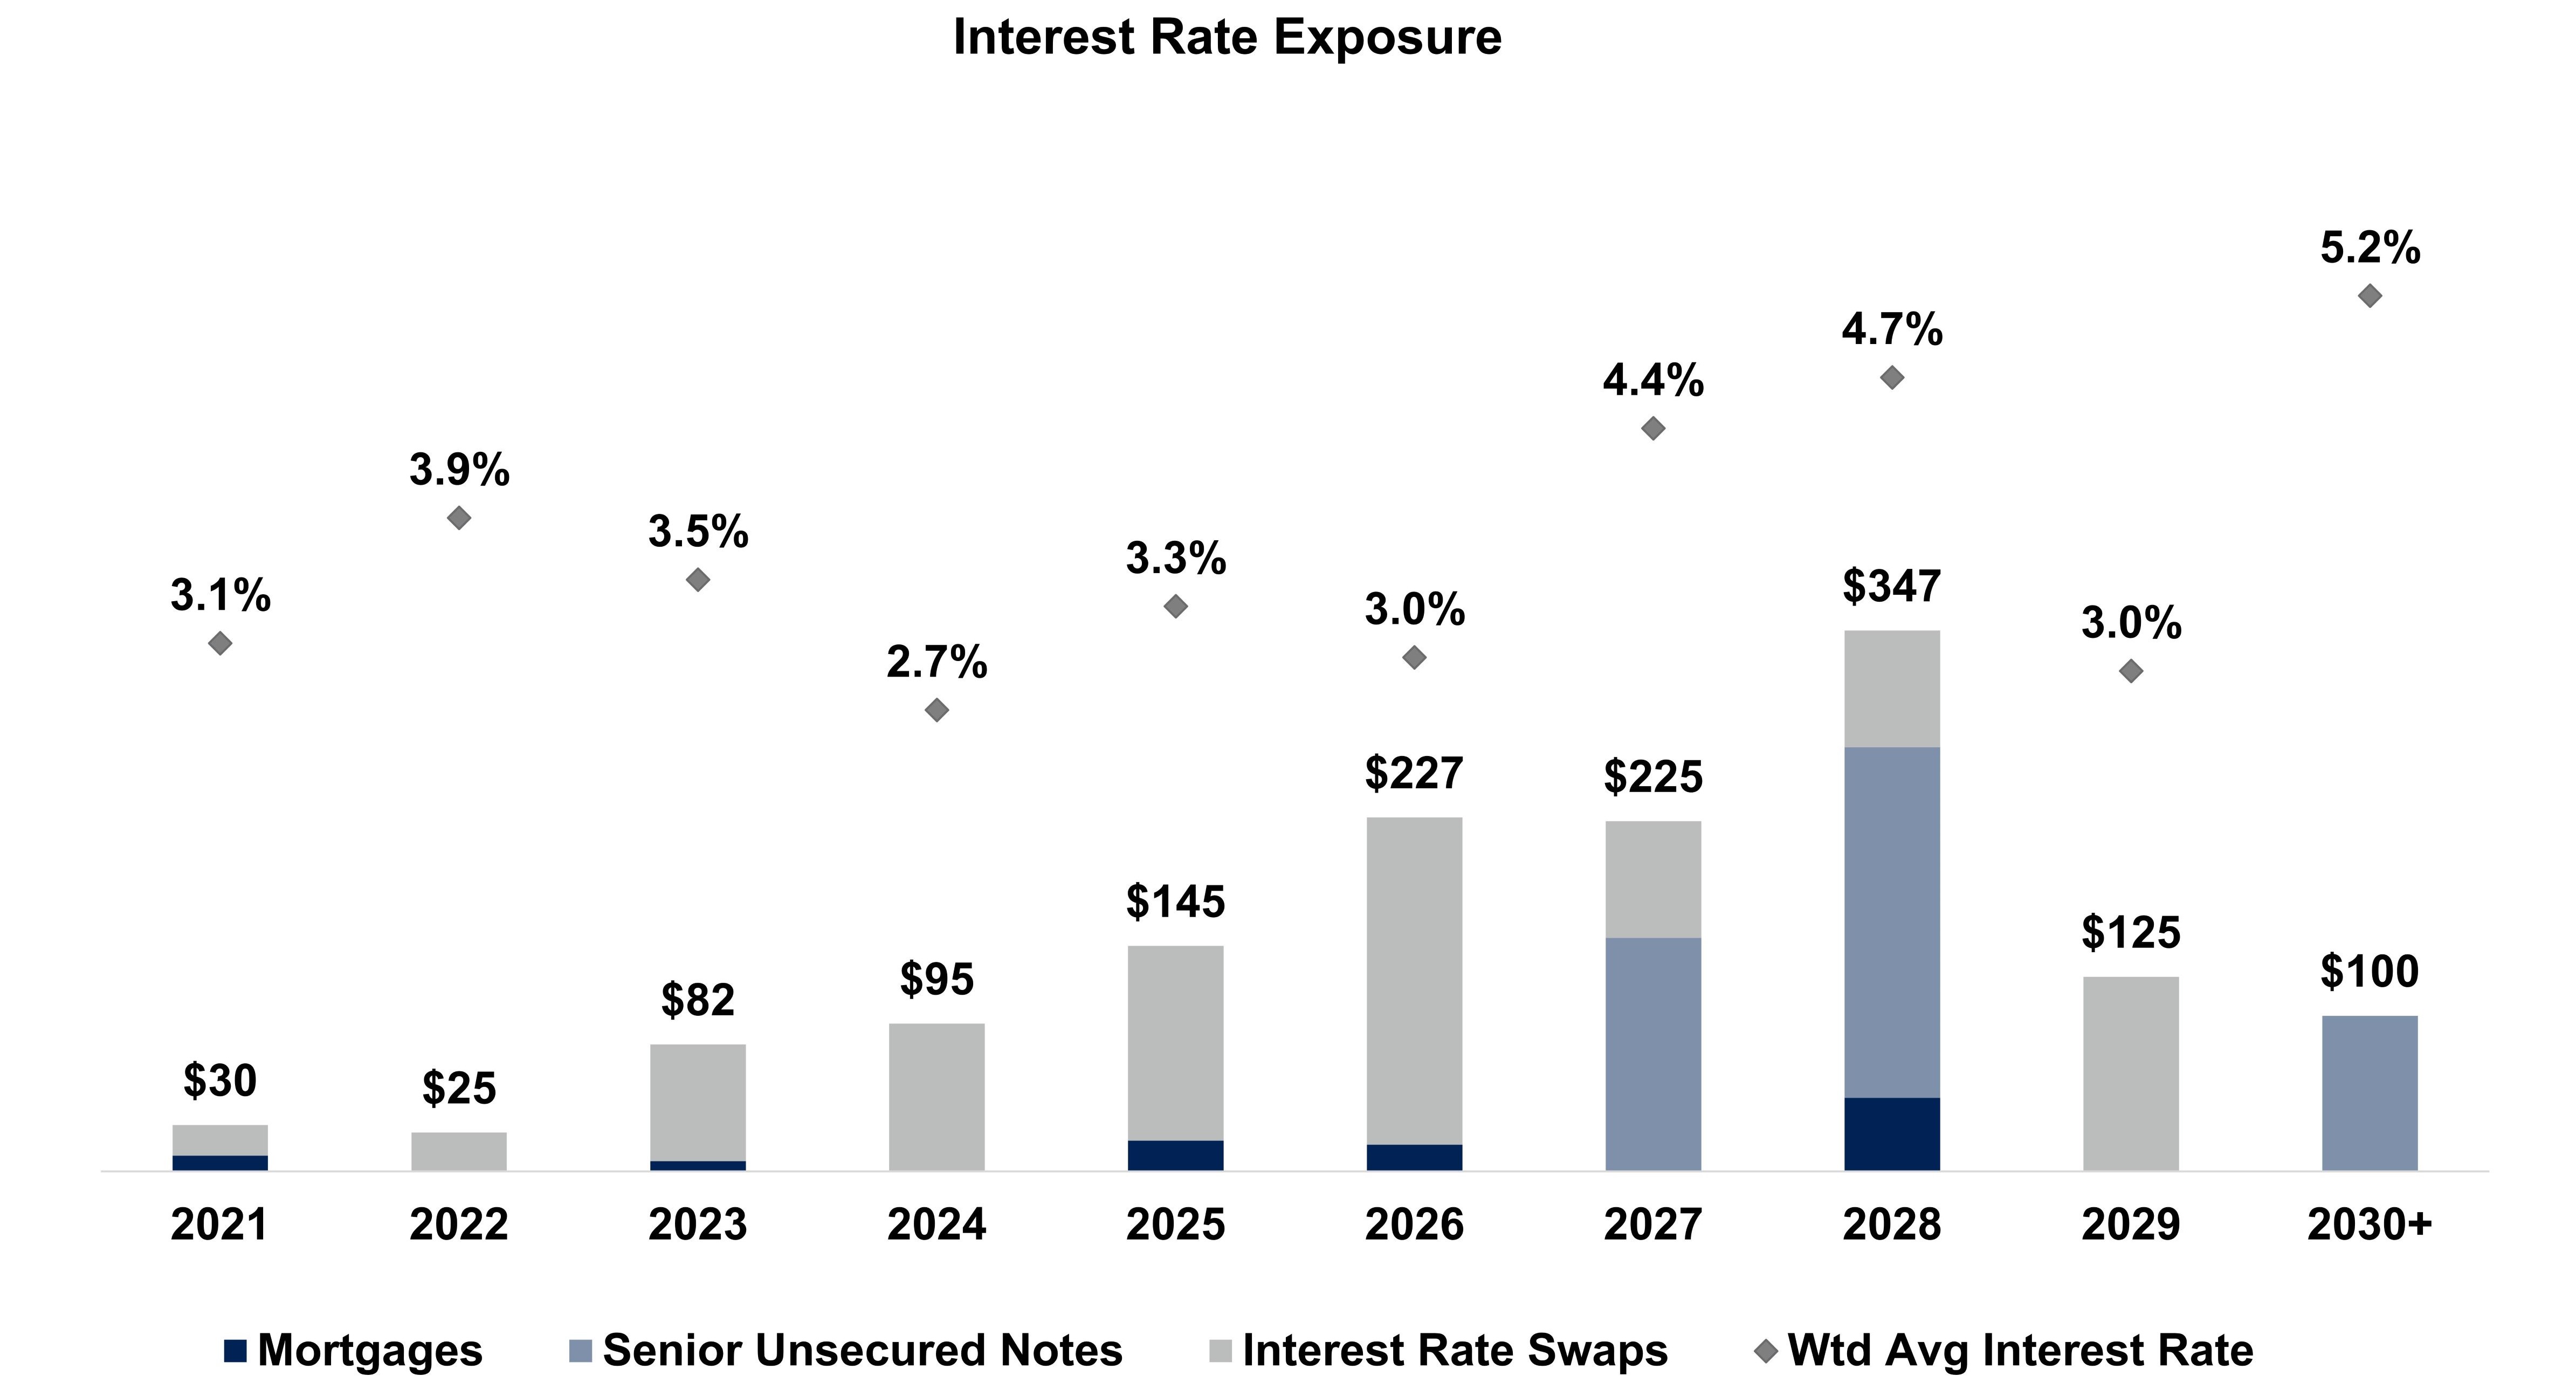
Interest rate exposure not inclusive of floating rate debt, as borrowings are short-term in nature.
BROADSTONE NET LEASE, INC. | www.broadstone.com | © 2021 Broadstone Net Lease, LLC. All rights reserved. 15
Portfolio Activity
Acquisitions
(unaudited, square feet and dollars in thousands)
The following table summarizes the Company’s property acquisition activity during 2021.
| | | | | | | | | | | | | | | | |
Q1 2021 | | | | | | | | | | | | |
Property Type | | Number of Properties | | | Square Feet ('000s) | | | Weighted Average Lease Term (years) | | | Acquisition Price ($'000s) | |
Retail | | | 24 | | | | 178 | | | | 16.3 | | | $ | 68,158 | |
Healthcare | | | 4 | | | | 51 | | | | 11.5 | | | | 18,983 | |
Restaurant 1 | | | — | | | | — | | | | 16.8 | | | | 181 | |
Total Properties | | | 28 | | | | 229 | | | | 15.3 | | | $ | 87,322 | |
Weighted average initial cash cap rate | | | | | | | | | | | | 6.4 | % |
| | | | | | | | | | | | |
Q2 2021 | | | | | | | | | | | | |
Property Type | | Number of Properties | | | Square Feet ('000s) | | | Weighted Average Lease Term (years) | | | Acquisition Price ($'000s) | |
Industrial | | | 12 | | | | 1,553 | | | | 15.5 | | | $ | 115,078 | |
Healthcare | | | 11 | | | | 136 | | | | 10.5 | | | | 46,050 | |
Retail | | | 11 | | | | 218 | | | | 9.8 | | | | 32,830 | |
Total Properties | | | 34 | | | | 1,906 | | | | 13.2 | | | $ | 193,959 | |
Weighted average initial cash cap rate | | | | | | | | | | | | 6.2 | % |
1 Acquisition of additional land to an existing property.
Dispositions
(unaudited, square feet and dollars in thousands)
The following table summarizes the Company’s property disposition activity during 2021.
| | | | | | | | | | | | | | | | | | | | | | | | | |
Q1 2021 | | | | | | | | | | | | | | | | | | | |
Property Type | | Number of Properties | | | Square Feet ('000s) | | | Acquisition Price ($'000s) | | | Disposition Price ($'000s) | | | Net Book Value ($'000s) | | | Cash Cap Rate | | |
Healthcare | | | 5 | | | | 31 | | | | 12,420 | | | | 14,689 | | | $ | 10,773 | | | | 7.4 | % | |
Restaurant | | | 3 | | | | 14 | | | | 6,965 | | | | 8,181 | | | | 6,599 | | | | 6.4 | % | |
Total Properties | | | 8 | | | | 45 | | | $ | 19,385 | | | $ | 22,870 | | | $ | 17,373 | | | | 7.0 | % | |
| | | | | | | | | | | | | | | | | | | |
Q2 2021 | | | | | | | | | | | | | | | | | | | |
Property Type | | Number of Properties | | | Square Feet ('000s) | | | Acquisition Price ($'000s) | | | Disposition Price ($'000s) | | | Net Book Value ($'000s) | | | Cash Cap Rate | | |
Restaurant | | | 10 | | | | 36 | | | $ | 17,973 | | | $ | 20,876 | | | $ | 15,694 | | | | 6.4 | % | |
Healthcare | | | 1 | | | | 6 | | | | 1,689 | | | | 1,400 | | | | 1,506 | | | N/A | | 2 |
Total Properties | | | 11 | | | | 42 | | | $ | 19,662 | | | $ | 22,276 | | | $ | 17,200 | | | | 6.4 | % | 3 |
2 Properties were vacant at the time of disposition.
3 Weighted average cash cap rate on tenanted properties sold.
BROADSTONE NET LEASE, INC. | www.broadstone.com | © 2021 Broadstone Net Lease, LLC. All rights reserved. 16
Portfolio at a Glance: Key Metrics
| | | |
Properties | 684 | | 
|
States | 42 | |
Canada | 1 | |
Total Rentable Sq. Footage | 30.2M | |
Tenants | 192 | |
Brands | 179 | |
Industries | 55 | |
Occupancy (based on SF) | 99.7% | |
Top Ten Tenant Concentration | 18.4% | |
Top Twenty Tenant Concentration | 31.1% | |
Investment Grade (tenant/guarantor) | 16.7% | |
Financial Reporting Coverage1 | 94.5% | |
Rent Coverage Ratio2 | 3.3x | |
Weighted Average Annual Rent Increases | 2.0% | |
Weighted Average Remaining Lease Term | 10.4 years | |
1 Includes 9.0% related to tenants not required to provide financial information under the terms of our lease, but whose financial statements are available publicly.
2 Represents rent coverage ratio for Restaurants property type only.
BROADSTONE NET LEASE, INC. | www.broadstone.com | © 2021 Broadstone Net Lease, LLC. All rights reserved. 17
Diversification: Tenants & Brands
(unaudited)
Top 20 Tenants
| | | | | | | | | | | | | | | | | | | | | | |
Tenant | | Property Type | | #
Properties | | | ABR
($'000s) | | | ABR as a
% of Total
Portfolio | | | Square
Feet
('000s) | | | SF as a
% of Total
Portfolio | |
Red Lobster Hospitality & Red Lobster
Restaurants LLC | | Casual Dining | | | 24 | | | $ | 7,307 | | | | 2.3 | % | | | 196 | | | | 0.6 | % |
Jack's Family Restaurants LP | | Quick Service Restaurants | | | 43 | | | | 7,026 | | | | 2.2 | % | | | 147 | | | | 0.5 | % |
Joseph T. Ryerson & Son, Inc | | Distribution & Warehouse | | | 11 | | | | 6,395 | | | | 2.0 | % | | | 1,537 | | | | 5.1 | % |
Axcelis Technologies, Inc. | | Flex and R&D | | | 1 | | | | 5,859 | | | | 1.9 | % | | | 417 | | | | 1.4 | % |
Hensley & Company | | Distribution & Warehouse | | | 3 | | | | 5,756 | | | | 1.8 | % | | | 577 | | | | 1.9 | % |
BluePearl Holdings, LLC | | Animal Health Services | | | 13 | | | | 5,308 | | | | 1.7 | % | | | 160 | | | | 0.5 | % |
Outback Steakhouse of Florida LLC | | Casual Dining | | | 22 | | | | 5,192 | | | | 1.7 | % | | | 140 | | | | 0.5 | % |
Krispy Kreme Doughnut Corporation | | Quick Service Restaurants/
Food Processing | | | 27 | | | | 5,034 | | | | 1.6 | % | | | 156 | | | | 0.5 | % |
Siemens Medical Solutions USA, Inc.
& Siemens Corporation | | Manufacturing/Flex
and R&D | | | 2 | | | | 4,862 | | | | 1.6 | % | | | 545 | | | | 1.8 | % |
Big Tex Trailer Manufacturing, Inc. | | Automotive/Distribution &
Warehouse/Manufacturing/ Corporate Headquarters | | | 17 | | | | 4,860 | | | | 1.6 | % | | | 1,302 | | | | 4.3 | % |
Total Top 10 Tenants | | | | | 163 | | | $ | 57,599 | | | | 18.4 | % | | | 5,177 | | | | 17.1 | % |
| | | | | | | | | | | | | | | | | |
Nestle' Dreyer's Ice Cream Company | | Cold Storage | | | 1 | | | $ | 4,409 | | | | 1.4 | % | | | 310 | | | | 1.0 | % |
Arkansas Surgical Hospital | | Surgical | | | 1 | | | | 4,260 | | | | 1.4 | % | | | 129 | | | | 0.4 | % |
Nationwide Mutual Insurance
Company | | Strategic Operations | | | 2 | | | | 4,248 | | | | 1.4 | % | | | 407 | | | | 1.3 | % |
Cascade Aerospace Inc. | | Manufacturing | | | 1 | | | | 4,187 | | | | 1.4 | % | | | 231 | | | | 0.8 | % |
American Signature, Inc. | | Home Furnishings | | | 6 | | | | 4,141 | | | | 1.3 | % | | | 474 | | | | 1.6 | % |
Tractor Supply Company | | General Merchandise | | | 15 | | | | 3,872 | | | | 1.2 | % | | | 300 | | | | 1.0 | % |
Fresh Express Incorporated | | Food Processing | | | 1 | | | | 3,869 | | | | 1.2 | % | | | 335 | | | | 1.1 | % |
Aventiv Technologies, LLC | | Corporate Headquarters | | | 1 | | | | 3,819 | | | | 1.2 | % | | | 154 | | | | 0.5 | % |
Dollar General Corporation | | General Merchandise | | | 35 | | | | 3,510 | | | | 1.1 | % | | | 320 | | | | 1.1 | % |
Centene Management Company, LLC | | Strategic Operations | | | 1 | | | | 3,377 | | | | 1.1 | % | | | 220 | | | | 0.8 | % |
Total Top 20 Tenants | | | | | 227 | | | $ | 97,291 | | | | 31.1 | % | | | 8,057 | | | | 26.7 | % |
BROADSTONE NET LEASE, INC. | www.broadstone.com | © 2021 Broadstone Net Lease, LLC. All rights reserved. 18
Top 20 Brands
(unaudited)
| | | | | | | | | | | | | | | | | | | | | | |
Brand | | Property Type | | #
Properties | | | ABR
($'000s) | | | ABR as a
% of Total
Portfolio | | | Square
Feet
('000s) | | | SF as a
% of Total
Portfolio | |
Red Lobster | | Casual Dining | | | 24 | | | $ | 7,307 | | | | 2.3 | % | | | 196 | | | | 0.6 | % |
Jack's Family Restaurants | | Quick Service Restaurants | | | 43 | | | | 7,026 | | | | 2.2 | % | | | 147 | | | | 0.5 | % |
Ryerson | | Distribution & Warehouse | | | 11 | | | | 6,395 | | | | 2.0 | % | | | 1,537 | | | | 5.1 | % |
Axcelis | | Flex and R&D | | | 1 | | | | 5,859 | | | | 1.9 | % | | | 417 | | | | 1.4 | % |
Hensley | | Distribution & Warehouse | | | 3 | | | | 5,756 | | | | 1.8 | % | | | 577 | | | | 1.9 | % |
BluePearl Veterinary Partners | | Animal Health Services | | | 13 | | | | 5,308 | | | | 1.7 | % | | | 160 | | | | 0.5 | % |
Bob Evans Farms | | Casual Dining/Food
Processing | | | 21 | | | | 5,246 | | | | 1.7 | % | | | 282 | | | | 1.0 | % |
Krispy Kreme | | Quick Service Restaurants/
Food Processing | | | 27 | | | | 5,034 | | | | 1.6 | % | | | 156 | | | | 0.5 | % |
Siemens | | Manufacturing/Flex
and R&D | | | 2 | | | | 4,862 | | | | 1.6 | % | | | 545 | | | | 1.8 | % |
Big Tex Trailers | | Automotive/Distribution &
Warehouse/Manufacturing/
Corporate Headquarters | | | 17 | | | | 4,860 | | | | 1.6 | % | | | 1,302 | | | | 4.3 | % |
Total Top 10 Brands | | | | | 162 | | | $ | 57,653 | | | | 18.4 | % | | | 5,319 | | | | 17.6 | % |
| | | | | | | | | | | | | | | | | |
Wendy's | | Quick Service Restaurants | | | 31 | | | $ | 4,532 | | | | 1.5 | % | | | 88 | | | | 0.3 | % |
Outback Steakhouse | | Casual Dining | | | 20 | | | | 4,492 | | | | 1.4 | % | | | 126 | | | | 0.4 | % |
Nestle' | | Cold Storage | | | 1 | | | | 4,409 | | | | 1.4 | % | | | 310 | | | | 1.0 | % |
Arkansas Surgical Hospital | | Surgical | | | 1 | | | | 4,260 | | | | 1.4 | % | | | 129 | | | | 0.4 | % |
Nationwide Mutual Insurance Co. | | Strategic Operations | | | 2 | | | | 4,248 | | | | 1.4 | % | | | 407 | | | | 1.3 | % |
Cascade Aerospace | | Manufacturing | | | 1 | | | | 4,187 | | | | 1.4 | % | | | 231 | | | | 0.8 | % |
Value City Furniture | | Home Furnishings | | | 6 | | | | 4,142 | | | | 1.3 | % | | | 474 | | | | 1.6 | % |
Taco Bell | | Quick Service Restaurants | | | 31 | | | | 4,101 | | | | 1.3 | % | | | 80 | | | | 0.3 | % |
Tractor Supply Co. | | General Merchandise | | | 15 | | | | 3,872 | | | | 1.2 | % | | | 300 | | | | 1.0 | % |
Chiquita | | Food Processing | | | 1 | | | | 3,869 | | | | 1.2 | % | | | 335 | | | | 1.1 | % |
Total Top 20 Brands | | | | | 271 | | | $ | 99,765 | | | | 31.9 | % | | | 7,799 | | | | 25.8 | % |
BROADSTONE NET LEASE, INC. | www.broadstone.com | © 2021 Broadstone Net Lease, LLC. All rights reserved. 19
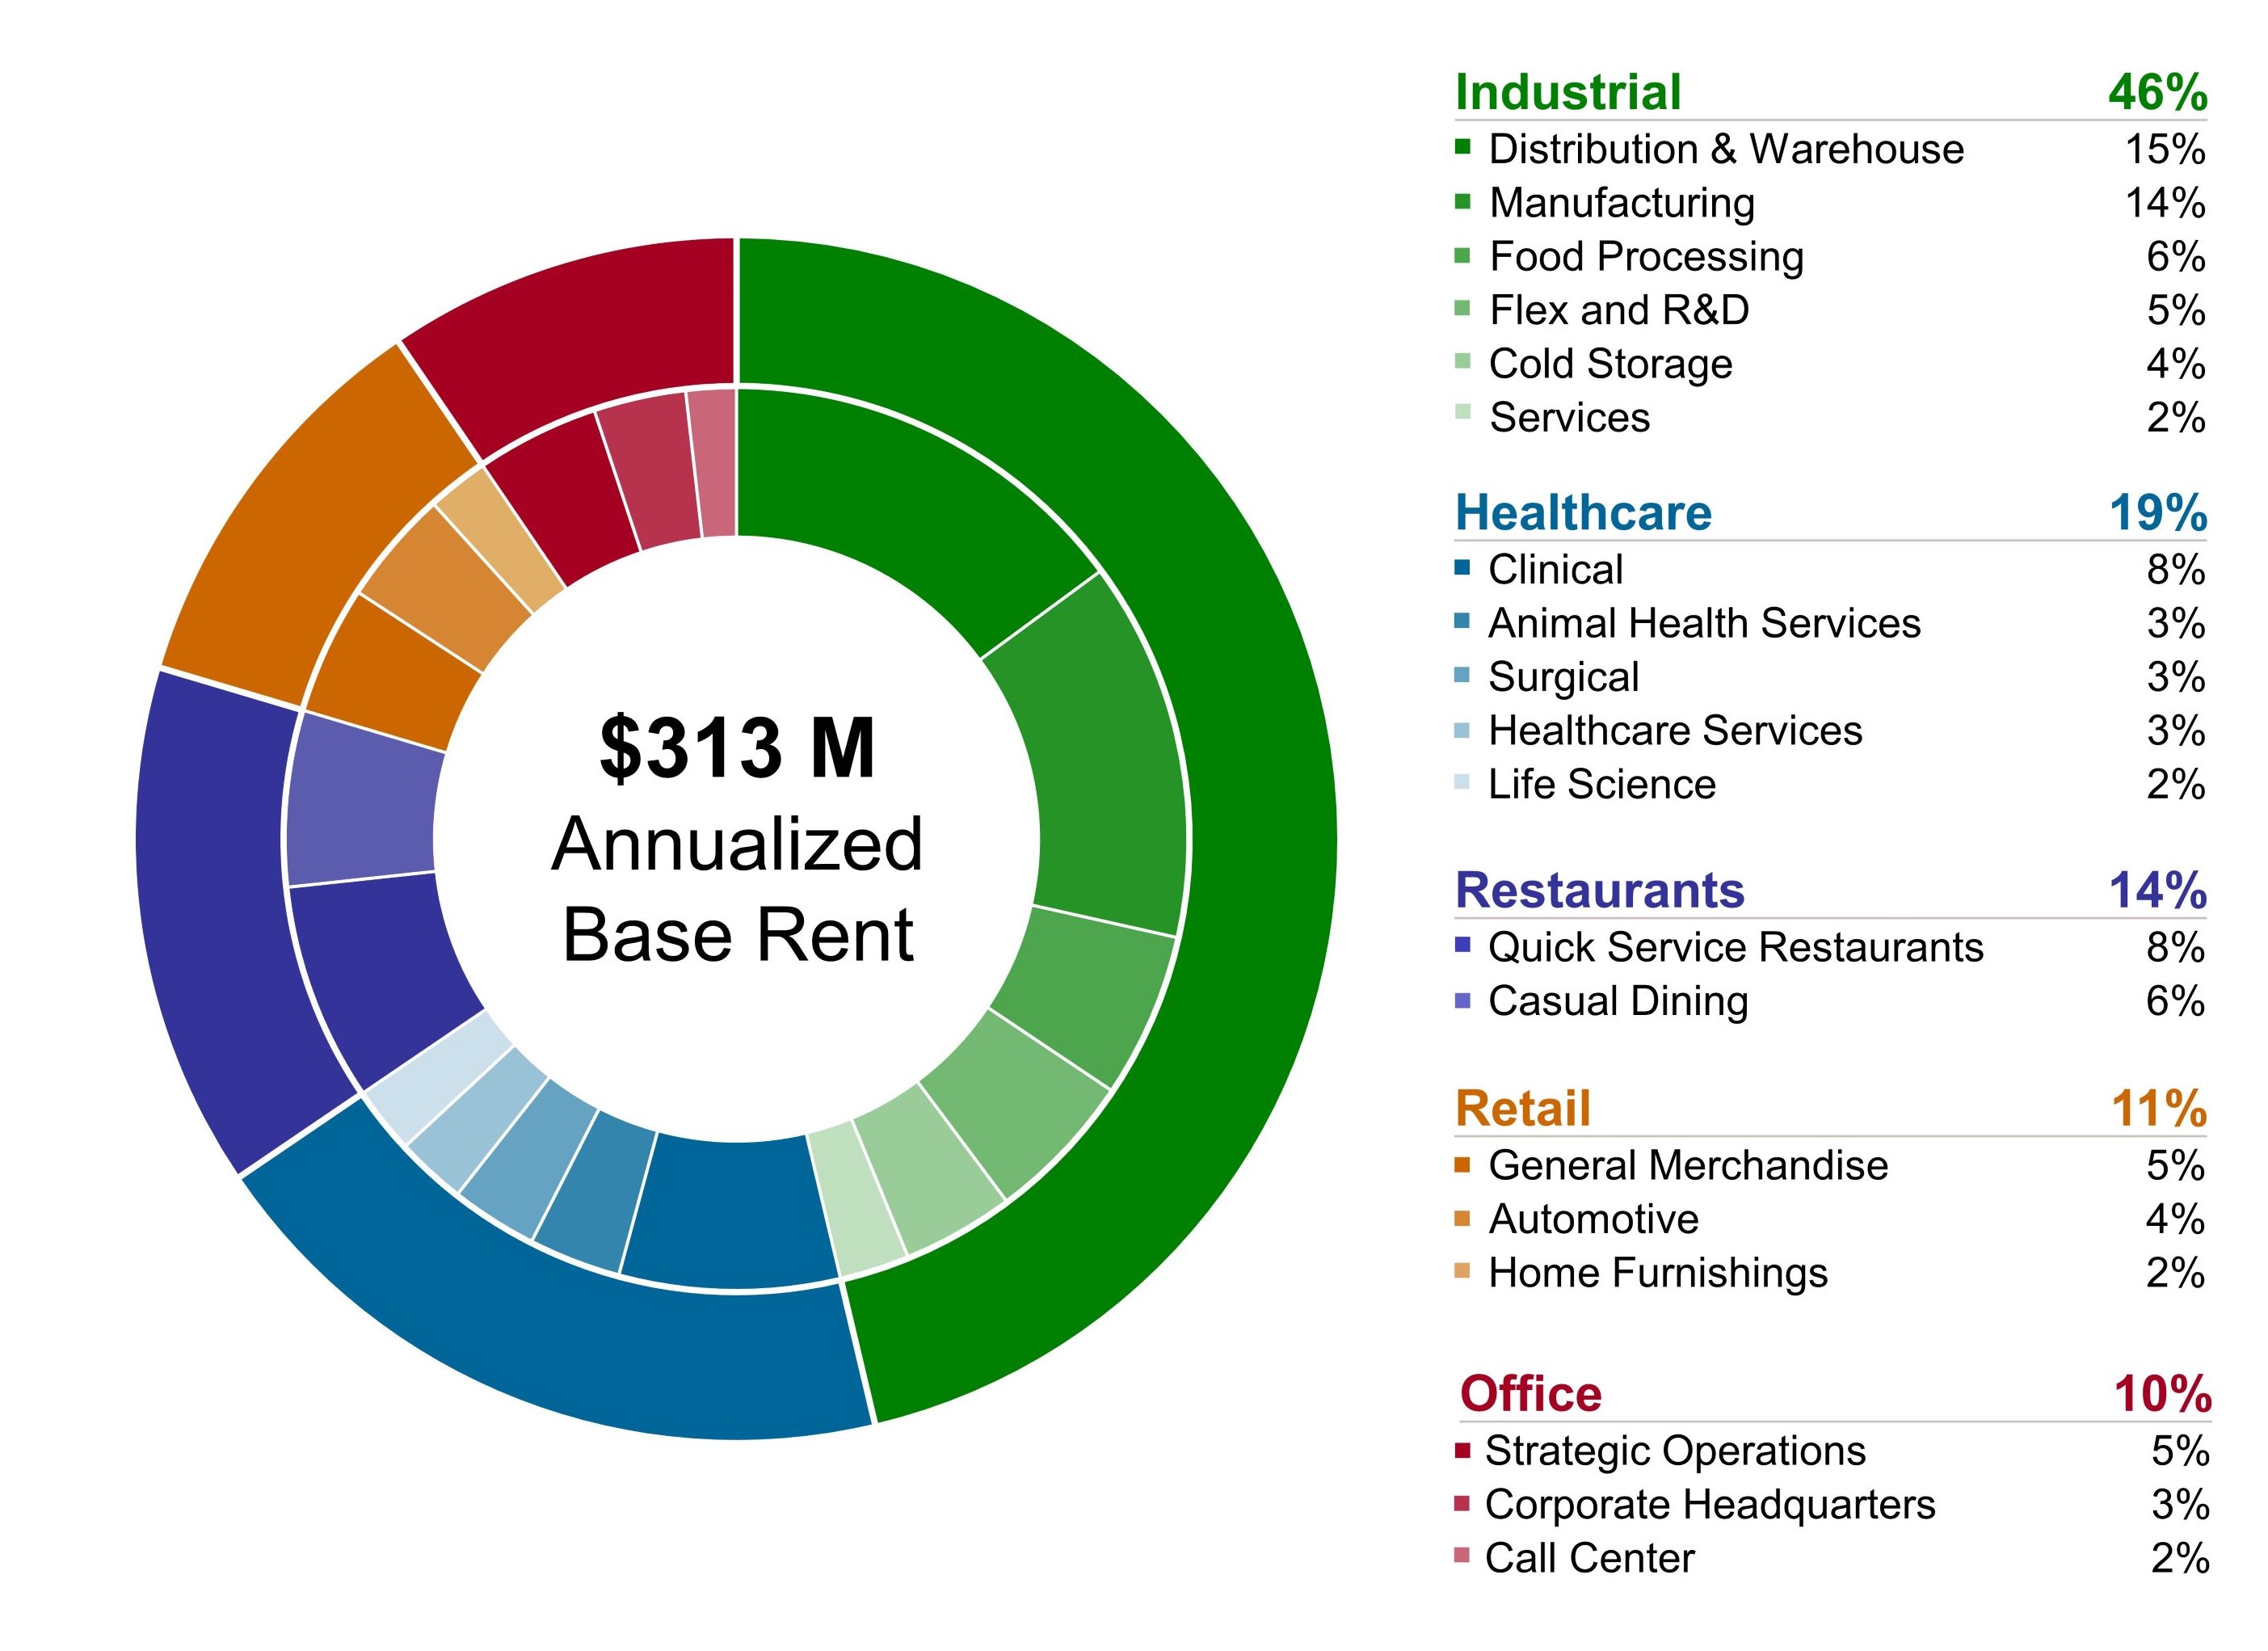
Diversification: Property Type
(unaudited, rent percentages based on ABR)
BROADSTONE NET LEASE, INC. | www.broadstone.com | © 2021 Broadstone Net Lease, LLC. All rights reserved. 20
Diversification: Property Type (continued)
(unaudited)
| | | | | | | | | | | | | | | | | | | | |
Property Type | | # Properties | | | ABR
($'000s) | | | ABR as a %
of Total
Portfolio | | | Square Feet ('000s) | | | SF as a %
of Total
Portfolio | |
Industrial | | | | | | | | | | | | | | | |
Distribution & Warehouse | | | 42 | | | $ | 46,668 | | | | 14.9 | % | | | 8,950 | | | | 29.6 | % |
Manufacturing | | | 56 | | | | 42,724 | | | | 13.6 | % | | | 7,732 | | | | 25.6 | % |
Food Processing | | | 14 | | | | 18,455 | | | | 5.9 | % | | | 2,132 | | | | 7.1 | % |
Flex and R&D | | | 7 | | | | 16,934 | | | | 5.4 | % | | | 1,457 | | | | 4.8 | % |
Cold Storage | | | 4 | | | | 12,600 | | | | 4.0 | % | | | 933 | | | | 3.1 | % |
Services | | | 19 | | | | 7,787 | | | | 2.5 | % | | | 445 | | | | 1.5 | % |
Industrial Total | | | 142 | | | | 145,168 | | | | 46.3 | % | | | 21,649 | | | | 71.7 | % |
Healthcare | | | | | | | | | | | | | | | |
Clinical | | | 50 | | | | 24,831 | | | | 7.9 | % | | | 1,055 | | | | 3.6 | % |
Animal Health Services | | | 27 | | | | 10,188 | | | | 3.3 | % | | | 405 | | | | 1.3 | % |
Surgical | | | 11 | | | | 9,592 | | | | 3.1 | % | | | 316 | | | | 1.0 | % |
Healthcare Services | | | 27 | | | | 7,829 | | | | 2.5 | % | | | 315 | | | | 1.0 | % |
Life Science | | | 9 | | | | 7,539 | | | | 2.4 | % | | | 549 | | | | 1.8 | % |
Untenanted | | | 2 | | | | — | | | | 0.0 | % | | | 23 | | | | 0.1 | % |
Healthcare Total | | | 126 | | | | 59,979 | | | | 19.2 | % | | | 2,663 | | | | 8.8 | % |
Restaurant | | | | | | | | | | | | | | | |
Quick Service Restaurants | | | 148 | | | | 24,468 | | | | 7.8 | % | | | 505 | | | | 1.7 | % |
Casual Dining | | | 84 | | | | 19,657 | | | | 6.3 | % | | | 543 | | | | 1.8 | % |
Untenanted | | | 2 | | | | — | | | | 0.0 | % | | | 10 | | | | 0.0 | % |
Restaurant Total | | | 234 | | | | 44,125 | | | | 14.1 | % | | | 1,058 | | | | 3.5 | % |
Retail | | | | | | | | | | | | | | | |
General Merchandise | | | 82 | | | | 14,472 | | | | 4.6 | % | | | 1,072 | | | | 3.5 | % |
Automotive | | | 68 | | | | 12,830 | | | | 4.1 | % | | | 844 | | | | 2.8 | % |
Home Furnishings | | | 13 | | | | 6,916 | | | | 2.2 | % | | | 797 | | | | 2.6 | % |
Untenanted | | | 2 | | | | — | | | | 0.0 | % | | | 63 | | | | 0.2 | % |
Retail Total | | | 165 | | | | 34,218 | | | | 10.9 | % | | | 2,776 | | | | 9.1 | % |
Office | | | | | | | | | | | | | | | |
Strategic Operations | | | 7 | | | | 13,835 | | | | 4.4 | % | | | 1,021 | | | | 3.4 | % |
Corporate Headquarters | | | 6 | | | | 10,167 | | | | 3.3 | % | | | 671 | | | | 2.2 | % |
Call Center | | | 4 | | | | 5,731 | | | | 1.8 | % | | | 392 | | | | 1.3 | % |
Office Total | | | 17 | | | | 29,733 | | | | 9.5 | % | | | 2,084 | | | | 6.9 | % |
Total | | | 684 | | | $ | 313,223 | | | | 100.0 | % | | | 30,230 | | | | 100.0 | % |
BROADSTONE NET LEASE, INC. | www.broadstone.com | © 2021 Broadstone Net Lease, LLC. All rights reserved. 21
Key Statistics by Property Type
| | | | |
Industrial | | | |
Number of properties | | | 142 | |
Square feet (000s) | | | 21,649 | |
Weighted average lease term (years) | | | 10.4 | |
Weighted average annual rent escalation | | | 2.0 | % |
| | | |
Healthcare | | | |
Number of properties | | | 126 | |
Square feet (000s) | | | 2,663 | |
Weighted average lease term (years) | | | 8.1 | |
Weighted average annual rent escalation | | | 2.2 | % |
| | | |
Restaurants | | | |
Number of properties | | | 234 | |
Square feet (000s) | | | 1,058 | |
Weighted average lease term (years) | | | 15.4 | |
Weighted average annual rent escalation | | | 2.0 | % |
| | | |
Retail | | | |
Number of properties | | | 165 | |
Square feet (000s) | | | 2,776 | |
Weighted average lease term (years) | | | 11.0 | |
Weighted average annual rent escalation | | | 1.6 | % |
| | | |
Office | | | |
Number of properties | | | 17 | |
Square feet (000s) | | | 2,084 | |
Weighted average lease term (years) | | | 6.9 | |
Weighted average annual rent escalation | | | 2.4 | % |
BROADSTONE NET LEASE, INC. | www.broadstone.com | © 2021 Broadstone Net Lease, LLC. All rights reserved. 22
Diversification: Tenant Industry
(unaudited)
| | | | | | | | | | | | | | | | | | | | |
Industry | | # Properties | | | ABR
($'000s) | | | ABR as a %
of Total
Portfolio | | | Square Feet ('000s) | | | SF as a %
of Total
Portfolio | |
Healthcare Facilities | | | 99 | | | $ | 47,073 | | | | 15.0 | % | | | 1,874 | | | | 6.2 | % |
Restaurants | | | 234 | | | | 44,788 | | | | 14.3 | % | | | 1,082 | | | | 3.6 | % |
Distributors | | | 24 | | | | 13,889 | | | | 4.4 | % | | | 2,519 | | | | 8.3 | % |
Food Distributors | | | 7 | | | | 12,957 | | | | 4.1 | % | | | 1,556 | | | | 5.1 | % |
Auto Parts & Equipment | | | 39 | | | | 12,396 | | | | 4.0 | % | | | 2,387 | | | | 7.9 | % |
Specialized Consumer Services | | | 47 | | | | 12,004 | | | | 3.8 | % | | | 720 | | | | 2.4 | % |
Packaged Foods & Meats | | | 6 | | | | 11,390 | | | | 3.6 | % | | | 1,130 | | | | 3.7 | % |
Metal & Glass Containers | | | 8 | | | | 9,686 | | | | 3.1 | % | | | 2,206 | | | | 7.3 | % |
Healthcare Services | | | 18 | | | | 9,018 | | | | 2.9 | % | | | 515 | | | | 1.7 | % |
Home Furnishing Retail | | | 16 | | | | 8,696 | | | | 2.8 | % | | | 1,149 | | | | 3.8 | % |
Specialty Stores | | | 19 | | | | 8,279 | | | | 2.7 | % | | | 1,023 | | | | 3.4 | % |
Aerospace & Defense | | | 6 | | | | 7,825 | | | | 2.5 | % | | | 921 | | | | 3.0 | % |
Electronic Components | | | 2 | | | | 6,658 | | | | 2.1 | % | | | 466 | | | | 1.6 | % |
Air Freight & Logistics | | | 3 | | | | 6,516 | | | | 2.1 | % | | | 436 | | | | 1.5 | % |
General Merchandise Stores | | | 60 | | | | 6,090 | | | | 2.0 | % | | | 533 | | | | 1.8 | % |
Other (40 industries) | | | 90 | | | | 95,958 | | | | 30.6 | % | | | 11,617 | | | | 38.4 | % |
Untenanted properties | | | 6 | | | | — | | | | — | | | | 96 | | | | 0.3 | % |
Total | | | 684 | | | $ | 313,223 | | | | 100.0 | % | | | 30,230 | | | | 100.0 | % |
BROADSTONE NET LEASE, INC. | www.broadstone.com | © 2021 Broadstone Net Lease, LLC. All rights reserved. 23
Diversification: Geography
(unaudited, rent percentages based on ABR)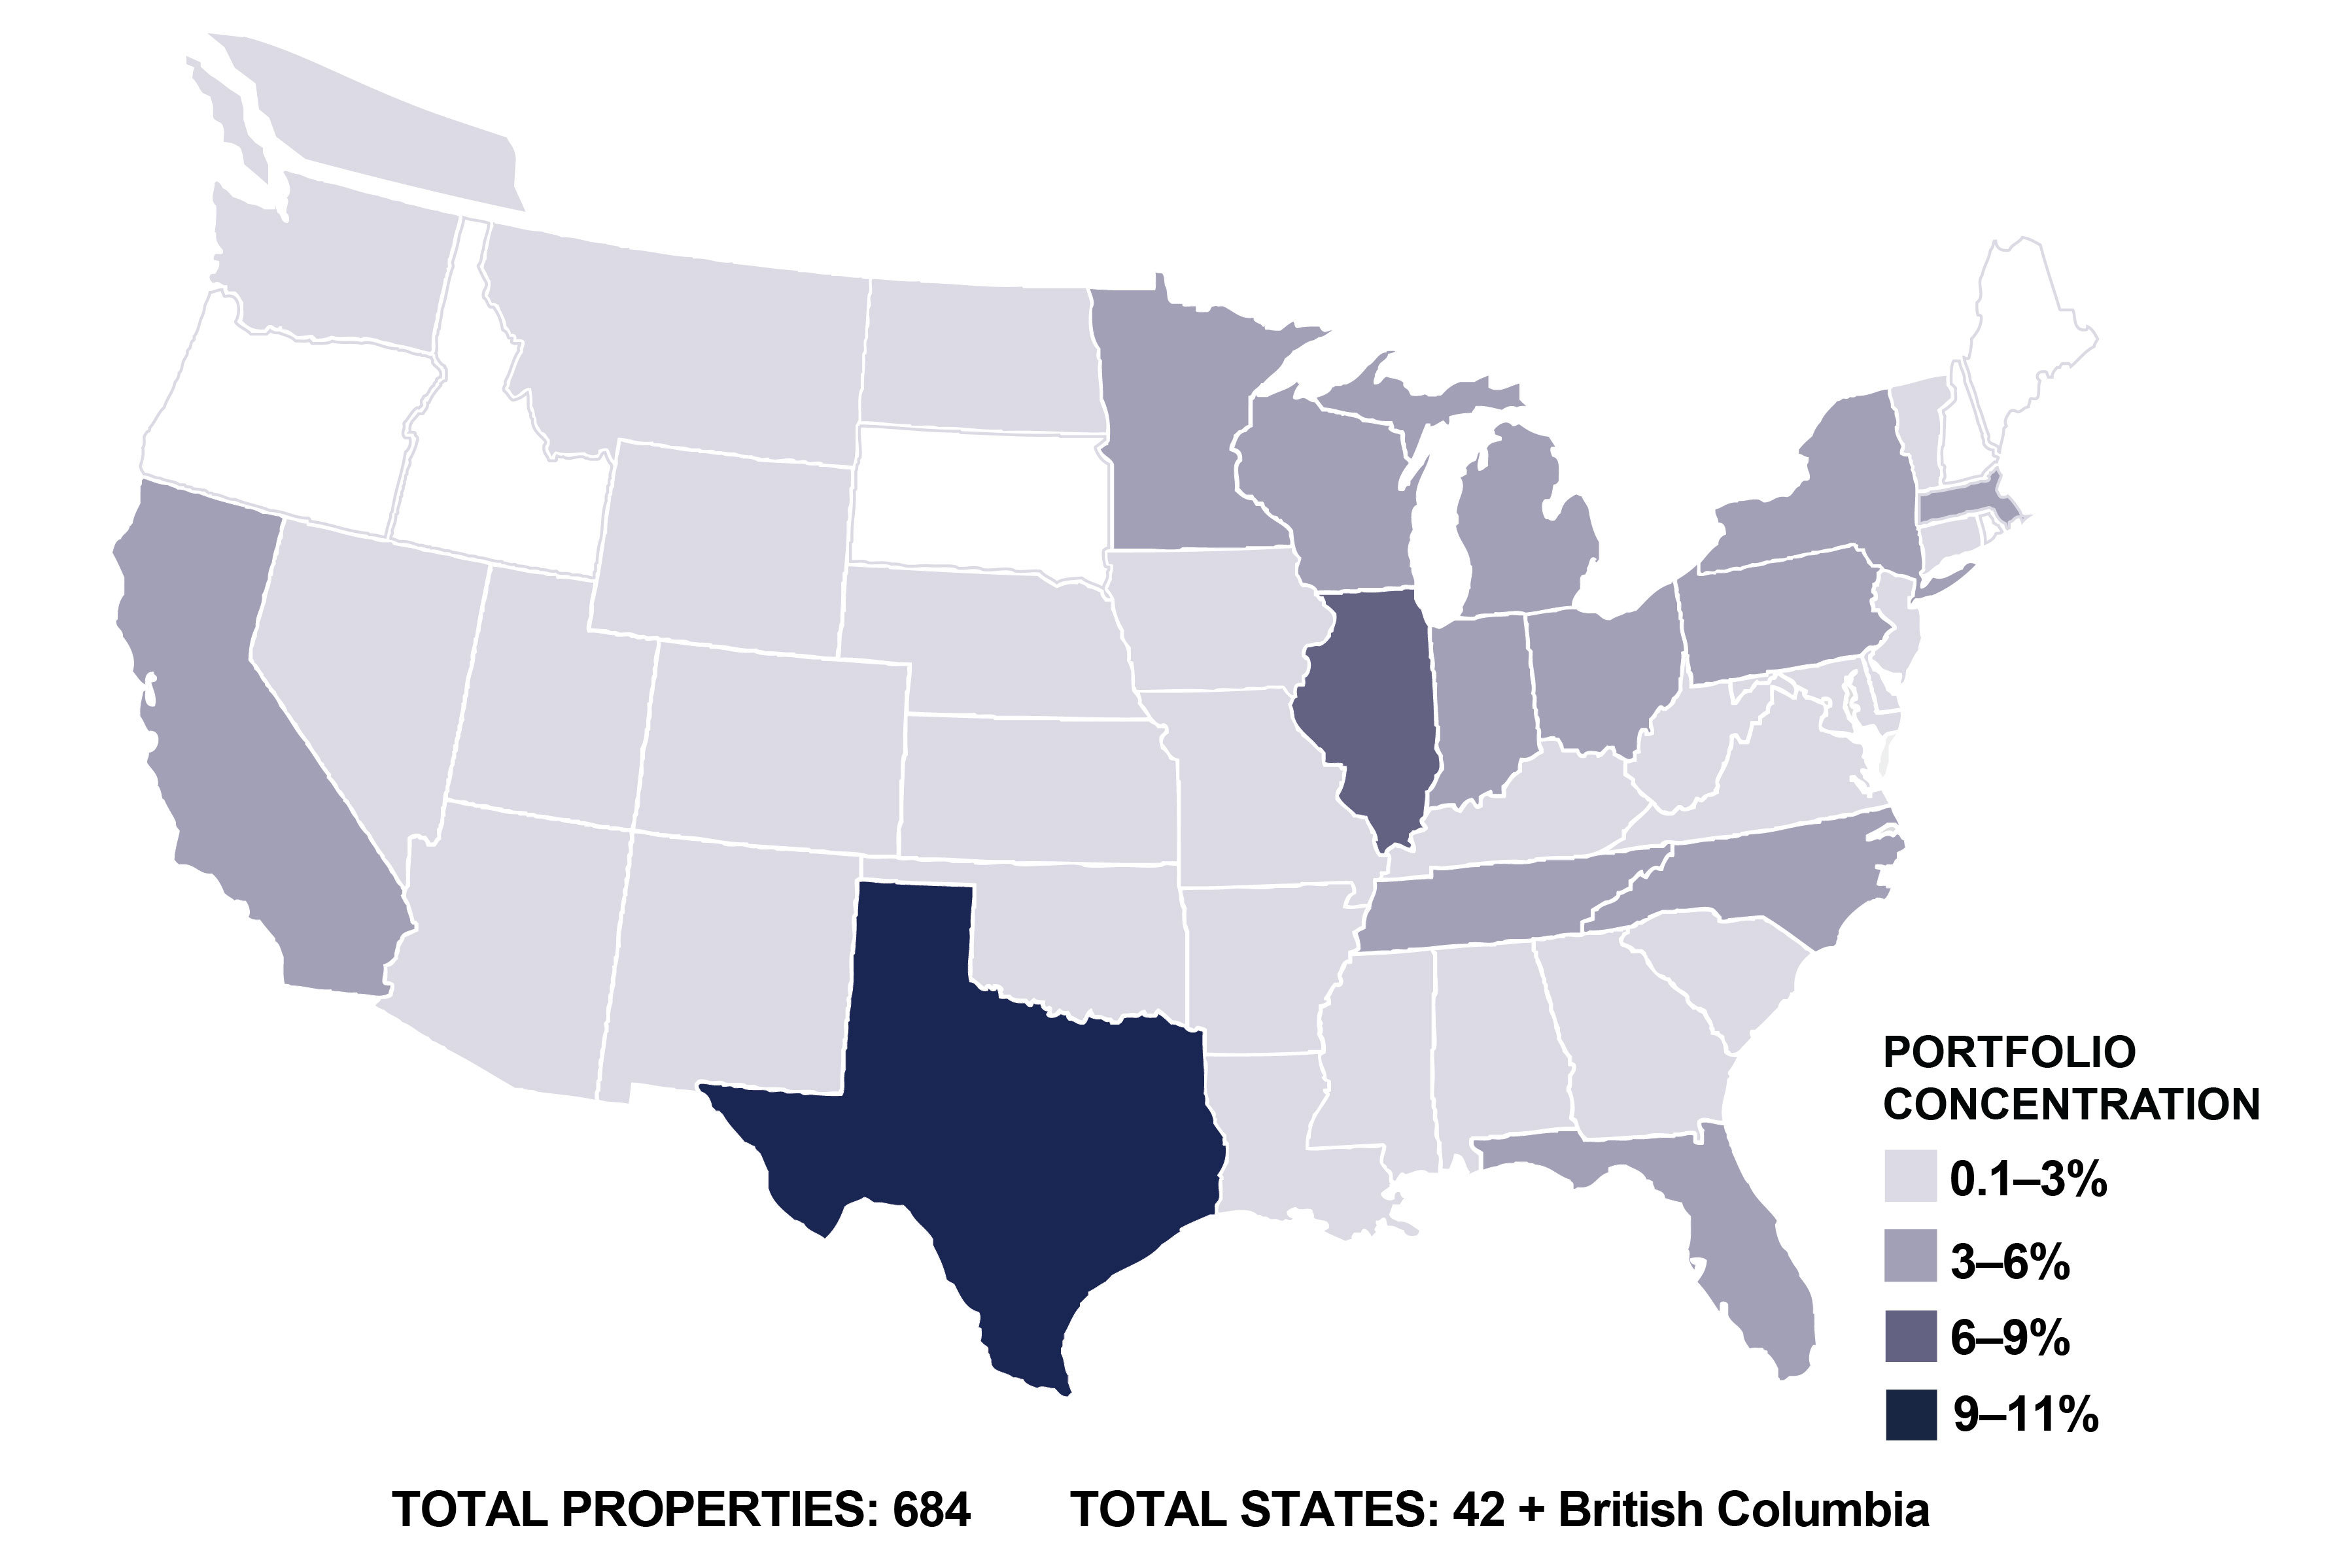
| | | | | | | | | | | | | | | | | | | | | | | | | | | | | | | | | | | | | | | | | | | |
State | | #
Properties | | | ABR
($'000s) | | | ABR as a
% of Total
Portfolio | | | Square Feet ('000s) | | | SF as a %
of Total
Portfolio | | | | State | | #
Properties | | | ABR
($'000s) | | | ABR as a
% of Total
Portfolio | | | Square Feet ('000s) | | | SF as a %
of Total
Portfolio | |
TX | | | 59 | | | $ | 32,074 | | | | 10.2 | % | | | 3,366 | | | | 11.1 | % | | | MO | | | 10 | | | $ | 4,781 | | | | 1.5 | % | | | 959 | | | | 3.2 | % |
IL | | | 26 | | | $ | 19,922 | | | | 6.4 | % | | | 1,991 | | | | 6.6 | % | | | WA | | | 15 | | | $ | 4,185 | | | | 1.3 | % | | | 150 | | | | 0.5 | % |
FL | | | 47 | | | $ | 16,345 | | | | 5.2 | % | | | 859 | | | | 2.8 | % | | | KY | | | 18 | | | $ | 4,110 | | | | 1.3 | % | | | 338 | | | | 1.1 | % |
CA | | | 11 | | | $ | 15,735 | | | | 5.0 | % | | | 1,554 | | | | 5.1 | % | | | LA | | | 3 | | | $ | 3,128 | | | | 1.0 | % | | | 175 | | | | 0.6 | % |
WI | | | 32 | | | $ | 15,655 | | | | 5.0 | % | | | 1,611 | | | | 5.3 | % | | | NE | | | 6 | | | $ | 2,967 | | | | 0.9 | % | | | 509 | | | | 1.7 | % |
MI | | | 35 | | | $ | 14,762 | | | | 4.7 | % | | | 1,439 | | | | 4.8 | % | | | MD | | | 4 | | | $ | 2,903 | | | | 0.9 | % | | | 293 | | | | 1.0 | % |
OH | | | 34 | | | $ | 14,149 | | | | 4.5 | % | | | 1,364 | | | | 4.5 | % | | | NM | | | 8 | | | $ | 2,764 | | | | 0.9 | % | | | 96 | | | | 0.3 | % |
NC | | | 35 | | | $ | 12,810 | | | | 4.1 | % | | | 1,308 | | | | 4.3 | % | | | MS | | | 8 | | | $ | 2,736 | | | | 0.9 | % | | | 334 | | | | 1.1 | % |
MN | | | 21 | | | $ | 12,761 | | | | 4.1 | % | | | 2,029 | | | | 6.7 | % | | | IA | | | 4 | | | $ | 2,704 | | | | 0.9 | % | | | 622 | | | | 2.1 | % |
IN | | | 29 | | | $ | 12,690 | | | | 4.0 | % | | | 1,759 | | | | 5.8 | % | | | SC | | | 13 | | | $ | 2,466 | | | | 0.8 | % | | | 308 | | | | 1.0 | % |
PA | | | 16 | | | $ | 10,923 | | | | 3.5 | % | | | 1,416 | | | | 4.7 | % | | | WV | | | 16 | | | $ | 2,456 | | | | 0.8 | % | | | 109 | | | | 0.4 | % |
TN | | | 43 | | | $ | 10,694 | | | | 3.4 | % | | | 516 | | | | 1.7 | % | | | UT | | | 3 | | | $ | 2,328 | | | | 0.7 | % | | | 280 | | | | 0.9 | % |
NY | | | 26 | | | $ | 10,532 | | | | 3.4 | % | | | 680 | | | | 2.3 | % | | | CT | | | 2 | | | $ | 1,690 | | | | 0.5 | % | | | 55 | | | | 0.2 | % |
MA | | | 5 | | | $ | 10,286 | | | | 3.3 | % | | | 1,026 | | | | 3.4 | % | | | MT | | | 7 | | | $ | 1,544 | | | | 0.5 | % | | | 43 | | | | 0.1 | % |
AZ | | | 8 | | | $ | 8,553 | | | | 2.7 | % | | �� | 761 | | | | 2.5 | % | | | CO | | | 3 | | | $ | 1,434 | | | | 0.5 | % | | | 94 | | | | 0.3 | % |
AL | | | 44 | | | $ | 7,981 | | | | 2.5 | % | | | 186 | | | | 0.6 | % | | | NV | | | 2 | | | $ | 1,311 | | | | 0.4 | % | | | 81 | | | | 0.3 | % |
AR | | | 11 | | | $ | 7,385 | | | | 2.4 | % | | | 282 | | | | 0.9 | % | | | DE | | | 4 | | | $ | 1,124 | | | | 0.4 | % | | | 133 | | | | 0.4 | % |
GA | | | 21 | | | $ | 7,334 | | | | 2.3 | % | | | 1,056 | | | | 3.5 | % | | | ND | | | 2 | | | $ | 933 | | | | 0.3 | % | | | 28 | | | | 0.1 | % |
OK | | | 20 | | | $ | 7,080 | | | | 2.3 | % | | | 944 | | | | 3.1 | % | | | WY | | | 1 | | | $ | 307 | | | | 0.1 | % | | | 21 | | | | 0.1 | % |
VA | | | 17 | | | $ | 5,364 | | | | 1.7 | % | | | 204 | | | | 0.7 | % | | | VT | | | 1 | | | $ | 305 | | | | 0.1 | % | | | 15 | | | | 0.1 | % |
KS | | | 10 | | | $ | 4,925 | | | | 1.6 | % | | | 639 | | | | 2.1 | % | | | Total US | | | 683 | | | $ | 309,036 | | | | 98.6 | % | | | 29,999 | | | | 99.2 | % |
NJ | | | 3 | | | $ | 4,900 | | | | 1.6 | % | | | 366 | | | | 1.2 | % | | | Total Canada | | | 1 | | | | 4,187 | | | | 1.4 | % | | | 231 | | | | 0.8 | % |
| | | | | | | | | | | | | | | | | | Grand Total | | | 684 | | | $ | 313,223 | | | | 100.0 | % | | | 30,230 | | | | 100.0 | % |
BROADSTONE NET LEASE, INC. | www.broadstone.com | © 2021 Broadstone Net Lease, LLC. All rights reserved. 24
Lease Expirations
(unaudited, rent percentages based on ABR) 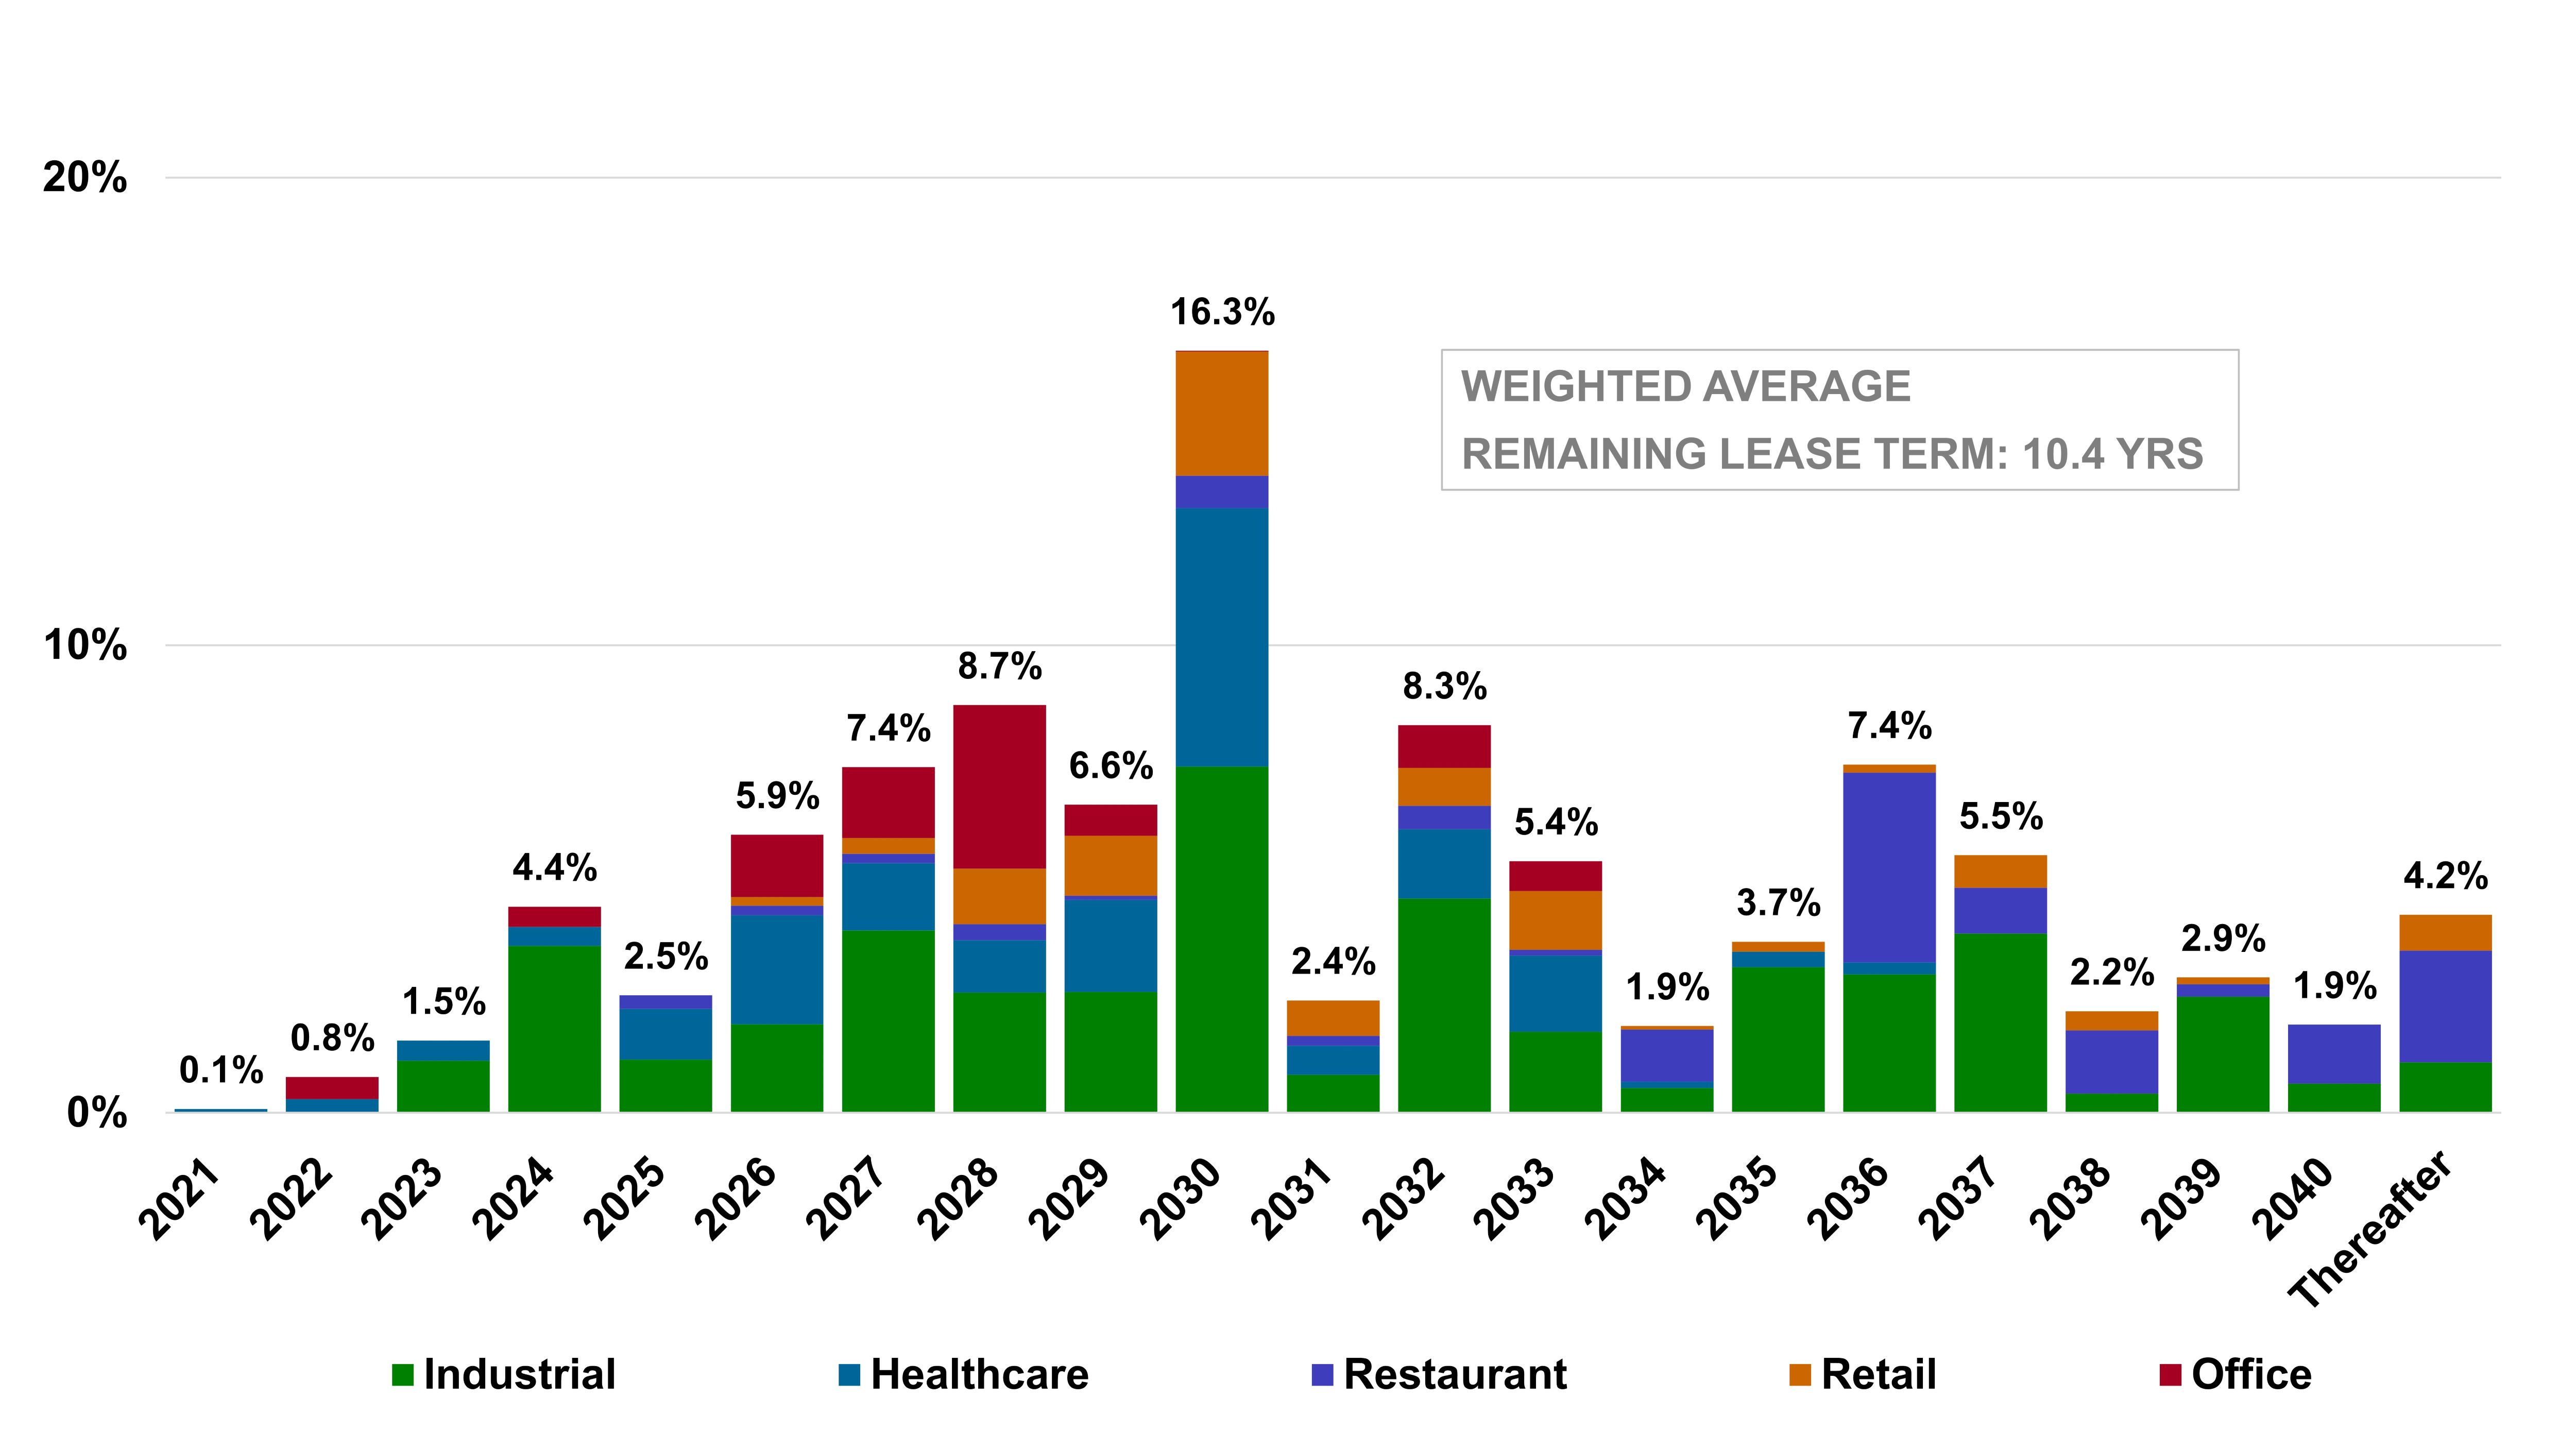
| | | | | | | | | | | | | | | | | | | | |
Expiration Year | | # Properties | | | ABR
($'000s) | | | ABR as a % of Total Portfolio | | | Square Feet ('000s) | | | SF as a % of Total Portfolio | |
2021 | | | 2 | | | $ | 294 | | | | 0.1 | % | | | 37 | | | | 0.1 | % |
2022 | | | 3 | | | | 2,410 | | | | 0.8 | % | | | 85 | | | | 0.3 | % |
2023 | | | 6 | | | | 4,848 | | | | 1.5 | % | | | 515 | | | | 1.7 | % |
2024 | | | 11 | | | | 13,811 | | | | 4.4 | % | | | 1,689 | | | | 5.6 | % |
2025 | | | 19 | | | | 7,872 | | | | 2.5 | % | | | 682 | | | | 2.3 | % |
2026 | | | 34 | | | | 18,626 | | | | 5.9 | % | | | 1,404 | | | | 4.6 | % |
2027 | | | 27 | | | | 23,148 | | | | 7.4 | % | | | 2,010 | | | | 6.7 | % |
2028 | | | 36 | | | | 27,307 | | | | 8.7 | % | | | 2,746 | | | | 9.1 | % |
2029 | | | 66 | | | | 20,638 | | | | 6.6 | % | | | 2,647 | | | | 8.8 | % |
2030 | | | 96 | | | | 51,029 | | | | 16.3 | % | | | 5,030 | | | | 16.6 | % |
2031 | | | 23 | | | | 7,527 | | | | 2.4 | % | | | 737 | | | | 2.4 | % |
2032 | | | 44 | | | | 25,963 | | | | 8.3 | % | | | 3,014 | | | | 10.0 | % |
2033 | | | 42 | | | | 16,858 | | | | 5.4 | % | | | 1,717 | | | | 5.7 | % |
2034 | | | 32 | | | | 5,817 | | | | 1.9 | % | | | 376 | | | | 1.2 | % |
2035 | | | 16 | | | | 11,461 | | | | 3.7 | % | | | 1,552 | | | | 5.1 | % |
2036 | | | 82 | | | | 23,320 | | | | 7.4 | % | | | 2,506 | | | | 8.3 | % |
2037 | | | 24 | | | | 17,256 | | | | 5.5 | % | | | 1,367 | | | | 4.5 | % |
2038 | | | 33 | | | | 6,805 | | | | 2.2 | % | | | 306 | | | | 1.0 | % |
2039 | | | 12 | | | | 9,066 | | | | 2.9 | % | | | 933 | | | | 3.1 | % |
2040 | | | 33 | | | | 5,906 | | | | 1.9 | % | | | 317 | | | | 1.1 | % |
Thereafter | | | 37 | | | | 13,261 | | | | 4.2 | % | | | 464 | | | | 1.5 | % |
Untenanted properties | | | 6 | | | | — | | | | — | | | | 96 | | | | 0.3 | % |
Total | | | 684 | | | $ | 313,223 | | | | 100.0 | % | | | 30,230 | | | | 100.0 | % |
BROADSTONE NET LEASE, INC. | www.broadstone.com | © 2021 Broadstone Net Lease, LLC. All rights reserved. 25
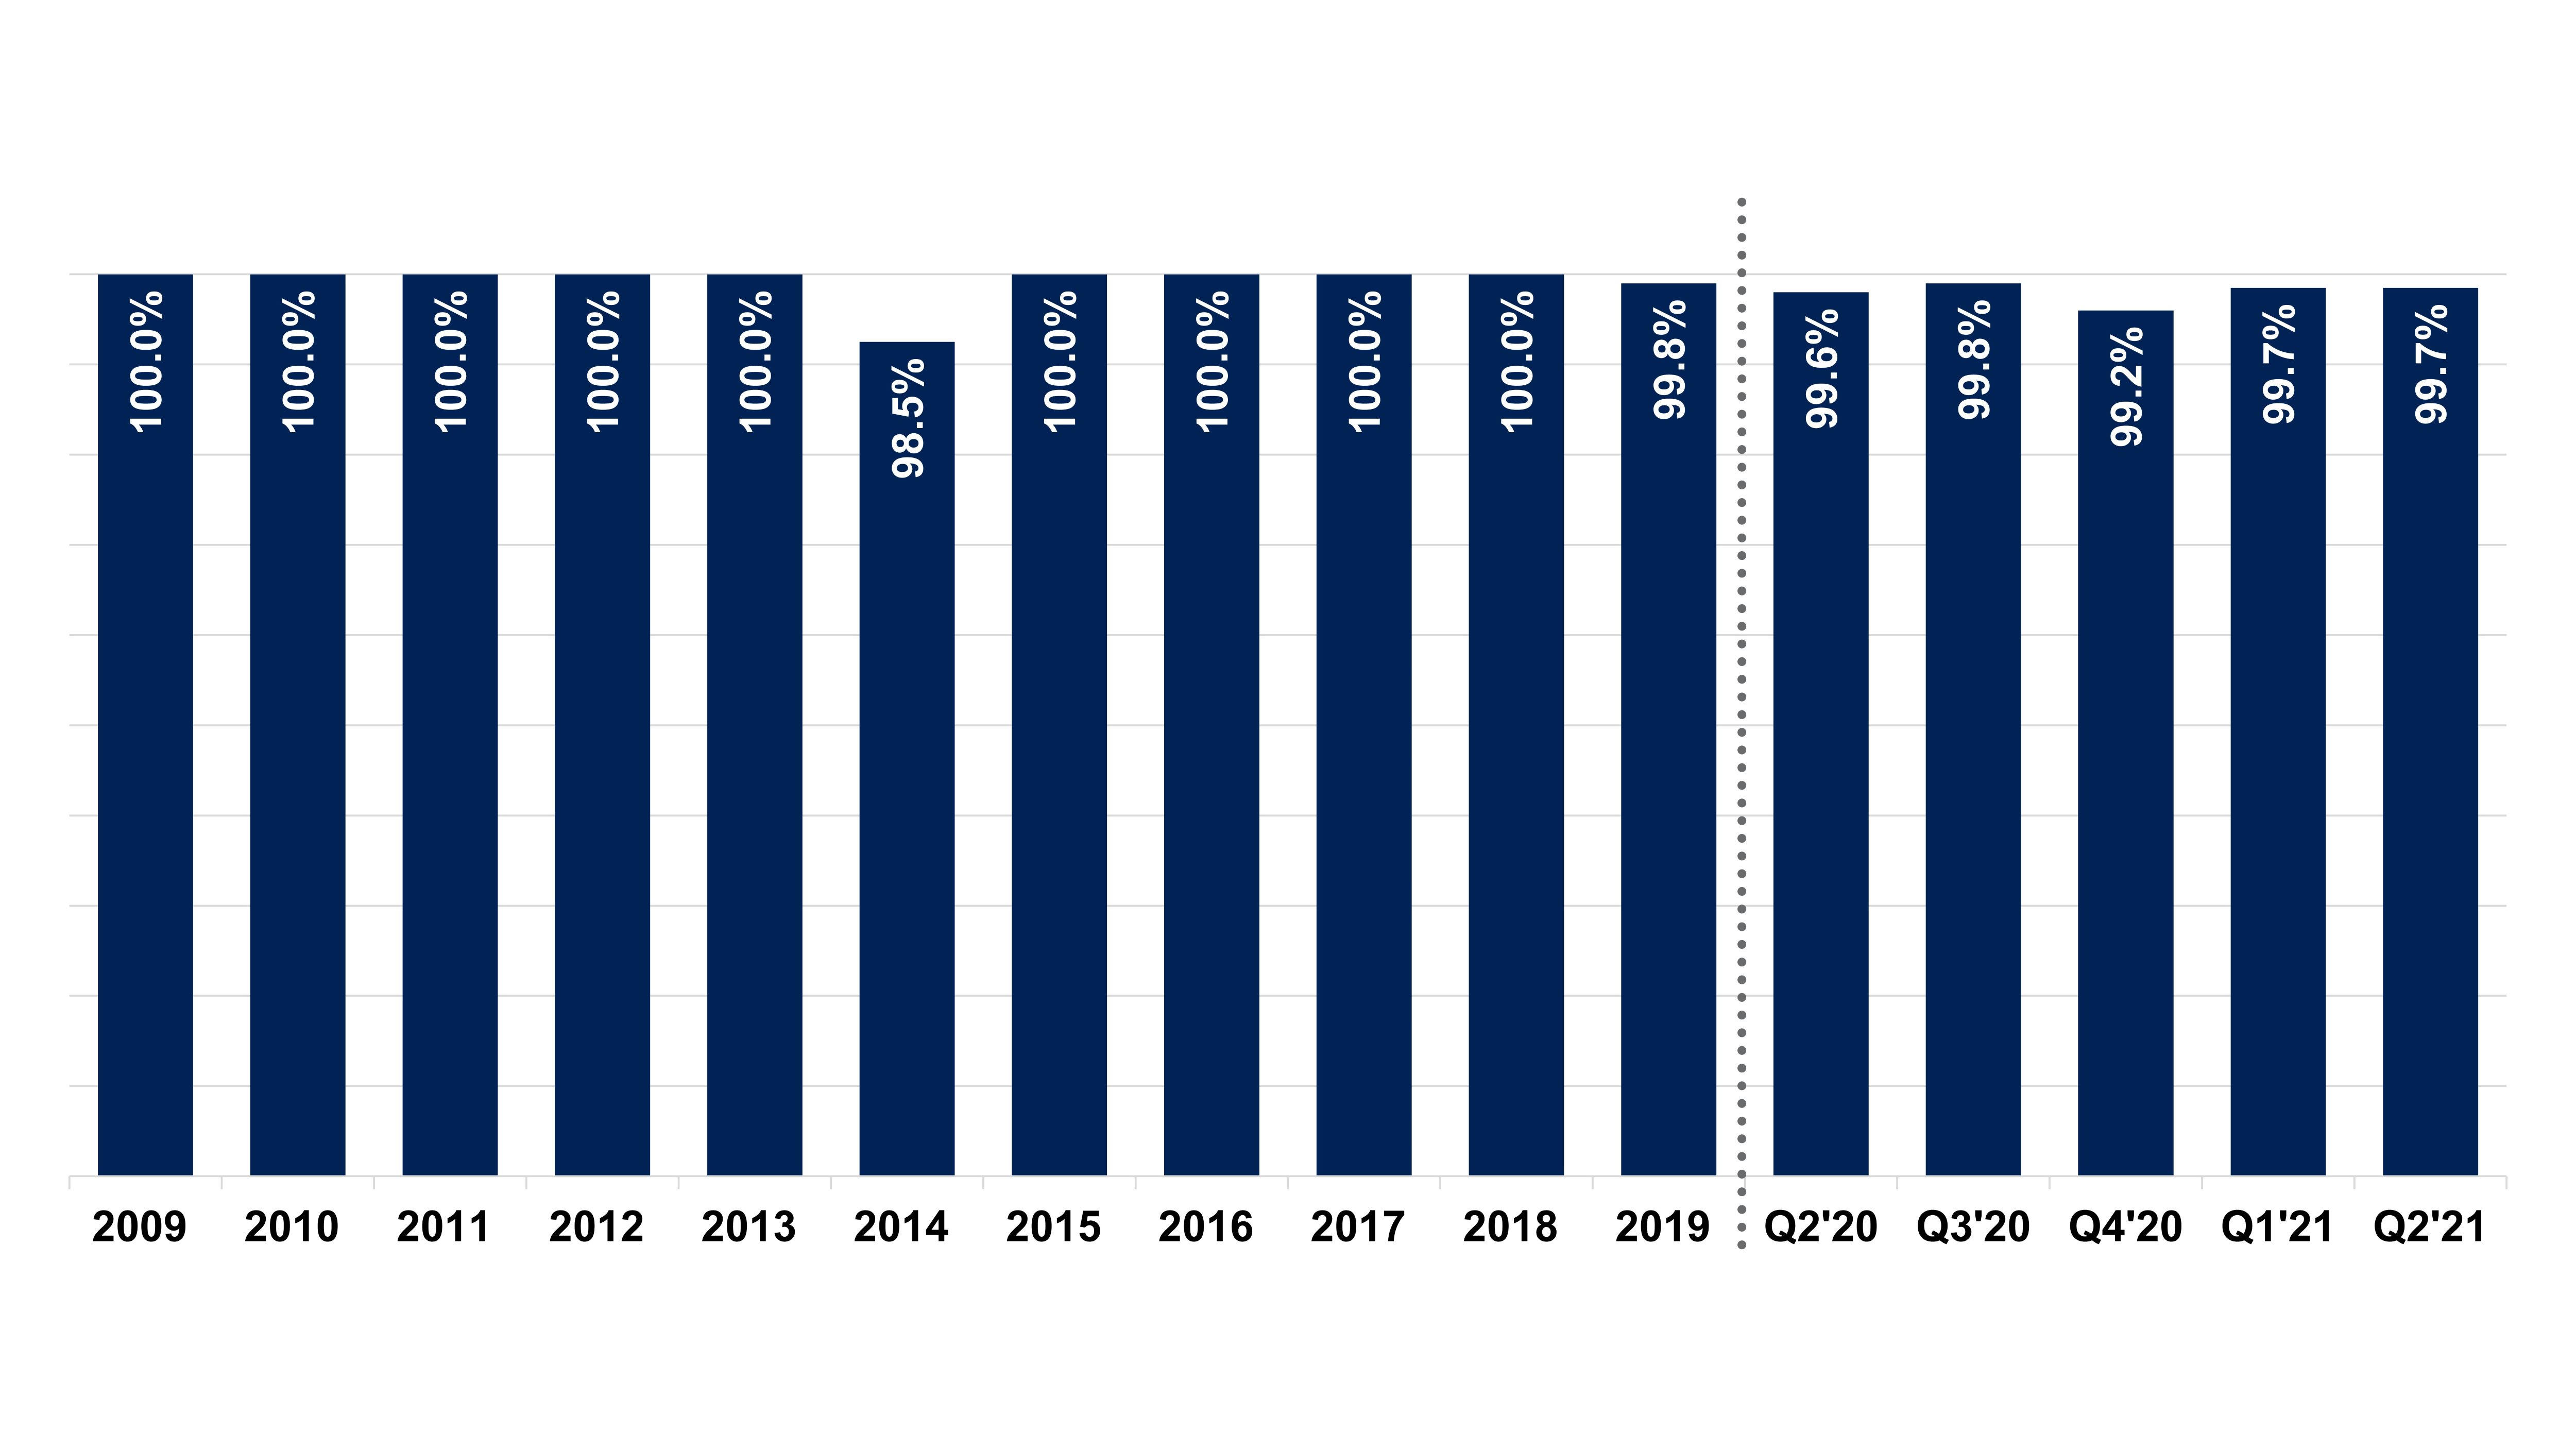
Portfolio Occupancy
(unaudited, based on square feet)
BROADSTONE NET LEASE, INC. | www.broadstone.com | © 2021 Broadstone Net Lease, LLC. All rights reserved. 26
Definitions and Explanations
Adjusted NOI, Annualized Adjusted NOI, Adjusted Cash NOI and Annualized Adjusted Cash NOI: Our reported results and net earnings per diluted share are presented in accordance with accounting principles generally accepted in the United States of America (GAAP). Adjusted NOI and Adjusted Cash NOI are non-GAAP financial measures that we believe are useful to assess property-level performance. We compute Adjusted NOI by adjusting Adjusted EBITDAre (defined below) to exclude general and administrative expenses incurred at the corporate level. Given the net lease nature of our portfolio, we do not incur general and administrative expenses at the property level. To compute Adjusted Cash NOI, we adjust Adjusted NOI to exclude non-cash items included in total revenues and property expenses, such as straight-line rental revenue and other amortization and non-cash items, based on an estimate calculated as if all investment and disposition activity that took place during the quarter had occurred on the first day of the quarter. We then annualize quarterly Adjusted NOI and Adjusted Cash NOI by multiplying each amount by four to compute Annualized Adjusted NOI and Annualized Adjusted Cash NOI, respectively, which are also non-GAAP financial measures. We believe Adjusted NOI and Adjusted Cash NOI provide useful and relevant information because they reflect only those income and expense items that are incurred at the property level and present such items on an unlevered basis. We believe that the exclusion of certain non-cash revenues and expenses from Adjusted Cash NOI is a useful supplemental measure for investors to consider because it will help them to better assess our operating performance without the distortions created by non-cash revenues or expenses. You should not unduly rely on Annualized Adjusted NOI and Annualized Adjusted Cash NOI as they are based on assumptions and estimates that may prove to be inaccurate. Our actual reported Adjusted NOI and Adjusted Cash NOI for future periods may be significantly different from our Annualized Adjusted NOI and Annualized Adjusted Cash NOI. Additionally, our computation of Adjusted NOI and Adjusted Cash NOI may differ from the methodology for calculating these metrics used by companies in our industry, and, therefore, may not be comparable to similarly titled measures reported by other companies.
Annualized Base Rent (ABR): We define ABR as the annualized contractual cash rent due for the last month of the reporting period, excluding the impacts of the short-term rent deferrals and abatements agreed to as a result of tenant requests for rent relief related to the COVID-19 pandemic, and adjusted to remove rent from properties sold during the month and to include a full month of contractual cash rent for properties acquired during the last month.
Cash Cap Rate: Cash Cap Rate represents the estimated first year cash yield to be generated on a real estate investment property, which was estimated at the time of investment based on the contractually specified cash base rent for the first full year after the date of the investment, divided by the purchase price for the property.
EBITDA, EBITDAre, Adjusted EBITDAre and Annualized Adjusted EBITDAre: EBITDA, EBITDAre, Adjusted EBITDAre and Annualized Adjusted EBITDAre are non-GAAP financial measures. We compute EBITDA as earnings before interest, income taxes and depreciation and amortization. EBITDA is a measure commonly used in our industry. We believe that this ratio provides investors and analysts with a measure of our performance that includes our operating results unaffected by the differences in capital structures, capital investment cycles and useful life of related assets compared to other companies in our industry. We compute EBITDAre in accordance with the definition adopted by Nareit. Nareit defines EBITDAre as EBITDA excluding gains (loss) from the sales of depreciable property and provisions for impairment on investment in real estate. We believe EBITDA and EBITDAre are useful to investors and analysts because they provide important supplemental information about our operating performance exclusive of certain non-cash and other costs. Adjusted EBITDAre represents EBITDAre, adjusted to reflect revenue producing acquisitions and dispositions for the quarter as if such acquisitions and dispositions had occurred as of the beginning of the quarter, and to exclude certain GAAP income and expense amounts that are either non-cash, such as cost of debt extinguishments or the change in fair value of our earnout liability, or that we believe are one time, or unusual in nature because they relate to unique circumstances or transactions that had not previously occurred and which we do not anticipate occurring in the future, and to eliminate the impact of lease termination fees, and other items that are not a result of normal operations. We then annualize quarterly Adjusted EBITDAre by multiplying it by four to compute Annualized Adjusted EBITDAre. Our reported EBITDA, EBITDAre, Adjusted EBITDAre and Annualized Adjusted EBITDAre may not be comparable to similarly titled measures of other companies. You should not consider these measures as alternatives to net income or cash flows from operating activities determined in accordance with GAAP.
Funds From Operations (FFO) and Adjusted Funds From Operations (AFFO): FFO and AFFO are non-GAAP measures. We believe the use of FFO and AFFO are useful to investors because they are widely accepted industry measures used by analysts and investors to compare the operating performance of REITs. FFO and AFFO should not be considered alternatives to net income as a performance measure or to cash flows from operations, as reported on our statement of cash flows, or as a liquidity measure and should be considered in addition to, and not in lieu of, GAAP financial measures. We compute FFO in accordance with the standards established by Nareit, which defines FFO as GAAP net income or loss adjusted to exclude net gains (losses) from sales of certain depreciated real estate assets, depreciation and amortization expense from real estate assets, gains and losses from change in control, and impairment charges related to certain previously depreciated real estate assets. To derive AFFO, we modify the Nareit computation of FFO to include other adjustments to GAAP net income related to certain non-cash and non-recurring revenues and expenses, including straight-line rents, the change in fair value of our earnout liability, cost of debt extinguishments, amortization of lease intangibles, amortization of debt issuance costs, amortization of net mortgage premiums, (gain) loss on interest rate swaps and other non-cash interest expense, realized gains or losses on foreign currency transactions, internalization expenses, stock based compensation, severance, extraordinary items, and other specified non-cash items. We believe excluding such items assists management and investors in distinguishing whether changes in our operations are due to growth or decline of operations at our properties or from other factors.
BROADSTONE NET LEASE, INC. | www.broadstone.com | © 2021 Broadstone Net Lease, LLC. All rights reserved. 27
Definitions and Explanations (continued)
Gross Debt: We define Gross Debt as total debt plus deferred financing costs.
Net Debt: Net Debt is a non-GAAP financial measure. We define Net Debt as our Gross Debt less cash and cash equivalents and restricted cash.
Occupancy: Occupancy or a specified percentage of our portfolio that is “occupied” means as of a specified date the quotient of (1) the total rentable square footage of our properties minus the square footage of our properties that are vacant and from which we are not receiving any rental payment, and (2) the total square footage of our properties.
Rent Coverage Ratio: Rent Coverage Ratio means the ratio of tenant-reported or, when available, management’s estimate, based on tenant-reported financial information, of annual earnings before interest, taxes, depreciation, amortization, and cash rent attributable to the leased property (or properties, in the case of a master lease) to the annualized base rental obligation as of a specified date.
BROADSTONE NET LEASE, INC. | www.broadstone.com | © 2021 Broadstone Net Lease, LLC. All rights reserved. 28