UNITED STATES
SECURITIES AND EXCHANGE COMMISSION
WASHINGTON, D.C. 20549
FORM 10-Q
☒ Quarterly report pursuant to Section 13 or 15(d) of the Securities Exchange Act of 1934
For the quarterly period ended June 30, 2024, or
☐ Transition report pursuant to section 13 or 15(d) of the Securities Exchange Act of 1934
Commission File Number 001-39529
BROADSTONE NET LEASE, INC.
(Exact name of registrant as specified in its charter)
| |
Maryland | 26-1516177 |
(State or other jurisdiction of
incorporation or organization) | (I.R.S. Employer
Identification No.) |
| |
207 High Point Drive Suite 300 Victor, New York | 14564 |
(Address of principal executive offices) | (Zip Code) |
(585) 287-6500
(Registrant’s telephone number, including area code)
Securities registered pursuant to Section 12(b) of the Act:
| | | | |
Title of each class | | Trading Symbol(s) | | Name of each exchange on which registered |
Common Stock, $0.00025 par value | | BNL | | The New York Stock Exchange |
Indicate by check mark whether the registrant (1) has filed all reports required to be filed by Section 13 or 15 (d) of the Securities Exchange Act of 1934 during the preceding 12 months (or for such shorter period that the registrant was required to file such reports), and (2) has been subject to such filing requirements for the past 90 days. Yes ☒ No ☐
Indicate by check mark whether the registrant has submitted electronically every Interactive Data File required to be submitted pursuant to Rule 405 of Regulation S-T (§232.405 of this chapter) during the preceding 12 months (or for such shorter period that the registrant was required to submit such files). Yes ☒ No ☐
Indicate by check mark whether the registrant is a large accelerated filer, an accelerated filer, a non-accelerated filer, a smaller reporting company, or an emerging growth company. See the definitions of “large accelerated filer,” “accelerated filer,” “smaller reporting company,” and “emerging growth company” in Rule 12b-2 of the Exchange Act.
| | | | | | |
Large accelerated filer |
| ☒ |
| Accelerated filer |
| ☐ |
Non-accelerated filer |
| ☐ |
| Smaller reporting company |
| ☐ |
Emerging growth company | | ☐ | | | | |
If an emerging growth company, indicate by check mark if the registrant has elected not to use the extended transition period for complying with any new or revised financial accounting standards provided pursuant to Section 13(a) of the Exchange Act. ☐
Indicate by check mark whether the registrant is a shell company (as defined in Rule 12b-2 of the Exchange Act). Yes ☐ No ☒
There were 188,517,485 shares of the Registrants’ Common Stock, $0.00025 par value per share, outstanding as of July 29, 2024.
BROADSTONE NET LEASE, INC.
TABLE OF CONTENTS
Part I. FINANCIAL INFORMATION
Item 1. Financial Statements
Broadstone Net Lease, Inc. and Subsidiaries
Condensed Consolidated Balance Sheets
(Unaudited)
(in thousands, except per share amounts)
| | | | | | | | |
| | June 30,
2024 | | | December 31,
2023 | |
Assets | | | | | | |
Accounted for using the operating method: | | | | | | |
Land | | $ | 773,224 | | | $ | 748,529 | |
Land improvements | | | 324,138 | | | | 328,746 | |
Buildings and improvements | | | 3,708,366 | | | | 3,803,156 | |
Equipment | | | 8,248 | | | | 8,265 | |
Total accounted for using the operating method | | | 4,813,976 | | | | 4,888,696 | |
Less accumulated depreciation | | | (627,871 | ) | | | (626,597 | ) |
Accounted for using the operating method, net | | | 4,186,105 | | | | 4,262,099 | |
Accounted for using the direct financing method | | | 26,413 | | | | 26,643 | |
Accounted for using the sales-type method | | | 572 | | | | 572 | |
Property under development | | | 165,014 | | | | 94,964 | |
Investment in rental property, net | | | 4,378,104 | | | | 4,384,278 | |
Cash and cash equivalents | | | 18,282 | | | | 19,494 | |
Accrued rental income | | | 153,551 | | | | 152,724 | |
Tenant and other receivables, net | | | 2,604 | | | | 1,487 | |
Prepaid expenses and other assets | | | 33,255 | | | | 36,661 | |
Interest rate swap, assets | | | 56,444 | | | | 46,096 | |
Goodwill | | | 339,769 | | | | 339,769 | |
Intangible lease assets, net | | | 282,548 | | | | 288,226 | |
Total assets | | $ | 5,264,557 | | | $ | 5,268,735 | |
| | | | | | |
Liabilities and equity | | | | | | |
Unsecured revolving credit facility | | $ | 79,096 | | | $ | 90,434 | |
Mortgages, net | | | 77,970 | | | | 79,068 | |
Unsecured term loans, net | | | 896,574 | | | | 895,947 | |
Senior unsecured notes, net | | | 845,687 | | | | 845,309 | |
Accounts payable and other liabilities | | | 42,635 | | | | 47,534 | |
Dividends payable | | | 58,028 | | | | 56,869 | |
Accrued interest payable | | | 14,033 | | | | 5,702 | |
Intangible lease liabilities, net | | | 53,124 | | | | 53,531 | |
Total liabilities | | | 2,067,147 | | | | 2,074,394 | |
| | | | | | |
Commitments and contingencies (Note 16) | | | | | | |
| | | | | | |
Equity | | | | | | |
Broadstone Net Lease, Inc. equity: | | | | | | |
Preferred stock, $0.001 par value; 20,000 shares authorized, no shares issued or outstanding | | | — | | | | — | |
Common stock, $0.00025 par value; 500,000 shares authorized, 188,517 and 187,614 shares issued
and outstanding at June 30, 2024 and December 31, 2023, respectively | | | 47 | | | | 47 | |
Additional paid-in capital | | | 3,444,265 | | | | 3,440,639 | |
Cumulative distributions in excess of retained earnings | | | (449,893 | ) | | | (440,731 | ) |
Accumulated other comprehensive income | | | 60,383 | | | | 49,286 | |
Total Broadstone Net Lease, Inc. equity | | | 3,054,802 | | | | 3,049,241 | |
Non-controlling interests | | | 142,608 | | | | 145,100 | |
Total equity | | | 3,197,410 | | | | 3,194,341 | |
Total liabilities and equity | | $ | 5,264,557 | | | $ | 5,268,735 | |
The accompanying notes are an integral part of these condensed consolidated financial statements.
Broadstone Net Lease, Inc. and Subsidiaries
Condensed Consolidated Statements of Income and Comprehensive Income
(Unaudited)
(in thousands, except per share amounts)
| | | | | | | | | | | | | | | | |
| | For the Three Months Ended
June 30, | | | For the Six Months Ended
June 30, | |
| | 2024 | | | 2023 | | | 2024 | | | 2023 | |
Revenues | | | | | | | | | | | | |
Lease revenues, net | | $ | 105,907 | | | $ | 109,353 | | | $ | 211,274 | | | $ | 228,345 | |
| | | | | | | | | | | | |
Operating expenses | | | | | | | | | | | | |
Depreciation and amortization | | | 37,404 | | | | 39,031 | | | | 75,176 | | | | 80,815 | |
Property and operating expense | | | 5,303 | | | | 4,988 | | | | 10,963 | | | | 10,874 | |
General and administrative | | | 9,904 | | | | 9,483 | | | | 19,336 | | | | 19,899 | |
Provision for impairment of investment in rental properties | | | 3,852 | | | | — | | | | 30,252 | | | | 1,473 | |
Total operating expenses | | | 56,463 | | | | 53,502 | | | | 135,727 | | | | 113,061 | |
| | | | | | | | | | | | |
Other income (expenses) | | | | | | | | | | | | |
Interest income | | | 649 | | | | 82 | | | | 882 | | | | 244 | |
Interest expense | | | (17,757 | ) | | | (20,277 | ) | | | (36,334 | ) | | | (41,416 | ) |
Gain on sale of real estate | | | 3,384 | | | | 29,462 | | | | 62,515 | | | | 32,877 | |
Income taxes | | | (531 | ) | | | (448 | ) | | | (939 | ) | | | (927 | ) |
Other income (expenses) | | | 748 | | | | (1,674 | ) | | | 2,443 | | | | (1,692 | ) |
Net income | | | 35,937 | | | | 62,996 | | | | 104,114 | | | | 104,370 | |
Net income attributable to non-controlling interests | | | (608 | ) | | | (2,982 | ) | | | (3,671 | ) | | | (5,052 | ) |
Net income attributable to Broadstone Net Lease, Inc. | | $ | 35,329 | | | $ | 60,014 | | | $ | 100,443 | | | $ | 99,318 | |
| | | | | | | | | | | | |
Weighted average number of common shares outstanding | | | | | | | | | | | | |
Basic | | | 187,436 | | | | 186,733 | | | | 187,363 | | | | 186,433 | |
Diluted | | | 196,470 | | | | 196,228 | | | | 196,379 | | | | 196,148 | |
Net earnings per share attributable to common stockholders | | | | | | | | | | | | |
Basic and diluted | | $ | 0.19 | | | $ | 0.32 | | | $ | 0.53 | | | $ | 0.53 | |
| | | | | | | | | | | | |
Comprehensive income | | | | | | | | | | | | |
Net income | | $ | 35,937 | | | $ | 62,996 | | | $ | 104,114 | | | $ | 104,370 | |
Other comprehensive income | | | | | | | | | | | | |
Change in fair value of interest rate swaps | | | (1,456 | ) | | | 19,652 | | | | 10,348 | | | | 1,753 | |
Realized loss on interest rate swaps | | | 62 | | | | 522 | | | | 221 | | | | 1,044 | |
Comprehensive income | | | 34,543 | | | | 83,170 | | | | 114,683 | | | | 107,167 | |
Comprehensive income attributable to non-controlling interests | | | (546 | ) | | | (3,937 | ) | | | (4,146 | ) | | | (5,138 | ) |
Comprehensive income attributable to Broadstone Net Lease, Inc. | | $ | 33,997 | | | $ | 79,233 | | | $ | 110,537 | | | $ | 102,029 | |
The accompanying notes are an integral part of these condensed consolidated financial statements.
Broadstone Net Lease, Inc. and Subsidiaries
Condensed Consolidated Statements of Equity
(Unaudited)
(in thousands, except per share amounts)
| | | | | | | | | | | | | | | | | | | | | | | | |
| | Common
Stock | | | Additional
Paid-in
Capital | | | Cumulative
Distributions
in Excess of
Retained Earnings | | | Accumulated
Other
Comprehensive
Income | | | Non-
controlling
Interests | | | Total
Equity | |
Balance, January 1, 2024 | | $ | 47 | | | $ | 3,440,639 | | | $ | (440,731 | ) | | $ | 49,286 | | | $ | 145,100 | | | $ | 3,194,341 | |
Net income | | | — | | | | — | | | | 65,114 | | | | — | | | | 3,063 | | | | 68,177 | |
Issuance of 822 shares of common stock under equity incentive plan | | | — | | | | 116 | | | | — | | | | — | | | | — | | | | 116 | |
Offering costs, discounts, and commissions | | | — | | | | (36 | ) | | | — | | | | — | | | | — | | | | (36 | ) |
Stock-based compensation, net of 25 shares of restricted stock forfeited | | | — | | | | 1,475 | | | | — | | | | — | | | | — | | | | 1,475 | |
Retirement of 71 shares of common stock under equity incentive plan | | | — | | | | (1,040 | ) | | | — | | | | — | | | | — | | | | (1,040 | ) |
Conversion of 95 OP units to 95 shares of common stock | | | — | | | | 1,536 | | | | — | | | | — | | | | (1,536 | ) | | | — | |
Distributions declared ($0.285 per share and OP Unit) | | | — | | | | — | | | | (54,552 | ) | | | — | | | | (2,740 | ) | | | (57,292 | ) |
Change in fair value of interest rate swap agreements | | | — | | | | — | | | | — | | | | 11,274 | | | | 530 | | | | 11,804 | |
Realized loss on interest rate swap agreements | | | — | | | | — | | | | — | | | | 152 | | | | 7 | | | | 159 | |
Adjustment to non-controlling interests | | | — | | | | 4,220 | | | | — | | | | (3,878 | ) | | | (342 | ) | | | — | |
Balance, March 31, 2024 | | $ | 47 | | | $ | 3,446,910 | | | $ | (430,169 | ) | | $ | 56,834 | | | $ | 144,082 | | | $ | 3,217,704 | |
Net income | | | — | | | | — | | | | 35,329 | | | | — | | | | 608 | | | | 35,937 | |
Issuance of 55 shares of common stock under equity incentive plan | | | — | | | | — | | | | — | | | | — | | | | — | | | | — | |
Offering costs, discounts, and commissions | | | — | | | | (200 | ) | | | — | | | | — | | | | — | | | | (200 | ) |
Contributions from non-controlling interests | | | — | | | | — | | | | — | | | | — | | | | 1,000 | | | | 1,000 | |
Stock-based compensation, net of 5 shares of restricted stock forfeited | | | — | | | | 2,073 | | | | — | | | | — | | | | — | | | | 2,073 | |
Conversion of 32 OP units to 32 shares of common stock | | | — | | | | 532 | | | | — | | | | — | | | | (532 | ) | | | — | |
Distributions declared ($0.290 per share and OP Unit) | | | — | | | | — | | | | (55,053 | ) | | | — | | | | (2,657 | ) | | | (57,710 | ) |
Change in fair value of interest rate swap agreements | | | — | | | | — | | | | — | | | | (1,391 | ) | | | (65 | ) | | | (1,456 | ) |
Realized loss on interest rate swap agreements | | | — | | | | — | | | | — | | | | 59 | | | | 3 | | | | 62 | |
Adjustment to non-controlling interests | | | — | | | | (5,050 | ) | | | — | | | | 4,881 | | | | 169 | | | | — | |
Balance, June 30, 2024 | | $ | 47 | | | $ | 3,444,265 | | | $ | (449,893 | ) | | $ | 60,383 | | | $ | 142,608 | | | $ | 3,197,410 | |
The accompanying notes are an integral part of these condensed consolidated financial statements.
Broadstone Net Lease, Inc. and Subsidiaries
Condensed Consolidated Statements of Equity - Continued
(Unaudited)
(in thousands, except per share amounts)
| | | | | | | | | | | | | | | | | | | | | | | | |
| | Common
Stock | | | Additional
Paid-in
Capital | | | Cumulative
Distributions
in Excess of
Retained Earnings | | | Accumulated
Other
Comprehensive
Income | | | Non-
controlling
Interests | | | Total
Equity | |
Balance, January 1, 2023 | | $ | 47 | | | $ | 3,419,395 | | | $ | (386,049 | ) | | $ | 59,525 | | | $ | 169,587 | | | $ | 3,262,505 | |
Net income | | | — | | | | — | | | | 39,304 | | | | — | | | | 2,070 | | | | 41,374 | |
Issuance of 259 shares of common stock under equity incentive plan | | | — | | | | — | | | | — | | | | — | | | | — | | | | — | |
Offering costs, discounts, and commissions | | | — | | | | (2 | ) | | | — | | | | — | | | | — | | | | (2 | ) |
Stock-based compensation, net of zero shares of restricted stock forfeited | | | — | | | | 1,879 | | | | — | | | | — | | | | — | | | | 1,879 | |
Retirement of 66 shares of common stock under equity incentive plan | | | — | | | | (1,175 | ) | | | — | | | | — | | | | — | | | | (1,175 | ) |
Conversion of 896 OP units to 896 shares of common stock | | | — | | | | 14,897 | | | | — | | | | — | | | | (14,897 | ) | | | — | |
Distributions declared ($0.275 per share and OP Unit) | | | — | | | | — | | | | (52,145 | ) | | | — | | | | (2,742 | ) | | | (54,887 | ) |
Change in fair value of interest rate swap agreements | | | — | | | | — | | | | — | | | | (17,003 | ) | | | (896 | ) | | | (17,899 | ) |
Realized loss on interest rate swap agreements | | | — | | | | — | | | | — | | | | 496 | | | | 26 | | | | 522 | |
Adjustment to non-controlling interests | | | — | | | | (460 | ) | | | — | | | | 498 | | | | (38 | ) | | | — | |
Balance, March 31, 2023 | | $ | 47 | | | $ | 3,434,534 | | | $ | (398,890 | ) | | $ | 43,516 | | | $ | 153,110 | | | $ | 3,232,317 | |
Net income | | | — | | | | — | | | | 60,014 | | | | — | | | | 2,982 | | | | 62,996 | |
Issuance of 51 shares of common stock under equity incentive plan | | | — | | | | — | | | | — | | | | — | | | | — | | | | — | |
Offering costs, discounts, and commissions | | | — | | | | (10 | ) | | | — | | | | — | | | | — | | | | (10 | ) |
Stock-based compensation, net of six shares of restricted stock forfeited | | | — | | | | 1,539 | | | | — | | | | — | | | | — | | | | 1,539 | |
Conversion of 25 OP units to 25 shares of common stock | | | — | | | | 398 | | | | — | | | | — | | | | (398 | ) | | | — | |
Distributions declared ($0.280 per share and OP Unit) | | | — | | | | — | | | | (52,755 | ) | | | — | | | | (2,664 | ) | | | (55,419 | ) |
Change in fair value of interest rate swap agreements | | | — | | | | — | | | | — | | | | 18,722 | | | | 930 | | | | 19,652 | |
Realized loss on interest rate swap agreements | | | — | | | | — | | | | — | | | | 496 | | | | 26 | | | | 522 | |
Adjustment to non-controlling interests | | | — | | | | (5,769 | ) | | | — | | | | 5,694 | | | | 75 | | | | — | |
Balance, June 30, 2023 | | $ | 47 | | | $ | 3,430,692 | | | $ | (391,631 | ) | | $ | 68,428 | | | $ | 154,061 | | | $ | 3,261,597 | |
The accompanying notes are an integral part of these condensed consolidated financial statements.
Broadstone Net Lease, Inc. and Subsidiaries
Condensed Consolidated Statements of Cash Flows
(Unaudited)
(in thousands)
| | | | | | | | |
| | For the Six Months Ended
June 30, | |
| | 2024 | | | 2023 | |
Operating activities | | | | | | |
Net income | | $ | 104,114 | | | $ | 104,370 | |
Adjustments to reconcile net income including non-controlling interests to net cash provided by
operating activities: | | | | | | |
Depreciation and amortization including intangibles associated with investment in rental property | | | 73,063 | | | | 77,039 | |
Provision for impairment of investment in rental properties | | | 30,252 | | | | 1,473 | |
Amortization of debt issuance costs and original issuance discount charged to interest expense | | | 1,966 | | | | 1,894 | |
Stock-based compensation expense | | | 3,548 | | | | 3,418 | |
Straight-line rent, direct financing and sales-type lease adjustments | | | (7,475 | ) | | | (14,250 | ) |
Gain on sale of real estate | | | (62,515 | ) | | | (32,877 | ) |
Other non-cash items | | | (2,239 | ) | | | 923 | |
Changes in assets and liabilities: | | | | | | |
Tenant and other receivables | | | (66 | ) | | | 371 | |
Prepaid expenses and other assets | | | 1,520 | | | | (192 | ) |
Accounts payable and other liabilities | | | (5,460 | ) | | | (4,383 | ) |
Accrued interest payable | | | 8,331 | | | | (1,182 | ) |
Net cash provided by operating activities | | | 145,039 | | | | 136,604 | |
| | | | | | |
Investing activities | | | | | | |
Acquisition of rental property | | | (218,891 | ) | | | (25,990 | ) |
Investment in property under development including capitalized interest of $2,601 and $267 in 2024 and 2023, respectively | | | (70,051 | ) | | | (37,449 | ) |
Capital expenditures and improvements | | | (3,304 | ) | | | (23,593 | ) |
Proceeds from disposition of rental property, net | | | 270,823 | | | | 118,253 | |
Change in deposits on investments in rental property | | | — | | | | 125 | |
Net cash (used in) provided by investing activities | | | (21,423 | ) | | | 31,346 | |
| | | | | | |
Financing activities | | | | | | |
Offering costs, discounts, and commissions | | | (461 | ) | | | (180 | ) |
Principal payments on mortgages and unsecured term loans | | | (1,117 | ) | | | (6,411 | ) |
Borrowings on unsecured revolving credit facility | | | 90,000 | | | | 125,000 | |
Repayments on unsecured revolving credit facility | | | (99,000 | ) | | | (201,000 | ) |
Cash distributions paid to stockholders | | | (108,385 | ) | | | (103,521 | ) |
Cash distributions paid to non-controlling interests | | | (5,389 | ) | | | (5,613 | ) |
Net cash used in financing activities | | | (124,352 | ) | | | (191,725 | ) |
Net decrease in cash and cash equivalents and restricted cash | | | (736 | ) | | | (23,775 | ) |
Cash and cash equivalents and restricted cash at beginning of period | | | 20,632 | | | | 60,040 | |
Cash and cash equivalents and restricted cash at end of period | | $ | 19,896 | | | $ | 36,265 | |
| | | | | | |
Reconciliation of cash and cash equivalents and restricted cash | | | | | | |
Cash and cash equivalents at beginning of period | | $ | 19,494 | | | $ | 21,789 | |
Restricted cash at beginning of period | | | 1,138 | | | | 38,251 | |
Cash and cash equivalents and restricted cash at beginning of period | | $ | 20,632 | | | $ | 60,040 | |
| | | | | | |
Cash and cash equivalents at end of period | | $ | 18,282 | | | $ | 20,763 | |
Restricted cash at end of period | | | 1,614 | | | | 15,502 | |
Cash and cash equivalents and restricted cash at end of period | | $ | 19,896 | | | $ | 36,265 | |
The accompanying notes are an integral part of these condensed consolidated financial statements.
Broadstone Net Lease, Inc. and Subsidiaries
Notes to the Condensed Consolidated Financial Statements (Unaudited)
1. Business Description
Broadstone Net Lease, Inc. (the “Corporation”) is a Maryland corporation formed on October 18, 2007, that elected to be taxed as a real estate investment trust (“REIT”) commencing with the taxable year ended December 31, 2008. Broadstone Net Lease, LLC (the Corporation’s operating company, or the “OP”), is the entity through which the Corporation conducts its business and owns (either directly or through subsidiaries) all of the Corporation’s properties. The Corporation is the sole managing member of the OP. The membership units not owned by the Corporation are referred to as OP Units and are recorded as non-controlling interests in the Condensed Consolidated Financial Statements. As the Corporation conducts substantially all of its operations through the OP, it is structured as an umbrella partnership real estate investment trust (“UPREIT”). The Corporation’s common stock is listed on the New York Stock Exchange under the symbol “BNL.” The Corporation, the OP, and its consolidated subsidiaries are collectively referred to as the “Company.”
The Company is an industrial-focused, diversified net lease REIT that focuses on investing in income-producing, single-tenant net leased commercial properties, primarily in the United States. The Company leases industrial, restaurant, healthcare, retail, and office commercial properties under long-term lease agreements. At June 30, 2024, the Company owned a diversified portfolio of 777 individual commercial properties with 770 properties located in 44 U.S. states and seven properties located in four Canadian provinces.
The following table summarizes the outstanding equity and economic ownership interest of the Company:
| | | | | | | | | | | | | | | | | | | | | | | | |
| | June 30, 2024 | | | December 31, 2023 | |
(in thousands) | | Shares of
Common Stock | | | OP Units | | | Total Diluted
Shares | | | Shares of
Common Stock | | | OP Units | | | Total Diluted
Shares | |
Ownership interest | | | 188,517 | | | | 8,801 | | | | 197,318 | | | | 187,614 | | | | 8,928 | | | | 196,542 | |
Percent ownership of OP | | | 95.5 | % | | | 4.5 | % | | | 100.0 | % | | | 95.5 | % | | | 4.5 | % | | | 100.0 | % |
Refer to Note 14 for further discussion regarding the calculation of weighted average shares outstanding.
2. Summary of Significant Accounting Policies
The accompanying Condensed Consolidated Financial Statements have been prepared in accordance with accounting principles generally accepted in the United States of America (“GAAP”) for interim financial information (Accounting Standards Codification (“ASC”) 270, Interim Reporting) and Article 10 of the Securities and Exchange Commission’s (“SEC”) Regulation S-X. Accordingly, the Company has omitted certain footnote disclosures which would substantially duplicate those contained within the audited consolidated financial statements for the year ended December 31, 2023, included in the Company’s 2023 Annual Report on Form 10-K, filed with the SEC on February 22, 2024. Therefore, the readers of this quarterly report should refer to those audited consolidated financial statements, specifically Note 2, Summary of Significant Accounting Policies, for further discussion of significant accounting policies and estimates. The Company believes all adjustments necessary for a fair presentation have been included in these interim Condensed Consolidated Financial Statements (which include only normal recurring adjustments).
Principles of Consolidation
The Condensed Consolidated Financial Statements include the accounts and operations of the Company. All intercompany balances and transactions have been eliminated in consolidation.
When the Company obtains an economic interest in an entity, the Company evaluates the entity to determine if it should be deemed a variable interest entity (“VIE”) and, if so, whether the Company is the primary beneficiary and is therefore required to consolidate the entity. The accounting guidance for consolidation of VIEs is applied to certain entities in which the equity investors do not have the characteristics of a controlling financial interest or do not have sufficient equity at risk for the entity to finance its activities without additional subordinated financial support from other parties. Certain decision-making rights within a loan or joint-venture agreement may cause us to consider an entity a VIE. The contractual arrangements in a partnership agreement or other related contracts are reviewed to determine whether the entity is a VIE, and if the Company has variable interests in the VIE. The Company’s variable interests are then compared to those of the other variable interest holders to determine which party is the primary beneficiary of the VIE. A primary beneficiary: (i) has the power to direct the activities that most significantly impact the economic performance of the VIE and (ii) has the obligation to absorb losses or the right to receive benefits of the VIE that could potentially be significant to the VIE. The Company reassesses the initial evaluation of whether an entity is a VIE when certain events occur, and reassesses the primary beneficiary determination of a VIE on an ongoing basis based on current facts and circumstances. To the extent the Company has a variable interest in entities that are not evaluated under the VIE model, the Company evaluates its interests using the voting interest entity model.
The Corporation has complete responsibility for the day-to-day management of, authority to make decisions for, and control of the OP. Based on consolidation guidance, the Corporation has concluded that the OP is a VIE as the members in the OP do not possess kick-out rights or substantive participating rights. Accordingly, the Corporation consolidates its interest in the OP. However, because the Corporation holds the majority voting interest in the OP and certain other conditions are met, it qualifies for the exemption from providing certain disclosure requirements associated with investments in VIEs.
In June 2024, the Company invested $52.2 million in exchange for 98.1% ownership interest in a VIE. The Company is the primary beneficiary as it: (i) has the power to direct the activities that significantly impact the economic performance of the VIE, and (ii) has the obligation to absorb losses and the right to receive benefits of the VIE, and therefore consolidates the VIE. The following table presents a summary of selected financial data of the consolidated VIE included in the Condensed Consolidated Balance Sheets:
| | | | |
(in thousands) | | June 30,
2024 | |
Assets | | | |
Accounted for using the operating method: | | | |
Land | | $ | 7,644 | |
Land improvements | | | 2,508 | |
Buildings and improvements | | | 38,648 | |
Total accounted for using the operating method | | | 48,800 | |
Less accumulated depreciation | | | (240 | ) |
Accounted for using the operating method, net | | | 48,560 | |
Intangible lease assets, net | | | 3,926 | |
Other assets | | | 1,831 | |
Total assets | | $ | 54,317 | |
| | | |
Liabilities | | | |
Intangible lease liabilities, net | | $ | 555 | |
Other liabilities | | | 1,485 | |
Total liabilities | | $ | 2,040 | |
From time to time, the Company acquires properties using a reverse like-kind exchange structure pursuant to Section 1031 of the Internal Revenue Code (a “reverse 1031 exchange”) and, as such, the properties are in the possession of an Exchange Accommodation Titleholder (“EAT”) until the reverse 1031 exchange is completed. The EAT is classified as a VIE as it is a “thinly capitalized” entity. The Company consolidates the EAT because it is the primary beneficiary as it has the ability to control the activities that most significantly impact the EAT's economic performance and can collapse the 1031 exchange structure at its discretion. The assets of the EAT primarily consist of leased property (net real estate investment in rental property and lease intangibles).
The portions of a consolidated entity not owned by the Company are presented as non-controlling interests as of and during the periods presented.
Basis of Accounting
The Condensed Consolidated Financial Statements have been prepared in accordance with GAAP.
The preparation of Condensed Consolidated Financial Statements in conformity with GAAP requires management to make certain estimates and assumptions that affect the reported amounts of assets and liabilities and disclosure of contingent liabilities at the date of the Condensed Consolidated Financial Statements and the reported amounts of revenues and expenses during the reporting periods. Accordingly, actual results may differ from those estimates.
Investment in Property Under Development
Land acquired for development and construction and improvement costs incurred in connection with the development of new properties are capitalized and recorded as Property under development in the accompanying Condensed Consolidated Balance Sheets until construction has been completed. Such capitalized costs include all direct and indirect costs related to planning, development, and construction, including interest, real estate taxes, and other miscellaneous costs incurred during the construction period. Once completed, the property under development is placed in service and depreciation commences. The following tables summarize the Company’s investments in property under development:
| | | | | | | | |
(in thousands) | | June 30,
2024 | | | December 31,
2023 | |
Development, construction and improvement costs | | $ | 160,950 | | | $ | 93,501 | |
Capitalized interest | | | 4,064 | | | | 1,463 | |
Property under development | | $ | 165,014 | | | $ | 94,964 | |
| | | | | | | | | | | | | | | | |
| | For the Three Months Ended
June 30, | | | For the Six Months Ended
June 30, | |
(in thousands) | | 2024 | | | 2023 | | | 2024 | | | 2023 | |
Investment in properties under development,
excluding capitalized costs | | $ | 30,591 | | | $ | 37,182 | | | $ | 67,450 | | | $ | 37,182 | |
Long-lived Asset Impairment
The Company reviews long-lived assets to be held and used for possible impairment when events or changes in circumstances indicate that their carrying amounts may not be recoverable. If, and when, such events or changes in circumstances are present, an impairment exists to the extent the carrying value of the long-lived asset or asset group exceeds the sum of the undiscounted cash flows expected to result from the use of the long-lived asset or asset group and its eventual disposition. Such cash flows include expected future operating income, as adjusted for trends and prospects, as well as the effects of demand, competition, and other factors. An impairment loss is measured as the amount by which the carrying amount of the long-lived asset or asset group exceeds its fair value. Significant judgment is made to determine if and when impairment should be taken. The Company’s assessment of impairment as of June 30, 2024 and 2023 was based on the most current information available to the Company. Certain of the Company’s properties may have fair values less than their carrying amounts. However, based on the Company’s plans with respect to each of those properties, the Company believes that their carrying amounts are recoverable and therefore, no impairment charges were recognized other than those described below. If the operating conditions mentioned above deteriorate or if the Company’s expected holding period for assets changes, subsequent tests for impairments could result in additional impairment charges in the future.
Inputs used in establishing fair value for impaired real estate assets generally fall within Level 3 of the fair value hierarchy, which are characterized as requiring significant judgment as little or no current market activity may be available for validation. The main indicator used to establish the classification of the inputs is current market conditions, as derived through the use of published commercial real estate market information and information obtained from brokers and other third party sources. The Company determines the valuation of impaired assets using generally accepted valuation techniques including discounted cash flow analysis, income capitalization, analysis of recent comparable sales transactions, actual sales negotiations, and bona fide purchase offers received from third parties. Management may consider a single valuation technique or multiple valuation techniques, as appropriate, when estimating the fair value of its real estate.
The following table summarizes the Company’s impairment charges:
| | | | | | | | | | | | | | | | |
| | For the Three Months Ended
June 30, | | | For the Six Months Ended
June 30, | |
(in thousands, except number of properties) | | 2024 | | | 2023 | | | 2024 | | | 2023 | |
Number of properties | | | 2 | | | | — | | | | 14 | | | | 1 | |
Impairment charge | | $ | 3,852 | | | $ | — | | | $ | 30,252 | | | $ | 1,473 | |
During the three and six months ended June 30, 2024, the Company recognized impairment of of $3.9 million and $30.3 million, respectively, resulting from changes in the Company’s long-term hold strategy with respect to the individual properties. The impairments primarily include $18.1 million on two healthcare properties and $11.2 million on 11 healthcare properties sold as part of a portfolio with a gain of $59.1 million, excluding any impairment, and were based on actual and expected sales prices of the individual properties.
Restricted Cash
Restricted cash generally includes escrow funds the Company maintains pursuant to the terms of certain mortgages, lease agreements, and undistributed proceeds from the sale of properties under Section 1031 of the Internal Revenue Code of 1986, as amended (the “Code”), and is reported within Prepaid expenses and other assets in the Condensed Consolidated Balance Sheets. Restricted cash consisted of the following:
| | | | | | | | |
| | June 30, | | | December 31, | |
(in thousands) | | 2024 | | | 2023 | |
Escrow funds and other | | $ | 1,614 | | | $ | 1,138 | |
1031 exchange proceeds | | | — | | | | — | |
| | $ | 1,614 | | | $ | 1,138 | |
Rent Received in Advance
Rent received in advance represents tenant rent payments received prior to the contractual due date, and is included in Accounts payable and other liabilities in the Condensed Consolidated Balance Sheets. Rent received in advance consisted of the following:
| | | | | | | | |
(in thousands) | | June 30,
2024 | | | December 31,
2023 | |
Rent received in advance | | $ | 14,292 | | | $ | 14,776 | |
Fair Value Measurements
Recurring Fair Value Measurements
The balances of financial instruments measured at fair value on a recurring basis are as follows (see Note 9):
| | | | | | | | | | | | | | | | |
| | June 30, 2024 | |
(in thousands) | | Total | | | Level 1 | | | Level 2 | | | Level 3 | |
Interest rate swap, assets | | $ | 56,444 | | | $ | — | | | $ | 56,444 | | | $ | — | |
| | | | | | | | | | | | | | | | |
| | December 31, 2023 | |
(in thousands) | | Total | | | Level 1 | | | Level 2 | | | Level 3 | |
Interest rate swap, assets | | $ | 46,096 | | | $ | — | | | $ | 46,096 | | | $ | — | |
Long-term Debt – The fair value of the Company’s debt was estimated using Level 1, Level 2, and Level 3 inputs based on recent secondary market trades of the Company’s 2031 Senior Unsecured Public Notes (see Note 7), recent comparable financing transactions, recent market risk premiums for loans of comparable quality, applicable Secured Overnight Financing Rate (“SOFR”), Canadian Dollar Offered Rate (“CDOR”), Canadian Overnight Repo Rate Average (“CORRA”), U.S. Treasury obligation interest rates, and discounted estimated future cash payments to be made on such debt. The discount rates estimated reflect the Company’s judgment as to the approximate current lending rates for loans or groups of loans with similar maturities and assumes that the debt is outstanding through maturity. Market information, as available, or present value techniques were utilized to estimate the amounts required to be disclosed. Since such amounts are estimates that are based on limited available market information for similar transactions and do not acknowledge transfer or other repayment restrictions that may exist on specific loans, it is unlikely that the estimated fair value of any such debt could be realized by immediate settlement of the obligation.
The following table summarizes the carrying amount reported in the Condensed Consolidated Balance Sheets and the Company’s estimate of the fair value of the unsecured revolving credit facility, mortgages, unsecured term loans, and senior unsecured notes which reflects the fair value of interest rate swaps:
| | | | | | | | |
(in thousands) | | June 30,
2024 | | | December 31,
2023 | |
Carrying amount | | $ | 1,907,151 | | | $ | 1,919,607 | |
Fair value | | | 1,751,768 | | | | 1,761,177 | |
Non-recurring Fair Value Measurements
The Company’s non-recurring fair value measurements at June 30, 2024 and December 31, 2023 consisted of the fair value of impaired real estate assets that were determined using Level 3 inputs.
Right-of-Use Assets and Lease Liabilities
The Company is a lessee under non-cancelable operating leases associated with its corporate headquarters and other office spaces as well as with leases of land (“ground leases”). The Company records right-of-use assets and lease liabilities associated with these leases. The lease liability is equal to the net present value of the future payments to be made under the lease, discounted using estimates based on observable market factors. The right-of-use asset is generally equal to the lease liability plus initial direct costs associated with the leases. The Company includes in the recognition of the right-of-use asset and lease liability those renewal periods that are reasonably certain to be exercised, based on the facts and circumstances that exist at lease inception. Amounts associated with percentage rent provisions are considered variable lease costs and are not included in the initial measurement of the right-of-use asset or lease liability. The Company has made an accounting policy election, applicable to all asset types, not to separate lease from nonlease components when allocating contract consideration related to operating leases.
Right-of-use assets and lease liabilities associated with operating leases were included in the accompanying Condensed Consolidated Balance Sheets as follows:
| | | | | | | | | | |
| | | | June 30, | | | December 31, | |
(in thousands) | | Financial Statement Presentation | | 2024 | | | 2023 | |
Right-of-use assets | | Prepaid expenses and other assets | | $ | 7,387 | | | $ | 8,476 | |
Lease liabilities | | Accounts payable and other liabilities | | | 7,757 | | | | 8,256 | |
The Company’s right-of-use assets and lease liabilities primarily consist of a lease for the Company’s corporate office space, which expires in October 2033. The lease contains two five-year extension options, exercisable at the Company’s discretion, that are not reasonably certain to be exercised, and are therefore excluded from our calculation of the lease liability.
3. Acquisitions of Rental Property
The Company closed on the following acquisitions during the six months ended June 30, 2024:
| | | | | | | | | | | |
(in thousands, except number of properties) | | Number of | | | Real Estate | | |
Date | | Property Type | | Properties | | | Acquisition Price | | |
April 4, 2024 | | Retail & Restaurant | | | 8 | | | $ | 84,500 | | (a) |
April 18, 2024 | | Industrial & Retail | | | 5 | | | | 65,000 | | |
May 21, 2024 | | Retail | | | 1 | | | | 12,590 | | |
May 30, 2024 | | Industrial | | | 5 | | | | 31,493 | | |
June 6, 2024 | | Industrial | | | 1 | | | | 9,470 | | |
June 24, 2024 | | Retail | | | 2 | | | | 14,000 | | |
| | | | | 22 | | | $ | 217,053 | | (b) |
(a)In April 2024, the Company acquired $52.0 million of real estate assets. In June 2024, the Company contributed these assets in exchange for preferred equity in a consolidated VIE (see Note 2).
(b)Acquisition price excludes capitalized acquisition costs of $1.7 million.
The Company closed on the following acquisitions during the six months ended June 30, 2023:
| | | | | | | | | | | |
(in thousands, except number of properties) | | Number of | | | Real Estate | | |
Date | | Property Type | | Properties | | | Acquisition Price | | |
March 14, 2023 | | Retail | | | 1 | | | $ | 5,221 | | |
May 16, 2023 | | Industrial | | | 2 | | | | 10,432 | | |
May 22, 2023 | | Industrial | | | 1 | | | | 17,300 | | (c) |
May 25, 2023 | | Industrial | | | 1 | | | | 9,952 | | |
| | | | | 5 | | | $ | 42,905 | | (d) |
(c)Acquisition of land to be developed in connection with a $204.8 million build-to-suit transaction expected to fund in multiple draws through October 2024 (see Note 16).
(d)Acquisition price excludes capitalized acquisition costs of $2.8 million.
The Company allocated the purchase price of these properties to the fair value of the assets acquired and liabilities assumed. The following table summarizes the purchase price allocation for completed real estate acquisitions:
| | | | | | | | | |
| | For the Six Months Ended
June 30, | | |
(in thousands) | | 2024 | | | 2023 | | |
Land | | $ | 50,741 | | | $ | 2,461 | | |
Land improvements | | | 10,121 | | | | 2,694 | | |
Buildings and improvements | | | 142,866 | | | | 18,647 | | |
Property under development | | | — | | | | 19,648 | | |
Acquired in-place leases (e) | | | 17,956 | | | | 2,400 | | |
Acquired above-market leases (f) | | | 1,028 | | | | — | | |
Acquired below-market leases (g) | | | (3,996 | ) | | | (166 | ) | |
| | $ | 218,716 | | | $ | 45,684 | | |
(e)The weighted average amortization period for acquired in-place leases is 11 years and 15 years for acquisitions completed during the six months ended June 30, 2024 and 2023, respectively.
(f)The weighted average amortization period for acquired above-market leases is six years for acquisitions completed during the six months ended June 30, 2024. There were no above-market leases acquired during the six months ended June 30, 2023.
(g)The weighted average amortization period for acquired below-market leases is nine years and 20 years for acquisitions completed during the six months ended June 30, 2024 and 2023, respectively.
The above acquisitions were funded using a combination of available cash on hand and unsecured revolving credit facility borrowings. All real estate acquisitions closed during the six months ended June 30, 2024 and 2023, qualified as asset acquisitions and as such, acquisition costs were capitalized.
4. Sale of Real Estate
The Company closed on the following sales of real estate, none of which qualified as discontinued operations:
| | | | | | | | | | | | | | | | | |
| | For the Three Months Ended
June 30, | | | For the Six Months Ended
June 30, | | |
(in thousands, except number of properties) | | 2024 | | | 2023 | | | 2024 | | | 2023 | | |
Number of properties disposed | | | 3 | | | | 4 | | | | 40 | | | | 7 | | |
Aggregate sale price | | $ | 24,350 | | | $ | 69,390 | | | $ | 276,102 | | | $ | 121,264 | | |
Aggregate carrying value | | | (20,473 | ) | | | (38,381 | ) | | | (209,846 | ) | | | (85,376 | ) | |
Additional sales expenses | | | (493 | ) | | | (1,547 | ) | | | (3,741 | ) | | | (3,011 | ) | |
Gain on sale of real estate | | $ | 3,384 | | | $ | 29,462 | | | $ | 62,515 | | | $ | 32,877 | | |
5. Investment in Rental Property and Lease Arrangements
The Company generally leases its investment rental property to established tenants in the industrial, restaurant, healthcare, retail, and office property types. At June 30, 2024, the Company had 777 real estate properties, 764 of which were leased under leases that have been classified as operating leases, nine that have been classified as direct financing leases, one that has been classified as a sales-type lease, and three that were vacant. Of the nine leases classified as direct financing leases, three include land portions which are accounted for as operating leases. The sales-type lease includes a land portion which is accounted for as an operating lease. Most leases have initial terms of 10 to 20 years. The Company’s leases generally provide for limited increases in rent as a result of fixed increases, increases in the Consumer Price Index (“CPI”), or increases in the tenant’s sales volume. Generally, tenants are also required to pay all property taxes and assessments, substantially maintain the interior and exterior of the building, and maintain property and liability insurance coverage. The leases also typically provide for one or more multiple-year renewal options, at the election of the tenant, and are subject to generally the same terms and conditions as the initial lease.
Investment in Rental Property – Accounted for Using the Operating Method
Depreciation expense on investment in rental property was as follows:
| | | | | | | | | | | | | | | | |
| | For the Three Months Ended
June 30, | | | For the Six Months Ended
June 30, | |
(in thousands) | | 2024 | | | 2023 | | | 2024 | | | 2023 | |
Depreciation | | $ | 29,480 | | | $ | 30,989 | | | $ | 59,474 | | | $ | 62,146 | |
Estimated lease payments to be received under non-cancelable operating leases with tenants at June 30, 2024 are as follows:
| | | | |
(in thousands) | | | |
Remainder of 2024 | | $ | 194,506 | |
2025 | | | 400,269 | |
2026 | | | 398,481 | |
2027 | | | 384,581 | |
2028 | | | 368,069 | |
Thereafter | | | 3,075,488 | |
| | $ | 4,821,394 | |
Since lease renewal periods are exercisable at the option of the tenant, the above amounts only include future lease payments due during the initial lease terms. Such amounts exclude any potential variable rent increases that are based on changes in the CPI or future variable rents which may be received under the leases based on a percentage of the tenant’s gross sales. Additionally, certain of our leases provide tenants with the option to terminate their leases in exchange for termination penalties, or that are contingent upon the occurrence of a future event. Future lease payments within the table above have not been adjusted for these termination rights.
Investment in Rental Property – Direct Financing Leases
The Company’s net investment in direct financing leases was comprised of the following:
| | | | | | | | |
(in thousands) | | June 30,
2024 | | | December 31,
2023 | |
Undiscounted estimated lease payments to be received | | $ | 33,569 | | | $ | 35,155 | |
Estimated unguaranteed residual values | | | 14,547 | | | | 14,547 | |
Unearned revenue | | | (21,605 | ) | | | (22,944 | ) |
Reserve for credit losses | | | (98 | ) | | | (115 | ) |
Net investment in direct financing leases | | $ | 26,413 | | | $ | 26,643 | |
Undiscounted estimated lease payments to be received under non-cancelable direct financing leases with tenants at June 30, 2024 are as follows:
| | | | |
(in thousands) | | | |
Remainder of 2024 | | $ | 1,586 | |
2025 | | | 3,285 | |
2026 | | | 3,357 | |
2027 | | | 3,426 | |
2028 | | | 3,496 | |
Thereafter | | | 18,419 | |
| | $ | 33,569 | |
The above rental receipts do not include future lease payments for renewal periods, potential variable CPI rent increases, or variable percentage rent payments that may become due in future periods.
The following table summarizes amounts reported as Lease revenues, net in the Condensed Consolidated Statements of Income and Comprehensive Income:
| | | | | | | | | | | | | | | | | |
| | For the Three Months Ended
June 30, | | | For the Six Months Ended
June 30, | | |
(in thousands) | | 2024 | | | 2023 | | | 2024 | | | 2023 | | |
Contractual rental amounts billed for operating leases | | $ | 95,736 | | | $ | 96,456 | | | $ | 193,285 | | | $ | 194,558 | | |
Adjustment to recognize contractual operating lease billings
on a straight-line basis | | | 5,177 | | | | 7,380 | | | | 10,281 | | | | 14,750 | | |
Net write-offs of accrued rental income | | | — | | | | — | | | | (2,556 | ) | | | (105 | ) | |
Variable rental amounts earned | | | 659 | | | | 452 | | | | 1,257 | | | | 793 | | |
Earned income from direct financing leases | | | 689 | | | | 689 | | | | 1,371 | | | | 1,380 | | |
Interest income from sales-type leases | | | 15 | | | | 15 | | | | 29 | | | | 29 | | |
Operating expenses billed to tenants | | | 4,651 | | | | 4,594 | | | | 9,756 | | | | 9,669 | | |
Other income from real estate transactions | | | 12 | | | | 3 | | | | 79 | | | | 7,395 | | (a) |
Adjustment to revenue recognized for uncollectible rental
amounts billed, net | | | (1,032 | ) | | | (236 | ) | | | (2,228 | ) | | | (124 | ) | |
Total lease revenues, net | | $ | 105,907 | | | $ | 109,353 | | | $ | 211,274 | | | $ | 228,345 | | |
(a)The six months ended June 30, 2023, includes $7.5 million of lease termination fee income recognized in connection with the simultaneous lease termination and sale of an underlying office property for an additional $32.0 million in proceeds.
6. Intangible Assets and Liabilities, and Leasing Fees
The following is a summary of intangible assets and liabilities, and leasing fees, and related accumulated amortization:
| | | | | | | | |
(in thousands) | | June 30,
2024 | | | December 31,
2023 | |
Lease intangibles: | | | | | | |
Acquired above-market leases | | $ | 41,237 | | | $ | 44,711 | |
Less accumulated amortization | | | (18,377 | ) | | | (20,312 | ) |
Acquired above-market leases, net | | | 22,860 | | | | 24,399 | |
Acquired in-place leases | | | 415,062 | | | | 416,206 | |
Less accumulated amortization | | | (155,374 | ) | | | (152,379 | ) |
Acquired in-place leases, net | | | 259,688 | | | | 263,827 | |
Total intangible lease assets, net | | $ | 282,548 | | | $ | 288,226 | |
Acquired below-market leases | | $ | 99,650 | | | $ | 98,535 | |
Less accumulated amortization | | | (46,526 | ) | | | (45,004 | ) |
Intangible lease liabilities, net | | $ | 53,124 | | | $ | 53,531 | |
Leasing fees | | $ | 17,676 | | | $ | 18,117 | |
Less accumulated amortization | | | (6,399 | ) | | | (6,426 | ) |
Leasing fees, net | | $ | 11,277 | | | $ | 11,691 | |
Amortization of intangible lease assets and liabilities, and leasing fees was as follows:
| | | | | | | | | | | | | | | | | | |
(in thousands) | | | | For the Three Months Ended
June 30, | | | For the Six Months Ended
June 30, | |
Intangible | | Financial Statement Presentation | | 2024 | | | 2023 | | | 2024 | | | 2023 | |
Acquired in-place leases and leasing fees | | Depreciation and amortization | | $ | 7,840 | | | $ | 8,001 | | | $ | 15,536 | | | $ | 18,589 | |
Above-market and below-market leases | | Lease revenues, net | | | 1,096 | | | | 1,088 | | | | 2,117 | | | | 3,782 | |
There was no accelerated amortization for the three and six months ended June 30, 2024, respectively. There was no accelerated amortization for the three months ended June 30, 2023. For the six months ended June 30, 2023, amortization expense includes $0.9 million of accelerated amortization resulting from early lease terminations.
Estimated future amortization of intangible assets and liabilities, and leasing fees at June 30, 2024 is as follows:
| | | | |
(in thousands) | | | |
Remainder of 2024 | | $ | 13,401 | |
2025 | | | 26,102 | |
2026 | | | 25,050 | |
2027 | | | 23,161 | |
2028 | | | 20,888 | |
Thereafter | | | 132,099 | |
| | $ | 240,701 | |
7. Unsecured Credit Agreements
The following table summarizes the Company’s unsecured credit agreements:
| | | | | | | | | | | | |
| | Outstanding Balance | | | | | |
(in thousands, except interest rates) | | June 30,
2024 | | | December 31,
2023 | | | Interest Rate | | Maturity Date |
Unsecured revolving credit facility | | $ | 79,096 | | | $ | 90,434 | | | Applicable reference rate + 0.85% (a) | | Mar. 2026 (c) |
Unsecured term loans: | | | | | | | | | | |
2026 Unsecured Term Loan | | | 400,000 | | | | 400,000 | | | one-month adjusted SOFR + 1.00% (b) | | Feb. 2026 |
2027 Unsecured Term Loan | | | 200,000 | | | | 200,000 | | | one-month adjusted SOFR + 0.95% (b) | | Aug. 2027 |
2029 Unsecured Term Loan | | | 300,000 | | | | 300,000 | | | one-month adjusted SOFR + 1.25% (b) | | Aug. 2029 |
Total unsecured term loans | | | 900,000 | | | | 900,000 | | | | | |
Unamortized debt issuance costs, net | | | (3,426 | ) | | | (4,053 | ) | | | | |
Total unsecured term loans, net | | | 896,574 | | | | 895,947 | | | | | |
Senior unsecured notes: | | | | | | | | | | |
2027 Senior Unsecured Notes - Series A | | | 150,000 | | | | 150,000 | | | 4.84% | | Apr. 2027 |
2028 Senior Unsecured Notes - Series B | | | 225,000 | | | | 225,000 | | | 5.09% | | Jul. 2028 |
2030 Senior Unsecured Notes - Series C | | | 100,000 | | | | 100,000 | | | 5.19% | | Jul. 2030 |
2031 Senior Unsecured Public Notes | | | 375,000 | | | | 375,000 | | | 2.60% | | Sep. 2031 |
Total senior unsecured notes | | | 850,000 | | | | 850,000 | | | | | |
Unamortized debt issuance costs and
original issuance discount, net | | | (4,313 | ) | | | (4,691 | ) | | | | |
Total senior unsecured notes, net | | | 845,687 | | | | 845,309 | | | | | |
Total unsecured debt, net | | $ | 1,821,357 | | | $ | 1,831,690 | | | | | |
(a)At June 30, 2024 and December 31, 2023, a balance of $6.0 million and $15.0 million was subject to the one-month SOFR of 5.34% and 5.35%, respectively. The remaining balance of $100 million Canadian Dollar (“CAD”) borrowings remeasured to $73.1 million United States Dollar (”USD”) and $75.4 million USD, at June 30, 2024 and December 31, 2023, respectively, and was subject to the adjusted daily simple CORRA of 4.80% at June 30, 2024 and one-month CDOR, of 5.46% at December 31, 2023. Effective May 24, 2024, the $100 million CAD borrowings converted into an adjusted daily simple CORRA borrowing resulting from CDOR’s cessation in June 2024.
(b)At June 30, 2024 and December 31, 2023, one-month SOFR was 5.34% and 5.35%, respectively.
(c)The Company’s unsecured revolving credit facility contains two six-month extension options subject to certain conditions, including the payment of an extension fee equal to 0.0625% of the revolving commitments.
At June 30, 2024, the weighted average interest rate on all outstanding borrowings was 5.30% exclusive of interest rate swap agreements, and 3.73% inclusive of interest rate swap agreements.
The Company is subject to various financial and operational covenants and financial reporting requirements pursuant to its unsecured credit agreements. These covenants require the Company to maintain certain financial ratios. As of June 30, 2024, and for all periods presented, the Company believes it was in compliance with all of its loan covenants. Failure to comply with the covenants would result in a default which, if the Company were unable to cure or obtain a waiver from the lenders, could accelerate the repayment of the obligations. Further, in the event of default, the Company may be restricted from paying dividends to its stockholders in excess of dividends required to maintain its REIT qualification. Accordingly, an event of default could have a material effect on the Company.
Debt issuance costs and original issuance discounts are amortized as a component of Interest expense in the accompanying Condensed Consolidated Statements of Income and Comprehensive Income. The following table summarizes debt issuance cost and original issuance discount amortization:
| | | | | | | | | | | | | | | | |
| | For the Three Months Ended
June 30, | | | For the Six Months Ended
June 30, | |
(in thousands) | | 2024 | | | 2023 | | | 2024 | | | 2023 | |
Debt issuance costs and original issuance discount amortization | | $ | 983 | | | $ | 986 | | | $ | 1,966 | | | $ | 1,972 | |
8. Mortgages
The Company’s mortgages consist of the following:
| | | | | | | | | | | | | | | | |
| | Origination | | Maturity | | | | | | | | | | |
(in thousands, except interest rates) | | Date | | Date | | Interest | | June 30, | | | December 31, | | | |
Lender | | (Month/Year) | | (Month/Year) | | Rate | | 2024 | | | 2023 | | | |
Wilmington Trust National Association | | Apr-19 | | Feb-28 | | 4.92% | | $ | 43,531 | | | $ | 44,207 | | | (a) (b) (c) (d) |
Wilmington Trust National Association | | Jun-18 | | Aug-25 | | 4.36% | | | 18,506 | | | | 18,725 | | | (a) (b) (c) (d) |
PNC Bank | | Oct-16 | | Nov-26 | | 3.62% | | | 16,018 | | | | 16,241 | | | (b) (c) |
Total mortgages | | | | | | | | | 78,055 | | | | 79,173 | | | |
Debt issuance costs, net | | | | | | | | | (85 | ) | | | (105 | ) | | |
Mortgages, net | | | | | | | | $ | 77,970 | | | $ | 79,068 | | | |
(a)Non-recourse debt includes the indemnification/guaranty of the Company pertaining to fraud, environmental claims, insolvency, and other matters.
(b)Debt secured by related rental property and lease rents.
(c)Debt secured by guaranty of the OP.
(d)Mortgage was assumed as part of the acquisition of the related property. The debt was recorded at fair value at the time of assumption.
At June 30, 2024, investment in rental property of $119.1 million was pledged as collateral against the Company’s mortgages.
Estimated future principal payments to be made under the above mortgages and the Company’s unsecured credit agreements (see Note 7) at June 30, 2024 are as follows:
| | | | |
(in thousands) | | | |
Remainder of 2024 | | $ | 1,143 | |
2025 | | | 20,195 | |
2026 | | | 495,939 | |
2027 | | | 351,596 | |
2028 | | | 263,278 | |
Thereafter | | | 775,000 | |
| | $ | 1,907,151 | |
Certain of the Company’s mortgages provide for prepayment fees and can be terminated under certain events of default as defined under the related agreements. These prepayment fees are not reflected as part of the table above.
9. Interest Rate Swaps
During the three months ended June 30, 2024, the Company entered into nine forward-starting interest rate swaps with various institutions for a total notional amount of $460.0 million in order to mitigate the impact of interest rate variability over the term of the Company’s current and expected debt obligations. These swap arrangements are effective during various periods between March and December 2025 and mature in 2030.
The following is a summary of the Company’s outstanding interest rate swap agreements:
| | | | | | | | | | | | | | | | | | | | | | | | | |
(in thousands, except interest rates) | | | | | | | June 30, 2024 | | | December 31, 2023 | | |
Counterparty | | Maturity Date | | Fixed
Rate | | | Variable Rate Index (a) | | Notional
Amount | | | Fair
Value | | | Notional
Amount | | | Fair
Value | | |
Effective Swaps: | | | | | | | | | | | | | | | | | | | | |
Wells Fargo Bank, N.A. | | October 2024 | | | 2.72 | % | | daily compounded SOFR | | $ | 15,000 | | | $ | 103 | | | $ | 15,000 | | | $ | 255 | | |
Capital One, National Association | | December 2024 | | | 1.58 | % | | daily compounded SOFR | | | 15,000 | | | | 239 | | | | 15,000 | | | | 445 | | |
Bank of Montreal | | January 2025 | | | 1.91 | % | | daily compounded SOFR | | | 25,000 | | | | 428 | | | | 25,000 | | | | 713 | | |
Truist Financial Corporation | | April 2025 | | | 2.20 | % | | daily compounded SOFR | | | 25,000 | | | | 553 | | | | 25,000 | | | | 734 | | |
Bank of Montreal | | July 2025 | | | 2.32 | % | | daily compounded SOFR | | | 25,000 | | | | 670 | | | | 25,000 | | | | 768 | | |
Truist Financial Corporation | | July 2025 | | | 1.99 | % | | daily compounded SOFR | | | 25,000 | | | | 751 | | | | 25,000 | | | | 888 | | |
Truist Financial Corporation | | December 2025 | | | 2.30 | % | | daily compounded SOFR | | | 25,000 | | | | 911 | | | | 25,000 | | | | 887 | | |
Bank of Montreal | | January 2026 | | | 1.92 | % | | daily compounded SOFR | | | 25,000 | | | | 1,054 | | | | 25,000 | | | | 1,071 | | |
Bank of Montreal | | January 2026 | | | 2.05 | % | | daily compounded SOFR | | | 40,000 | | | | 1,611 | | | | 40,000 | | | | 1,615 | | |
Capital One, National Association | | January 2026 | | | 2.08 | % | | daily compounded SOFR | | | 35,000 | | | | 1,395 | | | | 35,000 | | | | 1,389 | | |
Truist Financial Corporation | | January 2026 | | | 1.93 | % | | daily compounded SOFR | | | 25,000 | | | | 1,051 | | | | 25,000 | | | | 1,067 | | |
Capital One, National Association | | April 2026 | | | 2.68 | % | | daily compounded SOFR | | | 15,000 | | | | 517 | | | | 15,000 | | | | 439 | | |
Capital One, National Association | | July 2026 | | | 1.32 | % | | daily compounded SOFR | | | 35,000 | | | | 2,216 | | | | 35,000 | | | | 2,186 | | |
Bank of Montreal | | December 2026 | | | 2.33 | % | | daily compounded SOFR | | | 10,000 | | | | 509 | | | | 10,000 | | | | 423 | | |
Bank of Montreal | | December 2026 | | | 1.99 | % | | daily compounded SOFR | | | 25,000 | | | | 1,473 | | | | 25,000 | | | | 1,299 | | |
Toronto-Dominion Bank | | March 2027 | | | 2.46 | % | | one-month CDOR | | | 14,619 | | (b) | | 588 | | | | 15,087 | | (b) | | 572 | | |
Wells Fargo Bank, N.A. | | April 2027 | | | 2.72 | % | | daily compounded SOFR | | | 25,000 | | | | 1,102 | | | | 25,000 | | | | 806 | | |
Bank of Montreal | | December 2027 | | | 2.37 | % | | daily compounded SOFR | | | 25,000 | | | | 1,557 | | | | 25,000 | | | | 1,215 | | |
Capital One, National Association | | December 2027 | | | 2.37 | % | | daily compounded SOFR | | | 25,000 | | | | 1,550 | | | | 25,000 | | | | 1,197 | | |
Wells Fargo Bank, N.A. | | January 2028 | | | 2.37 | % | | daily compounded SOFR | | | 75,000 | | | | 4,665 | | | | 75,000 | | | | 3,632 | | |
Bank of Montreal | | May 2029 | | | 2.09 | % | | daily compounded SOFR | | | 25,000 | | | | 2,267 | | | | 25,000 | | | | 1,835 | | |
Regions Bank | | May 2029 | | | 2.11 | % | | daily compounded SOFR | | | 25,000 | | | | 2,237 | | | | 25,000 | | | | 1,801 | | |
Regions Bank | | June 2029 | | | 2.03 | % | | daily compounded SOFR | | | 25,000 | | | | 2,329 | | | | 25,000 | | | | 1,900 | | |
U.S. Bank National Association | | June 2029 | | | 2.03 | % | | daily compounded SOFR | | | 25,000 | | | | 2,334 | | | | 25,000 | | | | 1,908 | | |
Regions Bank | | August 2029 | | | 2.58 | % | | one-month SOFR | | | 100,000 | | | | 6,462 | | | | 100,000 | | | | 4,392 | | |
Toronto-Dominion Bank | | August 2029 | | | 2.58 | % | | one-month SOFR | | | 45,000 | | | | 2,946 | | | | 45,000 | | | | 2,021 | | |
U.S. Bank National Association | | August 2029 | | | 2.65 | % | | one-month SOFR | | | 15,000 | | | | 932 | | | | 15,000 | | | | 618 | | |
U.S. Bank National Association | | August 2029 | | | 2.58 | % | | one-month SOFR | | | 100,000 | | | | 6,490 | | | | 100,000 | | | | 4,427 | | |
U.S. Bank National Association | | August 2029 | | | 1.35 | % | | daily compounded SOFR | | | 25,000 | | | | 3,192 | | | | 25,000 | | | | 2,828 | | |
Regions Bank | | March 2032 | | | 2.69 | % | | one-month CDOR | | | 14,619 | | (b) | | 931 | | | | 15,087 | | (b) | | 677 | | |
U.S. Bank National Association | | March 2032 | | | 2.70 | % | | one-month CDOR | | | 14,619 | | (b) | | 930 | | | | 15,087 | | (b) | | 678 | | |
Bank of Montreal | | March 2034 | | | 2.81 | % | | one-month CDOR | | | 29,239 | | (c) | | 2,082 | | | | 30,174 | | (c) | | 1,410 | | |
| | | | | | | | | | 973,096 | | | | 56,075 | | | | 975,435 | | | | 46,096 | | |
Forward Starting Swaps: (d) | | | | | | | | | | | | | | | | | | | | |
Bank of Montreal | | March 2030 | | | 3.80 | % | | daily simple SOFR | | | 80,000 | | | | — | | | | — | | | | — | | |
JPMorgan Chase Bank, N.A. | | March 2030 | | | 3.79 | % | | daily simple SOFR | | | 50,000 | | | | 35 | | | | — | | | | — | | |
U.S. Bank National Association | | June 2030 | | | 3.73 | % | | daily simple SOFR | | | 70,000 | | | | 76 | | | | — | | | | — | | |
Truist Financial Corporation | | June 2030 | | | 3.73 | % | | daily simple SOFR | | | 55,000 | | | | 48 | | | | — | | | | — | | |
Manufacturers & Traders Trust Company | | September 2030 | | | 3.71 | % | | daily simple SOFR | | | 50,000 | | | | 29 | | | | — | | | | — | | |
Regions Bank | | September 2030 | | | 3.69 | % | | daily simple SOFR | | | 15,000 | | | | 13 | | | | — | | | | — | | |
Truist Financial Corporation | | September 2030 | | | 3.70 | % | | daily simple SOFR | | | 15,000 | | | | 14 | | | | — | | | | — | | |
Toronto-Dominion Bank | | December 2030 | | | 3.66 | % | | daily simple SOFR | | | 70,000 | | | | 101 | | | | — | | | | — | | |
Regions Bank | | December 2030 | | | 3.66 | % | | daily simple SOFR | | | 55,000 | | | | 53 | | | | — | | | | — | | |
| | | | | | | | | | 460,000 | | | | 369 | | | | — | | | | — | | |
Total Swaps | | | | | | | | | $ | 1,433,096 | | | $ | 56,444 | | | $ | 975,435 | | | $ | 46,096 | | |
(a)Effective July 1, 2024, the variable rate index for CDOR based swaps will convert to daily compounded CORRA concurrent with CDOR’s cessation.
(b)The contractual notional amount is $20.0 million CAD.
(c)The contractual notional amount is $40.0 million CAD.
(d)Forward starting swaps have effective dates that are five years prior to each respective maturity date.
At June 30, 2024, the weighted average interest rate on all outstanding borrowings was 3.73%, inclusive of a weighted average fixed rate on effective interest rate swaps of 2.28%.
The total amounts recognized, and the location in the accompanying Condensed Consolidated Statements of Income and Comprehensive Income, from converting from variable rates to fixed rates under these agreements were as follows:
| | | | | | | | | | | | | | |
| | Amount of (Loss) Gain | | | Reclassification from | | | Total Interest Expense | |
| | Recognized in | | | Accumulated Other | | | Presented in the Condensed | |
| | Accumulated Other | | | Comprehensive Income | | | Consolidated Statements of | |
(in thousands) | | Comprehensive | | | | | Amount of | | | Income and Comprehensive | |
For the Three Months Ended June 30, | | Income | | | Location | | Gain | | | Income | |
2024 | | $ | (1,456 | ) | | Interest expense | | $ | 7,619 | | | $ | 17,757 | |
2023 | | | 19,652 | | | Interest expense | | | 6,182 | | | | 20,277 | |
| | | | | | | | | | | | | | |
| | Amount of Gain | | | Reclassification from | | | Total Interest Expense | |
| | Recognized in | | | Accumulated Other | | | Presented in the Condensed | |
| | Accumulated Other | | | Comprehensive Income | | | Consolidated Statements of | |
(in thousands) | | Comprehensive | | | | | Amount of | | | Income and Comprehensive | |
For the Six Months Ended June 30, | | Income | | | Location | | Gain | | | Income | |
2024 | | $ | 10,348 | | | Interest expense | | $ | 15,167 | | | $ | 36,334 | |
2023 | | | 1,753 | | | Interest expense | | | 11,179 | | | | 41,416 | |
Amounts related to the interest rate swaps expected to be reclassified out of Accumulated other comprehensive income to Interest expense during the next twelve months are estimated to be a gain of $25.3 million.
10. Non-Controlling Interests
The following table summarizes OP Units exchanged for shares of common stock:
| | | | | | | | | | | | | | | | |
| | For the Three Months Ended
June 30, | | | For the Six Months Ended
June 30, | |
(in thousands) | | 2024 | | | 2023 | | | 2024 | | | 2023 | |
OP Units exchanged for shares of common stock | | | 32 | | | | 25 | | | | 127 | | | | 921 | |
Value of units exchanged | | $ | 532 | | | $ | 398 | | | $ | 2,068 | | | $ | 15,295 | |
11. Credit Risk Concentrations
The Company maintained bank balances that, at times, exceeded the federally insured limit during the six months ended June 30, 2024. The Company has not experienced losses relating to these deposits and management does not believe that the Company is exposed to any significant credit risk with respect to these amounts based on the financial position and capitalization of the banks.
For the six months ended June 30, 2024 and 2023, the Company had no individual tenants or common franchises that accounted for more than 10% of Lease revenues, net, excluding lease termination fees.
12. Equity
At-the-Market Program (“ATM Program”)
In May 2024, the Company replaced its prior ATM Program with a new ATM Program, through which it may, from time to time, publicly offer and sell shares of common stock having an aggregate gross sales price of up to $400.0 million. The Company’s ATM Program provides for forward sale agreements, enabling the Company to set the price of shares upon pricing the offering, while delaying the issuance of shares and the receipt of the net proceeds. The Company was authorized to publicly offer and sell shares of common stock having an aggregate gross sales price of up to $400.0 million under the prior ATM Program, of which the Company sold shares of common stock having an aggregate gross sales price of $254.6 million. During the six months ended June 30, 2024, and June 30, 2023, no shares were issued under the applicable ATM Program and, as of June 30, 2024, the Company has $400.0 million of available capacity under the new ATM Program.
Share Repurchase Program
The Company has a stock repurchase program (the “Repurchase Program”), which authorizes the Company to repurchase up to $150.0 million of the Company’s common stock. On March 12, 2024, the Company’s Board of Directors re-authorized the Repurchase Program for a 12-month period beginning on March 14, 2024. Under the Repurchase Program, repurchases of the Company’s stock can be made in the open market or through private transactions from time to time over the 12-month period, depending on prevailing market conditions and compliance with applicable legal and regulatory requirements. The timing, manner, price, and amount of any repurchases of common stock under the Repurchase Program will be determined at the Company’s discretion, using available cash resources. During the six months ended June 30, 2024 and 2023, no shares of the Company’s common stock were repurchased under the Repurchase Program.
13. Stock-Based Compensation
Restricted Stock Awards
During the three and six months ended June 30, 2024, the Company awarded 55,064 and 833,007 shares of restricted stock awards (“RSAs”), respectively, to officers, employees and non-employee directors under the Company’s equity incentive plan. During the three and six months ended June 30, 2023, the Company awarded 50,531 and 309,630 shares of RSAs, respectively, to officers, employees and non-employee directors under the Company’s equity incentive plan. The holder of RSAs is generally entitled at all times on and after the date of issuance of the restricted common shares to exercise the rights of a stockholder of the Company, including the right to vote the shares and the right to receive dividends on the shares. The RSAs vest over a one-, three-, four-, or five-year period from the date of the grant and are subject to the holder’s continued service through the applicable vesting dates and in accordance with the terms of the individual award agreements. The weighted average value of awards granted per share during the three and six months ended June 30, 2024, were $15.23 and $14.77, respectively, which were based on the market price per share of the Company’s common stock on the grant dates. The weighted average value of awards granted per share during the three and six months ended June 30, 2023, were $16.33 and $17.52, respectively.
The following table presents information about the Company’s RSAs:
| | | | | | | | | | | | | | | | |
| | For the Three Months Ended
June 30, | | | For the Six Months Ended
June 30, | |
(in thousands) | | 2024 | | | 2023 | | | 2024 | | | 2023 | |
Compensation cost | | $ | 1,346 | | | $ | 932 | | | $ | 2,389 | | | $ | 2,660 | |
Dividends declared on unvested RSAs | | | 300 | | | | 142 | | | | 595 | | | | 278 | |
Fair value of shares vested during the period | | | 762 | | | | 520 | | | | 3,969 | | | | 3,384 | |
As of June 30, 2024, there was $14.4 million of unrecognized compensation costs related to the unvested restricted shares, which is expected to be recognized over a weighted average period of 3.6 years.
The following table presents information about the Company’s restricted stock activity:
| | | | | | | | | | | | | | | | |
| | For the Three Months Ended June 30, | |
| | 2024 | | | 2023 | |
(in thousands, except per share amounts) | | Number of Shares | | | Weighted Average
Grant Date Fair
Value per Share | | | Number of Shares | | | Weighted Average
Grant Date Fair
Value per Share | |
Unvested at beginning of period | | | 1,036 | | | $ | 15.57 | | | | 495 | | | $ | 19.00 | |
Granted | | | 55 | | | | 15.23 | | | | 51 | | | | 16.33 | |
Vested | | | (50 | ) | | | 16.33 | | | | (32 | ) | | | 20.22 | |
Forfeited | | | (5 | ) | | | 16.98 | | | | (6 | ) | | | 18.90 | |
Unvested at end of period | | | 1,036 | | | | 15.51 | | | | 508 | | | | 18.65 | |
| | | | | | | | | | | | | | | | |
| | For the Six Months Ended June 30, | |
| | 2024 | | | 2023 | |
(in thousands, except per share amounts) | | Number of Shares | | | Weighted Average
Grant Date Fair
Value per Share | | | Number of Shares | | | Weighted Average
Grant Date Fair
Value per Share | |
Unvested at beginning of period | | | 492 | | | $ | 18.63 | | | | 396 | | | $ | 20.36 | |
Granted | | | 833 | | | | 14.77 | | | | 310 | | | | 17.52 | |
Vested | | | (259 | ) | | | 18.70 | | | | (192 | ) | | | 20.33 | |
Forfeited | | | (30 | ) | | | 18.68 | | | | (6 | ) | | | 18.90 | |
Unvested at end of period | | | 1,036 | | | | 15.51 | | | | 508 | | | | 18.65 | |
Performance-based Restricted Stock Units
During the six months ended June 30, 2024, the Company issued target grants of 202,308 of performance-based restricted stock units (“PRSUs”), under the Company’s equity incentive plan to the officers of the Company. During the six months ended June 30, 2023, the Company issued target grants of 186,481 of PRSUs. During the three months ended June 30, 2024 and 2023, there were no PRSUs issued. The awards are non-vested restricted stock units where the vesting percentages and the ultimate number of units vesting will be measured 50% based on the relative total shareholder return (“rTSR”) of the Company’s common stock as compared to the rTSR of peer companies, as identified in the grant agreements, over a three-year period, and 50% based on the rTSR of the Company’s common stock as compared to the rTSR of the MSCI US REIT Index over a three year measurement period. Vesting percentages range from 0% to 200% with a target of 100%. rTSR means the percentage appreciation in the fair market value of one share over the three-year measurement period beginning on the date of grant, assuming the reinvestment of dividends on the ex-dividend date. The target number of units is based on achieving a rTSR equal to the 55th percentile of the peer companies and MSCI US REIT Index. For PRSUs issued during the six months ended June 30, 2024 that achieve a percentile rank of at least the 55th percentile, and the absolute rTSR of the Company is negative for the performance period, the awards will be reduced by 25%, not to result in a reduction less than target. Dividends accrue during the measurement period and will be paid on the PRSUs ultimately earned at the end of the measurement period in either cash or common stock, at the discretion of the Compensation Committee of the Board of Directors. The grant date fair value of the PRSUs was measured using a Monte Carlo simulation model based on assumptions including share price volatility.
The following table presents compensation cost recognized on the Company’s performance-based restricted stock units:
| | | | | | | | | | | | | | | | |
| | For the Three Months Ended
June 30, | | | For the Six Months Ended
June 30, | |
(in thousands) | | 2024 | | | 2023 | | | 2024 | | | 2023 | |
Compensation cost | | $ | 727 | | | $ | 607 | | | $ | 1,159 | | | $ | 758 | |
As of June 30, 2024, there was $5.4 million of unrecognized compensation costs related to the unvested PRSUs, which is expected to be recognized over a weighted average period of 2.1 years.
The following table presents information about the Company’s performance-based restricted stock unit activity:
| | | | | | | | | | | | | | | | |
| | For the Three Months Ended June 30, | |
| | 2024 | | | 2023 | |
(in thousands, except per share amounts) | | Number of Shares | | | Weighted Average
Grant Date Fair
Value per Share | | | Number of Shares | | | Weighted Average
Grant Date Fair
Value per Share | |
Unvested at beginning of period | | | 446 | | | $ | 20.89 | | | | 358 | | | $ | 25.01 | |
Granted | | | — | | | | — | | | | — | | | | — | |
Vested | | | — | | | | — | | | | — | | | | — | |
Forfeited | | | — | | | | — | | | | — | | | | — | |
Unvested at end of period | | | 446 | | | | 20.89 | | | | 358 | | | | 25.01 | |
| | | | | | | | | | | | | | | | |
| | For the Six Months Ended June 30, | |
| | 2024 | | | 2023 | |
(in thousands, except per share amounts) | | Number of Shares | | | Weighted Average
Grant Date Fair
Value per Share | | | Number of Shares | | | Weighted Average
Grant Date Fair
Value per Share | |
Unvested at beginning of period | | | 351 | | | $ | 24.90 | | | | 233 | | | $ | 26.27 | |
Granted | | | 202 | | | | 15.84 | | | | 186 | | | | 23.78 | |
Vested | | | (88 | ) | | | 24.40 | | | | — | | | | — | |
Forfeited | | | (19 | ) | | | 25.09 | | | | (61 | ) | | | 26.80 | |
Unvested at end of period | | | 446 | | | | 20.89 | | | | 358 | | | | 25.01 | |
14. Earnings per Share
The following table summarizes the components used in the calculation of basic and diluted earnings per share (“EPS”):
| | | | | | | | | | | | | | | | |
| | For the Three Months Ended
June 30, | | | For the Six Months Ended
June 30, | |
(in thousands, except per share amounts) | | 2024 | | | 2023 | | | 2024 | | | 2023 | |
Basic earnings: | | | | | | | | | | | | |
Net earnings attributable to Broadstone Net Lease, Inc. common
shareholders | | $ | 35,329 | | | $ | 60,014 | | | $ | 100,443 | | | $ | 99,318 | |
Less: earnings allocated to unvested restricted shares | | | (300 | ) | | | (162 | ) | | | (595 | ) | | | (278 | ) |
Net earnings used to compute basic earnings per common share | | $ | 35,029 | | | $ | 59,852 | | | $ | 99,848 | | | $ | 99,040 | |
| | | | | | | | | | | | |
Diluted earnings: | | | | | | | | | | | | |
Net earnings used to compute basic earnings per common share | | $ | 35,029 | | | $ | 59,852 | | | $ | 99,848 | | | $ | 99,040 | |
Add: net earnings attributable to OP unit holders | | | 1,608 | | | | 2,982 | | | | 4,671 | | | | 5,052 | |
Add: undistributed earnings allocated to unvested restricted shares | | | — | | | | 21 | | | | — | | | | — | |
Less: undistributed earnings reallocated to unvested restricted shares | | | — | | | | (20 | ) | | | — | | | | — | |
Net earnings used to compute diluted earnings per common share | | $ | 36,637 | |
| $ | 62,835 | | | $ | 104,519 | |
| $ | 104,092 | |
| | | | | | | | | | | | |
Weighted average number of common shares outstanding | | | 188,470 | | | | 187,237 | | | | 188,211 | | | | 186,901 | |
Less: weighted average unvested restricted shares (a) | | | (1,034 | ) | | | (504 | ) | | | (848 | ) | | | (468 | ) |
Weighted average number of common shares outstanding used in
basic earnings per common share | | | 187,436 | | | | 186,733 | | | | 187,363 | | | | 186,433 | |
Add: effects of restricted stock units (b) | | | 205 | | | | 191 | | | | 180 | | | | 151 | |
Add: effects of convertible OP units (c) | | | 8,829 | | | | 9,304 | | | | 8,836 | | | | 9,564 | |
Weighted average number of common shares outstanding used in
diluted earnings per common share | | | 196,470 | | | | 196,228 | | | | 196,379 | | | | 196,148 | |
| | | | | | | | | | | | |
Basic earnings per share | | $ | 0.19 | | | $ | 0.32 | | | $ | 0.53 | | | $ | 0.53 | |
Diluted earnings per share | | $ | 0.19 | | | $ | 0.32 | | | $ | 0.53 | | | $ | 0.53 | |
(a)Represents the weighted average effects of 1,035,110 and 506,671 unvested restricted shares of common stock as of June 30, 2024 and 2023, respectively, which will be excluded from the computation of earnings per share until they vest.
(b)Represents the weighted average effects of shares of common stock to be issued as though the end of the period were the end of the performance period (see Note 13).
(c)Represents the weighted average effects of 8,800,636 and 9,284,245 OP Units outstanding at June 30, 2024 and 2023, respectively.
15. Supplemental Cash Flow Disclosures
Cash paid for interest was $28.4 million and $39.7 million for the six months ended June 30, 2024 and 2023, respectively. Cash paid for income taxes was $0.8 million and $1.0 million for the six months ended June 30, 2024 and 2023, respectively.
The following are non-cash transactions and have been excluded from the accompanying Condensed Consolidated Statements of Cash Flows:
•During the six months ended June 30, 2024, the Company converted 127,100 OP Units valued at $2.1 million to 127,100 shares of common stock. During the six months ended June 30, 2023, the Company converted 920,561 OP Units valued at $15.3 million to 920,561 shares of common stock.
•At June 30, 2024 and 2023, dividend amounts declared and accrued but not yet paid amounted to $58.0 million and $55.6 million, respectively.
16. Commitments and Contingencies
Litigation
From time to time, the Company is a party to various litigation matters incidental to the conduct of the Company’s business. While the resolution of such matters cannot be predicted with certainty, based on currently available information, the Company does not believe that the final outcome of any of these matters will have a material effect on its consolidated financial position, results of operations, or liquidity.
Property and Acquisition Related
In connection with ownership and operation of real estate, the Company may potentially be liable for costs and damages related to environmental matters. The Company is not aware of any non-compliance, liability, claim, or other environmental condition that would have a material effect on its consolidated financial position, results of operations, or liquidity.
As of June 30, 2024, the Company has a commitment to fund one build-to-suit transaction with a remaining obligation of $43.5 million expected to fund in multiple draws through October 2024, using a combination of available cash on hand and unsecured revolving credit facility borrowings. Rent is contractually scheduled to commence at the earlier of construction completion or October 15, 2024.
The Company is a party to two separate tax protection agreements with the contributing members of two distinct UPREIT transactions and a third tax protection agreement entered into in connection with the Company’s internalization. The tax protection agreements require the Company to indemnify the beneficiaries in the event of a sale, exchange, transfer, or other disposal of the contributed property, and in the case of the tax protection agreement entered into in connection with the Company’s internalization, the entire Company, in a taxable transaction that would cause such beneficiaries to recognize a gain that is protected under the agreements, subject to certain exceptions. The Company is required to allocate an amount of nonrecourse liabilities to each beneficiary that is at least equal to the minimum liability amount, as contained in the agreements. The minimum liability amount and the associated allocation of nonrecourse liabilities are calculated in accordance with applicable tax regulations, are completed at the OP level, and are not probable. Therefore, there is no impact to the Condensed Consolidated Financial Statements. Based on values as of June 30, 2024, taxable sales of the applicable properties would trigger liability under the agreements of approximately $20.4 million. Based on information available, the Company does not believe that the events resulting in damages as detailed above have occurred or are likely to occur in the foreseeable future.
In the normal course of business, the Company enters into various types of commitments to purchase real estate properties. These commitments are generally subject to the Company’s customary due diligence process and, accordingly, a number of specific conditions must be met before the Company is obligated to purchase the properties.
17. Subsequent Events
On July 15, 2024, the Company paid distributions totaling $57.2 million.
On July 25, 2024, the Board of Directors declared a quarterly distribution of $0.29 per share on the Company’s common stock and OP Units for the third quarter of 2024, which will be payable on or before October 15, 2024 to stockholders and OP unitholders of record as of September 30, 2024.
Subsequent to June 30, 2024, the Company paid down $6.0 million, and borrowed $23.5 million on the unsecured revolving credit facility, the proceeds of which were used to fund investment activity and for general corporate purposes.
Subsequent to June 30, 2024, the Company sold a portfolio of five healthcare properties with an aggregate carrying value of approximately $27.9 million for total proceeds of $30.8 million. The Company incurred additional expenses related to the sales of approximately $0.4 million, resulting in a gain on sale of real estate of approximately $2.5 million.
Item 2. Management’s Discussion and Analysis of Financial Condition and Results of Operations
Except where the context suggests otherwise, as used in this Quarterly Report on Form 10-Q, the terms “BNL,” “we,” “us,” “our,” and “our Company” refer to Broadstone Net Lease, Inc., a Maryland corporation incorporated on October 18, 2007, and, as required by context, Broadstone Net Lease, LLC, a New York limited liability company, which we refer to as the or our “OP,” and to their respective subsidiaries.
The following Management’s Discussion and Analysis of Financial Condition and Results of Operations (“MD&A”) is intended to help the reader understand our results of operations and financial condition. This MD&A is provided as a supplement to, and should be read in conjunction with, our Condensed Consolidated Financial Statements and the accompanying Notes to the Condensed Consolidated Financial Statements appearing elsewhere in this Quarterly Report on Form 10-Q.
Cautionary Note Regarding Forward-Looking Statements
This Quarterly Report on Form 10-Q contains forward-looking statements, which reflect our current views regarding our business, financial performance, growth prospects and strategies, market opportunities, and market trends, that are intended to be made pursuant to the safe harbor provisions of Section 27A of the Securities Act of 1933, as amended (the “Securities Act”) and Section 21E of the Securities Exchange Act of 1934, as amended (the “Exchange Act”). Forward-looking statements include all statements that are not historical facts. In some cases, you can identify these forward-looking statements by the use of words such as “outlook,” “believes,” “expects,” “potential,” “continues,” “may,” “will,” “should,” “could,” “seeks,” “approximately,” “projects,” “predicts,” “intends,” “plans,” “estimates,” “anticipates,” or the negative version of these words or other comparable words. All of the forward-looking statements included in this Quarterly Report on Form 10-Q are subject to various risks and uncertainties. Assumptions relating to the foregoing involve judgments with respect to, among other things, future economic, competitive and market conditions, and future business decisions, all of which are difficult or impossible to predict accurately and many of which are beyond our control. Although we believe that the expectations reflected in such forward-looking statements are based on reasonable assumptions, our actual results, performance, and achievements could differ materially from those expressed in or by the forward-looking statements and may be affected by a variety of risks and other factors. Accordingly, there are or will be important factors that could cause actual outcomes or results to differ materially from such forward-looking statements.
Important factors that could cause results to differ materially from the forward-looking statements are described in Item 1. “Business,” Item 1A. “Risk Factors,” and Item 7. “Management’s Discussion and Analysis of Financial Condition and Results of Operations” in our 2023 Annual Report on Form 10-K, as filed with the SEC on February 22, 2024. The “Risk Factors” of our 2023 Annual Report should not be construed as exhaustive and should be read in conjunction with other cautionary statements included elsewhere in this Quarterly Report on Form 10-Q.
You are cautioned not to place undue reliance on any forward-looking statements included in this Quarterly Report on Form 10-Q. All forward-looking statements are made as of the date of this Quarterly Report on Form 10-Q and the risk that actual results, performance, and achievements will differ materially from the expectations expressed in or referenced by this Quarterly Report on Form 10-Q will increase with the passage of time. We undertake no obligation to publicly update or review any forward-looking statement, whether as a result of new information, future developments, or otherwise, except as required by law.
Regulation FD Disclosures
We use any of the following to comply with our disclosure obligations under Regulation FD: U.S. Securities and Exchange Commission (“SEC”) filings, press releases, public conference calls, or our website. We routinely post important information on our website at www.broadstone.com, including information that may be deemed material. We encourage our shareholders and others interested in our company to monitor these distribution channels for material disclosures. Our website address is included in this Quarterly Report as a textual reference only and the information on the website is not incorporated by reference in this Quarterly Report.
Explanatory Note and Certain Defined Terms
Unless the context otherwise requires, the following terms and phrases are used throughout this MD&A as described below:
•“annualized base rent” or “ABR” means the annualized contractual cash rent due for the last month of the reporting period, excluding the impacts of short-term rent deferrals, abatements, or free rent, and adjusted to remove rent from properties sold during the month and to include a full month of contractual cash rent for investments made during the month;
•“investments” or amounts “invested” include real estate investments in new property acquisitions, revenue generating capital expenditures, whereby we agree to fund certain expenditures in exchange for increased rents that often include rent escalations and terms consistent with that of the underlying lease, development funding opportunities, and transitional capital, which represent shorter term investments and currently includes a preferred equity investment, and exclude capitalized costs;
•“cash capitalization rate” represents either (1) for acquisitions and new developments, the estimated first year cash yield to be generated on a real estate investment, which was estimated at the time of investment based on the contractually specified cash base rent for the first full year after the date of the investment, divided by the purchase price for the property excluding capitalized acquisitions costs, or (2) for dispositions, the estimated first year cash yield to be generated subsequent to disposition based on a property’s ABR in effect immediately prior to the disposition, divided by the disposition price, or (3) for transitional capital, the contractual cash yield to be generated on total invested capital;
•“CPI” means the Consumer Price Index for All Urban Consumers (CPI-U): U.S. City Average, All Items, as published by the U.S. Bureau of Labor Statistics, or other similar index which is a measure of the average change over time in the prices paid by urban consumers for a market basket of consumer goods and services;
•“occupancy” or a specified percentage of our portfolio that is “occupied” or “leased” means as of a specified date the quotient of (1) the total rentable square footage of our properties minus the square footage of our properties that are vacant and from which we are not receiving any rental payment, and (2) the total square footage of our properties; and
•“Revolving Credit Facility” means our $1.0 billion unsecured revolving credit facility, dated January 28, 2022, with J.P. Morgan Chase Bank, N.A., as administrative agent, and the other lenders party thereto.
Overview
We are an industrial-focused, diversified net lease real estate investment trust (“REIT”) that invests in primarily single-tenant commercial real estate properties that are net leased on a long-term basis to a diversified group of tenants. As of June 30, 2024, our portfolio includes 777 properties, with 770 properties located in 44 U.S. states and seven properties located in four Canadian provinces.
We focus on investing in real estate that is operated by creditworthy single tenants in industries characterized by positive business drivers and trends. We target properties that are an integral part of the tenants’ businesses and are therefore opportunities to secure long-term net leases through which our tenants are able to retain operational control of their strategically important locations, while allocating their debt and equity capital to fund core business operations rather than real estate ownership.
-Diversified Portfolio. As of June 30, 2024, our portfolio comprised approximately 38.5 million rentable square feet of operational space, was highly diversified based on property type, geography, tenant, and industry, and was cross-diversified within each (e.g., property-type diversification within a geographic concentration):
•Property Type: We are diversified across industrial, restaurant, healthcare, retail, and office property types. Within these sectors, we have meaningful concentrations in manufacturing, distribution and warehouse, food processing, general merchandise, casual dining, and quick service restaurants.
•Geographic Diversification: Our properties are located in 44 U.S. states and four Canadian provinces, with no single geographic concentration exceeding 9.5% of our ABR.
•Tenant and Industry Diversification: Our properties are occupied by approximately 207 different commercial tenants who operate 196 different brands that are diversified across 53 differing industries, with no single tenant accounting for more than 4.1% of our ABR.
-Strong In-Place Leases with Significant Remaining Lease Term. As of June 30, 2024, our portfolio was approximately 99.3% leased with an ABR weighted average remaining lease term of approximately 10.4 years, excluding renewal options.
-Standard Contractual Base Rent Escalation. Approximately 97.4% of our leases have contractual rent escalations, with an ABR weighted average minimum increase of 2.0%.
-Extensive Tenant Financial Reporting. Approximately 94.8% of our tenants, based on ABR, provide financial reporting, of which 86.0% are required to provide us with specified financial information on a periodic basis, and an additional 8.8% of our tenants report financial statements publicly, either through SEC filings or otherwise.
Current Macroeconomic Conditions and Strategic Priorities
Over the last two fiscal years, challenging macroeconomic conditions directly impacted the broader commercial real estate market and, in particular, the net lease real estate market. During the latter half of fiscal 2022, interest rates began to rise steadily and persisted through fiscal 2023, resulting in a challenging lending environment and a material increase in the cost of capital for commercial real estate buyers and lenders. The increase in interest rates accelerated at a more aggressive pace than commercial real estate capitalization rates, thereby compressing earnings on new investments. More recently, market expectations about expansionary monetary policy resulted in net lease real estate sellers maintaining higher pricing expectations, which ultimately led to a significant decrease in transaction volumes during the latter half of 2023 and into 2024. These challenging macroeconomic conditions have limited and may continue to limit the ability of commercial real estate owners, including us, to complete real estate acquisitions at volume and accretion levels consistent with prior years, resulting in lower earnings growth rates compared to historical periods.
Notwithstanding the challenging macroeconomic conditions, we believe that our portfolio performance and strong liquidity profile position our Company well for future opportunities. We expect to achieve growth in revenues and earnings through our four building blocks, including best-in-class portfolio rent escalations, revenue generating capital expenditures with existing tenants thanks to our industrial focus, development funding opportunities provided by the distressed lending environment, and a diversified acquisition pipeline. In addition, as part of our prudent portfolio management, on February 21, 2024, we announced the strategic decision to sell our clinically oriented healthcare properties as part of our healthcare portfolio simplification strategy. Our decision to sell these assets was in part due to our review of our investment pipeline and expectation that we would fully redeploy the proceeds into our core investment verticals of industrial, retail, and restaurant assets without diluting our per share results. Through June 30, 2024, we have sold 38 healthcare properties for gross proceeds of $262.2 million, accounting for approximately 50% of the assets we have identified for disposition as part of our healthcare portfolio simplification strategy. Subsequent to quarter end, we closed on the first of two tranches associated with a portfolio sale of clinically-oriented healthcare assets (the “Portfolio Sale”), selling five properties for gross proceeds of $30.8 million. The second tranche, representing 10 additional properties for $49.5 million, will close in October 2024. In total, the Portfolio Sale will generate $80.3 million of gross proceeds at a weighted average capitalization rate of 7.96%, representing an additional 15% of our planned healthcare simplification strategy sales and completing nearly all previously planned healthcare dispositions for 2024.
Since the announcement of our healthcare portfolio simplification strategy in the fourth quarter of 2023, we have successfully redeployed all of the proceeds from the dispositions of our clinically-oriented healthcare properties. As a result of actual and planned sales from our healthcare portfolio simplification strategy, we have recognized a $64.3 million gain on sale of real estate and incurred $59.7 million of impairment charges through the date of this filing. Outside of gains on sale of real estate and impairments, we do not expect our healthcare portfolio simplification strategy to materially impact our results of operations or financial position.
Our Real Estate Investment Portfolio
The following charts summarize our portfolio diversification by property type, tenant, brand, industry, and geographic location as of June 30, 2024. These portfolio statistics exclude transitional capital investments. The percentages below are calculated based on our ABR of $385.5 million as of June 30, 2024.
Diversification by Property Type
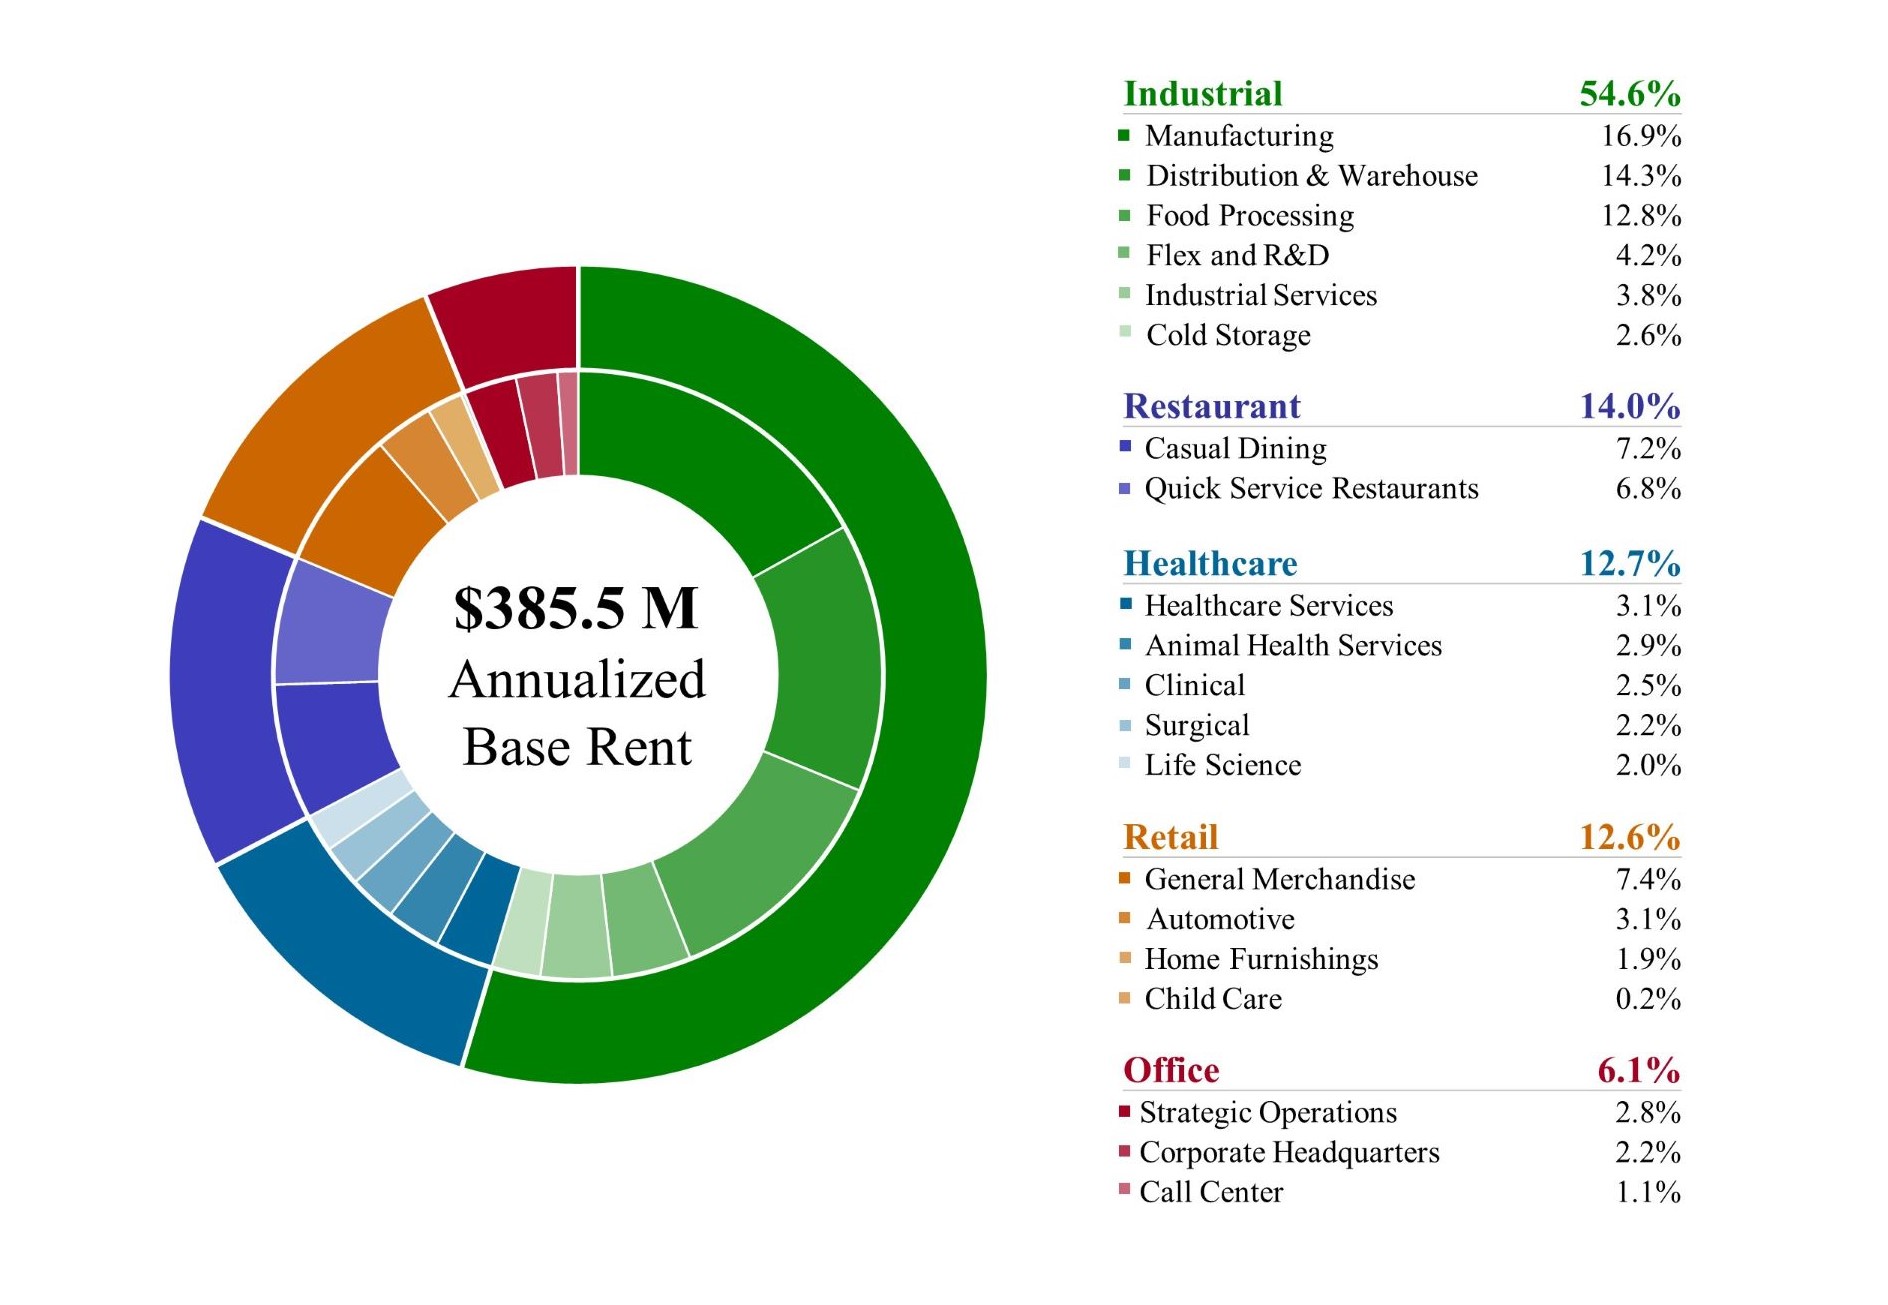
| | | | | | | | | | | | | | | | | | | | |
Property Type | | # Properties | | | ABR (’000s) | | | ABR as a % of Total Portfolio | | | Square Feet (’000s) | | | SF as a % of Total Portfolio | |
Industrial | | | | | | | | | | | | | | | |
Manufacturing | | | 79 | | | $ | 65,334 | | | | 16.9 | % | | | 12,094 | | | | 31.5 | % |
Distribution & Warehouse | | | 48 | | | | 55,025 | | | | 14.3 | % | | | 9,521 | | | | 24.8 | % |
Food Processing | | | 34 | | | | 49,202 | | | | 12.8 | % | | | 5,736 | | | | 14.9 | % |
Flex and R&D | | | 6 | | | | 16,199 | | | | 4.2 | % | | | 1,157 | | | | 3.0 | % |
Industrial Services | | | 29 | | | | 14,659 | | | | 3.8 | % | | | 725 | | | | 1.9 | % |
Cold Storage | | | 4 | | | | 9,977 | | | | 2.6 | % | | | 723 | | | | 1.9 | % |
Untenanted | | | 2 | | | | — | | | | — | | | | 197 | | | | 0.4 | % |
Industrial Total | | | 202 | | | | 210,396 | | | | 54.6 | % | | | 30,153 | | | | 78.4 | % |
Restaurant | | | | | | | | | | | | | | | |
Casual Dining | | | 102 | | | | 27,604 | | | | 7.2 | % | | | 674 | | | | 1.8 | % |
Quick Service Restaurants | | | 151 | | | | 26,382 | | | | 6.8 | % | | | 514 | | | | 1.3 | % |
Restaurant Total | | | 253 | | | | 53,986 | | | | 14.0 | % | | | 1,188 | | | | 3.1 | % |
Healthcare | | | | | | | | | | | | | | | |
Healthcare Services | | | 28 | | | | 11,842 | | | | 3.1 | % | | | 462 | | | | 1.2 | % |
Animal Health Services | | | 27 | | | | 11,208 | | | | 2.9 | % | | | 405 | | | | 1.1 | % |
Clinical | | | 19 | | | | 9,640 | | | | 2.5 | % | | | 425 | | | | 1.1 | % |
Surgical | | | 7 | | | | 8,486 | | | | 2.2 | % | | | 256 | | | | 0.7 | % |
Life Science | | | 8 | | | | 7,673 | | | | 2.0 | % | | | 519 | | | | 1.3 | % |
Untenanted | | | 1 | | | | — | | | | — | | | | 14 | | | | — | |
Healthcare Total | | | 90 | | | | 48,849 | | | | 12.7 | % | | | 2,081 | | | | 5.4 | % |
Retail | | | | | | | | | | | | | | | |
General Merchandise | | | 137 | | | | 28,736 | | | | 7.4 | % | | | 2,118 | | | | 5.5 | % |
Automotive | | | 65 | | | | 12,045 | | | | 3.1 | % | | | 764 | | | | 2.0 | % |
Home Furnishings | | | 13 | | | | 7,265 | | | | 1.9 | % | | | 797 | | | | 2.0 | % |
Child Care | | | 2 | | | | 726 | | | | 0.2 | % | | | 21 | | | | 0.1 | % |
Retail Total | | | 217 | | | | 48,772 | | | | 12.6 | % | | | 3,700 | | | | 9.6 | % |
Office | | | | | | | | | | | | | | | |
Strategic Operations | | | 6 | | | | 10,880 | | | | 2.8 | % | | | 632 | | | | 1.6 | % |
Corporate Headquarters | | | 7 | | | | 8,553 | | | | 2.2 | % | | | 409 | | | | 1.1 | % |
Call Center | | | 2 | | | | 4,049 | | | | 1.1 | % | | | 287 | | | | 0.8 | % |
Office Total | | | 15 | | | | 23,482 | | | | 6.1 | % | | | 1,328 | | | | 3.5 | % |
Total | | | 777 | | | $ | 385,485 | | | | 100.0 | % | | | 38,450 | | | | 100.0 | % |
Diversification by Tenant
| | | | | | | | | | | | | | | | | | | | | | |
Tenant | | Property Type | | # Properties | | | ABR
(’000s) | | | ABR as a %
of Total
Portfolio | | | Square Feet
(’000s) | | | SF as a %
of Total
Portfolio | |
Roskam Baking Company, LLC* | | Food Processing | | | 7 | | | $ | 15,917 | | | | 4.1 | % | | | 2,250 | | | | 5.9 | % |
AHF, LLC* | | Distribution & Warehouse/Manufacturing | | | 8 | | | | 9,612 | | | | 2.5 | % | | | 2,284 | | | | 5.9 | % |
Joseph T. Ryerson & Son, Inc | | Distribution & Warehouse | | | 11 | | | | 7,780 | | | | 2.0 | % | | | 1,599 | | | | 4.2 | % |
Jack’s Family Restaurants LP* | | Quick Service Restaurants | | | 43 | | | | 7,456 | | | | 1.9 | % | | | 147 | | | | 0.4 | % |
Tractor Supply Company | | General Merchandise | | | 23 | | | | 6,353 | | | | 1.7 | % | | | 462 | | | | 1.2 | % |
Axcelis Technologies, Inc. | | Flex and R&D | | | 1 | | | | 6,263 | | | | 1.6 | % | | | 417 | | | | 1.1 | % |
J. Alexander’s, LLC* | | Casual Dining | | | 16 | | | | 6,207 | | | | 1.6 | % | | | 131 | | | | 0.3 | % |
Salm Partners, LLC* | | Food Processing | | | 2 | | | | 6,168 | | | | 1.6 | % | | | 426 | | | | 1.1 | % |
Hensley & Company* | | Distribution & Warehouse | | | 3 | | | | 6,109 | | | | 1.6 | % | | | 577 | | | | 1.5 | % |
Red Lobster Hospitality & Red Lobster Restaurants LLC* | | Casual Dining | | | 18 | | | | 6,061 | | | | 1.6 | % | | | 147 | | | | 0.4 | % |
Total Top 10 Tenants | | | | | 132 | | | | 77,926 | | | | 20.2 | % | | | 8,440 | | | | 22.0 | % |
| | | | | | | | | | | | | | | | | |
Dollar General Corporation | | General Merchandise | | | 60 | | | | 5,980 | | | | 1.6 | % | | | 562 | | | | 1.5 | % |
BluePearl Holdings, LLC** | | Animal Health Services | | | 13 | | | | 5,750 | | | | 1.5 | % | | | 165 | | | | 0.4 | % |
Krispy Kreme Doughnut Corporation | | Quick Service Restaurants/
Food Processing | | | 27 | | | | 5,538 | | | | 1.4 | % | | | 156 | | | | 0.4 | % |
Outback Steakhouse of Florida LLC*1 | | Casual Dining | | | 22 | | | | 5,454 | | | | 1.4 | % | | | 140 | | | | 0.4 | % |
Big Tex Trailer Manufacturing Inc.* | | Automotive/Distribution & Warehouse/Manufacturing/ Corporate Headquarters | | | 17 | | | | 5,157 | | | | 1.3 | % | | | 1,302 | | | | 3.4 | % |
Jelly Belly Candy Company | | Distribution & Warehouse/Food Processing/General Merchandise | | | 5 | | | | 4,650 | | | | 1.2 | % | | | 576 | | | | 1.5 | % |
Nestle’ Dreyer's Ice Cream Company2 | | Cold Storage | | | 1 | | | | 4,611 | | | | 1.2 | % | | | 309 | | | | 0.8 | % |
Carvana, LLC* | | Industrial Services | | | 2 | | | | 4,589 | | | | 1.2 | % | | | 230 | | | | 0.6 | % |
Arkansas Surgical Hospital | | Surgical | | | 1 | | | | 4,587 | | | | 1.2 | % | | | 129 | | | | 0.3 | % |
Klosterman Bakery* | | Food Processing | | | 11 | | | | 4,567 | | | | 1.2 | % | | | 549 | | | | 1.4 | % |
Total Top 20 Tenants | | | | | 291 | | | $ | 128,809 | | | | 33.4 | % | | | 12,558 | | | | 32.7 | % |
1 Tenant’s properties include 20 Outback Steakhouse restaurants and two Carrabba’s Italian Grill restaurants.
2 Nestle’s ABR excludes $1.6 million of rent paid under a sub-lease for an additional property, which will convert to a prime lease no later than August 2024.
* Subject to a master lease.
** Includes properties leased by multiple tenants, some, not all, of which are subject to master leases.
Diversification by Industry
| | | | | | | | | | | | | | | | | | | | |
Tenant Industry | | # Properties | | | ABR (’000s) | | | ABR as a %
of Total
Portfolio | | | Square Feet
(’000s) | | | SF as a %
of Total
Portfolio | |
Restaurants | | | 256 | | | $ | 54,827 | | | | 14.2 | % | | | 1,231 | | | | 3.2 | % |
Packaged Foods & Meats | | | 34 | | | | 45,974 | | | | 11.9 | % | | | 5,347 | | | | 13.9 | % |
Healthcare Facilities | | | 65 | | | | 34,900 | | | | 9.1 | % | | | 1,307 | | | | 3.4 | % |
Specialty Stores | | | 35 | | | | 17,930 | | | | 4.7 | % | | | 1,561 | | | | 4.1 | % |
Distributors | | | 27 | | | | 17,593 | | | | 4.6 | % | | | 2,757 | | | | 7.2 | % |
Auto Parts & Equipment | | | 45 | | | | 16,518 | | | | 4.3 | % | | | 2,888 | | | | 7.5 | % |
Food Distributors | | | 8 | | | | 14,545 | | | | 3.8 | % | | | 1,712 | | | | 4.5 | % |
Home Furnishing Retail | | | 18 | | | | 12,914 | | | | 3.3 | % | | | 1,858 | | | | 4.8 | % |
Specialized Consumer Services | | | 46 | | | | 12,082 | | | | 3.1 | % | | | 716 | | | | 1.9 | % |
Metal & Glass Containers | | | 8 | | | | 10,578 | | | | 2.7 | % | | | 2,206 | | | | 5.7 | % |
General Merchandise Stores | | | 96 | | | | 9,807 | | | | 2.5 | % | | | 880 | | | | 2.3 | % |
Industrial Machinery | | | 20 | | | | 9,793 | | | | 2.5 | % | | | 1,949 | | | | 5.1 | % |
Healthcare Services | | | 18 | | | | 9,766 | | | | 2.5 | % | | | 515 | | | | 1.3 | % |
Forest Products | | | 8 | | | | 9,612 | | | | 2.5 | % | | | 2,284 | | | | 5.9 | % |
Electronic Components | | | 2 | | | | 7,112 | | | | 1.8 | % | | | 466 | | | | 1.2 | % |
Other (38 industries) | | | 88 | | | | 101,534 | | | | 26.5 | % | | | 10,506 | | | | 27.3 | % |
Untenanted properties | | | 3 | | | | — | | | | — | | | | 267 | | | | 0.7 | % |
Total | | | 777 | | | $ | 385,485 | | | | 100.0 | % | | | 38,450 | | | | 100.0 | % |
Diversification by Geographic Location
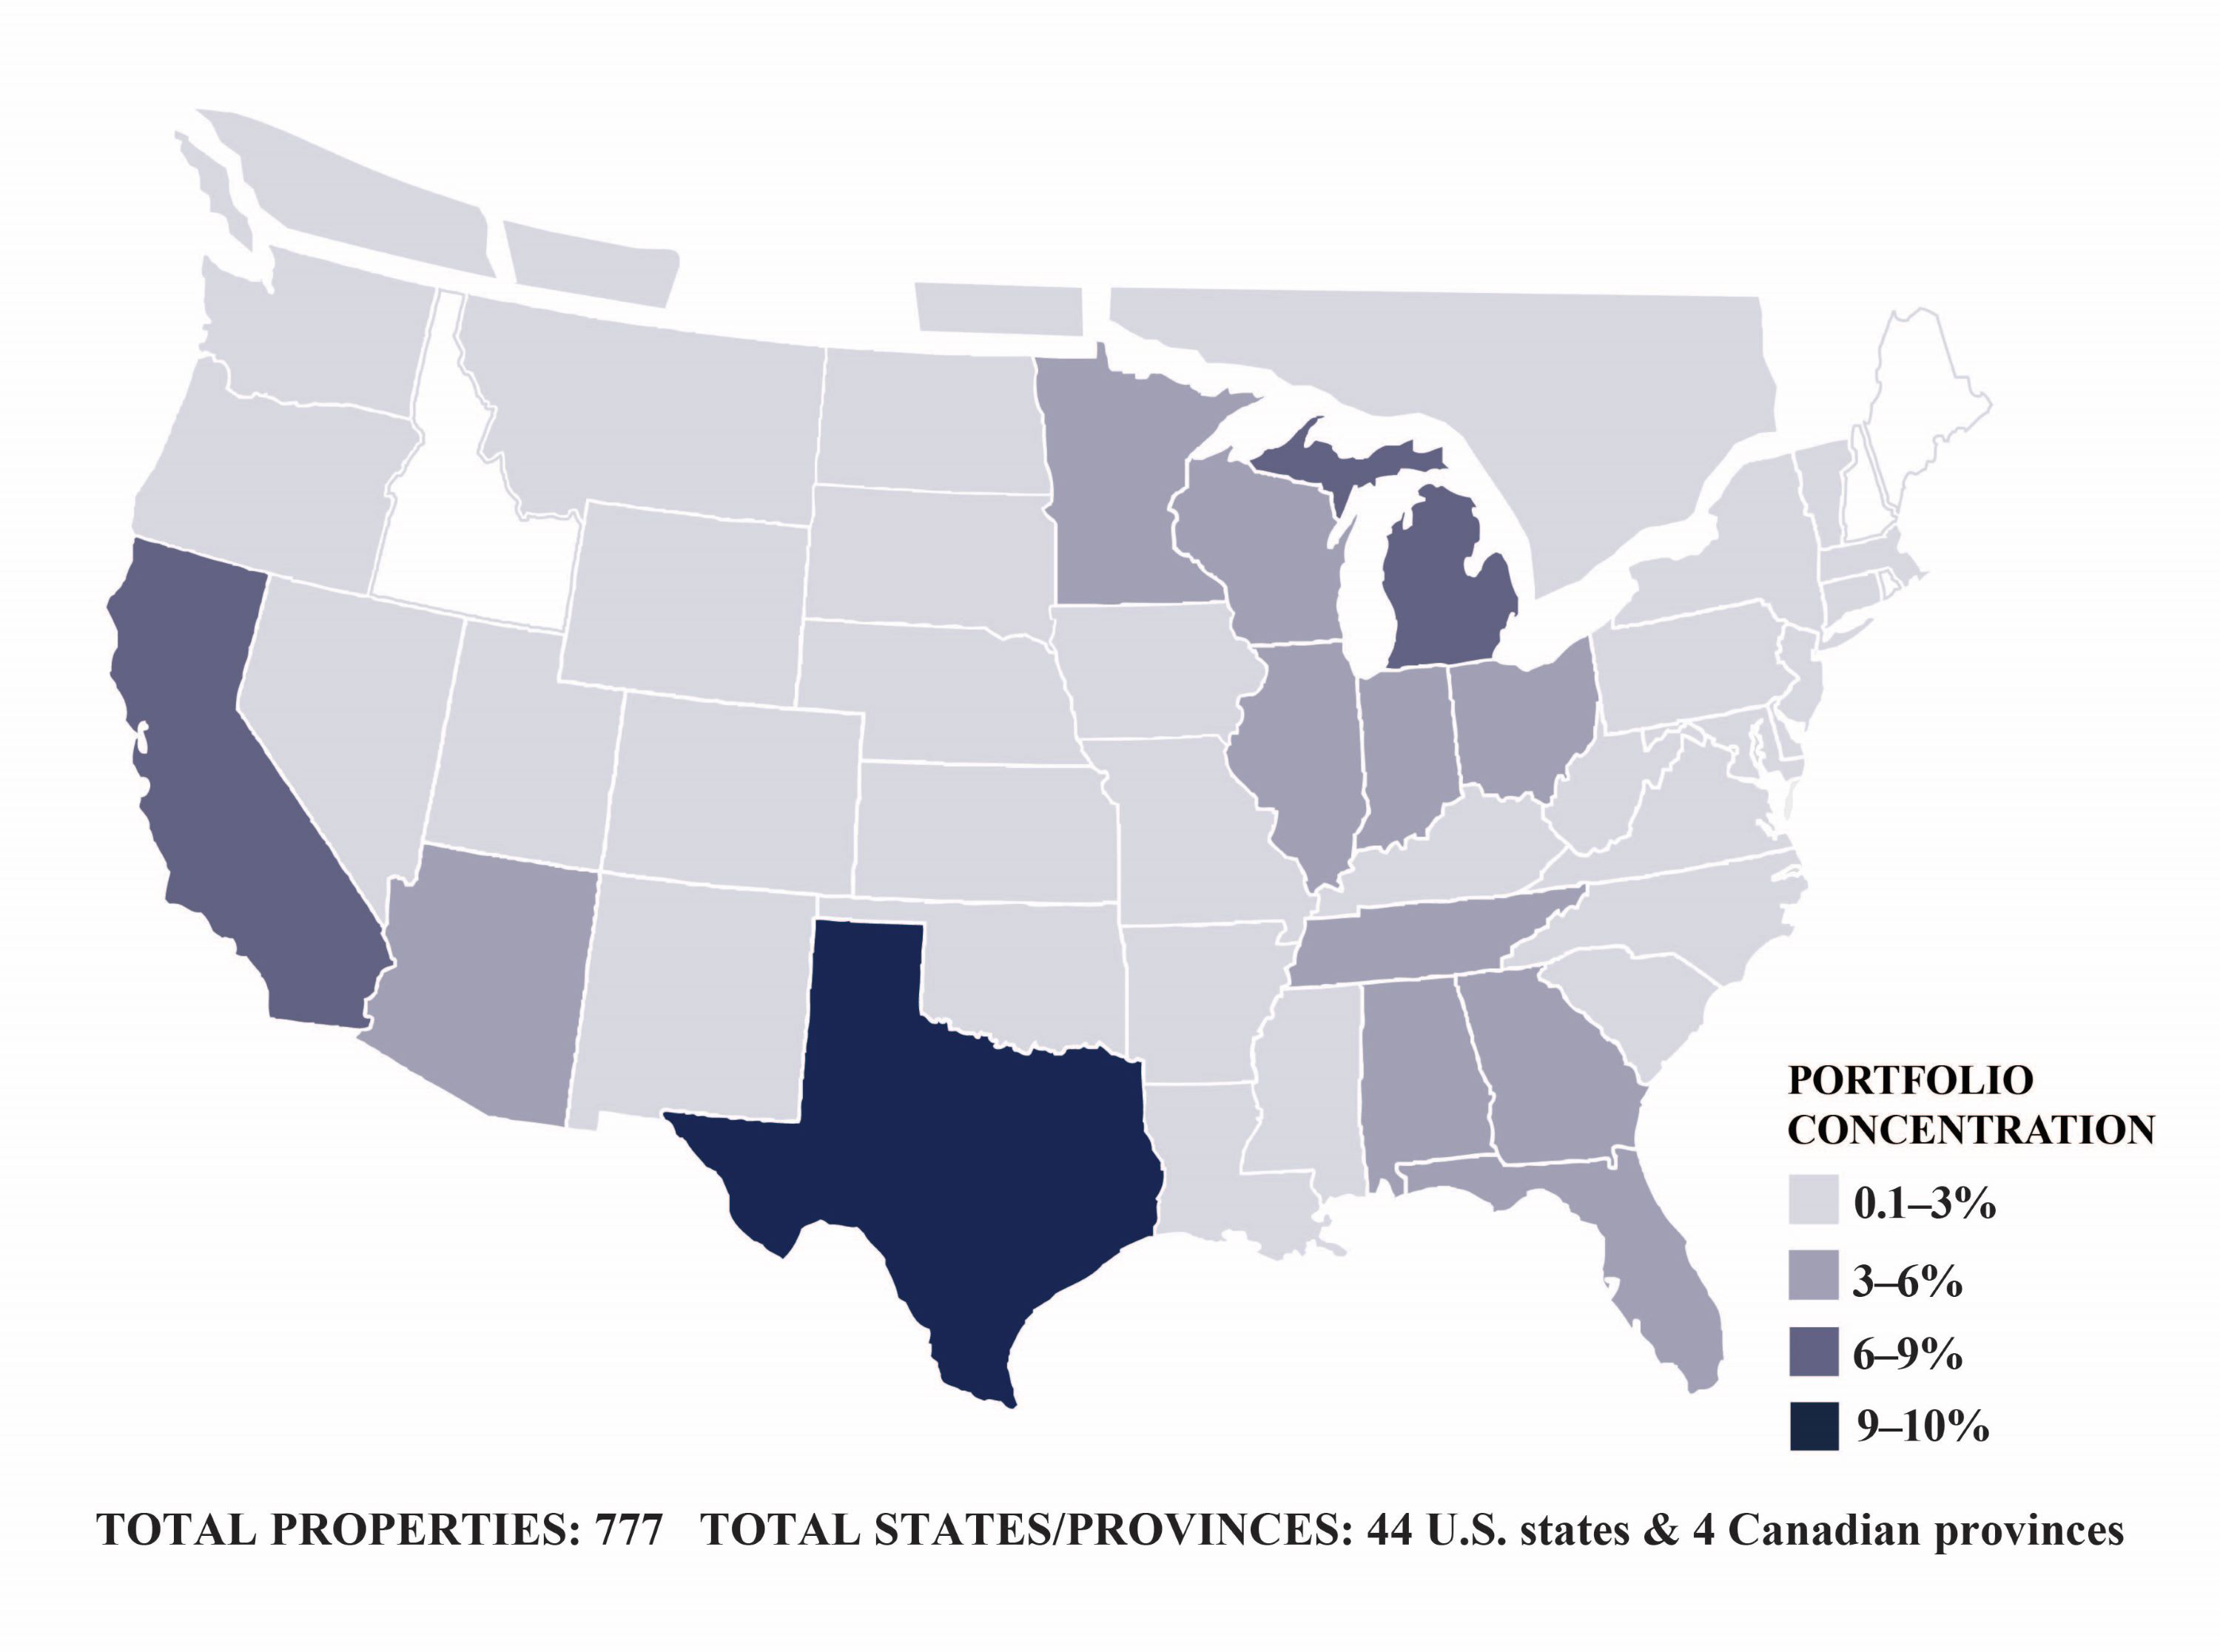
| | | | | | | | | | | | | | | | | | | | | | | | | | | | | | | | | | | | | | | | | | | |
State/
Province | | #
Properties | | | ABR
(’000s) | | | ABR as a
% of Total
Portfolio | | | Square Feet (’000s) | | | SF as a %
of Total
Portfolio | | | | State/
Province | | #
Properties | | | ABR
(’000s) | | | ABR as a
% of Total
Portfolio | | | Square Feet (’000s) | | | SF as a %
of Total
Portfolio | |
TX | | | 67 | | | $ | 36,578 | | | | 9.5 | % | | | 3,615 | | | | 9.4 | % | | | MS | | | 12 | | | | 4,072 | | | | 1.1 | % | | | 607 | | | | 1.6 | % |
MI | | | 54 | | | | 32,805 | | | | 8.5 | % | | | 3,799 | | | | 9.9 | % | | | LA | | | 5 | | | | 3,942 | | | | 1.0 | % | | | 211 | | | | 0.5 | % |
CA | | | 18 | | | | 24,334 | | | | 6.4 | % | | | 2,294 | | | | 6.0 | % | | | SC | | | 15 | | | | 3,854 | | | | 1.0 | % | | | 340 | | | | 0.9 | % |
IL | | | 29 | | | | 22,625 | | | | 5.9 | % | | | 2,364 | | | | 6.1 | % | | | NE | | | 6 | | | | 3,286 | | | | 0.9 | % | | | 509 | | | | 1.3 | % |
WI | | | 30 | | | | 19,435 | | | | 5.0 | % | | | 1,945 | | | | 5.1 | % | | | WA | | | 14 | | | | 3,242 | | | | 0.8 | % | | | 148 | | | | 0.4 | % |
OH | | | 47 | | | | 16,471 | | | | 4.3 | % | | | 1,582 | | | | 4.1 | % | | | IA | | | 4 | | | | 2,869 | | | | 0.7 | % | | | 622 | | | | 1.6 | % |
MN | | | 21 | | | | 15,801 | | | | 4.1 | % | | | 2,500 | | | | 6.5 | % | | | NM | | | 9 | | | | 2,802 | | | | 0.7 | % | | | 107 | | | | 0.3 | % |
FL | | | 38 | | | | 15,149 | | | | 3.9 | % | | | 789 | | | | 2.1 | % | | | CO | | | 4 | | | | 2,545 | | | | 0.7 | % | | | 126 | | | | 0.3 | % |
TN | | | 48 | | | | 15,037 | | | | 3.9 | % | | | 1,084 | | | | 2.8 | % | | | UT | | | 3 | | | | 2,492 | | | | 0.6 | % | | | 280 | | | | 0.7 | % |
IN | | | 28 | | | | 14,824 | | | | 3.8 | % | | | 1,832 | | | | 4.8 | % | | | MD | | | 3 | | | | 2,230 | | | | 0.6 | % | | | 205 | | | | 0.5 | % |
AL | | | 52 | | | | 12,215 | | | | 3.2 | % | | | 863 | | | | 2.2 | % | | | CT | | | 2 | | | | 1,892 | | | | 0.5 | % | | | 55 | | | | 0.1 | % |
AZ | | | 8 | | | | 12,085 | | | | 3.2 | % | | | 895 | | | | 2.3 | % | | | ND | | | 3 | | | | 1,726 | | | | 0.4 | % | | | 48 | | | | 0.1 | % |
GA | | | 33 | | | | 11,966 | | | | 3.1 | % | | | 1,576 | | | | 4.1 | % | | | MT | | | 7 | | | | 1,602 | | | | 0.4 | % | | | 43 | | | | 0.1 | % |
NC | | | 28 | | | | 10,451 | | | | 2.7 | % | | | 1,038 | | | | 2.7 | % | | | DE | | | 4 | | | | 1,180 | | | | 0.3 | % | | | 133 | | | | 0.3 | % |
PA | | | 22 | | | | 9,900 | | | | 2.6 | % | | | 1,836 | | | | 4.8 | % | | | VT | | | 2 | | | | 432 | | | | 0.1 | % | | | 24 | | | | 0.1 | % |
KY | | | 23 | | | | 9,091 | | | | 2.4 | % | | | 927 | | | | 2.4 | % | | | WY | | | 1 | | | | 307 | | | | 0.1 | % | | | 21 | | | | 0.1 | % |
OK | | | 25 | | | | 8,934 | | | | 2.3 | % | | | 1,006 | | | | 2.6 | % | | | NV | | | 1 | | | | 273 | | | | 0.1 | % | | | 6 | | | | 0.0 | % |
MO | | | 19 | | | | 8,919 | | | | 2.3 | % | | | 1,260 | | | | 3.3 | % | | | OR | | | 1 | | | | 136 | | | | 0.0 | % | | | 9 | | | | 0.0 | % |
AR | | | 11 | | | | 7,905 | | | | 2.1 | % | | | 283 | | | | 0.7 | % | | | SD | | | 1 | | | | 81 | | | | 0.0 | % | | | 9 | | | | 0.0 | % |
MA | | | 3 | | | | 6,686 | | | | 1.7 | % | | | 444 | | | | 1.2 | % | | | Total U.S. | | | 770 | | | $ | 377,367 | | | | 97.9 | % | | | 38,020 | | | | 98.8 | % |
NY | | | 24 | | | | 6,631 | | | | 1.7 | % | | | 514 | | | | 1.3 | % | | | BC | | | 2 | | | | 4,769 | | | | 1.3 | % | | | 253 | | | | 0.7 | % |
KS | | | 10 | | | | 5,544 | | | | 1.4 | % | | | 643 | | | | 1.7 | % | | | ON | | | 3 | | | | 2,045 | | | | 0.5 | % | | | 101 | | | | 0.3 | % |
WV | | | 17 | | | | 5,075 | | | | 1.3 | % | | | 884 | | | | 2.3 | % | | | AB | | | 1 | | | | 961 | | | | 0.2 | % | | | 51 | | | | 0.1 | % |
VA | | | 15 | | | | 5,030 | | | | 1.3 | % | | | 178 | | | | 0.5 | % | | | MB | | | 1 | | | | 343 | | | | 0.1 | % | | | 25 | | | | 0.1 | % |
NJ | | | 3 | | | | 4,913 | | | | 1.3 | % | | | 366 | | | | 1.0 | % | | | Total Canada | | | 7 | | | $ | 8,118 | | | | 2.1 | % | | | 430 | | | | 1.2 | % |
| | | | | | | | | | | | | | | | | | Grand Total | | | 777 | | | $ | 385,485 | | | | 100.0 | % | | | 38,450 | | | | 100.0 | % |
Our Leases
The following chart sets forth our lease expirations based upon the terms of the leases in place as of June 30, 2024.
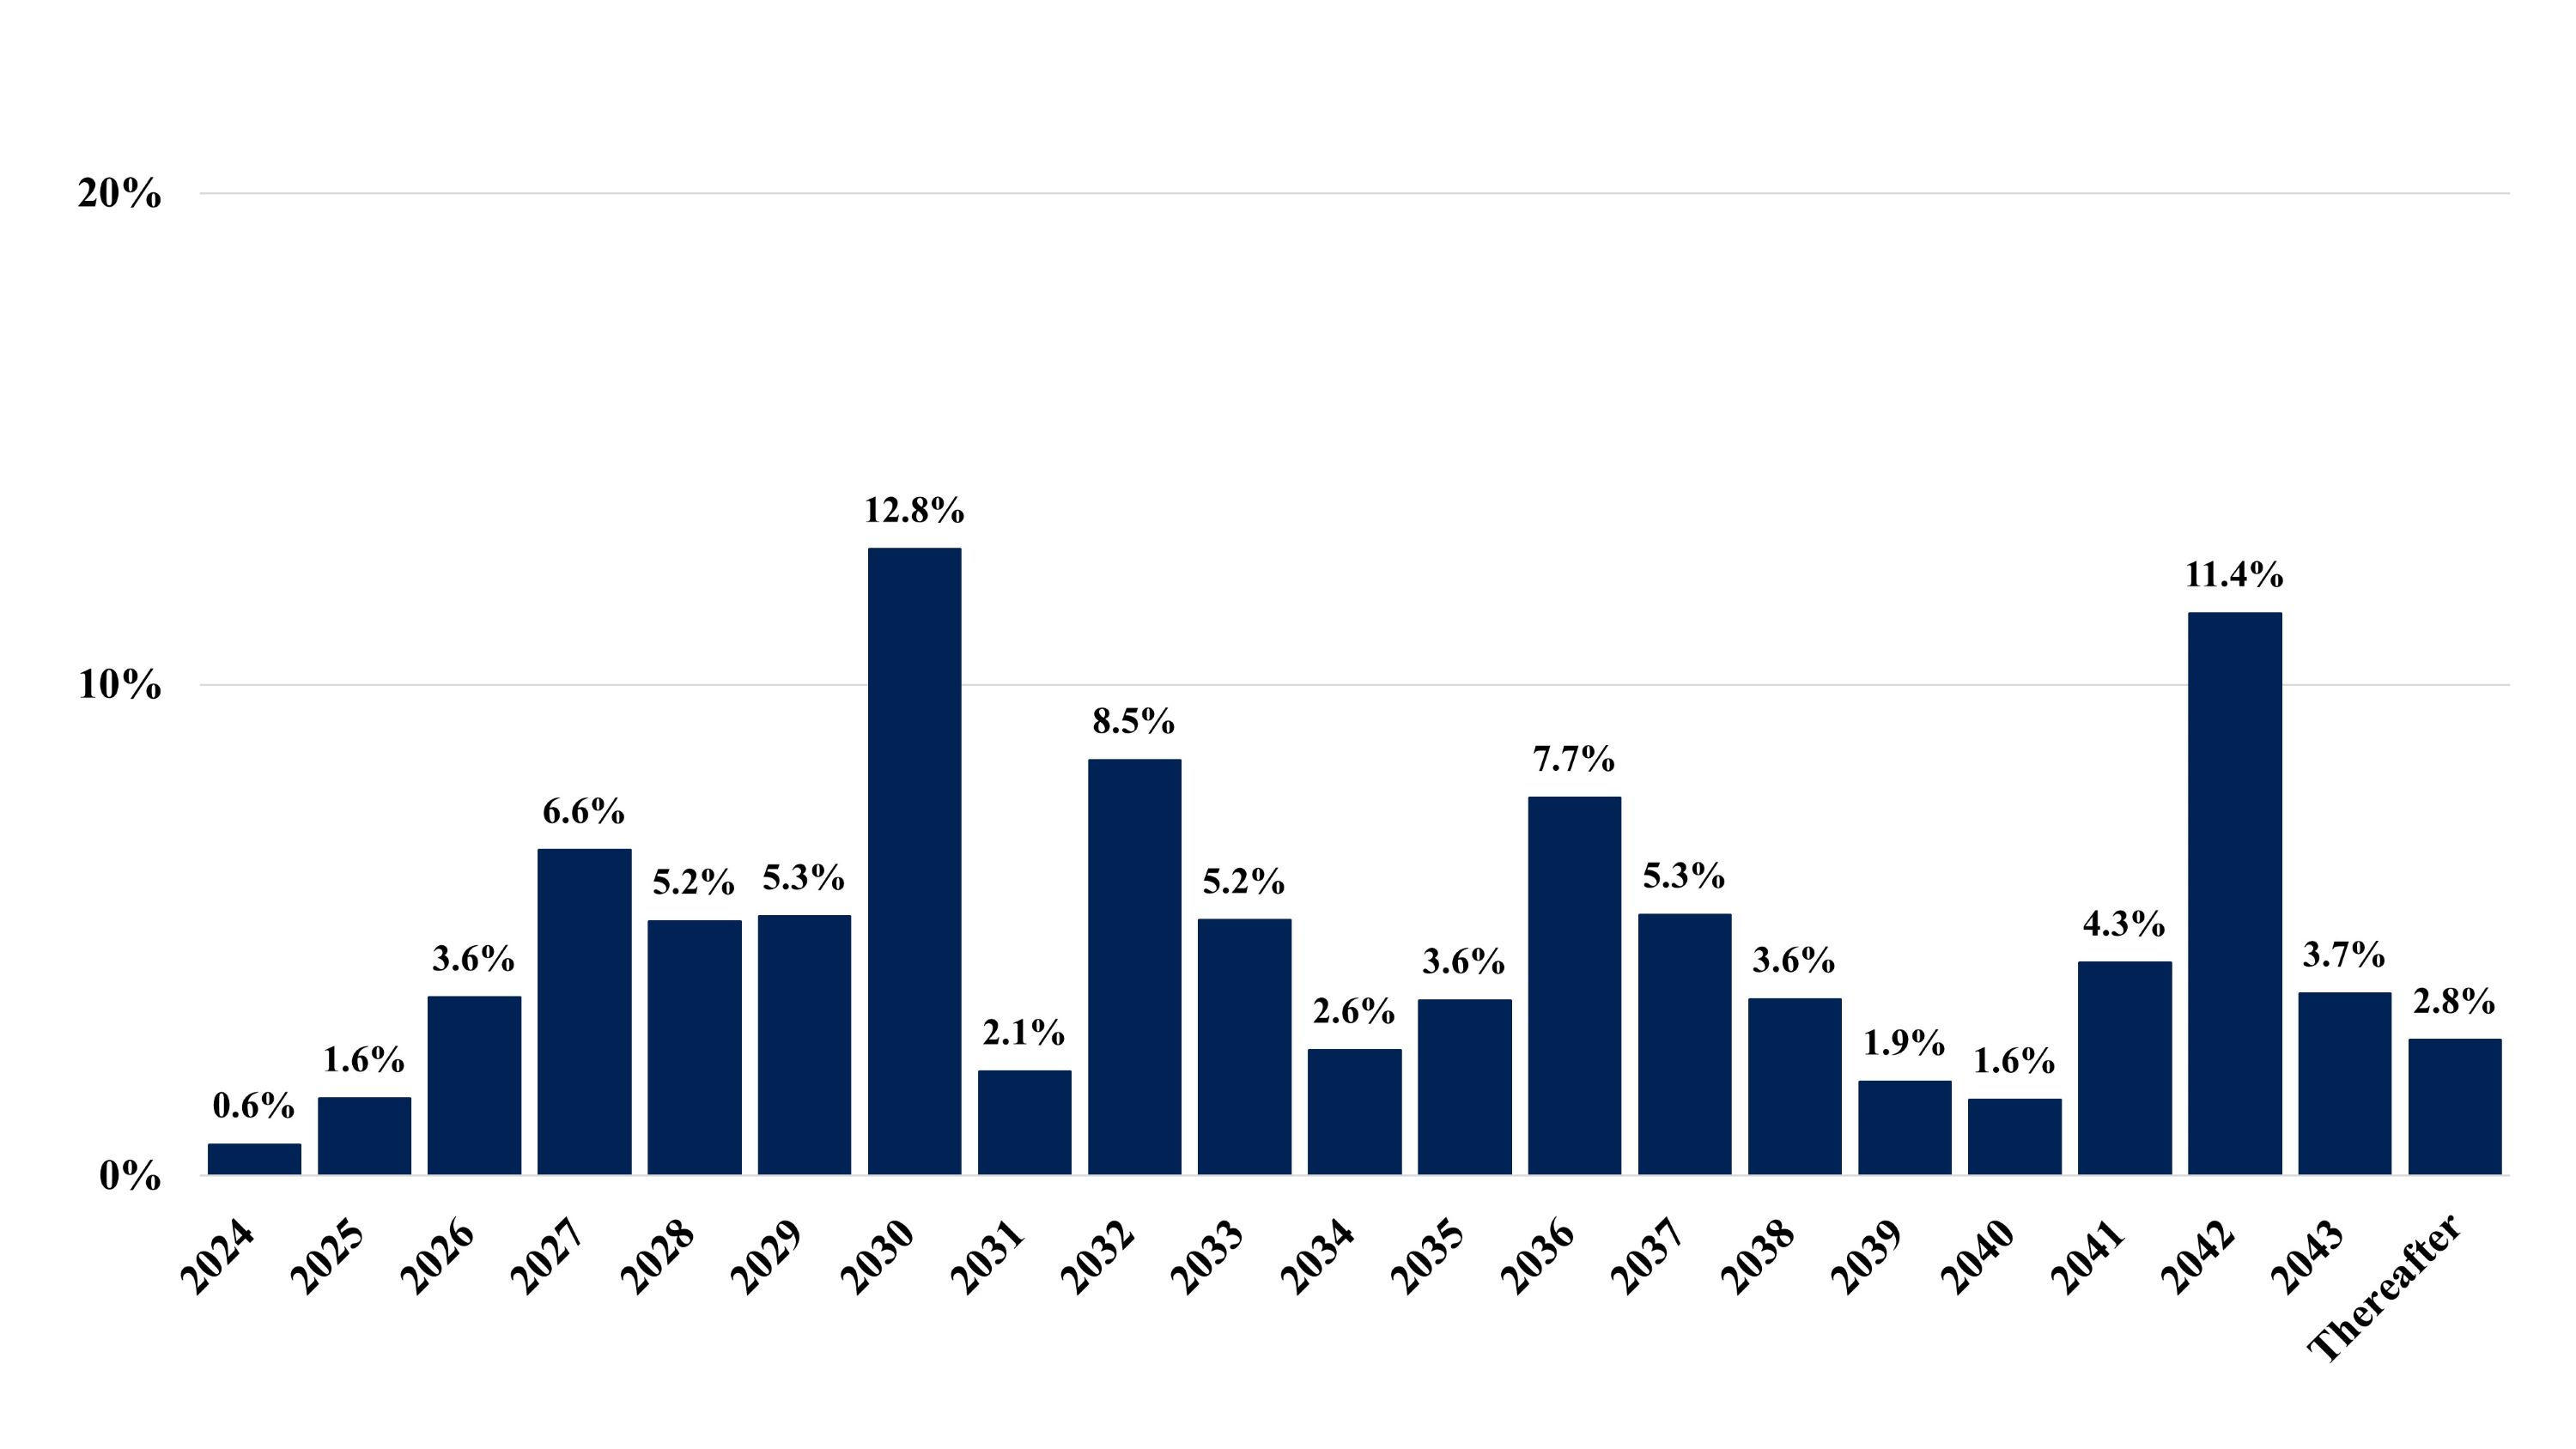
The following table presents certain information based on lease expirations by year. Amounts are in thousands, except for number of properties.
| | | | | | | | | | | | | | | | | | | | |
Year | | # of Properties | | | ABR (’000s) | | | ABR as a % of Total Portfolio | | | Square Feet (’000s) | | | SF as a % of Total Portfolio | |
2024 | | | 1 | | | $ | 2,468 | | | | 0.6 | % | | | 217 | | | | 0.6 | % |
2025 | | | 17 | | | | 6,071 | | | | 1.6 | % | | | 358 | | | | 0.9 | % |
2026 | | | 25 | | | | 13,995 | | | | 3.6 | % | | | 1,017 | | | | 2.6 | % |
2027 | | | 29 | | | | 25,569 | | | | 6.6 | % | | | 2,257 | | | | 5.9 | % |
2028 | | | 29 | | | | 20,003 | | | | 5.2 | % | | | 1,805 | | | | 4.7 | % |
2029 | | | 64 | | | | 20,368 | | | | 5.3 | % | | | 2,679 | | | | 7.0 | % |
2030 | | | 93 | | | | 49,180 | | | | 12.8 | % | | | 4,822 | | | | 12.5 | % |
2031 | | | 32 | | | | 8,199 | | | | 2.1 | % | | | 786 | | | | 2.0 | % |
2032 | | | 62 | | | | 32,634 | | | | 8.5 | % | | | 3,469 | | | | 9.0 | % |
2033 | | | 51 | | | | 20,055 | | | | 5.2 | % | | | 1,598 | | | | 4.2 | % |
2034 | | | 36 | | | | 9,880 | | | | 2.6 | % | | | 957 | | | | 2.5 | % |
2035 | | | 19 | | | | 13,779 | | | | 3.6 | % | | | 2,021 | | | | 5.3 | % |
2036 | | | 90 | | | | 29,682 | | | | 7.7 | % | | | 2,894 | | | | 7.5 | % |
2037 | | | 24 | | | | 20,505 | | | | 5.3 | % | | | 1,578 | | | | 4.1 | % |
2038 | | | 39 | | | | 13,886 | | | | 3.6 | % | | | 1,226 | | | | 3.2 | % |
2039 | | | 10 | | | | 7,385 | | | | 1.9 | % | | | 741 | | | | 1.9 | % |
2040 | | | 31 | | | | 5,987 | | | | 1.6 | % | | | 312 | | | | 0.8 | % |
2041 | | | 39 | | | | 16,728 | | | | 4.3 | % | | | 1,367 | | | | 3.6 | % |
2042 | | | 58 | | | | 44,131 | | | | 11.4 | % | | | 4,803 | | | | 12.5 | % |
2043 | | | 13 | | | | 14,320 | | | | 3.7 | % | | | 944 | | | | 2.5 | % |
Thereafter | | | 12 | | | | 10,660 | | | | 2.8 | % | | | 2,332 | | | | 6.0 | % |
Total leased properties | | | 774 | | | | 385,485 | | | | 100.0 | % | | | 38,183 | | | | 99.3 | % |
Untenanted properties | | | 3 | | | | — | | | | — | | | | 267 | | | | 0.7 | % |
Total properties | | | 777 | | | $ | 385,485 | | | | 100.0 | % | | | 38,450 | | | | 100.0 | % |
Substantially all of our leases provide for periodic contractual rent escalations. As of June 30, 2024, leases contributing 97.4% of our ABR provided for increases in future ABR, generally ranging from 1.5% to 3.0% annually, with an ABR weighted average annual minimum increase equal to 2.0% of base rent. Generally, our rent escalators increase rent on specified dates by a fixed percentage. Our escalations provide us with a source of organic revenue growth and a measure of inflation protection. Additional information on lease escalation frequency and weighted average annual escalation rates as of June 30, 2024 is displayed below:
| | | | | | | | |
Lease Escalation Frequency | | % of ABR | | | Weighted Average Annual Minimum Increase (a) | |
Annually | | | 79.0 | % | | | 2.2 | % |
Every 2 years | | | 0.1 | % | | | 1.8 | % |
Every 3 years | | | 2.3 | % | | | 3.0 | % |
Every 4 years | | | 1.1 | % | | | 2.4 | % |
Every 5 years | | | 8.2 | % | | | 1.7 | % |
Every 6 years | | | 0.1 | % | | | 1.7 | % |
Other escalation frequencies | | | 6.6 | % | | | 1.6 | % |
Flat (b) | | | 2.6 | % | | | — | |
Total/ABR Weighted Average | | | 100.0 | % | | | 2.0 | % |
(a)Represents the ABR weighted average annual minimum increase of the entire portfolio as if all escalations occurred annually. For leases where rent escalates by the greater of a stated fixed percentage or the change in CPI, we have assumed an escalation equal to the stated fixed percentage in the lease. As of June 30, 2024, leases contributing 5.4% of our ABR provide for rent increases equal to the lesser of a stated fixed percentage or the change in CPI. As any future increase in CPI is unknowable at this time, we have not included an increase in the rent pursuant to these leases in the weighted average annual minimum increase presented.
(b)Generally associated with investment grade retail tenants.
The escalation provisions of our leases (by percentage of ABR) as of June 30, 2024, are displayed in the following chart:
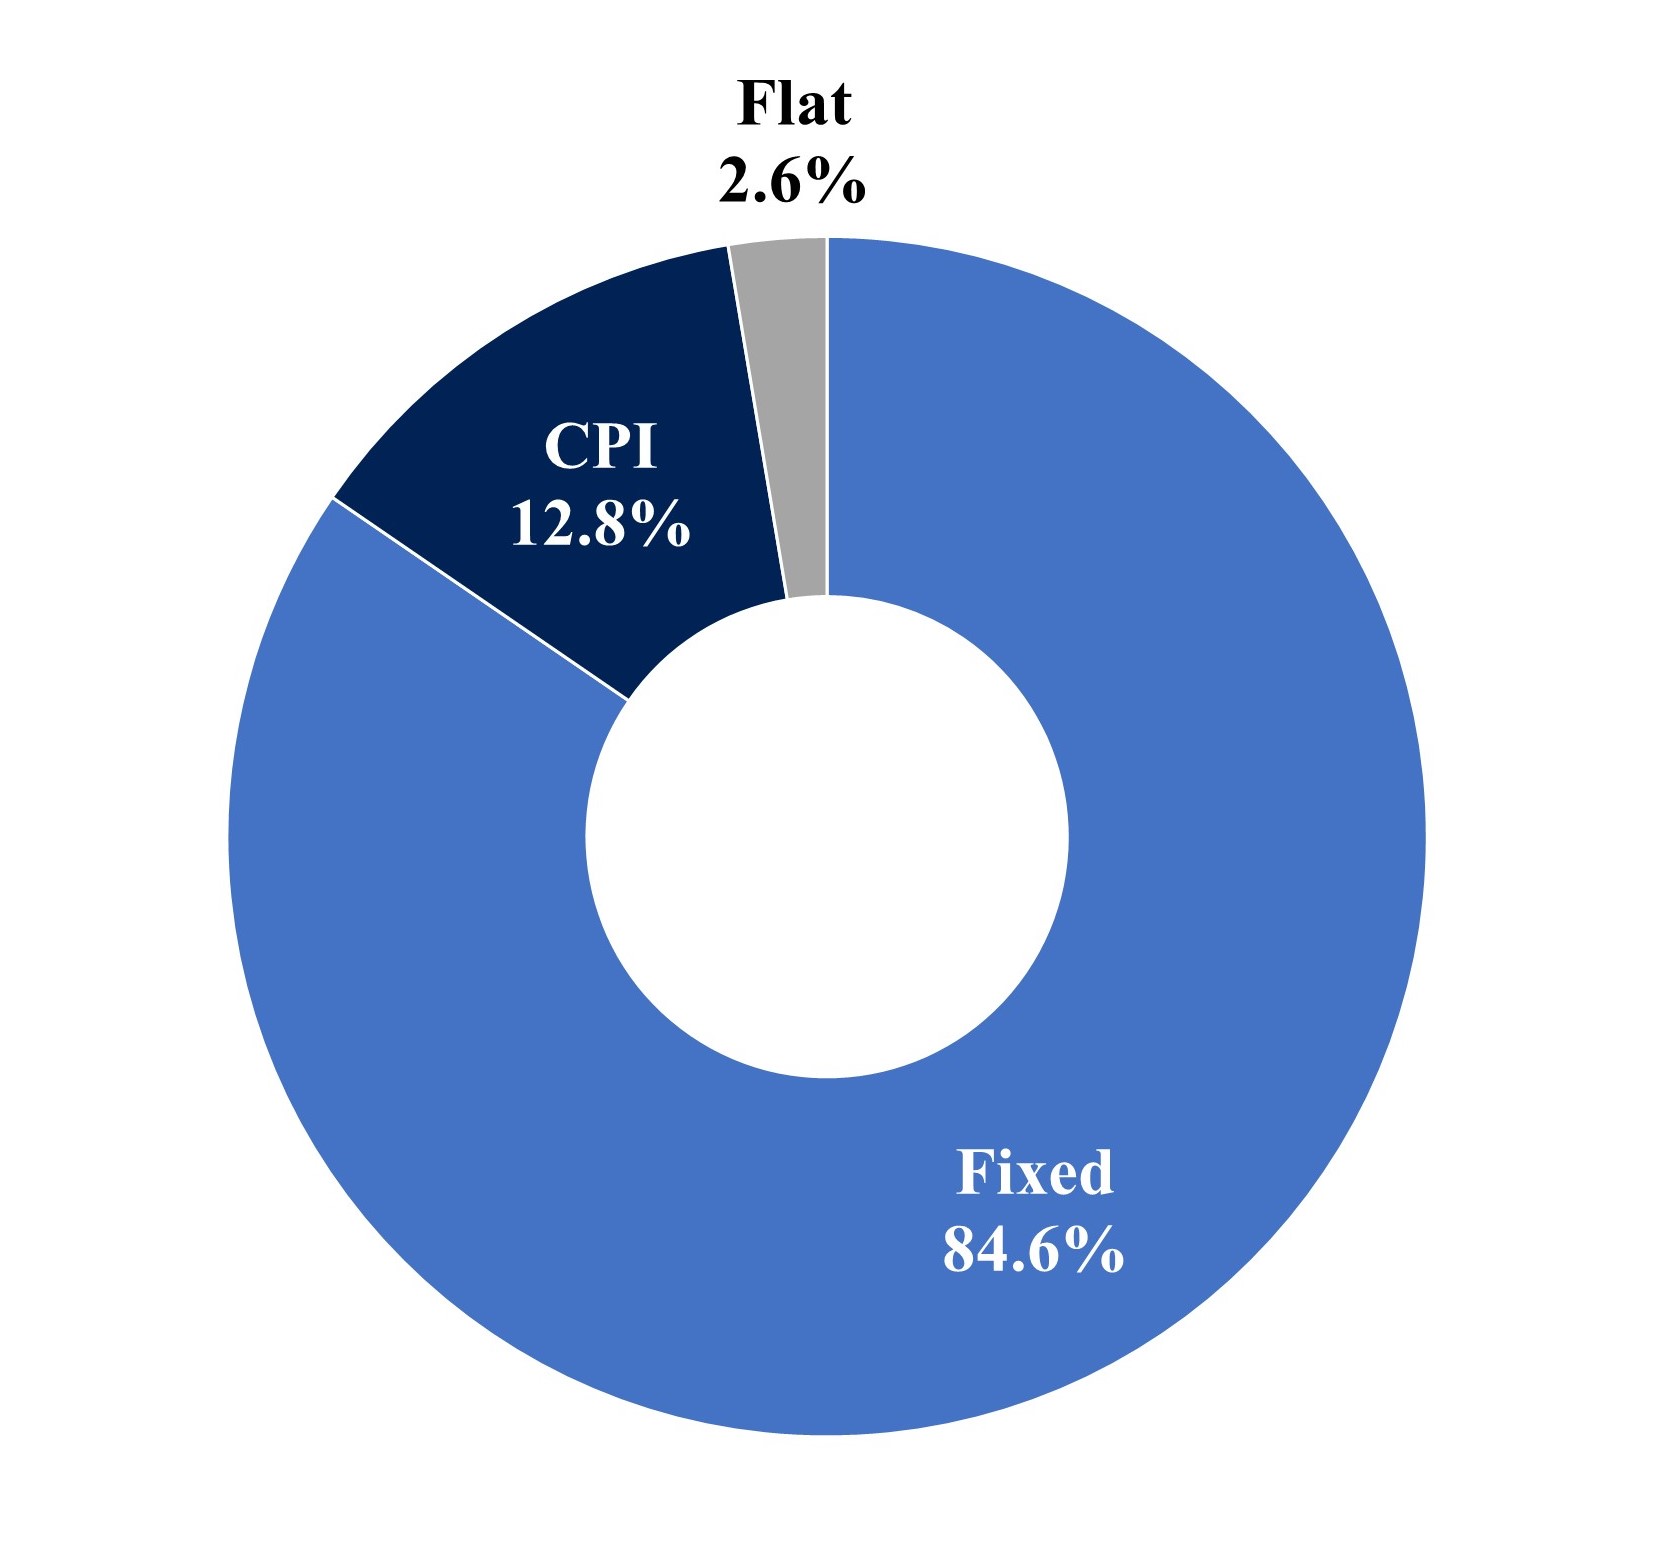
Transitional Capital
In addition to investing in new property acquisitions, revenue generating capital expenditures, and development fundings, we may, from time to time, invest in transitional capital opportunities, including preferred equity interests and real estate lending opportunities. Such investments are intended to be shorter in duration, capitalizing on the distressed lending environment.
The following table presents our transitional capital investments at June 30, 2024:
| | | | |
| | June 30, 2024 | |
Transitional Capital: | | | |
Type | | Preferred Equity | |
Investment (’000s) (a) | | | 52,200 | |
Stabilized cash capitalization rate (b) | | | 8.0 | % |
Annualized initial cash NOI yield | | | 7.6 | % |
Term (years) (c) | | | 3.0 | |
Property type | | Retail Center | |
Underlying property metrics | | | |
Number of retail spaces | | | 28 | |
Rentable square footage (“SF”) (’000s) | | | 332 | |
Weighted avg. lease term (years) | | | 3.6 | |
Occupancy rate (based on SF) (d) | | | 98.7 | % |
Quarterly rent collection | | | 98.4 | % |
(a)Agreement includes commitment to fund up to an additional $7.8 million of preferred capital.
(b)Represents stated yield with unpaid amounts accruing with preferential payment.
(c)Agreement contains two one-year extension options subject to a 0.50% extension fee. Repayment at end of term subject to a $3.5 million repayment fee.
(d)Includes leases that have been executed but have not yet commenced
Results of Operations
The following discussion includes the results of our operations for the periods presented.
Three Months Ended June 30, 2024 Compared to Three Months Ended March 31, 2024
Lease Revenues, net
| | | | | | | | | | | | | | | | | | | | | | | |
| | For the Three Months Ended | | | | | | | | | |
| | June 30, | | March 31, | | Increase/(Decrease) |
(in thousands) | | 2024 | | 2024 | | $ | | % |
Contractual rental amounts billed for operating leases | | $ | | 95,736 | | | | $ | | 97,549 | | | | $ | | (1,813 | ) | | | | (1.9 | ) | % |
Adjustment to recognize contractual operating lease
billings on a straight-line basis | | | | 5,177 | | | | | | 5,104 | | | | | | 73 | | | | | 1.4 | | % |
Net write-offs of accrued rental income | | | | - | | | | | | (2,556 | ) | | | | | 2,556 | | | | | 100.0 | | % |
Variable rental amount earned | | | | 659 | | | | | | 598 | | | | | | 61 | | | | | 10.2 | | % |
Earned income from direct financing leases | | | | 689 | | | | | | 682 | | | | | | 7 | | | | | 1.0 | | % |
Interest income from sales-type leases | | | | 15 | | | | | | 14 | | | | | | 1 | | | | | 7.1 | | % |
Operating expenses billed to tenants | | | | 4,651 | | | | | | 5,105 | | | | | | (454 | ) | | | | (8.9 | ) | % |
Other income from real estate transactions | | | | 12 | | | | | | 66 | | | | | | (54 | ) | | | | (81.8 | ) | % |
Adjustment to revenue recognized for uncollectible
rental amounts billed, net | | | | (1,032 | ) | | | | | (1,196 | ) | | | | | 164 | | | | | 13.7 | | % |
Total Lease revenues, net | | $ | | 105,907 | | | | $ | | 105,366 | | | | $ | | 541 | | | | | 0.5 | | % |
The increase in Lease revenues, net, was primarily attributable to a decrease in the write off of accrued rental income of $2.6 million. Write offs are discrete charges in a quarter related to collection probabilities, and fluctuate quarter to quarter. The increase was partially offset by a decrease in contractual rental amounts of $1.8 million, primarily due to the timing of the majority of our 2024 dispositions which occurred at the end of the three months ended March 31, 2024, compared to our redeployment into new properties which occurred during the three months ended June 30, 2024.
Operating Expenses
| | | | | | | | | | | | | | | | | |
| | For the Three Months Ended | | | | | | | | |
| | June 30, | | | March 31, | | | Increase/(Decrease) |
(in thousands) | | 2024 | | | 2024 | | | $ | | | % |
Operating expenses | | | | | | | | | | | | | |
Depreciation and amortization | | $ | 37,404 | | | $ | 37,772 | | | $ | (368 | ) | | | (1.0 | ) | % |
Property and operating expense | | | 5,303 | | | | 5,660 | | | | (357 | ) | | | (6.3 | ) | % |
General and administrative | | | 9,904 | | | | 9,432 | | | | 472 | | | | 5.0 | | % |
Provision for impairment of investment in rental properties | | | 3,852 | | | | 26,400 | | | | (22,548 | ) | | | (85.4 | ) | % |
Total operating expenses | | $ | 56,463 | | | $ | 79,264 | | | $ | (22,801 | ) | | | (28.8 | ) | % |
Provision for impairment of investment in rental properties
The amount of impairment recognized varies quarter-to-quarter based on individual facts and circumstances during the quarter. The following table presents the impairment charges for the respective periods:
| | | | | | | | |
| | For the Three Months Ended | |
| | June 30, | | | March 31, | |
(in thousands, except number of properties) | | 2024 | | | 2024 | |
Number of properties | | | 2 | | | | 12 | |
Carrying value prior to impairment charge | | $ | 14,850 | | | $ | 83,924 | |
Fair value | | | 10,998 | | | | 57,524 | |
Impairment charge | | $ | 3,852 | | | $ | 26,400 | |
The $3.9 million impairment charges during the second quarter of 2024 resulted from changes in our long-term hold strategy with respect to the individual properties. The impairments during the first and second quarter of 2024 primarily related to our strategic decision to sell our clinically-oriented healthcare properties as part of our healthcare portfolio simplification strategy. The timing and amount of impairment fluctuates from period to period depending on the specific facts and circumstances.
Other income (expenses)
| | | | | | | | | | | | | | | | | | | | | | | |
| | For the Three Months Ended | | | | | | | | | |
| | June 30, | | March 31, | | Increase/(Decrease) |
(in thousands) | | 2024 | | 2024 | | $ | | % |
Other income (expenses) | | | | | | | | | | | | | | | | | | | |
Interest income | | $ | | 649 | | | | $ | | 233 | | | | $ | | 416 | | | | > 100.0 | | % |
Interest expense | | | | (17,757 | ) | | | | | (18,578 | ) | | | | | (821 | ) | | | | (4.4 | ) | % |
Gain on sale of real estate | | | | 3,384 | | | | | | 59,132 | | | | | | (55,748 | ) | | | | (94.3 | ) | % |
Income taxes | | | | (531 | ) | | | | | (408 | ) | | | | | 123 | | | | | 30.1 | | % |
Other income (expenses) | | | | 748 | | | | | | 1,696 | | | | | | (948 | ) | | | | (55.9 | ) | % |
Gain on sale of real estate
Our recognition of a gain or loss on the sale of real estate varies from transaction to transaction based on fluctuations in asset prices and demand in the real estate market. During the three months ended June 30, 2024, we recognized a gain of $3.4 million on the sale of three properties, compared to a gain of $59.1 million on the sale of 37 properties during the three months ended March 31, 2024, excluding the impact of impairments recognized with these sales.
Other income (expenses)
The increase in other income (expense) is due to the fluctuation of realized and unrealized foreign exchange gains/losses. For the three months ended June 30, 2024, there was a $0.7 million foreign exchange gain compared to a $1.7 million foreign exchange gain during the three months ended March 31, 2024.
Net income and Net earnings per diluted share
| | | | | | | | | | | | | | | | | |
| | For the Three Months Ended | | | | | | | | |
| | June 30, | | | March 31, | | | Increase/(Decrease) |
(in thousands, except per share data) | | 2024 | | | 2024 | | | $ | | | % |
Net income | | $ | 35,937 | | | $ | 68,177 | | | $ | (32,240 | ) | | | (47.3 | ) | % |
Net earnings per diluted share | | | 0.19 | | | | 0.35 | | | | (0.16 | ) | | | (45.7 | ) | % |
The decrease in net income is primarily attributable to a $55.7 million decrease in gain on the sale of real estate which was offset by a $22.5 million decrease in provision for impairment of investment in rental properties.
GAAP net income includes items such as gain or loss on sale of real estate and provisions for impairment, among others, which can vary from quarter to quarter and impact period-over-period comparisons.
Six Months Ended June 30, 2024 Compared to Six Months Ended June 30, 2023
Lease Revenues, net
| | | | | | | | | | | | | | | | | | | | | | | |
| | For the Six Months Ended | | | | | | | | | |
| | June 30, | | Increase/(Decrease) |
(in thousands) | | 2024 | | 2023 | | $ | | % |
Contractual rental amounts billed for operating leases | | $ | | 193,285 | | | | $ | | 194,558 | | | | $ | | (1,273 | ) | | | | (0.7 | ) | % |
Adjustment to recognize contractual operating lease
billings on a straight-line basis | | | | 10,281 | | | | | | 14,750 | | | | | | (4,469 | ) | | | | (30.3 | ) | % |
Net write-offs of accrued rental income | | | | (2,556 | ) | | | | | (105 | ) | | | | | (2,451 | ) | | | < (100.0) | | % |
Variable rental amount earned | | | | 1,257 | | | | | | 793 | | | | | | 464 | | | | | 58.5 | | % |
Earned income from direct financing leases | | | | 1,371 | | | | | | 1,380 | | | | | | (9 | ) | | | | (0.7 | ) | % |
Interest income from sales-type leases | | | | 29 | | | | | | 29 | | | | | | — | | | | | — | | % |
Operating expenses billed to tenants | | | | 9,756 | | | | | | 9,669 | | | | | | 87 | | | | | 0.9 | | % |
Other income from real estate transactions | | | | 79 | | | | | | 7,395 | | | | | | (7,316 | ) | | | | (98.9 | ) | % |
Adjustment to revenue recognized for uncollectible
rental amounts billed, net | | | | (2,228 | ) | | | | | (124 | ) | | | | | (2,104 | ) | | | < (100.0) | | % |
Total Lease revenues, net | | $ | | 211,274 | | | | $ | | 228,345 | | | | $ | | (17,071 | ) | | | | (7.5 | ) | % |
The decrease in Lease revenues, net was primarily attributable to a decrease in lease termination income (Other income from real estate transactions). Lease termination income for the six months ended June 30, 2023 was $7.5 million. There was no lease termination income for the six months ended June 30, 2024. Additionally, the decrease was due to a $4.5 million decrease in the amount of GAAP revenues recorded on a straight-line basis due to timing difference from first quarter dispositions and redeployment of those proceeds in the second quarter, an increase in write-off of accrued rental income of $2.5 million, an increase in adjustment to revenue recognized for uncollectible rental amounts of $2.1 million, and a decrease in contractual rental amounts billed of $1.3 million.
Operating Expenses
| | | | | | | | | | | | | | | | | |
| | For the Six Months Ended | | | | | | | | |
| | June 30, | | | Increase/(Decrease) |
(in thousands) | | 2024 | | | 2023 | | | $ | | | % |
Operating expenses | | | | | | | | | | | | | |
Depreciation and amortization | | $ | 75,176 | | | $ | 80,815 | | | $ | (5,639 | ) | | | (7.0 | ) | % |
Property and operating expense | | | 10,963 | | | | 10,874 | | | | 89 | | | | 0.8 | | % |
General and administrative | | | 19,336 | | | | 19,899 | | | | (563 | ) | | | (2.8 | ) | % |
Provision for impairment of investment in rental properties | | | 30,252 | | | | 1,473 | | | | 28,779 | | | > 100.0 | | % |
Total operating expenses | | $ | 135,727 | | | $ | 113,061 | | | $ | 22,666 | | | | 20.0 | | % |
Depreciation and amortization
The decrease in depreciation and amortization for the six months ended June 30, 2024 was primarily due to net dispositions during the first quarter of 2024 and the timing of redeployment into new properties during the second quarter of 2024.
Provision for impairment of investment in rental properties
The following table presents the impairment charges for the respective periods:
| | | | | | | | |
| | For the Six Months Ended | |
| | June 30, | |
(in thousands, except number of properties) | | 2024 | | | 2023 | |
Number of properties | | | 14 | | | | 1 | |
Carrying value prior to impairment charge | | $ | 98,774 | | | $ | 4,236 | |
Fair value | | | 68,522 | | | | 2,763 | |
Impairment charge | | $ | 30,252 | | | $ | 1,473 | |
The $30.3 million impairment charges during the six months ended June 30, 2024 resulted from changes in the Company’s long-term hold strategy with respect to the individual properties and were primarily based on actual and expected sales prices. Such impairments primarily related to our strategic decision to sell our clinically-oriented healthcare properties as part of our healthcare portfolio simplification strategy. The timing and amount of impairment fluctuates from period to period depending on the specific facts and circumstances.
Other income (expenses)
| | | | | | | | | | | | | | | | | | | | | | | |
| | For the Six Months Ended | | | | | | | | | |
| | June 30, | | Increase/(Decrease) |
(in thousands) | | 2024 | | 2023 | | $ | | % |
Other income (expenses) | | | | | | | | | | | | | | | | | | | |
Interest income | | $ | | 882 | | | | $ | | 244 | | | | $ | | 638 | | | | > 100.0 | | % |
Interest expense | | | | (36,334 | ) | | | | | (41,416 | ) | | | | | (5,082 | ) | | | | (12.3 | ) | % |
Gain on sale of real estate | | | | 62,515 | | | | | | 32,877 | | | | | | 29,638 | | | | | 90.1 | | % |
Income taxes | | | | (939 | ) | | | | | (927 | ) | | | | | 12 | | | | | 1.3 | | % |
Other income (expenses) | | | | 2,443 | | | | | | (1,692 | ) | | | | | 4,135 | | | | > 100.0 | | % |
Interest expense
The decrease in interest expense reflects a decrease in average outstanding borrowings. Since June 30, 2023, we decreased total outstanding borrowings by $46.0 million primarily through proceeds from dispositions. This was partially offset by an increase in our weighted average cost of borrowings, relating to our variable-rate USD Revolving Credit Facility borrowings. At June 30, 2024, the one-month SOFR rate was 5.34%, compared with 5.14% at June 30, 2023.
Gain on sale of real estate
Our recognition of a gain or loss on the sale of real estate varies from transaction to transaction based on fluctuations in asset prices and demand in the real estate market. During the six months ended June 30, 2024, we recognized a gain of $62.5 million on the sale of 40 properties, compared to a gain of $32.9 million on the sale of seven properties during the six months ended June 30, 2023.
Other income (expenses)
The increase in other income (expenses) during the six months ended June 30, 2024 was primarily due to a $2.4 million foreign exchange gain recognized on the quarterly remeasurement of our $100 million Canadian Dollars (“CAD”) Revolving Credit Facility borrowings, compared to a $1.7 million unrealized foreign exchange loss recognized during the six months ended June 30, 2023.
Net income and Net earnings per diluted share
| | | | | | | | | | | | | | | | | |
| | For the Six Months Ended | | | | | | | | |
| | June 30, | | | Increase/(Decrease) |
(in thousands, except per share data) | | 2024 | | | 2023 | | | $ | | | % |
Net income | | $ | 104,114 | | | $ | 104,370 | | | $ | (256 | ) | | | (0.2 | ) | % |
Net earnings per diluted share | | | 0.53 | | | | 0.53 | | | | - | | | | - | | % |
The decrease in net income is primarily due to an increase in the provision for impairment of investment in rental properties of $28.8 million and a decrease total lease revenue of $17.1 million. These factors were partially offset by a $29.6 million increase in gain on sale of real estate, a decrease of $5.6 million in depreciation and amortization, a decrease of $5.1 million in interest expense, and a $4.1 million increase in other income (expense).
GAAP net income includes items such as gain or loss on sale of real estate and provisions for impairment, among others, which can vary from quarter to quarter and impact period-over-period comparisons.
Liquidity and Capital Resources
General
We acquire real estate using a combination of debt and equity capital and with cash from operations that is not otherwise distributed to our stockholders, and proceeds from dispositions of real estate properties. Our focus is on maximizing the risk-adjusted return to our stockholders through an appropriate balance of debt and equity in our capital structure. We are committed to maintaining an investment grade balance sheet through active management of our leverage profile and overall liquidity position. We believe our leverage strategy has allowed us to take advantage of the lower cost of debt while simultaneously strengthening our balance sheet, as evidenced by our current investment grade credit ratings of ‘BBB’ from S&P and ‘Baa2’ from Moody’s. We seek to maintain on a sustained basis a Leverage Ratio that is generally less than 6.0x. As of June 30, 2024, we had total debt outstanding of $1.9 billion, Net Debt of $1.9 billion, a Net Debt to Annualized Adjusted EBITDAre ratio of 5.1x, and a Pro Forma Net Debt to Annualized Adjusted EBITDAre ratio of 4.9x.
Net Debt and Annualized Adjusted EBITDAre are non-GAAP financial measures, and Annualized Adjusted EBITDAre is calculated based upon EBITDA, EBITDAre, and Adjusted EBITDAre, each of which is also a non-GAAP financial measure. Refer to Non-GAAP Measures below for further details concerning our calculation of non-GAAP measures and reconciliations to the comparable GAAP measure.
Liquidity/REIT Requirements
Liquidity is a measure of our ability to meet potential cash requirements, including our ongoing commitments to repay debt, fund our operations, acquire properties, make distributions to our stockholders, and other general business needs. As a REIT, we are required to distribute to our stockholders at least 90% of our REIT taxable income determined without regard to the dividends paid deduction and excluding net capital gains, on an annual basis. As a result, it is unlikely that we will be able to retain substantial cash balances to meet our long-term liquidity needs, including repayment of debt and the acquisition of additional properties, from our annual taxable income. Instead, we expect to meet our long-term liquidity needs primarily by relying upon external sources of capital and proceeds from selective property dispositions.
Short-term Liquidity Requirements
Our short-term liquidity requirements consist primarily of funds necessary to pay for our operating expenses, including our general and administrative expenses as well as interest payments on our outstanding debt, to pay distributions, to fund our acquisitions that are under control or expected to close within a short time period, and to pay for commitments to fund development opportunities, tenant improvements, revenue generating capital expenditures, and transitional capital investments. Under leases where we are required to bear the cost of structural repairs and replacements, we do not currently anticipate making significant capital expenditures or incurring other significant property costs, including as a result of inflationary pressures in the current economic environment, because of the strong occupancy levels across our portfolio and the net lease nature of our leases. We expect to meet our short-term liquidity requirements primarily from cash and cash equivalents balances and net cash provided by operating activities, supplemented by borrowings under our Revolving Credit Facility and capital recycled through selective property dispositions. We use cash on hand and borrowings under our Revolving Credit Facility to initially fund acquisitions, which are subsequently repaid or replaced with proceeds from our equity and debt capital markets activities as well as proceeds from dispositions.
As detailed in the contractual obligations table below, we have approximately $211.1 million of expected obligations due throughout the remainder of 2024, primarily consisting of $117.3 million of commitments to fund investments, $56.9 million of dividends declared, $35.7 million of projected interest expense, and $1.1 million of mortgage amortization. We expect our cash provided by operating activities, as discussed below, will be sufficient to pay for our current obligations including interest and mortgage amortization. We expect to pay for commitments to fund investments and our dividends declared using our proceeds from dispositions and Revolving Credit Facility. As of June 30, 2024, we have $920.9 million of available capacity under our Revolving Credit Facility.
Long-term Liquidity Requirements
Our long-term liquidity requirements consist primarily of funds necessary to repay debt and invest in additional revenue generating properties. We expect to source debt capital from unsecured term loans from commercial banks, revolving credit facilities, private placement senior unsecured notes, and public bond offerings.
The source and mix of our debt capital in the future will be impacted by market conditions as well as our continued focus on lengthening our debt maturity profile to better align with our portfolio’s long-term leases, staggering debt maturities to reduce the risk that a significant amount of debt will mature in any single year in the future, and managing our exposure to interest rate risk. We have no material debt maturities until 2026, as detailed in the table below.
We expect to meet our long-term liquidity requirements primarily from borrowings under our Revolving Credit Facility, future debt and equity financings, and proceeds from limited sales of our properties. Our ability to access these capital sources may be impacted by unfavorable market conditions, particularly in the debt and equity capital markets, that are outside of our control. In addition, our success will depend on our operating performance, our borrowing restrictions, our degree of leverage, and other factors. Our acquisition growth strategy significantly depends on our ability to obtain acquisition financing on favorable terms. We seek to reduce the risk that long-term debt capital may be unavailable to us by strengthening our balance sheet by investing in real estate with creditworthy tenants and lease guarantors, and by maintaining an appropriate mix of debt and equity capitalization. We also, from time to time, obtain or assume non-recourse mortgage financing from banks and insurance companies secured by mortgages on the corresponding specific property subject to limitations imposed by our Revolving Credit Facility covenants and our investment grade credit rating.
Equity Capital Resources
Our equity capital is primarily provided through our at-the-market common equity offering program (“ATM Program”), as well as follow-on equity offerings. Under the terms of our ATM Program we may, from time to time, publicly offer and sell shares of our common stock having an aggregate gross sales price of up to $400.0 million. The ATM Program provides for forward sale agreements, enabling us to set the price of shares upon pricing the offering, while delaying the issuance of shares and the receipt of the net proceeds. During May 2024, we replaced our prior ATM Program with a new ATM Program with the same aggregate gross sales price of up to $400.0 million. We did not raise any equity from our ATM Program during the six months ended June 30, 2024, and have $400.0 million of capacity remaining under the new ATM Program as of June 30, 2024.
Our public offerings have been used to repay debt, fund acquisitions, and for other general corporate purposes.
Unsecured Indebtedness as of June 30, 2024
The following table sets forth our outstanding Revolving Credit Facility, unsecured term loans and senior unsecured notes at June 30, 2024.
| | | | | | | | |
(in thousands, except interest rates) | | Outstanding
Balance | | | Interest
Rate | | Maturity
Date |
Revolving Credit Facility | | $ | 79,096 | | | Applicable reference rate + 0.85% (a) | | Mar. 2026 (c) |
Unsecured term loans: | | | | | | | |
2026 Unsecured Term Loan | | | 400,000 | | | one-month adjusted SOFR + 1.00% (b) | | Feb. 2026 |
2027 Unsecured Term Loan | | | 200,000 | | | one-month adjusted SOFR + 0.95% (b) | | Aug. 2027 |
2029 Unsecured Term Loan | | | 300,000 | | | one-month adjusted SOFR + 1.25% (b) | | Aug. 2029 |
Total unsecured term loans | | | 900,000 | | | | | |
Unamortized debt issuance costs, net | | | (3,426 | ) | | | | |
Total unsecured term loans, net | | | 896,574 | | | | | |
Senior unsecured notes: | | | | | | | |
2027 Senior Unsecured Notes - Series A | | | 150,000 | | | 4.84% | | Apr. 2027 |
2028 Senior Unsecured Notes - Series B | | | 225,000 | | | 5.09% | | Jul. 2028 |
2030 Senior Unsecured Notes - Series C | | | 100,000 | | | 5.19% | | Jul. 2030 |
2031 Senior Unsecured Public Notes | | | 375,000 | | | 2.60% | | Sep. 2031 |
Total senior unsecured notes | | | 850,000 | | | | | |
Unamortized debt issuance costs and
original issuance discount, net | | | (4,313 | ) | | | | |
Total senior unsecured notes, net | | | 845,687 | | | | | |
Total unsecured debt | | $ | 1,821,357 | | | | | |
(a)At June 30, 2024, a balance of $6.0 million was subject to the one-month SOFR of 5.34%. Effective May 24, 2024, the $100 million Canadian Dollar borrowings converted into a daily simple Canadian Overnight Repo Rate Average (“CORRA”) borrowing concurrent with the Canadian Dollar Offered Rate’s cessation. At June 30, 2024, the balance includes $100 million CAD borrowings remeasured to $73.1 million USD, and was subject to the one-month CORRA of 4.8%.
(b)At June 30, 2024, one-month SOFR was 5.34%.
(c)Our Revolving Credit Facility contains two six-month extension options subject to certain conditions, including the payment of an extension fee equal to 0.0625% of the revolving commitments.
Debt Covenants
We are subject to various covenants and financial reporting requirements pursuant to our debt facilities, which are summarized below. As of June 30, 2024, we believe we were in compliance with all of our covenants on all outstanding borrowings. In the event of default, either through default on payments or breach of covenants, we may be restricted from paying dividends to our stockholders in excess of dividends required to maintain our REIT qualification. For each of the previous three years, we paid dividends out of our cash flows from operations in excess of the distribution amounts required to maintain our REIT qualification.
Contractual Obligations
The following table provides information with respect to our contractual commitments and obligations as of June 30, 2024 (in thousands). Refer to the discussion in the Liquidity and Capital Resources section above for further discussion over our short and long-term obligations.
| | | | | | | | | | | | | | | | | | | | | | | | | | | | | | | | |
Year of
Maturity | | Revolving Credit
Facility (a) | | | Mortgages | | | Term Loans | | | Senior Notes | | | Interest
Expense (b) | | | Dividends (c) | | | Commitments to Fund Investments (d) | | | Total | |
Remainder
of 2024 | | $ | — | | | $ | 1,143 | | | $ | — | | | $ | — | | | $ | 35,678 | | | $ | 56,938 | | | $ | 117,322 | | | $ | 211,081 | |
2025 | | | — | | | | 20,195 | | | | — | | | | — | | | | 70,540 | | | | — | | | | 2,000 | | | | 92,735 | |
2026 | | | 79,096 | | | | 16,843 | | | | 400,000 | | | | — | | | | 72,620 | | | | — | | | | 1,500 | | | | 570,059 | |
2027 | | | — | | | | 1,596 | | | | 200,000 | | | | 150,000 | | | | 44,496 | | | | — | | | | — | | | | 396,092 | |
2028 | | | — | | | | 38,278 | | | | — | | | | 225,000 | | | | 26,583 | | | | — | | | | — | | | | 289,861 | |
Thereafter | | | — | | | | — | | | | 300,000 | | | | 475,000 | | | | 37,164 | | | | — | | | | — | | | | 812,164 | |
Total | | $ | 79,096 | | | $ | 78,055 | | | $ | 900,000 | | | $ | 850,000 | | | $ | 287,081 | | | $ | 56,938 | | | $ | 120,822 | | | $ | 2,371,992 | |
(a)Our Revolving Credit Facility contains two six-month extension options subject to certain conditions, including the payment of an extension fee equal to 0.0625% of the revolving commitments.
(b)Interest expense is projected based on the outstanding borrowings and interest rates in effect as of June 30, 2024. This amount includes the impact of interest rate swap agreements.
(c)Amounts include dividends declared as of June 30, 2024 of $0.29 per common share and OP Unit. Future undeclared dividends have been excluded.
(d)Amounts include acquisitions under control, defined as under contract or executed letter of intent, and commitments to fund revenue generating capital expenditures and development opportunities.
At June 30, 2024 investment in rental property of $119.1 million was pledged as collateral against our mortgages.
In the normal course of business, we enter into various types of commitments to purchase real estate properties. These commitments are generally subject to our customary due diligence process and, accordingly, a number of specific conditions must be met before we are obligated to purchase the properties.
Derivative Instruments and Hedging Activities
We are exposed to interest rate risk arising from changes in interest rates on the floating-rate borrowings under our unsecured credit facilities. Borrowings pursuant to our unsecured credit facilities bear interest at floating rates based on SOFR or CDOR plus an applicable margin. Accordingly, fluctuations in market interest rates may increase or decrease our interest expense, which will in turn, increase or decrease our net income and cash flow.
We attempt to manage the interest rate risk on variable rate borrowings by entering into interest rate swaps. During the three months ended June 30, 2024, the Company entered into nine forward-starting interest rate swaps for a total notional amount of $460.0 million. These forward-starting swap arrangements are effective during various periods between March and December 2025 and mature in 2030. As of June 30, 2024, we had 32 effective and nine forward-starting interest rate swaps with an aggregate notional amount of $1.43 billion. Under the effective swap agreements, we receive monthly payments from the counterparties equal to the related variable interest rates multiplied by the outstanding notional amounts. In turn, we pay the counterparties each month an amount equal to a fixed interest rate multiplied by the related outstanding notional amounts. The intended net impact of these transactions is that we pay a fixed interest rate on our variable-rate borrowings. The interest rate swaps have been designated by us as cash flow hedges for accounting purposes and are reported at fair value. We assess, both at inception and on an ongoing basis, the effectiveness of our qualifying cash flow hedges. We have not entered, and do not intend to enter, into derivative or interest rate transactions for speculative purposes.
In addition, we own investments in Canada, and as a result are subject to risk from the effects of exchange rate movements in the Canadian dollar, which may affect future costs and cash flows. We funded a significant portion of our Canadian investments through Canadian dollar borrowings under our Revolving Credit Facility, which is intended to act as a natural hedge against our Canadian dollar investments. The Canadian dollar Revolving Credit Facility borrowings are remeasured each reporting period, with the unrealized foreign currency gains and losses flowing through earnings. These unrealized foreign currency gains and losses do not impact our cash flows from operations until settled, and are expected to directly offset the changes in the value of our net investments as a result of changes in the Canadian dollar. Our Canadian investments are recorded at their historical exchange rates, and therefore are not impacted by changes in the value of the Canadian dollar.
Cash Flows
Cash and cash equivalents and restricted cash totaled $19.9 million and $36.3 million at June 30, 2024 and June 30, 2023, respectively. The table below shows information concerning cash flows for the six months ended June 30, 2024 and 2023:
| | | | | | | | |
| | For the Six Months Ended | |
| | June 30, | |
(In thousands) | | 2024 | | | 2023 | |
Net cash provided by operating activities | | $ | 145,039 | | | $ | 136,604 | |
Net cash (used in) provided by investing activities | | | (21,423 | ) | | | 31,346 | |
Net cash used in financing activities | | | (124,352 | ) | | | (191,725 | ) |
Decrease in cash and cash equivalents and restricted cash | | $ | (736 | ) | | $ | (23,775 | ) |
The increase in net cash provided by operating activities was mainly due to a decrease in interest expense during the six months ended June 30, 2024.
The decrease in cash provided by investing activities was mainly due to increased investment volume, partially offset by an increase in disposition volume during the six months ended June 30, 2024.
The decrease in net cash used in financing activities mainly reflects a decrease in net repayments on the Revolving Credit Facility.
Non-GAAP Measures
FFO, Core FFO, and AFFO
We compute Funds From Operations (“FFO”) in accordance with the standards established by the Board of Governors of Nareit, the worldwide representative voice for REITs and publicly traded real estate companies with an interest in the U.S. real estate and capital markets. Nareit defines FFO as GAAP net income or loss adjusted to exclude net gains (losses) from sales of certain depreciated real estate assets, depreciation and amortization expense from real estate assets, and impairment charges related to certain previously depreciated real estate assets. FFO is used by management, investors, and analysts to facilitate meaningful comparisons of operating performance between periods and among our peers, primarily because it excludes the effect of real estate depreciation and amortization and net gains (losses) on sales, which are based on historical costs and implicitly assume that the value of real estate diminishes predictably over time, rather than fluctuating based on existing market conditions.
We compute Core Funds From Operations (“Core FFO”) by adjusting FFO, as defined by Nareit, to exclude certain GAAP income and expense amounts that we believe are infrequently recurring, unusual in nature, or not related to its core real estate operations, including write-offs or recoveries of accrued rental income, lease termination fees, cost of debt extinguishment, unrealized and realized gains or losses on foreign currency transactions, severance and executive transition costs, and other extraordinary items. Exclusion of these items from similar FFO-type metrics is common within the equity REIT industry, and management believes that presentation of Core FFO provides investors with a metric to assist in their evaluation of our operating performance across multiple periods and in comparison to the operating performance of our peers, because it removes the effect of unusual items that are not expected to impact our operating performance on an ongoing basis.
We compute Adjusted Funds From Operations (“AFFO”), by adjusting Core FFO for certain revenues and expenses that are non-cash or unique in nature, including straight-line rents, amortization of lease intangibles, amortization of debt issuance costs, amortization of net mortgage premiums, non-capitalized transaction costs such as acquisition costs related to deals that failed to transact, (gain) loss on interest rate swaps and other non-cash interest expense, deferred taxes, stock-based compensation, and other specified non-cash items. We believe that excluding such items assists management and investors in distinguishing whether changes in our operations are due to growth or decline of operations at our properties or from other factors. We use AFFO as a measure of our performance when we formulate corporate goals, and is a factor in determining management compensation. We believe that AFFO is a useful supplemental measure for investors to consider because it will help them to better assess our operating performance without the distortions created by non-cash revenues or expenses.
Specific to our adjustment for straight-line rents, our leases include cash rents that increase over the term of the lease to compensate us for anticipated increases in market rental rates over time. Our leases do not include significant front-loading or back-loading of payments, or significant rent-free periods. Therefore, we find it useful to evaluate rent on a contractual basis as it allows for comparison of existing rental rates to market rental rates.
FFO, Core FFO, and AFFO may not be comparable to similarly titled measures employed by other REITs, and comparisons of our FFO, Core FFO, and AFFO with the same or similar measures disclosed by other REITs may not be meaningful.
Neither the SEC nor any other regulatory body has passed judgment on the acceptability of the adjustments to FFO that we use to calculate Core FFO and AFFO. In the future, the SEC, Nareit or another regulatory body may decide to standardize the allowable adjustments across the REIT industry and in response to such standardization we may have to adjust our calculation and characterization of Core FFO and AFFO accordingly.
The following table reconciles net income (which is the most comparable GAAP measure) to FFO, Core FFO, and AFFO:
| | | | | | | | | | | | | | | | |
| | For the Three Months Ended | | | For the Six Months Ended | |
(in thousands, except per share data) | | June 30,
2024 | | | March 31,
2024 | | | June 30,
2024 | | | June 30,
2023 | |
Net income | | $ | 35,937 | | | $ | 68,177 | | | $ | 104,114 | | | $ | 104,370 | |
Real property depreciation and amortization | | | 37,320 | | | | 37,690 | | | | 75,010 | | | | 80,735 | |
Gain on sale of real estate | | | (3,384 | ) | | | (59,132 | ) | | | (62,515 | ) | | | (32,877 | ) |
Provision for impairment on investment in rental properties | | | 3,852 | | | | 26,400 | | | | 30,252 | | | | 1,473 | |
FFO | | $ | 73,725 | | | $ | 73,135 | | | $ | 146,861 | | | $ | 153,701 | |
Net write-offs of accrued rental income | | | — | | | | 2,556 | | | | 2,556 | | | | 297 | |
Lease termination fees | | | — | | | | — | | | | — | | | | (7,500 | ) |
Cost of debt extinguishment | | | — | | | | — | | | | — | | | | 3 | |
Severance and executive transition costs | | | 24 | | | | 77 | | | | 99 | | | | 664 | |
Other (income) expenses (a) | | | (748 | ) | | | (1,696 | ) | | | (2,443 | ) | | | 1,689 | |
Core FFO | | $ | 73,001 | | | $ | 74,072 | | | $ | 147,073 | | | $ | 148,854 | |
Straight-line rent adjustment | | | (5,051 | ) | | | (4,980 | ) | | | (10,031 | ) | | | (14,547 | ) |
Adjustment to provision for credit losses | | | (17 | ) | | | — | | | | (17 | ) | | | (10 | ) |
Amortization of debt issuance costs | | | 983 | | | | 983 | | | | 1,966 | | | | 1,972 | |
Amortization of net mortgage premiums | | | — | | | | — | | | | — | | | | (78 | ) |
Non-capitalized transaction costs | | | 445 | | | | 182 | | | | 629 | | | | — | |
Loss on interest rate swaps and other non-cash interest expense | | | 62 | | | | 159 | | | | 221 | | | | 1,043 | |
Amortization of lease intangibles (b) | | | (1,095 | ) | | | (1,018 | ) | | | (2,113 | ) | | | (3,776 | ) |
Stock-based compensation | | | 2,073 | | | | 1,475 | | | | 3,548 | | | | 3,031 | |
AFFO | | $ | 70,401 | | | $ | 70,873 | | | $ | 141,276 | | | $ | 136,489 | |
(a)Amount includes $0.7 million and $1.7 million of unrealized and realized foreign exchange gain for the three months ended June 30, 2024, and March 31, 2024, respectively, and $2.4 million and ($1.7) million of unrealized and realized foreign exchange gain (loss) for the six months ended June 30, 2024 and 2023, respectively, primarily associated with our Canadian dollar denominated revolving borrowings.
(b)Amount includes $1.5 million of accelerated amortization of lease intangibles for an early lease termination of a property during the six months ended June 30, 2023.
EBITDA, EBITDAre, Adjusted EBITDAre and Annualized Adjusted EBITDAre
We compute EBITDA as earnings before interest, income taxes and depreciation and amortization. EBITDA is a measure commonly used in our industry. We believe that this ratio provides investors and analysts with a measure of our performance that includes our operating results unaffected by the differences in capital structures, capital investment cycles and useful life of related assets compared to other companies in our industry. We compute EBITDAre in accordance with the definition adopted by Nareit, as EBITDA excluding gains (losses) from the sales of depreciable property and provisions for impairment on investment in real estate. We believe EBITDA and EBITDAre are useful to investors and analysts because they provide important supplemental information about our operating performance exclusive of certain non-cash and other costs. EBITDA and EBITDAre are not measures of financial performance under GAAP, and our EBITDA and EBITDAre may not be comparable to similarly titled measures of other companies. You should not consider our EBITDA and EBITDAre as alternatives to net income or cash flows from operating activities determined in accordance with GAAP.
We are focused on a disciplined and targeted investment strategy, together with active asset management that includes selective sales of properties. We manage our leverage profile using a ratio of Net Debt to Annualized Adjusted EBITDAre, each discussed further below, which we believe is a useful measure of our ability to repay debt and a relative measure of leverage, and is used in communications with our lenders and rating agencies regarding our credit rating. As we fund new investments using our unsecured Revolving Credit Facility, our leverage profile and Net Debt will be immediately impacted by current quarter investments. However, the full benefit of EBITDAre from new investments will not be received in the same quarter in which the properties are acquired. Additionally, EBITDAre for the quarter includes amounts generated by properties that have been sold during the quarter. Accordingly, the variability in EBITDAre caused by the timing of our investments and dispositions can temporarily distort our leverage ratios. We adjust EBITDAre (“Adjusted EBITDAre”) for the most recently completed quarter (i) to recalculate as if all investments and dispositions had occurred at the beginning of the quarter, (ii) to exclude certain GAAP income and expense amounts that are either non-cash, such as cost of debt extinguishments, realized or unrealized gains and losses on foreign currency transactions, or gains on insurance recoveries, or that we believe are one time, or unusual in nature because they relate to unique circumstances or transactions that had not previously occurred and which we do not anticipate occurring in the future, and (iii) to eliminate the impact of lease termination fees and other items that are not a result of normal operations. While investments in property developments have an immediate impact to Net Debt, we do not make an adjustment to EBITDAre until the quarter in which the lease commences. We then annualize quarterly Adjusted EBITDAre by multiplying it by four (“Annualized Adjusted EBITDAre”). You should not unduly rely on this measure as it is based on assumptions and estimates that may prove to be inaccurate. Our actual reported EBITDAre for future periods may be significantly different from our Annualized Adjusted EBITDAre. Adjusted EBITDAre and Annualized Adjusted EBITDAre are not measurements of performance under GAAP, and our Adjusted EBITDAre and Annualized Adjusted EBITDAre may not be comparable to similarly titled measures of other companies. You should not consider our Adjusted EBITDAre and Annualized Adjusted EBITDAre as alternatives to net income or cash flows from operating activities determined in accordance with GAAP.
The following table reconciles net income (which is the most comparable GAAP measure) to EBITDA, EBITDAre, and Adjusted EBITDAre. Information is also presented with respect to Annualized EBITDAre and Annualized Adjusted EBITDAre:
| | | | | | | | | | | | |
| | For the Three Months Ended | |
(in thousands) | | June 30,
2024 | | | March 31,
2024 | | | June 30,
2023 | |
Net income | | $ | 35,937 | | | $ | 68,177 | | | $ | 62,996 | |
Depreciation and amortization | | | 37,404 | | | | 37,772 | | | | 39,031 | |
Interest expense | | | 17,757 | | | | 18,578 | | | | 20,277 | |
Income taxes | | | 531 | | | | 408 | | | | 448 | |
EBITDA | | $ | 91,629 | | | $ | 124,935 | | | $ | 122,752 | |
Provision for impairment of investment in rental properties | | | 3,852 | | | | 26,400 | | | | — | |
Gain on sale of real estate | | | (3,384 | ) | | | (59,132 | ) | | | (29,462 | ) |
EBITDAre | | $ | 92,097 | | | $ | 92,203 | | | $ | 93,290 | |
Adjustment for current quarter investment activity (a) | | | 1,241 | | | | — | | | | 342 | |
Adjustment for current quarter disposition activity (b) | | | (87 | ) | | | (4,712 | ) | | | (444 | ) |
Adjustment to exclude non-recurring and other expenses (c) | | | 26 | | | | (125 | ) | | | 183 | |
Adjustment to exclude net write-offs of accrued rental income | | | — | | | | 2,556 | | | | — | |
Adjustment to exclude realized / unrealized foreign exchange (gain) loss | | | (748 | ) | | | (1,696 | ) | | | 1,681 | |
Adjustment to exclude cost of debt extinguishment | | | — | | | | — | | | | 3 | |
Adjusted EBITDAre | | $ | 92,529 | | | $ | 88,226 | | | $ | 95,055 | |
Estimated revenues from developments (d) | | | 3,458 | | | | 2,771 | | | | — | |
Pro Forma Adjusted EBITDAre | | $ | 95,987 | | | $ | 90,997 | | | $ | 95,055 | |
Annualized EBITDAre | | $ | 368,388 | | | $ | 368,812 | | | $ | 373,160 | |
Annualized Adjusted EBITDAre | | $ | 370,116 | | | $ | 352,904 | | | $ | 380,220 | |
Pro Forma Annualized Adjusted EBITDAre | | $ | 383,948 | | | $ | 363,988 | | | $ | 380,220 | |
(a)Reflects an adjustment to give effect to all investments during the quarter as if they had been made as of the beginning of the quarter.
(b)Reflects an adjustment to give effect to all dispositions during the quarter as if they had been sold as of the beginning of the quarter.
(c)Amount includes $0.02 million of employee severance and executive transition costs for the three months ended June 30, 2024.
(d)Represents estimated contractual revenues based on in-process development spend to-date.
Net Debt, Net Debt to Annualized EBITDAre and Net Debt to Annualized Adjusted EBITDAre
We define Net Debt as gross debt (total reported debt plus debt issuance costs) less cash and cash equivalents and restricted cash. We believe that the presentation of Net Debt to Annualized EBITDAre and Net Debt to Annualized Adjusted EBITDAre is useful to investors and analysts because these ratios provide information about gross debt less cash and cash equivalents, which could be used to repay debt, compared to our performance as measured using EBITDAre, and is used in communications with lenders and rating agencies regarding our credit rating. The following table reconciles total debt (which is the most comparable GAAP measure) to Net Debt, and presents the ratio of Net Debt to Annualized EBITDAre and Net Debt to Annualized Adjusted EBITDAre, respectively:
| | | | | | | | | | | | |
(in thousands) | | June 30,
2024 | | | March 31,
2024 | | | June 30,
2023 | |
Debt | | | | | | | | | |
Revolving Credit Facility | | $ | 79,096 | | | $ | 73,820 | | | $ | 122,912 | |
Unsecured term loans, net | | | 896,574 | | | | 896,260 | | | | 895,319 | |
Senior unsecured notes, net | | | 845,687 | | | | 845,498 | | | | 844,932 | |
Mortgages, net | | | 77,970 | | | | 78,517 | | | | 80,141 | |
Debt issuance costs | | | 7,825 | | | | 8,337 | | | | 9,872 | |
Gross Debt | | | 1,907,152 | | | | 1,902,432 | | | | 1,953,176 | |
Cash and cash equivalents | | | (18,282 | ) | | | (221,740 | ) | | | (20,763 | ) |
Restricted cash | | | (1,614 | ) | | | (1,038 | ) | | | (15,502 | ) |
Net Debt | | $ | 1,887,256 | | | $ | 1,679,654 | | | $ | 1,916,911 | |
| | | | | | | | | |
Leverage Ratios: | | | | | | | | | |
Net Debt to Annualized EBITDAre | | 5.1x | | | 4.6x | | | 5.1x | |
Net Debt to Annualized Adjusted EBITDAre | | 5.1x | | | 4.8x | | | 5.0x | |
Pro Forma Net Debt to Annualized Adjusted EBITDAre | | 4.9x | | | 4.6x | | | 5.0x | |
Critical Accounting Policies and Estimates
This Management’s Discussion and Analysis of Financial Condition and Results of Operations is based upon our Condensed Consolidated Financial Statements, which have been prepared in accordance with GAAP. The preparation of these Condensed Consolidated Financial Statements requires management to make estimates and assumptions that affect the reported amounts of assets, liabilities, revenues, and expenses as well as other disclosures in the financial statements. We base our estimates on historical experience and on various other assumptions believed to be reasonable under the circumstances. These judgments affect the reported amounts of assets and liabilities, disclosure of contingent assets and liabilities at the dates of the financial statements, and the reported amounts of revenue and expenses during the reporting periods. On an ongoing basis, management evaluates its estimates and assumptions; however, actual results may differ from these estimates and assumptions, which in turn could have a material impact on our financial statements. A summary of our significant accounting policies and procedures are included in Note 2, "Summary of Significant Accounting Policies," in the Notes to the Condensed Consolidated Financial Statements included in this Quarterly Report on Form 10-Q. We believe there have been no significant changes during the six months ended June 30, 2024 to the items that we disclosed as our critical accounting policies and estimates in our 2023 Annual Report on Form 10-K.
Impact of Recent Accounting Pronouncements
For information on the impact of recent accounting pronouncements on our business, see Note 2 of the Notes to the Condensed Consolidated Financial Statements included in this Quarterly Report on Form 10-Q.
Item 3. Quantitative and Qualitative Disclosures About Market Risk
Interest Rate Risk
We are exposed to certain market risks, one of the most predominant of which is a change in interest rates. Increases in interest rates can result in increased interest expense under our Revolving Credit Facility and other variable-rate debt. Increases in interest rates can also result in increased interest expense when our fixed rate debt and interest rate swaps mature. We attempt to manage interest rate risk by entering into long-term fixed rate debt, entering into interest rate swaps to convert certain variable-rate debt to a fixed rate, and staggering our debt maturities. We have designated the interest rate swaps as cash flow hedges for accounting purposes and they are reported at fair value. We have not entered, and do not intend to enter, into derivative or interest rate transactions for speculative purposes. Further information concerning our interest rate swaps can be found in Note 9 in our Condensed Consolidated Financial Statements contained elsewhere in this Quarterly Report on Form 10-Q.
Our fixed-rate debt includes our senior unsecured notes, mortgages, and variable-rate debt converted to a fixed rate with the use of interest rate swaps. Our fixed-rate debt had a carrying value and fair value of approximately $1.9 billion and $1.7 billion, respectively, as of June 30, 2024. Changes in market interest rates impact the fair value of our fixed-rate debt and interest rate swaps, but they have no impact on interest incurred or on cash flows. For instance, if interest rates were to increase and the fixed-rate debt balance were to remain constant, we would expect the fair value of our debt to decrease, similar to how the price of a bond decreases as interest rates rise. A 1% increase in market interest rates would have resulted in a decrease in the fair value of our fixed-rate debt of approximately $61.8 million as of June 30, 2024.
Borrowings pursuant to our Revolving Credit Facility and other variable-rate debt bear interest at rates based on the applicable reference rate plus an applicable margin, and totaled $1.0 billion as of June 30, 2024. Taking into account the effect of our interest rate swaps, a 1% increase or decrease in interest rates would have a corresponding $0.06 million increase or decrease in interest expense annually.
With the exception of our interest rate swap transactions, we have not engaged in transactions in derivative financial instruments or derivative commodity instruments.
Foreign Currency Exchange Rate Risk
We own investments in Canada, and as a result are subject to risk from the effects of exchange rate movements in the Canadian dollar, which may affect future costs and cash flows. We funded a significant portion of our Canadian investments through Canadian dollar borrowings under our Revolving Credit Facility, which is intended to act as a natural hedge against our Canadian dollar investments. The Canadian dollar Revolving Credit Facility borrowings are remeasured each reporting period, with the unrealized foreign currency gains and losses flowing through earnings. A 10% increase or decrease in the exchange rate between the Canadian dollar and USD would have a corresponding $7.3 million increase or decrease in unrealized foreign currency gain or loss. These unrealized foreign currency gains and losses do not impact our cash flows from operations until settled, and are expected to directly offset the changes in the value of our net investments as a result of changes in the Canadian dollar. Our Canadian investments are recorded at their historical exchange rates, and therefore are not impacted by changes in the value of the Canadian dollar.
Item 4. Controls and Procedures
Evaluation of Disclosure Controls and Procedures
We maintain disclosure controls and procedures (as defined in Rules 13a-15(e) and 15d-15(e) of the Exchange Act), that are designed to ensure that information required to be disclosed in our Exchange Act reports is recorded, processed, summarized, and reported within the time periods specified in the SEC’s rules and forms, and that such information is accumulated and communicated to our management, including our Chief Executive Officer and Chief Financial Officer, as appropriate, to allow timely decisions regarding required disclosure. As of and for the quarter ended June 30, 2024, we carried out an evaluation of the effectiveness of the design and operation of our disclosure controls and procedures, under the supervision and with the participation of management, including our Chief Executive Officer and Chief Financial Officer. Based on the foregoing, our Chief Executive Officer and Chief Financial Officer concluded that our disclosure controls and procedures were effective and were operating at a reasonable assurance level.
Changes in Internal Control Over Financial Reporting
There have been no changes in our internal control over financial reporting during the quarter ended June 30, 2024 that have materially affected, or are reasonably likely to materially affect, our internal control over financial reporting.
Part II – OTHER INFORMATION
Item 1. Legal Proceedings.
From time to time, we are subject to various lawsuits, claims, and other legal proceedings that arise in the ordinary course of our business. We are not currently a party to legal proceedings that we believe would reasonably be expected to have a material adverse effect on our business, financial condition, or results of operations. We are not aware of any material legal proceedings to which we or any of our subsidiaries are a party or to which any of our property is subject, nor are we aware of any such legal proceedings contemplated by government agencies.
Item 1A. Risk Factors.
There have been no material changes from the risk factors set forth in our 2023 Annual Report on Form 10-K for the year ended December 31, 2023.
Item 1B. Unresolved Staff Comments.
There are no unresolved staff comments.
Item 1C. Cybersecurity.
There have been no material changes for cybersecurity set forth in our 2023 Annual Report on Form 10-K for the year ended December 31, 2023.
Item 2. Unregistered Sales of Equity Securities and Use of Proceeds from Registered Securities.
None.
Item 3. Defaults Upon Senior Securities.
None.
Item 4. Mine Safety Disclosures.
Not applicable.
Item 5. Other Information.
None of our officers or directors adopted or terminated any contract, instruction, or written plan for the purchase or sale of our securities intended to satisfy the affirmative defense conditions of Rule 10b5-1(c) or any non-Rule 10b5-1 trading arrangement.
Item 6. Exhibits
| | |
No. | | Description |
| | |
3.1 | | Articles of Incorporation of Broadstone Net Lease, Inc. (filed as Exhibit 3.1 to the Corporation’s Registration Statement on Form 10 filed April 24, 2017 and incorporated herein by reference) |
| | |
3.2 | | Articles of Amendment of Broadstone Net Lease, Inc. (filed as Exhibit 3.1 to the Corporation’s Current Report on Form 8-K filed September 18, 2020 and incorporated herein by reference) |
| | |
3.3 | | Articles Supplementary of Broadstone Net Lease, Inc. (filed as Exhibit 3.2 to the Corporation’s Current Report on Form 8-K filed September 18, 2020 and incorporated herein by reference) |
| | |
3.4 | | Articles of Amendment of Broadstone Net Lease, Inc. (filed as Exhibit 3.3 to the Corporation’s Current Report on Form 8-K filed September 18, 2020 and incorporated herein by reference) |
| | |
3.5 | | Articles of Amendment and Restatement of Broadstone Net Lease, Inc. (filed as Exhibit 3.1 to the Corporation’s Current Report on Form 8-K filed May 8, 2023 and incorporated herein by reference) |
| | |
3.6 | | Second Amended and Restated Bylaws of Broadstone Net Lease, Inc., adopted March 23, 2020 (filed as Exhibit 3.1 to the Corporation’s Current Report on Form 8-K filed March 25, 2020 and incorporated herein by reference) |
| | |
4.1 | | Indenture, dated as of September 15, 2021, among the Issuer, the Company and the Trustee, including the form of the Guarantee (filed as Exhibit 4.1 to the Corporation’s Current Report on Form 8-K filed September 10, 2021 and incorporated herein by reference) |
| | |
4.2 | | First Supplemental Indenture, dated as of September 15, 2021, among the Issuer, the Company and the Trustee, including the form of the Notes (filed as Exhibit 4.2 to the Corporation’s Current Report on Form 8-K filed September 10, 2021 and incorporated herein by reference) |
| | |
10.1* | | Amendment No. 1 to Amended and Restated Revolving Credit Agreement, dated as of April 17, 2024, by and among Broadstone Net Lease, Inc., Broadstone Net Lease, LLC, and JP Morgan Chase Bank, N.A., as administrative agent |
| | |
31.1* | | Certification of Chief Executive Officer pursuant to Rule 13a-14(a) or Rule 15d-14(a) of the Securities Exchange Act of 1934, as amended, as adopted pursuant to Section 302 of the Sarbanes-Oxley Act of 2002 |
| | |
31.2* | | Certification of Chief Financial Officer pursuant to Rule 13a-14(a) or Rule 15d-14(a) of the Securities Exchange Act of 1934, as amended, as adopted pursuant to Section 302 of the Sarbanes-Oxley Act of 2002 |
| | |
32.1*† | | Certification of Chief Executive Officer pursuant to 18 U.S.C. Section 1350, as adopted pursuant to Section 906 of the Sarbanes-Oxley Act of 2002 |
| | |
32.2*† | | Certification of Chief Financial Officer pursuant to 18 U.S.C. Section 1350, as adopted pursuant to Section 906 of the Sarbanes-Oxley Act of 2002 |
| | |
101.INS | | Inline XBRL Instance Document – the instance document does not appear in Interactive Data File because its XBRL tags are embedded within the Inline XBRL Document |
| | |
101.SCH | | Inline XBRL Taxonomy Extension Schema Document |
| | |
101.CAL | | Inline XBRL Taxonomy Extension Calculation Linkbase Document |
| | |
101.DEF | | Inline XBRL Taxonomy Extension Definition Linkbase Document |
| | |
101.LAB | | Inline XBRL Taxonomy Extension Label Linkbase Document |
| | |
101.PRE | | Inline XBRL Taxonomy Extension Presentation Linkbase Document |
| | |
104 | | Cover Page Interactive Data File (embedded within the Inline XBRL document) |
* Filed herewith.
+ Management contract or compensatory plan or arrangement.
† In accordance with Item 601(b)(32) of Regulation S-K, this Exhibit is not deemed "filed" for purposes of Section 18 of the Exchange Act or otherwise subject to the liabilities of that section. Such certifications will not be deemed incorporated by reference into any filing under the Securities Act or the Exchange Act, except to the extent that the Registrant specifically incorporates it by reference.
SIGNATURES
Pursuant to the requirements of the Securities Exchange Act of 1934, the registrant has duly caused this report to be signed on its behalf by the undersigned thereunto duly authorized.
| | |
| | BROADSTONE NET LEASE, INC. |
| | |
Date: July 31, 2024 | | /s/ John D. Moragne |
| | John D. Moragne |
| | Chief Executive Officer |
| | |
Date: July 31, 2024 | | /s/ Kevin M. Fennell |
| | Kevin M. Fennell |
| | Executive Vice President and Chief Financial Officer |