Exhibit 99.2
toneet Lease, Inc. (NYSE: BNL) is a Real Estate Investment Trust (REIT) that acquires, owns, and manages single-tenant commercial real estate properties that are net leased on a long-term basis to a diversified group of tenants. www.broadstone.com
Table of Contents
| | |
Section | Page | 

|
About the Data | 3 |
Company Overview | 4 |
Quarterly Financial Summary | 5 |
Balance Sheet | 6 |
Income Statement Summary | 7 |
Funds From Operations (FFO), Core Funds From Operations (Core FFO), and Adjusted Funds From Operations (AFFO) | 8 |
Lease Revenues Detail | 9 |
Capital Structure | 10 |
Equity Rollforward | 11 |
Debt Outstanding | 12 |
Interest Rate Swaps | 13 |
EBITDA, EBITDAre, and Other Non-GAAP Operating Measures | 14 |
Net Debt Metrics & Covenants | 15 |
Debt & Swap Maturities | 16 |
Investment Activity | 17 |
Transitional Capital & Developments | 18 |
Dispositions | 19 |
Portfolio at a Glance: Key Metrics | 20 |
Diversification: Tenants and Brands | 21-24 |
Diversification: Property Type | 25-26 |
Key Statistics by Property Type | 27 |
Diversification: Tenant Industry | 28 |
Diversification: Geography | 29 |
Lease Expirations | 30 |
Portfolio Occupancy | 31 |
Definitions and Explanations | 32-33 |
| |
| |
| |
| |
BROADSTONE NET LEASE, INC. | www.broadstone.com | © 2024 Broadstone Net Lease, LLC. All rights reserved. 2
About the Data
This data and other information described herein are as of and for the three months ended September 30, 2024 unless otherwise indicated. Future performance may not be consistent with past performance and is subject to change and inherent risks and uncertainties. This information should be read in conjunction with Broadstone Net Lease, Inc.’s Annual Report on Form 10-K for the year ended December 31, 2023, including the financial statements and the management’s discussion and analysis of financial condition and results of operations sections.
Forward Looking Statements
Information set forth herein contains forward-looking statements, which reflect our current views regarding our business, financial performance, growth prospects and strategies, market opportunities, and market trends. Forward-looking statements include all statements that are not historical facts. In some cases, you can identify these forward-looking statements by the use of words such as “outlook,” “believes,” “expects,” “potential,” “continues,” “may,” “will,” “should,” “could,” “would be,” “seeks,” “approximately,” “projects,” “predicts,” “intends,” “plans,” “estimates,” “anticipates,” or the negative version of these words or other comparable words. All of the forward-looking statements herein are subject to various risks and uncertainties. Assumptions relating to the foregoing involve judgments with respect to, among other things, future economic, competitive and market conditions, and future business decisions, all of which are difficult or impossible to predict accurately and many of which are beyond our control. Although we believe that the expectations reflected in such forward-looking statements are based on reasonable assumptions, our actual results, performance, and achievements could differ materially from those expressed in or by the forward-looking statements and may be affected by a variety of risks and other factors. Accordingly, there are or will be important factors that could cause actual outcomes or results to differ materially from such forward-looking statements. These factors include, but are not limited to, risks and uncertainties related to general economic conditions, including but not limited to increases in the rate of inflation and/or interest rates, local real estate conditions, tenant financial health, and property acquisitions and the timing of these investments and acquisitions. These and other risks, assumptions, and uncertainties are described in our filings with the SEC, which are available on the SEC’s website at www.sec.gov.
You are cautioned not to place undue reliance on any forward-looking statements included herein. All forward-looking statements are made as of the date of this document and the risk that actual results, performance, and achievements will differ materially from the expectations expressed or referenced herein will increase with the passage of time. We undertake no obligation to publicly update or review any forward-looking statement, whether as a result of new information, future developments, or otherwise, except as required by law.
IP Disclaimer
This document contains references to copyrights, trademarks, trade names, and service marks that belong to other companies. Broadstone Net Lease is not affiliated or associated with, and is not endorsed by and does not endorse, such companies or their products or services.
BROADSTONE NET LEASE, INC. | www.broadstone.com | © 2024 Broadstone Net Lease, LLC. All rights reserved. 3
Company Overview
Broadstone Net Lease, Inc. (NYSE:BNL) (the “Company”, “BNL”, “us”, “our”, and “we”) is an industrial-focused, diversified net lease real estate investment trust (“REIT”) that invests in primarily single-tenant commercial real estate properties that are net leased on a long-term basis to a diversified group of tenants. Since our inception, we have selectively invested in real estate across the industrial, restaurant, retail, healthcare, and office property types. We target properties with credit worthy tenants in industries characterized by positive business drivers and trends, where the properties are an integral part of the tenants’ businesses and there are opportunities to secure long-term net leases. Through long-term net leases, our tenants are able to retain operational control of their strategically important locations, while allocating their debt and equity capital to fund core business operations rather than real estate ownership.
| | |
Executive Team John D. Moragne Chief Executive Officer and Member, Board of Directors Ryan M. Albano President and Chief Operating Officer Kevin M. Fennell Executive Vice President, Chief Financial Officer and Treasurer John D. Callan, Jr. Senior Vice President, General Counsel, and Secretary Michael B. Caruso Senior Vice President, Underwriting & Strategy Will D. Garner Senior Vice President, Acquisitions Jennie L. O’Brien Senior Vice President and Chief Accounting Officer Molly Kelly Wiegel Senior Vice President, Human Resources & Administration | | Board of Directors Laurie A. Hawkes Chairman of the Board John D. Moragne Chief Executive Officer Denise Brooks-Williams Michael A. Coke Jessica Duran Laura Felice David M. Jacobstein Shekar Narasimhan James H. Watters |
| |
Company Contact Information Brent Maedl
Director, Corporate Finance & Investor Relations brent.maedl@broadstone.com 585-382-8507 Transfer Agent Computershare Trust Company, N.A. 150 Royall Street Canton, Massachusetts 02021 800-736-3001 | |
BROADSTONE NET LEASE, INC. | www.broadstone.com | © 2024 Broadstone Net Lease, LLC. All rights reserved. 4
Quarterly Financial Summary
(unaudited, dollars in thousands except per share data)
| | | | | | | | | | | | | | | | | | | | |
| | Q3 2024 | | | Q2 2024 | | | Q1 2024 | | | Q4 2023 | | | Q3 2023 | |
Financial Summary | | | | | | | | | | | | | | | |
Investment in rental property | | $ | 5,018,626 | | | $ | 4,840,961 | | | $ | 4,666,969 | | | $ | 4,915,911 | | | $ | 4,939,598 | |
Less accumulated depreciation | | | (644,214 | ) | | | (627,871 | ) | | | (606,225 | ) | | | (626,597 | ) | | | (601,895 | ) |
Property under development | | | — | | | | 165,014 | | | | 133,064 | | | | 94,964 | | | | 49,819 | |
Investment in rental property, net | | | 4,374,412 | | | | 4,378,104 | | | | 4,193,808 | | | | 4,384,278 | | | | 4,387,522 | |
Cash and cash equivalents | | | 8,999 | | | | 18,282 | | | | 221,740 | | | | 19,494 | | | | 35,061 | |
Restricted cash | | | 2,219 | | | | 1,614 | | | | 1,038 | | | | 1,138 | | | | 15,436 | |
Total assets | | | 5,263,286 | | | | 5,264,557 | | | | 5,269,655 | | | | 5,268,735 | | | | 5,335,043 | |
Unsecured revolving credit facility | | | 125,482 | | | | 79,096 | | | | 73,820 | | | | 90,434 | | | | 74,060 | |
Mortgages, net | | | 77,416 | | | | 77,970 | | | | 78,517 | | | | 79,068 | | | | 79,613 | |
Unsecured term loans, net | | | 896,887 | | | | 896,574 | | | | 896,260 | | | | 895,947 | | | | 895,633 | |
Senior unsecured notes, net | | | 845,875 | | | | 845,687 | | | | 845,498 | | | | 845,309 | | | | 845,121 | |
Total liabilities | | | 2,124,927 | | | | 2,067,147 | | | | 2,051,951 | | | | 2,074,394 | | | | 2,059,570 | |
Total Broadstone Net Lease, Inc.
equity | | | 2,999,074 | | | | 3,054,802 | | | | 3,073,622 | | | | 3,049,241 | | | | 3,120,776 | |
Total equity (book value) | | | 3,138,359 | | | | 3,197,410 | | | | 3,217,704 | | | | 3,194,341 | | | | 3,275,473 | |
| | | | | | | | | | | | | | | |
Revenues | | | 108,397 | | | | 105,907 | | | | 105,366 | | | | 105,000 | | | | 109,543 | |
General and administrative -
other | | | 6,893 | | | | 7,831 | | | | 7,957 | | | | 7,982 | | | | 8,603 | |
Stock based compensation | | | 1,829 | | | | 2,073 | | | | 1,475 | | | | 1,401 | | | | 1,540 | |
General and administrative | | | 8,722 | | | | 9,904 | | | | 9,432 | | | | 9,383 | | | | 10,143 | |
Total operating expenses | | | 54,811 | | | | 56,463 | | | | 79,264 | | | | 84,457 | | | | 54,383 | |
Interest expense | | | 18,178 | | | | 17,757 | | | | 18,578 | | | | 18,972 | | | | 19,665 | |
Net income | | | 37,268 | | | | 35,937 | | | | 68,177 | | | | 6,797 | | | | 52,145 | |
Net earnings per common share,
diluted | | $ | 0.19 | | | $ | 0.19 | | | $ | 0.35 | | | $ | 0.03 | | | $ | 0.26 | |
| | | | | | | | | | | | | | | |
FFO | | | 73,818 | | | | 73,725 | | | | 73,135 | | | | 69,443 | | | | 75,478 | |
FFO per share, diluted | | $ | 0.37 | | | $ | 0.37 | | | $ | 0.37 | | | $ | 0.35 | | | $ | 0.39 | |
Core FFO | | | 73,971 | | | | 73,001 | | | | 74,072 | | | | 75,275 | | | | 74,754 | |
Core FFO per share, diluted | | $ | 0.37 | | | $ | 0.37 | | | $ | 0.38 | | | $ | 0.38 | | | $ | 0.38 | |
AFFO | | | 70,185 | | | | 70,401 | | | | 70,873 | | | | 71,278 | | | | 69,958 | |
AFFO per share, diluted | | $ | 0.35 | | | $ | 0.36 | | | $ | 0.36 | | | $ | 0.36 | | | $ | 0.36 | |
| | | | | | | | | | | | | | | |
Net cash provided by operating
activities | | | 67,303 | | | | 74,172 | | | | 70,867 | | | | 60,582 | | | | 73,888 | |
Capital expenditures and improvements | | | 1,180 | | | | 134 | | | | 132 | | | | 568 | | | | 1,106 | |
Capital expenditures and improvements - revenue generating | | | 6,351 | | | | 38 | | | | 3,000 | | | | 16,229 | | | | 4,755 | |
Net cash provided by (used in) investing
activities | | | (65,618 | ) | | | (225,708 | ) | | | 204,285 | | | | (49,536 | ) | | | 42,528 | |
Net cash provided by (used in) financing
activities | | | (10,363 | ) | | | (51,346 | ) | | | (73,006 | ) | | | (40,911 | ) | | | (102,184 | ) |
Distributions declared | | | 56,354 | | | | 57,710 | | | | 57,292 | | | | 56,433 | | | | 54,274 | |
Distributions declared per diluted
share | | $ | 0.290 | | | $ | 0.290 | | | $ | 0.285 | | | $ | 0.285 | | | $ | 0.280 | |
BROADSTONE NET LEASE, INC. | www.broadstone.com | © 2024 Broadstone Net Lease, LLC. All rights reserved. 5
Balance Sheet
(unaudited, in thousands)
| | | | | | | | | | | | | | | | | | | | |
| | September 30,
2024 | | | June 30,
2024 | | | March 31,
2024 | | | December 31,
2023 | | | September 30,
2023 | |
Assets | | | | | | | | | | | | | | | |
Accounted for using the operating method: | | | | | | | | | | | | | | | |
Land | | $ | 784,545 | | | $ | 773,224 | | | $ | 724,199 | | | $ | 748,529 | | | $ | 752,708 | |
Land improvements | | | 357,090 | | | | 324,138 | | | | 316,170 | | | | 328,746 | | | | 330,214 | |
Buildings and improvements | | | 3,834,310 | | | | 3,708,366 | | | | 3,591,260 | | | | 3,803,156 | | | | 3,819,745 | |
Equipment | | | 15,824 | | | | 8,248 | | | | 8,247 | | | | 8,265 | | | | 9,608 | |
Total accounted for using the
operating method | | | 4,991,769 | | | | 4,813,976 | | | | 4,639,876 | | | | 4,888,696 | | | | 4,912,275 | |
Less accumulated depreciation | | | (644,214 | ) | | | (627,871 | ) | | | (606,225 | ) | | | (626,597 | ) | | | (601,895 | ) |
Accounted for using the
operating method, net | | | 4,347,555 | | | | 4,186,105 | | | | 4,033,651 | | | | 4,262,099 | | | | 4,310,380 | |
Accounted for using the direct
financing method | | | 26,285 | | | | 26,413 | | | | 26,522 | | | | 26,643 | | | | 26,751 | |
Accounted for using the sales-type
method | | | 572 | | | | 572 | | | | 571 | | | | 572 | | | | 572 | |
Property under development | | | — | | | | 165,014 | | | | 133,064 | | | | 94,964 | | | | 49,819 | |
Investment in rental property, net | | | 4,374,412 | | | | 4,378,104 | | | | 4,193,808 | | | | 4,384,278 | | | | 4,387,522 | |
Investment in rental property and intangible lease assets held for sale, net | | | 38,779 | | | | — | | | | — | | | | — | | | | — | |
Cash and cash equivalents | | | 8,999 | | | | 18,282 | | | | 221,740 | | | | 19,494 | | | | 35,061 | |
Accrued rental income | | | 158,350 | | | | 153,551 | | | | 149,203 | | | | 152,724 | | | | 152,268 | |
Tenant and other receivables, net | | | 2,124 | | | | 2,604 | | | | 836 | | | | 1,487 | | | | 1,372 | |
Prepaid expenses and other assets | | | 36,230 | | | | 33,255 | | | | 33,149 | | | | 36,661 | | | | 42,309 | |
Interest rate swap, assets | | | 27,812 | | | | 56,444 | | | | 57,900 | | | | 46,096 | | | | 79,086 | |
Goodwill | | | 339,769 | | | | 339,769 | | | | 339,769 | | | | 339,769 | | | | 339,769 | |
Intangible lease assets, net | | | 276,811 | | | | 282,548 | | | | 273,250 | | | | 288,226 | | | | 297,656 | |
Total assets | | $ | 5,263,286 | | | $ | 5,264,557 | | | $ | 5,269,655 | | | $ | 5,268,735 | | | $ | 5,335,043 | |
Liabilities and equity | | | | | | | | | | | | | | | |
Unsecured revolving credit facility | | $ | 125,482 | | | $ | 79,096 | | | $ | 73,820 | | | $ | 90,434 | | | $ | 74,060 | |
Mortgages, net | | | 77,416 | | | | 77,970 | | | | 78,517 | | | | 79,068 | | | | 79,613 | |
Unsecured term loans, net | | | 896,887 | | | | 896,574 | | | | 896,260 | | | | 895,947 | | | | 895,633 | |
Senior unsecured notes, net | | | 845,875 | | | | 845,687 | | | | 845,498 | | | | 845,309 | | | | 845,121 | |
Interest rate swap, liabilities | | | 13,050 | | | | — | | | | — | | | | — | | | | — | |
Accounts payable and other liabilities | | | 47,651 | | | | 42,635 | | | | 40,655 | | | | 47,534 | | | | 44,886 | |
Dividends payable | | | 58,163 | | | | 58,028 | | | | 56,871 | | | | 56,869 | | | | 55,770 | |
Accrued interest payable | | | 9,642 | | | | 14,033 | | | | 9,377 | | | | 5,702 | | | | 9,186 | |
Intangible lease liabilities, net | | | 50,761 | | | | 53,124 | | | | 50,953 | | | | 53,531 | | | | 55,301 | |
Total liabilities | | | 2,124,927 | | | | 2,067,147 | | | | 2,051,951 | | | | 2,074,394 | | | | 2,059,570 | |
Equity | | | | | | | | | | | | | | | |
Broadstone Net Lease, Inc.
equity: | | | | | | | | | | | | | | | |
Preferred stock, $0.001 par value | | | — | | | | — | | | | — | | | | — | | | | — | |
Common stock, $0.00025 par value | | | 47 | | | | 47 | | | | 47 | | | | 47 | | | | 47 | |
Additional paid-in capital | | | 3,450,116 | | | | 3,444,265 | | | | 3,446,910 | | | | 3,440,639 | | | | 3,430,725 | |
Cumulative distributions in excess of
retained earnings | | | (467,922 | ) | | | (449,893 | ) | | | (430,169 | ) | | | (440,731 | ) | | | (393,571 | ) |
Accumulated other comprehensive
Income | | | 16,833 | | | | 60,383 | | | | 56,834 | | | | 49,286 | | | | 83,575 | |
Total Broadstone Net Lease, Inc.
equity | | | 2,999,074 | | | | 3,054,802 | | | | 3,073,622 | | | | 3,049,241 | | | | 3,120,776 | |
Non-controlling interests | | | 139,285 | | | | 142,608 | | | | 144,082 | | | | 145,100 | | | | 154,697 | |
Total equity | | | 3,138,359 | | | | 3,197,410 | | | | 3,217,704 | | | | 3,194,341 | | | | 3,275,473 | |
Total liabilities and equity | | $ | 5,263,286 | | | $ | 5,264,557 | | | $ | 5,269,655 | | | $ | 5,268,735 | | | $ | 5,335,043 | |
BROADSTONE NET LEASE, INC. | www.broadstone.com | © 2024 Broadstone Net Lease, LLC. All rights reserved. 6
Income Statement Summary
(unaudited, in thousands except per share data)
| | | | | | | | | | | | | | | | | | | | |
| | Three Months Ended | |
| | September 30,
2024 | | | June 30,
2024 | | | March 31,
2024 | | | December 31,
2023 | | | September 30,
2023 | |
Revenues | | | | | | | | | | | | | | | |
Lease revenues, net | | $ | 108,397 | | | $ | 105,907 | | | $ | 105,366 | | | $ | 105,000 | | | $ | 109,543 | |
Operating expenses | | | | | | | | | | | | | | | |
Depreciation and amortization | | | 38,016 | | | | 37,404 | | | | 37,772 | | | | 39,278 | | | | 38,533 | |
Property and operating
expense | | | 7,014 | | | | 5,303 | | | | 5,660 | | | | 5,995 | | | | 5,707 | |
General and administrative | | | 8,722 | | | | 9,904 | | | | 9,432 | | | | 9,383 | | | | 10,143 | |
Provision for impairment of
investment in rental
properties | | | 1,059 | | | | 3,852 | | | | 26,400 | | | | 29,801 | | | | — | |
Total operating expenses | | | 54,811 | | | | 56,463 | | | | 79,264 | | | | 84,457 | | | | 54,383 | |
Other income (expenses) | | | | | | | | | | | | | | | |
Interest income | | | 70 | | | | 649 | | | | 233 | | | | 141 | | | | 127 | |
Interest expense | | | (18,178 | ) | | | (17,757 | ) | | | (18,578 | ) | | | (18,972 | ) | | | (19,665 | ) |
Gain on sale of real estate | | | 2,441 | | | | 3,384 | | | | 59,132 | | | | 6,270 | | | | 15,163 | |
Income taxes | | | 291 | | | | (531 | ) | | | (408 | ) | | | 268 | | | | (104 | ) |
Other income (expenses) | | | (942 | ) | | | 748 | | | | 1,696 | | | | (1,453 | ) | | | 1,464 | |
Net income | | | 37,268 | | | | 35,937 | | | | 68,177 | | | | 6,797 | | | | 52,145 | |
Net income attributable to
non-controlling interests | | | (1,660 | ) | | | (608 | ) | | | (3,063 | ) | | | (319 | ) | | | (2,463 | ) |
Net income attributable to
Broadstone Net Lease, Inc. | | $ | 35,608 | | | $ | 35,329 | | | $ | 65,114 | | | $ | 6,478 | | | $ | 49,682 | |
| | | | | | | | | | | | | | | |
Weighted average number of common shares outstanding | | | | | | | | | | | | | | | |
Basic1 | | | 187,496 | | | | 187,436 | | | | 187,290 | | | | 186,829 | | | | 186,766 | |
Diluted1 | | | 196,932 | | | | 196,470 | | | | 196,417 | | | | 196,373 | | | | 196,372 | |
Net earnings per common share2 | | | | | | | | | | | | | | | |
Basic | | $ | 0.19 | | | $ | 0.19 | | | $ | 0.35 | | | $ | 0.03 | | | $ | 0.27 | |
Diluted | | $ | 0.19 | | | $ | 0.19 | | | $ | 0.35 | | | $ | 0.03 | | | $ | 0.26 | |
1 Excludes 1,024,429 weighted average shares of unvested restricted common stock for the three months ended September 30, 2024.
2 Excludes $0.3 million from the numerator for the three months ended September 30, 2024, related to dividends declared on shares of unvested restricted common stock.
BROADSTONE NET LEASE, INC. | www.broadstone.com | © 2024 Broadstone Net Lease, LLC. All rights reserved. 7
Funds From Operations (FFO), Core Funds From Operations (Core FFO), and Adjusted Funds From Operations (AFFO)
(unaudited, in thousands except per share data)
| | | | | | | | | | | | | | | | | | | | |
| | Three Months Ended | |
| | September 30,
2024 | | | June 30,
2024 | | | March 31,
2024 | | | December 31,
2023 | | | September 30,
2023 | |
Net income | | $ | 37,268 | | | $ | 35,937 | | | $ | 68,177 | | | $ | 6,797 | | | $ | 52,145 | |
Real property depreciation and
amortization | | | 37,932 | | | | 37,320 | | | | 37,690 | | | | 39,115 | | | | 38,496 | |
Gain on sale of real estate | | | (2,441 | ) | | | (3,384 | ) | | | (59,132 | ) | | | (6,270 | ) | | | (15,163 | ) |
Provision for impairment of investment
in rental properties | | | 1,059 | | | | 3,852 | | | | 26,400 | | | | 29,801 | | | | — | |
FFO | | $ | 73,818 | | | $ | 73,725 | | | $ | 73,135 | | | $ | 69,443 | | | $ | 75,478 | |
Net write-offs of accrued rental income | | | — | | | | — | | | | 2,556 | | | | 4,161 | | | | — | |
Other non-core income from real estate transactions1 | | | (887 | ) | | | — | | | | — | | | | — | | | | — | |
Severance and employee transition costs | | | 98 | | | | 24 | | | | 77 | | | | 218 | | | | 740 | |
Other (income) expenses2 | | | 942 | | | | (748 | ) | | | (1,696 | ) | | | 1,453 | | | | (1,464 | ) |
Core FFO | | $ | 73,971 | | | $ | 73,001 | | | $ | 74,072 | | | $ | 75,275 | | | $ | 74,754 | |
Straight-line rent adjustment | | | (5,309 | ) | | | (5,051 | ) | | | (4,980 | ) | | | (5,404 | ) | | | (6,785 | ) |
Adjustment to provision for credit
losses | | | — | | | | (17 | ) | | | — | | | | — | | | | — | |
Amortization of debt issuance costs | | | 983 | | | | 983 | | | | 983 | | | | 983 | | | | 983 | |
Non-capitalized transaction costs3 | | | 25 | | | | 445 | | | | 182 | | | | — | | | | — | |
Loss on interest rate swaps and
other non-cash interest expense | | | (5 | ) | | | 62 | | | | 159 | | | | 319 | | | | 522 | |
Amortization of lease intangibles | | | (1,309 | ) | | | (1,095 | ) | | | (1,018 | ) | | | (1,014 | ) | | | (1,056 | ) |
Stock-based compensation | | | 1,829 | | | | 2,073 | | | | 1,475 | | | | 1,401 | | | | 1,540 | |
Deferred taxes | | | — | | | | — | | | | — | | | | (282 | ) | | | — | |
AFFO | | $ | 70,185 | | | $ | 70,401 | | | $ | 70,873 | | | $ | 71,278 | | | $ | 69,958 | |
| | | | | | | | | | | | | | | |
Diluted weighted average shares
outstanding4 | | | 196,932 | | | | 196,470 | | | | 196,417 | | | | 196,373 | | | | 196,372 | |
Net earnings per diluted share5 | | $ | 0.19 | | | $ | 0.19 | | | $ | 0.35 | | | $ | 0.03 | | | $ | 0.26 | |
FFO per diluted share5 | | | 0.37 | | | | 0.37 | | | | 0.37 | | | | 0.35 | | | | 0.39 | |
Core FFO per diluted share5 | | | 0.37 | | | | 0.37 | | | | 0.38 | | | | 0.38 | | | | 0.38 | |
AFFO per diluted share5 | | | 0.35 | | | | 0.36 | | | | 0.36 | | | | 0.36 | | | | 0.36 | |
1 Amount includes income for the settlement of a permanent land easement for an insignificant portion of two of our properties during the three months ended September 30, 2024.
2 Amount includes $0.9 million of unrealized and realized foreign exchange loss for the three months ended September 30, 2024, primarily associated with our Canadian dollar denominated revolver borrowings.
3 Includes $0.03 million of acquisition costs related to deals that failed to transact for the three months ended September 30, 2024.
4 Excludes 1,024,429 weighted average shares of unvested restricted common stock for the three months ended September 30, 2024.
5 Excludes $0.3 million from the numerator for the three months ended September 30, 2024, related to dividends declared on shares of unvested restricted common stock.
BROADSTONE NET LEASE, INC. | www.broadstone.com | © 2024 Broadstone Net Lease, LLC. All rights reserved. 8
Lease Revenues Detail
(unaudited, in thousands)
| | | | | | | | | | | | | | | | | | | | |
| | Three Months Ended | |
| | September 30,
2024 | | | June 30,
2024 | | | March 31,
2024 | | | December 31,
2023 | | | September 30,
2023 | |
Contractual rental amounts billed for
operating leases | | $ | 96,596 | | | $ | 95,736 | | | $ | 97,549 | | | $ | 97,182 | | | $ | 96,333 | |
Adjustment to recognize contractual
operating lease billings on a straight-
line basis | | | 5,438 | | | | 5,177 | | | | 5,104 | | | | 5,513 | | | | 6,891 | |
Net write-offs of accrued rental income | | | — | | | | — | | | | (2,556 | ) | | | (4,161 | ) | | | — | |
Variable rental amounts earned | | | 644 | | | | 659 | | | | 598 | | | | 971 | | | | 513 | |
Earned income from direct financing
leases | | | 691 | | | | 689 | | | | 682 | | | | 685 | | | | 687 | |
Interest income from sales-type
leases | | | 14 | | | | 15 | | | | 14 | | | | 15 | | | | 14 | |
Operating expenses billed to tenants | | | 5,537 | | | | 4,651 | | | | 5,105 | | | | 5,513 | | | | 5,181 | |
Other income from real estate
transactions | | | 907 | | | | 12 | | | | 66 | | | | — | | | | 19 | |
Adjustment to revenue recognized for
uncollectible rental amounts billed, net | | | (1,430 | ) | | | (1,032 | ) | | | (1,196 | ) | | | (718 | ) | | | (95 | ) |
Total Lease revenues, net | | $ | 108,397 | | | $ | 105,907 | | | $ | 105,366 | | | $ | 105,000 | | | $ | 109,543 | |
BROADSTONE NET LEASE, INC. | www.broadstone.com | © 2024 Broadstone Net Lease, LLC. All rights reserved. 9
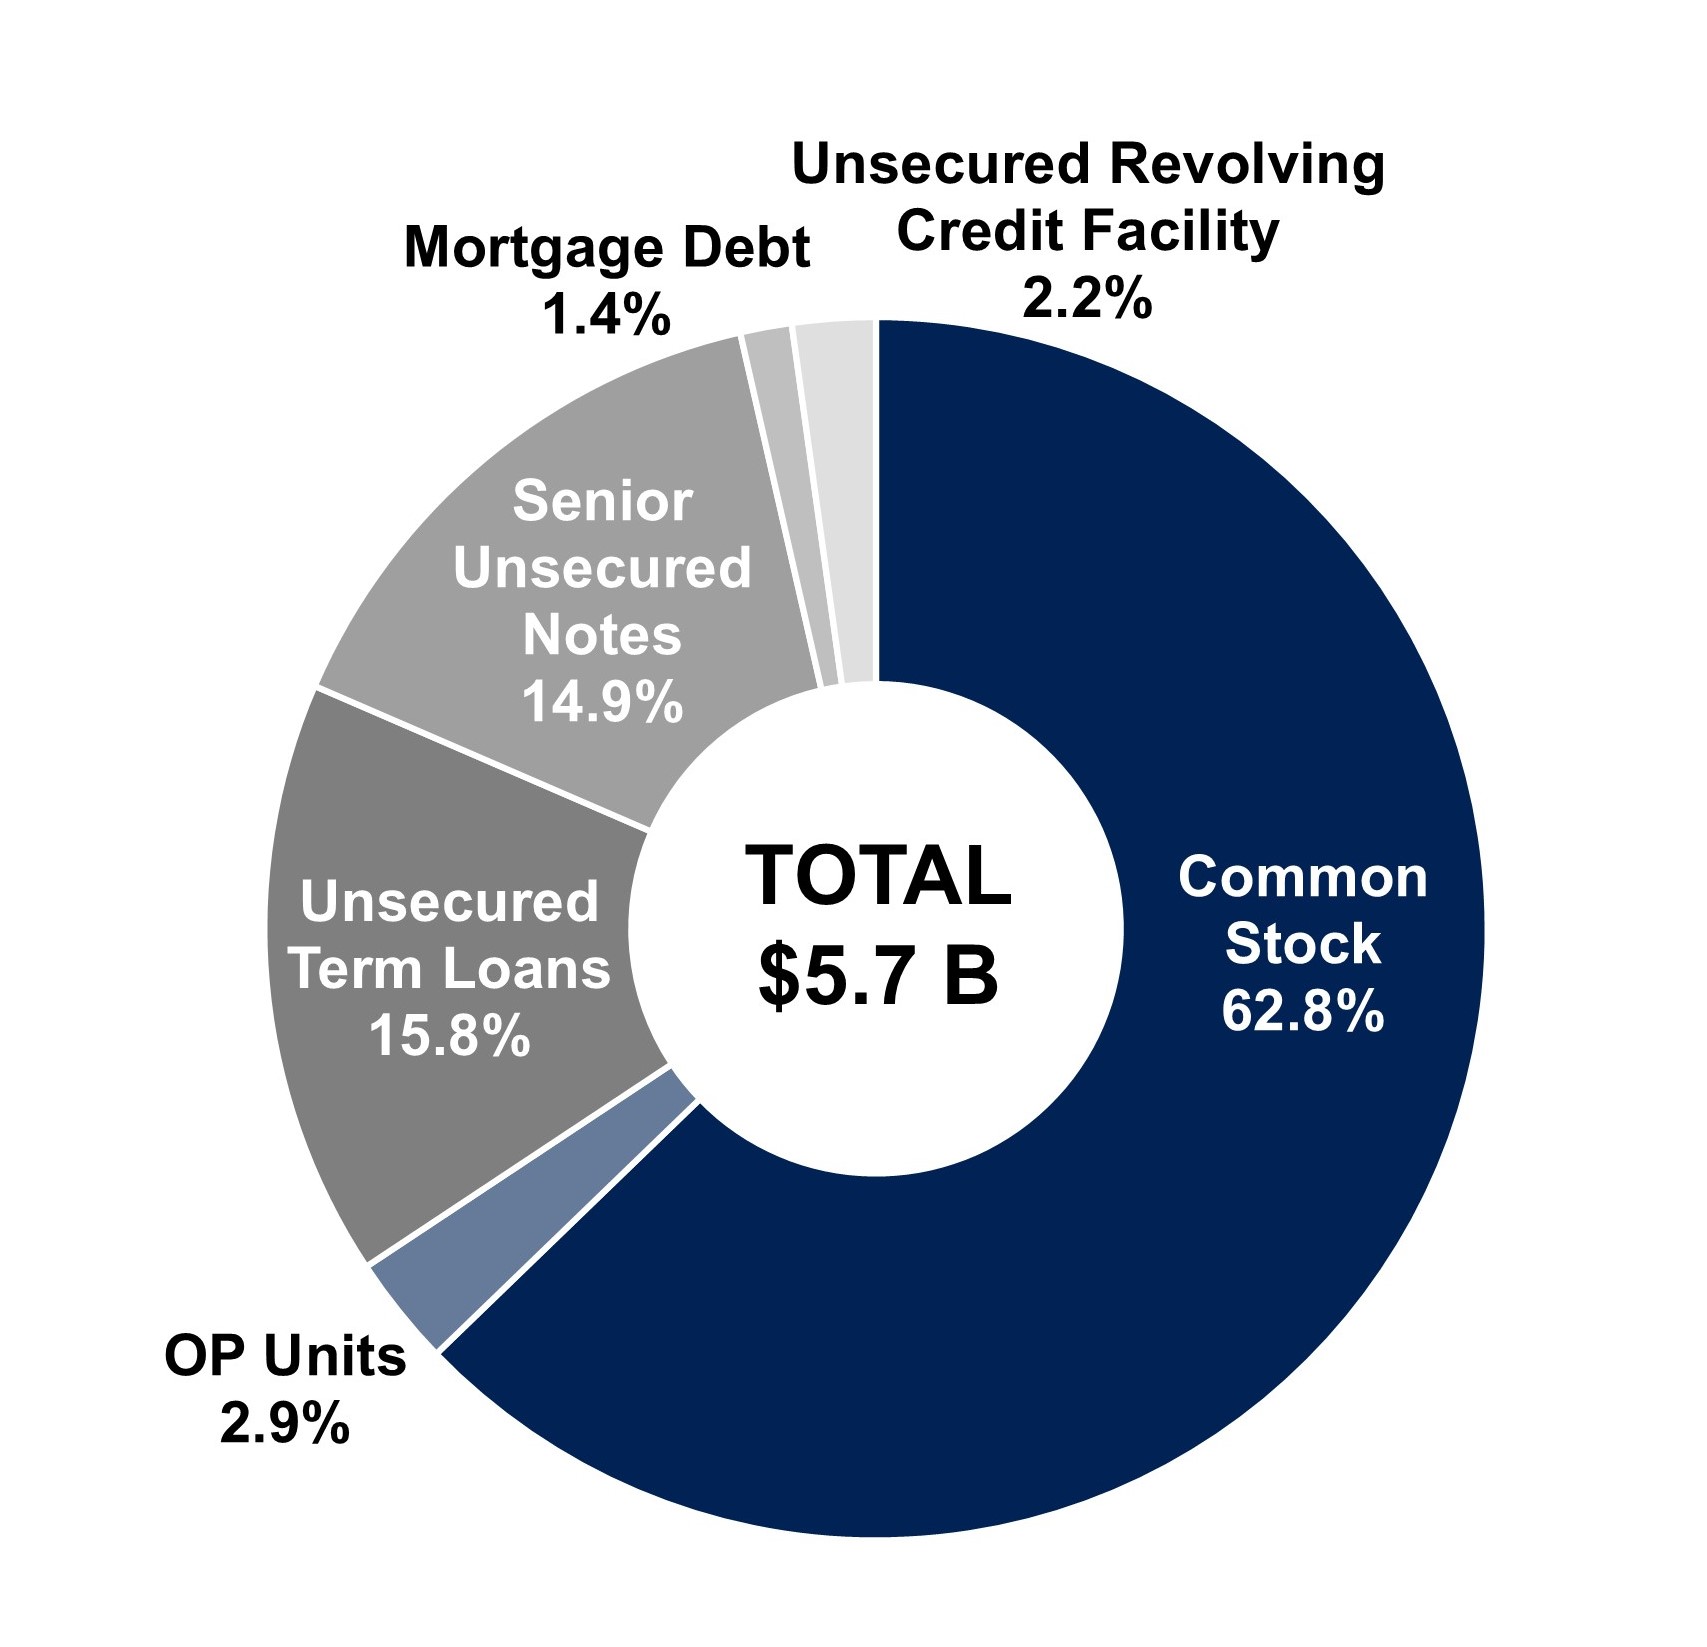
Capital Structure
(in thousands, except per share data)
| | | | |
EQUITY | | | |
Shares of Common Stock | | | 188,507 | |
OP Units | | | 8,755 | |
Common Stock & OP Units | | | 197,262 | |
Price Per Share / Unit at September 30, 2024 | | $ | 18.95 | |
IMPLIED EQUITY MARKET CAPITALIZATION | | $ | 3,738,118 | |
% of Total Capitalization | | | 65.7 | % |
DEBT | | | |
Unsecured Revolving Credit Facility - 2026 | | $ | 125,482 | |
Unsecured Term Loans | | | 900,000 | |
Unsecured Term Loan - 2026 | | | 400,000 | |
Unsecured Term Loan - 2027 | | | 200,000 | |
Unsecured Term Loan - 2029 | | | 300,000 | |
Senior Unsecured Notes | | | 850,000 | |
Senior Unsecured Notes - 2027 | | | 150,000 | |
Senior Unsecured Notes - 2028 | | | 225,000 | |
Senior Unsecured Notes - 2030 | | | 100,000 | |
Senior Unsecured Public Notes - 2031 | | | 375,000 | |
Mortgage Debt - Various | | | 77,492 | |
TOTAL DEBT | | $ | 1,952,974 | |
% of Total Capitalization | | | 34.3 | % |
Floating Rate Debt % | | | 2.6 | % |
Fixed Rate Debt % | | | 97.4 | % |
Secured Debt % | | | 4.0 | % |
Unsecured Debt % | | | 96.0 | % |
| | | |
Total Capitalization | | $ | 5,691,092 | |
Less: Cash and Cash Equivalents | | | (8,999 | ) |
Enterprise Value | | $ | 5,682,093 | |
BROADSTONE NET LEASE, INC. | www.broadstone.com | © 2024 Broadstone Net Lease, LLC. All rights reserved. 10
Equity Rollforward
(in thousands)
| | | | | | | | | | | | | |
| | | Shares of Common Stock | | | OP Units | | | Total Diluted Shares | |
Balance, January 1, 2024 | | | | 187,614 | | | | 8,928 | | | | 196,542 | |
Grants of restricted stock awards - employees | | | | 778 | | | | — | | | | 778 | |
Vesting of performance-based restricted stock units – employees | | | | 44 | | | | — | | | | 44 | |
Retirement of common shares under equity incentive plan | | | | (71 | ) | | | — | | | | (71 | ) |
Forfeiture of restricted stock awards | | | | (25 | ) | | | — | | | | (25 | ) |
OP unit conversion | | | | 95 | | | | (95 | ) | | | — | |
Balance, March 31, 2024 | | | | 188,435 | | | | 8,833 | | | | 197,268 | |
Grants of restricted stock awards - employees | | | | 55 | | | | — | | | | 55 | |
Forfeiture of restricted stock awards | | | | (5 | ) | | | — | | | | (5 | ) |
OP unit conversion | | | | 32 | | | | (32 | ) | | | — | |
Balance, June 30, 2024 | | | | 188,517 | | | | 8,801 | | | | 197,318 | |
Grants of restricted stock awards - employees | | | | 1 | | | | — | | | | 1 | |
Forfeiture of restricted stock awards | | | | (57 | ) | | | — | | | | (57 | ) |
OP unit conversion | | | | 46 | | | | (46 | ) | | | — | |
Balance, September 30, 2024 | | | | 188,507 | | | | 8,755 | | | | 197,262 | |
BROADSTONE NET LEASE, INC. | www.broadstone.com | © 2024 Broadstone Net Lease, LLC. All rights reserved. 11
Debt Outstanding
(in thousands)
| | | | | | | | | | | | |
| | September 30, | | | December 31, | | | | | |
| | 2024 | | | 2023 | | | Interest Rate | | Maturity Date |
Unsecured revolving credit facility | $ | 125,482 | | | $ | 90,434 | | | Applicable reference rate
+ 0.85%1 | | Mar. 20264 |
Unsecured term loans: | | | | | | | | | | |
2026 Unsecured Term Loan | | | 400,000 | | | | 400,000 | | | one-month adjusted SOFR + 1.00%2 | | Feb. 2026 |
2027 Unsecured Term Loan | | | 200,000 | | | | 200,000 | | | daily simple adjusted SOFR + 0.95%3 | | Aug. 2027 |
2029 Unsecured Term Loan | | | 300,000 | | | | 300,000 | | | daily simple adjusted SOFR + 1.25%3 | | Aug. 2029 |
Total unsecured term loans | | | 900,000 | | | | 900,000 | | | | | |
Unamortized debt issuance costs, net | | | (3,113 | ) | | | (4,053 | ) | | | | |
Total unsecured term loans, net | | | 896,887 | | | | 895,947 | | | | | |
Senior unsecured notes: | | | | | | | | | | |
2027 Senior Unsecured Notes - Series A | | 150,000 | | | | 150,000 | | | 4.84% | | Apr. 2027 |
2028 Senior Unsecured Notes - Series B | | 225,000 | | | | 225,000 | | | 5.09% | | Jul. 2028 |
2030 Senior Unsecured Notes - Series C | | 100,000 | | | | 100,000 | | | 5.19% | | Jul. 2030 |
2031 Senior Unsecured Public Notes | | | 375,000 | | | | 375,000 | | | 2.60% | | Sep. 2031 |
Total senior unsecured notes | | | 850,000 | | | | 850,000 | | | | | |
Unamortized debt issuance costs and
original issuance discount, net | | | (4,125 | ) | | | (4,691 | ) | | | | |
Total senior unsecured notes, net | | | 845,875 | | | | 845,309 | | | | | |
Total unsecured debt, net | | $ | 1,868,244 | | | $ | 1,831,690 | | | | | |
1 At September 30, 2024 a balance of $51.5 million was subject to daily simple SOFR, and at December 31, 2023 a balance of $15.0 million was subject to one-month SOFR. The remaining balances include $100 million CAD borrowings remeasured to $74.0 million and $75.4 million USD, respectively, which were subject to the daily simple CORRA of 4.30% at September 30, 2024 and the one-month Canadian Dollar Offered Rate of 5.36% at December 31, 2023.
2 At September 30, 2024 and December 31, 2023, one-month SOFR was 4.85% and 5.35%, respectively.
3 At September 30, 2024 and December 31, 2023, borrowings were subject to overnight SOFR of 4.96% and one-month SOFR of 5.35%, respectively.
4 Our unsecured revolving credit facility contains two six-month extension options subject to certain conditions, including the payment of an extension fee equal to 0.0625% of the revolving commitments.
| | | | | | | | | | | | | | |
| | Origination | | Maturity | | Interest | | September 30, | | | December 31, | |
Lender | | Date | | Date | | Rate | | 2024 | | | 2023 | |
Wilmington Trust National Association | | Apr. 2019 | | Feb. 2028 | | 4.92% | | $ | 43,189 | | | $ | 44,207 | |
Wilmington Trust National Association | | Jun. 2018 | | Aug. 2025 | | 4.36% | | | 18,396 | | | | 18,725 | |
PNC Bank | | Oct. 2016 | | Nov. 2026 | | 3.62% | | | 15,907 | | | | 16,241 | |
Total mortgages | | | | | | | | | 77,492 | | | | 79,173 | |
Debt issuance costs, net | | | | | | | | | (76 | ) | | | (105 | ) |
Mortgages, net | | | | | | | | $ | 77,416 | | | $ | 79,068 | |
| | | | | | | | | | | | | | | | | | | | |
Year of Maturity | | Revolving
Credit Facility | | | Mortgages | | | Term Loans | | | Senior Notes | | | Total | |
2024 | | $ | — | | | $ | 580 | | | $ | — | | | $ | — | | | $ | 580 | |
2025 | | | — | | | | 20,195 | | | | — | | | | — | | | | 20,195 | |
2026 | | | 125,482 | | | | 16,843 | | | | 400,000 | | | | — | | | | 542,325 | |
2027 | | | — | | | | 1,596 | | | | 200,000 | | | | 150,000 | | | | 351,596 | |
2028 | | | — | | | | 38,278 | | | | — | | | | 225,000 | | | | 263,278 | |
Thereafter | | | — | | | | — | | | | 300,000 | | | | 475,000 | | | | 775,000 | |
Total | | $ | 125,482 | | | $ | 77,492 | | | $ | 900,000 | | | $ | 850,000 | | | $ | 1,952,974 | |
BROADSTONE NET LEASE, INC. | www.broadstone.com | © 2024 Broadstone Net Lease, LLC. All rights reserved. 12
Interest Rate Swaps
(dollars in thousands)
| | | | | | | | | | | | | | | | |
| | | | | | | September 30, 2024 | |
Counterparty | | Maturity Date1 | | Fixed
Rate2 | | | Variable Rate Index | | Notional
Amount | | | Fair
Value | |
Effective Swaps: | | | | | | | | | | | | | |
Wells Fargo Bank, N.A. | | October 2024 | | | 2.72 | % | | daily compounded SOFR | | $ | 15,000 | | | $ | — | |
Capital One, National Association | | December 2024 | | | 1.58 | % | | daily compounded SOFR | | | 15,000 | | | | 85 | |
Bank of Montreal | | January 2025 | | | 1.91 | % | | daily compounded SOFR | | | 25,000 | | | | 183 | |
Truist Financial Corporation | | April 2025 | | | 2.20 | % | | daily compounded SOFR | | | 25,000 | | | | 274 | |
Bank of Montreal | | July 2025 | | | 2.32 | % | | daily compounded SOFR | | | 25,000 | | | | 337 | |
Truist Financial Corporation | | July 2025 | | | 1.99 | % | | daily compounded SOFR | | | 25,000 | | | | 398 | |
Truist Financial Corporation | | December 2025 | | | 2.30 | % | | daily compounded SOFR | | | 25,000 | | | | 451 | |
Bank of Montreal | | January 2026 | | | 1.92 | % | | daily compounded SOFR | | | 25,000 | | | | 570 | |
Bank of Montreal | | January 2026 | | | 2.05 | % | | daily compounded SOFR | | | 40,000 | | | | 848 | |
Capital One, National Association | | January 2026 | | | 2.08 | % | | daily compounded SOFR | | | 35,000 | | | | 730 | |
Truist Financial Corporation | | January 2026 | | | 1.93 | % | | daily compounded SOFR | | | 25,000 | | | | 567 | |
Capital One, National Association | | April 2026 | | | 2.68 | % | | daily compounded SOFR | | | 15,000 | | | | 217 | |
Capital One, National Association | | July 2026 | | | 1.32 | % | | daily compounded SOFR | | | 35,000 | | | | 1,349 | |
Bank of Montreal | | December 2026 | | | 2.33 | % | | daily compounded SOFR | | | 10,000 | | | | 249 | |
Bank of Montreal | | December 2026 | | | 1.99 | % | | daily compounded SOFR | | | 25,000 | | | | 808 | |
Toronto-Dominion Bank | | March 2027 | | | 2.46 | % | | daily compounded CORRA | | | 14,796 | | 3 | | 202 | |
Wells Fargo Bank, N.A. | | April 2027 | | | 2.72 | % | | daily compounded SOFR | | | 25,000 | | | | 435 | |
Bank of Montreal | | December 2027 | | | 2.37 | % | | daily compounded SOFR | | | 25,000 | | | | 780 | |
Capital One, National Association | | December 2027 | | | 2.37 | % | | daily compounded SOFR | | | 25,000 | | | | 776 | |
Wells Fargo Bank, N.A. | | January 2028 | | | 2.37 | % | | daily compounded SOFR | | | 75,000 | | | | 2,333 | |
Bank of Montreal | | May 2029 | | | 2.09 | % | | daily compounded SOFR | | | 25,000 | | | | 1,344 | |
Regions Bank | | May 2029 | | | 2.11 | % | | daily compounded SOFR | | | 25,000 | | | | 1,317 | |
Regions Bank | | June 2029 | | | 2.03 | % | | daily compounded SOFR | | | 25,000 | | | | 1,406 | |
U.S. Bank National Association | | June 2029 | | | 2.03 | % | | daily compounded SOFR | | | 25,000 | | | | 1,407 | |
Regions Bank | | August 2029 | | | 2.58 | % | | one-month SOFR | | | 100,000 | | | | 2,782 | |
Toronto-Dominion Bank | | August 2029 | | | 2.58 | % | | one-month SOFR | | | 45,000 | | | | 1,282 | |
U.S. Bank National Association | | August 2029 | | | 2.65 | % | | one-month SOFR | | | 15,000 | | | | 379 | |
U.S. Bank National Association | | August 2029 | | | 2.58 | % | | one-month SOFR | | | 100,000 | | | | 2,798 | |
U.S. Bank National Association | | August 2029 | | | 1.35 | % | | daily compounded SOFR | | | 25,000 | | | | 2,231 | |
Regions Bank | | March 2032 | | | 2.69 | % | | daily compounded CORRA | | | 14,796 | | 3 | | 295 | |
U.S. Bank National Association | | March 2032 | | | 2.70 | % | | daily compounded CORRA | | | 14,796 | | 3 | | 291 | |
Bank of Montreal | | March 2034 | | | 2.81 | % | | daily compounded CORRA | | | 29,593 | | 4 | | 688 | |
| | | | | | | | | $ | 973,981 | | | $ | 27,812 | |
Forward Starting Swaps:5 | | | | | | | | | | | | | |
Bank of Montreal | | March 2030 | | | 3.80 | % | | daily simple SOFR | | $ | 80,000 | | | $ | (2,535 | ) |
JPMorgan Chase Bank, N.A. | | March 2030 | | | 3.79 | % | | daily simple SOFR | | | 50,000 | | | | (1,545 | ) |
U.S. Bank National Association | | June 2030 | | | 3.73 | % | | daily simple SOFR | | | 70,000 | | | | (2,021 | ) |
Truist Financial Corporation | | June 2030 | | | 3.73 | % | | daily simple SOFR | | | 55,000 | | | | (1,598 | ) |
Manufacturers & Traders Trust Company | | September 2030 | | | 3.71 | % | | daily simple SOFR | | | 50,000 | | | | (1,378 | ) |
Regions Bank | | September 2030 | | | 3.69 | % | | daily simple SOFR | | | 15,000 | | | | (409 | ) |
Truist Financial Corporation | | September 2030 | | | 3.70 | % | | daily simple SOFR | | | 15,000 | | | | (409 | ) |
Toronto-Dominion Bank | | December 2030 | | | 3.66 | % | | daily simple SOFR | | | 70,000 | | | | (1,756 | ) |
Regions Bank | | December 2030 | | | 3.66 | % | | daily simple SOFR | | | 55,000 | | | | (1,399 | ) |
| | | | | | | | | $ | 460,000 | | | $ | (13,050 | ) |
| | | | | | | | | | | | | |
Total Swaps | | | | | | | | | $ | 1,433,981 | | | $ | 14,762 | |
1 The weighted average maturity date of effective swaps and effective swaps and forward starting swaps combined was 3.4 years and 4.1 years, respectively, at September 30, 2024.
2 At September 30, 2024, the weighted average interest rate on all outstanding borrowings was 3.78%, inclusive of a weighted average fixed rate on effective interest rate swaps of 2.28%.
3 The contractual notional amount is $20.0 million CAD.
4 The contractual notional amount is $40.0 million CAD.
5 Forward starting swaps have effective dates that are 5 years prior to each respective maturity date.
BROADSTONE NET LEASE, INC. | www.broadstone.com | © 2024 Broadstone Net Lease, LLC. All rights reserved. 13
EBITDA, EBITDAre, and Other-Non GAAP Operating Measures
(unaudited, in thousands)
| | | | | | | | | | | | | | | | | | | | |
| | Three Months Ended | |
| | September 30,
2024 | | | June 30,
2024 | | | March 31,
2024 | | | December 31,
2023 | | | September 30,
2023 | |
Net income | | $ | 37,268 | | | $ | 35,937 | | | $ | 68,177 | | | $ | 6,797 | | | $ | 52,145 | |
Depreciation and amortization | | | 38,016 | | | | 37,404 | | | | 37,772 | | | | 39,278 | | | | 38,533 | |
Interest expense | | | 18,178 | | | | 17,757 | | | | 18,578 | | | | 18,972 | | | | 19,665 | |
Income taxes | | | 291 | | | | 531 | | | | 408 | | | | (268 | ) | | | 104 | |
EBITDA | | $ | 93,753 | | | $ | 91,629 | | | $ | 124,935 | | | $ | 64,779 | | | $ | 110,447 | |
Provision for impairment of investment in
rental properties | | | 1,059 | | | | 3,852 | | | | 26,400 | | | | 29,801 | | | | — | |
Gain on sale of real estate | | | (2,441 | ) | | | (3,384 | ) | | | (59,132 | ) | | | (6,270 | ) | | | (15,163 | ) |
EBITDAre | | $ | 92,371 | | | $ | 92,097 | | | $ | 92,203 | | | $ | 88,310 | | | $ | 95,284 | |
Adjustment for current quarter investment activity 1 | | | 4,080 | | | | 1,241 | | | | — | | | | 153 | | | | 26 | |
Adjustment for current quarter disposition activity 2 | | | (66 | ) | | | (87 | ) | | | (4,712 | ) | | | (156 | ) | | | (400 | ) |
Adjustment to exclude non-recurring and other expenses 3 | | | (201 | ) | | | 26 | | | | (125 | ) | | | 128 | | | | 740 | |
Adjustment to exclude net write-offs of accrued rental income | | | — | | | | — | | | | 2,556 | | | | 4,161 | | | | — | |
Adjustment to exclude realized / unrealized foreign exchange (gain) loss | | | 942 | | | | (748 | ) | | | (1,696 | ) | | | 1,453 | | | | (1,433 | ) |
Other income from real estate transactions 4 | | | (887 | ) | | | — | | | | — | | | | — | | | | — | |
Adjusted EBITDAre | | $ | 96,239 | | | $ | 92,529 | | | $ | 88,226 | | | $ | 94,049 | | | $ | 94,217 | |
Estimated revenues from developments 5 | | | — | | | | 3,458 | | | | 2,771 | | | | — | | | | — | |
Pro Forma Adjusted EBITDAre | | $ | 96,239 | | | $ | 95,987 | | | $ | 90,997 | | | $ | 94,049 | | | $ | 94,217 | |
Annualized EBITDAre | | $ | 369,484 | | | $ | 368,388 | | | $ | 368,812 | | | $ | 353,240 | | | $ | 381,136 | |
Annualized Adjusted EBITDAre | | | 384,956 | | | | 370,116 | | | | 352,904 | | | | 376,196 | | | | 376,868 | |
Pro Forma Annualized Adjusted EBITDAre | | | 384,956 | | | | 383,948 | | | | 363,988 | | | | 376,196 | | | | 376,868 | |
1 Reflects an adjustment to give effect to all investments during the quarter, including developments that have reached rent commencement, as if they had been made as of the beginning of the quarter.
2 Reflects an adjustment to give effect to all dispositions during the quarter as if they had been sold as of the beginning of the quarter.
3 Amounts include $0.2 million of forfeited stock-based compensation expense during the three months ended September 30, 2024.
4 Amount includes income for the settlement of a permanent land easement for an insignificant portion of two of our properties during the three months ended September 30, 2024.
5 Represents estimated contractual revenues based on in-process development spend to-date.
| | | | | | | | | | | | | | | | | | | | |
| | Three Months Ended | |
| | September 30,
2024 | | | June 30,
2024 | | | March 31,
2024 | | | December 31,
2023 | | | September 30,
2023 | |
Adjusted EBITDAre | | $ | 96,239 | | | $ | 92,529 | | | $ | 88,226 | | | $ | 94,049 | | | $ | 94,217 | |
General and administrative | | | 8,924 | | | | 9,878 | | | | 9,557 | | | | 9,254 | | | | 9,404 | |
Adjusted Net Operating Income ("NOI") | | $ | 105,163 | | | $ | 102,407 | | | $ | 97,783 | | | $ | 103,303 | | | $ | 103,621 | |
Straight-line rental revenue, net | | | (6,128 | ) | | | (5,191 | ) | | | (4,929 | ) | | | (5,438 | ) | | | (6,744 | ) |
Other amortization and non-cash charges | | | (1,309 | ) | | | (1,095 | ) | | | (1,018 | ) | | | (1,014 | ) | | | (1,087 | ) |
Adjusted Cash NOI | | $ | 97,726 | | | $ | 96,121 | | | $ | 91,836 | | | $ | 96,851 | | | $ | 95,789 | |
Annualized Adjusted NOI | | $ | 420,652 | | | $ | 409,628 | | | $ | 391,132 | | | $ | 413,212 | | | $ | 414,483 | |
Annualized Adjusted Cash NOI | | | 390,904 | | | | 384,484 | | | | 367,344 | | | | 387,404 | | | | 383,157 | |
BROADSTONE NET LEASE, INC. | www.broadstone.com | © 2024 Broadstone Net Lease, LLC. All rights reserved. 14
Net Debt Metrics
(in thousands)
| | | | | | | | | | | | | | | | | | | | |
| | September 30,
2024 | | | June 30,
2024 | | | March 31,
2024 | | | December 31,
2023 | | | September 30,
2023 | |
Debt | | | | | | | | | | | | | | | |
Unsecured revolving credit facility | | $ | 125,482 | | | $ | 79,096 | | | $ | 73,820 | | | $ | 90,434 | | | $ | 74,060 | |
Unsecured term loans, net | | | 896,887 | | | | 896,574 | | | | 896,260 | | | | 895,947 | | | | 895,633 | |
Senior unsecured notes, net | | | 845,875 | | | | 845,687 | | | | 845,498 | | | | 845,309 | | | | 845,121 | |
Mortgages, net | | | 77,416 | | | | 77,970 | | | | 78,517 | | | | 79,068 | | | | 79,613 | |
Debt issuance costs | | | 7,314 | | | | 7,825 | | | | 8,337 | | | | 8,848 | | | | 9,360 | |
Gross Debt | | | 1,952,974 | | | | 1,907,152 | | | | 1,902,432 | | | | 1,919,606 | | | | 1,903,787 | |
Cash and cash equivalents | | | (8,999 | ) | | | (18,282 | ) | | | (221,740 | ) | | | (19,494 | ) | | | (35,061 | ) |
Restricted cash | | | (2,219 | ) | | | (1,614 | ) | | | (1,038 | ) | | | (1,138 | ) | | | (15,436 | ) |
Net Debt | | $ | 1,941,756 | | | $ | 1,887,256 | | | $ | 1,679,654 | | | $ | 1,898,974 | | | $ | 1,853,290 | |
Estimated net proceeds from forward equity agreements 1 | | | (38,983 | ) | | | — | | | | — | | | | — | | | | — | |
Pro Forma Net Debt | | $ | 1,902,773 | | | $ | 1,887,256 | | | $ | 1,679,654 | | | $ | 1,898,974 | | | $ | 1,853,290 | |
| | | | | | | | | | | | | | | |
Leverage Ratios: | | | | | | | | | | | | | | | |
Net Debt to Annualized EBITDAre | | 5.3x | | | 5.1x | | | 4.6x | | | 5.4x | | | 4.9x | |
Net Debt to Annualized Adjusted
EBITDAre | | 5.0x | | | 5.1x | | | 4.8x | | | 5.0x | | | 4.9x | |
Pro Forma Net Debt to Annualized
Adjusted EBITDAre | | 4.9x | | | 4.9x | | | 4.6x | | | 5.0x | | | 4.9x | |
1 Represents pro forma adjustment for estimated net proceeds from forward sale agreements that have not settled as if they have been physically settled for cash as of the period presented.
Covenants
The following is a summary of key financial covenants for the Company’s unsecured debt instruments. The covenants associated with the Revolving Credit Facility, Unsecured Term Loans with commercial banks, and the Series A-C Senior Unsecured Notes, are reported to the respective lenders via quarterly covenant reporting packages. The covenants associated with the 2031 Senior Unsecured Public Notes are not required to be reported externally to third parties, and are instead calculated in connection with borrowing activity and for financial reporting purposes only. These calculations, which are not based on U.S. GAAP measurements, are presented to investors to show that as of September 30, 2024, the Company believes it is in compliance with the covenants.
| | | | | | | | | | | | | | |
Covenants | | Required | | Revolving Credit Facility and Unsecured Term Loans | | | Senior Unsecured
Notes Series
A, B, & C | | | 2031 Senior Unsecured Public Notes | |
Leverage ratio | | ≤ 0.60 to 1.00 | | | 0.32 | | | | 0.33 | | | Not Applicable | |
Secured indebtedness ratio | | ≤ 0.40 to 1.00 | | | 0.01 | | | | 0.01 | | | Not Applicable | |
Unencumbered coverage ratio | | ≥ 1.75 to 1.00 | | | 3.69 | | | Not Applicable | | | Not Applicable | |
Fixed charge coverage ratio | | ≥ 1.50 to 1.00 | | | 4.55 | | | | 4.55 | | | Not Applicable | |
Total unsecured indebtedness to
total unencumbered eligible
property value | | ≤ 0.60 to 1.00 | | | 0.37 | | | | 0.35 | | | Not Applicable | |
Dividends and other restricted
payments | | Only applicable
in case of default | | Not Applicable | | | Not Applicable | | | Not Applicable | |
Aggregate debt ratio | | ≤ 0.60 to 1.00 | | Not Applicable | | | Not Applicable | | | | 0.36 | |
Consolidated income available for
debt to annual debt service
charge | | ≥ 1.50 to 1.00 | | Not Applicable | | | Not Applicable | | | | 5.27 | |
Total unencumbered assets to
total unsecured debt | | ≥ 1.50 to 1.00 | | Not Applicable | | | Not Applicable | | | | 2.84 | |
Secured debt ratio | | ≤ 0.40 to 1.00 | | Not Applicable | | | Not Applicable | | | | 0.01 | |
BROADSTONE NET LEASE, INC. | www.broadstone.com | © 2024 Broadstone Net Lease, LLC. All rights reserved. 15
Debt Maturities
(dollars in millions)
The Company utilizes diversified sources of debt capital including unsecured bank debt, unsecured notes, and secured mortgages (where appropriate).
|
Weighted Average Debt Maturity: 3.8 years1 |
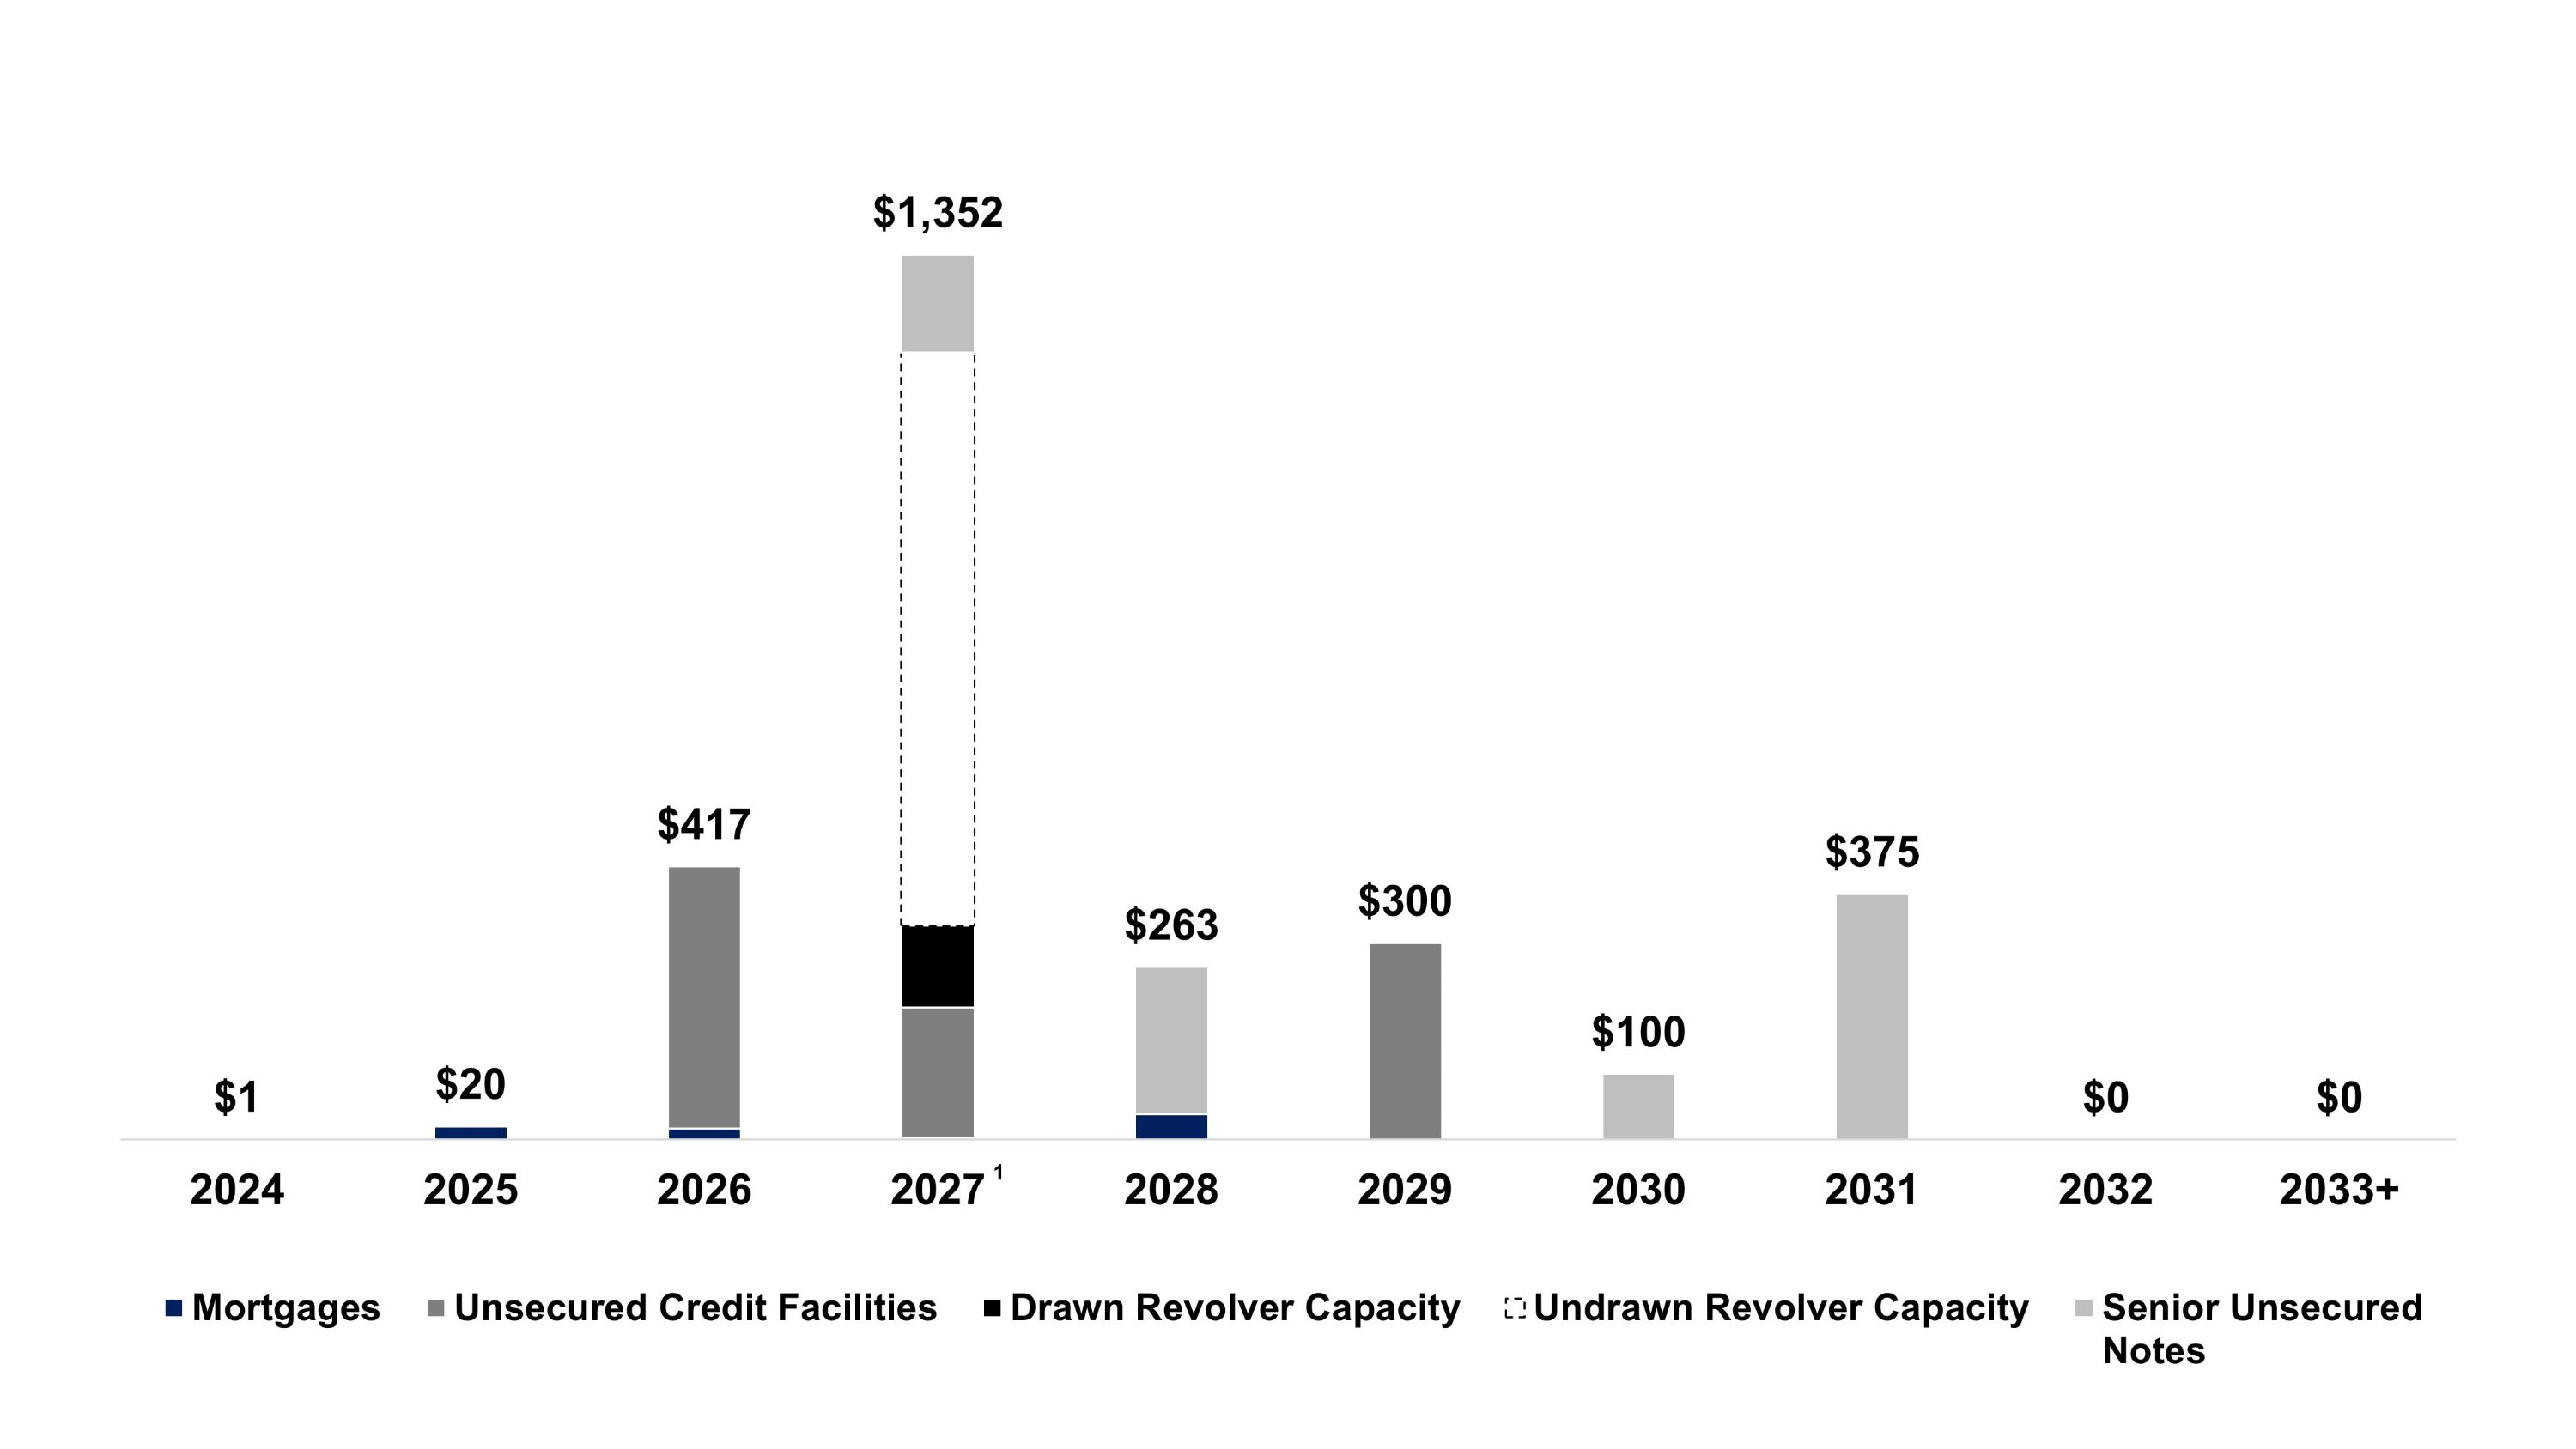
1 Our Revolving Credit Facility reflected above assumes exercise of two six-month extension options subject to certain conditions, including the payment of an extension fee equal to 0.0625% of the revolving commitments.
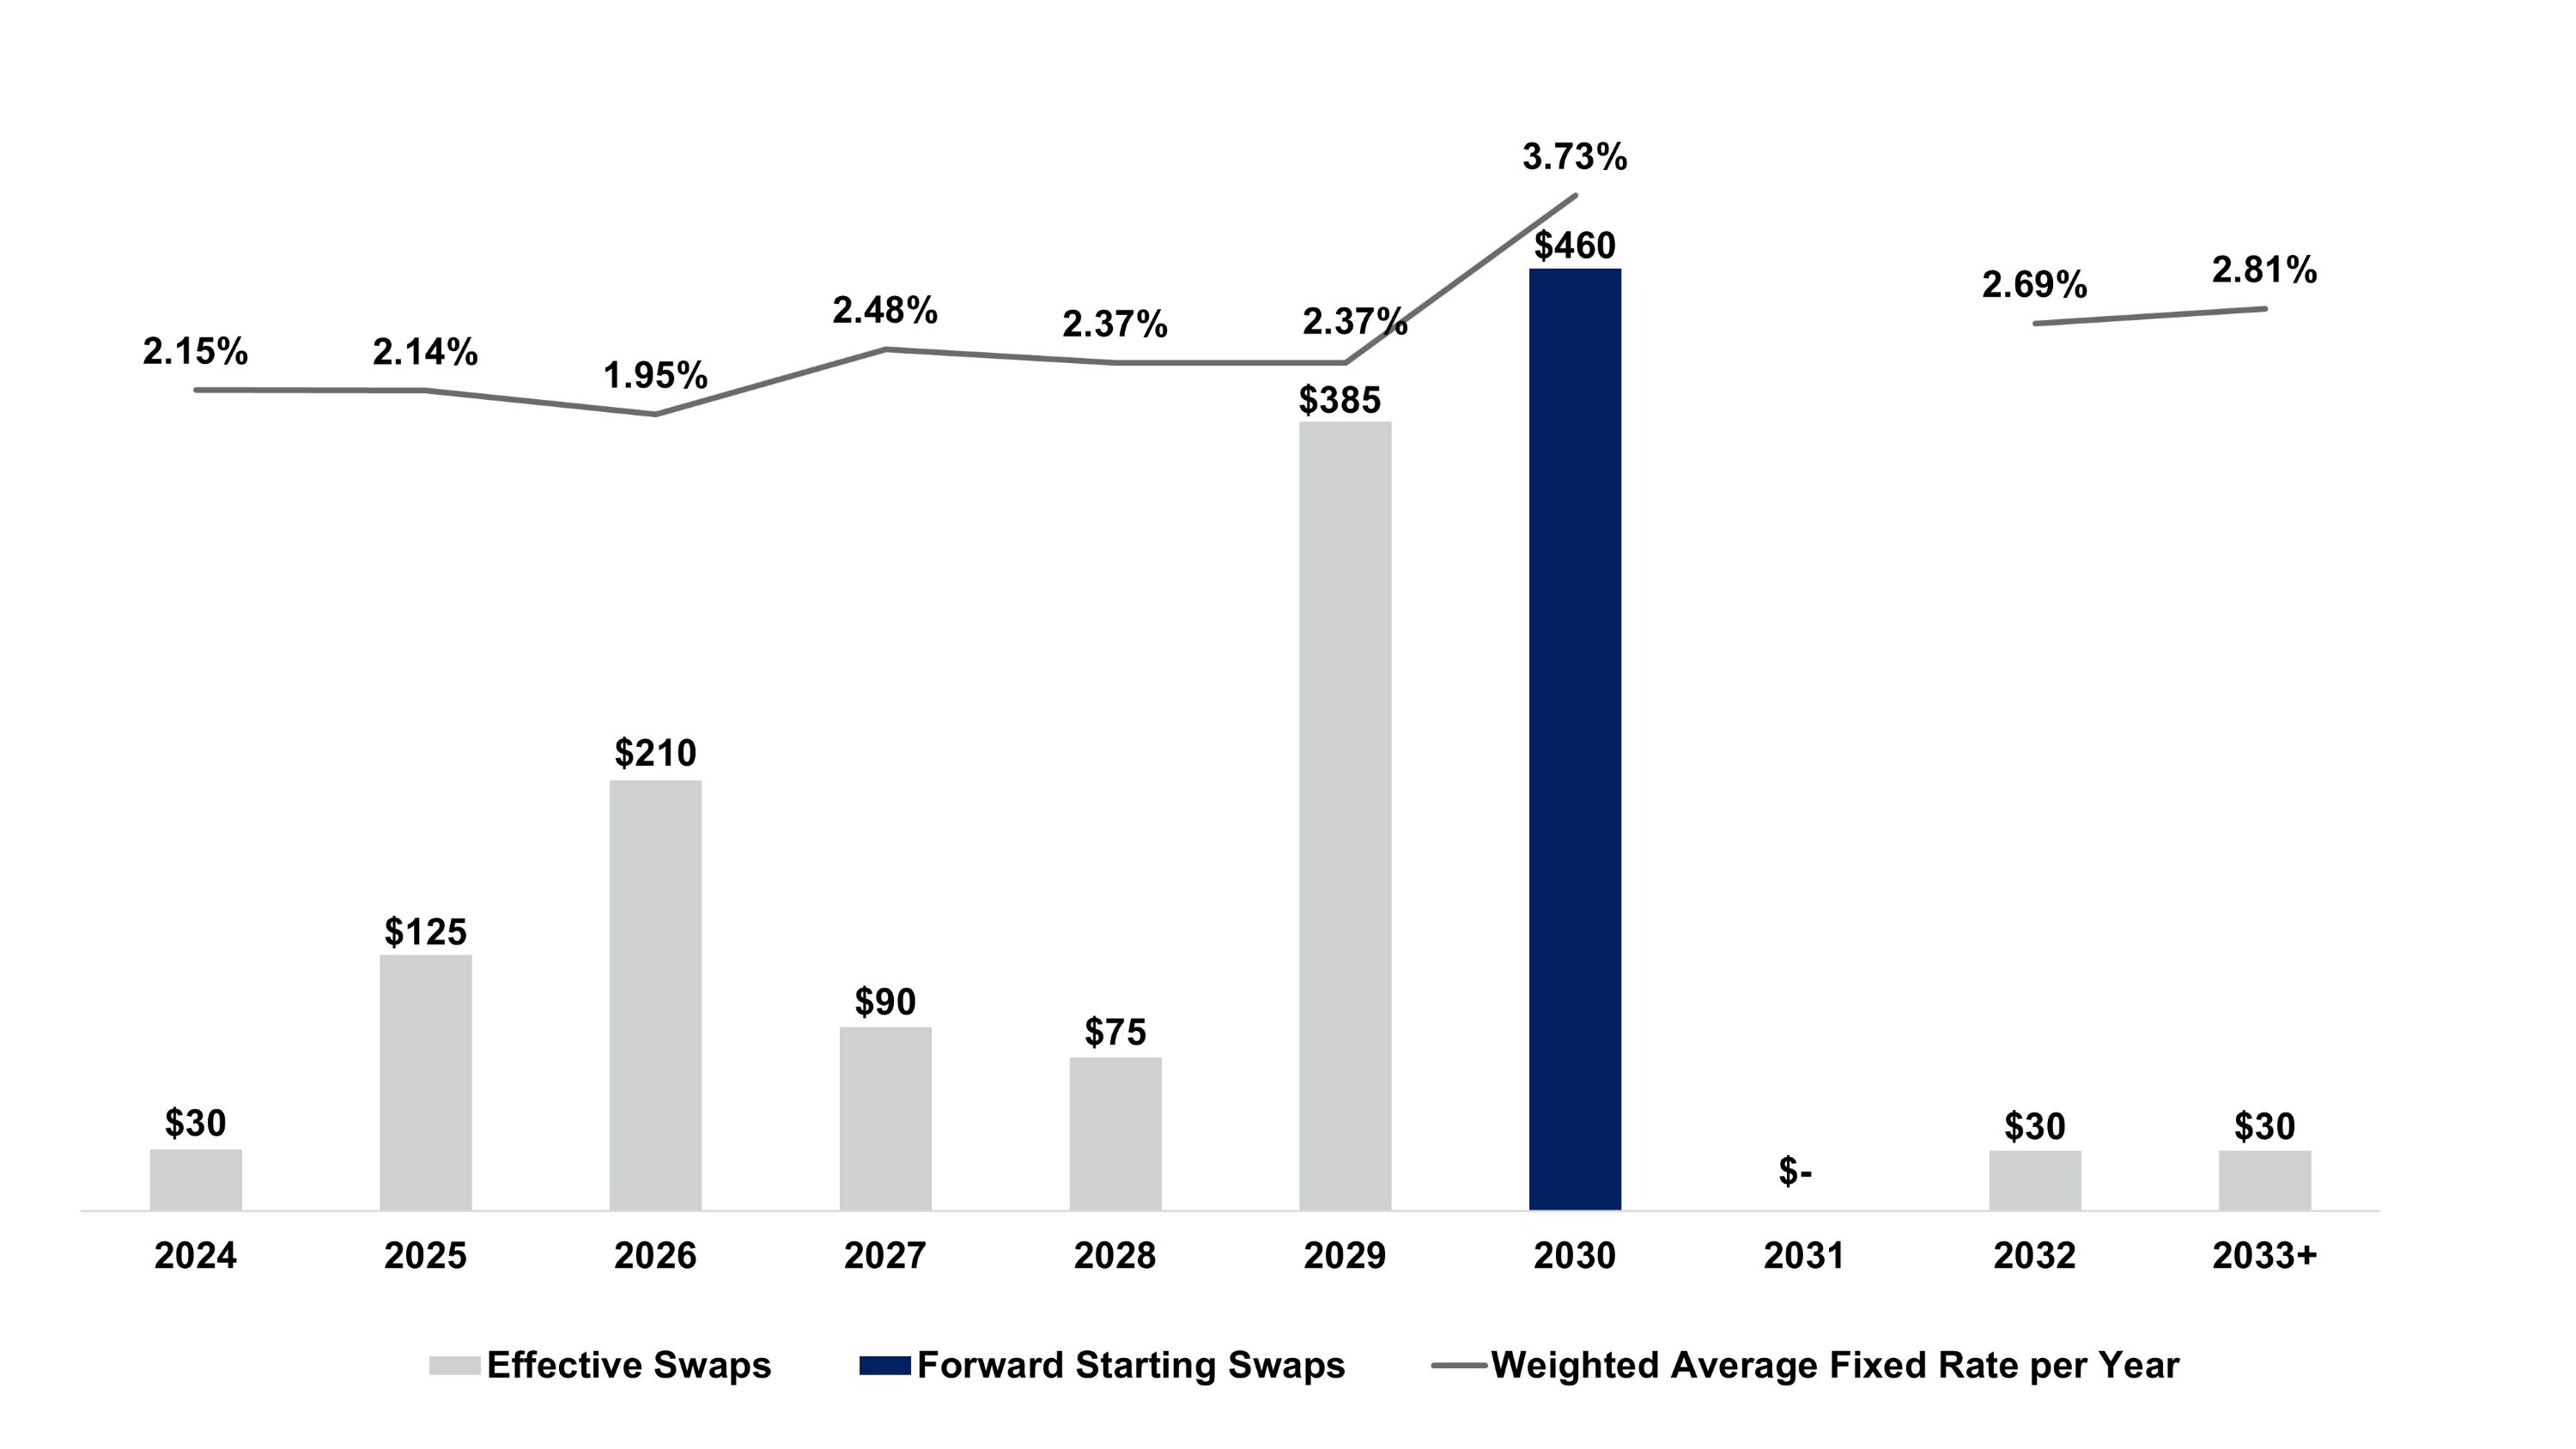
Swap Maturities
(dollars in millions)
|
Weighted Average Effective Swap Maturity: 3.4 years Weighted Average Effective & Forward Starting Swap Maturity: 4.1 years |
BROADSTONE NET LEASE, INC. | www.broadstone.com | © 2024 Broadstone Net Lease, LLC. All rights reserved. 16
Investment Activity
(square feet and dollars in thousands)
The following tables summarize the Company’s investment activity during 2024.
| | | | | | | | | | | | | | | | |
| | Q3 2024 | | | Q2 2024 | | | Q1 2024 | | | YTD 2024 | |
Acquisitions: | | | | | | | | | | | | |
Number of transactions | | | 2 | | | | 6 | | | | — | | | | 8 | |
Number of properties | | | 2 | | | | 21 | | | | — | | | | 23 | |
Square feet | | | 357 | | | | 1,094 | | | | — | | | | 1,451 | |
Acquisition price | | $ | 69,250 | | | $ | 165,053 | | | $ | — | | | $ | 234,303 | |
Industrial | | | 59,000 | | | | 103,735 | | | | — | | | | 162,735 | |
Retail | | | 10,250 | | | | 52,359 | | | | — | | | | 62,609 | |
Restaurant | | | — | | | | 8,959 | | | | — | | | | 8,959 | |
Initial cash capitalization rate | | | 7.2 | % | | | 7.3 | % | | | — | | | | 7.3 | % |
Straight-line yield | | | 8.0 | % | | | 8.1 | % | | | — | | | | 8.1 | % |
Weighted avg. lease term (years) | | | 9.4 | | | | 11.5 | | | | — | | | | 10.9 | |
Weighted average annual rent increase | | | 2.8 | % | | | 2.3 | % | | | — | | | | 2.4 | % |
| | | | | | | | | | | | |
Development funding opportunities: | | | | | | | | | | | | |
Number of new properties | | | — | | | | — | | | | — | | | | — | |
Development funding | | $ | 24,667 | | | $ | 30,583 | | | $ | 37,107 | | | $ | 92,357 | |
| | | | | | | | | | | | |
Revenue generating capital expenditures: | | | | | | | | | | | | |
Number of existing properties | | | — | | | | — | | | | 1 | | | | 1 | |
Investments | | $ | — | | | $ | — | | | $ | 3,000 | | | $ | 3,000 | |
Healthcare - Animal Health Services | | | — | | | | — | | | | 3,000 | | | | 3,000 | |
Initial cash capitalization rate | | | — | | | | — | | | | 8.0 | % | | | 8.0 | % |
Weighted avg. lease term (years) | | | — | | | | — | | | | 8.0 | | | | 8.0 | |
Weighted average annual rent increase | | | — | | | | — | | | | 2.5 | % | | | 2.5 | % |
| | | | | | | | | | | | |
Transitional capital: | | | | | | | | | | | | |
Number of transactions | | | — | | | | 1 | | | | — | | | | 1 | |
Investments1 | | $ | — | | | $ | 52,200 | | | $ | — | | | $ | 52,200 | |
Cash capitalization rate | | | — | | | | 8.0 | % | | | — | | | | 8.0 | % |
| | | | | | | | | | | | |
Total investments | | $ | 93,917 | | | $ | 247,836 | | | $ | 40,107 | | | $ | 381,860 | |
Total initial cash capitalization rate2 | | | 7.2 | % | | | 7.3 | % | | | 8.0 | % | | | 7.3 | % |
Total weighted average lease term (years)2 | | | 9.4 | | | | 11.5 | | | | 8.0 | | | | 10.8 | |
Total weighted average annual rent increase2 | | | 2.8 | % | | | 2.3 | % | | | 2.5 | % | | | 2.4 | % |
1 Refer below for property-level statistics relating to our transitional capital investments.
2 Due to the nature of (1) transitional capital representing a contractual yield on invested capital, and (2) development funding opportunities not generating revenue during construction, these are excluded from the calculation of total capitalization rates, weighted average lease terms, and rent increases.
BROADSTONE NET LEASE, INC. | www.broadstone.com | © 2024 Broadstone Net Lease, LLC. All rights reserved. 17
Transitional Capital
The following table summarizes the Company’s transitional capital investments, which are excluded from real estate investment portfolio statistics:
| | | | |
| | Q3 2024 | |
Transitional Capital: | | | |
Type | | Preferred Equity | |
Investment (’000s)1 | | $ | 52,200 | |
Stabilized cash capitalization rate2 | | | 8.0 | % |
Annualized initial cash NOI yield | | | 7.6 | % |
Remaining term (years)3 | | | 2.8 | |
Property type | | Retail Center | |
Underlying property metrics | | | |
Number of retail spaces | | | 28 | |
Rentable square footage (“SF”) (’000s) | | | 332 | |
Weighted average remaining lease term (years) | | | 3.8 | |
Occupancy rate (based on SF)4 | | | 98.7 | % |
Quarterly rent collection | | | 95.2 | % |
1 Agreement includes commitment to fund up to an additional $7.8 million of preferred capital.
2 Represents stated yield with unpaid amounts accruing with preferential payment.
3 Agreement contains two one-year extension options subject to a 0.50% extension fee. Repayment at end of term subject to a $3.5 million repayment fee.
4 Includes executed leases where rent has not yet commenced.
Developments
(square feet and dollars in thousands)
The following table summarizes the Company’s completed developments as of September 30, 2024:
| | | | | | | | | | | | | | | | | | | | | | | | | | | | |
Property | | Property Type | | Rentable Square Feet | | | Lease Commencement Date5 | | Investment Funded | | | Estimated Investment to be Funded6 | | | Total Project Investment | | | Cash Capitalization Rate5 | | | Straight-line Yield5 | |
UNFI (Sarasota - FL) | | Industrial | | | 1,016 | | | 9/2024 | | $ | 185,964 | | | $ | 18,869 | | | $ | 204,833 | | | | 7.2 | % | | | 8.6 | % |
5 Refer to definitions and explanations appearing at the end of this supplemental document.
6 Revenue on additional fundings will receive a cash capitalization rate of 6.8%.
BROADSTONE NET LEASE, INC. | www.broadstone.com | © 2024 Broadstone Net Lease, LLC. All rights reserved. 18
Dispositions
(square feet and dollars in thousands)
The following table summarizes the Company’s property disposition activity during 2024.
| | | | | | | | | | | | | | | | | | | | |
Q1 2024 | | | | | | | | | | | | | | | |
Property Type | | Number of Properties | | | Square Feet | | | Acquisition Price | | | Disposition Price | | | Net Book
Value | |
Healthcare | | | 37 | | | | 706 | | | $ | 250,079 | | | | 251,700 | | | $ | 199,098 | |
Total Properties | | | 37 | | | | 706 | | | $ | 250,079 | | | $ | 251,700 | | | $ | 199,098 | |
Weighted average cash cap rate | | | | | | | | | | | | | 7.9 | % |
| | | | | | | | | | | | | | | |
Q2 2024 | | | | | | | | | | | | | | | |
Property Type | | Number of Properties | | | Square Feet | | | Acquisition Price | | | Disposition Price | | | Net Book
Value | |
Industrial | | | 1 | | | | 187 | | | $ | 11,330 | | | $ | 11,750 | | | $ | 10,753 | |
Office | | | 1 | | | | 46 | | | | 11,745 | | | | 2,100 | | | | 3,003 | |
Healthcare | | | 1 | | | | 34 | | | | 10,000 | | | | 10,500 | | | | 7,620 | |
Total Properties | | | 3 | | | | 267 | | | $ | 33,075 | | | $ | 24,350 | | | $ | 21,376 | |
Weighted average cash cap rate | | | | | | | | | | | | | 7.3 | % |
| | | | | | | | | | | | | | | |
Q3 2024 | | | | | | | | | | | | | | | |
Property Type | | Number of Properties | | | Square Feet | | | Acquisition Price | | | Disposition Price | | | Net Book
Value | |
Office | | | 1 | | | | 18 | | | $ | 4,316 | | | $ | 4,508 | | | $ | 2,524 | |
Healthcare | | | 5 | | | | 92 | | | | 32,295 | | | | 27,304 | | | | 27,272 | |
Total Properties | | | 6 | | | | 110 | | | $ | 36,611 | | | $ | 31,812 | | | $ | 29,796 | |
Weighted average cash cap rate | | | | | | | | | | | | | 8.0 | % |
| | | | | | | | | | | | | | | |
2024 Dispositions | | | | | | | | | | | | | | | |
Property Type | | Number of Properties | | | Square Feet | | | Acquisition Price | | | Disposition Price | | | Net Book
Value | |
Industrial | | | 1 | | | | 187 | | | $ | 11,330 | | | $ | 11,750 | | | $ | 10,753 | |
Office | | | 2 | | | | 64 | | | | 16,061 | | | | 6,608 | | | | 5,527 | |
Healthcare | | | 43 | | | | 832 | | | | 292,374 | | | | 289,504 | | | | 233,990 | |
Total Properties | | | 46 | | | | 1,083 | | | $ | 319,765 | | | $ | 307,862 | | | $ | 250,270 | |
Weighted average cash cap rate | | | | | | | | | | | | | 7.8 | % |
BROADSTONE NET LEASE, INC. | www.broadstone.com | © 2024 Broadstone Net Lease, LLC. All rights reserved. 19
Portfolio at a Glance: Key Metrics1
| | | | | | | | | | | | | | | | | | | |
| September 30,
2024 | | | June 30,
2024 | | | March 31,
2024 | | | December 31,
2023 | | | September 30,
2023 | |
Properties | | 773 | | | | 777 | | | | 759 | | | | 796 | | | | 800 | |
U.S. States | | 44 | | | | 44 | | | | 44 | | | | 44 | | | | 44 | |
Canadian Provinces | | 4 | | | | 4 | | | | 4 | | | | 4 | | | | 4 | |
Total annualized base rent | $398.2M | | | $385.5M | | | $374.1M | | | $392.2M | | | $390.0M | |
Total rentable square footage (“SF”) | 39.7M | | | 38.5M | | | 37.6M | | | 38.3M | | | 38.2M | |
Tenants | | 203 | | | | 207 | | | | 200 | | | | 220 | | | | 220 | |
Brands | | 191 | | | | 196 | | | | 188 | | | | 208 | | | | 208 | |
Industries | | 55 | | | | 53 | | | | 53 | | | | 53 | | | | 54 | |
Occupancy (based on SF) | | 99.0 | % | | | 99.3 | % | | | 99.2 | % | | | 99.4 | % | | | 99.4 | % |
Rent Collection | | 99.1 | % | | | 99.0 | % | | | 99.0 | % | | | 99.2 | % | | | 99.9 | % |
Top 10 tenant concentration | | 21.4 | % | | | 20.2 | % | | | 20.6 | % | | | 19.6 | % | | | 19.3 | % |
Top 20 tenant concentration | | 34.9 | % | | | 33.4 | % | | | 34.0 | % | | | 32.3 | % | | | 32.0 | % |
Investment grade (tenant/guarantor) | | 17.0 | % | | | 15.5 | % | | | 15.7 | % | | | 15.3 | % | | | 15.3 | % |
Financial reporting coverage2 | | 94.0 | % | | | 94.8 | % | | | 95.3 | % | | | 93.8 | % | | | 93.7 | % |
Rent coverage ratio (restaurants only) | 3.3x | | | 3.3x | | | 3.3x | | | 3.4x | | | 3.4x | |
Weighted average annual rent increases | | 2.0 | % | | | 2.0 | % | | | 2.0 | % | | | 2.0 | % | | | 2.0 | % |
Weighted average remaining lease term | 10.3 years | | | 10.4 years | | | 10.6 years | | | 10.5 years | | | 10.5 years | |
Master leases (based on ABR) | | | | | | | | | | | | | | |
Total portfolio | | 40.2 | % | | | 41.7 | % | | | 43.0 | % | | | 41.5 | % | | | 41.6 | % |
Multi-site tenants | | 69.0 | % | | | 71.0 | % | | | 71.0 | % | | | 69.0 | % | | | 69.3 | % |
1 Property metrics exclude transitional capital investments.
2 Includes 8.6% related to tenants not required to provide financial information under the terms of our lease, but whose financial statements are available publicly at September 30, 2024.
BROADSTONE NET LEASE, INC. | www.broadstone.com | © 2024 Broadstone Net Lease, LLC. All rights reserved. 20
Diversification: Tenants & Brands
Top 20 Tenants
| | | | | | | | | | | | | | | | | | | | | | |
Tenant | | Property Type | | #
Properties | | | ABR
(’000s) | | | ABR as a
% of Total
Portfolio | | | Square
Feet
(’000s) | | | SF as a
% of Total
Portfolio | |
Roskam Baking Company, LLC* | | Food Processing | | | 7 | | | $ | 15,917 | | | | 4.0 | % | | | 2,250 | | | | 5.7 | % |
United Natural Foods, Inc. | | Cold Storage | | | 1 | | | | 13,367 | | | | 3.4 | % | | | 1,016 | | | | 2.6 | % |
AHF, LLC* | | Distribution & Warehouse/Manufacturing | | | 8 | | | | 9,612 | | | | 2.4 | % | | | 2,284 | | | | 5.8 | % |
Joseph T. Ryerson & Son, Inc | | Distribution & Warehouse | | | 11 | | | | 7,870 | | | | 2.0 | % | | | 1,599 | | | | 4.0 | % |
Jack’s Family Restaurants LP* | | Quick Service Restaurants | | | 43 | | | | 7,456 | | | | 1.8 | % | | | 147 | | | | 0.4 | % |
Tractor Supply Company | | General Merchandise | | | 23 | | | | 6,353 | | | | 1.6 | % | | | 462 | | | | 1.2 | % |
Axcelis Technologies, Inc. | | Flex and R&D | | | 1 | | | | 6,263 | | | | 1.6 | % | | | 417 | | | | 1.1 | % |
J. Alexander’s, LLC* | | Casual Dining | | | 16 | | | | 6,207 | | | | 1.6 | % | | | 131 | | | | 0.3 | % |
Salm Partners, LLC* | | Food Processing | | | 2 | | | | 6,168 | | | | 1.5 | % | | | 426 | | | | 1.1 | % |
Nestle’ Dreyer's Ice Cream Company | | Cold Storage | | | 2 | | | | 6,151 | | | | 1.5 | % | | | 504 | | | | 1.1 | % |
Total Top 10 Tenants | | | | | 114 | | | $ | 85,364 | | | | 21.4 | % | | | 9,236 | | | | 23.3 | % |
| | | | | | | | | | | | | | | | | |
Hensley & Company* | | Distribution & Warehouse | | | 3 | | | $ | 6,109 | | | | 1.5 | % | | | 577 | | | | 1.5 | % |
Dollar General Corporation | | General Merchandise | | | 60 | | | | 5,983 | | | | 1.5 | % | | | 562 | | | | 1.4 | % |
BluePearl Holdings, LLC** | | Animal Health Services | | | 13 | | | | 5,750 | | | | 1.4 | % | | | 159 | | | | 0.4 | % |
Red Lobster Hospitality & Red Lobster Restaurants LLC* | | Casual Dining | | | 18 | | | | 5,563 | | | | 1.4 | % | | | 147 | | | | 0.4 | % |
Krispy Kreme Doughnut Corporation | | Quick Service Restaurants/
Food Processing | | | 27 | | | | 5,538 | | | | 1.4 | % | | | 156 | | | | 0.4 | % |
Outback Steakhouse of Florida LLC* | | Casual Dining | | | 22 | | | | 5,454 | | | | 1.4 | % | | | 140 | | | | 0.4 | % |
Big Tex Trailer Manufacturing Inc.* | | Automotive/Distribution & Warehouse/Manufacturing/ Corporate Headquarters | | | 17 | | | | 5,157 | | | | 1.3 | % | | | 1,302 | | | | 3.3 | % |
Carvana, LLC* | | Industrial Services | | | 2 | | | | 4,672 | | | | 1.2 | % | | | 230 | | | | 0.6 | % |
Jelly Belly Candy Company | | Distribution & Warehouse/Food Processing/General Merchandise | | | 5 | | | | 4,650 | | | | 1.2 | % | | | 576 | | | | 1.4 | % |
Klosterman Bakery* | | Food Processing | | | 11 | | | | 4,634 | | | | 1.2 | % | | | 548 | | | | 1.3 | % |
Total Top 20 Tenants | | | | | 292 | | | $ | 138,874 | | | | 34.9 | % | | | 13,633 | | | | 34.4 | % |
*Subject to a master lease.
**Includes properties leased by multiple tenants, some, not all, of which are subject to master leases.
BROADSTONE NET LEASE, INC. | www.broadstone.com | © 2024 Broadstone Net Lease, LLC. All rights reserved. 21
Top 20 Tenant Descriptions1
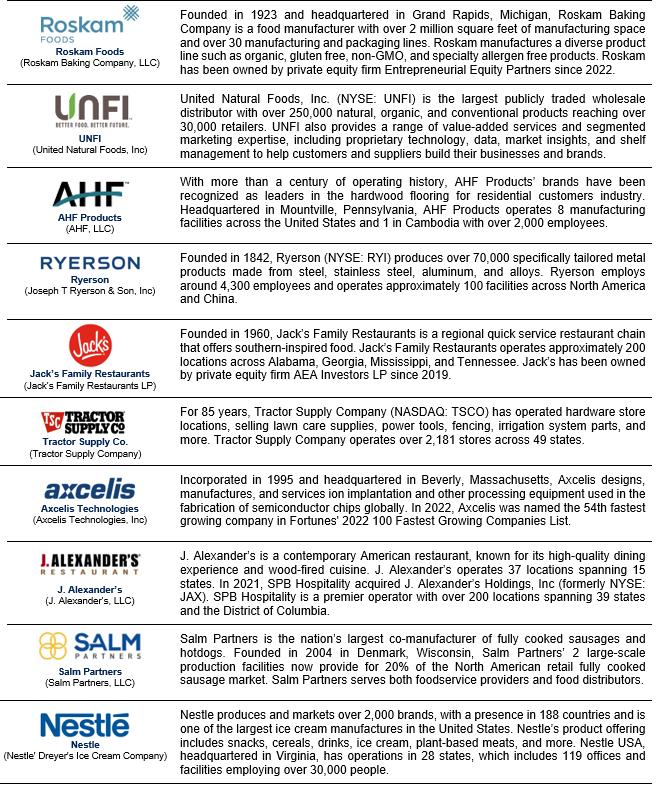
BROADSTONE NET LEASE, INC. | www.broadstone.com | © 2024 Broadstone Net Lease, LLC. All rights reserved. 22
Top 20 Tenant Descriptions1 (continued)
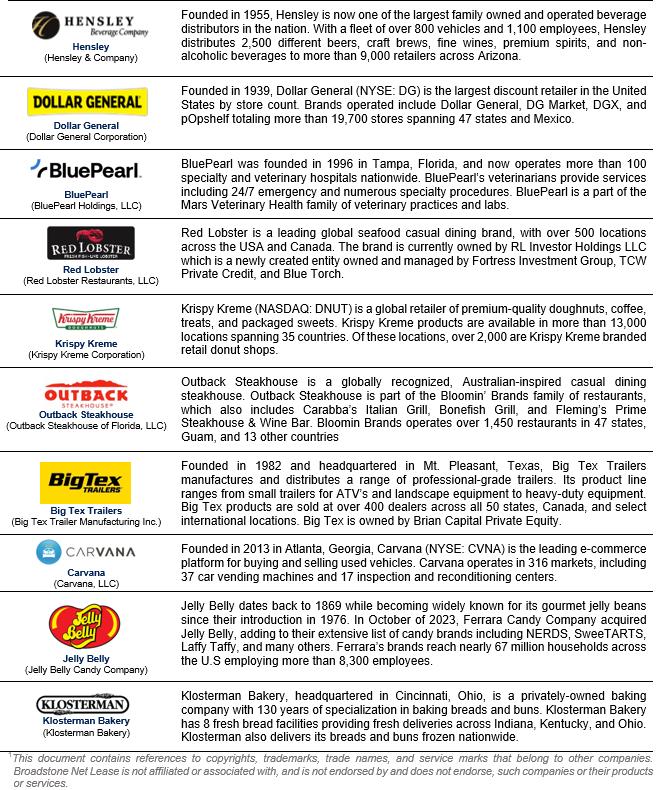
BROADSTONE NET LEASE, INC. | www.broadstone.com | © 2024 Broadstone Net Lease, LLC. All rights reserved. 23
Top 20 Brands
| | | | | | | | | | | | | | | | | | | | | | |
Brand | | Property Type | | #
Properties | | | ABR
(’000s) | | | ABR as a
% of Total
Portfolio | | | Square
Feet
(’000s) | | | SF as a
% of Total
Portfolio | |
Roskam Baking Company, LLC* | | Food Processing | | | 7 | | | $ | 15,917 | | | | 4.0 | % | | | 2,250 | | | | 5.7 | % |
United Natural Foods, Inc. | | Cold Storage | | | 1 | | | | 13,367 | | | | 3.4 | % | | | 1,016 | | | | 2.6 | % |
AHF Products* | | Distribution & Warehouse/
Manufacturing | | | 8 | | | | 9,612 | | | | 2.4 | % | | | 2,284 | | | | 5.8 | % |
Ryerson | | Distribution & Warehouse | | | 11 | | | | 7,870 | | | | 2.0 | % | | | 1,599 | | | | 4.0 | % |
Jack's Family Restaurants* | | Quick Service Restaurants | | | 43 | | | | 7,456 | | | | 1.9 | % | | | 147 | | | | 0.4 | % |
Tractor Supply Company | | General Merchandise | | | 23 | | | | 6,353 | | | | 1.6 | % | | | 462 | | | | 1.2 | % |
Axcelis | | Flex and R&D | | | 1 | | | | 6,263 | | | | 1.6 | % | | | 417 | | | | 1.1 | % |
Salm Partners, LLC* | | Food Processing | | | 2 | | | | 6,168 | | | | 1.5 | % | | | 426 | | | | 1.0 | % |
Nestle’ | | Cold Storage | | | 2 | | | | 6,150 | | | | 1.5 | % | | | 503 | | | | 1.2 | % |
Hensley* | | Distribution & Warehouse | | | 3 | | | | 6,110 | | | | 1.5 | % | | | 578 | | | | 1.4 | % |
Total Top 10 Brands | | | | | 101 | | | $ | 85,266 | | | | 21.4 | % | | | 9,682 | | | | 24.4 | % |
| | | | | | | | | | | | | | | | | |
Dollar General | | General Merchandise | | | 60 | | | $ | 5,983 | | | | 1.5 | % | | | 562 | | | | 1.4 | % |
BluePearl Veterinary Partners** | | Animal Health Services | | | 13 | | | | 5,750 | | | | 1.4 | % | | | 159 | | | | 0.4 | % |
Bob Evans Farms* | | Casual Dining/Food Processing | | | 21 | | | | 5,568 | | | | 1.4 | % | | | 281 | | | | 0.7 | % |
Red Lobster* | | Casual Dining | | | 18 | | | | 5,563 | | | | 1.4 | % | | | 147 | | | | 0.4 | % |
Krispy Kreme | | Quick Service Restaurants/
Food Processing | | | 27 | | | | 5,538 | | | | 1.4 | % | | | 156 | | | | 0.4 | % |
Big Tex Trailers* | | Automotive/Distribution &
Warehouse/Manufacturing/
Corporate Headquarters | | | 17 | | | | 5,157 | | | | 1.3 | % | | | 1,302 | | | | 3.3 | % |
Outback Steakhouse* | | Casual Dining | | | 20 | | | | 4,718 | | | | 1.2 | % | | | 126 | | | | 0.3 | % |
Carvana* | | Industrial Services | | | 2 | | | | 4,672 | | | | 1.2 | % | | | 230 | | | | 0.6 | % |
Jelly Belly | | Distribution & Warehouse/Food Processing/General Merchandise | | | 5 | | | | 4,650 | | | | 1.2 | % | | | 576 | | | | 1.4 | % |
Klosterman Bakery* | | Food Processing | | | 11 | | | | 4,635 | | | | 1.1 | % | | | 548 | | | | 1.4 | % |
Total Top 20 Brands | | | | | 295 | | | $ | 137,500 | | | | 34.5 | % | | | 13,769 | | | | 34.7 | % |
*Subject to a master lease.
**Includes properties leased by multiple tenants, some, not all, of which are subject to master leases.
BROADSTONE NET LEASE, INC. | www.broadstone.com | © 2024 Broadstone Net Lease, LLC. All rights reserved. 24
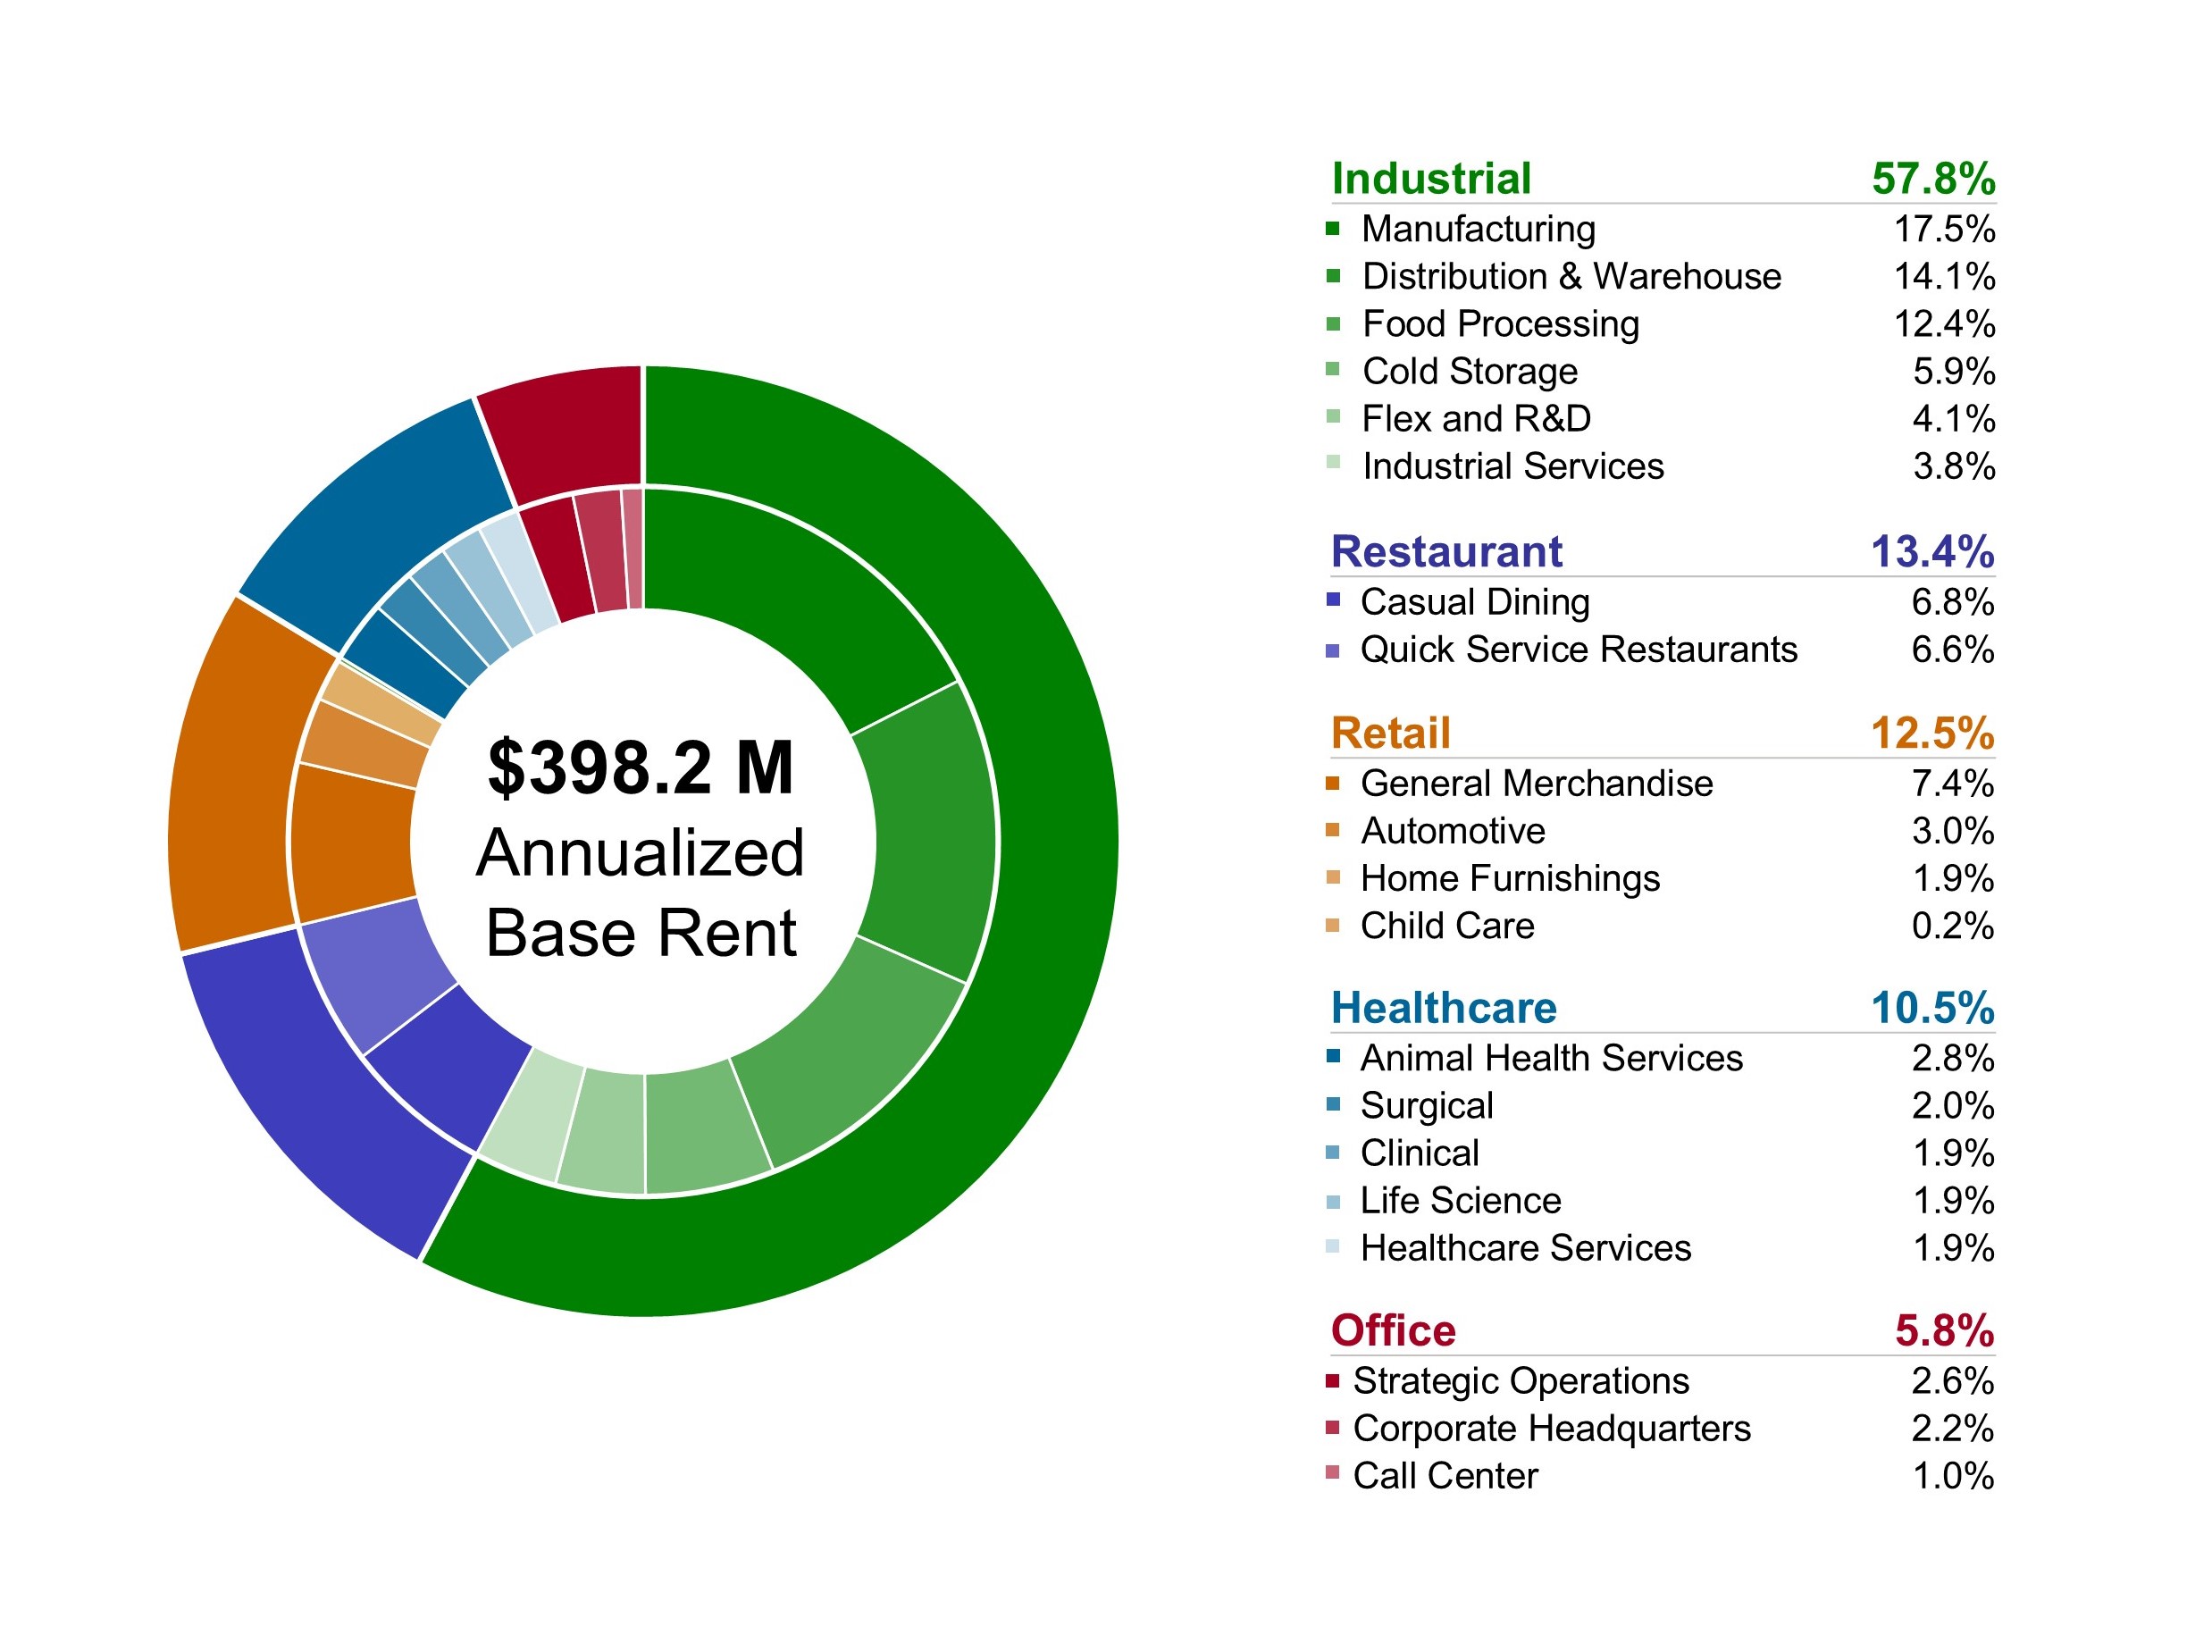
Diversification: Property Type
(rent percentages based on ABR)
BROADSTONE NET LEASE, INC. | www.broadstone.com | © 2024 Broadstone Net Lease, LLC. All rights reserved. 25
Diversification: Property Type (continued)
| | | | | | | | | | | | | | | | | | | | |
Property Type | | # Properties | | | ABR
(’000s) | | | ABR as a %
of Total
Portfolio | | | Square Feet (’000s) | | | SF as a %
of Total
Portfolio | |
Industrial | | | | | | | | | | | | | | | |
Manufacturing | | | 80 | | | $ | 69,796 | | | | 17.5 | % | | | 12,319 | | | | 31.0 | % |
Distribution & Warehouse | | | 49 | | | | 56,238 | | | | 14.1 | % | | | 9,596 | | | | 24.2 | % |
Food Processing | | | 34 | | | | 49,209 | | | | 12.4 | % | | | 5,736 | | | | 14.4 | % |
Cold Storage | | | 4 | | | | 23,344 | | | | 5.9 | % | | | 1,739 | | | | 4.4 | % |
Flex and R&D | | | 6 | | | | 16,298 | | | | 4.1 | % | | | 1,157 | | | | 2.9 | % |
Industrial Services | | | 29 | | | | 14,795 | | | | 3.8 | % | | | 725 | | | | 1.9 | % |
Untenanted | | | 1 | | | | — | | | | — | | | | 178 | | | | 0.4 | % |
Industrial Total | | | 203 | | | | 229,680 | | | | 57.8 | % | | | 31,450 | | | | 79.2 | % |
Restaurant | | | | | | | | | | | | | | | |
Casual Dining | | | 102 | | | | 27,107 | | | | 6.8 | % | | | 674 | | | | 1.7 | % |
Quick Service Restaurants | | | 151 | | | | 26,433 | | | | 6.6 | % | | | 514 | | | | 1.3 | % |
Restaurant Total | | | 253 | | | | 53,540 | | | | 13.4 | % | | | 1,188 | | | | 3.0 | % |
Retail | | | | | | | | | | | | | | | |
General Merchandise | | | 138 | | | | 29,549 | | | | 7.4 | % | | | 2,195 | | | | 5.5 | % |
Automotive | | | 65 | | | | 12,069 | | | | 3.0 | % | | | 764 | | | | 1.9 | % |
Home Furnishings | | | 13 | | | | 7,353 | | | | 1.9 | % | | | 797 | | | | 2.0 | % |
Child Care | | | 2 | | | | 725 | | | | 0.2 | % | | | 20 | | | | 0.1 | % |
Retail Total | | | 218 | | | | 49,696 | | | | 12.5 | % | | | 3,776 | | | | 9.5 | % |
Healthcare | | | | | | | | | | | | | | | |
Animal Health Services | | | 27 | | | | 11,216 | | | | 2.8 | % | | | 399 | | | | 1.0 | % |
Surgical | | | 6 | | | | 7,777 | | | | 2.0 | % | | | 231 | | | | 0.6 | % |
Clinical | | | 17 | | | | 7,756 | | | | 1.9 | % | | | 336 | | | | 0.8 | % |
Life Science | | | 8 | | | | 7,727 | | | | 1.9 | % | | | 519 | | | | 1.3 | % |
Healthcare Services | | | 25 | | | | 7,515 | | | | 1.9 | % | | | 273 | | | | 0.7 | % |
Untenanted | | | 2 | | | | — | | | | — | | | | 225 | | | | 0.6 | % |
Healthcare Total | | | 85 | | | | 41,991 | | | | 10.5 | % | | | 1,983 | | | | 5.0 | % |
Office | | | | | | | | | | | | | | | |
Strategic Operations | | | 5 | | | | 10,516 | | | | 2.6 | % | | | 615 | | | | 1.5 | % |
Corporate Headquarters | | | 7 | | | | 8,610 | | | | 2.2 | % | | | 409 | | | | 1.0 | % |
Call Center | | | 2 | | | | 4,126 | | | | 1.0 | % | | | 287 | | | | 0.8 | % |
Office Total | | | 14 | | | | 23,252 | | | | 5.8 | % | | | 1,311 | | | | 3.3 | % |
Total | | | 773 | | | $ | 398,159 | | | | 100.0 | % | | | 39,708 | | | | 100.0 | % |
BROADSTONE NET LEASE, INC. | www.broadstone.com | © 2024 Broadstone Net Lease, LLC. All rights reserved. 26
Key Statistics by Property Type
| | | | | | | | | | | | | | | | | | | | |
| | Q3 2024 | | | Q2 2024 | | | Q1 2024 | | | Q4 2023 | | | Q3 2023 | |
Industrial | | | | | | | | | | | | | | | |
Number of properties | | | 203 | | | | 202 | | | | 192 | | | | 192 | | | | 193 | |
Square feet (000s) | | | 31,450 | | | | 30,153 | | | | 29,500 | | | | 29,442 | | | | 29,387 | |
Weighted average lease term (years) | | | 11.3 | | | | 11.2 | | | | 11.5 | | | | 11.7 | | | | 11.5 | |
Weighted average annual rent escalation | | | 2.1 | % | | | 2.0 | % | | | 2.0 | % | | | 2.0 | % | | | 2.0 | % |
Percentage of total ABR | | | 57.8 | % | | | 54.6 | % | | | 54.2 | % | | | 51.5 | % | | | 51.2 | % |
| | | | | | | | | | | | | | | |
Restaurant | | | | | | | | | | | | | | | |
Number of properties | | | 253 | | | | 253 | | | | 248 | | | | 248 | | | | 248 | |
Square feet (000s) | | | 1,188 | | | | 1,188 | | | | 1,164 | | | | 1,164 | | | | 1,172 | |
Weighted average lease term (years) | | | 13.0 | | | | 13.3 | | | | 13.6 | | | | 13.9 | | | | 13.9 | |
Weighted average annual rent escalation | | | 1.8 | % | | | 1.8 | % | | | 1.8 | % | | | 1.8 | % | | | 1.8 | % |
Percentage of total ABR | | | 13.4 | % | | | 14.0 | % | | | 14.2 | % | | | 13.6 | % | | | 13.7 | % |
| | | | | | | | | | | | | | | |
Retail | | | | | | | | | | | | | | | |
Number of properties | | | 218 | | | | 217 | | | | 211 | | | | 211 | | | | 214 | |
Square feet (000s) | | | 3,776 | | | | 3,700 | | | | 3,439 | | | | 3,439 | | | | 3,455 | |
Weighted average lease term (years) | | | 9.0 | | | | 9.3 | | | | 9.1 | | | | 9.4 | | | | 9.7 | |
Weighted average annual rent escalation | | | 1.4 | % | | | 1.3 | % | | | 1.3 | % | | | 1.6 | % | | | 1.6 | % |
Percentage of total ABR | | | 12.5 | % | | | 12.6 | % | | | 11.9 | % | | | 11.4 | % | | | 11.6 | % |
| | | | | | | | | | | | | | | |
Healthcare | | | | | | | | | | | | | | | |
Number of properties | | | 85 | | | | 90 | | | | 92 | | | | 129 | | | | 129 | |
Square feet (000s) | | | 1,983 | | | | 2,081 | | | | 2,146 | | | | 2,852 | | | | 2,851 | |
Weighted average lease term (years) | | | 6.4 | | | | 7.3 | | | | 7.2 | | | | 6.6 | | | | 6.8 | |
Weighted average annual rent escalation | | | 2.3 | % | | | 2.4 | % | | | 2.4 | % | | | 2.4 | % | | | 2.4 | % |
Percentage of total ABR | | | 10.5 | % | | | 12.7 | % | | | 13.4 | % | | | 17.6 | % | | | 17.6 | % |
| | | | | | | | | | | | | | | |
Office | | | | | | | | | | | | | | | |
Number of properties | | | 14 | | | | 15 | | | | 16 | | | | 16 | | | | 16 | |
Square feet (000s) | | | 1,311 | | | | 1,328 | | | | 1,374 | | | | 1,374 | | | | 1,375 | |
Weighted average lease term (years) | | | 4.8 | | | | 5.1 | | | | 5.3 | | | | 5.3 | | | | 5.6 | |
Weighted average annual rent escalation | | | 2.5 | % | | | 2.5 | % | | | 2.5 | % | | | 2.5 | % | | | 2.5 | % |
Percentage of total ABR | | | 5.8 | % | | | 6.1 | % | | | 6.3 | % | | | 5.9 | % | | | 5.9 | % |
BROADSTONE NET LEASE, INC. | www.broadstone.com | © 2024 Broadstone Net Lease, LLC. All rights reserved. 27
Diversification: Tenant Industry
| | | | | | | | | | | | | | | | | | | | |
Industry | | # Properties | | | ABR
(’000s) | | | ABR as a %
of Total
Portfolio | | | Square Feet (’000s) | | | SF as a %
of Total
Portfolio | |
Restaurants | | | 256 | | | $ | 54,381 | | | | 13.7 | % | | | 1,231 | | | | 3.1 | % |
Packaged Foods & Meats | | | 35 | | | | 47,606 | | | | 12.0 | % | | | 5,541 | | | | 14.0 | % |
Healthcare Facilities | | | 58 | | | | 27,600 | | | | 6.9 | % | | | 980 | | | | 2.5 | % |
Food Distributors | | | 7 | | | | 26,263 | | | | 6.6 | % | | | 2,534 | | | | 6.4 | % |
Auto Parts & Equipment | | | 46 | | | | 20,673 | | | | 5.2 | % | | | 3,168 | | | | 8.0 | % |
Specialty Stores | | | 36 | | | | 18,739 | | | | 4.7 | % | | | 1,637 | | | | 4.1 | % |
Distributors | | | 27 | | | | 17,711 | | | | 4.4 | % | | | 2,757 | | | | 6.9 | % |
Home Furnishing Retail | | | 18 | | | | 13,018 | | | | 3.3 | % | | | 1,858 | | | | 4.7 | % |
Specialized Consumer Services | | | 46 | | | | 12,157 | | | | 3.1 | % | | | 716 | | | | 1.8 | % |
Metal & Glass Containers | | | 8 | | | | 10,696 | | | | 2.7 | % | | | 2,206 | | | | 5.6 | % |
Industrial Machinery | | | 20 | | | | 9,859 | | | | 2.5 | % | | | 1,949 | | | | 4.9 | % |
General Merchandise Stores | | | 96 | | | | 9,810 | | | | 2.5 | % | | | 880 | | | | 2.2 | % |
Healthcare Services | | | 18 | | | | 9,778 | | | | 2.5 | % | | | 515 | | | | 1.3 | % |
Forest Products | | | 8 | | | | 9,612 | | | | 2.4 | % | | | 2,284 | | | | 5.8 | % |
Electronic Components | | | 2 | | | | 7,112 | | | | 1.8 | % | | | 466 | | | | 1.2 | % |
Other (40 industries) | | | 89 | | | | 103,144 | | | | 25.7 | % | | | 10,583 | | | | 26.5 | % |
Untenanted properties | | | 3 | | | | — | | | | — | | | | 403 | | | | 1.0 | % |
Total | | | 773 | | | $ | 398,159 | | | | 100.0 | % | | | 39,708 | | | | 100.0 | % |
BROADSTONE NET LEASE, INC. | www.broadstone.com | © 2024 Broadstone Net Lease, LLC. All rights reserved. 28
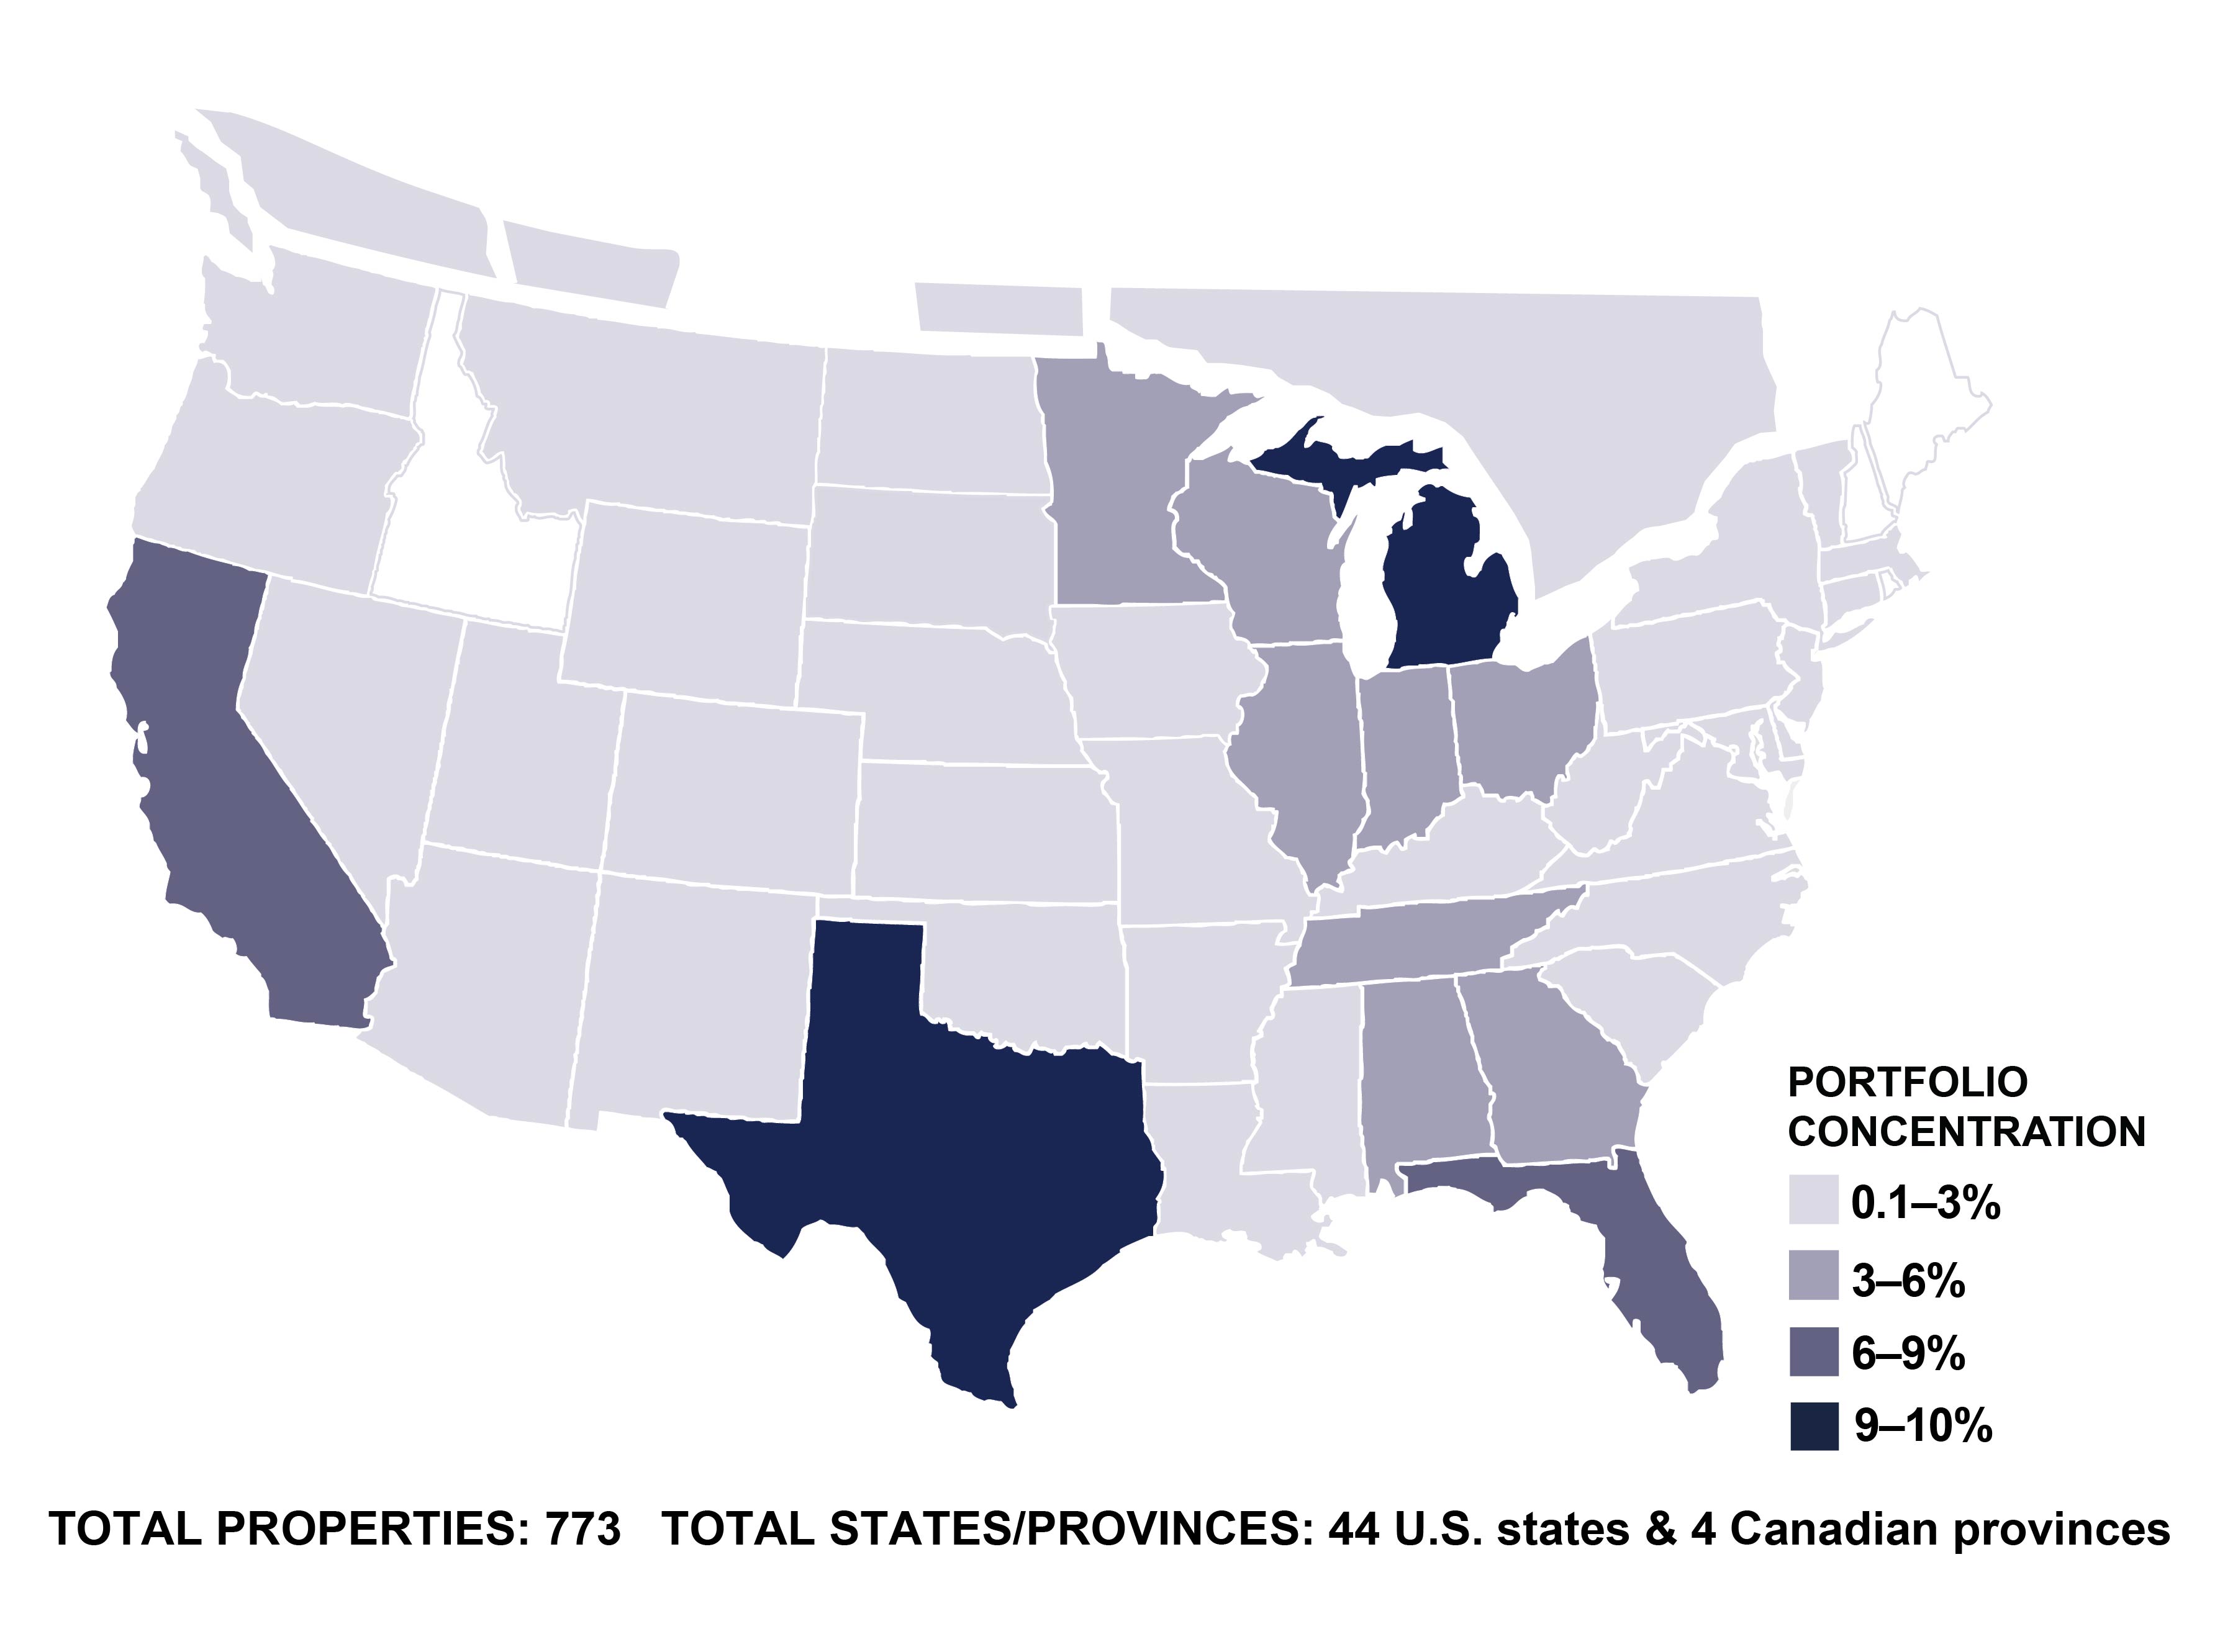
Diversification: Geography
(rent percentages based on ABR)
| | | | | | | | | | | | | | | | | | | | | | | | | | | | | | | | | | | | | | | | | | | |
State /
Province | | #
Properties | | | ABR
(’000s) | | | ABR as
a % of
Total
Portfolio | | | Square
Feet
(’000s) | | | SF as a
% of
Total
Portfolio | | | | State /
Province | | #
Properties | | | ABR
(’000s) | | | ABR as
a % of
Total
Portfolio | | | Square
Feet
(’000s) | | | SF as a
% of
Total
Portfolio | |
TX | | | 67 | | | $ | 37,631 | | | | 9.5 | % | | | 3,615 | | | | 9.1 | % | | | MS | | | 12 | | | $ | 4,097 | | | | 1.0 | % | | | 607 | | | | 1.5 | % |
MI | | | 52 | | | | 36,023 | | | | 9.0 | % | | | 4,018 | | | | 10.2 | % | | | LA | | | 5 | | | | 3,942 | | | | 1.0 | % | | | 211 | | | | 0.5 | % |
FL | | | 38 | | | | 27,007 | | | | 6.8 | % | | | 1,805 | | | | 4.5 | % | | | SC | | | 14 | | | | 3,495 | | | | 0.9 | % | | | 323 | | | | 0.8 | % |
CA | | | 17 | | | | 24,092 | | | | 6.1 | % | | | 2,282 | | | | 5.7 | % | | | NE | | | 6 | | | | 3,363 | | | | 0.8 | % | | | 509 | | | | 1.3 | % |
IL | | | 29 | | | | 22,624 | | | | 5.7 | % | | | 2,364 | | | | 6.0 | % | | | WA | | | 14 | | | | 3,254 | | | | 0.8 | % | | | 148 | | | | 0.4 | % |
WI | | | 30 | | | | 19,445 | | | | 4.9 | % | | | 1,945 | | | | 4.9 | % | | | IA | | | 4 | | | | 2,869 | | | | 0.7 | % | | | 622 | | | | 1.6 | % |
OH | | | 47 | | | | 16,530 | | | | 4.2 | % | | | 1,582 | | | | 4.0 | % | | | NM | | | 9 | | | | 2,749 | | | | 0.7 | % | | | 107 | | | | 0.3 | % |
MN | | | 21 | | | | 15,855 | | | | 4.0 | % | | | 2,500 | | | | 6.3 | % | | | CO | | | 4 | | | | 2,568 | | | | 0.6 | % | | | 126 | | | | 0.3 | % |
TN | | | 48 | | | | 15,106 | | | | 3.8 | % | | | 1,084 | | | | 2.7 | % | | | UT | | | 3 | | | | 2,510 | | | | 0.6 | % | | | 280 | | | | 0.7 | % |
IN | | | 28 | | | | 14,925 | | | | 3.7 | % | | | 1,832 | | | | 4.6 | % | | | MD | | | 3 | | | | 2,102 | | | | 0.5 | % | | | 205 | | | | 0.5 | % |
AL | | | 52 | | | | 12,191 | | | | 3.1 | % | | | 863 | | | | 2.2 | % | | | CT | | | 2 | | | | 1,892 | | | | 0.5 | % | | | 55 | | | | 0.1 | % |
GA | | | 33 | | | | 11,980 | | | | 3.0 | % | | | 1,576 | | | | 4.0 | % | | | MT | | | 7 | | | | 1,602 | | | | 0.4 | % | | | 43 | | | | 0.1 | % |
NC | | | 28 | | | | 10,459 | | | | 2.6 | % | | | 1,038 | | | | 2.6 | % | | | DE | | | 4 | | | | 1,162 | | | | 0.3 | % | | | 133 | | | | 0.3 | % |
PA | | | 22 | | | | 9,942 | | | | 2.5 | % | | | 1,836 | | | | 4.6 | % | | | ND | | | 2 | | | | 1,024 | | | | 0.3 | % | | | 24 | | | | 0.1 | % |
KY | | | 23 | | | | 9,059 | | | | 2.3 | % | | | 927 | | | | 2.3 | % | | | VT | | | 2 | | | | 432 | | | | 0.1 | % | | | 24 | | | | 0.1 | % |
MO | | | 19 | | | | 8,941 | | | | 2.2 | % | | | 1,260 | | | | 3.2 | % | | | WY | | | 1 | | | | 307 | | | | 0.1 | % | | | 21 | | | | 0.1 | % |
OK | | | 25 | | | | 8,900 | | | | 2.2 | % | | | 1,006 | | | | 2.5 | % | | | NV | | | 1 | | | | 273 | | | | 0.1 | % | | | 6 | | | | 0.0 | % |
AZ | | | 8 | | | | 8,792 | | | | 2.2 | % | | | 895 | | | | 2.3 | % | | | OR | | | 1 | | | | 136 | | | | 0.0 | % | | | 9 | | | | 0.0 | % |
AR | | | 12 | | | | 8,624 | | | | 2.2 | % | | | 360 | | | | 0.9 | % | | | SD | | | 1 | | | | 81 | | | | 0.0 | % | | | 9 | | | | 0.0 | % |
NY | | | 24 | | | | 6,712 | | | | 1.7 | % | | | 514 | | | | 1.3 | % | | | Total U.S. | | | 766 | | | $ | 389,942 | | | | 98.0 | % | | | 39,279 | | | | 98.8 | % |
MA | | | 3 | | | | 6,686 | | | | 1.7 | % | | | 444 | | | | 1.1 | % | | | BC | | | 2 | | | $ | 4,827 | | | | 1.2 | % | | | 253 | | | | 0.7 | % |
KS | | | 10 | | | | 5,523 | | | | 1.4 | % | | | 643 | | | | 1.6 | % | | | ON | | | 3 | | | | 2,069 | | | | 0.5 | % | | | 101 | | | | 0.3 | % |
WV | | | 17 | | | | 5,089 | | | | 1.3 | % | | | 884 | | | | 2.2 | % | | | AB | | | 1 | | | | 973 | | | | 0.2 | % | | | 51 | | | | 0.1 | % |
VA | | | 15 | | | | 5,035 | | | | 1.3 | % | | | 178 | | | | 0.4 | % | | | MB | | | 1 | | | | 348 | | | | 0.1 | % | | | 24 | | | | 0.1 | % |
NJ | | | 3 | | | | 4,913 | | | | 1.2 | % | | | 366 | | | | 0.9 | % | | | Total Canada | | | 7 | | | $ | 8,217 | | | | 2.0 | % | | | 429 | | | | 1.2 | % |
| | | | | | | | | | | | | | | | | | Grand Total | | | 773 | | | $ | 398,159 | | | | 100.0 | % | | | 39,708 | | | | 100.0 | % |
BROADSTONE NET LEASE, INC. | www.broadstone.com | © 2024 Broadstone Net Lease, LLC. All rights reserved. 29
Lease Expirations
(rent percentages based on ABR)
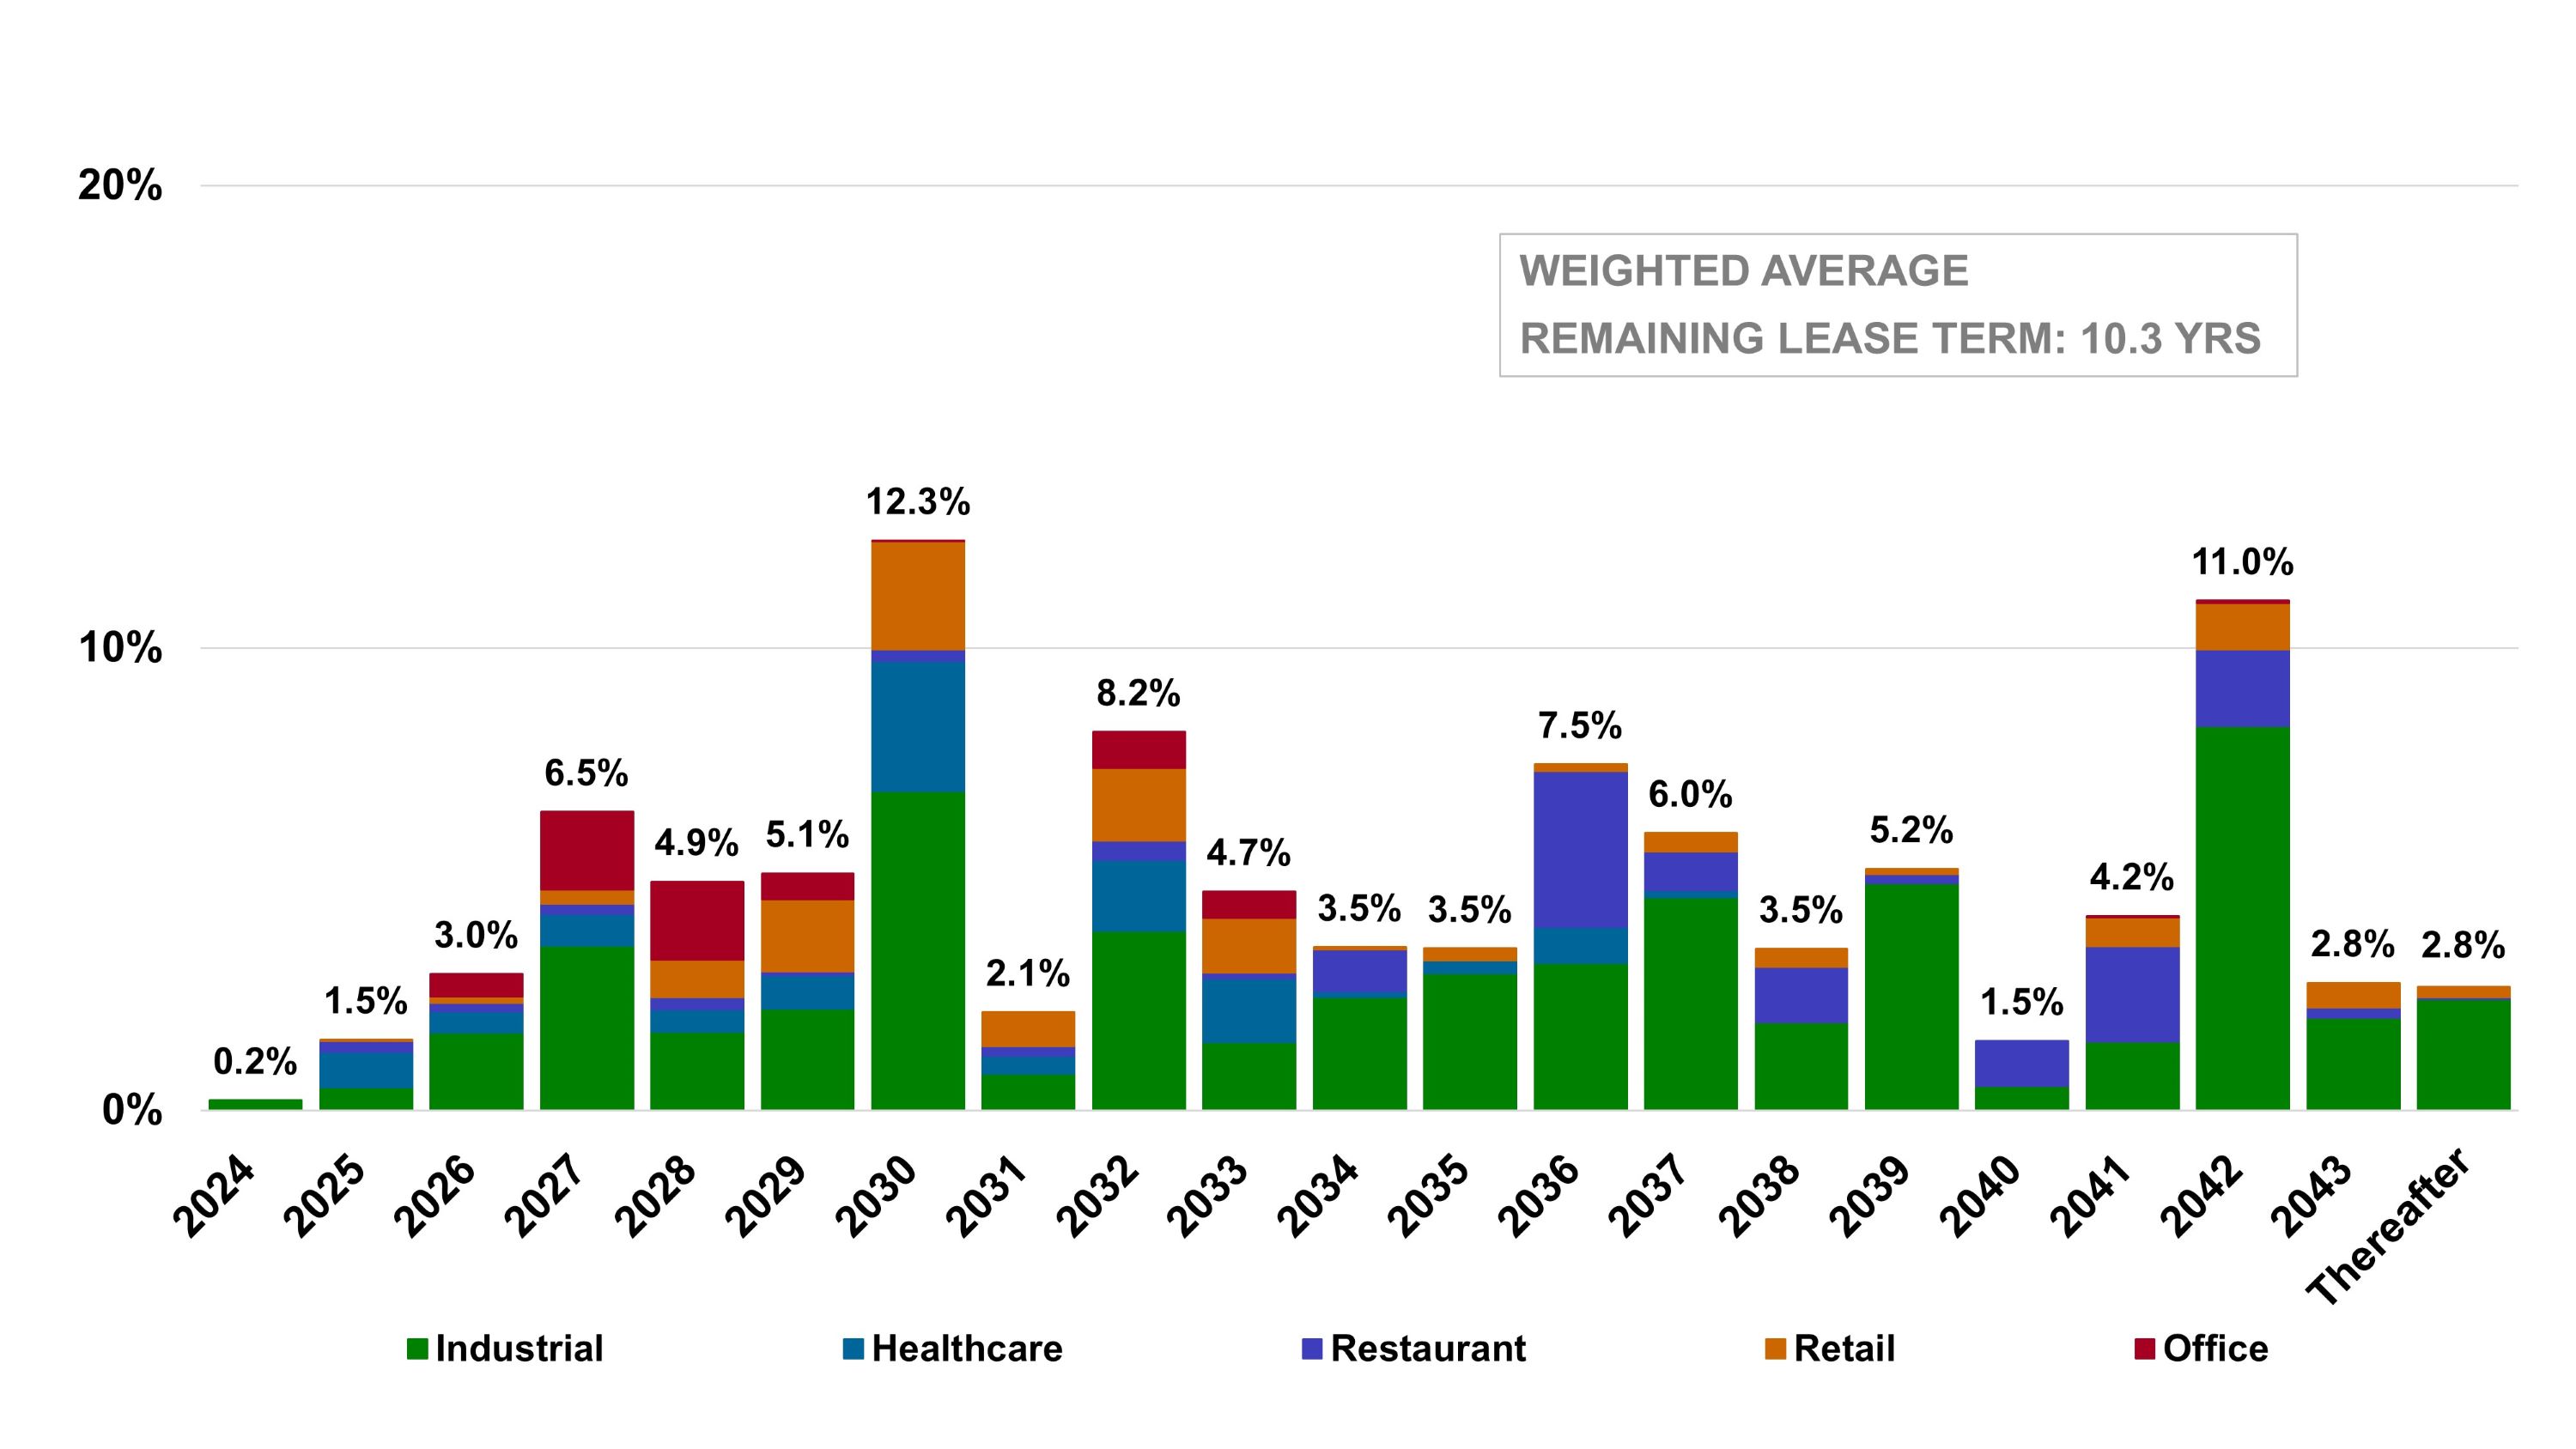
| | | | | | | | | | | | | | | | | | | | |
Expiration Year | | # of Properties | | | ABR
('000s) | | | ABR as a % of Total Portfolio | | | Square Feet ('000s) | | | SF as a % of Total Portfolio | |
2024 | | | 1 | | | $ | 867 | | | | 0.2 | % | | | 166 | | | | 0.4 | % |
2025 | | | 17 | | | | 6,084 | | | | 1.5 | % | | | 358 | | | | 0.9 | % |
2026 | | | 23 | | | | 11,751 | | | | 3.0 | % | | | 915 | | | | 2.3 | % |
2027 | | | 28 | | | | 25,709 | | | | 6.5 | % | | | 2,257 | | | | 5.7 | % |
2028 | | | 29 | | | | 19,704 | | | | 4.9 | % | | | 1,793 | | | | 4.5 | % |
2029 | | | 64 | | | | 20,420 | | | | 5.1 | % | | | 2,679 | | | | 6.7 | % |
2030 | | | 92 | | | | 49,073 | | | | 12.3 | % | | | 4,802 | | | | 12.1 | % |
2031 | | | 32 | | | | 8,453 | | | | 2.1 | % | | | 843 | | | | 2.1 | % |
2032 | | | 62 | | | | 32,587 | | | | 8.2 | % | | | 3,469 | | | | 8.7 | % |
2033 | | | 49 | | | | 18,841 | | | | 4.7 | % | | | 1,409 | | | | 3.5 | % |
2034 | | | 37 | | | | 14,057 | | | | 3.5 | % | | | 1,237 | | | | 3.1 | % |
2035 | | | 19 | | | | 13,938 | | | | 3.5 | % | | | 2,021 | | | | 5.1 | % |
2036 | | | 90 | | | | 29,801 | | | | 7.5 | % | | | 2,894 | | | | 7.3 | % |
2037 | | | 26 | | | | 23,883 | | | | 6.0 | % | | | 1,870 | | | | 4.7 | % |
2038 | | | 39 | | | | 13,919 | | | | 3.5 | % | | | 1,226 | | | | 3.1 | % |
2039 | | | 11 | | | | 20,806 | | | | 5.2 | % | | | 1,758 | | | | 4.4 | % |
2040 | | | 31 | | | | 5,987 | | | | 1.5 | % | | | 312 | | | | 0.8 | % |
2041 | | | 39 | | | | 16,739 | | | | 4.2 | % | | | 1,367 | | | | 3.4 | % |
2042 | | | 58 | | | | 43,893 | | | | 11.0 | % | | | 4,803 | | | | 12.1 | % |
2043 | | | 12 | | | | 10,987 | | | | 2.8 | % | | | 796 | | | | 2.0 | % |
Thereafter | | | 11 | | | | 10,660 | | | | 2.8 | % | | | 2,330 | | | | 6.1 | % |
Total leased properties | | | 770 | | | | 398,159 | | | | 100.0 | % | | | 39,305 | | | | 99.0 | % |
Untenanted properties | | | 3 | | | | — | | | | — | | | | 403 | | | | 1.0 | % |
Total properties | | | 773 | | | $ | 398,159 | | | | 100.0 | % | | | 39,708 | | | | 100.0 | % |
BROADSTONE NET LEASE, INC. | www.broadstone.com | © 2024 Broadstone Net Lease, LLC. All rights reserved. 30
Occupancy
Occupancy by Rentable Square Footage
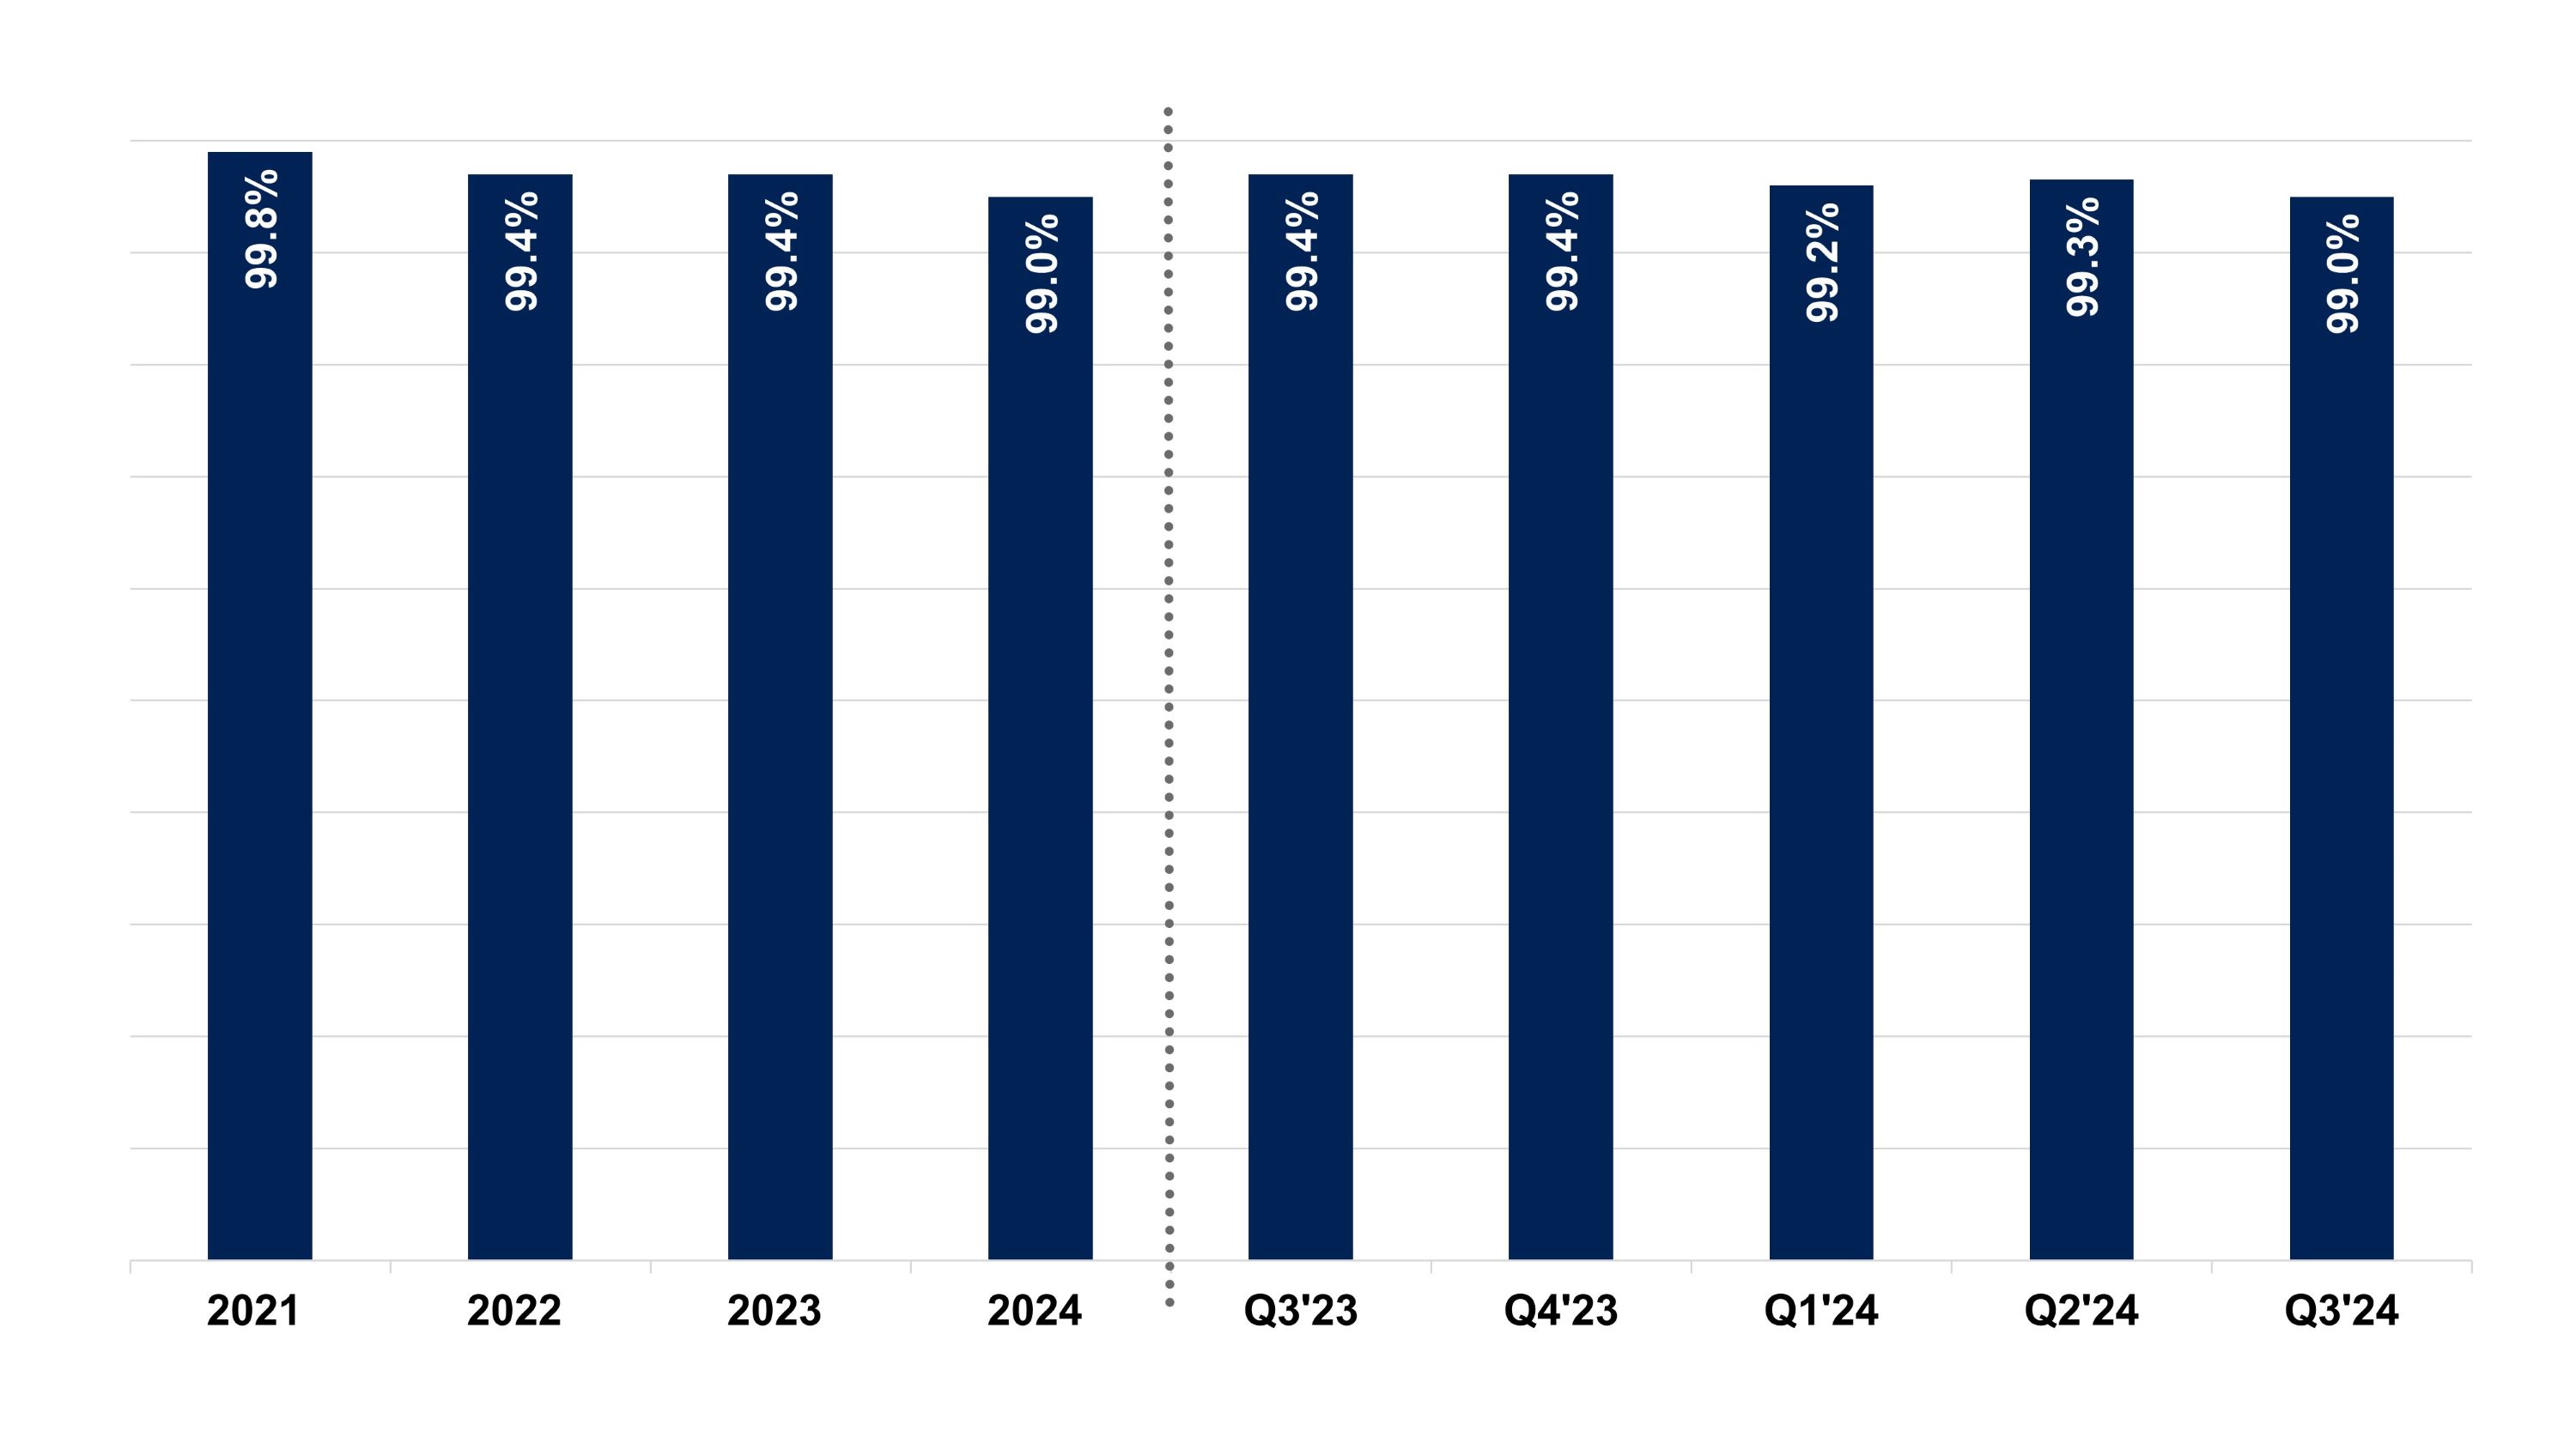
Change in Occupancy
| | | | | |
| | | Number of properties | |
Vacant properties at January 1, 2024 | | | | 2 | |
Lease expirations1 | | | | 3 | |
Leasing activities | | | | (2 | ) |
Vacant dispositions | | | | — | |
Vacant properties at March 31, 2024 | | | | 3 | |
Lease expirations1 | | | | 1 | |
Leasing activities | | | | — | |
Vacant dispositions | | | | (1 | ) |
Vacant properties at June 30, 2024 | | | | 3 | |
Lease expirations1 | | | | 4 | |
Leasing activities | | | | (3 | ) |
Vacant dispositions | | | | (1 | ) |
Vacant properties at September 30, 2024 | | | | 3 | |
1 Includes scheduled and unscheduled expirations (including leases rejected in bankruptcy), as well as future expirations resolved and effective in the periods indicated above.
BROADSTONE NET LEASE, INC. | www.broadstone.com | © 2024 Broadstone Net Lease, LLC. All rights reserved. 31
Definitions and Explanations
Adjusted NOI, Annualized Adjusted NOI, Adjusted Cash NOI and Annualized Adjusted Cash NOI: Our reported results and net earnings per diluted share are presented in accordance with accounting principles generally accepted in the United States of America (GAAP). Adjusted NOI and Adjusted Cash NOI are non-GAAP financial measures that we believe are useful to assess property-level performance. We compute Adjusted NOI by adjusting Adjusted EBITDAre (defined below) to exclude general and administrative expenses incurred at the corporate level. Given the net lease nature of our portfolio, we do not incur general and administrative expenses at the property level. To compute Adjusted Cash NOI, we adjust Adjusted NOI to exclude non-cash items included in total revenues and property expenses, such as straight-line rental revenue and other amortization and non-cash items, based on an estimate calculated as if all investment and disposition activity that took place during the quarter had occurred on the first day of the quarter. We then annualize quarterly Adjusted NOI and Adjusted Cash NOI by multiplying each amount by four to compute Annualized Adjusted NOI and Annualized Adjusted Cash NOI, respectively, which are also non-GAAP financial measures. We believe Adjusted NOI and Adjusted Cash NOI provide useful and relevant information because they reflect only those income and expense items that are incurred at the property level and present such items on an unlevered basis. We believe that the exclusion of certain non-cash revenues and expenses from Adjusted Cash NOI is a useful supplemental measure for investors to consider because it will help them to better assess our operating performance without the distortions created by non-cash revenues or expenses. You should not unduly rely on Annualized Adjusted NOI and Annualized Adjusted Cash NOI as they are based on assumptions and estimates that may prove to be inaccurate. Our actual reported Adjusted NOI and Adjusted Cash NOI for future periods may be significantly different from our Annualized Adjusted NOI and Annualized Adjusted Cash NOI. Additionally, our computation of Adjusted NOI and Adjusted Cash NOI may differ from the methodology for calculating these metrics used by companies in our industry, and, therefore, may not be comparable to similarly titled measures reported by other companies.
Adjusted Secured Overnight Financing Rate (SOFR): We define Adjusted SOFR as the current one month term SOFR plus an adjustment of 0.10% per the terms of our credit facilities.
Annualized Base Rent (ABR): We define ABR as the annualized contractual cash rent due for the last month of the reporting period, excluding the impacts of short-term rent deferrals, abatements, or free rent, and adjusted to remove rent from properties sold during the month and to include a full month of contractual cash rent for investments made during the month.
Cash Capitalization Rate: Cash Capitalization Rate represents either (1) for acquisitions and new developments, the estimated first year cash yield to be generated on a real estate investment, which was estimated at the time of investment based on the contractually specified cash base rent for the first full year after the date of the investment, divided by the purchase price for the property excluding capitalized acquisitions costs, or (2) for dispositions, the estimated cash yield to be generated based on a property’s ABR in effect immediately prior to the disposition, divided by the disposition price, or (3) for transitional capital, the contractual cash yield to be generated on total invested capital.
EBITDA, EBITDAre, Adjusted EBITDAre, and Annualized Adjusted EBITDAre: EBITDA, EBITDAre, Adjusted EBITDAre, Annualized Adjusted EBITDAre, and Pro Forma Annualized Adjusted EBITDAre are non-GAAP financial measures. We compute EBITDA as earnings before interest, income taxes and depreciation and amortization. EBITDA is a measure commonly used in our industry. We believe that this ratio provides investors and analysts with a measure of our performance that includes our operating results unaffected by the differences in capital structures, capital investment cycles and useful life of related assets compared to other companies in our industry. We compute EBITDAre in accordance with the definition adopted by Nareit. Nareit defines EBITDAre as EBITDA excluding gains (loss) from the sales of depreciable property and provisions for impairment on investment in real estate. We believe EBITDA and EBITDAre are useful to investors and analysts because they provide important supplemental information about our operating performance exclusive of certain non-cash and other costs. Adjusted EBITDAre represents EBITDAre, adjusted to reflect revenue producing investments and dispositions for the quarter as if such investments and dispositions had occurred at the beginning of the quarter, and to exclude certain GAAP income and expense amounts that are either non-cash, such as cost of debt extinguishments, realized or unrealized gains and losses on foreign currency transactions, or gains on insurance recoveries, or that we believe are one time, or unusual in nature because they relate to unique circumstances or transactions that had not previously occurred and which we do not anticipate occurring in the future, and to eliminate the impact of lease termination fees, and other items that are not a result of normal operations. While investments in developments have an immediate impact to Net Debt, we do not make an adjustment to EBITDAre until the quarter in which the lease commences. We define our Pro Forma Adjusted EBITDAre as Adjusted EBITDAre adjusted to show the impact of estimated contractual revenues based on in-process development spend to-date. Our Pro Forma Net Debt is defined as Net Debt adjusted for estimated net proceeds from forward sale agreements that have not settled as if they have been physically settled for cash as of the period presented. We then annualize quarterly Adjusted EBITDAre and Pro Forma Adjusted EBITDAre by multiplying them by four (“Annualized Adjusted EBITDAre” and “Annualized Pro Forma Adjusted EBITDAre”). You should not unduly rely on this measure as it is based on assumptions and estimates that may prove to be inaccurate. Our actual reported EBITDAre for future periods may be significantly different from our Annualized Adjusted EBITDAre. Adjusted EBITDAre and Annualized Adjusted EBITDAre are not measurements of performance under GAAP, and our Adjusted EBITDAre and Annualized Adjusted EBITDAre may not be comparable to similarly titled measures of other companies. You should not consider our Adjusted EBITDAre and Annualized Adjusted EBITDAre as alternatives to net income or cash flows from operating activities determined in accordance with GAAP.
Funds From Operations (FFO), Core Funds From Operations (Core FFO), and Adjusted Funds From Operations (AFFO): FFO, Core FFO, and AFFO are non-GAAP measures. We believe the use of FFO, Core FFO, and AFFO are useful to investors because they are widely accepted industry measures used by analysts and investors to compare the operating performance of REITs. FFO, Core FFO, and AFFO should not be considered alternatives to net income as a performance measure or to cash flows from operations, as reported on our statement of cash flows, or as a liquidity measure and should be considered in addition to, and not in lieu of, GAAP financial measures. We compute Core FFO by adjusting FFO to exclude certain GAAP income and expense amounts that we believe are infrequently recurring, unusual in nature, or not related to its core real estate operations, including write-offs or recoveries of accrued rental income, lease termination fees and other non-core income from real estate transactions, the gain on insurance recoveries, cost of debt extinguishments, unrealized and realized gains or losses on foreign currency transactions, severance and employee transition costs, and other extraordinary items. We compute AFFO by adjusting Core FFO for certain revenues and expenses that are non-cash or unique in nature, including straight-line rents, amortization of lease intangibles, amortization of debt issuance costs, amortization of net mortgage premiums, non-capitalized transaction costs such as acquisition costs related to deals that failed to transact, (gain) loss on interest rate swaps and other non-cash interest expense, deferred taxes, stock-based compensation, and other specified non-cash items.
BROADSTONE NET LEASE, INC. | www.broadstone.com | © 2024 Broadstone Net Lease, LLC. All rights reserved. 32
Definitions and Explanations (continued)
Gross Debt: We define Gross Debt as total debt plus debt issuance costs and original issuance discount.
Net Debt: Net Debt is a non-GAAP financial measure. We define Net Debt as our Gross Debt less cash and cash equivalents and restricted cash.
Occupancy: Occupancy or a specified percentage of our portfolio that is “occupied” or “leased” means as of a specified date the quotient of (1) the total rentable square footage of our properties minus the square footage of our properties that are vacant and from which we are not receiving any rental payment, and (2) the total square footage of our properties.
Rent Coverage Ratio: Rent Coverage Ratio means the ratio of tenant-reported or, when available, management’s estimate, based on tenant-reported financial information, of annual earnings before interest, taxes, depreciation, amortization, and cash rent attributable to the leased property (or properties, in the case of a master lease) to the annualized base rental obligation as of a specified date.
Straight-line Yield: Straight-line yield represents the estimated first year yield to be generated on a real estate investment, which was computed at the time of investment based on the straight-line annual rental income computed in accordance with GAAP, divided by the purchase price, excluding capitalized costs for the property. For developments, the denominator is the total project investment.
Definitions Related to Development Properties:
•Lease Commencement Date: The month in which the development was substantially completed and was made available for occupancy.
BROADSTONE NET LEASE, INC. | www.broadstone.com | © 2024 Broadstone Net Lease, LLC. All rights reserved. 33