Exhibit 99.2

Q3 2019 QUARTERLY SUPPLEMENTAL INFORMATION Broadstone Net Lease, Inc. is a publicly reporting, privately offered Real Estate Investment Trust (REIT) that acquires and holds freestanding, single-tenant, net-leased, commercial properties. www.broadstone.com

| Q3 2019 SUPPLEMENTAL INFORMATION |
| |
Table of Contents
| | |
Section | Page | 


|
Company Overview | 4 |
Quarterly Financial Summary | 5 |
Income Statement Summary | 6 |
Funds From Operations (FFO) | 7 |
Adjusted Funds From Operations (AFFO) | 7 |
Lease Revenues | 8 |
Balance Sheet | 9 |
Capital Structure | 10 |
Equity Summary | 10 |
Debt Outstanding | 11 |
Debt Maturities and Interest Rate Exposure | 12 |
Credit Facility and Notes Covenants | 13 |
Acquisitions | 14 |
Dispositions | 15 |
Portfolio at a Glance: Key Metrics | 16 |
Diversification: Tenants and Brands | 17 |
Diversification: Property Type | 18 |
Diversification: Tenant Industry | 18 |
Diversification: Geography | 19 |
Lease Expirations | 20 |
Occupancy | 21 |
Dividends | 21 |
Disclosures | 22 |
| |
| |
| |
| |
| |
| |
BROADSTONE NET LEASE, INC. | www.broadstone.com | © 2019 Broadstone Net Lease, Inc. All rights reserved. | 2 |
| Q3 2019 SUPPLEMENTAL INFORMATION |
| |
About the Data
This data and other information described herein are as of and for the three months ended September 30, 2019 unless otherwise indicated. Future performance may not be consistent with past performance and is subject to change and inherent risks and uncertainties. This information should be read in conjunction with the financial statements and the management's discussion and analysis of financial condition and results of operations sections contained in Broadstone Net Lease, Inc.'s Annual Report on Form 10-K for the year ended December 31, 2018, and Quarterly Reports on Form 10-Q for the periods ended September 30, 2019, June 30, 2019, March 31, 2019, and September 30, 2018.
Forward Looking Statements
This information contains “forward-looking” statements within the meaning of Section 27A of the Securities Act of 1933, as amended, and Section 21E of the Securities Exchange Act of 1934, as amended, regarding, among other things, our plans, strategies, and prospects, both business and financial. Such forward-looking statements can generally be identified by our use of forward-looking terminology such as "may," "will," “should,” "expect," "intend," "anticipate," "estimate," “would be,“ "believe," "continue," or other similar words. Forward-looking statements involve known and unknown risks, which may cause our actual future results to differ materially from expected results, including, without limitation, risks related to general economic conditions, local real estate conditions, tenant financial health, property acquisitions and the timing of these acquisitions, the availability of capital to finance planned growth, our success in our deleveraging efforts, the risk that the Internalization (as defined in our Quarterly Report on Form 10-Q for the period ended September 30, 2019) will not be consummated within the anticipated time period or at all, and our ability to effectively and efficiently manage the Internalization, if consummated. These and other risks, assumptions and uncertainties are described in Item 1A “Risk Factors” of our Annual Report on Form 10-K for the fiscal year ended December 31, 2018, which we filed with the SEC on March 14, 2019, and our Quarterly Report on Form 10-Q for the period ended September 30, 2019, which we filed on November 12, 2019. These documents, which you are encouraged to read, are available on the SEC’s website at www.sec.gov. Should one or more of these risks or uncertainties materialize, or should underlying assumptions prove incorrect, actual results may vary materially from those indicated or anticipated by such forward-looking statements. Accordingly, you are cautioned not to place undue reliance on these forward-looking statements, which speak only as of the date they are made. We expressly disclaim any current intention to update publicly any forward-looking statement after the distribution of this supplemental information, whether as a result of new information, future events, changes in assumptions or otherwise.
BROADSTONE NET LEASE, INC. | www.broadstone.com | © 2019 Broadstone Net Lease, Inc. All rights reserved. | 3 |
| Q3 2019 SUPPLEMENTAL INFORMATION |
| |
Company Overview
Broadstone Net Lease, Inc. (the “Company,” “BNL,” “us,” “our” and “we”) is currently an externally managed REIT, formed as a Maryland corporation in 2007 to acquire and hold single-tenant, net-leased commercial real estate properties that are leased to the properties’ operators under long-term leases. We focus on real estate that is operated by a single tenant which is an integral part of the tenant’s business. Our diversified portfolio of real estate includes retail properties, healthcare facilities, industrial manufacturing facilities, warehouse and distribution centers, and corporate offices, among others. We target properties with credit-worthy tenants that look to engage in a long-term lease relationship. Through long-term leases, our tenants are able to retain operational control of their mission critical locations, while utilizing their capital to fund their fundamental business operations.
Senior Management Amy L. Tait Founder and Chairman of the Board Christopher J. Czarnecki Chief Executive Officer, President, and Director Sean T. Cutt Chief Investment Officer Ryan M. Albano Executive Vice President and Chief Financial Officer David E. Kasprzak Executive Vice President and Chief Business Development Officer John D. Moragne Executive Vice President, Chief Operating Officer, and Secretary Timothy D. Dieffenbacher Senior Vice President, Chief Accounting Officer, and Treasurer | | Board of Directors Amy L. Tait Founder and Chairman of Broadstone Real Estate, LLC Christopher J. Czarnecki Chief Executive Officer and President of Broadstone Real Estate, LLC Laurie A. Hawkes Lead Independent Director David M. Jacobstein Independent Director Shekar Narasimhan Independent Director Geoffrey H. Rosenberger Independent Director James H. Watters Independent Director Agha S. Khan Director |
| |
Corporate Office & Contact Information 800 Clinton Square
Rochester, New York 14604
585-287-6500
info@broadstone.com
www.broadstone.com Transfer Agent Computershare Trust Company, N.A. 250 Royall Street Canton, Massachusetts 02021 800-736-3001 | |
BROADSTONE NET LEASE, INC. | www.broadstone.com | © 2019 Broadstone Net Lease, Inc. All rights reserved. | 4 |
| Q3 2019 SUPPLEMENTAL INFORMATION |
| |
Quarterly Financial Summary
(unaudited, dollars in thousands, except per share data)
| | Q3 2019 | | | Q2 2019 | | | Q1 2019 | | | Q4 2018 | | | Q3 2018 | |
Financial Summary | | | | | | | | | | | | | | | | | | | | |
Investment in rental property, net | | $ | 3,501,546 | | | $ | 2,804,110 | | | $ | 2,724,971 | | | $ | 2,683,746 | | | $ | 2,491,450 | |
Total assets | | | 3,991,788 | | | | 3,212,318 | | | | 3,131,943 | | | | 3,096,797 | | | | 2,905,345 | |
Mortgage and notes payable, net | | | 112,562 | | | | 121,074 | | | | 72,004 | | | | 78,952 | | | | 79,762 | |
Unsecured term notes, net and revolver | | | 1,974,811 | | | | 1,345,976 | | | | 1,361,995 | | | | 1,366,873 | | | | 1,225,473 | |
Total liabilities | | | 2,263,288 | | | | 1,606,680 | | | | 1,559,917 | | | | 1,567,877 | | | | 1,422,974 | |
Total Broadstone Net Lease, Inc. stockholders' equity | | | 1,623,362 | | | | 1,498,704 | | | | 1,462,386 | | | | 1,417,099 | | | | 1,369,667 | |
Total equity (book value) | | | 1,728,500 | | | | 1,605,638 | | | | 1,572,026 | | | | 1,528,920 | | | | 1,482,371 | |
Revenues | | | 76,401 | | | | 69,053 | | | | 68,430 | | | | 63,094 | | | | 61,764 | |
Total operating expenses | | | 44,110 | | | | 37,486 | | | | 38,268 | | | | 34,471 | | | | 34,772 | |
Interest expense | | | 18,465 | | | | 16,732 | | | | 15,828 | | | | 14,740 | | | | 14,484 | |
Net income | | | 25,038 | | | | 17,342 | | | | 15,022 | | | | 14,660 | | | | 23,064 | |
Net earnings per common share, basic and diluted | | $ | 0.95 | | | $ | 0.70 | | | $ | 0.62 | | | $ | 0.63 | | | $ | 1.03 | |
FFO | | | 43,280 | | | | 39,842 | | | | 38,949 | | | | 36,475 | | | | 44,969 | |
FFO per share, basic and diluted | | $ | 1.64 | | | $ | 1.60 | | | $ | 1.62 | | | $ | 1.58 | | | $ | 2.02 | |
AFFO | | | 38,819 | | | | 34,637 | | | | 34,169 | | | | 32,551 | | | | 31,315 | |
AFFO per share, basic and diluted | | $ | 1.47 | | | $ | 1.39 | | | $ | 1.42 | | | $ | 1.41 | | | $ | 1.40 | |
Net cash provided by operating activities | | | 46,214 | | | | 33,080 | | | | 31,639 | | | | 34,494 | | | | 34,842 | |
Net cash used in investing activities | | | (749,333 | ) | | | (56,257 | ) | | | (64,637 | ) | | | (235,869 | ) | | | (86,870 | ) |
Net cash provided by financing activities | | | 734,516 | | | | 22,735 | | | | 27,169 | | | | 192,336 | | | | 59,234 | |
Distributions declared | | | 34,883 | | | | 33,231 | | | | 31,983 | | | | 29,603 | | | | 28,416 | |
Distributions declared per diluted share | | $ | 1.32 | | | $ | 1.32 | | | $ | 1.31 | | | $ | 1.29 | | | $ | 1.29 | |
| | | | | | | | | | | | | | | | | | | | |
Portfolio Metrics | | | | | | | | | | | | | | | | | | | | |
Properties | | | 662 | | | | 646 | | | | 644 | | | | 621 | | | | 583 | |
Rentable square feet | | 27.5M | | | 20.3M | | | 19.7M | | | 19.0M | | | 18.0M | |
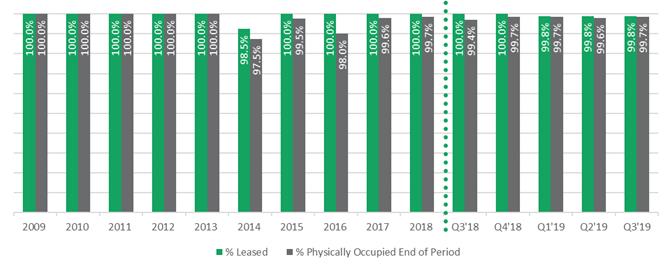
% Leased | | | 99.8 | % | | | 99.8 | % | | | 99.8 | % | | | 100.0 | % | | | 100.0 | % |
Physical occupancy | | | 99.7 | % | | | 99.6 | % | | | 99.7 | % | | | 99.7 | % | | | 99.4 | % |
Weighted average remaining lease term (years) | | | 11.7 | | | | 11.9 | | | | 12.0 | | | | 12.1 | | | | 12.8 | |
BROADSTONE NET LEASE, INC. | www.broadstone.com | © 2019 Broadstone Net Lease, Inc. All rights reserved. | 5 |
| Q3 2019 SUPPLEMENTAL INFORMATION |
| |
Income Statement Summary
(unaudited, in thousands, except per share data)
| | Three Months Ended | |
| | September 30, 2019 | | | June 30, 2019 | | | March 31, 2019 | | | December 31, 2018 | | | September 30, 2018 | |
Revenues | | | | | | | | | | | | | | | | | | | | |
Lease revenues | | $ | 76,401 | | | $ | 69,053 | | | $ | 68,430 | | | $ | 63,094 | | | $ | 61,764 | |
Operating expenses | | | | | | | | | | | | | | | | | | | | |
Depreciation and amortization | | | 28,392 | | | | 25,287 | | | | 24,310 | | | | 22,691 | | | | 21,869 | |
Asset management fees | | | 5,610 | | | | 5,318 | | | | 5,120 | | | | 5,054 | | | | 4,663 | |
Property management fees | | | 2,098 | | | | 1,935 | | | | 1,885 | | | | 1,737 | | | | 1,680 | |
Property and operating expense | | | 3,855 | | | | 3,252 | | | | 4,390 | | | | 3,231 | | | | 2,777 | |
General and administrative | | | 1,315 | | | | 1,389 | | | | 1,103 | | | | 1,712 | | | | 1,664 | |
State, franchise and foreign tax | | | 405 | | | | 305 | | | | 443 | | | | 46 | | | | 58 | |
Provision for impairment of investment in rental properties | | | 2,435 | | | | — | | | | 1,017 | | | | — | | | | 2,061 | |
Total operating expenses | | | 44,110 | | | | 37,486 | | | | 38,268 | | | | 34,471 | | | | 34,772 | |
Other income (expenses) | | | | | | | | | | | | | | | | | | | | |
Preferred distribution income | | | — | | | | — | | | | — | | | | — | | | | 65 | |
Interest income | | | 5 | | | | — | | | | 1 | | | | 1 | | | | 16 | |
Interest expense | | | (18,465 | ) | | | (16,732 | ) | | | (15,828 | ) | | | (14,740 | ) | | | (14,484 | ) |
Cost of debt extinguishment | | | (455 | ) | | | (8 | ) | | | (713 | ) | | | — | | | | (50 | ) |
Gain on sale of real estate | | | 12,585 | | | | 2,787 | | | | 1,400 | | | | 876 | | | | 2,025 | |
Gain on sale of investment in related party | | | — | | | | — | | | | — | | | | — | | | | 8,500 | |
Internalization expenses | | | (923 | ) | | | (272 | ) | | | — | | | | — | | | | — | |
Other losses | | | — | | | | — | | | | — | | | | (100 | ) | | | — | |
Net income | | | 25,038 | | | | 17,342 | | | | 15,022 | | | | 14,660 | | | | 23,064 | |
Net income attributable to non-controlling interests | | | (1,650 | ) | | | (1,208 | ) | | | (1,084 | ) | | | (1,099 | ) | | | (1,797 | ) |
Net income attributable to Broadstone Net Lease, Inc. | | $ | 23,388 | | | $ | 16,134 | | | $ | 13,938 | | | $ | 13,561 | | | $ | 21,267 | |
| | | | | | | | | | | | | | | | | | | | |
Weighted average number of common shares outstanding | |
Basic | | | 24,642 | | | | 23,204 | | | | 22,335 | | | | 21,416 | | | | 20,554 | |
Diluted | | | 26,379 | | | | 24,941 | | | | 24,072 | | | | 23,154 | | | | 22,291 | |
Net earnings per common share | | | | | | | | | | | | | | | | | | | | |
Basic and diluted | | $ | 0.95 | | | $ | 0.70 | | | $ | 0.62 | | | $ | 0.63 | | | $ | 1.03 | |
BROADSTONE NET LEASE, INC. | www.broadstone.com | © 2019 Broadstone Net Lease, Inc. All rights reserved. | 6 |
| Q3 2019 SUPPLEMENTAL INFORMATION |
| |
Funds From Operations (FFO) and Adjusted Funds From Operations (AFFO)
(unaudited, in thousands, except per share data)
| | Three Months Ended | |
| | September 30, 2019 | | | June 30, 2019 | | | March 31, 2019 | | | December 31, 2018 | | | September 30, 2018 | |
Net income | | $ | 25,038 | | | $ | 17,342 | | | $ | 15,022 | | | $ | 14,660 | | | $ | 23,064 | |
Real property depreciation and amortization | | | 28,392 | | | | 25,287 | | | | 24,310 | | | | 22,691 | | | | 21,869 | |
Gain on sale of real estate | | | (12,585 | ) | | | (2,787 | ) | | | (1,400 | ) | | | (876 | ) | | | (2,025 | ) |
Provision for impairment of investment in rental properties | | | 2,435 | | | | — | | | | 1,017 | | | | — | | | | 2,061 | |
FFO | | $ | 43,280 | | | $ | 39,842 | | | $ | 38,949 | | | $ | 36,475 | | | $ | 44,969 | |
Capital improvements/reserves | | | — | | | | (48 | ) | | | (49 | ) | | | (49 | ) | | | (49 | ) |
Straight-line rent adjustment | | | (5,499 | ) | | | (5,240 | ) | | | (5,143 | ) | | | (3,852 | ) | | | (5,337 | ) |
Cost of debt extinguishment | | | 455 | | | | 8 | | | | 713 | | | | — | | | | 50 | |
Gain on sale of investments in related party | | | — | | | | — | | | | — | | | | — | | | | (8,500 | ) |
Other losses | | | — | | | | — | | | | — | | | | 100 | | | | — | |
Amortization of debt issuance costs | | | 611 | | | | 597 | | | | 553 | | | | 508 | | | | 477 | |
Amortization of net mortgage premiums | | | (37 | ) | | | (36 | ) | | | (35 | ) | | | (35 | ) | | | (36 | ) |
Gain on interest rate swaps and other non-cash interest expense | | | (41 | ) | | | (41 | ) | | | (81 | ) | | | (80 | ) | | | (4 | ) |
Amortization of lease intangibles | | | (873 | ) | | | (717 | ) | | | (738 | ) | | | (516 | ) | | | (255 | ) |
Internalization expenses | | | 923 | | | | 272 | | | | — | | | | — | | | | — | |
AFFO | | $ | 38,819 | | | $ | 34,637 | 1 | | $ | 34,169 | | | $ | 32,551 | | | $ | 31,315 | |
| | | | | | | | | | | | | | | | | | | | |
Diluted weighted average shares outstanding | | | 26,379 | | | | 24,941 | | | | 24,072 | | | | 23,154 | | | | 22,291 | |
Net earnings per diluted share | | $ | 0.95 | | | $ | 0.70 | | | $ | 0.62 | | | $ | 0.63 | | | $ | 1.03 | |
FFO per diluted share | | | 1.64 | | | | 1.60 | | | | 1.62 | | | | 1.58 | | | | 2.02 | |
AFFO per diluted share | | | 1.47 | | | | 1.39 | 1 | | | 1.42 | | | | 1.41 | | | | 1.40 | |
1 AFFO and AFFO per diluted share disclosed in the Company’s Second Quarter 2019 Supplemental Information were $34,365 and $1.38, respectively. Revised amounts herein reflect adjustment for $272 of internalization expenses incurred during the second quarter or 2019, that had previously been reported as general and administrative expenses.
BROADSTONE NET LEASE, INC. | www.broadstone.com | © 2019 Broadstone Net Lease, Inc. All rights reserved. | 7 |
| Q3 2019 SUPPLEMENTAL INFORMATION |
| |
Lease Revenues
(unaudited, in thousands)
The Company adopted ASC 842 as of January 1, 2019, and elected the optional transition method to apply the guidance of ASC 842 as of the adoption date. As a result, captions and amounts in the table below for the three months ended September 30, 2019, June 30, 2019 and March 31, 2019, are prepared in accordance with the provisions of ASC 842, and historical periods are presented in accordance with the provisions of prior GAAP.
| | Three Months Ended | |
| | September 30, 2019 | | | June 30, 2019 | | | March 31, 2019 | | | December 31, 2018 | | | September 30, 2018 | |
Contractual rental amounts billed for operating leases | | $ | 65,579 | | | $ | 60,294 | | | $ | 58,419 | | | $ | — | | | $ | — | |
Straight-line rent adjustments | | | 5,575 | | | | 5,269 | | | | 5,171 | | | | — | | | | — | |
Adjustment to revenue recognized for uncollectible rental amounts billed | | | — | | | | — | | | | (440 | ) | | | — | | | | — | |
Rental income from operating leases | | | — | | | | — | | | | — | | | | 58,597 | | | | 58,189 | |
Operating expenses billed to/reimbursed from tenants | | | 3,811 | | | | 2,486 | | | | 4,275 | | | | 3,457 | | | | 2,529 | |
Other income from real estate transactions | | | 431 | | | | — | | | | — | | | | 35 | | | | 29 | |
Total lease revenues from operating leases | | | 75,396 | | | | 68,049 | | | | 67,425 | | | | 62,089 | | | | 60,747 | |
Earned income from direct financing leases | | | 1,005 | | | | 1,004 | | | | 1,005 | | | | 1,005 | | | | 1,017 | |
Total lease revenues | | $ | 76,401 | | | $ | 69,053 | | | $ | 68,430 | | | $ | 63,094 | | | $ | 61,764 | |
BROADSTONE NET LEASE, INC. | www.broadstone.com | © 2019 Broadstone Net Lease, Inc. All rights reserved. | 8 |
| Q3 2019 SUPPLEMENTAL INFORMATION |
| |
Balance Sheet
(unaudited, in thousands)
| | September 30, 2019 | | | June 30, 2019 | | | March 31, 2019 | | | December 31, 2018 | | | September 30, 2018 | |
Assets | | | | | | | | | | | | | | | | | | | | |
Accounted for using the operating method, net of accumulated depreciation | | $ | 3,459,626 | | | $ | 2,762,161 | | | $ | 2,682,996 | | | $ | 2,641,746 | | | $ | 2,449,438 | |
Accounted for using the direct financing method | | | 41,920 | | | | 41,949 | | | | 41,975 | | | | 42,000 | | | | 42,012 | |
Investment in rental property, net | | | 3,501,546 | | | | 2,804,110 | | | | 2,724,971 | | | | 2,683,746 | | | | 2,491,450 | |
Cash and cash equivalents | | | 14,008 | | | | 10,288 | | | | 11,726 | | | | 18,612 | | | | 17,301 | |
Accrued rental income | | | 81,251 | | | | 78,254 | | | | 73,618 | | | | 69,247 | | | | 65,689 | |
Tenant and other receivables, net | | | 861 | | | | 129 | | | | 1,376 | | | | 1,026 | | | | 214 | |
Prepaid expenses and other assets | | | 34,594 | | | | 7,176 | | | | 7,404 | | | | 4,316 | | | | 14,746 | |
Interest rate swap, assets | | | 1,120 | | | | 2,687 | | | | 8,737 | | | | 17,633 | | | | 35,525 | |
Intangible lease assets, net | | | 342,478 | | | | 293,228 | | | | 287,189 | | | | 286,258 | | | | 264,038 | |
Debt issuance costs – unsecured revolver, net | | | 2,679 | | | | 2,978 | | | | 3,277 | | | | 2,261 | | | | 2,453 | |
Leasing fees, net | | | 13,251 | | | | 13,468 | | | | 13,645 | | | | 13,698 | | | | 13,929 | |
Total assets | | $ | 3,991,788 | | | $ | 3,212,318 | | | $ | 3,131,943 | | | $ | 3,096,797 | | | $ | 2,905,345 | |
Liabilities and equity | | | | | | | | | | | | | | | | | | | | |
Unsecured revolver | | $ | 303,300 | | | $ | 123,600 | | | $ | 139,900 | | | $ | 141,100 | | | $ | — | |
Mortgages and notes payable, net | | | 112,562 | | | | 121,074 | | | | 72,004 | | | | 78,952 | | | | 79,762 | |
Unsecured term notes, net | | | 1,671,511 | | | | 1,222,376 | | | | 1,222,095 | | | | 1,225,773 | | | | 1,225,473 | |
Interest rate swap, liabilities | | | 37,489 | | | | 22,676 | | | | 5,549 | | | | 1,820 | | | | — | |
Accounts payable and other liabilities | | | 34,008 | | | | 32,370 | | | | 26,846 | | | | 24,394 | | | | 24,373 | |
Due to related parties | | | 433 | | | | 111 | | | | 52 | | | | 114 | | | | 47 | |
Accrued interest payable | | | 9,482 | | | | 2,578 | | | | 8,391 | | | | 9,777 | | | | 7,018 | |
Intangible lease liabilities, net | | | 94,503 | | | | 81,895 | | | | 85,080 | | | | 85,947 | | | | 86,301 | |
Total liabilities | | | 2,263,288 | | | | 1,606,680 | | | | 1,559,917 | | | | 1,567,877 | | | | 1,422,974 | |
| | | | | | | | | | | | | | | | | | | | |
Equity | | | | | | | | | | | | | | | | | | | | |
Broadstone Net Lease, Inc. stockholders' equity: | | | | | | | | | | | | | | | | | | | | |
Preferred stock, $0.001 par value | | | — | | | | — | | | | — | | | | — | | | | — | |
Common stock, $0.001 par value | | | 25 | | | | 24 | | | | 23 | | | | 22 | | | | 21 | |
Additional paid-in capital | | | 1,852,038 | | | | 1,702,911 | | | | 1,630,417 | | | | 1,557,421 | | | | 1,479,339 | |
Subscriptions receivable | | | — | | | | — | | | | (225 | ) | | | — | | | | (1,690 | ) |
Cumulative distributions in excess of retained earnings | | | (194,790 | ) | | | (185,647 | ) | | | (170,847 | ) | | | (155,150 | ) | | | (141,117 | ) |
Accumulated other comprehensive income | | | (33,911 | ) | | | (18,584 | ) | | | 3,018 | | | | 14,806 | | | | 33,114 | |
Total Broadstone Net Lease, Inc. stockholders’ equity | | | 1,623,362 | | | | 1,498,704 | | | | 1,462,386 | | | | 1,417,099 | | | | 1,369,667 | |
Non-controlling interests | | | 105,138 | | | | 106,934 | | | | 109,640 | | | | 111,821 | | | | 112,704 | |
Total equity | | | 1,728,500 | | | | 1,605,638 | | | | 1,572,026 | | | | 1,528,920 | | | | 1,482,371 | |
Total liabilities and equity | | $ | 3,991,788 | | | $ | 3,212,318 | | | $ | 3,131,943 | | | $ | 3,096,797 | | | $ | 2,905,345 | |
BROADSTONE NET LEASE, INC. | www.broadstone.com | © 2019 Broadstone Net Lease, Inc. All rights reserved. | 9 |
| Q3 2019 SUPPLEMENTAL INFORMATION |
| |
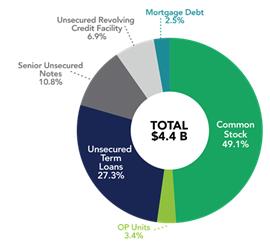
Capital Structure
(unaudited, in thousands, except per share data)
EQUITY ($ in thousands, except per share amounts) | | | | |
Shares of Common Stock | | | 25,482 | |
Membership Units | | | 1,737 | |
Common Stock & OP Units | | | 27,219 | |
Price Per Share / Unit | | $ | 85.00 | |
IMPLIED EQUITY MARKET CAPITALIZATION | | $ | 2,313,586 | |
% of Total Capitalization | | | 52.5 | % |
DEBT ($ in thousands) | | | | |
Unsecured Revolving Credit Facility - 2022 | | $ | 303,300 | |
Unsecured Term Loan Facilities | | | 1,205,000 | |
Unsecured Term Loan - 2020 | | | 300,000 | |
Unsecured Term Loan - 2023 | | | 265,000 | |
Unsecured Term Loan - 2024 | | | 190,000 | |
Unsecured Term Loan - 2026 | | | 450,000 | |
Senior Unsecured Notes | | | 475,000 | |
Senior Unsecured Notes - 2027 | | | 150,000 | |
Senior Unsecured Notes - 2028 | | | 225,000 | |
Senior Unsecured Notes - 2030 | | | 100,000 | |
Mortgage Debt - Various | | | 112,935 | |
TOTAL DEBT | | $ | 2,096,235 | |
% of Total Capitalization | | | 47.5 | % |
% of Total Capitalization Floating Rate Debt | | | 13.7 | % |
% of Total Capitalization Fixed Rate Debt | | | 33.8 | % |
ENTERPRISE VALUE ($ in thousands) | | | | |
Total Capitalization | | $ | 4,409,821 | |
Less: Cash and Cash Equivalents | | | (14,008 | ) |
Enterprise Value | | $ | 4,395,813 | |
The value of common stock and operating company unit equity is calculated by multiplying the total number of shares and units by BNL’s Determined Share Value of $85 as of September 30, 2019.
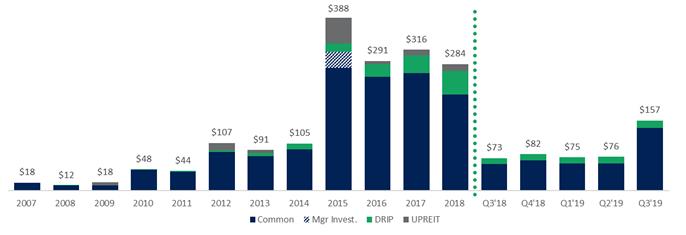
Equity Summary
(unaudited, dollars in millions)
The Company raises equity on a monthly basis through private offerings to accredited investors. Beginning in November 2017, BNL implemented a cap on new and additional investments at its monthly equity closings. The cap applies to new or additional investments and does not apply to investments made pursuant to its DRIP or equity capital received (operating company units) in connection with UPREIT transactions. On July 3, 2019, the Company eliminated the equity cap based on its then current leverage profile and pipeline of acquisitions. We anticipate reinstating the equity cap once we are comfortably within the leverage range of our investment grade rating. On October 22, 2019, the Company announced that as a result of a pending transaction, it would not hold an equity closing as of October 31, 2019. The next equity closing will occur on November 29, 2019.
BROADSTONE NET LEASE, INC. | www.broadstone.com | © 2019 Broadstone Net Lease, Inc. All rights reserved. | 10 |
| Q3 2019 SUPPLEMENTAL INFORMATION |
| |
Debt Outstanding
(unaudited, in thousands)
Year of Maturity | | Term Loans | | | Revolver | | | Senior Notes | | | Mortgages and Notes Payable | | | Total | |
2019 | | $ | — | | | $ | — | | | $ | — | | | $ | 784 | | | $ | 784 | |
2020 | | | 300,000 | | | | — | | | | — | | | | 3,210 | | | | 303,210 | |
2021 | | | — | | | | — | | | | — | | | | 18,028 | | | | 18,028 | |
2022 | | | — | | | | 303,300 | | | | — | | | | 2,930 | | | | 306,230 | |
2023 | | | 265,000 | | | | — | | | | — | | | | 8,356 | | | | 273,356 | |
Thereafter | | | 640,000 | | | | — | | | | 475,000 | | | | 79,627 | | | | 1,194,627 | |
Total | | $ | 1,205,000 | | | $ | 303,300 | | | $ | 475,000 | | | $ | 112,935 | | | $ | 2,096,235 | |
.
| | Outstanding Balance | | | | | | | |
| | September 30, | | | December 31, | | | | | | | |
| | | 2019 | | | | 2018 | | | Interest Rate | | | Maturity Date |
2019 Unsecured Term Loan | | $ | — | | | $ | 300,000 | | | one-month LIBOR + 1.40% | | | Feb. 2020 |
2020 Unsecured Term Loan | | | 300,000 | | | | — | | | one-month LIBOR + 1.25% | | | Aug. 2020 |
Unsecured Revolving Credit and Term Loan Agreement | | | | | | | | | | | | | | |
Revolver | | 303,300 | | | | 141,100 | | | see note | | | Jan. 2022 |
2023 Unsecured Term Loan | | 265,000 | | | | 265,000 | | | one-month LIBOR + 1.35% | | | Jan. 2023 |
2024 Unsecured Term Loan | | 190,000 | | | | 190,000 | | | see note | | | Jun. 2024 |
| | | 758,300 | | | | 596,100 | | | | | | | |
2026 Unsecured Term Loan | | | 450,000 | | | | — | | | one-month LIBOR + 1.85% | | | Feb. 2026 |
Senior Notes | | | | | | | | | | | | | | |
Series A | | 150,000 | | | | 150,000 | | | 4.84% | | | Apr. 2027 |
Series B | | 225,000 | | | | 225,000 | | | 5.09% | | | Jul. 2028 |
Series C | | 100,000 | | | | 100,000 | | | 5.19% | | | Jul. 2030 |
| | | 475,000 | | | | 475,000 | | | | | | | |
Total | | | 1,983,300 | | | | 1,371,100 | | | | | | | |
Debt issuance costs, net | | | (8,489 | ) | | | (4,227 | ) | | | | | | |
| | $ | 1,974,811 | | | $ | 1,366,873 | | | | | | | |
At September 30, 2019, the Revolver borrowings of $303,300 bore interest at one-month LIBOR plus 1.20%. At December 31, 2018, borrowings under the Swingline portion of the Revolver totaled $15,000 and bore interest at 5.45%, and the remaining Revolver borrowings of $126,100 bore interest at one-month LIBOR plus 1.20%.
The 2024 Unsecured Term Loan bore interest at one-month LIBOR plus 1.25% and one-month LIBOR plus 1.90% at September 30, 2019 and December 31, 2018, respectively.
BROADSTONE NET LEASE, INC. | www.broadstone.com | © 2019 Broadstone Net Lease, Inc. All rights reserved. | 11 |
| Q3 2019 SUPPLEMENTAL INFORMATION |
| |
Debt Maturities and Interest Rate Exposure
(unaudited, dollars in millions)
Debt Maturities
The Company utilizes diversified sources of debt capital including unsecured bank debt, private placement debt, and secured mortgages (where appropriate).
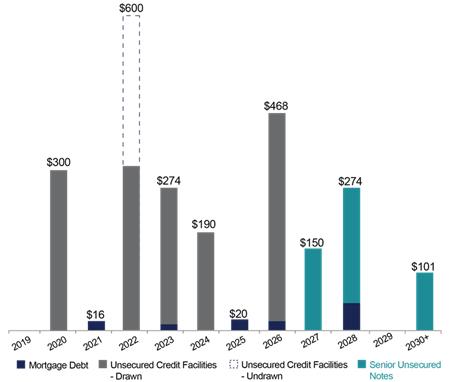
Interest Rate Exposure
The Company uses interest rate swaps, fixed-rate private placement notes, and fixed-rate mortgages to mitigate the impact of interest rate variability.
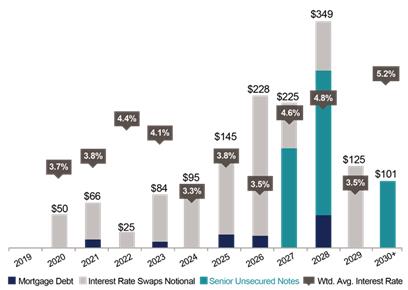
Interest rate exposure not inclusive of floating rate debt, as borrowings are short-term in nature.
BROADSTONE NET LEASE, INC. | www.broadstone.com | © 2019 Broadstone Net Lease, Inc. All rights reserved. | 12 |
| Q3 2019 SUPPLEMENTAL INFORMATION |
| |
Credit Facility and Notes Covenants
(unaudited)
The following is a summary of key financial covenants for the Company’s unsecured credit facility. These calculations, which are not based on U.S. GAAP measurements, are presented to investors to show that as of September 30, 2019, the Company believes it is in compliance with the covenants.
Covenants | | Required | | Actual as of September 30, 2019 | |
Leverage ratio | | ≤ 0.60 to 1.00 | | | 0.52 | |
Secured indebtedness ratio | | ≤ 0.40 to 1.00 | | | 0.03 | |
Unencumbered coverage ratio | | ≥ 1.75 to 1.00 | | | 3.52 | |
Fixed charge coverage ratio | | ≥ 1.50 to 1.00 | | | 2.84 | |
Total unsecured indebtedness to total unencumbered eligible property value | | ≤ 0.60 to 1.00 | | | 0.54 | |
Dividends and other restricted payments | | Only applicable in case of default | | Not Applicable | |
BROADSTONE NET LEASE, INC. | www.broadstone.com | © 2019 Broadstone Net Lease, Inc. All rights reserved. | 13 |
| Q3 2019 SUPPLEMENTAL INFORMATION |
| |
Acquisitions
(unaudited, square feet and dollars in thousands)
The following table summarizes the Company’s property acquisition activity during 2019.
Q1 2019 | | | | | | | | | | | | | | | | |
Property Type | | Number of Properties | | | Square Feet ('000s) | | | Weighted Average Lease Term (years) | | | Acquisition Price ($'000s) | |
Retail | | | 24 | | | | 204 | | | | 11.0 | | | $ | 32,313 | |
Industrial | | | 2 | | | | 506 | | | | 18.4 | | | | 36,018 | |
Healthcare | | | 1 | | | | 14 | | | | 10.0 | | | | 4,747 | |
Total Properties | | | 27 | | | | 724 | | | | 14.8 | | | $ | 73,078 | |
Weighted average initial cash cap rate | | | | | | | | | | | | | | | 7.4 | % |
| | | | | | | | | | | | | | | | |
Q2 2019 | | | | | | | | | | | | | | | | |
Property Type | | Number of Properties | | | Square Feet ('000s) | | | Weighted Average Lease Term (years) | | | Acquisition Price ($'000s) | |
Retail | | | 3 | | | | 27 | | | | 15.9 | | | $ | 9,692 | |
Industrial | | | 2 | | | | 142 | | | | 15.0 | | | | 11,180 | |
Other | | | 2 | | | | 575 | | | | 15.3 | | | | 106,589 | |
Total Properties | | | 7 | | | | 744 | | | | 15.3 | | | $ | 127,461 | |
Weighted average initial cash cap rate | | | | | | | | | | | | | | | 7.4 | % |
| | | | | | | | | | | | | | | | |
Q3 2019 | | | | | | | | | | | | | | | | |
Property Type | | Number of Properties | | | Square Feet ('000s) | | | Weighted Average Lease Term (years) | | | Acquisition Price ($'000s) | |
Industrial | | | 24 | | | | 7,011 | | | | 12.1 | | | $ | 707,703 | |
Healthcare | | | 5 | | | | 82 | | | | 7.6 | | | | 27,277 | |
Office | | | 1 | | | | 282 | | | | 6.4 | | | | 33,050 | |
Retail | | | 1 | | | | 6 | | | | 20.1 | | | | 3,214 | |
Other | | | 1 | | | | 99 | | | | 6.0 | | | | 21,906 | |
Total Properties | | | 32 | | | | 7,480 | | | | 11.5 | | | $ | 793,150 | |
Weighted average initial cash cap rate | | | | | | | | | | | | | | | 6.4 | % |
BROADSTONE NET LEASE, INC. | www.broadstone.com | © 2019 Broadstone Net Lease, Inc. All rights reserved. | 14 |
| Q3 2019 SUPPLEMENTAL INFORMATION |
| |
Dispositions
(unaudited, square feet and dollars in thousands)
The following table summarizes the Company’s property disposition activity during 2019.
Q1 2019 | | | | | | | | | | | | | | | | | | | | | | | | |
Property Type | | Number of Properties | | | Square Feet ('000s) | | | Acquisition Price ($'000s) | | | Disposition Price ($'000s) | | | Net Book Value ($'000s) | | | Cash Cap Rate | |
Retail | | | 2 | | | | 12 | | | $ | 7,148 | | | $ | 6,381 | | | $ | 5,855 | | | | 7.1 | % |
Healthcare | | | 2 | | | | 10 | | | | 3,664 | | | | 4,910 | | | | 3,357 | | | | 7.1 | % |
Total Properties | | | 4 | | | | 22 | | | $ | 10,812 | | | $ | 11,291 | | | $ | 9,212 | | | | 7.1 | % |
| | | | | | | | | | | | | | | | | | | | | | | | |
Q2 2019 | | | | | | | | | | | | | | | | | | | | | | | | |
Property Type | | Number of Properties | | | Square Feet ('000s) | | | Acquisition Price ($'000s) | | | Disposition Price ($'000s) | | | Net Book Value ($'000s) | | | Cash Cap Rate | |
Retail | | | 3 | | | | 25 | | | $ | 8,373 | | | $ | 8,185 | | | $ | 8,452 | | | | 7.2 | % |
Industrial | | | 1 | | | | 124 | | | | 12,500 | | | | 14,876 | | | | 11,305 | | | | 7.5 | % |
Healthcare | | | 1 | | | | 3 | | | | 566 | | | | 748 | | | | 476 | | | | 7.6 | % |
Total Properties | | | 5 | | | | 152 | | | $ | 21,439 | | | $ | 23,809 | | | $ | 20,233 | | | | 7.4 | % |
| | | | | | | | | | | | | | | | | | | | | | | | |
Q3 2019 | | | | | | | | | | | | | | | | | | | | | | | | |
Property Type | | Number of Properties | | | Square Feet ('000s) | | | Acquisition Price ($'000s) | | | Disposition Price ($'000s) | | | Net Book Value ($'000s) | | | Cash Cap Rate | |
Retail | | | 10 | | | | 51 | | | $ | 27,526 | | | $ | 32,340 | | | $ | 24,698 | | | | 6.9 | % |
Healthcare | | | 4 | | | | 22 | | | | 7,410 | | | | 10,188 | | | | 6,433 | | | | 7.0 | % |
Industrial | | | 1 | | | | 200 | | | | 9,800 | | | | 11,200 | | | | 8,581 | | | | 7.0 | % |
Other | | | 1 | | | | 10 | | | | 4,494 | | | | 5,963 | | | | 4,208 | | | | 5.6 | % |
Total Properties | | | 16 | | | | 283 | | | $ | 49,230 | | | $ | 59,691 | | | $ | 43,920 | | | | 6.8 | % |
BROADSTONE NET LEASE, INC. | www.broadstone.com | © 2019 Broadstone Net Lease, Inc. All rights reserved. | 15 |
| Q3 2019 SUPPLEMENTAL INFORMATION |
| |
Portfolio at a Glance: Key Metrics
Properties | 662 | | 
|
States | 42 | |
Canada | 1 | |
Total Building Sq. Footage | 27.5M | |
Enterprise Value | $4.4B | |
Tenants | 187 | |
Brands | 171 | |
Industries | 53 | |
% Leased (based on SF) | 99.8% | |
Physical Occupancy (based on SF) | 99.7% | |
Top Twenty Tenant Concentration | 32.4% | |
Investment Grade (tenant/guarantor) | 16.1% | |
Financial Reporting Coverage | 87.8% | |
Weighted Average Annual Rent Increases | 2.0% | |
Weighted Average Remaining Lease Term | 11.7 years | |
BROADSTONE NET LEASE, INC. | www.broadstone.com | © 2019 Broadstone Net Lease, Inc. All rights reserved. | 16 |
| Q3 2019 SUPPLEMENTAL INFORMATION |
| |
Diversification: Tenants & Brands
(unaudited, rent percentages based on contractual rent over the next twelve months)
Top 20 Tenants
Tenant | | # Properties | | | NTM Rent ($'000s) | | | NTM Rent as a % of Total Portfolio | | | Square Feet ('000s) | | | SF as a % of Total Portfolio | |
Art Van Furniture | | | 10 | | | $ | 8,367 | | | | 2.8 | % | | | 665 | | | | 2.4 | % |
Red Lobster Hospitality | | | 25 | | | | 7,494 | | | | 2.5 | % | | | 203 | | | | 0.7 | % |
Jack's Family Restaurants | | | 36 | | | | 6,057 | | | | 2.0 | % | | | 121 | | | | 0.4 | % |
Axcelis | | | 1 | | | | 5,688 | | | | 1.9 | % | | | 417 | | | | 1.5 | % |
Hensley | | | 3 | | | | 5,616 | | | | 1.9 | % | | | 577 | | | | 2.1 | % |
Outback Steakhouse | | | 24 | | | | 5,491 | | | | 1.9 | % | | | 152 | | | | 0.6 | % |
Krispy Kreme | | | 27 | | | | 5,034 | | | | 1.7 | % | | | 156 | | | | 0.6 | % |
BluePearl | | | 12 | | | | 4,984 | | | | 1.7 | % | | | 154 | | | | 0.6 | % |
Big Tex Trailer Manufacturing | | | 17 | | | | 4,741 | | | | 1.6 | % | | | 1,302 | | | | 4.7 | % |
Siemens | | | 2 | | | | 4,640 | | | | 1.6 | % | | | 545 | | | | 2.0 | % |
Nestle' Dreyer's Ice Cream Company | | | 1 | | | | 4,339 | | | | 1.4 | % | | | 310 | | | | 1.1 | % |
Arkansas Surgical Hospital | | | 1 | | | | 4,139 | | | | 1.4 | % | | | 129 | | | | 0.5 | % |
Nationwide Mutual Insurance Company | | | 2 | | | | 4,117 | | | | 1.4 | % | | | 407 | | | | 1.5 | % |
Cascade Aerospace | | | 1 | | | | 3,919 | | | | 1.3 | % | | | 231 | | | | 0.8 | % |
Bob Evans Restaurants | | | 25 | | | | 3,822 | | | | 1.3 | % | | | 131 | | | | 0.5 | % |
Chiquita | | | 1 | | | | 3,771 | | | | 1.3 | % | | | 335 | | | | 1.2 | % |
BEF Foods | | | 2 | | | | 3,761 | | | | 1.3 | % | | | 331 | | | | 1.2 | % |
Securus1 | | | 1 | | | | 3,729 | | | | 1.2 | % | | | 154 | | | | 0.6 | % |
Zips Car Wash | | | 14 | | | | 3,230 | | | | 1.1 | % | | | 57 | | | | 0.2 | % |
Centene Management Company | | | 1 | | | | 3,194 | | | | 1.1 | % | | | 220 | | | | 0.8 | % |
Total Top 20 Tenants | | | 206 | | | $ | 96,133 | | | | 32.4 | % | | | 6,597 | | | | 24.0 | % |
Top 20 Brands
Brand | | # Properties | | | NTM Rent ($'000s) | | | NTM Rent as a % of Total Portfolio | | | Square Feet ('000s) | | | SF as a % of Total Portfolio | |
Art Van Furniture | | | 10 | | | $ | 8,367 | | | | 2.8 | % | | | 665 | | | | 2.4 | % |
Bob Evans Farms | | | 27 | | | | 7,583 | | | | 2.6 | % | | | 462 | | | | 1.7 | % |
Red Lobster | | | 25 | | | | 7,494 | | | | 2.5 | % | | | 203 | | | | 0.7 | % |
Wendy's | | | 41 | | | | 6,117 | | | | 2.1 | % | | | 122 | | | | 0.5 | % |
Jack's Family Restaurants | | | 36 | | | | 6,057 | | | | 2.0 | % | | | 120 | | | | 0.4 | % |
Axcelis | | | 1 | | | | 5,688 | | | | 1.9 | % | | | 417 | | | | 1.5 | % |
Hensley | | | 3 | | | | 5,616 | | | | 1.9 | % | | | 577 | | | | 2.1 | % |
Krispy Kreme | | | 27 | | | | 5,034 | | | | 1.7 | % | | | 156 | | | | 0.6 | % |
BluePearl Veterinary Partners | | | 12 | | | | 4,984 | | | | 1.7 | % | | | 154 | | | | 0.6 | % |
Outback Steakhouse | | | 22 | | | | 4,802 | | | | 1.6 | % | | | 139 | | | | 0.5 | % |
Taco Bell | | | 37 | | | | 4,751 | | | | 1.6 | % | | | 94 | | | | 0.3 | % |
Big Tex Trailers | | | 17 | | | | 4,741 | | | | 1.6 | % | | | 1,302 | | | | 4.7 | % |
Siemens | | | 2 | | | | 4,640 | | | | 1.6 | % | | | 545 | | | | 2.0 | % |
Nestle | | | 1 | | | | 4,339 | | | | 1.4 | % | | | 310 | | | | 1.1 | % |
Arkansas Surgical Hospital | | | 1 | | | | 4,139 | | | | 1.4 | % | | | 129 | | | | 0.5 | % |
Nationwide Mutual Insurance Co. | | | 2 | | | | 4,117 | | | | 1.4 | % | | | 407 | | | | 1.5 | % |
Cascade Aerospace | | | 1 | | | | 3,919 | | | | 1.3 | % | | | 231 | | | | 0.8 | % |
Chiquita | | | 1 | | | | 3,771 | | | | 1.3 | % | | | 335 | | | | 1.2 | % |
Securus Technologies1 | | | 1 | | | | 3,729 | | | | 1.2 | % | | | 154 | | | | 0.6 | % |
Zips Car Wash | | | 14 | | | | 3,230 | | | | 1.1 | % | | | 57 | | | | 0.2 | % |
Total Top 20 Brands | | | 281 | | | $ | 103,118 | | | | 34.7 | % | | | 6,579 | | | | 23.9 | % |
1 Lease associated with this property requires BNL to pay for certain costs that are not reimbursed by the tenant. Estimated next twelve months net operating income associated with the property is $2,575.
BROADSTONE NET LEASE, INC. | www.broadstone.com | © 2019 Broadstone Net Lease, Inc. All rights reserved. | 17 |
| Q3 2019 SUPPLEMENTAL INFORMATION |
| |
Diversification: Property Type
(unaudited, rent percentages based on contractual rent over the next twelve months)
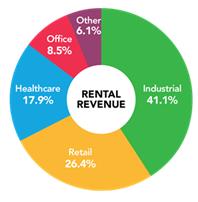
Property Type | | # Properties | | | NTM Rent ($'000s) | | | NTM Rent as a % of Total Portfolio | | | Square Feet ('000s) | | | SF as a % of Total Portfolio | |
Retail - Other | | | 144 | | | $ | 31,320 | | | | 10.5 | % | | | 2,339 | | | | 8.5 | % |
Retail - QSR | | | 150 | | | | 23,677 | | | | 8.0 | % | | | 466 | | | | 1.7 | % |
Retail - Casual Dining | | | 104 | | | | 23,556 | | | | 7.9 | % | | | 673 | | | | 2.5 | % |
Retail Total | | | 398 | | | | 78,553 | | | | 26.4 | % | | | 3,478 | | | | 12.7 | % |
Industrial - Warehouse/Distribution | | | 39 | | | | 61,122 | | | | 20.6 | % | | | 8,406 | | | | 30.6 | % |
Industrial - Manufacturing | | | 54 | | | | 33,127 | | | | 11.2 | % | | | 7,349 | | | | 26.7 | % |
Industrial - Flex | | | 12 | | | | 16,448 | | | | 5.5 | % | | | 1,922 | | | | 7.0 | % |
Industrial - Other | | | 7 | | | | 11,367 | | | | 3.8 | % | | | 1,010 | | | | 3.7 | % |
Industrial Total | | | 112 | | | | 122,064 | | | | 41.1 | % | | | 18,687 | | | | 68.0 | % |
Healthcare - Clinical | | | 73 | | | | 34,768 | | | | 11.7 | % | | | 1,557 | | | | 5.7 | % |
Healthcare - Surgical | | | 16 | | | | 9,644 | | | | 3.2 | % | | | 369 | | | | 1.3 | % |
Healthcare - Other | | | 31 | | | | 8,906 | | | | 3.0 | % | | | 364 | | | | 1.3 | % |
Healthcare Total | | | 120 | | | | 53,318 | | | | 17.9 | % | | | 2,290 | | | | 8.3 | % |
Office Total | | | 16 | | | | 25,236 | | | | 8.5 | % | | | 1,786 | | | | 6.5 | % |
Other Total | | | 16 | | | | 17,971 | | | | 6.1 | % | | | 1,233 | | | | 4.5 | % |
Total | | | 662 | | | $ | 297,142 | | | | 100.0 | % | | | 27,474 | | | | 100.0 | % |
Diversification: Tenant Industry
(unaudited, rent percentages based on contractual rent over the next twelve months)
Industry | | # Properties | | | NTM Rent ($'000s) | | | NTM Rent as a % of Total Portfolio | | | Square Feet ('000s) | | | SF as a % of Total Portfolio | |
Restaurants | | | 255 | | | $ | 47,897 | | | | 16.1 | % | | | 1,170 | | | | 4.3 | % |
Healthcare Facilities | | | 101 | | | $ | 46,636 | | | | 15.7 | % | | | 1,840 | | | | 6.7 | % |
Packaged Foods & Meats | | | 7 | | | $ | 13,088 | | | | 4.4 | % | | | 1,285 | | | | 4.7 | % |
Food Distributors | | | 7 | | | $ | 12,681 | | | | 4.3 | % | | | 1,556 | | | | 5.7 | % |
Home Furnishing Retail | | | 19 | | | $ | 12,279 | | | | 4.1 | % | | | 1,300 | | | | 4.7 | % |
Specialized Consumer Services | | | 42 | | | $ | 10,817 | | | | 3.7 | % | | | 753 | | | | 2.7 | % |
Auto Parts & Equipment | | | 32 | | | $ | 10,219 | | | | 3.4 | % | | | 2,241 | | | | 8.2 | % |
Metal & Glass Containers | | | 8 | | | $ | 9,489 | | | | 3.2 | % | | | 2,196 | | | | 8.0 | % |
Healthcare Services | | | 15 | | | $ | 7,745 | | | | 2.6 | % | | | 467 | | | | 1.7 | % |
Air Freight & Logistics | | | 13 | | | $ | 7,606 | | | | 2.6 | % | | | 519 | | | | 1.9 | % |
Aerospace & Defense | | | 6 | | | $ | 7,476 | | | | 2.5 | % | | | 921 | | | | 3.3 | % |
Distributors | | | 12 | | | $ | 6,768 | | | | 2.3 | % | | | 961 | | | | 3.5 | % |
Electronic Components | | | 2 | | | $ | 6,469 | | | | 2.2 | % | | | 466 | | | | 1.7 | % |
Industrial Machinery | | | 15 | | | $ | 5,451 | | | | 1.8 | % | | | 1,096 | | | | 4.0 | % |
Home Furnishings | | | 2 | | | $ | 5,189 | | | | 1.7 | % | | | 942 | | | | 3.4 | % |
Other (38 industries) | | | 122 | | | $ | 87,332 | | | | 29.4 | % | | | 9,710 | | | | 35.3 | % |
Untenanted properties | | | 4 | | | | — | | | | — | | | | 51 | | | | 0.2 | % |
Total | | | 662 | | | $ | 297,142 | | | | 100.0 | % | | | 27,474 | | | | 100.0 | % |
BROADSTONE NET LEASE, INC. | www.broadstone.com | © 2019 Broadstone Net Lease, Inc. All rights reserved. | 18 |
| Q3 2019 SUPPLEMENTAL INFORMATION |
| |
Diversification: Geography
(unaudited, rent percentages based on contractual rent over the next twelve months)
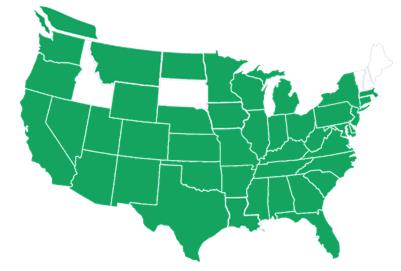
| TOTAL PROPERTIES: 662 TOTAL STATES: 42 TOTAL CANADA: 1 |
State | | # Properties | | | NTM Rent ($'000s) | | | NTM Rent as a % of Total Portfolio | | | Square Feet ('000s) | | | SF as a % of Total Portfolio | | | | State | | # Properties | | | | | NTM Rent ($'000s) | | | | | NTM Rent as a % of Total Portfolio | | | | | Square Feet ('000s) | | | | | SF as a % of Total Portfolio | |
TX | | | 53 | | | $ | 31,302 | | | | 10.5 | % | | | 3,251 | | | | 11.8 | % | | | VA | | | 14 | | | | | $ | 4,543 | | | | | | 1.5 | % | | | | | 110 | | | | | | 0.4 | % |
IL | | | 28 | | | | 20,014 | | | | 6.7 | % | | | 1,990 | | | | 7.2 | % | | | WA | | | 15 | | | | | | 4,072 | | | | | | 1.4 | % | | | | | 150 | | | | | | 0.6 | % |
MI | | | 35 | | | | 17,012 | | | | 5.7 | % | | | 1,439 | | | | 5.2 | % | | | MO | | | 9 | | | | | | 3,836 | | | | | | 1.3 | % | | | | | 733 | | | | | | 2.7 | % |
FL | | | 52 | | | | 16,251 | | | | 5.5 | % | | | 844 | | | | 3.1 | % | | | KY | | | 18 | | | | | | 3,713 | | | | | | 1.2 | % | | | | | 179 | | | | | | 0.6 | % |
WI | | | 33 | | | | 15,348 | | | | 5.2 | % | | | 1,569 | | | | 5.7 | % | | | SC | | | 17 | | | | | | 3,299 | | | | | | 1.1 | % | | | | | 342 | | | | | | 1.3 | % |
CA | | | 11 | | | | 15,240 | | | | 5.1 | % | | | 1,554 | | | | 5.7 | % | | | NE | | | 6 | | | | | | 2,916 | | | | | | 1.0 | % | | | | | 509 | | | | | | 1.9 | % |
OH | | | 37 | | | | 14,378 | | | | 4.9 | % | | | 1,379 | | | | 5.0 | % | | | MD | | | 4 | | | | | | 2,842 | | | | | | 1.0 | % | | | | | 293 | | | | | | 1.1 | % |
IN | | | 29 | | | | 12,254 | | | | 4.1 | % | | | 1,738 | | | | 6.3 | % | | | LA | | | 2 | | | | | | 2,726 | | | | | | 0.9 | % | | | | | 161 | | | | | | 0.6 | % |
NC | | | 29 | | | | 10,659 | | | | 3.6 | % | | | 1,149 | | | | 4.2 | % | | | IA | | | 4 | | | | | | 2,635 | | | | | | 0.9 | % | | | | | 622 | | | | | | 2.3 | % |
MN | | | 22 | | | | 9,557 | | | | 3.2 | % | | | 1,254 | | | | 4.6 | % | | | NM | | | 7 | | | | | | 2,438 | | | | | | 0.8 | % | | | | | 77 | | | | | | 0.3 | % |
PA | | | 17 | | | | 9,554 | | | | 3.2 | % | | | 1,077 | | | | 3.9 | % | | | UT | | | 3 | | | | | | 2,272 | | | | | | 0.8 | % | | | | | 280 | | | | | | 1.0 | % |
MA | | | 4 | | | | 9,501 | | | | 3.2 | % | | | 1,009 | | | | 3.7 | % | | | CT | | | 2 | | | | | | 1,632 | | | | | | 0.6 | % | | | | | 55 | | | | | | 0.2 | % |
NY | | | 16 | | | | 9,131 | | | | 3.1 | % | | | 578 | | | | 2.1 | % | | | WV | | | 8 | | | | | | 1,615 | | | | | | 0.6 | % | | | | | 36 | | | | | | 0.1 | % |
TN | | | 37 | | | | 8,930 | | | | 3.0 | % | | | 372 | | | | 1.4 | % | | | MS | | | 2 | | | | | | 1,614 | | | | | | 0.6 | % | | | | | 239 | | | | | | 0.9 | % |
OK | | | 28 | | | | 8,397 | | | | 2.8 | % | | | 856 | | | | 3.1 | % | | | MT | | | 7 | | | | | | 1,506 | | | | | | 0.5 | % | | | | | 43 | | | | | | 0.2 | % |
AL | | | 45 | | | | 7,890 | | | | 2.7 | % | | | 177 | | | | 0.6 | % | | | CO | | | 3 | | | | | | 1,413 | | | | | | 0.5 | % | | | | | 94 | | | | | | 0.3 | % |
AZ | | | 6 | | | | 7,774 | | | | 2.6 | % | | | 716 | | | | 2.6 | % | | | NV | | | 2 | | | | | | 1,292 | | | | | | 0.4 | % | | | | | 81 | | | | | | 0.3 | % |
AR | | | 11 | | | | 7,376 | | | | 2.5 | % | | | 284 | | | | 1.0 | % | | | ND | | | 2 | | | | | | 917 | | | | | | 0.3 | % | | | | | 28 | | | | | | 0.1 | % |
GA | | | 25 | | | | 6,861 | | | | 2.3 | % | | | 910 | | | | 3.3 | % | | | DE | | | 3 | | | | | | 658 | | | | | | 0.2 | % | | | | | 35 | | | | | | 0.1 | % |
KS | | | 10 | | | | 4,874 | | | | 1.6 | % | | | 639 | | | | 2.3 | % | | | WY | | | 1 | | | | | | 305 | | | | | | 0.1 | % | | | | | 21 | | | | | | 0.1 | % |
NJ | | | 3 | | | | 4,577 | | | | 1.5 | % | | | 366 | | | | 1.3 | % | | | OR | | | 1 | | | | | | 99 | | | | | <0.1 | % | | | | | 4 | | | | | <0.1 | % |
| | | | | | | | | | | | | | | | | | | | | | | Total US | | | 661 | | | | | $ | 293,223 | | | | | | 98.7 | % | | | | | 27,243 | | | | | | 99.2 | % |
| | | | | | | | | | | | | | | | | | | | | | | Total Canada | | | 1 | | | | | | 3,919 | | | | | | 1.3 | % | | | | | 231 | | | | | | 0.8 | % |
| | | | | | | | | | | | | | | | | | | | | | | Grand Total | | | 662 | | | | | $ | 297,142 | | | | | | 100.0 | % | | | | | 27,474 | | | | | | 100.0 | % |
BROADSTONE NET LEASE, INC. | www.broadstone.com | © 2019 Broadstone Net Lease, Inc. All rights reserved. | 19 |
| Q3 2019 SUPPLEMENTAL INFORMATION |
| |
Lease Expirations
(unaudited, rent percentages based on contractual rent over the next twelve months)
WEIGHTED AVERAGE
REMAINING LEASE TERM: 11.7 YRS
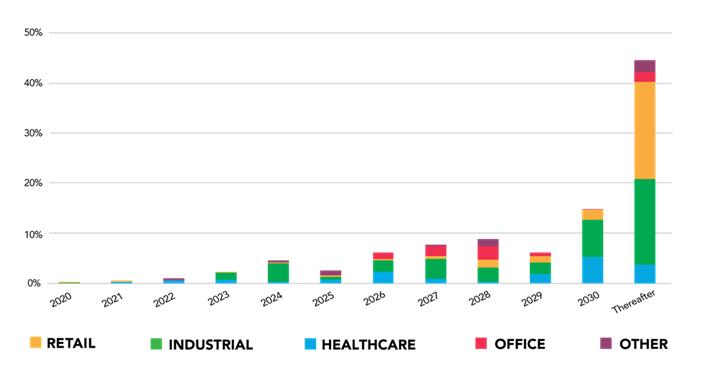
Expiration Year | | # Properties | | | NTM Rent ($'000s) | | | NTM Rent as a % of Total Portfolio | | | Square Feet ('000s) | | | SF as a % of Total Portfolio | |
2020 | | | 3 | | | $ | 629 | | | | 0.2 | % | | | 87 | | | | 0.3 | % |
2021 | | | 11 | | | | 1,931 | | | | 0.6 | % | | | 99 | | | | 0.4 | % |
2022 | | | 4 | | | | 3,285 | | | | 1.1 | % | | | 124 | | | | 0.5 | % |
2023 | | | 13 | | | | 6,975 | | | | 2.3 | % | | | 703 | | | | 2.5 | % |
2024 | | | 14 | | | | 13,737 | | | | 4.6 | % | | | 1,672 | | | | 6.1 | % |
2025 | | | 21 | | | | 7,713 | | | | 2.6 | % | | | 693 | | | | 2.5 | % |
2026 | | | 34 | | | | 18,551 | | | | 6.2 | % | | | 1,521 | | | | 5.5 | % |
2027 | | | 32 | | | | 23,043 | | | | 7.8 | % | | | 2,006 | | | | 7.3 | % |
2028 | | | 36 | | | | 26,555 | | | | 8.9 | % | | | 2,715 | | | | 9.9 | % |
2029 | | | 61 | | | | 18,527 | | | | 6.2 | % | | | 2,481 | | | | 9.0 | % |
Thereafter | | | 429 | | | | 176,196 | | | | 59.3 | % | | | 15,322 | | | | 55.8 | % |
Untenanted properties | | | 4 | | | | — | | | | — | | | | 51 | | | | 0.2 | % |
Total | | | 662 | | | $ | 297,142 | | | | 100.0 | % | | | 27,474 | | | | 100.0 | % |
BROADSTONE NET LEASE, INC. | www.broadstone.com | © 2019 Broadstone Net Lease, Inc. All rights reserved. | 20 |
| Q3 2019 SUPPLEMENTAL INFORMATION |
| |
Portfolio Occupancy
(unaudited, based upon square feet)
Dividends Paid Per Share
(unaudited)
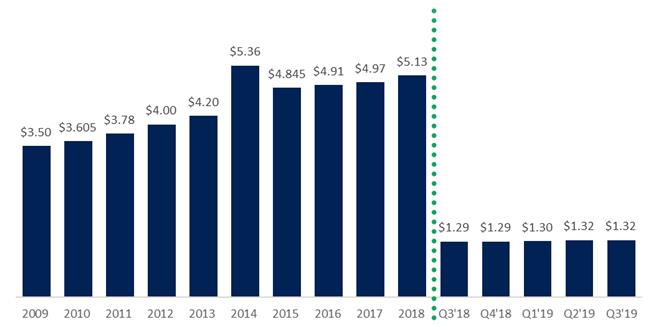
Year-to-date total return through September 30, 2019, assuming dividend reinvestment, was 3.58%.
On November 1, 2019, the Determined Share Value of our common stock was $85.00 per share. Year-to-date total return, assuming dividend reinvestment, through December 31, 2019, is projected to be 5.23%1.
1 Calculation of year-to-date total return assumes reinvestment of dividends declared by the Board of Directors but net yet paid for the months of November and December 2019.
BROADSTONE NET LEASE, INC. | www.broadstone.com | © 2019 Broadstone Net Lease, Inc. All rights reserved. | 21 |
| Q3 2019 SUPPLEMENTAL INFORMATION |
| |
Important Disclosures and Definitions Regarding Broadstone Net Lease, Inc. (BNL)
Not an offer to sell securities: Offers to sell interests in BNL are made exclusively through BNL’s Private Placement Memorandum (PPM). Offers, solicitations, and sales are not made in jurisdictions where not lawful or prohibited. Securities are not offered to residents of Arizona.
BNL’s securities are privately offered: BNL’s securities have not been registered under the Securities Act of 1933, as amended (the “Securities Act”). BNL conducts its private offering in reliance upon the exemptions from Securities Act registration provided by Rule 506(c) under Regulation D promulgated under the Securities Act and Section 4(a)(2) of the Securities Act and certain state securities laws. BNL’s securities have not been approved or disapproved by the U.S. Securities and Exchange Commission (the “SEC”), the attorney general of the State of New York, any other state securities commission or any other regulatory authority, nor have any of the foregoing passed upon the accuracy or adequacy of the information presented. Any representation to the contrary is a criminal offense.
BNL files public reports with the SEC: BNL has registered its shares of common stock pursuant to Section 12(g) of the Securities Exchange Act of 1934, as amended (the “Exchange Act”). BNL is subject to the registration requirements of Section 12(g) of the Exchange Act because as of December 31, 2016, the aggregate value of its assets exceeded the applicable threshold and its common stock was held of record by 2,000 or more persons. As a result of the registration of its common stock pursuant to the Exchange Act, BNL is subject to the requirements of the Exchange Act and the rules promulgated thereunder. In particular, BNL is required to file Quarterly Reports on Form 10-Q, Annual Reports on Form 10-K, and Current Reports on Form 8-K and otherwise comply with the disclosure obligations of the Exchange Act applicable to issuers filing registration statements to register a class of securities pursuant to Section 12(g) of the Exchange Act.
Investment Company Act: BNL’s securities are not subject to the protections of the Investment Company Act of 1940, as amended.
Accredited investors only: BNL’s securities are only offered and sold to “accredited investors,” as defined under the U.S. securities laws, pursuant to BNL’s PPM and related subscription documents. Individuals are accredited investors only if they meet certain minimum net worth
or sustained annual income thresholds. Entities are accredited investors only if they hold sufficient assets or are completely owned by accredited investors. Please see the definition on the SEC website. http://www.sec.gov/answers/accred.htm
Transfers restricted; No trading market: Transfers of BNL’s securities are restricted by federal and state securities laws and certain provisions of our organizational documents. There is no trading market for the shares and there can be no assurance that such a market will develop in the foreseeable future. BNL’s securities may not be transferred, resold, or otherwise disposed of by an investor unless, in the opinion of counsel acceptable to us, registration under federal and applicable state securities laws is not required or compliance is made with the registration requirements of such laws.
Liquidity of BNL’s securities is limited: Redemptions of BNL’s securities are limited in amount and require that the shares have been held for required periods. Provisions of state law, REIT requirements, and other matters may limit redemptions.
Investments involve significant risks: An investment in BNL’s securities involves significant risks. Only investors who can bear the economic risk of an investment of this type for an indefinite period of time and the risk of loss of their entire investment should invest in BNL’s securities. Factors that may cause our actual results, performance, or achievements to differ materially from our stated expectations include, among others: general economic conditions; local real estate conditions in the markets where our properties are located; financial difficulties of our tenants; loss of key personnel; interest rates rising; compliance with REIT requirements; and continued access to capital to fund growth. See the section entitled “Risk Factors” in our PPM for additional information.
This is not investment, financial, legal, or tax advice: This information is not investment, financial, legal, or tax advice and has been prepared without reference to any reader’s investment profile or financial circumstances. You should obtain financial and tax advice and conduct diligent investigation of information material to you before making any investment decision.
Performance data; Stock price: The value of investments and the income or distributions from investments may fall or rise. BNL’s stock price is not set by any market in the common stock but by our independent directors based on the net asset value of our portfolio of properties determined as described in the PPM. We are not required by law to follow any particular methodology in setting the stock price (referred to in our organizational documents as the “Determined Share Value”). There may be variations from time to time in how our independent directors apply or weight the criteria described in the PPM in setting the stock price.
No guarantee of future performance: The information contained herein represents the past performance of BNL. Past performance is not a
guarantee of future performance. The current performance of BNL may be lower or higher than the past performance. Distributions are made at the discretion of BNL’s board of directors and past practices are not guarantees of the timing or amount of future distributions.
Funds From Operations (FFO) and Adjusted Funds From Operations (AFFO): Our reported results and net earnings per dilutive share are presented in accordance with accounting principles generally accepted in the United States of America (GAAP). We also disclose FFO and AFFO, each of which are non-GAAP measures. We believe the use of FFO and AFFO are useful to investors because they are widely accepted industry measures used by analysts and investors to compare the operating performance of REITs. FFO and AFFO should not be considered alternatives to net income as a performance measure or to cash flows from operations, as reported on our statement of cash flows, or as a liquidity measure and should be considered in addition to, and not in lieu of, GAAP financial measures.
We compute FFO in accordance with the standards established by the Funds From Operations White Paper — 2018 Restatement approved by the Board of Governors of Nareit, the worldwide representative voice for REITs and publicly traded real estate companies with an interest in the U.S. real estate and capital markets. Nareit defines FFO as GAAP net income or loss adjusted to exclude net gains (losses) from sales of certain depreciated real estate assets, depreciation and amortization expense from real estate assets, gains and losses from change in control, and impairment charges related to certain previously depreciated real estate assets. To derive AFFO, we modify the Nareit computation of FFO to include other adjustments to GAAP net income related to certain non-cash revenues and expenses, including straight-line rents, cost of debt extinguishments, amortization of debt issuance costs, amortization of net mortgage premiums, amortization of lease intangibles, (gain) loss on interest rate swaps and other non-cash interest expense, realized gains or losses on foreign currency transactions, internalization expenses, extraordinary items and other specified non-cash items. We believe that such items are not a result of normal operations and thus we believe excluding such items assists management and investors in distinguishing whether changes in our operations are due to growth or decline of operations at our properties or from other factors.
BROADSTONE NET LEASE, INC. | www.broadstone.com | © 2019 Broadstone Net Lease, Inc. All rights reserved. | 22 |