BUSINESS UPDATE MAY 2020 EXHIBIT 99.1 BROADSTONE NET LEASE INC.
FORWARD LOOKING STATEMENTS This presentation contains “forward-looking” statements within the meaning of Section 27A of the Securities Act of 1933, as amended, and Section 21E of the Securities Exchange Act of 1934, as amended. Such forward-looking statements can generally be identified by our use of forward-looking terminology such as "may," "will," "expect," "intend," "anticipate," "estimate," "believe," "continue," or other similar words. Forward-looking statements involve known and unknown risks, which may cause BNL’s actual future results to differ materially from expected results, including without limitation, risks and uncertainties related to the COVID-19 pandemic and its related impacts on us and our tenants, general economic conditions, local real estate conditions, tenant financial health, property acquisitions and the timing of these acquisitions, the availability of capital to finance planned growth, and BNL’s success in its deleveraging efforts, among others, as described in the BNL’s filings with the Securities and Exchange Commission. Consequently, forward-looking statements should be regarded solely as reflections of our current operating plans and estimates as of the dates indicated. Actual operating results may differ materially from what is expressed or forecast in this presentation. BNL undertakes no obligation to publicly release the results of any revisions to these forward-looking statements that may be made to reflect events or circumstances after the date these statements were made. The information included in this presentation and covered during this call is based on the information and disclosures contained in Broadstone Net Lease’s Quarterly Report on Form 10-Q and earnings release for the quarter ended March 31, 2020, which were filed with the SEC on May 7, 2020, and are available on the SEC's website, on investors.bnl.broadstone.com, and by request. BROADSTONE NET LEASE INC. 2 BUAINESS UPDATE MAY2020
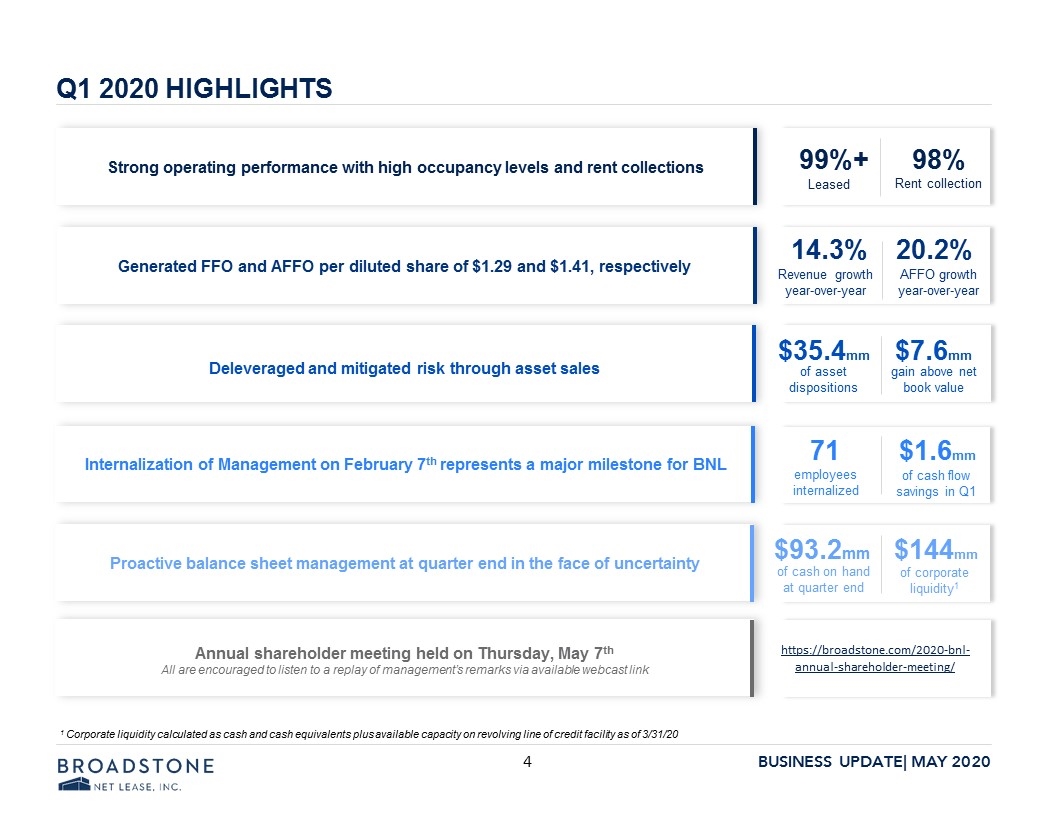
Q1 2020 HIGHLIGHTS 99%+ 98% Leased Rent collection $35.4mm $7.6mm of asset dispositions gain above net book value 71 $1.6mm employees internalized of cash flow savings in Q1 $93.2mm $144mm of cash on hand at quarter end of corporate liquidity1 Strong operating performance with high occupancy levels and rent collections Deleveraged and mitigated risk through asset sales Internalization of Management on February 7th represents a major milestone for BNL Proactive balance sheet management at quarter end in the face of uncertainty 14.3% 20.2% Revenue growth year-over-year Generated FFO and AFFO per diluted share of $1.29 and $1.41, respectively AFFO growth year-over-year QUARTERLY UPDATE Annual shareholder meeting held on Thursday, May 7th All are encouraged to listen to a replay of management’s remarks via available webcast link 1 Corporate liquidity calculated as cash and cash equivalents plus available capacity on revolving line of credit facility as of 3/31/20 https://broadstone.com/2020-bnl-annual-shareholder-meeting/ BROADSTONE NET LEASE INC. 4 BUAINESS UPDATE MAY2020
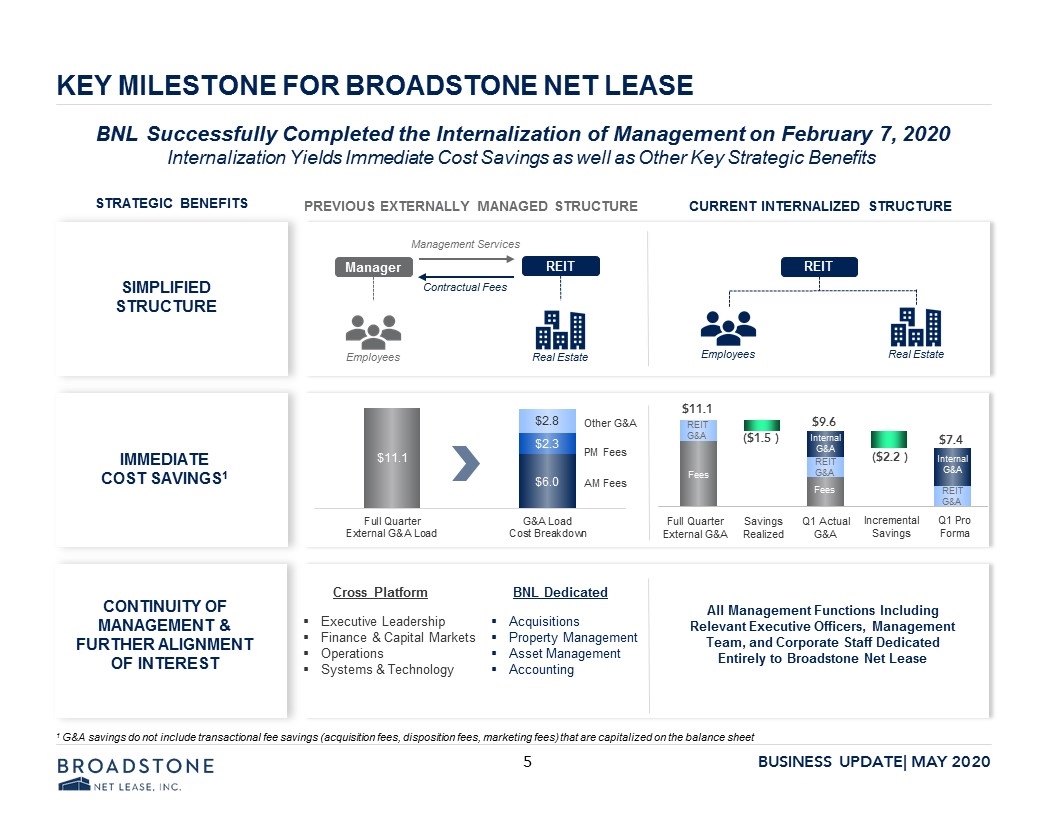
KEY MILESTONE FOR BROADSTONE NET LEASE BNL Successfully Completed the Internalization of Management on February 7, 2020 Internalization Yields Immediate Cost Savings as well as Other Key Strategic Benefits STRATEGIC BENEFITS PREVIOUS EXTERNALLY MANAGED STRUCTURE CURRENT INTERNALIZED STRUCTURE SIMPLIFIED STRUCTURE CONTINUITY OF MANAGEMENT & FURTHER ALIGNMENT OF INTEREST IMMEDIATE COST SAVINGS1 Management Services Contractual Fees Employees Real Estate Manager REIT REIT Employees Real Estate AM Fees PM Fees Other G&A Cross Platform BNL Dedicated Executive Leadership Finance & Capital Markets Operations Systems & Technology Acquisitions Property Management Asset Management Accounting All Management Functions Including Relevant Executive Officers, Management Team, and Corporate Staff Dedicated Entirely to Broadstone Net Lease 1 G&A savings do not include transactional fee savings (acquisition fees, disposition fees, marketing fees) that are capitalized on the balance sheet Fees G&A Fees G&A G&A Full Quarter External G&A Savings Realized Q1 Actual G&A Incremental Savings Q1 Pro Forma Fees Fees REIT G&A REIT G&A Internal G&A Internal G&A REIT G&A $11.1 $2.8 $2.3 $6.0 $1.5 $2.2 BROADSTONE NET LEASE INC. 5 BUAINESS UPDATE MAY2020
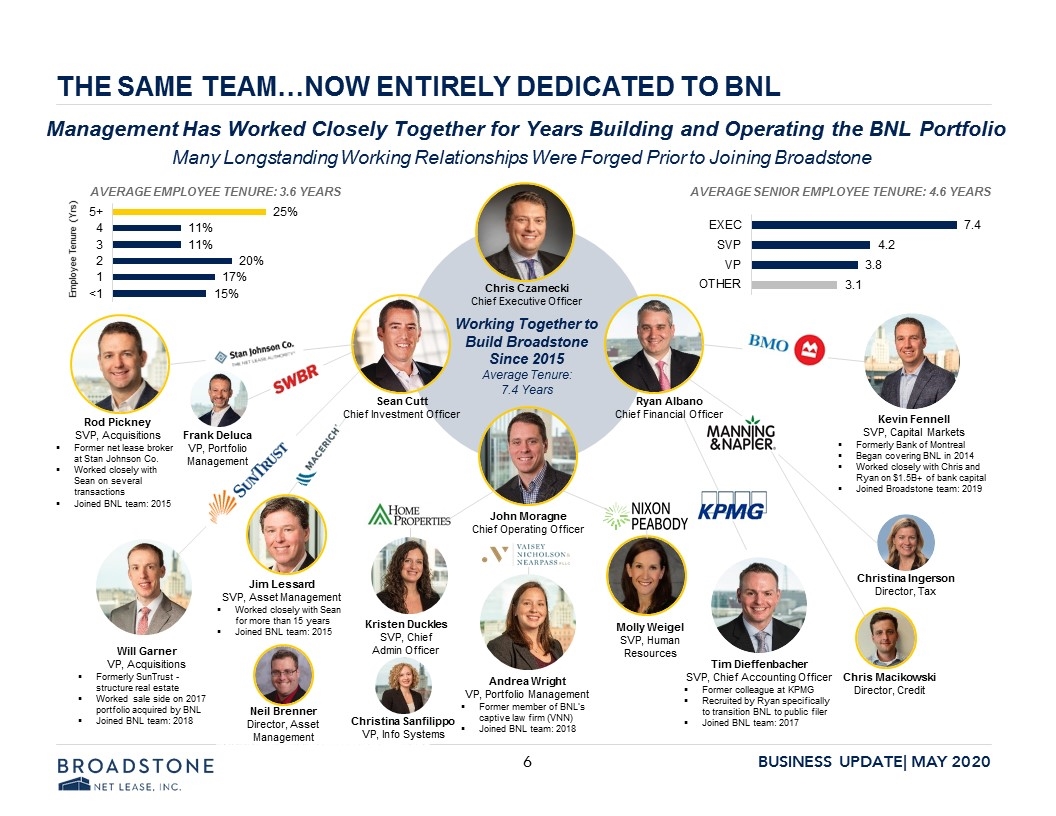
THE SAME TEAM…NOW ENTIRELY DEDICATED TO BNL Working Together to Build Broadstone Since 2015 Average Tenure: 7.4 Years Kevin Fennell SVP, Capital Markets Formerly Bank of Montreal Began covering BNL in 2014 Worked closely with Chris and Ryan on $1.5B+ of bank capital Joined Broadstone team: 2019 Chris Czarnecki Chief Executive Officer Sean Cutt Chief Investment Officer John Moragne Chief Operating Officer AVERAGE EMPLOYEE TENURE: 3.6 YEARS AVERAGE SENIOR EMPLOYEE TENURE: 4.6 YEARS Christina Ingerson Director, Tax Chris Macikowski Director, Credit Tim Dieffenbacher SVP, Chief Accounting Officer Former colleague at KPMG Recruited by Ryan specifically to transition BNL to public filer Joined BNL team: 2017 Kristen Duckles SVP, Chief Admin Officer Christina Sanfilippo VP, Info Systems Molly Weigel SVP, Human Resources Andrea Wright VP, Portfolio Management Former member of BNL’s captive law firm (VNN) Joined BNL team: 2018 Will Garner VP, Acquisitions Formerly SunTrust - structure real estate Worked sale side on 2017 portfolio acquired by BNL Joined BNL team: 2018 Rod Pickney SVP, Acquisitions Former net lease broker at Stan Johnson Co. Worked closely with Sean on several transactions Joined BNL team: 2015 Frank Deluca VP, Portfolio Management Jim Lessard SVP, Asset Management Worked closely with Sean for more than 15 years Joined BNL team: 2015 Neil Brenner Director, Asset Management Management Has Worked Closely Together for Years Building and Operating the BNL Portfolio Many Longstanding Working Relationships Were Forged Prior to Joining Broadstone Ryan Albano Chief Financial Officer Employee Tenure (Yrs) +5 4 3 2 1 25 % 11% 11% 20% 17% 15%EXEC SVP VP OTHER 7.4 4.2 3.8 3.1 Stan Johnson Co. THE NET LEASE AUTHORITY SWBR SUNTRUST MACERICH HOME PROPERTIES VAISEY NICHOLSON & NEARPASS PLL MANNING & NAPIER NIXON PEABODY KPMG BROADSTONE NET LEASE INC. 6 BUSINESS UPDATE MAY 2020
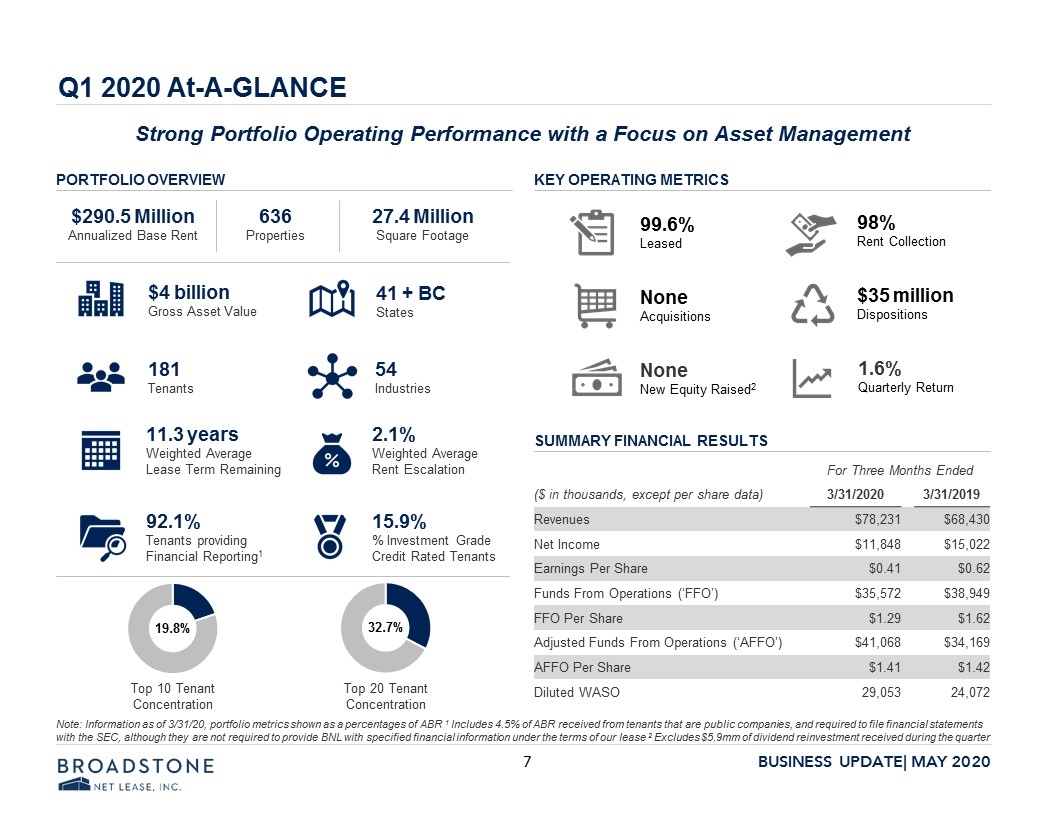
Q1 2020 At-A-GLANCE For Three Months Ended ($ in thousands, except per share data) 3/31/2020 3/31/2019 Revenues $78,231 $68,430 Net Income $11,848 $15,022 Earnings Per Share $0.41 $0.62 Funds From Operations (‘FFO’) $35,572 $38,949 FFO Per Share $1.29 $1.62 Adjusted Funds From Operations (‘AFFO’) $41,068 $34,169 AFFO Per Share $1.41 $1.42 Diluted WASO 29,053 24,072 KEY OPERATING METRICS SUMMARY FINANCIAL RESULTS PORTFOLIO OVERVIEW Top 10 Tenant Concentration Top 20 Tenant Concentration $290.5 Million Annualized Base Rent 636 Properties 27.4 Million Square Footage 98% Rent Collection $35 million Dispositions None Acquisitions 99.6% Leased 1.6% Quarterly Return None New Equity Raised2 Strong Portfolio Operating Performance with a Focus on Asset Management $4 billion Gross Asset Value 181 Tenants 54 Industries 11.3 years Weighted Average Lease Term Remaining 41 + BC States 2.1% Weighted Average Rent Escalation 92.1% Tenants providing Financial Reporting1 15.9% % Investment Grade Credit Rated Tenants Note: Information as of 3/31/20, portfolio metrics shown as a percentages of ABR 1 Includes 4.5% of ABR received from tenants that are public companies, and required to file financial statements with the SEC, although they are not required to provide BNL with specified financial information under the terms of our lease 2 Excludes $5.9mm of dividend reinvestment received during the quarter BROADSTONE NET LEASE INC. 7 BUSINESS UPDATE MAY 2020
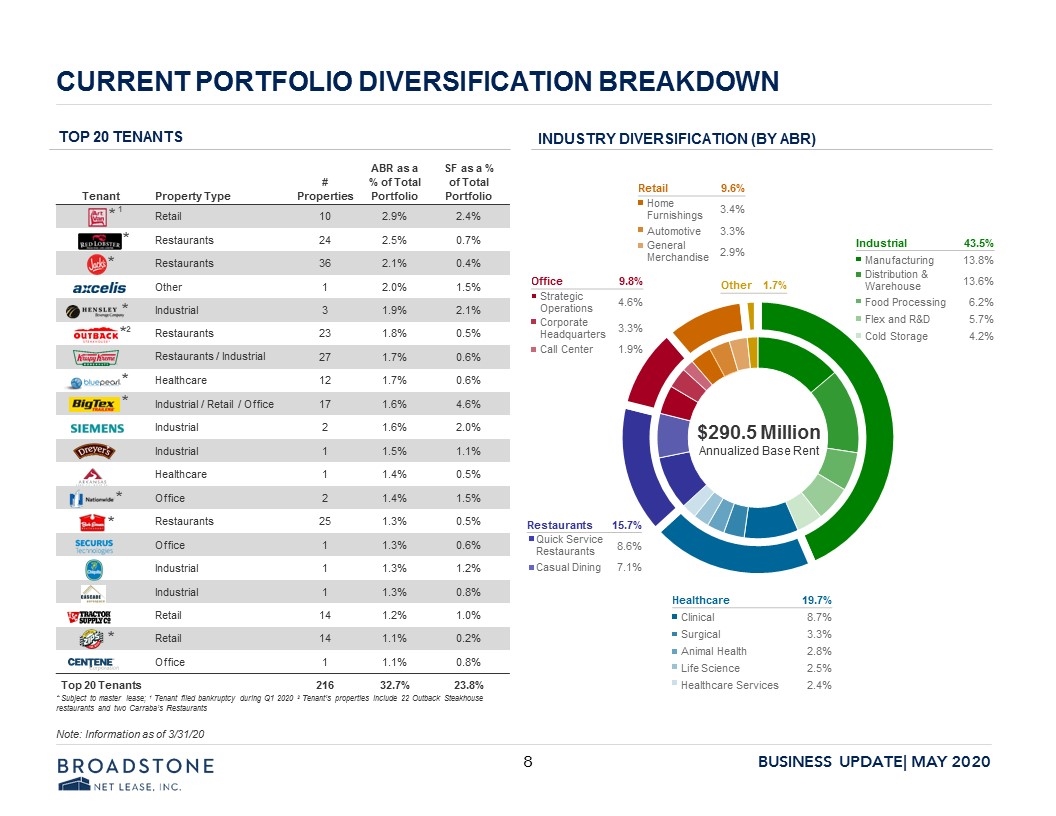
CURRENT PORTFOLIO DIVERSIFICATION BREAKDOWN Industrial 43.5% Manufacturing 13.8% Distribution & ...Warehouse 13.6% Food Processing 6.2% Flex and R&D 5.7% Cold Storage 4.2% Office 9.8% Strategic ...Operations 4.6% Corporate ...Headquarters 3.3% Call Center 1.9% Tenant Property Type # Properties ABR as a % of Total Portfolio SF as a % of Total Portfolio Retail 10 2.9% 2.4% Restaurants 24 2.5% 0.7% Restaurants 36 2.1% 0.4% Other 1 2.0% 1.5% Industrial 3 1.9% 2.1% Restaurants 23 1.8% 0.5% Restaurants / Industrial 27 1.7% 0.6% Healthcare 12 1.7% 0.6% Industrial / Retail / Office 17 1.6% 4.6% Industrial 2 1.6% 2.0% Industrial 1 1.5% 1.1% Healthcare 1 1.4% 0.5% Office 2 1.4% 1.5% Restaurants 25 1.3% 0.5% Office 1 1.3% 0.6% Industrial 1 1.3% 1.2% Industrial 1 1.3% 0.8% Retail 14 1.2% 1.0% Retail 14 1.1% 0.2% Office 1 1.1% 0.8% Top 20 Tenants 216 32.7% 23.8% * Subject to master lease; 1 Tenant filed bankruptcy during Q1 2020 2 Tenant’s properties include 22 Outback Steakhouse restaurants and two Carraba’s Restaurants * * * * *2 * * * * Healthcare 19.7% Clinical 8.7% Surgical 3.3% Animal Health 2.8% Life Science 2.5% Healthcare Services 2.4% Retail 9.6% Home ...Furnishings 3.4% Automotive 3.3% General ...Merchandise 2.9% Other 1.7% Top 20 Tenants Industry Diversification (by ABR) Restaurants 15.7% Quick Service ...Restaurants 8.6% Casual Dining 7.1% * Note: Information as of 3/31/20 $290.5 Million Annualized Base Rent 1 BROADSTONE NET LEASE INC. 8 BUSINESS UPDATE MAY 2020
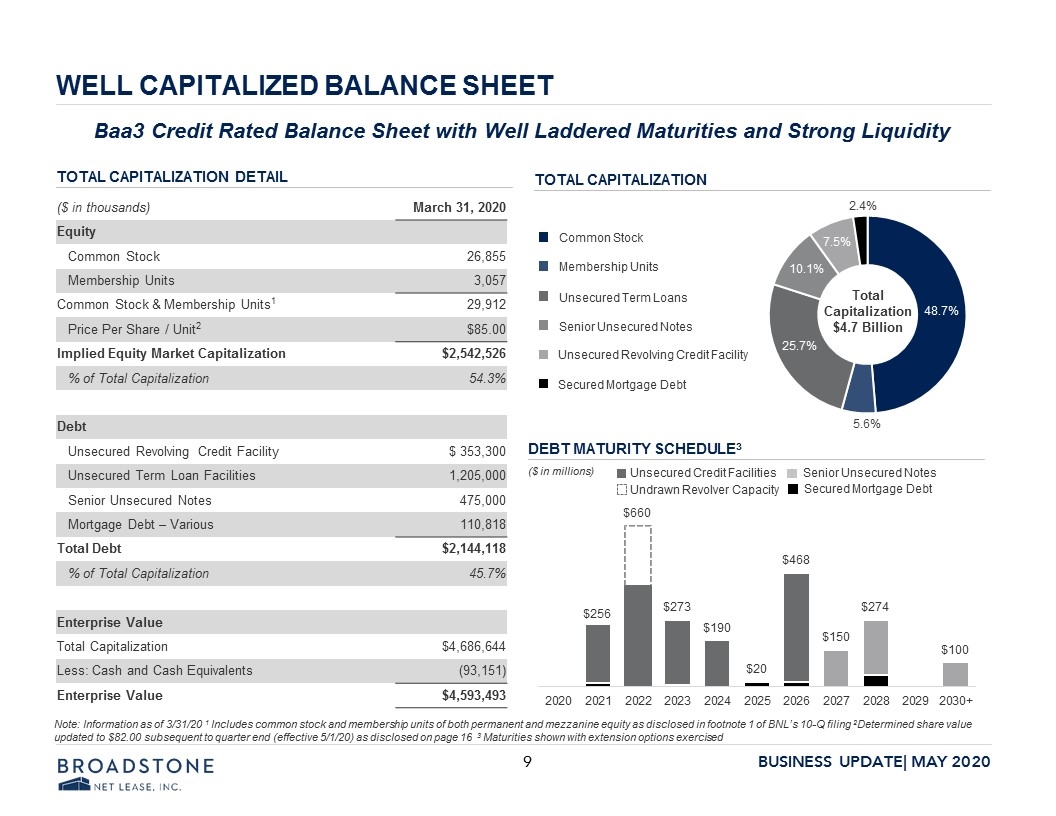
WELL CAPITALIZED BALANCE SHEET ($ in thousands) March 31, 2020 Equity Common Stock 26,855 Membership Units 3,057 Common Stock & Membership Units1 29,912 Price Per Share / Unit2 $85.00 Implied Equity Market Capitalization $2,542,526 % of Total Capitalization 54.3% Debt Unsecured Revolving Credit Facility $ 353,300 Unsecured Term Loan Facilities 1,205,000 Senior Unsecured Notes 475,000 Mortgage Debt – Various 110,818 Total Debt $2,144,118 % of Total Capitalization 45.7% Enterprise Value Total Capitalization $4,686,644 Less: Cash and Cash Equivalents (93,151) Enterprise Value $4,593,493 TOTAL CAPITALIZATION DETAIL Baa3 Credit Rated Balance Sheet with Well Laddered Maturities and Strong Liquidity TOTAL CAPITALIZATION DEBT MATURITY SCHEDULE3 Common Stock Membership Units Unsecured Term Loans Senior Unsecured Notes Unsecured Revolving Credit Facility Secured Mortgage Debt Total Capitalization $4.7 Billion ($ in millions) Unsecured Credit Facilities Undrawn Revolver Capacity Senior Unsecured Notes Secured Mortgage Debt Note: Information as of 3/31/20 1 Includes common stock and membership units of both permanent and mezzanine equity as disclosed in footnote 1 of BNL’s 10-Q filing 2Determined share value updated to $82.00 subsequent to quarter end (effective 5/1/20) as disclosed on page 16 3 Maturities shown with extension options exercised 2.4% 7.5% 10.1% 25.7% 5.6% 48.7% 2020 2021 $256 2022 $660 2023 $273 2024 $190 2025 $20 2026 $468 2027 $150 2028 $274 $ 2029 2030+ $100 BROADSTONE NET LEASE INC. 9 BUSINESS UPDATE MAY 2020
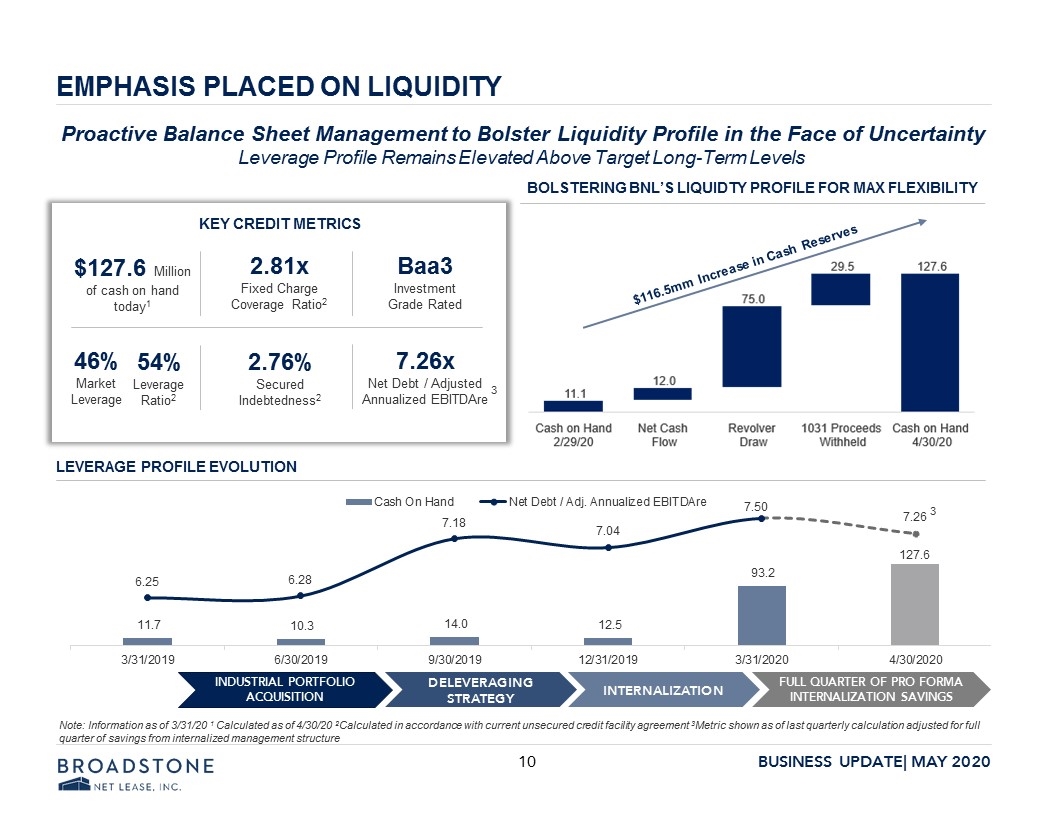
EMPHASIS PLACED ON LIQUIDITY $116.5mm Increase in Cash Reserves Note: Information as of 3/31/20 1 Calculated as of 4/30/20 2Calculated in accordance with current unsecured credit facility agreement 3Metric shown as of last quarterly calculation adjusted for full quarter of savings from internalized management structure INDUSTRIAL PORTFOLIO ACQUISITION DELEVERAGING STRATEGY INTERNALIZATION FULL QUARTER OF PRO FORMA INTERNALIZATION SAVINGS LEVERAGE PROFILE EVOLUTION BOLSTERING BNL’S LIQUIDTY PROFILE FOR MAX FLEXIBILITY $127.6 Million of cash on hand today1 Proactive Balance Sheet Management to Bolster Liquidity Profile in the Face of Uncertainty Leverage Profile Remains Elevated Above Target Long-Term Levels 2.81x Fixed Charge Coverage Ratio2 54% Leverage Ratio2 2.76% Secured Indebtedness2 7.26x Net Debt / Adjusted Annualized EBITDAre Baa3 Investment Grade Rated KEY CREDIT METRICS 3 46% Market Leverage 3 Cash on Hand 2/29/20 11.1 Net Cash Flow 12.0 Revolver Draw 75.0 1031 Proceeds Withheld29.5 Cash on Hand 127.6 Cash on Hand Net Debt/ Adj. Annualized EBITDAre 3/31/2019 11.7 6.25 6/30/2019 10.3 6.28 9/30/2019 14.0 7.18 12/31/2019 12.5 7.04 3/31/2020 93.2 7.50 4/30/2020 127.6 7.26 3 BROADSTONE NET LEASE INC. 10 BUSINESS UPDATE MAY 2020
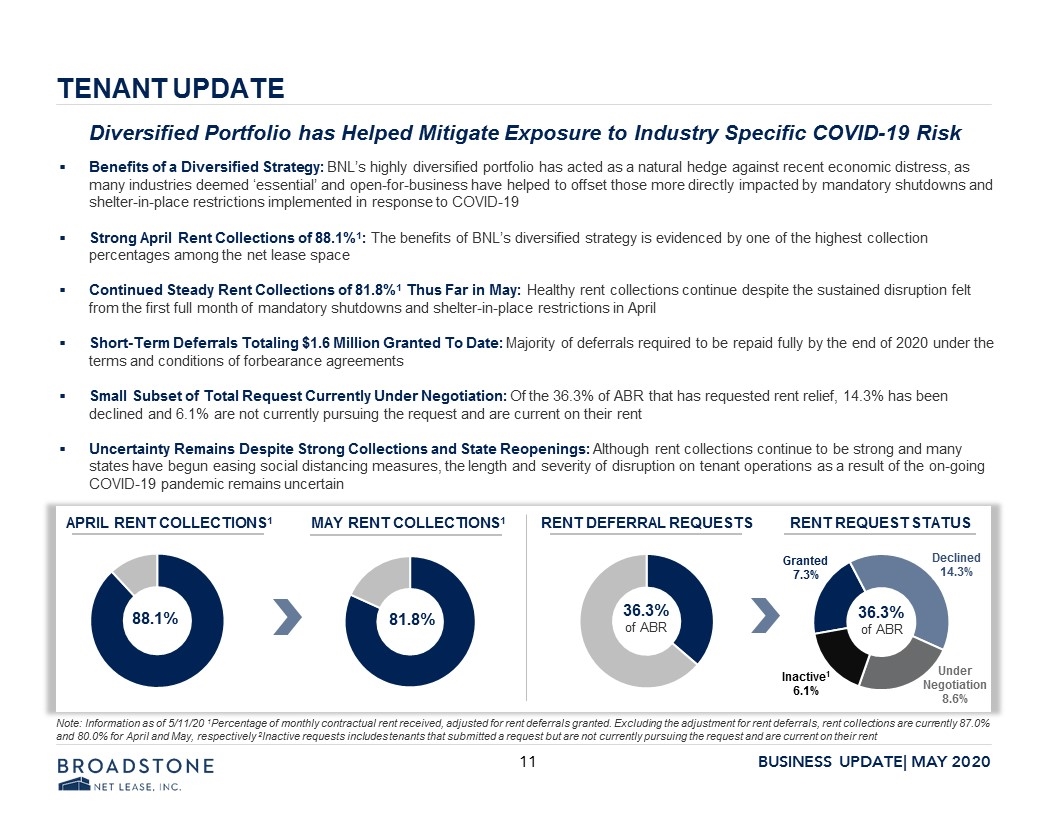
TENANT UPDATE Benefits of a Diversified Strategy: BNL’s highly diversified portfolio has acted as a natural hedge against recent economic distress, as many industries deemed ‘essential’ and open-for-business have helped to offset those more directly impacted by mandatory shutdowns and shelter-in-place restrictions implemented in response to COVID-19 Strong April Rent Collections of 88.1%1: The benefits of BNL’s diversified strategy is evidenced by one of the highest collection percentages among the net lease space Continued Steady Rent Collections of 81.8%1 Thus Far in May: Healthy rent collections continue despite the sustained disruption felt from the first full month of mandatory shutdowns and shelter-in-place restrictions in April Short-Term Deferrals Totaling $1.6 Million Granted To Date: Majority of deferrals required to be repaid fully by the end of 2020 under the terms and conditions of forbearance agreements Small Subset of Total Request Currently Under Negotiation: Of the 36.3% of ABR that has requested rent relief, 14.3% has been declined and 6.1% are not currently pursuing the request and are current on their rent Uncertainty Remains Despite Strong Collections and State Reopenings: Although rent collections continue to be strong and many states have begun easing social distancing measures, the length and severity of disruption on tenant operations as a result of the on-going COVID-19 pandemic remains uncertain 88.1% 81.8% 36.3% of ABR APRIL RENT COLLECTIONS1 MAY RENT COLLECTIONS1 RENT DEFERRAL REQUESTS RENT REQUEST STATUS Granted 7.3% Declined 14.3% Inactive1 6.1% 36.3% of ABR Under Negotiation 8.6% Diversified Portfolio has Helped Mitigate Exposure to Industry Specific COVID-19 Risk Note: Information as of 5/11/20 1Percentage of monthly contractual rent received, adjusted for rent deferrals granted. Excluding the adjustment for rent deferrals, rent collections are currently 87.0% and 80.0% for April and May, respectively 2Inactive requests includes tenants that submitted a request but are not currently pursuing the request and are current on their rent BROADSTONE NET LEASE INC. 11 BUSINESS UPDATE MAY 2020
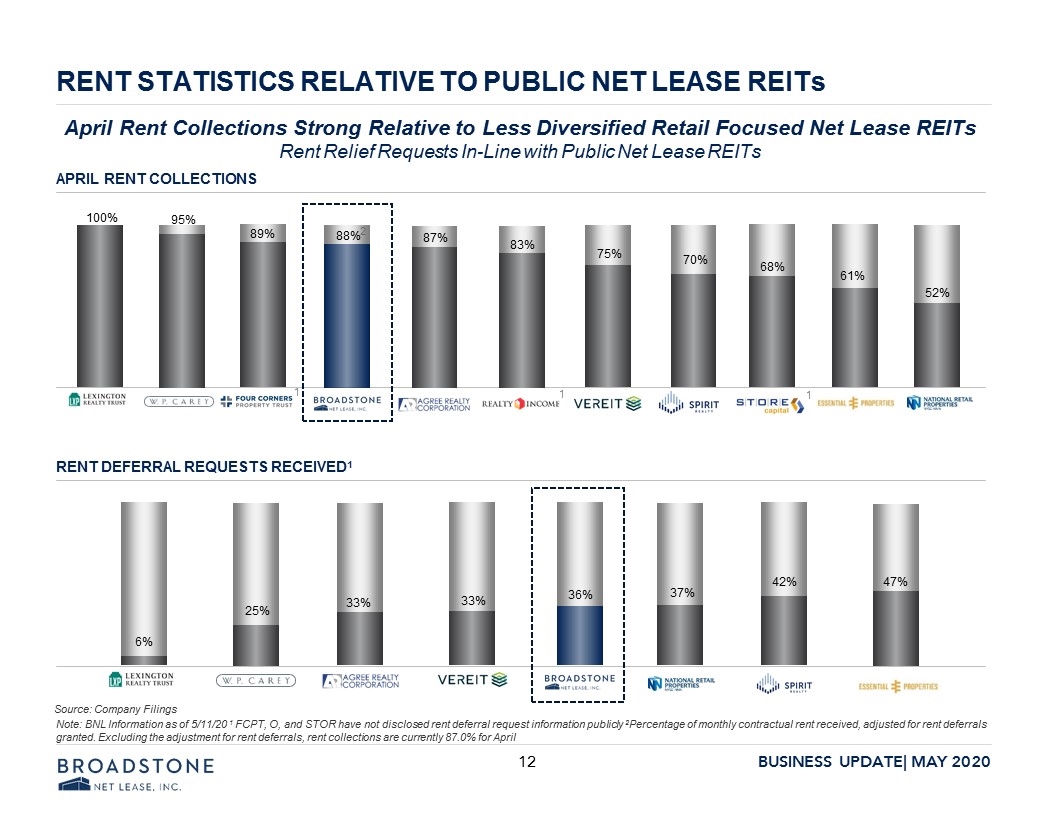
RENT STATISTICS RELATIVE TO PUBLIC NET LEASE REITs APRIL RENT COLLECTIONS RENT DEFERRAL REQUESTS RECEIVED1 Source: Company Filings April Rent Collections Strong Relative to Less Diversified Retail Focused Net Lease REITs Rent Relief Requests In-Line with Public Net Lease REITs Note: BNL Information as of 5/11/20 1 FCPT, O, and STOR have not disclosed rent deferral request information publicly 2Percentage of monthly contractual rent received, adjusted for rent deferrals granted. Excluding the adjustment for rent deferrals, rent collections are currently 87.0% for April 1 1 1 2 BROADSTONE NET LEASE INC. 12 BUSINESS UPDATE MAY 2020
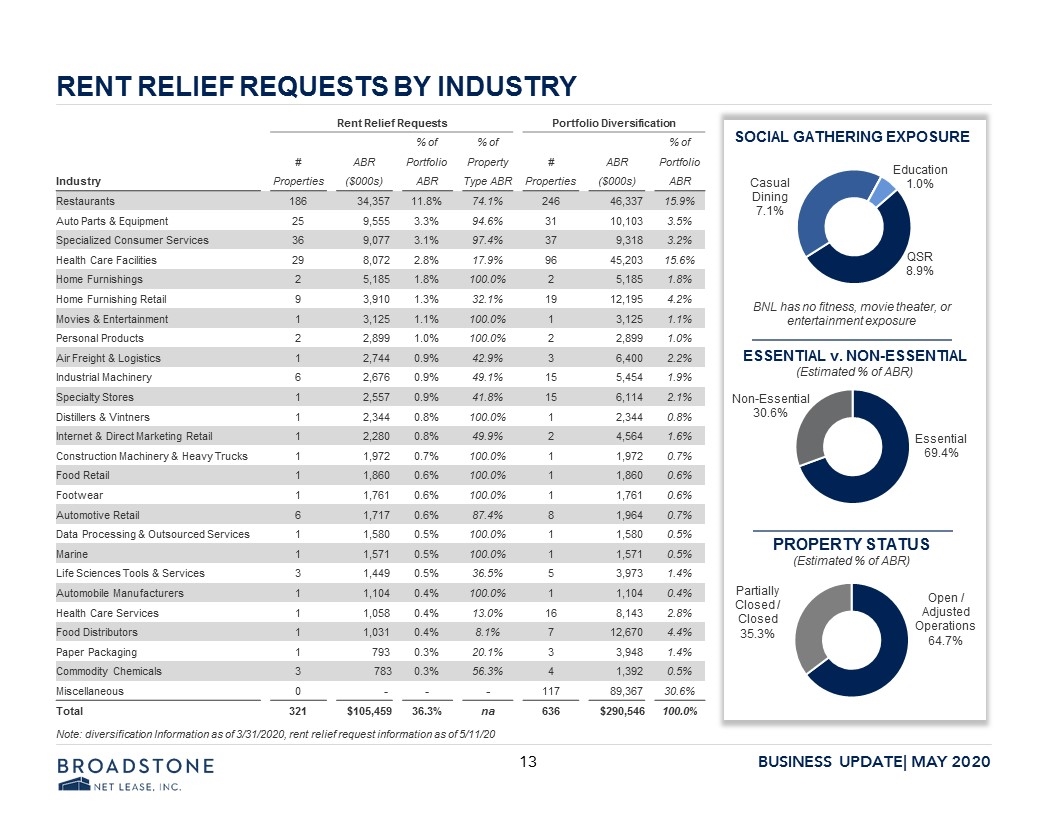
RENT RELIEF REQUESTS BY INDUSTRY Rent Relief Requests Portfolio Diversification % of % of % of # ABR Portfolio Property # ABR Portfolio Industry Properties ($000s) ABR Type ABR Properties ($000s) ABR Restaurants 186 34,357 11.8% 74.1% 246 46,337 15.9% Auto Parts & Equipment 25 9,555 3.3% 94.6% 31 10,103 3.5% Specialized Consumer Services 36 9,077 3.1% 97.4% 37 9,318 3.2% Health Care Facilities 29 8,072 2.8% 17.9% 96 45,203 15.6% Home Furnishings 2 5,185 1.8% 100.0% 2 5,185 1.8% Home Furnishing Retail 9 3,910 1.3% 32.1% 19 12,195 4.2% Movies & Entertainment 1 3,125 1.1% 100.0% 1 3,125 1.1% Personal Products 2 2,899 1.0% 100.0% 2 2,899 1.0% Air Freight & Logistics 1 2,744 0.9% 42.9% 3 6,400 2.2% Industrial Machinery 6 2,676 0.9% 49.1% 15 5,454 1.9% Specialty Stores 1 2,557 0.9% 41.8% 15 6,114 2.1% Distillers & Vintners 1 2,344 0.8% 100.0% 1 2,344 0.8% Internet & Direct Marketing Retail 1 2,280 0.8% 49.9% 2 4,564 1.6% Construction Machinery & Heavy Trucks 1 1,972 0.7% 100.0% 1 1,972 0.7% Food Retail 1 1,860 0.6% 100.0% 1 1,860 0.6% Footwear 1 1,761 0.6% 100.0% 1 1,761 0.6% Automotive Retail 6 1,717 0.6% 87.4% 8 1,964 0.7% Data Processing & Outsourced Services 1 1,580 0.5% 100.0% 1 1,580 0.5% Marine 1 1,571 0.5% 100.0% 1 1,571 0.5% Life Sciences Tools & Services 3 1,449 0.5% 36.5% 5 3,973 1.4% Automobile Manufacturers 1 1,104 0.4% 100.0% 1 1,104 0.4% Health Care Services 1 1,058 0.4% 13.0% 16 8,143 2.8% Food Distributors 1 1,031 0.4% 8.1% 7 12,670 4.4% Paper Packaging 1 793 0.3% 20.1% 3 3,948 1.4% Commodity Chemicals 3 783 0.3% 56.3% 4 1,392 0.5% Miscellaneous 0 - - - 117 89,367 30.6% Total 321 $105,459 36.3% na 636 $290,546 100.0% PROPERTY STATUS (Estimated % of ABR) ESSENTIAL v. NON-ESSENTIAL (Estimated % of ABR) SOCIAL GATHERING EXPOSURE QSR 8.9% Casual Dining 7.1% Education 1.0% BNL has no fitness, movie theater, or entertainment exposure Essential 69.4% Non-Essential 30.6% Open / Adjusted Operations 64.7% Partially Closed / Closed 35.3% Note: diversification Information as of 3/31/2020, rent relief request information as of 5/11/20 BROADSTONE NET LEASE INC. 13 BUSINESS UPDATE MAY 2020
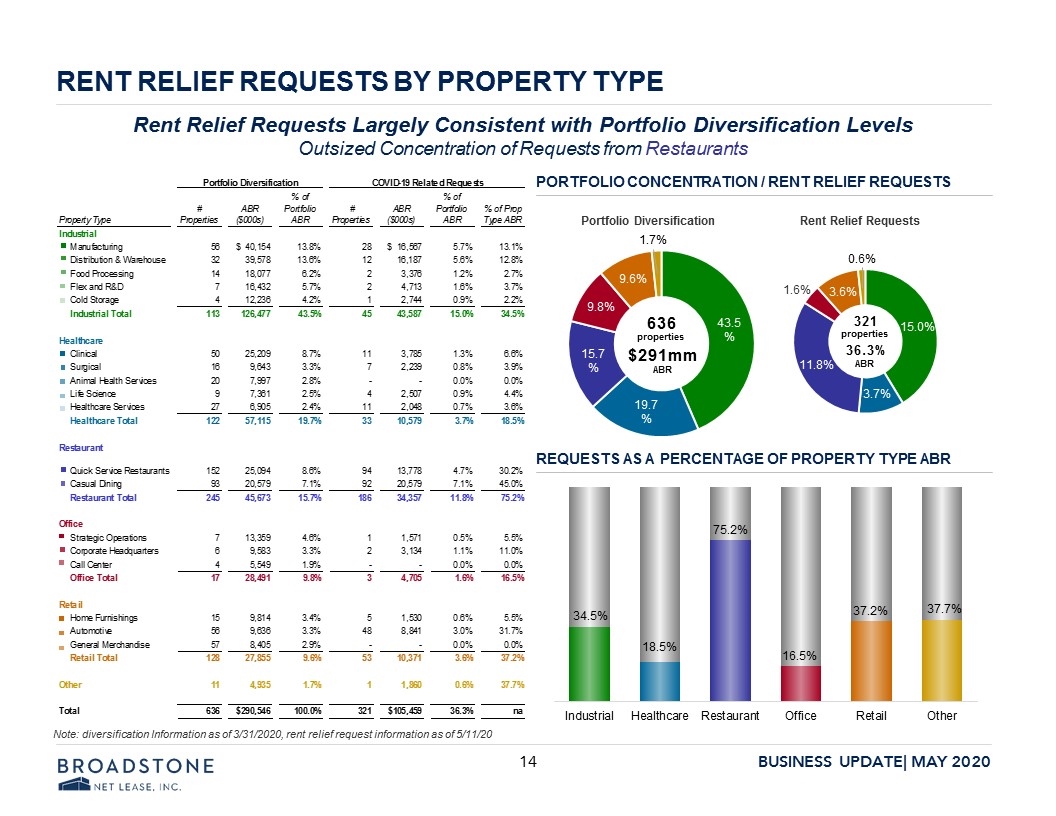
RENT RELIEF REQUESTS BY PROPERTY TYPE PORTFOLIO CONCENTRATION / RENT RELIEF REQUESTS REQUESTS AS A PERCENTAGE OF PROPERTY TYPE ABR Portfolio Diversification Rent Relief Requests 636 properties $291mm ABR 321 properties 36.3% ABR Rent Relief Requests Largely Consistent with Portfolio Diversification Levels Outsized Concentration of Requests from Restaurants Note: diversification Information as of 3/31/2020, rent relief request information as of 5/11/20 9.6% 9.8% 15.7% 19.7% 43.5% 36.% 11.8% 3.7% 15.0% 1.6% 0.6% 1.7% 34.5% 18.5% 75.2% 16.5% 37.2% 37.7% BROADSTONE NET LEASE INC. 14 BUSINESS UPDATE MAY 2020 Portfolio Diversification COVID-19 Related Requests Property Type #Properties ABR ($000s) % of Portfolio ABR # Properties ABR ($000s) % of Portfolio ABR % of Prop Type ABR Industrial Manufacturing 56 $40,154.279040000001 0.13820296415134495 28 $16,566.756000000001 5.7% 0.13098583002741956 Distribution & Warehouse 32 39,578.411999999997 0.13622094545277036 12 16,187.16 5.6% 0.12798453652523431 Food Processing 14 18,076.655999999999 6.2% 2 3,375.5520000000001 1.2% 2.7% Flex and R&D 7 16,432.284 5.7% 2 4,712.7719999999999 1.6% 3.7% Cold Storage 4 12,235.835999999999 4.2% 1 2,744.4 .9% 2.2% Industrial Total 113 ,126,477.46704 0.43531004070250223 45 43,586.64 0.15001646124431517 0.34461980477688731 Healthcare Clinical 50 25,208.903999999999 8.7% 10.5 3,784.68 1.3% 6.6% Surgical 16 9,642.7440000000006 3.3% 7 2,239.44 .8% 3.9% Animal Health Services 20 7,996.9080000000004 2.8% 0 0 0.0% 0.0% Life Science 9 7,360.9080000000004 2.5% 4 2,507.4 .9% 4.4% Healthcare Services 27 6,905 2.4% 11 2,047.62 .7% 3.6% Healthcare Total 122 57,115.8000000009 0.1965783869575804 32.5 10,578.779999999999 3.7% 0.18521891829201875 Restaurant Quick Service Restaurants 152 25,094 8.6% 94 13,778.316000000001 4.7% 0.30167179002128164 Casual Dining 93 20,578.691999999999 7.8% 92 20,578.691999999999 7.8% 0.45 Restaurant Total 245 45,673.2 0.15719798171421004 186 34,357.8000000002 0.11824992151500154 0.75223562176506142 Office Strategic Operations 7 13,358.736000000001 4.6% 1 1,571.2560000000001 .5% 5.5% Corporate Headquarters 6 9,582.6119999999992 3.3% 2 3,133.9319999999998 1.8% 0.10999925448791956 Call Center 4 5,549.1360000000004 1.9% 0 0 0.0% 0.0% Office Total 17 28,491 9.8% 3 4,705.1880000000001 1.6% 0.16514945832440053 Retail Home Furnishings 15 9,814.3439999999991 3.4% 5 1,529.7 .6% 5.5% Automotive 56 9,635.7240000000002 3.3% 48 8,841.2880000000005 3.4% 0.31740986478155553 General Merchandise 57 8,405 2.9% 0 0 0.0% 0.0% Retail Total 128 27,855 9.6% 53 10,370.988000000001 3.6% 0.37232741414272841 Other 11 4,935.720000000001 1.7% 1 1,860 .6% 0.37689419728830703 Total 636 $,290,545.71503999998 1.0000000000000002 320.5 $,105,458.60399999999 0.36296733540014969 na 1 Industrial Manufacturing 0.13820296415134495 2 Industrial Distribution & Warehouse 0.13622094545277036 3 Industrial Food Processing 6.2% 4 Industrial Flex and R&D 5.7% 5 Industrial Cold Storage 4.2% 6 Restaurant Quick Service Restaurants 8.6% 7 Restaurant Casual Dining 7.8% 8 Healthcare Clinical 8.7% 9 Office Strategic Operations 4.6% 10 Retail Automotive 3.4% Other All Other 0.24097090535429566 Industrial 0.34461980477688731 0.65538019522311264 Healthcare 0.18521891829201875 0.81478108170798125 Restaurant 0.75223562176506142 0.24776437823493858 Office 0.16514945832440053 0.83485054167559947 Retail 0.37232741414272841 0.62767258585727159 Other 0.37689419728830703 0.62310580271169291 Industrial 0.43531004070250223 0.15001646124431517 Healthcare 0.1965783869575804 3.6999999999999998E-2 Restaurant 0.15719798171421004 0.11824992151500154 Office 9.8058524098617872E-2 1.6194312138976916E-2 Retail 9.586953982840607E-2 3.5694857859363736E-2 Other 1.6985526698683473E-2 6.4017464506194157E-3
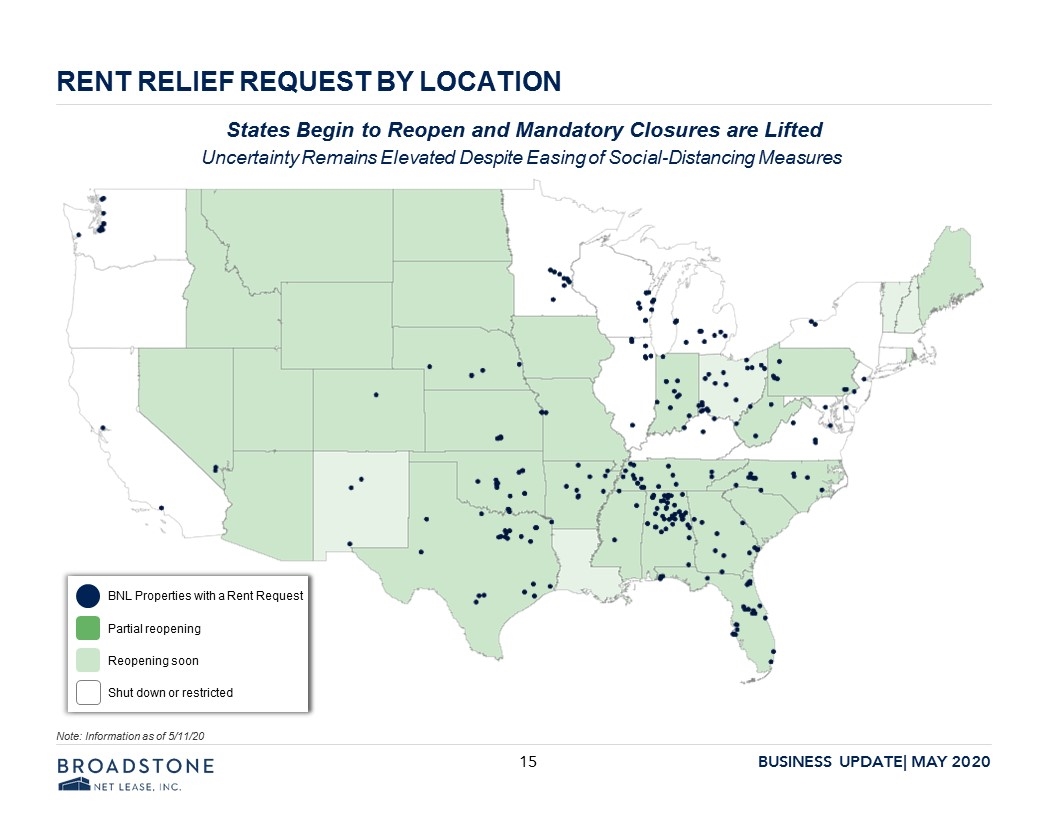
RENT RELIEF REQUEST BY LOCATION States Begin to Reopen and Mandatory Closures are Lifted Uncertainty Remains Elevated Despite Easing of Social-Distancing Measures Note: Information as of 5/11/20 Partial reopening Reopening soon Shut down or restricted BNL Properties with a Rent Request BROADSTONE NET LEASE INC. 15 BUSINESS UPDATE MAY 2020
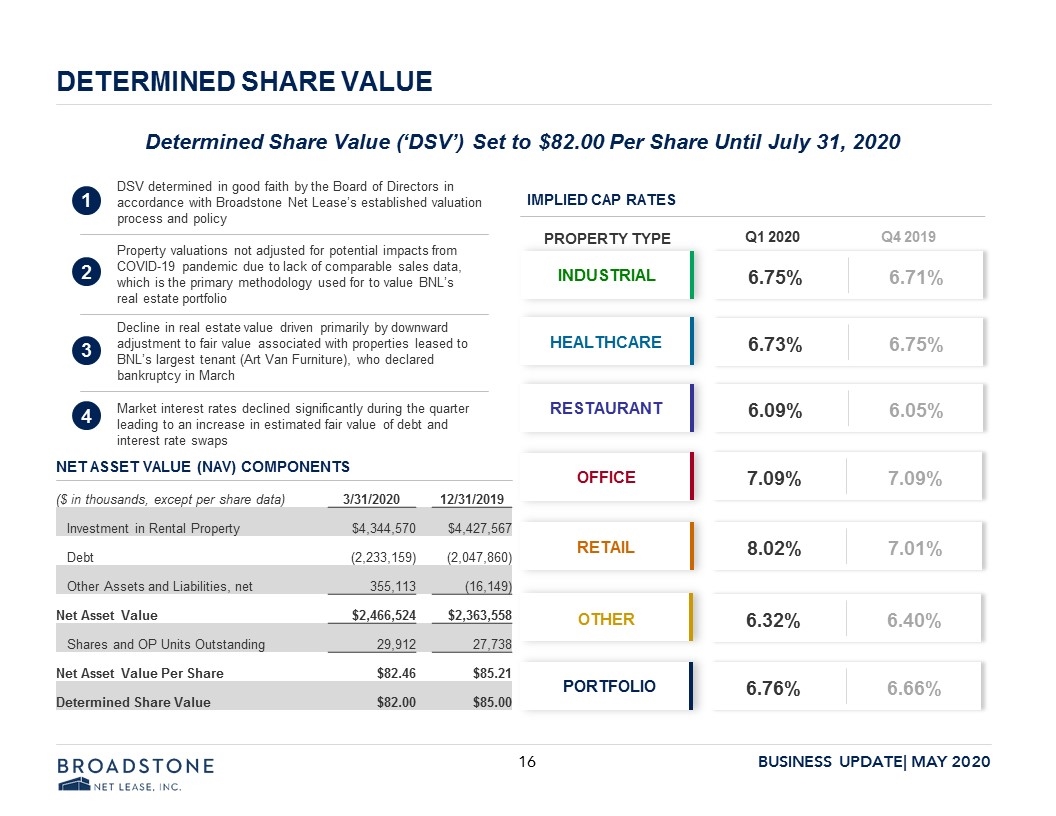
DETERMINED SHARE VALUE ($ in thousands, except per share data) 3/31/2020 12/31/2019 Investment in Rental Property $4,344,570 $4,427,567 Debt (2,233,159) (2,047,860) Other Assets and Liabilities, net 355,113 (16,149) Net Asset Value $2,466,524 $2,363,558 Shares and OP Units Outstanding 29,912 27,738 Net Asset Value Per Share $82.46 $85.21 Determined Share Value $82.00 $85.00 6.75% 6.71% INDUSTRIAL HEALTHCARE Determined Share Value (‘DSV’) Set to $82.00 Per Share Until July 31, 2020 IMPLIED CAP RATES NET ASSET VALUE (NAV) COMPONENTS RESTAURANT RETAIL PORTFOLIO OTHER OFFICE PROPERTY TYPE Q1 2020 Q4 2019 6.73% 6.75% 6.09% 6.05% 7.09% 7.09% 8.02% 7.01% 6.32% 6.40% 6.76% 6.66% 1 2 3 Property valuations not adjusted for potential impacts from COVID-19 pandemic due to lack of comparable sales data, which is the primary methodology used for to value BNL’s real estate portfolio 4 DSV determined in good faith by the Board of Directors in accordance with Broadstone Net Lease’s established valuation process and policy Decline in real estate value driven primarily by downward adjustment to fair value associated with properties leased to BNL’s largest tenant (Art Van Furniture), who declared bankruptcy in March Market interest rates declined significantly during the quarter leading to an increase in estimated fair value of debt and interest rate swaps BROADSTONE NET LEASE INC. 16 BUSINESS UPDATE MAY 2020
OTHER STRATEGIC ITEMS Given the Economic Uncertainty and Rapidly Evolving Circumstances Related to the COVID-19 Pandemic, the Board of Directors has determined BNL will Temporarily Suspend its Current Monthly Distribution Previously announced distribution of $0.44 per share for the month of April (record date 4/29/2020) is payable on May 15th Decision to temporarily suspend distribution made out of an abundance of caution and driven by effort to protect long-term shareholder value The board will re-evaluate whether or not to reinstate a distribution at its August 2020 meeting Will also evaluate the appropriate payout ratio and payment frequency for any future distributions The suspension of private capital raise and the termination of the distribution reinvestment and redemption programs will also be re-evaluated by the Board of Directors in August BNL intends to maintain REIT status and will make a special distribution in 2020 if it becomes necessary to do so based on the ultimate decisions with respect to future distributions 1 2 3 4 5 6 BROADSTONE NET LEASE INC. 17 BUSINESS UPDATE MAY 2020
LOOKING FORWARD - KEY FOCUS AREAS FOR BNL Focus on asset management of the portfolio as top priority Work to maintain consistent level of rent collections Take efforts to preserve strong liquidity position and maximum financial flexibility Negotiate rent deferrals only when necessary with a focus on limited payback period and incremental value enhancements for shareholders Consistent and transparent communication with all stakeholders Monitor markets closely for signs of opportunity and healing Proceed with caution…not panic BROADSTONE NET LEASE INC. 18 BUSINESS UPDATE MAY 2020
Q&A SESSION

INVESTOR RELATIONS CONTACTS DAN BLASI VICE PRESIDENT, INVESTOR RELATIONS dan.blasi@broadstone.com 585.287.6504 NICOLE CALCAGNI DIRECTOR, INVESTOR RELATIONS nicole.calcagni@broadstone.com 585.287.6476 BROADSTONE NET LEASE INC. 20 BUSINESS UPDATE MAY 2020
ADDITIONAL INFORMATION
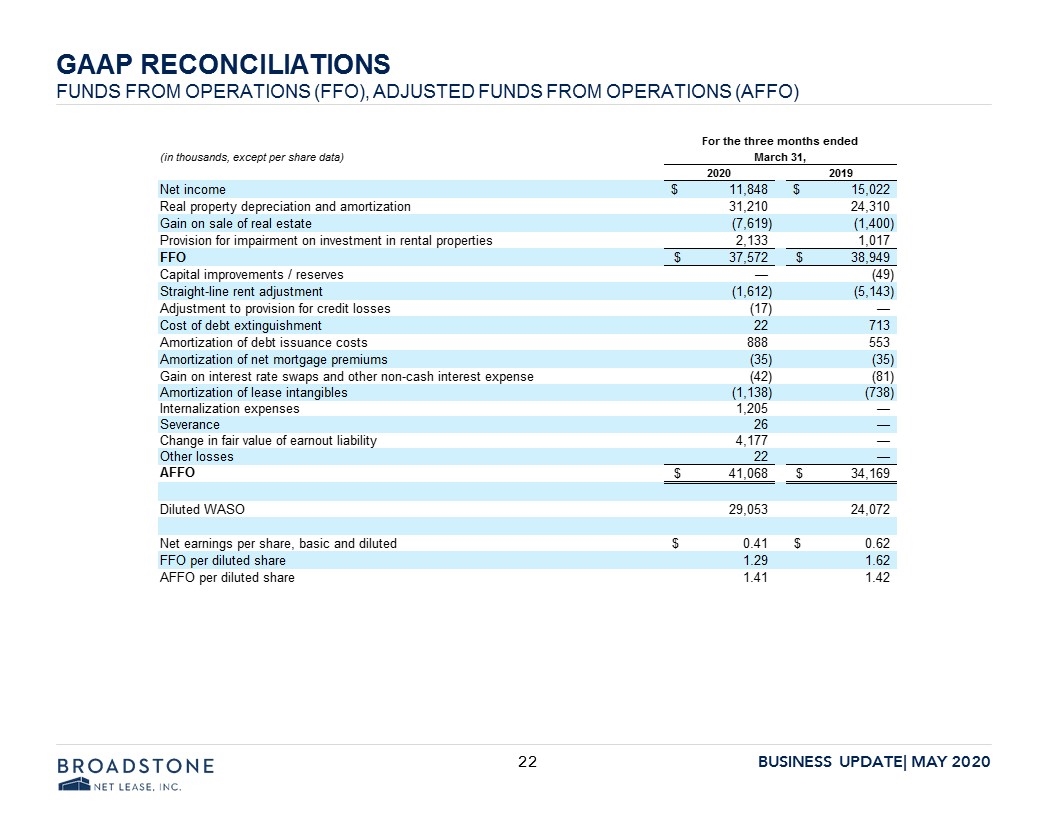
GAAP RECONCILIATIONS FUNDS FROM OPERATIONS (FFO), ADJUSTED FUNDS FROM OPERATIONS (AFFO) GAAP RECONCILIATIONS FUNDS FROM OPERATIONS (FFO), ADJUSTED FUNDS FROM OPERATIONS (AFFO) (in thousands, except per share data) For the three months ended March 31 2020 2019 Net Income $ 11,848 $ 15,022 Real property depreciation and amortization 31,210 24,310 Gain on sale for real estate (7,619) (1,400) Provision for impairment on investment in rental properties 2,133 1,017 FFO $ 37,572 $ 38,949 Capital improvements/reserves – (49)Straight-line rent adjustment (1,612) (5,143) Adjustment to provision for credit losses (17) – Cost of debt extinguishment 22 713 Amortization of debt issuance costs 888 553 Amortization of net mortgage premiums (35) (35) gain on interest rate swaps and other non-cash interest expense (42) (81) Amortization of lease intangibles (1,138) (738) Internalization expenses 1,205 – Severance 26 – Change in fair value of earnout liability 4,117 – Other Losses 22 – AFFO $ 41,068 $ 34,169 Diluted WASO 29,053 24,072 Net earning per share, basic and diluted $0.41 $ 0.62 FFO per diluted share 1.29 1.62 AFFO per diluted share 1.41 1.42 BROADSTONE NET LEASE INC. 22 BUSINESS UPDATE MAY 2020
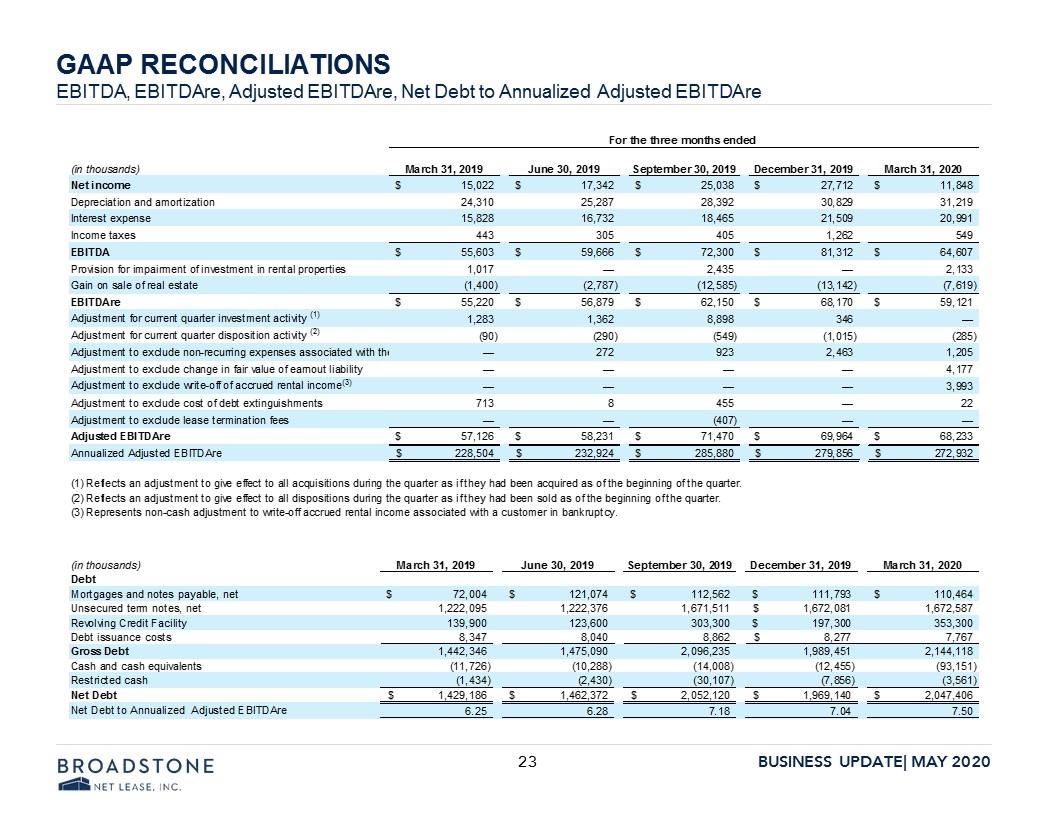
GAAP RECONCILIATIONS EBITDA, EBITDAre, Adjusted EBITDAre, Net Debt to Annualized Adjusted EBITDAre GAAP RECONCILIATIONS EBITDA, EBITDAre, Adjusted EBITDAre, Net Debt to Annualized Adjusted EBITDAre For the three months ended March 31, 2019 June 30, 2019 September 30, 2019 December 31, 2019 March 31, 2020 (in thousands) Net income $ 15,022 $ 17,342 $ 25,038 $ 27,712 $ 11,848 Depreciation and amortization 24,310 25,287 28,392 30,829 31,219 Interest expense 15,828 16,732 18,465 21,509 20,991 Income taxes 443 305 405 1,262 549 EBITDA $ 55,603 $ 59,666 $ 72,300 $ 81,312 $ 64,607 Provision for impairment of investment in rental properties 1,017 – 2,435 – 2,133 Gain on sale of real estate (1,400) (2,787) (12,585) (13,142) (7,619) EBITDAre $ 55,220 $ 56,879 $ 62,150 $ 68,170 $ 59,121 Adjustment for current quarter investment activity(1) 1,283 1,362 8,898 346 - Adjustment for current quarter disposition activity(2) (90) (290) (549) (1,015) (285) Adjustment to exclude non-recurring expenses associated with the – 272 923 2,463, 1,205 Adjustment to exclude change in fair value of earnout liability - - - - 4,177 Adjustment to exclude write-off accrued rental income(3) - - - - 3,993 Adjustment to exclude cost of debt extinguishments 713 8 455 – 22 Adjustment to exclude lease termination fees - - (407) - - Adjusted EBITDAre $ 57,126 $58,231 $ 71,470 $ 69,964 $ 68,233 Annualized Adjusted EBITDAre $ 228,504 $ 232,924 $285,880, $279,856 $ 272,932 (1) Reflects an adjustment to give effect to all acquisitions during the quarter as if they had been acquired as of the beginning of the quarter. (2) Reflects an adjustment to give effect to all disposition during the quarter as if they had sold as of the beginning of the quarter. (3) Represents non-cash adjustment to write-off accrued rental income associated with a customer in bankruptcy. March 31, 2019 June 30, 2019 September 30, 2019 December 31, 2019 March 31, 2020 (in thousands) Debt Mortgages and notes payable, net $ 72,004 $121,074 $ 112,562 $ 111,793, $110,464 Unsecured term note, net 1,222,095 1,222,376 1,671,511 $ 1,672,081 1,672,587 Revolving Credit Facility 139,900 123,600 303,300 $ 197,300 353,300 Debt issuance costs 8,347 8,040 8,862 $ 8,277 7,767 Gross Debt 1,442,346 1,475,090 2,096,235 1,989,451 2,144,118 Cash and cash equivalents (11,726) (10,288) (14,008) (12,455) (95,151) Restricted cash (1,434) (2,430) (30,107) (7,856) (3,561) Net Debt $ 1,429,186 $ 1,462,372 $ 2,052,120 $ 1,969,140 $ 2,047,406 Net Debt to Annualized Adjusted EBITDAre 6.25 6.28 7.18 7.04 7.50 BROADSTONE NET LEASE INC. 23 BUSINESS UPDATE MAY 2020


