UNITED STATES
SECURITIES AND EXCHANGE COMMISSION
Washington, D.C. 20549
Form 10-K
(Mark One)
| x | ANNUAL REPORT PURSUANT TO SECTION 13 OR 15(d) OF THE SECURITIES |
For the fiscal year ended December 31, 2014
Or
| ¨ | TRANSITION REPORT PURSUANT TO SECTION 13 OR 15(d) OF THE SECURITIES |
For the transition period from to
Commission File No. 001-36640
Travelport Worldwide Limited
(Exact name of registrant as specified in its charter)
| | |
| Bermuda | | 98-0505105 |
(State or other jurisdiction of incorporation or organization) | | (I.R.S. Employer Identification Number) |
Axis One, Axis Park
Langley, Berkshire, United Kingdom SL3 8AG
(Address of principal executive offices, including zip code)
+44-1753-288-000
(Registrant’s telephone number, including area code)
SECURITIES REGISTERED PURSUANT TO SECTION 12(b) OF THE ACT:
| | |
| Title of Each Class | | Name of Each Exchange on Which Registered |
| Common Shares, Par Value $0.0025 | | New York Stock Exchange |
SECURITIES REGISTERED PURSUANT TO SECTION 12(g) OF THE ACT: None.
Indicate by check mark if the registrant is a well-known seasoned issuer, as defined in Rule 405 of the Securities Act. Yes ¨ No x
Indicate by check mark if the registrant is not required to file reports pursuant to Section 13 or Section 15(d) of the Act. Yes ¨ No x
Indicate by check mark whether the registrant: (1) has filed all reports required to be filed by Section 13 or 15(d) of the Securities Exchange Act of 1934 during the preceding 12 months (or for such shorter period that the registrant was required to file such reports), and (2) has been subject to such filing requirements for the past 90 days. Yes x No ¨
Indicate by check whether the registrant has submitted electronically and posted on its corporate website, if any, every interactive data file required to be submitted and posted pursuant to Rule 405 of Regulation S-T during the preceding 12 months (or for such shorter period that the registrant was required to submit and post such files. Yes x No ¨
Indicate by check mark if disclosure of delinquent filers pursuant to Item 405 of Regulation S-K is not contained herein, and will not be contained, to the best of registrant’s knowledge, in definitive proxy or information statements incorporated by reference in Part III of this Form 10-K or any amendment to this Form 10-K. x
Indicate by check mark whether the registrant is a large accelerated filer, an accelerated filer, a non-accelerated filer or a smaller reporting company. See definitions of “large accelerated filer,” “accelerated filer” and “smaller reporting company” in Rule 12b-2 of the Exchange Act.
| | | | | | |
| Large accelerated filer ¨ | | Accelerated filer ¨ | | Non-accelerated filer x | | Smaller reporting company ¨ |
(Do not check if a smaller reporting company)
Indicate by check mark whether the registrant is a shell company (as defined in Rule 12b-2 of the Exchange Act). Yes ¨ No x
The aggregate market value of the voting and non-voting common equity held by non-affiliates computed by reference to the closing price on the New York Stock Exchange as of the last business day of the Registrant’s most recently completed second fiscal quarter is not available because the Registrant’s common shares did not begin trading until September 25, 2014.
As of February 27, 2015, there were 121,411,360 common shares of the Registrant, par value $0.0025, outstanding.
DOCUMENTS INCORPORATED BY REFERENCE
None
TABLE OF CONTENTS
FORWARD-LOOKING STATEMENTS
The forward-looking statements contained herein involve risks and uncertainties. Many of the statements appear, in particular, in the sections entitled “Business”, “Risk Factors” and “Management’s Discussion and Analysis of Financial Condition and Results of Operations”. Forward-looking statements identify prospective information. Important factors could cause actual results to differ, possibly materially, from those in the forward-looking statements. In some cases you can identify forward-looking statements by words such as “anticipate”, “believe”, “could”, “estimate”, “expect”, “intend”, “may”, “plan”, “predict”, “potential”, “should”, “will” and “would” or other similar words. You should read statements that contain these words carefully because they discuss our future priorities, goals, strategies, actions to improve business performance, market growth assumptions and expectations, new products, product pricing, changes to our business processes, future business opportunities, capital expenditures, financing needs, financial position and other information that is not historical information. References within this Annual Report on Form 10-K to “we”, “our”, “us” or “Travelport” refer to Travelport Worldwide Limited, a Bermuda company, and its consolidated subsidiaries.
The following list represents some, but not necessarily all, of the factors that could cause actual results to differ from historical results of continuing operations or those anticipated or predicted by these forward-looking statements:
| | • | | factors affecting the level of travel activity, particularly air travel volume, including security concerns, pandemics, general economic conditions, natural disasters and other disruptions; |
| | • | | our ability to obtain travel provider inventory from travel providers, such as airlines, hotels, car rental companies, cruise lines and other travel providers; |
| | • | | our ability to maintain existing relationships with travel agencies and to enter into new relationships on acceptable financial and other terms; |
| | • | | our ability to develop and deliver products and services that are valuable to travel agencies and travel providers and generate new revenue streams; |
| | • | | the impact on travel provider capacity and inventory resulting from consolidation of the airline industry; |
| | • | | our ability to grow adjacencies, such as eNett, in which we own a majority interest; |
| | • | | general economic and business conditions in the markets in which we operate, including fluctuations in currencies, particularly in the U.S. dollar, and the economic conditions in the eurozone; |
| | • | | pricing, regulatory and other trends in the travel industry; |
| | • | | the impact our outstanding indebtedness may have on the way we operate our business; |
| | • | | our ability to achieve expected cost savings from our efforts to improve operational efficiency; and |
| | • | | maintenance and protection of our information technology and intellectual property. |
We caution you that the foregoing list of important factors may not contain all of the factors that are important to you. In addition, in light of these risks and uncertainties, the matters referred to in the forward-looking statements contained in this report may not in fact occur.
Forward-looking statements should not be read as a guarantee of future performance or results, and will not necessarily be accurate indications of the times at, or by which, such performance or results will be achieved. Forward-looking information is based on information available at the time and/or management’s good faith belief with respect to future events and is subject to risks and uncertainties that could cause actual performance or results to differ materially from those expressed in the statements. The factors listed in the section captioned “Risk Factors” in this Annual report on Form 10-K, provide examples of risks, uncertainties and events that may
1
cause actual results to differ materially from the expectations described in the forward-looking statements. You should be aware that the occurrence of the events described in these risk factors and elsewhere in this report could have an adverse effect on our business, results of operations, financial position and cash flows.
Forward-looking statements speak only as of the date the statements are made. We assume no obligation to update forward-looking statements to reflect actual results, changes in assumptions or changes in other factors affecting forward-looking information except to the extent required by applicable securities laws. If we do update one or more forward-looking statements, no inference should be drawn that we will make additional updates with respect thereto or with respect to other forward-looking statements. For any forward-looking statements contained in any document, we claim the protection of the safe harbor for forward-looking statements contained in the Private Securities Litigation Reform Act of 1995.
2
PART I
ITEM 1. BUSINESS
Overview
We are a leading travel commerce platform providing distribution, technology, payment and other solutions for the $7 trillion global travel and tourism industry. We facilitate travel commerce by connecting the world’s leading travel providers, such as airlines and hotel chains with online and offline travel agencies and other travel buyers in our proprietary business-to-business (“B2B”) travel commerce platform (our Travel Commerce Platform). We processed approximately $90 billion of travel spending in 2014. Our geographically dispersed footprint allows travel providers to generate high yielding and incremental global demand for their perishable and capital intensive travel inventory from customers living in non-domestic, or away, markets, in addition to serving their domestic, or home, markets. As travel industry needs evolve, we are utilizing our Travel Commerce Platform to redefine the electronic distribution and merchandising of airline core and ancillary products, as well as extending our reach into the growing world of travel commerce beyond air, including to hotel, car rental, rail, cruise-line and tour operators. In addition, we leveraged our domain expertise in the travel industry to design a unique and pioneering B2B payment solution that addresses the need of travel agencies to efficiently and securely make payments to travel providers globally. Through our global reach in over 170 countries, distinct merchandising platform with capabilities for value-added content and enhanced user experience, we offer a strong value proposition not only to travel providers, travel agencies and corporations, but also to end travelers. Our primarily transaction-based pricing model links our revenue to global travel passenger volume rather than travel spending, thus creating a stable and recurring business model with high revenue visibility.
Our Travel Commerce Platform connects travel providers and travel buyers, the latter of which includes travel agencies, Travel Management Companies (“TMCs”) and corporations. The diagram below illustrates our central role in global travel commerce as a provider of high value, real-time distribution services:
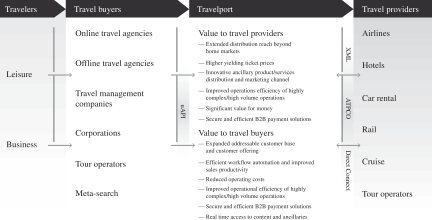
We believe that our Travel Commerce Platform combines state-of-the-art technology with industry leading features, functionality and innovative solutions to address the high-volume and growing transaction processing requirements for the evolving needs of the travel industry. In 2014, our systems processed up to 3 billion travel related system messages per day on an average transaction speed of 240 millisecond and over 9 billion Application Programming Interface (“API”) calls per month. Our advanced search technology aggregates global travel content, filters it through sophisticated search algorithms and presents it in a transparent and efficient workflow for travel agencies, enabling them to create and modify multi-content, multi-modular complex itineraries, issue travel documents, process millions of booking transactions and invoices and transfer secure, cost-effective and automated payments, all on a graphically rich, single user interface.
3
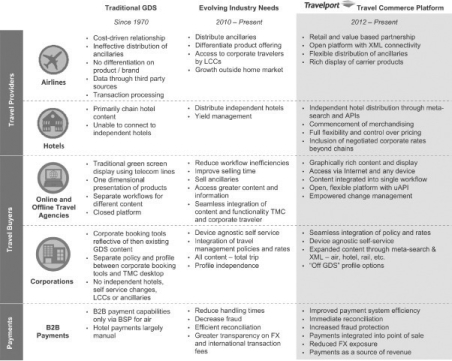
Since 2012, we have strategically invested approximately 580 million in products with a focus on redefining our Travel Commerce Platform to address the trends, inefficiencies and unmet needs of all components of the travel value chain: Air and Beyond Air, which include distribution and merchandising solutions for hotel, car rental, rail, cruise-line and tour operators, B2B travel payments, advertising and an array of additional platform services. For Air, we have transformed the traditional Global Distribution System (“GDS”) concept, which had very limited ancillary sales capabilities, into an open platform with eXtensible Markup Language (“XML”) connectivity and a graphically rich, single user interface to enable marketing and sales of not only full air content, but also full ancillary content. For Beyond Air, we have connected independent hotels, previously unable to reach corporate customers, to a global network of travel agencies through our meta-search technology, which combines search results from multiple sources and have given hotels the ability to display their full range of rates and packages in a one-stop booking portal. We have also pioneered a secure, cost-effective and automated B2B payment alternative to the traditional inefficient and costly methods for travel agencies to pay travel providers. Our Travel Commerce Platform creates synergies and network effects that facilitate revenue growth across the travel value chain. The chart below demonstrates the ways in which our Travel Commerce Platform has identified, addressed and redefined key elements of the travel value chain that are fully or partially unaddressed by traditional GDS providers:
Our Travel Commerce Platform Addresses the Evolving Needs of Our Industry
We provide air distribution services to approximately 400 airlines globally, including approximately 100 low cost carriers (“LCCs”). We distribute ancillaries for 25 airlines. In addition, we serve numerous Beyond Air travel providers, including over 650,000 hotel properties (of which over 550,000 are independent hotel properties), which, based on our internal estimates, is the largest inventory of hotel properties on any travel platform in the world, over 35,000 car rental locations and 61 cruise-line and tour operators. We aggregate travel content across over 67,000 travel agency locations representing 259,000 online and offline travel agency terminals worldwide, which in turn serve millions of end consumers globally. In 2014, we created over 170 million individual travel itineraries, handled over 355 million segments sold by travel agencies, issued 122 million airline tickets and sold over 63 million hotel room nights and 85 million car rental days. Our Travel
4
Commerce Platform provides real-time search, pricing, booking, change, payment and integrated itinerary creation for travelers who use the services of online and offline travel agencies for both leisure and business travel. Our access to business travelers, merchandising capabilities and ability to process complex itineraries have attracted and allowed for the full integration of several fast-growing LCCs such as AirAsia, easyJet, Ryanair and Spirit Airlines into our Travel Commerce Platform.
Through eNett International (Jersy) Limited (“eNett”), our majority-owned subsidiary and an early adopter in automated payments, we are redefining how travel agencies pay travel providers. When a consumer purchases an itinerary through a travel agency, the consumer pays using a variety of mechanisms, including cash, direct debit and credit card. Generally, the consumer makes one payment for the entire itinerary of flights, hotels and ground services, such as transfers. The travel agency then remits the individual payments to each travel provider. eNett’s core offering is a VAN payment solution that automatically generates unique MasterCard numbers used to process payments globally. Before eNett, travel payments were primarily settled in cash and exposed payers to risks of fraud, delays and costly reconciliations. The Virtual Account Number (“VAN”) solution is integrated into all of our point of sale systems and exclusively utilizes the MasterCard network pursuant to a long-term agreement. eNett’s operations currently focus on Asia Pacific and Europe, and we believe the model is highly scalable. We have expanded beyond the core hospitality sector into air travel, including LCCs, with further opportunities for growth in other sectors of the travel industry. eNett was formed in 2009, and eNett’s net revenue has grown from $2 million in 2011 to $67 million in 2014.
In addition to hospitality and payments, we utilize the broad connections and extensive data managed by our Travel Commerce Platform to provide advertising solutions to approximately 5,000 advertisers that allow our travel providers to easily and cost-effectively promote upgrades, ancillary products or services, package deals and other offers. We also offer other platform services, including subscription services, processing services, business intelligence data services and marketing-oriented analytical tools, to travel agencies, travel providers and other travel data users.
We provide IT solutions to airlines, such as pricing, shopping, ticketing, ground handling and other services, enabling them to focus on their core business competencies and reduce costs. We also host and manage reservations, inventory management and other related systems for Delta Air Lines Inc. (“Delta”) and in May 2014, we signed a new long-term agreement to continue to run the system infrastructure for the Delta Air Lines platform in our Atlanta data center. In addition, we own a 51% controlling interest in IGT Solutions Private Ltd. (“InterGlobe”), a Gurgaon, India-based company that provides application development services. We use InterGlobe to perform software development in support of our products and services. Using offshore and onshore human resources, InterGlobe augments our software development staff and manages project-specific development tasks. InterGlobe also provides application development services in the same service delivery model to other customers in the travel industry. We refer to these solutions and services as “Technology Services.”
As travel providers increase their focus on distribution and merchandising, we do not believe that a travel provider’s choice of distribution and merchandising services are affected in any meaningful way by their choice of hosting solutions. For example, based on our distribution capabilities, we believe we have the largest share of bookings in Australia and the United Kingdom even though we do not provide any hosting solutions in those countries.
We believe we are the most geographically balanced participant in the travel distribution industry. In 2014, we generated $2,031 million in Travel Commerce Platform revenue, of which 68% is international (with 20% from Asia Pacific, 30% from Europe, 4% from Latin America and Canada and 14% from the Middle East and Africa) and 32% is from the United States, closely mirroring the total GDS-processed air segments globally. Our geographically dispersed footprint helps insulate us from particular country or regional instability, allows for optimal IT efficiency and enhances our value proposition to travel providers. We are well positioned to capture higher value business from travel providers operating in away markets, which results in higher per transaction
5
revenue for both us and the travel providers we serve. As of December 31, 2014, we served over 170 countries through our extensive global network of approximately 60 sales and marketing offices, or SMOs, and a diverse workforce of approximately 3,400 full-time employees and an additional 1,100 employees at InterGlobe.
We have a recurring, primarily transaction-based, revenue model. As an asset-light company, we do not take airline, hotel or other inventory risk, and we are not directly exposed to fuel price volatility or labor unions like our travel providers. Our recurring, transaction-based revenue model is primarily driven by discrete travel events such as Air or Beyond Air segments booked rather than the price of the booking, meaning we benefit from an increase in total global travel without being exposed to price changes. However, our results, like others in our industry, are dependent upon various levels of travel activity, particularly air travel as well as our ability to obtain travel provider inventories, our ability to maintain existing relationships with travel agencies and our ability to deliver desired products and services.
Our ability to offer broad, high-quality and multi-product content on a single user interface encourages those booking travel to purchase additional products and services beyond the original Air or Beyond segment. For example, for every 100 air tickets sold in 2014, 43 hospitality segments were sold, which has grown from 34 hospitality segments sold for every 100 air tickets sold in 2010. The merchandising of additional products and services increases our revenue per transaction, and, consequently, we measure performance primarily on the basis of increases in both Reported Segments and RevPas. We place limited reliance and emphasis on traditional publicly reported air booking share metrics as they do not appropriately reflect the profitability of our expanded Travel Commerce Platform. Our recurring, transaction-based revenue model combined with high-quality content availability (which encourages incremental services booked with each transaction), our investment in our distribution and payment solutions technology and our multi-year contracts with travel providers and travel agents have enabled us to grow our RevPas in each of the last 12 quarters on a year-over-year basis. We increased our RevPas from $5.11 in the first quarter of 2011 to $5.78 in the fourth quarter of 2014. We grew Reported Segments from 347 million in 2012 to 356 million in 2014.
Our management team, led by industry veteran Gordon Wilson, our Chief Executive Officer since June 2011, spearheaded a shift in our corporate strategy to focus on the trends, inefficiencies and unmet needs of all components of the travel value chain and defined a new five-year strategy to transform our business from a traditional GDS to a next generation travel commerce platform. Our strategy is built on five pillars: unrivalled content, empowered selling, transforming payments, open platform and new business frontiers. Since refocusing our strategy in 2012, we have experienced revenue growth from airline fees, hospitality, advertising and payments and launched our air merchandising platform. We grew our Beyond Air revenue by 14% between 2012 and 2013 and 14% between 2013 and 2014. As a result, we delivered year-over-year quarterly improvements in key business metrics, such as RevPas, over the last 12 consecutive quarters and Reported Segments for the last 7 consecutive quarters (excluding the loss of segments relating to the hosting contract from United Airlines following its merger with Continental Airlines). We also addressed legacy contracts by stabilizing our business from the 2012 loss of a contract with United Airlines following its merger with Continental Airlines, entering into a new long-term contract in February 2014 with Orbitz Worldwide and restructuring and extending our Technology Services relationship with Delta Air Lines in May 2014.
We have historically generated strong cash flows on a consistent basis with Adjusted EBITDA margins of 25.1%, 24.9% and 24.7% for the years ended December 31, 2014, 2013 and 2012, respectively (See “Management’s Discussion and Analysis of Financial Condition and Results of Operations” for a discussion of Adjusted EBITDA). Drivers of our cash flows benefit from relatively modest capital expenditure requirements and attractive working capital dynamics. Furthermore, the diversity of our business provides us with multiple independent revenue streams from various markets and channels that lessen the impact of potential strategic and geographic shifts within the industry. These characteristics, combined with the contractual nature of our revenue and costs, our leading industry position and our long-standing customer relationships provide for a strong and predictable stream of cash flows.
For the years ended December 31, 2014 and 2013, we recorded net revenue of $2,148 million and $2,076 million, respectively, net income (loss) of $91 million and $(203) million, respectively, and Adjusted EBITDA of
6
$540 million and $517 million, respectively, reflecting a 4.2% net income margin and a 9.8% net loss margin and a 25.1% and 24.9% Adjusted EBITDA margin, respectively. As of December 31, 2014 we had total indebtedness of approximately $2.4 billion.
Company History
In 2006, we were acquired by affiliates of The Blackstone Group (“Blackstone”), affiliates of Technology Crossover Ventures and certain existing and former members of our management. One Equity Partners acquired an economic interest in us in December 2006. In 2007, we expanded and diversified our geographic and commercial footprint by acquiring Worldspan.
In 2013, we completed a comprehensive refinancing plan that extended our debt maturities and simplified our capital structure.
During 2014, we completed several deleveraging transactions and a debt refinancing. Further, on September 30, 2014, we completed our initial public offering, and our common shares are currently traded on the New York Stock Exchange under the symbol “TVPT.”
We were incorporated in 2006 in Bermuda. Our principal executive offices are located at Axis One, Axis Park, Langley, Berkshire SL3 8AG, United Kingdom and our telephone number is +44-1753-288-000.
We continually explore, prepare for and evaluate possible transactions, including acquisitions, divestitures, joint ventures and other arrangements, to ensure we have the most efficient and effective capital structure and/or to maximize the value of the enterprise. No assurance can be given with respect to the timing, likelihood or effect of any possible transactions.
Our Competitive Strengths
We believe that several aspects of our strategy fundamentally differentiate us from our competitors, including our focus on redefining travel distribution and commerce instead of investing in more capital and labor intensive airline and hospitality related IT solutions, our fast growing Beyond Air portfolio, including our automated B2B payments solution with a large addressable market and our emphasis on a value-based partnership approach with travel providers that allows us to increase revenue and profitability per Reported Segment. The following attributes describe in further detail how we differentiate ourselves from our competitors.
Our Travel Commerce Platform Addresses the Evolving Needs of Travel Providers, Agencies, Corporations and Travelers
Travel providers need flexible systems to distribute and merchandise their increasingly sophisticated core products and broadening offerings of ancillary products and services. We offer them a portfolio of industry-leading, value-add tools to increase revenue, lower costs and efficiently reach travel buyers globally in every channel. Our global reach allows travel providers to display and sell products in over 170 countries and across over 67,000 travel agency locations representing 259,000 online and offline travel agency terminals worldwide. Our Travel Commerce Platform enables travel providers to (i) extend their distribution by broadening their geographic reach to away markets and connects them with higher value business travelers, (ii) access higher yielding ticket prices from long-haul segments, room rates, complex itineraries and business travelers and (iii) encourage travelers to purchase ancillary services and/or upgrade or upsell travelers through our highly-differentiated Travelport Merchandising Platform.
Our Travelport Merchandising Platform, consisting of three distinct solutions—Travelport Aggregated Shopping, Travelport Ancillary Services and Travelport Rich Content and Branding—offers a range of sophisticated travel sales and marketing capabilities in collaboration with airlines. These solutions allow airlines to promote their products and services to the right buyers, at the right time and in the right place. Travelport Aggregated Shopping allows travel agencies to efficiently and directly compare results from traditional carriers,
7
who deliver data through the traditional industry standard ATPCO, which regularly updates traditional GDSs, with those from LCCs and other carriers who use an API connection to deliver data directly and in real time to us. Travelport Ancillary Services allows travel agencies to sell airline ancillaries, such as checked baggage, premium seats and lounge passes, directly through their existing interface rather than needing to book separately on an airline’s website. Travelport Rich Content and Branding allows airlines to more effectively control how their flights and ancillaries are visually presented and described on travel agency screens, bringing the display more in line with the airlines’ own website. This is especially valuable to airlines given the increasing importance of ancillary revenue for profitability. Our ability to help travel providers and travel agencies increase their revenue reinforces the value proposition of our Travel Commerce Platform when compared to alternative distribution channels, and is a key part of our strategy to change our relationship with travel providers from cost-focused to value-focused.
Our leading access to global travel provider content helps attract more travel buyers onto our platform, which in turn drives greater value for the travel providers, increasing their addressable customer base. Our leading point of sale solutions, such Travelport Smartpoint, Universal Desktop and Travelport Mobile Agent, along with Travelport Rich Content and Branding, provide travel agencies with greater choice and detailed information on key differences between the products and services offered by travel providers, allowing them to provide more valuable insights to their customers, higher levels of customer service and improved sales productivity. Utilization of our Travel Commerce Platform simplifies highly complex, high volume operations, freeing up more time for travel agencies to focus on the selling process. In addition, our Travel Commerce Platform reduces operating costs for travel agencies by offering a single point of access to broad global travel content and by integrating critical data for back office, accounting and corporate customer reporting. Furthermore, our Travel Commerce Platform gives travelers a quick and easy way to compare a multitude of available travel options and obtain the true cost of a desired itinerary, buy ancillaries directly after the core booking has been made and provides greater control over itineraries through an option to add features at later stages in the travel process.
Fast Growing Portfolio of Beyond Air Initiatives
Our Travel Commerce Platform provides us with a foundation to offer a fast growing portfolio of additional products and services, which in turn results in additional revenue. Our Beyond Air portfolio includes distribution and merchandising solutions for hotel, car rental, rail, cruise-line and tour operators, payment solutions, advertising and other platform services.
We offer the largest inventory of hotel properties on any travel platform in the world via our innovative distribution and merchandising solutions for both chain and independent hotels. Independent hotels were largely unaddressed by the GDS industry, which we integrate on one platform by combining the content from chain hotels captured by the traditional GDSs with independent hotel content our system accesses through our meta-search technology. In particular, our B2B solution, Travelport Rooms and More, is a single user interface that combines detailed product insights with meta-search functionality to deliver a fully-integrated hotel booking platform to travel agencies. Travelport Rooms and More captures highly fragmented content in one interface (including over 650,000 hotel properties) by combining content from large global Online Travel Agents (“OTAs”) with that from aggregators specializing in a particular geographic area. This streamlined and efficient interface also enables travel agencies to more easily upsell hotel content in a single, consistent and efficient workflow and user experience.
We are an early adopter in automated B2B payments and are redefining payments from travel agencies to travel providers. We have pioneered a new class of payments for the unmet needs of the travel industry that is focused on replacing cash and other payment methods with secure virtual pre-funded payment cards. eNett’s innovative, cost-efficient and secure travel payment solutions offer a strong value proposition to travel agencies and travel providers, including full flexibility, elimination of credit or bankruptcy risk, lower administrative cost due to significantly reduced time spent on reconciliation, rewards to travel agencies with incentive payments
8
based on payment volumes and a lower spread for foreign currency payments. eNett exclusively utilizes MasterCard under a long-term agreement for card issuance, giving unparalleled access to the payment systems of virtually all the world’s travel providers who accept MasterCard as a form of payment. We believe the model is highly scalable as we expand beyond the core hospitality sector into air travel, including LCCs, as well as other sectors of the travel industry. We estimate that there is over $2 trillion of direct spending on travel annually, $810 billion of which is booked through the indirect channel, and payment is made from travel agencies to travel providers.
In addition to hospitality and payments, we utilize the broad connections and extensive data managed by our Travel Commerce Platform to provide advertising solutions to approximately 5,000 advertisers, which includes, among others, travel providers who use our advertising solutions to easily and cost-effectively promote upgrades, ancillary products or services, package deals and other offers and, as a result, more effectively merchandise their products and services to targeted customers. We give advertisers direct access to a captive professional audience across over 67,000 travel agency locations representing 259,000 online and offline travel agency terminals worldwide, with a full-time focus on global travel bookings and cover all main domestic and international travel flows. Our improved, graphically rich point of sale solutions provide increased capabilities and advertising space to display banner advertisements, add click through functionality and market ancillary products through our user interface.
Innovative, Flexible and Scalable Open Technology Platform Tailored to Meet Evolving Industry Needs
Through our industry-leading technology platform, we have been able to maintain our position at the forefront of innovation by meeting the global demands of our travel agents and travel providers for speed, flexibility and convergence. Our technology-enabled solutions offer rich content through accessible distribution channels, such as Travelport Smartpoint and Travelport Mobile Agent. To address unmet industry needs, we made significant strategic investments in innovative technology over the last three years, and we continue to invest in developing new technologies, platforms and ideas, all on an open and accessible platform that delivers expansive content and improves service. Our open connectivity approach allows for fully-flexible access to content and services across a range of delivery mechanisms, from XML protocols to more traditional industry sources such as ATPCO. Our open platform allows us to pull together content delivered from multiple sources into a cohesive display for the travel buyer, enabling search, comparison, reservation and payment across multiple providers. We deliver our content and functionality through state-of-the-art point of sale tools or via our own uAPI, which enables the flexibility for travel agencies and intermediaries to design customized user interfaces. A broad network of over 800 developers utilize our uAPI, create their own applications and increase the robustness of our systems. Our point of sale tools are device agnostic, allowing travel agents to access our platform via internet connection on a desktop or a variety of mobile devices, such as smartphones and tablets. In 2014, our systems processed up to 3 billion travel related system messages per day with 240 millisecond peak transaction frequency, over 9 billion API calls per month with 99.991% core system uptime using approximately 9,900 physical and virtual servers and had total storage capacity of over 13 petabytes. We operate our own in-house data center, which is another source of competitive advantage.
In recognition of the advantages provided by our open platform, we were the first among our competitors to offer Delta Air Lines’ full range of seating products. In addition, starting in 2013, we offered Travelport Aggregated Shopping through XML connectivity to airline content, which has enabled and encouraged leading LCCs such as AirAsia, EasyJet and Ryanair to join our fully integrated Travel Commerce Platform. In 2013, we launched an innovative Air Merchandising Platform to enhance user experience and focus on the sale of ancillary products and services, which are becoming increasingly important for airlines’ profitability. In the hospitality industry, we were the first GDS to our knowledge to offer a one-stop portal for hotel content distribution powered by “meta-search” technology.
9
Resilient, Recurring, Transaction-based Business Model with High Revenue Visibility
Our operations are primarily founded on a transaction-based business model that ties our revenue to travel providers’ transaction volumes rather than the price paid by a consumer for airfare, hotel rooms or other travel products and services booked through our systems. Travel related businesses with volume-based revenue models have generally shown strong visibility, predictability and resilience across economic cycles because travel providers have historically sought to maintain traveler volumes by reducing prices in an economic downturn.
In general, our business is characterized by multi-year travel provider and travel agency contracts. Our standard distribution agreements with travel providers are open-ended or rollover unless specifically terminated. In 2014, we had 38 planned airline contract renewals, and we successfully renewed all such contracts. We currently have 60 and 48 planned airline contract renewals in 2015 and 2016, respectively, including contracts which rollover on an annual basis. We also enter into contracts with travel buyers, such as travel agencies and corporate travel departments. A meaningful portion of our travel buyer agreements, representing approximately 17% of our revenue on average, are up for renewal in any given year. We did not lose any material travel buyer contract in the last three years. The length of our contracts, as well as the transaction-based and recurring nature of our revenue, provides high revenue visibility going forward.
Balanced Global Footprint with Long-standing Relationships
We believe we are the most geographically balanced participant in the travel distribution industry. In 2014, we generated $2,031 million in Travel Commerce Platform revenue, of which 68% is international (with 20% from Asia Pacific, 30% from Europe, 4% from Latin America and Canada and 14% from the Middle East and Africa), and 32% is from the United States, closely mirroring the total GDS-processed air segments globally. Our geographically dispersed footprint helps insulate us from particular country or regional instability, allows for optimal IT efficiency and enhances our value proposition to travel providers. We are well positioned to capture higher value business from travel providers operating in away markets, which results in higher per transaction revenue for both us and the travel providers we serve. This strategically diversified geographic footprint allows us to focus on higher value transactions in the international travel segment. Our balanced network positions us well to benefit from global industry growth, while lessening the impact of potential geographic shifts within the industry. Our footprint also positions us as the challenger to the industry leader for air segments processed in each geographic region and provides us opportunities to grow our share.
We also have highly diversified, strong, long-standing relationships with both our travel providers and travel buyers. None of our travel buyers or travel providers accounted for more than 10% of our revenue for the year ended December 31, 2014. Our top 15 travel providers (by 2014 revenue) have been with us for more than ten years on average.
Proven and Motivated Management Team with Deep Travel Industry Expertise
Our management team has over 100 years of combined travel industry experience and is committed to improving and maintaining operational excellence by utilizing their extensive knowledge of the travel and technology industries. Their dedication and excellence has been demonstrated by improving our key business metrics and our recent capital structure improvements. Our management team’s compensation structure directly incentivizes them to improve business performance and profitability. Members of management currently own approximately 2.75% of our outstanding common shares (approximately 6% on a fully diluted basis assuming the vesting of existing equity awards).
Our management team is supported by a skilled, diverse, motivated and global workforce, comprised of approximately 3,400 full-time employees and an additional 1,100 employees at InterGlobe as of December 31, 2014. By investing in training, skills development and rotation programs for our employees, we seek to develop leaders with broad knowledge of our company, the industry, technology and customer-specific needs. We also hire externally as needed to bring in new expertise. Our combination of deep industry and company experience combined with the fresh perspective and insight of new hires across our management team creates a solid foundation for driving our business to success, profitability and industry leadership.
10
Our Growth Strategies
We believe we are well positioned for future growth. Our balanced geographic footprint aligns us with anticipated industry growth across geographies, and we expect trends such as the increasing importance of ancillary revenue, the need by travel providers to personalize their offers to travelers, expansion by LCCs into the business travel industry, continued penetration by GDSs into hospitality distribution and growth of B2B travel advertising to further underpin our growth. We continue to leverage our domain expertise and relationships with travel providers to grow eNett. We will continue to evaluate and pursue strategic acquisition opportunities that enhance our Travel Commerce Platform. Our recent strategic capital investments, current product portfolio and strategic positioning enable us to benefit from industry trends, and we intend to capitalize further on these industry trends by focusing on the following initiatives:
Driving Beyond Air Innovation and Growth
Our Beyond Air portfolio includes fast growing hotel distribution, advertising and payment solutions. Given growth rates and the underpenetrated nature of these three areas, we believe we can grow our Beyond Air portfolio at a multiple to overall travel industry growth by continuing to strategically invest in the development of state-of-the-art capabilities in order to achieve a leading industry position.
Payments: Our strategy for eNett is to continue growing the scale of the business through further investment in operational capabilities, sales and marketing and targeted geographic expansion. We plan to capitalize on our early adopter advantage to capture “white space” given the travel industry’s previously unmet needs for a secure and efficient payment solution. Our Travel Commerce Platform allows us to leverage our extensive network of travel agencies to grow the penetration rate for eNett payments.
Hospitality: Through our leading meta-search capabilities, we are increasing our presence among independent hotels and have the largest inventory of hotel properties on any travel platform in the world. In addition, we provide superior chain hotel content to OTAs relative to our competitors by providing direct XML connectivity. Our strategy to grow in hospitality distribution is also focused on delivering corporate access to aggregated hotel content, including both chain and independent hotels through a single point of sale.
Advertising: Our strategy is to focus on the B2B advertising opportunity by targeting travel agencies. Hotel advertising will remain our core offering, but other advertising categories (especially air) also represent areas for growth, which we believe we are well positioned to capitalize on through our Travel Commerce Platform.
Expand Air Platform
We are well positioned in the high-value, complex segment of air travel distribution, which is characterized by its larger number of business travelers, complex itineraries and international bookings. Our strategy to grow our Air platform focuses on providing state-of-the-art solutions to address the changing manner in which airlines are positioning and selling their products and services.
To achieve these objectives, we developed, and in April 2013, we launched, our Air Merchandising Platform that offers Rich Content and Branding capabilities and integrates XML content with traditional content in a graphically rich, single user interface. This allows for more flexible and effective distribution and merchandising of both core travel content and ancillary products and services, results in a higher value proposition for both network carriers and LCCs and allows travel agencies to upsell more content efficiently. We are also able to offer eNett payment capabilities to our travel buyers.
We intend to focus on the following strategies to drive Air growth:
Growth through Retailing and Merchandising Capabilities: In order to address the growing importance for travel providers of flexible systems to distribute and merchandise their increasingly sophisticated core products and broadening offerings of ancillary products, we have heavily invested in our Travelport Merchandising
11
Platform to more effectively market and sell products and services. We have signed numerous airlines to our Rich Content and Branding solution and will continue to target additional airlines with this solution. In addition, increasing the sale of ancillaries through our platform not only results in additional transaction revenue, but also helps us attract new content from carriers. We intend to continuously invest in our retailing and ancillary merchandising capabilities and grow by partnering with both traditional carriers and LCCs.
LCC Participation Growth: As LCCs continue to evolve and look for further growth opportunities, they seek to expand their offering to higher yield customers, mainly business travelers. Our access to business travelers, merchandising capabilities and ability to process complex itineraries have attracted and allowed for the full integration of several fast-growing LCCs such as AirAsia, EasyJet and Ryanair into our Travel Commerce Platform. We view the expansion of LCCs into the business travel segment as a significant growth opportunity for us, and we will continue building our offering to win their business.
Targeted Geographic Expansion: Because the ability to increase away segments provides more revenue to airlines, away segments attract a premium to home segments, a dynamic that will benefit our performance as this trend continues. Furthermore, due to our balanced global footprint, we are well placed to benefit from global airline capacity shifts and increased LCC participation. We will continue to grow our international business and will focus on expanding into new emerging regions such as Africa, Latin America and Eastern Europe.
Business Travel Growth: Our strategy to grow in the business travel space is focused on investing in products that distribute travel technology solutions directly to corporations, allowing them to easily access and book travel content that incorporates their travel management policies directly through our platform.
Focus on Distribution Technology Leadership and Differentiated Products
Achieving growth in our Travel Commerce Platform is predicated on our continued investment in developing advanced technologies and differentiated products to maintain our competitive position. We intend to continue our strong commitment to product innovation and technological excellence to maintain our state-of-the-art product portfolio and preserve our early adopter advantage in several key growth areas, such as the sale of ancillaries, B2B travel payments, hospitality merchandising and advertising. We plan to continue offering rich travel content and empowered selling capabilities on an open platform with service oriented architecture and industry leading uAPI, and plan to continue to focus on developing a diverse application set to consistently increase the value of our Travel Commerce Platform to our customers. We are exploring new adjacencies, such as big data, which allow us to improve our products and data offerings to our customers and develop insights into travel behaviors. We have chosen not to focus our resources on more capital and labor intensive airline and hospitality related IT solutions. Instead, we focus on distribution products and payment related solutions. Our ability to offer differentiated, high value products and services allows us to shift the focus of our dialogue with travel providers from price to value, leading to higher RevPas.
Travel Providers
Our relationships with travel providers extend to airlines, hotels, car rental companies, rail networks, cruise-line and tour operators. Travel providers are offered varying levels of services and functionality at which they can participate in our Travel Commerce Platform. These levels of functionality generally depend upon the travel provider’s preference as well as the type of communications and real-time access allowed with respect to the particular travel provider’s host reservations and other systems.
We provide air distribution services to approximately 400 airlines globally, including approximately 100 LCCs. We distribute ancillaries for approximately 40 airlines. We have relationships with approximately 330 hotel chains, representing approximately 100,000 hotel properties, which provide us with live availability and instant confirmation for bookings, in addition to approximately 20 hotel aggregators resulting in an aggregate
12
of over 650,000 hotel properties bookable through Travelport Rooms and More, which, based on our internal estimates, is the largest inventory of hotel properties on any travel platform in the world. In addition, we serve over 35,000 car rental locations, 61 cruise-lines and tour operators and 12 major rail networks worldwide.
The table below lists alphabetically our largest airline providers in the regions presented for the year ended December 31, 2014, based on revenue:
| | | | | | | | |
Asia Pacific | | Europe | | Latin America and
Canada | | Middle East and
Africa | | United States |
Jet Airways | | Aeroflot Airlines | | Air Canada | | Emirates Airlines | | American Airlines |
Malaysian Airlines | | Alitalia Airlines | | American Airlines | | Ethiopian Airlines | | Delta Air Lines |
Qantas Airways | | British Airways/Iberia | | Avianca Airways | | Qatar Airways | | Frontier Airlines |
Singapore Airlines | | Emirates Airlines | | United Airlines | | South African Airways | | United Airlines |
Virgin Australia Airlines | | Lufthansa Airlines | | WestJet | | Turkish Airlines | | US Airways |
The majority of our agreements remain in effect each year, with exceptions usually linked to airline mergers or insolvencies. In 2014, we had 38 planned airline contract renewals, and we successfully renewed all such contracts. We currently have 60 and 48 planned airline contract renewals in 2015 and 2016, respectively, including contracts which roll on an annual basis. Our top fifteen travel providers as measured by revenue for the year ended December 31, 2014, all of which are airlines, have been customers on average for more than ten years. For the year ended December 31, 2014, our top ten travel providers represented approximately 30% of revenue and no single provider accounted for more than 10% of revenue.
We have entered into a number of specific-term agreements with airlines across the globe to secure all of the airline’s public content. These content agreements allow our travel agency customers to have access to the full range of our airline providers’ public content, including the ability to book the last available seat, as well as other functionalities. We have secured full-content or distribution parity agreements with approximately 110 airlines, including LCCs. Revenue attributable to these agreements comprised 64% of Air revenue in the year ended December 31, 2014. Certain full-content agreements expire, or may be terminated, during 2015. For example, though we have participation agreements with these airline providers in which they participate in our Travel Commerce Platform, full-content or distribution parity agreements with airlines representing approximately 27% of our Travel Commerce Platform revenue for the year ended December 31, 2014 are up for renewal or are potentially terminable by such carriers in 2015.
We have approximately 100 airlines that we classify as LCCs participating in our Travel Commerce Platform around the world, including Ryanair, easyJet and AirAsia. Our revenue from LCCs increased by 12% for the year ended December 31, 2014, in contrast to a 1% increase in revenue attributable to network carriers compared to the prior year.
Our top hotel providers for the year ended December 31, 2014 were Hilton, Intercontinental Hotels Group and Marriott Hotels.
Our top five car rental company providers by brand for the year ended December 31, 2014 were Avis, Dollar, Enterprise, Hertz and National. We provide electronic ticket distribution to 12 major international and national rail networks, including Société Nationale des Chemins de Fer France (SNCF) (France), Amtrak (United States), Eurostar Group (United Kingdom/France) and AccessRail (United States).
Travel Agencies
Over 67,000 travel agency locations representing 259,000 online and offline travel agency terminals worldwide use us for travel information, booking and ticketing capabilities, travel purchases, workflow automation and management tools for travel information and travel agency operations. Access to our Travel
13
Commerce Platform enables travel agencies to electronically search travel related data such as schedules, availability, services and prices offered by travel providers and to book travel for end customers.
Our Travel Commerce Platform also facilitates travel agencies’ internal business processes such as quality control, operations and financial information management. Increasingly, this includes the integration of products and services from independent parties that complement our core product and service offerings, including a wide array of mid- and back-office service providers. We also provide technical support, training and other assistance to travel agencies, including numerous customized access options, productivity tools, automation, training and customer support focusing on process automation, back-office efficiency, aggregation of content at the desktop and online booking solutions.
Our relationships with travel agencies typically are non-exclusive, meaning they subscribe to and have the ability to use more than one GDS but may require a substantial portion to be booked through our Travel Commerce Platform. We pay travel agencies a commission for segments booked on our Travel Commerce Platform and, in order to encourage greater use of our Travel Commerce Platform, we may pay an increased commissions based on negotiated segment volume thresholds. Travel agencies or other customers in some cases pay a fee for access to our GDS or to access specific services or travel content. Our travel agency customers comprise online, offline, corporate and leisure travel agencies. Our largest online travel agency customers, by revenue, in 2014 were Orbitz Worldwide (which includes orbitz.com and cheaptickets.com in the United States and ebookers.com in Europe), Priceline and Expedia. In the year ended December 31, 2014, approximately 20% of our revenue was derived from OTAs and management estimates that the remaining revenue is split evenly between leisure and business. Our largest business travel agency customers in 2014 were American Express, BCD Holdings, Carlson Wagonlit Travel, Flight Centre Limited and Hogg Robinson Group. Our largest leisure travel agency customers in 2014 include AAA Travel, Carlson Leisure Group and GTT Global/USA Gateway. For the year ended December 31, 2014, our top ten travel agency customers represented approximately 30% of revenue and no single travel agency customer accounted for more than 10% of revenue. Travel agency contracts representing approximately 22%, 12%, 22% and 44% of 2014 revenue are up for renewal in 2015, 2016, 2017 and beyond, respectively.
Competition
Travel Commerce Platform
The marketplace for travel distribution is large, multi-faceted and highly competitive. We compete with a number of travel distributors, including:
| | • | | traditional GDSs, such as Abacus, Amadeus and Sabre; |
| | • | | local distribution systems that are primarily owned by airlines or governmental entities and operated predominately in their home countries, including TravelSky in China, Axess and Infini in Japan, Topas in South Korea and Sirena Travel in Russia; |
| | • | | travel providers that use direct distribution, including through the use of travel provider websites and mobile applications; |
| | • | | corporate booking tools, including Concur Technologies, GetThere, Deem, KDS, eTravel and Egencia (although most corporate booking tools interface with a GDS to access the content and functionality offered by the GDS); and |
| | • | | other participants, including Kayak, TripAdvisor, Yahoo! and Google, which have launched business-to-consumer travel search tools (although bookings are often fulfilled through a GDS) that connect travelers with direct distribution channels and OTAs. |
14
While many of the products and services offered by non-GDSs offer some of the functionality and integration provided by our Travel Commerce Platform, we believe none of them offer the full functionality and integration we offer, including serving the end consumer who desires to explore all booking options. Among industry participants with a traditional GDS, we believe our Travel Commerce Platform differentiates us from our competitors. We believe that competition in the industry is based on the following criteria:
| | • | | the timeliness, reliability and scope of travel inventory and related content; |
| | • | | service, reliability and ease of use of the system; |
| | • | | the number and size of travel agencies and the fees charged by a GDS and incentives and loyalty payments made to travel agencies; |
| | • | | travel provider participation levels, inventory and the transaction fees charged to travel providers; |
| | • | | the range of products and services available to travel providers and travel agencies; and |
| | • | | geographical reach, consistency of data and content, cross border capabilities and end traveler and corporation servicing. |
According to Market Information Data Transfer (“MIDT”), for the years ended December 31, 2014 and 2013, we accounted for 26% of global GDS-sold air segments, with a distribution mirroring the global distribution of GDS air segments.
Payment Solutions
While we believe eNett is redefining payments from travel agencies to travel providers, there are currently multiple ways to settle travel payments from travel agencies to travel providers. Traditional methods of settling travel payments include:
| | • | | consumer cards, corporate cards, lodge cards and bank-issued VANs; and |
| | • | | wire transfers and Electronic Funds Transfer (“EFTs”). |
Technology Services
The technology services sector of the travel industry is highly fragmented by service offering, including hosting solutions, such as internal reservation system services, as well as flight operations technology services and software development services. For example, sector participants include Amadeus, HP Enterprise Services, Navitaire LLC, Sabre, SITA and Google, as well as airlines that provide the services and support for their own internal reservation system services and also host external airlines.
Sales and Marketing
Our Sales and Marketing Organizations (“SMOs”) and National Distribution Companies (“NDCs”) are organized by country or region and are typically divided between the new account teams, which seek to add new travel agencies to our Travel Commerce Platform, and account management teams, which service and expand existing business. In certain regions, smaller customers are managed by telemarketing teams. Our SMOs are wholly-owned and represented approximately 82% of our Travel Commerce Platform revenue in 2014. We continue to utilize NDCs in certain regions where our appointed distributor either provides specialized expertise in the technology or the countries in which they operate for us. These NDCs are typically located in regions where airlines continue to exert strong influence over travel agencies or where the NDC has specialized expertise in the local region or country. We also contract with new NDCs in countries and regions where doing so would be more cost-effective than establishing an SMO. Our top ten NDCs generated approximately 11% of revenue in 2014 and no single NDC accounted for more than 5% of revenue.
15
We have a dedicated organization for hospitality, which covers sales, marketing, product and application development. eNett operates independently, but works closely with the Travel Commerce Platform SMOs to realize cross-sale opportunities.
Technology
Achieving growth for our Travel Commerce Platform is predicated on our continued investment in developing advanced technologies and differentiated products to maintain our competitive position. We intend to continue our commitment to product innovation and technological excellence to maintain our product portfolio and preserve our early adopter advantage in several key growth areas, such as the sale of ancillaries, B2B travel payments, hospitality merchandising and advertising. We plan to continue offering rich travel content on an open platform with service oriented architecture and an industry leading uAPI, and are also focused on developing a diverse application set to consistently keep increasing value of our Travel Commerce Platform to our customers. We are exploring new adjacencies, such as big data, which allow us to improve our products and data offerings to our customers and develop insights into travel behaviors. We have chosen not to focus our resources on more capital and labor intensive airline and hospitality related IT solutions. Instead, we focus on distribution products, payment related solutions and technology services. For example, starting in 2013, we offered Travelport Aggregated Shopping through XML connectivity to airline content, which has enabled and encouraged leading LCCs such as AirAsia, easyJet, Ryanair and Spirit Airlines to join our fully integrated Travel Commerce Platform, and have focused on providing superior chain hotel content to OTAs relative to our competitors by directly connecting via XML to key hotel chains. Our ability to offer differentiated, high value products and services allows us to shift the focus of our dialogue with travel providers from price to value, leading to higher revenue per transaction. Our Travel Commerce Platform includes three GDS systems—Travelport, Galileo and Worldspan.
We support our operations from a single data center location in Atlanta, Georgia that we operate. We believe that our data center is a state-of-the-art facility, one that has completed comprehensive technology upgrades to current processing and storage platforms. The combined facility features a technology platform that we believe leads the industry in terms of functionality, performance, reliability and security. The existing systems are certified compliant with the Payment Card Industry Data Security Standard, offering a secure environment for operations and have historically operated at a 99.991% core systems uptime. In 2014, our systems processed approximately 1 trillion transactions, up to 3 billion travel related system messages per day on an average transaction speed of 240 milliseconds and over 9 billion API calls per month. Our data center uses approximately 9,900 physical and virtual servers and has total storage capacity of over 13 petabytes. In the data center environment, our customers benefit from access to one of the industry’s most powerful, reliable and responsive travel distribution and hosting platforms. Continued modernization of our technical environment is an integral part of our aim to support growth by efficiently delivering distribution systems to our customers.
Intellectual Property
We regard our technology and other intellectual property as critical components and assets of our business. We protect our intellectual property rights through a combination of copyright, trademark and patent laws, and trade secret and confidentiality laws and procedures, as well as database rights, where applicable. We own and seek protection of key technology and business processes and rely on trade secret and copyright laws to protect proprietary software and processes. We also use confidentiality procedures and non-disclosure and other contractual provisions to protect our intellectual property assets. We rely on appropriate laws to protect the ownership of our data and databases.
Where appropriate, we seek statutory and common law protection of our material trade and service marks. The laws of some foreign jurisdictions, however, vary and offer less protection than other jurisdictions for our proprietary rights. Unauthorized use of our intellectual property could have a material adverse effect on us, and there is no assurance that our legal remedies would adequately compensate us for the damages caused by such unauthorized use.
16
We rely on technology that we license or obtain from third parties to operate our business. Vendors that support our core GDS technology include IBM, CA, Inc., SAS Group, Inc., Cisco Systems, Inc., EMC Corporation and Red Hat, Inc. Certain agreements with these vendors are subject to renewal or negotiation within the next year. In 2010, we obtained licenses to our Transaction Processing Facility operating system from IBM. Associated maintenance, support and capacity are available through December 31, 2016 under an agreement with IBM, and we expect such services will continue to be available to us after December 31, 2016.
Employees
As of December 31, 2014, we had approximately 3,400 full-time employees and an additional 1,100 employees at InterGlobe. None of our employees in the United States are subject to collective bargaining agreements governing employment with us. In certain of the European countries in which we operate, we are subject to, and comply with, local law requirements in relation to the establishment of work councils. In addition, due to our presence across Europe and pursuant to an E.U. Directive, we have a Travelport European Works Council in which we address E.U. and enterprise-wide issues. We believe that our employee relations are good.
Seasonality
Our business experiences seasonal fluctuations, reflecting seasonal demand trends for the products and services we offer. These trends generally cause our revenue to be higher in the first and second quarters as compared to the third and fourth quarters of the calendar year. Revenue typically peaks during these times as travelers plan and book their upcoming spring and summer travel.
Government Regulation
In the countries in which we operate, we are subject to or affected by international, federal, state and local laws, regulations and policies, including anti-bribery rules, trade sanctions, data privacy requirements, labor laws and anti-competition regulations, which are constantly subject to change. In addition, certain government trade sanctions affect our ability to operate in Cuba, Iran, Sudan, Syria and Ukraine. The descriptions of the laws, regulations and policies that follow are summaries and should be read in conjunction with the texts of the laws and regulations. The descriptions do not purport to describe all present and proposed laws, regulations and policies that affect our businesses.
We believe that we are in material compliance with these laws, regulations and policies. Although we cannot predict the effect of changes to the existing laws, regulations and policies or of the proposed laws, regulations and policies that are described below, we are not aware of proposed changes or proposed new laws, regulations and policies that will have a material adverse effect on our business.
Industry Regulations
Our business is subject to GDS industry specific regulations, including in the E.U., Canada, India and China, and eNett operates in the highly regulated financial services industry.
Historically, regulations were adopted in the E.U. and Canada to guarantee consumers access to competitive information by Computer Reservation Systems (“CRSs”) (then owned by individual airlines) and to provide travel agencies with unbiased displays and rankings of flights. Under the current E.U. CRS Regulations, GDSs and airlines are free to negotiate booking fees charged by GDSs and the information content provided by the airlines. The E.U. CRS Regulations include provisions to ensure a neutral and non-discriminatory presentation of travel options in the GDS displays and to prohibit the identification of travel agencies in MIDT data without their consent. The E.U. CRS Regulations also require GDSs to display rail or rail/air alternatives to air travel on the first screen of their principal displays in certain circumstances. In addition, to prevent parent carriers of GDSs from hindering competition from other GDSs, parent carriers will continue to be required to provide other GDSs with the same information on their transport services and to accept bookings from another GDS.
17
There are also GDS regulations in Canada, under the regulatory authority of the Canadian Department of Transport. Under the present regulations, Air Canada, the principal Canadian airline, could choose distribution channels that it owns and controls or distribution through another GDS rather than through our Travel Commerce Platform.
Although all GDS regulations in the United States (which only covered airline distribution) expired as of July 2004, the U.S. Department of Transportation, or DOT, retains the jurisdiction to regulate GDSs if they engage in “unfair or deceptive” practices relating to airfare price listings. To date, the DOT has not intervened in relation to our Travel Commerce Platform activities in the United States, but has provided industry guidance regarding, among other things, any biasing of air carrier GDS displays. On May 21, 2014, the DOT proposed rules requiring airlines and ticket agents to disclose fees for basic ancillary information associated with airline tickets. The proposed rules contain two alternative proposals, one of which would require carriers to disclose fee information to all ticket agents, including GDSs, and another alternative that would exclude GDSs.
In 2010, new Civil Aviation Requirements were issued by the Government of India to regulate CRSs operating in India for the purpose of displaying or selling air services, to promote fair competition in the airline sector and to ensure that consumers do not receive inaccurate or misleading information on airline services.
On October 1, 2012, the Interim Regulations on Administering the Permit of Direct Access to and Use of Foreign Computer Reservation System by Foreign Airlines’ Agents in China were published by the Civil Aviation Administration of China, or CAAC, and became effective on that date. The key element of the new regulations is the introduction of a permit scheme whereby foreign airlines are able to apply to CAAC for approval to allow Chinese-based travel agencies to access their nominated foreign CRS provider’s system for the purpose of making international bookings.
Because eNett operates an innovative payment solution, the regulatory environment for eNett products and services is not clearly defined and varies from country to country. In November 2013, eNett was granted a financial services license in Australia by the Australian Securities and Investments Commission. eNett had previously provided its eNett VAN solution pursuant to a sub-license from an Australian payments processor. In the European Union, eNett partners with regulated entities to limit its obligation to be regulated as a financial services provider with regard to its management of client funds. In jurisdictions where eNett’s operations are regulated, the regulations generally require licensing, insurance, systems and controls, client identification checks, and/or compliance staffing. Any violation of these regulatory requirements could compromise licenses and lead to financial penalties, imposed changes to systems and controls, closer monitoring, and detailed regulatory reviews.
We are also subject to regulations affecting issues such as international trade.
Privacy and Data Protection Regulations
Privacy regulations continue to evolve and on occasion may be inconsistent from one jurisdiction to another. Many states in the United States have introduced legislation or enacted laws and regulations that provide for penalties for failure to notify customers when security is breached, even by third parties.
Many countries have enacted or are considering legislation to regulate the protection of private information of consumers. In the United States, significant legislation is pending at the state and federal level. We cannot predict whether any of the proposed privacy legislation currently pending will be enacted and what effect, if any, it would have on our business.
A primary source of privacy regulations to which our operations are subject is the E.U. Data Protection Directive 95/46/EC of the European Parliament and Council (October 24, 1995), or the E.U. Data Protection Directive. Pursuant to this Directive, individual countries within the E.U. have specific regulations related to the
18
trans-border dataflow of personal information (i.e., sending personal information from one country to another). The E.U. Data Protection Directive requires companies doing business in E.U. member states to comply with its standards. It provides for, among other things, specific regulations requiring all non-E.U. countries doing business with E.U. member states to provide adequate data privacy protection when processing personal data from any of the E.U. member states. The E.U. has enabled several means for U.S.-based companies to comply with the E.U. Data Protection Directive, including a voluntary safe-harbor arrangement and a set of standard form contractual clauses for the transfer of personal data outside of Europe. We most recently completed self-certification for our GDS data processing under this safe-harbor arrangement on February 12, 2014. In January 2012, the European Commission issued a draft data protection regulation intended to replace this Directive, and we are monitoring developments in this rulemaking.
We are also subject to the U.S.-E.U. Safe Harbor Framework, or the Safe-Harbor, which provides a method for U.S. companies to transfer personal data outside the E.U. in a way that is consistent with the E.U. Data Protection Directive. To join the Safe-Harbor, we were required to self-certify to the U.S. Department of Commerce that we comply with E.U. standards. The Federal Trade Commission has enforcement authority over entities participating in the Safe-Harbor.
The CRS Regulations in force in Europe also incorporate personal data protection provisions that, among other things, classify GDSs as data controllers under the E.U. Data Protection Directive. The data protection provisions contained in the CRS Regulations are complementary to E.U. national and international data protection and privacy laws.
Many other countries have adopted data protection regimes. An example is Canada’s Personal Information and Protection of Electronic Documents Act, or PIPEDA. PIPEDA provides Canadian residents with privacy protections with regard to transactions with businesses and organizations in the private sector. PIPEDA recognizes the need of organizations to collect, use and share personal information and establishes rules for handling personal information.
Russia has recently enacted a data localization law that will require all personal data of Russian citizens to be stored and processed in Russia, effective on September 1, 2015. This law conflicts with our operational practice of aggregating and processing data at a central site. We are coordinating our response with other affected businesses.
Iran Sanctions Disclosure
As part of our global business in the travel industry, we provide certain passenger travel related Travel Commerce Platform and Technology Services to Iran Air. We also provide certain Technology Services to Iran Air Tours. All of these services are either exempt from applicable sanctions prohibitions pursuant to a statutory exemption permitting transactions ordinarily incident to travel or, to the extent not otherwise exempt, specifically licensed by the U.S. Office of Foreign Assets Control. Subject to any changes in the exempt/licensed status of such activities, we intend to continue these business activities, which are directly related to and promote the arrangement of travel for individuals.
The gross revenue and net profit attributable to these activities for the year ended December 31, 2014 were approximately $660,000 and $470,000, respectively.
Company Information
Our principal executive office is located at Axis One, Axis Park, Langley, Berkshire SL3 8AG, United Kingdom, and our telephone number is +44-1753-288-000. We file electronically with the Securities and Exchange Commission (the “SEC”) required reports on Form 8-K, Form 10-Q and Form 10-K, proxy materials, ownership reports for insiders as required by Section 16 of the Securities Exchange Act of 1934, registration
19
statements and other forms or reports as required. Certain of our officers and directors also file statements of changes in beneficial ownership on Form 4 with the SEC. The public may read and copy any materials that we have filed with the SEC at the SEC’s Public Reference Room located at 100 F Street, NE, Washington, D.C. 20549. The public may obtain information on the operation of the Public Reference Room by calling the SEC at 1-800-SEC-0330. Such materials also may be accessed electronically on the SEC’s Internet site (sec.gov). We maintain a website (travelport.com), and copies of our annual report on Form 10-K, quarterly reports on Form 10-Q, current reports on Form 8-K, Section 16 reports, proxy materials and any amendments to these reports filed or furnished with the SEC are available free of charge in the Investor Relations section of our website, as soon as reasonably practicable after filing with the SEC. Copies of our Board committee charters, Codes of Conduct and Ethics, Corporate Governance Guidelines and other corporate governance information are also available on our website. If we should decide to amend any of our Board committee charters, Codes of Conduct and Ethics or other corporate governance document, copies of such amendments will be made available to the public through our website. The information contained on our website is not included in, or incorporated by reference into, this Annual Report on Form 10-K.
20
ITEM 1A. RISK FACTORS
The following is a cautionary discussion of the most significant risks, uncertainties and assumptions that we believe are significant to our business and should be considered carefully in conjunction with all of the other information set forth in this Annual Report on Form 10-K. If any of the risks described below actually occur, our business, financial condition and results of operations could be materially adversely affected. Based on the information currently known to us, we believe that the following information identifies the most significant risk factors affecting us in each of these categories of risk. Additional risks and uncertainties not presently known to us or that we currently believe to be immaterial may also adversely affect our business, financial condition and results of operations. Achievement of future results is subject to risks, uncertainties and potentially inaccurate assumptions. Past financial performance may not be a reliable indicator of future performance and historical trends should not be used to anticipate results or trends in future periods.
Risks Relating to Our Business
Market and Industry Risks
Our revenue is derived from the global travel industry and a prolonged or substantial decrease in global travel volume, particularly air travel, as well as other industry trends, could adversely affect us.
Our revenue is derived from the global travel industry. As a result, our revenue is directly related to the overall level of travel activity, particularly air travel volume, and is therefore significantly impacted by declines in, or disruptions to, travel in any region due to factors entirely outside of our control. Such factors include:
| | • | | global security issues, political instability, acts or threats of terrorism, hostilities or war and other political issues that could adversely affect global air travel volume; |
| | • | | epidemics or pandemics, such as ebola, H1N1 “swine” flu, avian flu and Severe Acute Respiratory Syndrome; |
| | • | | natural disasters, such as hurricanes, volcanic activity and resulting ash clouds, earthquakes and tsunamis, such as the November 2013 typhoon in the Philippines; |
| | • | | general economic conditions, particularly to the extent that adverse conditions may cause a decline in travel volume, such as the crisis in the global credit and financial markets, diminished liquidity and credit availability, declines in consumer confidence and discretionary income, declines in economic growth, increases in unemployment rates and uncertainty about economic stability; |
| | • | | the financial condition of travel providers, including airlines and hotels, and the impact of any changes such as airline bankruptcies or mergers, on the cost and availability of air travel and hotel rooms; |
| | • | | changes to laws and regulations governing the airline and travel industry and the adoption of new laws and regulations detrimental to operations, including environmental and tax laws and regulations and carbon emissions reduction targets for flights to and from the European Union area in 2013; |
| | • | | work stoppages or labor unrest at any of the major airlines or other travel providers or at airports; |
| | • | | increased security, particularly airport security that could reduce the convenience of air travel; |
| | • | | travelers’ perception of the occurrence of travel related accidents, of the environmental impact of air travel, particularly in regards to CO2 emissions, or of the scope, severity and timing of the other factors described above; and |
| | • | | changes in hotel occupancy rates. |
If there were to be a prolonged substantial decrease in travel volume, particularly air travel volume, for these or any other reason, it would have an adverse impact on our business, financial condition and results of operations.
21
The travel industry is highly competitive, and we are subject to risks relating to competition that may adversely affect our performance.
Our business operates in highly competitive industries. If we cannot compete effectively, we may lose share to our competitors, which may adversely affect our financial performance. Our continued success depends, to a large extent, upon our ability to compete effectively in industries that contain numerous competitors, some of which may have significantly greater financial, marketing, personnel and other resources than us.
Our Travel Commerce Platform has two different primary categories of customers, namely travel providers, which provide travel content, and travel agencies, which shop for and book that content on behalf of end customers. The inter-dependence of effectively serving these customer groups, and the resulting network effects, may impact our ability to attract customers. If we are unable to attract a sufficient number of travel providers to provide comprehensive travel content, our ability to service travel agencies will be adversely impacted. Conversely, if we are unable to attract or retain a sufficient number of travel agencies, our ability to maintain our large base of travel providers and attract new travel providers will be impaired.
In addition to supplying sufficient content, the ability of our Travel Commerce Platform to attract travel agencies is dependent on the development of new products to enhance our Travel Commerce Platform and on the provision of adequate commissions to travel agencies. Competition to attract travel agencies is particularly intense as travel agencies, particularly larger ones, have the ability to access content from a variety of sources, including subscribing to more than one GDS at any given time. We also have had to, and expect that it will continue in certain circumstances to be necessary to, increase commissions to travel agencies in connection with renewals of their contracts, which may in the future reduce margins. If travel agencies are dissatisfied with our Travel Commerce Platform or we do not pay adequate commissions or provide other incentives to travel agencies to remain competitive, our Travel Commerce Platform may lose a number of travel agency customers.
Our Travel Commerce Platform competes against traditional GDSs operated by Abacus International Pte Ltd (“Abacus”), Amadeus IT Group SA (“Amadeus”) and Sabre Corporation (“Sabre”), as well as against local distribution systems and alternative distribution technologies. Our Travel Commerce Platform also competes against direct distribution of travel content by travel providers, such as airlines, hotels and car rental companies, many of which distribute all or part of their inventory directly through their own travel distribution websites (known as “supplier.com websites”). In addition, our Travel Commerce Platform competes against travel providers that supply content directly to travel agencies as well as new companies in the industry that are developing distribution systems without the large technology investment and network costs of a traditional GDS. The revolutionary emergence of mobile applications that link directly to providers may create a vigorous source of new competition that bypasses GDSs.
Increased competition may result in reduced operating margins, as well as loss of share and brand recognition. We may not be able to compete successfully against current and future competitors, and competitive pressures we face could have a material adverse effect on our business, financial condition or results of operations.
If we fail to develop and deliver new innovative products or enhance our existing products and services in a timely and cost-effective manner in response to rapid technological change and customer demands, our business will suffer.
Our industry is subject to constant and rapid technological change and product obsolescence as customers and competitors create new and innovative products and technologies. Products or technologies developed by our competitors may render our products or technologies obsolete or noncompetitive. We must develop innovative products and services and enhance our existing products and services to meet rapidly evolving demands to attract travel agencies. The development process to design leading, sustainable and desirable products to generate new revenue streams and profits requires us to accurately anticipate technological changes and business trends. Developing and enhancing these products is uncertain and can be time-consuming, costly and complex. If we do
22
not continue to develop innovative products that are in demand by our customers, we may be unable to maintain existing customers or attract new customers. Customer and business requirements can change during the development process. There is a risk that these developments and enhancements will be late, fail to meet customer or business specifications, not be competitive with products or services from our competitors that offer comparable or superior performance and functionality or fail to generate new revenue streams and profits. Our business will suffer if we fail to develop and introduce new innovative products and services or product and service enhancements on a timely and cost-effective basis.
Trends in pricing and other terms of agreements among airlines and travel agencies have become less favorable to us, and a further deterioration or a failure to renew these agreements may occur in the future, which could reduce our revenue and margins.
A significant portion of our revenue is derived from fees paid by airlines for bookings made through our Travel Commerce Platform. Airlines have sought to reduce or eliminate these fees in an effort to reduce distribution costs. One manner in which they have done so is to differentiate the content, in this case, the fares and inventory, that they provide to us and to our competitors from the content that they distribute directly themselves. In these cases, airlines provide some of their content to us and our competitors, while withholding other content, such as lower cost fares, for distribution via their own supplier.com websites unless the GDS agrees to significant discounts. Certain airlines have also threatened to withdraw content, in whole or in part, from us or our competitors as a means of obtaining lower booking fees or, alternatively, to charge to access their lower cost fares or charge travel agencies for bookings generated in our Travel Commerce Platform. Airlines also have aggressively expanded their use of the direct online distribution model for tickets in the United States and in Europe. There also has been an increase in the number of airlines that seek to sell optional ancillary services, such as fees for checked baggage or premium seats, only through their direct distribution channels, which threaten to further fragment content and disadvantage us and our competitors by making it more difficult to deliver a platform that allows travel agencies to shop for a single, “all-inclusive” price for travel.
We have entered into content agreements with most major carriers in the Americas and Europe, and a growing number of carriers in the Middle East and Africa, which provides us with access to the near-complete scope of public fares and inventory which the carriers generally make available through direct channels, such as their own supplier.com websites, with a contract duration usually ranging from three to seven years. In addition, we have entered into agreements with most major carriers in Asia Pacific, which provide us with access to varying levels of their content. We may not be able to renew these agreements on a commercially reasonable basis or at all. If we are unable to renew these agreements, we will be disadvantaged compared to our competitors, and our financial results will be adversely impacted. The content agreements have required us to make significant price concessions to the participating airlines. If we are required to make additional concessions to renew or extend the agreements, it could have a material adverse effect on our business, financial condition or results of operations. Moreover, as existing content agreements come up for renewal, there is no guarantee that the participating airlines will continue to provide their content to us to the same extent or on the same terms as they do now. For example, our content agreements with airlines representing approximately 27% of Travel Commerce Platform revenue for the year ended December 31, 2014 are up for renewal or are potentially terminable by such carriers in 2015. In addition, certain content agreements may be terminated earlier pursuant to the specific terms of each agreement. A substantial reduction in the amount of content received from the participating airlines or changes in pricing options will also negatively affect our competitive positioning, revenue and financial condition. Although we continue to have participation agreements with these airline providers, in which they have agreed to participate in our Travel Commerce Platform, a material adverse impact on our business may occur if these agreements are terminated and we are unable to reach agreement with such carriers regarding new content agreements.
In addition, we have implemented, in some countries, an alternative business and financial model, generally referred to as the “opt-in” model, for travel agencies. Under the “opt-in” model, travel agencies are offered the opportunity to pay a fee to us or to agree to a reduction in the financial incentives to be paid to them in order to
23
be assured of having access to all the content provided to us by the participating airlines or to avoid an airline-imposed surcharge on bookings made through our Travel Commerce Platform. There is pressure on us to provide highly competitive terms for such “opt-in” models as many travel agencies have the ability to access content from a variety of sources, including our competitors. The “opt-in” model has been introduced in a number of situations in parallel with content agreements between us and certain airlines to recoup certain fees from travel agencies and to offset some of the discounts provided to airlines in return for guaranteed access to content. The rate of adoption by travel agencies, where “opt-in” has been implemented, has been very high. If airlines require further discounts in connection with guaranteeing access to full content and in response thereto, the “opt-in” model becomes widely adopted, we could receive lower fees from the airlines. These lower fees are likely to be only partially offset by new fees paid by travel agencies and/or reduced incentives or loyalty payments to travel agencies, which would adversely affect our results of operations. In addition, if travel agencies choose not to opt in, such travel agencies would not receive access to all the content available through us without making further payment, which could have an adverse effect on the number of segments booked through our Travel Commerce Platform.
The level of fees and commissions we pay to travel agencies is subject to continuous competitive pressure as we renew our agreements with them. If we are required to pay higher rates of commissions, it will adversely affect our margins.
We depend on our relationships with travel providers, and adverse changes in these relationships or our inability to enter into new relationships could negatively affect our access to travel offerings and reduce our revenue.
We rely significantly on our relationships with airlines, hotels and other travel providers to enable us to offer our travel agency customers comprehensive access to travel services and products. The majority of our agreements remain in effect each year, with exceptions usually linked to airline mergers or insolvencies. Adverse changes in any of our relationships with travel providers or the inability to enter into new relationships with travel providers could reduce the amount of inventory that we are able to offer through our Travel Commerce Platform, and could negatively impact our results of operations and the availability and competitiveness of travel products we offer. Our arrangements with travel providers may not remain in effect on current or similar terms, and the net impact of future pricing options may adversely impact revenue. Our top ten providers by revenue, combined, accounted for approximately 30% of our revenue for the year ended December 31, 2014, and no single provider accounted for more than 10% of revenue. In 2014, we had 38 planned airline contract renewals, and we successfully renewed all such contracts. We currently have 60 and 48 planned airline contract renewals in 2015 and 2016, respectively, including contracts which roll on an annual basis.
Travel providers are increasingly focused on driving online demand to their own supplier.com websites and may cease to supply us with the same level of access to travel inventory in the future. In addition, some LCCs historically have not distributed content through us or other third-party intermediaries. If the airline industry continues to shift from a full-service carrier model to a low-cost one, this trend may result in more carriers moving ticket distribution systems in-house and a decrease in the demand for our products.
We are in continuous dialogue with our major hotel providers about the nature and extent of their participation in our Travel Commerce Platform. If hotel occupancy rates improve to the point that our hotel providers no longer place the same value on our Travel Commerce Platform, such providers may reduce the amount of inventory they make available through our Travel Commerce Platform or the amount we are able to earn in connection with hotel transactions. A significant reduction on the part of any of our major providers of their participation in our Travel Commerce Platform for a sustained period of time or a provider’s complete withdrawal could have a material adverse effect on our business, financial condition or results of operations. In addition, we strive to increase hotel participation in our system as part of our growth strategy. If we are not successful in increasing the number of hotels participating in our system, the growth of our business may be restrained.
24
We are subject to a certain degree of revenue concentration among a portion of our customer base.
Orbitz Worldwide currently is the largest travel agency on our Travel Commerce Platform, accounting for 6% of our net revenue in the year ended December 31, 2014. Our next nine largest travel agency customers accounted for an additional 28% of our net revenue during the same period. Travel agency contracts representing approximately 22%, 12% and 66% of 2014 revenue are up for renewal in 2015, 2016 and beyond, respectively.
In February 2014, we entered into a new long-term agreement with Orbitz Worldwide. Due to the increase in payments payable to Orbitz Worldwide under the new agreement in 2014, we experienced a negative impact on our 2014 cash flow attributable to this agreement, but no impact to our 2014 Adjusted EBITDA. From 2015 onwards, the combination of increased payments and greater flexibility for Orbitz Worldwide will have a greater impact on both our earnings and cash flow, which could be material.
In the event Orbitz Worldwide or any other substantial customer terminates its relationships with us or such customer’s business is materially impacted for any reason, such as a travel provider withholding content from a travel agency customer, and, as a result, such travel agency loses, or fails to generate, a substantial amount of bookings that would otherwise be processed through our Travel Commerce Platform, our business and results of operations would be adversely affected.
Travel providers are seeking alternative distribution models, including those involving direct access to travelers, which may adversely affect our results of operations.
Travel providers are seeking to decrease their reliance on third-party distributors, including us and our GDS competitors, for distribution of their content. For example, some travel providers have created or expanded efforts to establish commercial relationships with online and traditional travel agencies to book travel with those providers directly, rather than through an intermediary. Many airlines, hotels, car rental companies and cruise operators have also established or improved their own supplier.com websites and mobile offerings, and may offer incentives such as bonus miles or loyalty points, lower or no transaction or processing fees, priority waitlist clearance or e-ticketing for sales through these channels. In addition, metasearch travel websites facilitate access to supplier.com websites by aggregating the content of those websites. Due to the combined impact of direct bookings with the airlines, supplier.com websites and other non-GDS distribution channels, the percentage of air bookings made without the use of us or our GDS competitors at any stage in the chain between providers and end-customers may continue to increase. In addition, efforts by other major airlines to encourage our travel agencies to book directly rather than through our Travel Commerce Platform could adversely affect our results of operations.
Furthermore, recent trends towards disintermediation in the global travel industry could adversely affect our Travel Commerce Platform. For example, airlines have made some of their offerings unavailable to unrelated distributors, or made them available only in exchange for lower distribution fees. Some LCCs continue to distribute exclusively through direct channels, bypassing us and other third-party distributors completely and, as a whole, have increased their share of bookings in recent years, particularly in short-haul travel. In addition, several travel providers have formed joint ventures or alliances that offer multi-provider travel distribution websites. Finally, some airlines are exploring alternative global distribution methods developed by new entrants to the global distribution marketplace. Such new entrants propose technology that is purported to be efficient, which they claim enables the distribution of airline tickets in a manner that is more cost-effective to the airline provider because no or lower incentive or loyalty payments are paid to travel agencies. If these trends lead to lower participation by airlines and other travel providers in our Travel Commerce Platform, then our business, financial condition or results of operations could be materially adversely affected.
In addition, given the diverse and growing number of alternative travel distribution channels, such as supplier.com websites and direct connect channels between travel suppliers and travel providers, as well as new technologies that allow travel agencies and consumers to bypass third-party intermediaries, increases in travel
25
volumes, particularly air travel, may not translate in the same proportion to increases in volume passing through our Travel Commerce Platform, and we may therefore not benefit from a cyclical recovery in the travel industry to a similar extent as other industry participants.
We rely on third-party national distribution companies to market our GDS services in certain regions, which exposes us to risks associated with the lack of direct management control.
Our Travel Commerce Platform utilizes third-party, independently owned and managed NDCs to market products and distribute and provide services in certain countries, including Austria, India, Indonesia, Kuwait, Lebanon, Pakistan, Syria, Turkey, Kazakhstan and Yemen, as well as many countries in Africa. In Asia, where many national carriers own one of our regional competitors, we often use local companies to act as NDCs.
We rely on our NDCs and the manner in which they operate their business to develop and promote our global business. Our top ten NDCs generated approximately 11% of revenue in 2014, and no single NDC accounted for more than 5% of revenue. We pay each of our NDCs a commission relative to the number of segments booked by travel agencies with which the NDC has a relationship. The NDCs are independent business operators, are not our employees and we do not exercise management control over their day-to-day operations. We provide training and support to the NDCs, but the success of their marketing efforts and the quality of the services they provide is beyond our control. If they do not meet our standards for distribution, our image and reputation may suffer materially, and sales in those regions could decline significantly. In addition, any interruption in these third-party services or deterioration in their performance could have a material adverse effect on our business, financial condition or results of operations.
Consolidation in the travel industry may result in lost bookings and reduced revenue.
Consolidation among travel providers, including airline mergers and alliances, may increase competition from distribution channels related to those travel providers and place more negotiating leverage in the hands of those travel providers to attempt to lower booking fees further and to lower commissions. Examples include the merger of United and Continental Airlines, the merger of American Airlines and US Airways, the acquisition of AirTran Airways by Southwest Airlines and the merger of British Airways and Iberia. In addition, cooperation has increased within the Oneworld, SkyTeam and Star alliances. Changes in ownership of travel agencies may also cause them to direct less business towards us. If we are unable to compete effectively, competitors could divert travel providers and travel agencies away from our travel distribution channels, which could adversely affect our results of operations. Mergers and acquisitions of airlines may also result in a reduction in total flights and overall passenger capacity and higher fares, which may adversely affect the ability of our business to generate revenue.
Consolidation among travel agencies and competition for travel agency customers may also adversely affect our results of operations, since we compete to attract and retain travel agency customers. Reductions in commissions paid by some travel providers, such as airlines, to travel agencies contribute to travel agencies having a greater dependency on traveler-paid service fees and incentive or loyalty payments paid by us and our competitors and may contribute to travel agencies consolidating. Consolidation of travel agencies increases competition for these travel agency customers and increases the ability of those travel agencies to negotiate higher incentives or loyalty payments from us. In addition, a decision by airlines to surcharge the channel represented by travel agencies, for example, by surcharging fares booked through travel agencies or passing on charges to travel agencies, could have an adverse impact on our business, particularly in regions in which our Travel Commerce Platform is a significant source of bookings for an airline choosing to impose such surcharges. To compete effectively, we may need to increase incentives or loyalty payments, pre-pay incentives, discount or waive product or service fees or increase spending on marketing or product development.
26
Our business is exposed to customer credit risk and fraudulent booking activity, against which we may not be able to protect ourselves fully.
Our business is subject to the risks of non-payment and non-performance by travel providers, which may fail to make payments according to the terms of their agreements with us. For example, a small number of airlines that do not settle payment through International Air Transport Association (“IATA”) billing and settlement provider have, from time to time, not made timely payments for bookings made through our Travel Commerce Platform. We manage our exposure to credit risk through credit analysis and monitoring procedures, and sometimes use credit agreements, prepayments, security deposits and bank guarantees. However, these procedures and policies cannot fully eliminate customer credit risk, and to the extent our policies and procedures prove to be inadequate, our business, financial condition or results of operations may be adversely affected.
In addition, we are exposed to risk and potential liability from travel agency fraudulent booking activity resulting from travel agencies’ use of our Travel Commerce Platform for fraudulent purposes. We contractually disclaim all liability for any such loss, but periodically incur claims from airlines who allege that we should have more responsibility for any third-party fraud.
Some of our customers, NDCs counterparties and providers may be highly leveraged, not well capitalized and subject to their own operating, legal and regulatory risks and, even if our credit review and analysis mechanisms work properly, we may experience financial losses in our dealings with such parties. A lack of liquidity in the capital markets or the continued weak performance in the economy may cause our customers to increase the time they take to pay or to default on their payment obligations, which could negatively affect our results. In addition, continued weakness in the economy could cause some of our customers to become illiquid, delay payments, or could adversely affect collection on their accounts, which could result in a higher level of bad debt expense.
Economic conditions in the global travel industry could impact our business and results of operations.
As a participant in the global travel industry, our business and operating results are impacted by global economic conditions, including the European debt crisis, a slowdown in growth of the Chinese economy, a prolonged slow economic recovery in Japan and a general reduction in net disposable income as a result of fiscal measures adopted by countries to address high levels of budgetary indebtedness, which may adversely affect our business, results of operations and financial condition. In our industry, the past financial crisis and global recession have resulted in higher unemployment, a decline in consumer confidence, large-scale business failures and tightened credit markets. As a result, the global travel industry, which historically has grown at a rate in excess of global GDP growth during economic expansions, has experienced a cyclical downturn. A continuation of adverse economic developments in areas such as employment levels, business conditions, interest rates, tax rates, fuel and energy costs, particularly the expected rise in the price of crude oil, and other matters could reduce discretionary spending further and cause the travel industry to continue to contract. In addition, the global economy may not recover as quickly or to the extent anticipated, and consumer spending on leisure travel and business spending on business travel may not increase despite improvement in economic conditions. As a result, our business may not benefit from a broader macroeconomic recovery, which could adversely affect our business, financial condition or results of operations.
Operational Risks
We rely on information technology to operate our business and maintain our competitiveness, and any failure to adapt to technological developments or industry trends could harm our business.
We depend upon the use of sophisticated information technologies and systems, including technologies and systems utilized for reservation systems, communications, procurement and administrative systems. As our operations grow in both size and scope, we continuously need to improve and upgrade our systems and infrastructure to offer an increasing number of customers and travel providers enhanced products, services, features and functionality, while maintaining the reliability and integrity of our systems and infrastructure. Our
27
future success also depends on our ability to adapt to rapidly changing technologies in our industry, particularly the increasing use of internet-based products and services, to change our services and infrastructure so they address evolving industry standards and to improve the performance, features and reliability of our services in response to competitive service and product offerings and the evolving demands of the marketplace. We have recently introduced a number of new products and services, such as Travelport Smartpoint and the Travelport Merchandising Platform, including Travelport Rich Content and Branding. If there are technological impediments to introducing or maintaining these or other products and services, or if these products and services do not meet the requirements of our customers, our business, financial condition or results of operations may be adversely affected.
It is possible that, if we are not able to maintain existing systems, obtain new technologies and systems, or replace or introduce new technologies and systems as quickly as our competitors or in a cost-effective manner, our business and operations could be materially adversely affected. Also, we may not achieve the benefits anticipated or required from any new technology or system, or be able to devote financial resources to new technologies and systems in the future.
We rely primarily on a single data center to conduct our business.
Our business, which utilizes a significant amount of our information technology, and the financial business systems rely on computer infrastructure primarily housed in our data center near Atlanta, Georgia, to conduct its business. In the event the operations of this data center suffer any significant interruptions or the data center becomes significantly inoperable, such event would have a material adverse effect on our business and reputation and could result in a loss of customers. Although we have taken steps to strengthen physical and information security and add redundancy to this facility, the data center could be exposed to damage or interruption from fire, natural disaster, power loss, war, acts of terrorism, plane crashes, telecommunications failure, computer malfunctions, unauthorized entry, IT hacking and computer viruses. The steps we have taken and continue to take to prevent system failure and unauthorized transaction activity may not be successful. Our use of backup and disaster recovery systems may not allow us to recover from a system failure fully, or on a timely basis, and our property and business insurance may not be adequate to compensate us for all losses that may occur.
eNett, our majority-owned subsidiary, depends on critical service providers, may be subject to regulatory requirements and may experience conflicts.
eNett, our majority-owned subsidiary, operating in the payment solutions business, is exposed to operational, regulatory and governance risks. eNett is enabled to provide its virtual card solution pursuant to virtual card issuers licensed by MasterCard and, in particular, has a material relationship with a European-based issuer licensed by MasterCard. An extended service failure by eNett’s primary issuer or MasterCard would greatly harm eNett’s current business and growth opportunities. Due to its innovative solutions, the regulatory environment for eNett is not clearly defined in certain jurisdictions, and in other jurisdictions, laws or regulations may be modified or adopted that may impact how eNett’s solutions are provided, including an increase in costs to eNett to provide such solutions. Financial services regulators in any of the jurisdictions of the eNett customer base may construe potentially applicable requirements in a manner that results in eNett loss of business, slower growth, financial penalties and operational burdens. In addition, the minority shareholder of eNett may have economic or business interests or goals that are inconsistent with ours, take actions contrary to our objectives, undergo a change of control or be unable or unwilling to fulfill its obligations in support of eNett, which may affect eNett’s and our financial conditions or results of operations.
System interruptions, attacks and slowdowns may cause us to lose customers or business opportunities or to incur liabilities.
If we are unable to maintain and improve our IT systems and infrastructure, this might result in system interruptions and slowdowns. In the event of system interruptions and/or slow delivery times, prolonged or frequent service outages or insufficient capacity which impedes us from efficiently providing services to our
28
customers, we may lose customers and revenue or incur liabilities. In addition, our information technologies and systems are vulnerable to damage, interruption or fraudulent activity from various causes, including:
| | • | | power losses, computer systems failure, internet and telecommunications or data network failures, operator error, losses and corruption of data and similar events; |
| | • | | computer viruses, penetration by individuals seeking to disrupt operations, misappropriate information or perpetrate fraudulent activity and other physical or electronic breaches of security; |
| | • | | the failure of third-party software, systems or services that we rely upon to maintain our own operations; and |
| | • | | natural disasters, pandemics, wars and acts of terrorism. |
We may have inadequate insurance coverage or insurance limits to compensate for losses from a major interruption, and remediation may be costly and have a material adverse effect on our operating results and financial condition. Any extended interruption or degradation in our technologies or systems, or any substantial loss of data, could significantly curtail our ability to conduct our business and generate revenue. We could incur financial liability from fraudulent activity perpetrated on our systems.
In addition, the secure transmission of confidential information over the internet is essential in maintaining travel provider and travel agency confidence in our services. Substantial or ongoing data security breaches, whether instigated internally or externally on our system or other internet-based systems, could significantly harm our business. Our travel providers currently require end customers to guarantee their transactions with their credit card online. We rely on licensed encryption and authentication technology to effect secure transmission of confidential end customer information, including credit card numbers. It is possible that advances in computer capabilities, new discoveries or other developments could result in a compromise or breach of the technology that we use to protect customer transaction data.
We incur substantial expense to protect against security breaches and their consequences. However, our security measures may not prevent data security breaches. We may be unsuccessful in implementing remediation plans to address potential exposures. A party (whether internal, external, an affiliate or unrelated third party) that is able to circumvent our data security systems could also obtain proprietary information or cause significant interruptions in our operations. Security breaches could also damage our reputation and expose us to a risk of loss or litigation and possible liability. Security breaches could also cause our current and potential travel providers and travel agencies to lose confidence in our data security, which would have a negative effect on the demand for our products and services.
We have been the target of data security attacks and may experience attacks in the future. Although we have managed to substantially counter these attacks and minimize our exposure, there can be no assurances that we will be able to successfully counter and limit any such attacks in the future.
We provide IT services to travel providers, primarily airlines, and any adverse changes in these relationships could adversely affect our business.
We provide hosting solutions and IT subscription services to airlines and the technology companies that support them. We host the reservations systems for Delta Air Lines, and provide IT subscription services for critical applications in fares, pricing and e-ticketing, directly and indirectly, to 266 airlines and airline ground handlers. Adverse changes in our relationships with our IT and hosting customers or our inability to enter into new relationships with other customers could affect our business, financial condition and results of operations. Our arrangements with our customers may not remain in effect on current or similar terms and this may negatively affect our business, financial condition or results of operations. In addition, if any of our key customers enters bankruptcy, liquidates or does not emerge from bankruptcy, our business, financial condition or results of operations may be adversely affected.
29
For example, as a result of the integration of the United-Continental systems in early March 2012, we no longer service United’s reservation system as United Airlines now uses the system previously used by Continental Airlines. The loss of the Master Service Agreement (“MSA”) with United Airlines resulted in a decline in Reported Segments and a decline of $27 million of net revenue and $21 million of operating income for the year ended December 31, 2013 compared to 2012.
We are dependent upon software, equipment and services provided by third parties.
We are dependent upon software, equipment and services provided and/or managed by third parties in the operation of our business. In the event that the performance of such software, equipment or services provided and/or managed by third parties deteriorates or our arrangements with any of these third parties related to the provision and/or management of software, equipment or services are terminated, we may not be able to find alternative services, equipment or software on a timely basis or on commercially reasonable terms, or at all, or be able to do so without significant cost or disruptions to our business, and our relationships with our customers may be adversely impacted. We have experienced occasional system outages arising from services that were provided by one of our key third-party providers. Our failure to secure agreements with such third parties, or the failure of such third parties to perform under such agreements, may have a material adverse effect on our business, financial condition or results of operations.
We are subject to additional risks as a result of having global operations.
We have customers in over 170 countries. As a result of having global operations, we are subject to numerous risks. At any given time, one or more of the following principal risks may apply to any or all of the countries in which our services are provided:
| | • | | delays in the development, availability and use of the internet as a communication, advertising and commerce medium; |
| | • | | difficulties in staffing and managing operations due to distance, time zones, language and cultural differences, including issues associated with establishing management systems infrastructure; |
| | • | | differences and changes in regulatory requirements, including anti-bribery rules, trade sanctions, data privacy requirements, labor laws and anti-competition regulations; |
| | • | | exposure to local economic and political conditions; |
| | • | | changes in tax laws and regulations, and interpretations thereof; |
| | • | | limitations on repatriation of earnings, which may limit our ability to transfer revenue from our non-U.S. operations and result in substantial transaction costs; |
| | • | | increased risk of piracy and limits on our ability to enforce our intellectual property rights, particularly in the Middle East, Africa and Asia; |
| | • | | diminished ability to enforce our contractual rights; |
| | • | | exchange rate fluctuations and cost and risks inherent in hedging such exposures; and |
| | • | | withholding and other taxes on remittances and other payments by subsidiaries. |
Our ability to identify, hire and retain senior management and other qualified personnel is critical to our results of operations and future growth.
We depend significantly on the continued services and performance of our senior management, particularly our professionals with experience in the travel industry. Any of these individuals may choose to terminate their employment with us at any time. If unexpected leadership turnover occurs without adequate succession plans, the loss of the services of any of these individuals, or any negative perceptions of our business as a result of those losses, could damage our brand image and our business. The specialized skills we require are difficult and time-
30
consuming to acquire and, as a result, such skills are and are expected to remain in limited supply. It requires a long time to hire and train replacement personnel. An inability to hire, train and retain a sufficient number of qualified employees or ensure effective succession plans for critical positions could materially hinder our business by, for example, delaying our ability to bring new products and services to market or impairing the success of our operations. Even if we are able to maintain our employee base, the resources needed to attract and retain such employees may adversely affect our business, financial condition or results of operations.
We may not effectively integrate or realize anticipated benefits from future acquisitions.
In the future, we may enter into other acquisitions and investments, including NDCs or joint ventures, based on assumptions with respect to operations, profitability and other matters that could subsequently prove to be incorrect. Furthermore, we may fail to successfully integrate any acquired businesses or joint ventures into our operations. If future acquisitions, significant investments or joint ventures do not perform in accordance with our expectations or are not effectively integrated, our business, operations or financial performance could be adversely affected.
Financial and Taxation Risks
We have a substantial level of indebtedness that may have an adverse impact on us.
As of December 31, 2014, our total indebtedness, excluding capital leases, was $2,347 million, including $2,375 million of term loans issued at a discount of 1.25% under our first lien credit agreement. If our first lien term loans due in September 2021 or any revolving credit borrowings due September 2019 are not repaid or refinanced prior to their maturity dates, we may not have the funds necessary, or otherwise be able, to repay the debt when it becomes due.
As of December 31, 2014, we had $100 million available for borrowing under our revolving credit facility, less any letters of credit that have been issued under the revolving credit facility and that are outstanding on such date. In addition, we may incur obligations that do not constitute indebtedness such as commitments to operating leases and commitments to purchase goods and services from specific suppliers related to information technology as disclosed further in the footnotes to our financial statements. To the extent we incur any of these obligations, the risks associated with our substantial level of indebtedness would increase, which could further limit our financial and operational flexibility.
Our substantial level of indebtedness and obligations could have important consequences for us, including the following:
| | • | | requiring a substantial portion of cash flow from operations to be dedicated to the payment of principal and interest on our indebtedness, therefore reducing our ability to use our cash flow to fund our capital expenditure and future business opportunities; |
| | • | | exposing us to the risk of higher interest rates because certain of our borrowings may be at variable rates of interest; |
| | • | | restricting us from making strategic acquisitions or causing us to make non-strategic divestitures; |
| | • | | limiting our ability to obtain additional equity or debt financing for general corporate purposes, acquisitions, investments, capital expenditures or other strategic purposes; |
| | • | | limiting our ability to adjust to changing business conditions and placing us at a competitive disadvantage to our less highly leveraged competitors; and |
| | • | | making us more vulnerable to general economic downturns and adverse developments in our business. |
The above factors could limit our financial and operational flexibility, and as a result could have a material adverse effect on our business, financial condition and results of operations.
31
Our credit agreement contains restrictions that may limit our flexibility in operating our business.
Our first lien credit agreement contains various covenants that limit our ability to engage in specified types of transactions. These covenants limit our ability to, among other things:
| | • | | incur additional indebtedness; |
| | • | | pay dividends on, repurchase or make distributions in respect of equity interests or make other restricted payments; |
| | • | | make certain investments; |
| | • | | create liens on certain assets to secure debt; |
| | • | | consolidate, merge, sell or otherwise dispose of all or substantially all of our assets; |
| | • | | enter into certain transactions with affiliates; and |
| | • | | designate our subsidiaries as unrestricted subsidiaries. |
In addition, under our first lien credit agreement, we are required to satisfy and maintain compliance with a first lien net leverage ratio. Our ability to meet this requirement can be affected by events beyond our control and, in the longer term, we may not be able to meet such requirement. A breach of any of these covenants could result in a default under our first lien credit agreement. Upon the occurrence of an event of default under our first lien credit agreement, the lenders could elect to declare all amounts outstanding under our first lien credit agreement to be immediately due and payable and terminate all commitments to extend further credit under our first lien credit agreement. If we are unable to repay those amounts, the lenders under our first lien credit agreement could take action or exercise remedies, including proceedings against the collateral granted to them to secure that indebtedness. We have pledged a significant portion of our assets as collateral under our first lien credit agreement. If the lenders under our first lien credit agreement accelerate the repayment of borrowings, we may not have sufficient assets to repay amounts outstanding under our first lien credit agreement, as well as our other secured borrowings or unsecured indebtedness.
Government regulation could impose taxes or other burdens on us, which could increase our costs or decrease demand for our products.
We rely upon generally accepted interpretations of tax laws and regulations in the countries in which we have customers and for which we provide travel inventory. We cannot be certain that these interpretations are accurate or that the responsible taxing authority is in agreement with our views. The imposition of additional taxes could cause us to have to pay taxes that we currently do not pay or collect on behalf of authorities and increase the costs of our products or services, which would increase our costs of operations.
Changes in tax laws or interpretations thereof may result in an increase in our effective tax rate.
We have operations in various countries that have differing tax laws and rates. A significant portion of our revenue and income is earned in countries with low corporate tax rates. Our income tax reporting is subject to audit by domestic and foreign authorities, and our effective tax rate may change from year to year based on changes in the mix of activities and income allocated or earned among various jurisdictions, tax laws in these jurisdictions, tax treaties between countries, our eligibility for benefits under those tax treaties and the estimated values of deferred tax assets and liabilities. Such changes, which, among other reasons, may arise from ongoing inter-governmental and Organization for Economic Cooperation and Development (OECD)-led proposals on international corporate taxation, could result in an increase in the effective tax rate applicable to all or a portion of our income which would adversely affect our financial performance.
32
We may become subject to taxes in Bermuda after March 31, 2035, which may have a material adverse effect on our results of operations and your investment.
The Bermuda Minister of Finance, under the Exempted Undertakings Tax Protection Act 1966 of Bermuda, as amended, has given us an assurance that if any legislation is enacted in Bermuda that would impose tax computed on profits or income, or computed on any capital asset, gain or appreciation, or any tax in the nature of estate duty or inheritance tax, then the imposition of any such tax will not be applicable to us or any of our operations, shares, debentures or other obligations until March 31, 2035, except insofar as such tax applies to persons ordinarily resident in Bermuda or to any taxes payable by us in respect of real property owned or leased by us in Bermuda. See “Taxation—Bermuda Tax Considerations.” Given the limited duration of the Bermuda Minister of Finance’s assurance, we cannot assure you that we will not be subject to any Bermuda tax after March 31, 2035.
Fluctuations in the exchange rate of the U.S. dollar and other currencies may adversely impact our results of operations.
Our results of operations are reported in U.S. dollars. While most of our revenue is denominated in U.S. dollars, a portion of our revenue and costs is denominated in other currencies, such as the British pound, the Euro and the Australian dollar. As a result, we face exposure to adverse movements in currency exchange rates. The results of our operations and our operating expenses are exposed to foreign exchange rate fluctuations as the financial results of those operations are translated from local currency into U.S. dollars upon consolidation. If the U.S. dollar weakens against the local currency, the translation of these foreign currency-based local operations will result in increased net assets, revenue, operating expenses, and net income or loss. Similarly, our local currency-based net assets, revenue, operating expenses, and net income or loss will decrease if the U.S. dollar strengthens against local currency. Additionally, transactions denominated in currencies other than the functional currency may result in gains and losses that may adversely impact our results of operations.
We have significant operations in Europe which may be adversely affected by the economic conditions in the eurozone.
We own and operate subsidiaries in substantially all of the countries in the eurozone. Due to the deterioration of credit and economic conditions in the eurozone, the future of the euro is uncertain. Certain countries in which we operate, including Greece and Portugal, have received financial aid packages from the European Union, or E.U., in the form of loans and restructuring of their sovereign debt and have introduced comprehensive fiscal austerity measures.
It is possible that certain eurozone countries could leave the euro currency in the future. The resulting macroeconomic impact of this remains unknown. For the year ended December 31, 2014, we recorded revenue of $161 million derived from operations within the southern eurozone countries, which are comprised of Greece, Italy, Spain and Portugal. This represents approximately 7% of our net revenue for the year ended December 31, 2014.
Legal and Regulatory Risks
We may not be able to protect our technology and intellectual property effectively, which would allow competitors to duplicate our products and services and could make it more difficult for us to compete with them.
Our success and ability to compete depend, in part, upon our technology and other intellectual property, including our brands. Among our significant assets are our software and other proprietary information and intellectual property rights. We rely on a combination of copyright, trademark and patent laws, trade secrets, confidentiality procedures and contractual provisions to protect these assets. Our software and related documentation are protected principally under trade secret and copyright laws, which afford only limited
33
protection. Unauthorized use and misuse of our technology and other intellectual property could have a material adverse effect on our business, financial condition or results of operations, and there can be no assurance that our legal remedies would adequately compensate us for the damage caused by unauthorized use.
Intellectual property challenges have been increasingly brought against members of the travel industry. We have in the past, and may in the future, need to take legal action to enforce our intellectual property rights, to protect our intellectual property or to determine the validity and scope of the proprietary rights of others. Any future legal action might result in substantial costs and diversion of resources and the attention of our management.
Third parties may claim that we have infringed their intellectual property rights, which could expose us to substantial damages and restrict our operations.
We have faced and in the future could face claims that we have infringed the patents, copyrights, trademarks or other intellectual property rights of others. In addition, we may be required to indemnify travel providers for claims made against them. Any claims against us or such providers could require us to spend significant time and money in litigation or pay damages. Such claims could also delay or prohibit the use of existing, or the release of new, products, services or processes, and the development of new intellectual property. We could be required to obtain licenses to the intellectual property that is the subject of the infringement claims, and resolution of these matters may not be available on acceptable terms or at all. Intellectual property claims against us could have a material adverse effect on our business, financial condition and results of operations, and such claims may result in a loss of intellectual property protections that relate to certain parts of our business.
Our processing, storage, use and disclosure of personal data could give rise to liabilities or business loss as a result of governmental regulation, conflicting legal requirements, evolving security standards, differing views of personal privacy rights or security breaches.
In the processing of our travel transactions, we receive and store a large volume of personally identifiable information. This information is increasingly subject to legislation and regulations in numerous jurisdictions around the world, typically intended to protect the privacy and security of personal information. It is also subject to evolving security standards for credit card information that is collected, processed and transmitted.
We could be adversely affected if legislation or regulations are expanded to require changes in our business practices or if governing jurisdictions interpret or implement their legislation or regulations in ways that negatively affect our business. For example, Russia has recently enacted a data localization law that will conflict with our operational model by requiring all personal data of Russian citizens to be stored and processed in Russia, effective on September 1, 2015. Travel businesses have also been subjected to investigations, lawsuits and adverse publicity due to allegedly improper disclosure of passenger information. As privacy and data protection have become more sensitive and politicized issues, we may also become exposed to potential liabilities in relation to our handling, use and disclosure of travel related data, as it pertains to individuals, as a result of differing views on the privacy of such data. Our business could be affected by public concerns in some parts of the world about US-based data processing following revelations of National Security Agency surveillance activities, even though these revelations and activities did not involve Travelport. These and other privacy concerns, including security breaches, could adversely impact our business, financial condition and results of operations.
Our business is regulated, and any failure to comply with such regulations or any changes in such regulations could adversely affect us.
We operate in a regulated industry. Our business, financial condition and results of operations could be adversely affected by unfavorable changes in or the enactment of new laws, rules and/or regulations applicable to us, which could decrease demand for products and services, increase costs or subject us to additional liabilities. Moreover, regulatory authorities have relatively broad discretion to grant, renew and revoke licenses and
34
approvals and to implement regulations. Accordingly, such regulatory authorities could prevent or temporarily suspend us from carrying on some or all of our activities or otherwise penalize us if our practices were found not to comply with the then current regulatory or licensing requirements or any interpretation of such requirements by the regulatory authority. Our failure to comply with any of these requirements or interpretations could have a material adverse effect on our operations.
We store a large volume of personally identifiable information which is subject to legislation and regulation in numerous jurisdictions around the world, including in the U.S. and in Europe.
In Europe, computerized reservation systems, or CRS, regulations or interpretations of them may increase our cost of doing business or lower our revenue, limit our ability to sell marketing data, impact relationships with travel agencies, airlines, rail companies, or others, impair the enforceability of existing agreements with travel agencies and other users of our system, prohibit or limit us from offering services or products, or limit our ability to establish or change fees.
The CRS regulations require a GDS to display a rail or rail/air alternative to air travel on the first screen of their principal displays in certain circumstances. We currently have few rail participants in our GDS. We can display direct point to point rail services in our GDS principal displays, for those rail operators that participate in our GDS. Given the lack of standardization in the rail industry, displaying rail connections in a similar way to airline connections is extremely complex, particularly in relation to journey planning, fare quotation, ticketing and booking systems. We are working towards a solution that will include functionality to search, shop and book connected rail alternatives at such time as the rail industry in Europe agrees on and provides a standard framework to do so.
Continued regulation of GDSs in the European Union and elsewhere could also create the operational challenge of supporting different products, services and business practices to conform to the different regulatory regimes.
Our failure to comply with these laws and regulations may subject us to fines, penalties and potential criminal violations. Any changes to these laws or regulations or any new laws or regulations may make it more difficult for us to operate our business and may have a material adverse effect on our operations. We do not currently maintain a central database of regulatory requirements affecting our worldwide operations and, as a result, the risk of non-compliance with the laws and regulations described above is heightened.
We may be classified as a passive foreign investment company, which could result in adverse United States federal income tax consequences to United States Holders of our common shares.
Based on the current and anticipated value of our assets and the composition of our income and assets, we do not expect to be treated as a passive foreign investment company (“PFIC”) for United States federal income tax purposes for our current taxable year ending December 31, 2015. However, the application of the PFIC rules is subject to uncertainty in several respects, and we cannot assure you that the United States Internal Revenue Service will not take a contrary position. A non-United States corporation will be a PFIC for any taxable year if either (i) at least 75% of its gross income for such year is passive income or (ii) at least 50% of the value of its assets (based on an average of the quarterly value of the assets) during such year is attributable to assets that produce passive income or are held for the production of passive income. A separate determination must be made after the close of each taxable year as to whether we were a PFIC for that year. Because the value of our assets for purposes of the PFIC test generally will be determined by reference to the market price of our common shares, a significant decrease in the market price of our common shares may cause us to become a PFIC. If we are a PFIC for any taxable year during which a United States Holder holds a common share, certain adverse United States federal income tax consequences could apply to such United States Holder.
35
From time to time, we may be involved in legal proceedings and may experience unfavorable outcomes.
We are, and in the future may be, subject to material legal proceedings in the course of our business, including, but not limited to, actions relating to contract disputes, business practices, intellectual property and other commercial and tax matters. Such legal proceedings may involve claims for substantial amounts of money or for other relief or might necessitate changes to our business or operations, and the defense of such actions may be both time consuming and expensive. Further, if any such proceedings were to result in an unfavorable outcome, it could have a material adverse effect on our business, financial position and results of operations.
Risks Related to Our Common Shares
The market price and trading volume of our common shares may be volatile, which could result in rapid and substantial losses for our shareholders.
The market price of our common shares may be highly volatile and could be subject to wide fluctuations. In addition, the trading volume in our common shares may fluctuate and cause significant price variations to occur. If the market price of our common shares declines significantly, you may be unable to sell your common shares at or above your purchase price, if at all. The market price of our common shares may fluctuate or decline significantly in the future. Some of the factors that could negatively affect the price of our common shares or result in fluctuations in the price or trading volume of our common shares include: variations in our quarterly operating results; failure to meet our earnings estimates; publication of research reports about us or the travel industry or the failure of securities analysts to cover our common shares; additions or departures of our executive officers and other key management personnel; adverse market reaction to any indebtedness we may incur or securities we may issue in the future; actions by shareholders; changes in market valuations of similar companies; speculation in the press or investment community; changes or proposed changes in laws or regulations or differing interpretations thereof affecting our business or enforcement of these laws and regulations, or announcements relating to these matters; adverse publicity about the travel industry generally or individual scandals, specifically; and general market and economic conditions.
Our common share price may decline due to the large number of shares eligible for future sale.
The market price of our common shares could decline as a result of sales of a large number of shares of our common shares or the perception that such sales could occur. These sales, or the possibility that these sales may occur, also might make it more difficult for us to sell equity securities in the future at a time and price that we deem appropriate.
We have a total of approximately 121.4 million common shares issued and outstanding. Of these shares, all common shares sold in our initial public offering, except for any shares held by our affiliates, are eligible for sale in the public market, and substantially all of our other common shares are subject to a 180-day contractual lock-up with the underwriters that began on September 24, 2014. Morgan Stanley & Co. LLC may permit our officers, directors, employees and shareholders who are subject to the contractual lock-up to sell shares prior to the expiration of the lock-up agreements. Upon expiration of the contractual lock-up agreements with the underwriters, substantially all of our outstanding shares will be eligible for sale in the public market.
Holders of approximately 85% of our outstanding common shares have demand and/or piggyback registration rights to require us to register our common shares with the SEC following the expiration of the lock-up agreements. If we register these common shares, the shareholders would be able to sell those shares freely in the public market. In addition, we filed a registration statement registering under the Securities Act the common shares reserved for issuance in respect of incentive awards to our directors, officers and employees. If any of these holders cause a large number of securities to be sold in the public market, the sales could reduce the trading price of our common shares. These sales also could impede our ability to raise capital in the future.
36
If we do not pay additional cash dividends in the foreseeable future, the price of our common shares may be depressed.
The declaration and payment of all future dividends, if any, will be at the discretion of our Board and will depend upon our financial condition, earnings, contractual conditions, restrictions imposed by our credit agreement, any future indebtedness or preferred securities or applicable laws and other factors that our Board may deem relevant. In addition, pursuant to Bermuda law and our bye-laws, no dividends may be declared or paid if there are reasonable grounds for believing that: (i) we are, or would after the payment be, unable to pay our liabilities as they become due or (ii) that the realizable value of our assets would thereby be less than our liabilities. As a result, you may not receive any return on an investment in our common shares unless you sell our common shares for a price greater than that which you paid for it.
Anti-takeover provisions in our bye-laws may delay, discourage or prevent a change in control.
Our bye-laws contain provisions that may delay, discourage or prevent a merger or acquisition that a shareholder may consider favorable. As a result, shareholders may be limited in their ability to obtain a premium for their shares.
We are a Bermuda company, and it may be difficult for you to enforce judgments against us or certain of our directors or officers.
We are a Bermuda limited liability exempted company. We have been advised by our Bermuda counsel that there is no treaty in force between the United States and Bermuda providing for the reciprocal recognition and enforcement of judgments in civil and commercial matters. As a result, whether a U.S. judgment would be enforceable in Bermuda depends on whether the U.S. court that entered the judgment is recognized by a Bermuda court as having jurisdiction over it, as determined by reference to Bermuda conflict of law rules. The courts of Bermuda would recognize as a valid judgment, a final and conclusive judgment in personam obtained in a U.S. court pursuant to which a sum of money is payable (other than a sum of money payable in respect of multiple damages, taxes or other charges of a like nature or in respect of a fine or other penalty). The courts of Bermuda would recognize such a U.S. judgment as long as (1) the U.S. court had proper jurisdiction over the parties subject to the judgment, (2) the U.S. court did not contravene the rules of natural justice of Bermuda, (3) the U.S. judgment was not obtained by fraud, (4) the enforcement of the U.S. judgment would not be contrary to the public policy of Bermuda, (5) no new admissible evidence relevant to the action is submitted prior to the rendering of the judgment by the courts of Bermuda and (6) there is due compliance with the correct procedures under the laws of Bermuda.
In addition to and irrespective of jurisdictional issues, Bermuda courts will not enforce a provision of the United States federal securities law that is either penal in nature or contrary to public policy. It is the advice of our Bermuda counsel that an action brought pursuant to a public or penal law, the purpose of which is the enforcement of a sanction, power or right at the instance of the state in its sovereign capacity, is unlikely to be entertained by Bermuda courts. Specified remedies available under the laws of U.S. jurisdictions, including specified remedies under United States federal securities laws, would not be available under Bermuda law or enforceable in a Bermuda court, as they are likely to be contrary to Bermuda public policy. Further, no claim may be brought in Bermuda in the first instance for a violation of United States federal securities laws because these laws have no extraterritorial application under Bermuda law and do not have force of law in Bermuda.
Our bye-laws require that derivative actions brought in the name of the Company, actions against directors, officers and employees for breach of fiduciary duty and other similar actions may be brought only in Bermuda as the exclusive forum for such actions, which could limit our shareholders’ ability to obtain a favorable judicial forum for disputes with us.
Our bye-laws require, to the fullest extent permitted by law, that derivative actions brought in the name of the Company, actions against directors, officers and employees for breach of fiduciary duty and other similar actions may be brought only in Bermuda, and if brought outside of Bermuda, the shareholder bringing the suit
37
will be deemed to have consented to service of process on such shareholder’s counsel. The choice of forum provision in our bye-laws may limit our shareholders’ ability to obtain a favorable judicial forum for disputes with us and have the effect of discouraging lawsuits against our directors and officers. Alternatively, if a court were to find these provisions of bye-laws inapplicable to, or unenforceable in respect of, one or more of the specified types of actions or proceedings, we may incur additional costs associated with resolving such matters in other jurisdictions, which could adversely affect our business and financial condition.
Persons who own our shares may have more difficulty in protecting their interests than persons who are shareholders of a U.S. corporation.
The Companies Act 1981, as amended, of Bermuda, which applies to us, differs in certain material respects from laws generally applicable to U.S. corporations and their shareholders. As a result, persons who own our shares may have more difficulty in protecting their interests than persons who are shareholders of a U.S. corporation.
The requirements of being a public company may strain our resources, divert management’s attention and affect our ability to attract and retain qualified Board members.
As a public company, we are subject to the reporting requirements of the Exchange Act, the Sarbanes-Oxley Act and stock exchange rules. The requirements of these rules and regulations will increase our legal and financial compliance costs, make some activities more difficult, time-consuming or costly and increase demand on our systems and resources. The Sarbanes-Oxley Act requires, among other things, that we maintain effective disclosure controls and procedures and internal controls for financial reporting. In order to maintain and, if required, improve our disclosure controls and procedures and internal control over financial reporting to meet this standard, significant resources and management oversight may be required, and management’s attention may be diverted from other business concerns. These rules and regulations could also make it more difficult for us to attract and retain qualified independent members of our Board. Additionally, we expect these rules and regulations to make it more difficult and more expensive for us to obtain director and officer liability insurance. We may be required to accept reduced coverage or incur substantially higher costs to obtain coverage. Furthermore, because we have not operated as a company with equity listed on a national securities exchange in the past, we might not be successful in implementing these requirements. The increased costs of compliance with public company reporting requirements and our potential failure to satisfy these requirements could have a material adverse effect on our financial condition.
If we are unable to implement and maintain effective internal control over financial reporting in the future, investors may lose confidence in the accuracy and completeness of our financial reports and the trading price of our common stock may be negatively affected.
We are required to maintain internal controls over financial reporting and to report any material weaknesses in such internal controls. In addition, beginning with our 2015 Annual Report on Form 10-K to be filed in 2016, we will be required to furnish a report by management on the effectiveness of our internal control over financial reporting pursuant to Section 404 of the Sarbanes-Oxley Act. We are in the process of designing, implementing, and testing the internal control over financial reporting required to comply with this obligation, which process is time consuming, costly, and complicated. If we identify material weaknesses in our internal control over financial reporting, if we are unable to comply with the requirements of Section 404 in a timely manner or assert that our internal control over financial reporting is effective, or if our independent registered public accounting firm is unable to express an opinion as to the effectiveness of our internal control over financial reporting, investors may lose confidence in the accuracy and completeness of our financial reports and the trading price of our common stock could be negatively affected, and we could become subject to investigations by the stock exchange on which our securities are listed, the SEC, or other regulatory authorities, which could require additional financial and management resources.
38
ITEM 1B. UNRESOLVED STAFF COMMENTS
None.
ITEM 2. PROPERTIES
Headquarters and Corporate Offices
Our principal executive office is located in Langley in the United Kingdom, under a lease with a term of 20 years that expires in June 2022. We also have an office in Atlanta, Georgia, under a lease with a term of 12 years that expires in December 2024.
Operations
Our operational business global headquarters are located in Langley, United Kingdom. Our operational business U.S. headquarters are located in Atlanta, Georgia. eNett is headquartered in Melbourne, Australia.
In addition, we have leased facilities in 42 countries that function as call centers or fulfillment or sales offices. Our product development centers are located in leased offices in Denver, Colorado under a lease expiring in November 2025, leased offices in Kansas City, Missouri under a lease expiring in February 2021 and leased offices in New Delhi, India under a lease expiring in August 2016.
The table below provides a summary of our key facilities, all of which are leased:
| | |
Location | | Purpose |
| Langley, United Kingdom | | Corporate Headquarters; Operational Business Global Headquarters |
| Atlanta, Georgia | | GDS Operational Business |
| Atlanta, Georgia | | Data Center |
| Denver, Colorado | | Product Development Center |
| Kansas City, Missouri | | Product Development Center |
| New Delhi, India | | Product Development Center |
| Melbourne, Australia | | eNett Operational Business Headquarters |
Data Center
We operate an in-house data center out of leased facilities in Atlanta, Georgia, pursuant to a lease that expires in August 2022. Our data center powers our consolidated Travel Commerce Platform and provides access 24 hours a day, seven days a week and 365 days a year. The facility is a hardened building housing two data centers: one used by us and the other used by Delta Air Lines. We and Delta Air Lines each have equal space and infrastructure at the Atlanta facility. Our Atlanta data center comprises 94,000 square feet of raised floor space, 27,000 square feet of office space and 39,000 square feet of facilities support area.
We believe that our properties are sufficient to meet our present needs, and we do not anticipate any difficulty in securing additional space, as needed, on acceptable terms.
ITEM 3. LEGAL PROCEEDINGS
DOJ
On May 19, 2011, we received a Civil Investigative Demand (“CID”) from the United States Department of Justice, which seeks our documents and data in connection with an investigation into whether there have been “horizontal and vertical restraints of trade by global distribution systems.” We have complied with the CID, and the investigation remains open.
39
Other
In addition, we are a party to various litigation matters incidental to the conduct of our business. We do not believe that the outcome of any of the matters in which we are currently involved will have a material adverse effect on our financial condition, results of our operations or our liquidity position.
ITEM 4. MINE SAFETY DISCLOSURES
Not Applicable.
40
PART II
ITEM 5.MARKET FOR REGISTRANT’S COMMON EQUITY, RELATED STOCKHOLDER MATTERS AND ISSUER PURCHASES OF EQUITY SECURITIES
Market Price of Common Shares
Our common shares are currently traded on the New York Stock Exchange (“NYSE”) under the symbol “TVPT.” The following table sets forth the quarterly high and low sales prices per common share as reported by NYSE for 2014. At February 13, 2015, the number of shareholders of record was 273.
| | | | | | | | |
2014 | | High | | | Low | |
Third Quarter (starting September 25, 2014) | | $ | 16.46 | | | $ | 16.25 | |
Fourth Quarter | | $ | 18.07 | | | $ | 12.06 | |
Dividend Policy
We declared and paid a dividend on our common shares in the fourth quarter of 2014 of $0.075 per common share. We intend to fund any future dividends from distributions made by our operating subsidiaries from their available cash generated from operations. The declaration and payment of all future dividends, if any, will be at the discretion of our Board and will depend upon our financial condition, earnings, contractual conditions, restrictions imposed by our credit agreement, any future indebtedness or preferred securities or applicable laws and other factors that our Board may deem relevant. In addition, pursuant to Bermuda law and our bye-laws, no dividends may be declared or paid if there are reasonable grounds for believing that: (i) we are, or would after the payment be, unable to pay our liabilities as they become due or (ii) that the realizable value of our assets would thereby be less than our liabilities.
Recent Sales of Unregistered Securities
Since January 1, 2012, we have issued and sold the following securities without registration under the Securities Act of 1933:
2013 Refinancing
On April 15, 2013, in connection with our comprehensive refinancing, Travelport Holdings Limited, our wholly owned subsidiary, acquired all of its outstanding Tranche A PIK Term Loans in exchange for (i) approximately 43.3% of our then fully diluted issued and outstanding equity and (ii) $25 million of newly issued 11.875% senior subordinated notes due 2016 of Travelport LLC, our indirect wholly owned subsidiary, and acquired all of its outstanding Tranche B PIK Term Loans in exchange for approximately 34.6% of our then fully diluted issued and outstanding equity. The offers and sales of these securities were made in reliance on the exemption from registration provided by Section 4(a)(2) of the Securities Act of 1933 (i) in the United States, only to “qualified institutional buyers” as defined in Rule 144A under the Securities Act of 1933 and (ii) outside the United States, to certain non-U.S. persons in offshore transactions in reliance on Regulation S under the Securities Act of 1933.
2014 Debt-For-Equity Exchanges
On February 26, 2014, we entered into separate, individually negotiated private exchange agreements to issue an aggregate of approximately 7 million common shares in exchange for $135 million principal amount of Travelport LLC’s subordinated debt. The offers and sales of these securities were made in reliance on the exemption from registration provided by Section 4(a)(2) of the Securities Act of 1933 only in the United States to “qualified institutional buyers” as defined in Rule 144A.
41
On June 19, 2014, we entered into separate, individually negotiated private exchange agreements to exchange an aggregate of $182 million of Travelport LLC’s and Travelport Holdings, Inc.’s 11.785% Senior\ Subordinated Dollar Notes due 2016, 10.875% Senior Subordinated Euro Notes due 2016, 13.875% Senior Fixed Rate Notes and Senior Floating Rate Notes due 2016 into approximately 9.1 million common shares at a value of $20.50 per common share. The offers and sales of these securities were made in reliance on the exemption from registration provided by Section 4(a)(2) of the Securities Act of 1933 only in the United States to “qualified institutional buyers” as defined in Rule 144A.
On June 27, 2014, we commenced an offer of common shares in exchange for the following outstanding debt securities issued by Travelport LLC and Travelport Holdings, Inc.: (i) Senior Floating Rate Notes Due 2016; (ii) 13.875% Senior Fixed Rate Notes Due 2016; (iii) 11.875% Senior Subordinated Fixed Rate Notes Due 2016; (iv) 11.875% Dollar Senior Subordinated Fixed Rate Notes Due 2016; and (v) 10.875% Senior Subordinated Euro Fixed Rate Notes Due 2016. An aggregate of approximately $164 million principal amount of notes were tendered and accepted in exchange for approximately 8.2 million common shares at a value of $20.50 per common share. The offers and sales of these securities were made in reliance on the exemption from registration provided by Section 4(a)(2) of the Securities Act of 1933 (i) in the United States to “qualified institutional buyers” as defined in Rule 144A and (ii) either (A) in the United States to holders of notes who were “accredited investors” or (B) outside of the United States to certain non-U.S. persons in offshore transactions in reliance on Regulation S under the Securities Act of 1933.
On July 11, 2014, we entered into an agreement to issue certain Travelport LLC term loan lenders approximately 4.6 million common shares, at a value of $20.50 per common share, in exchange for the purchase of approximately $91 million of first and second lien term loans under Travelport LLC’s sixth amended and restated credit agreement and second lien credit agreement. The offers and sales of these securities were made in reliance on the exemption from registration provided by Section 4(a)(2) of the Securities Act of 1933 only in the United States to “qualified institutional buyers” as defined in Rule 144A.
Equity Awards
Since January 1, 2012, we have granted options (net of forfeitures) to purchase an aggregate of 1,270,871 common shares at an exercise price of $14.37 per common share. Since January 1, 2012, we have granted 6,882,444 restricted share units (net of forfeitures) to be settled in our common shares under our equity compensation plans.
We deemed the issuances and sales described above as exempt from registration pursuant to Section 4(a)(2) of the Securities Act of 1933 or in reliance on Rule 701 of the Securities Act of 1933 as offers and sales of securities under compensatory benefit plans and contracts relating to compensation in compliance with Rule 701. Each of the recipients of securities in any transaction exempt from registration either received or had adequate access, through employment, business or other relationships, to information about us. For each of the transactions listed above, stock certificates were not issued, but appropriate legends were included at each issuance under our former shareholders’ agreement.
Purchases of Equity Securities By the Issuer and Affiliated Purchases
None.
42
Performance Graph
The following graph and table show the cumulative total shareholder return of our common shares against the cumulative total returns of the Russell 2000 Index and the Dow Jones U.S. Travel & Leisure Index from September 25, 2014 and ending December 31, 2014. The Russell 2000 Index measures the performance of the small-cap segment of the U.S. equity universe, and the Dow Jones U.S. Travel & Leisure Index measures the performance of U.S. stocks in the travel and leisure sector. The graph and the table depict the result of an investment on September 25, 2014 of $100 in our common shares, the Russell 2000 Index and the Dow Jones U.S. Travel & Leisure Index, including investment of dividends. Historic share performance is not necessarily indicative of future share price performance.
| | | | | | | | | | | | | | | | | | | | |
| | | Base
Period
9/25/14 | | | INDEXED RETURNS
Month Ending | |
Company / Index | | | 9/30/14 | | | 10/31/14 | | | 11/30/14 | | | 12/31/14 | |
Travelport Worldwide Limited | | $ | 100 | | | $ | 100.37 | | | $ | 88.11 | | | $ | 105.79 | | | $ | 110.21 | |
Russell 2000 Index | | $ | 100 | | | $ | 99.28 | | | $ | 105.83 | | | $ | 105.92 | | | $ | 108.94 | |
Dow Jones U.S. Travel & Leisure Index | | $ | 100 | | | $ | 100.55 | | | $ | 103.06 | | | $ | 109.50 | | | $ | 110.19 | |
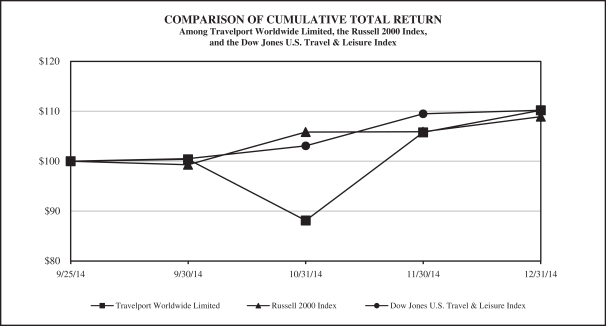
43
ITEM 6.SELECTED FINANCIAL DATA
The following table sets forth our selected consolidated historical financial information and other data as of the dates and for the periods indicated as set out below:
| • | | The consolidated statements of operations data and the consolidated statements of cash flows data for the years ended December 31, 2014, 2013 and 2012 and the consolidated balance sheet data as of December 31, 2014 and 2013 are derived from our audited consolidated financial statements and the related notes thereto included elsewhere in this Annual Report on Form 10-K. |
| • | | The consolidated statements of operations data and the consolidated statement of cash flows data for the year ended December 31, 2011 and the consolidated balance sheet data as of December 31, 2012 are derived from our audited consolidated financial statements and the related notes thereto not included in this Annual Report on Form 10-K. |
| • | | The consolidated statements of operations data and the consolidated statement of cash flows data for the year ended December 31, 2010 and the consolidated balance sheet data as of December 31, 2011 and 2010 are derived from our unaudited consolidated financial statements and the related notes thereto not included in this Annual Report on Form 10-K. |
All share and per share data in this Annual Report on Form 10-K gives retroactive effect to the 1-for-12.5 share consolidation of our authorized, issued and outstanding common shares (including adjustments for fractional shares) (“the Share Consolidation”), which was effective on September 5, 2014, for all periods presented.
In May 2011, we completed the sale of our Gullivers Travel Associates (“GTA”) business which qualified to be reported as discontinued operations. The gain from the disposal of the GTA business and the results of operations of the GTA business are presented as discontinued operations in our consolidated statements of operations and consolidated statements of cash flows. The assets and liabilities of the GTA business are classified as discontinued operations on our consolidated balance sheets for periods presented prior to such sale.
Our financial statements are prepared in accordance with accounting principles generally accepted in the United States (“U.S. GAAP”). The following selected consolidated historical financial and other data are qualified in their entirety by reference to, and should be read in conjunction with, our consolidated financial statements and the related notes thereto and the information under “Management’s Discussion and Analysis of Financial Condition and Results of Operations” included elsewhere in this Annual Report on Form 10-K.
44
Consolidated Statement of Operations Data
| | | | | | | | | | | | | | | | | | | | |
| | | Year Ended December 31, | |
(in $ millions, except share and per share data) | | 2014 | | | 2013 | | | 2012 | | | 2011 | | | 2010 | |
Net revenue | | $ | 2,148 | | | $ | 2,076 | | | $ | 2,002 | | | $ | 2,035 | | | $ | 1,996 | |
| | | | | | | | | | | | | | | | | | | | |
Costs and expenses | | | | | | | | | | | | | | | | | | | | |
Cost of revenue | | | 1,324 | | | | 1,266 | | | | 1,191 | | | | 1,211 | | | | 1,119 | |
Selling, general and administrative | | | 430 | | | | 396 | | | | 446 | | | | 397 | | | | 393 | |
Depreciation and amortization | | | 233 | | | | 206 | | | | 227 | | | | 227 | | | | 210 | |
| | | | | | | | | | | | | | | | | | | | |
Total costs and expenses | | | 1,987 | | | | 1,868 | | | | 1,864 | | | | 1,835 | | | | 1,722 | |
| | | | | | | | | | | | | | | | | | | | |
Operating income | | | 161 | | | | 208 | | | | 138 | | | | 200 | | | | 274 | |
Interest expense, net | | | (278 | ) | | | (356 | ) | | | (346 | ) | | | (364 | ) | | | (323 | ) |
(Loss) gain on early extinguishment of debt | | | (108 | ) | | | (49 | ) | | | 6 | | | | — | | | | 2 | |
Gain on sale of shares of Orbitz Worldwide | | | 356 | | | | — | | | | — | | | | — | | | | — | |
| | | | | | | | | | | | | | | | | | | | |
Income (loss) from continuing operations before income taxes and share of (losses) earnings in equity method investments | | | 131 | | | | (197 | ) | | | (202 | ) | | | (164 | ) | | | (47 | ) |
Provision for income taxes | | | (39 | ) | | | (20 | ) | | | (23 | ) | | | (29 | ) | | | (47 | ) |
Share of (losses) earnings in equity method investments | | | (1 | ) | | | 10 | | | | (74 | ) | | | (18 | ) | | | (28 | ) |
| | | | | | | | | | | | | | | | | | | | |
Net income (loss) from continuing operations | | | 91 | | | | (207 | ) | | | (299 | ) | | | (211 | ) | | | (122 | ) |
(Loss) income from discontinued operations, net of tax | | | — | | | | — | | | | — | | | | (6 | ) | | | 27 | |
Gain from disposal of discontinued operations, net of tax | | | — | | | | 4 | | | | 7 | | | | 312 | | | | — | |
| | | | | | | | | | | | | | | | | | | | |
Net income (loss) | | | 91 | | | | (203 | ) | | | (292 | ) | | | 95 | | | | (95 | ) |
Net (income) loss attributable to non-controlling interest in subsidiaries | | | (5 | ) | | | (3 | ) | | | — | | | | 3 | | | | 1 | |
| | | | | | | | | | | | | | | | | | | | |
Net income (loss) attributable to the Company | | $ | 86 | | | $ | (206 | ) | | $ | (292 | ) | | $ | 98 | | | $ | (94 | ) |
| | | | | | | | | | | | | | | | | | | | |
Income (loss) per share – Basic: | | | | | | | | | | | | | | | | | | | | |
Income (loss) per share – continuing operations | | $ | 1.01 | | | $ | (4.62 | ) | | $ | (36.76 | ) | | $ | (37.07 | ) | | $ | (25.42 | ) |
Income per share – discontinued operations | | | — | | | | 0.10 | | | | 0.83 | | | | 54.59 | | | | 5.63 | |
| | | | | | | | | | | | | | | | | | | | |
Basic income (loss) per share | | $ | 1.01 | | | $ | (4.52 | ) | | $ | (35.93 | ) | | $ | 17.52 | | | $ | (19.79 | ) |
| | | | | | | | | | | | | | | | | | | | |
Weighted average common shares outstanding – Basic | | | 85,771,655 | | | | 45,522,506 | | | | 8,129,920 | | | | 5,602,713 | | | | 4,800,000 | |
| | | | | | | | | | | | | | | | | | | | |
Income (loss) per share – Diluted: | | | | | | | | | | | | | | | | | | | | |
Income (loss) per share – continuing operations | | $ | 0.98 | | | $ | (4.62 | ) | | $ | (36.76 | ) | | $ | (37.07 | ) | | $ | (25.42 | ) |
Income per share – discontinued operations | | | — | | | | 0.10 | | | | 0.83 | | | | 54.59 | | | | 5.63 | |
| | | | | | | | | | | | | | | | | | | | |
Diluted income (loss) per share | | $ | 0.98 | | | $ | (4.52 | ) | | $ | (35.93 | ) | | $ | 17.52 | | | $ | (19.79 | ) |
| | | | | | | | | | | | | | | | | | | | |
Weighted average common shares
outstanding – Diluted | | | 87,864,090 | | | | 45,522,506 | | | | 8,129,920 | | | | 5,602,713 | | | | 4,800,000 | |
| | | | | | | | | | | | | | | | | | | | |
Cash dividends declared per common share | | $ | 0.075 | | | | — | | | | — | | | | — | | | | — | |
45
Consolidated Balance Sheet Data
| | | | | | | | | | | | | | | | | | | | |
| | | December 31, | |
(in $ millions) | | 2014 | | | 2013 | | | 2012 | | | 2011 | | | 2010 | |
Cash and cash equivalents | | $ | 139 | | | $ | 154 | | | $ | 110 | | | $ | 124 | | | $ | 105 | |
Total current assets (excluding cash and cash equivalents and assets of discontinued operations) | | | 273 | | | | 312 | | | | 322 | | | | 304 | | | | 303 | |
Assets of discontinued operations | | | — | | | | — | | | | — | | | | — | | | | 1,066 | |
Property and equipment, net | | | 414 | | | | 428 | | | | 416 | | | | 431 | | | | 484 | |
Goodwill and other intangible assets, net | | | 1,930 | | | | 1,971 | | | | 2,017 | | | | 2,110 | | | | 2,210 | |
All other non-current assets | | | 136 | | | | 223 | | | | 291 | | | | 373 | | | | 355 | |
| | | | | | | | | | | | | | | | | | | | |
Total assets | | $ | 2,892 | | | $ | 3,088 | | | $ | 3,156 | | | $ | 3,342 | | | $ | 4,523 | |
| | | | | | | | | | | | | | | | | | | | |
Total current liabilities (excluding liabilities of discontinued operations) | | $ | 555 | | | $ | 681 | | | $ | 695 | | | $ | 635 | | | $ | 569 | |
Liabilities of discontinued operations | | | — | | | | — | | | | — | | | | — | | | | 555 | |
Long-term debt | | | 2,384 | | | | 3,528 | | | | 3,866 | | | | 3,771 | | | | 4,370 | |
All other non-current liabilities | | | 291 | | | | 190 | | | | 281 | | | | 321 | | | | 257 | |
| | | | | | | | | | | | | | | | | | | | |
Total liabilities | | | 3,230 | | | | 4,399 | | | | 4,842 | | | | 4,727 | | | | 5,751 | |
| | | | | | | | | | | | | | | | | | | | |
Total equity (deficit) | | | (338 | ) | | | (1,311 | ) | | | (1,686 | ) | | | (1,385 | ) | | | (1,228 | ) |
| | | | | | | | | | | | | | | | | | | | |
Total liabilities and equity | | $ | 2,892 | | | $ | 3,088 | | | $ | 3,156 | | | $ | 3,342 | | | $ | 4,523 | |
| | | | | | | | | | | | | | | | | | | | |
Consolidated Statement of Cash Flows Data
| | | | | | | | | | | | | | | | | | | | |
| | | Year Ended December 31, | |
(in $ millions) | | 2014 | | | 2013 | | | 2012 | | | 2011 | | | 2010 | |
Net cash provided by operating activities of continuing operations | | $ | 58 | | | $ | 100 | | | $ | 181 | | | $ | 124 | | | $ | 181 | |
Net cash (used in) provided by operating activities of discontinued operations | | | — | | | | — | | | | — | | | | (12 | ) | | | 103 | |
Net cash provided by (used in) investing activities | | | 226 | | | | (96 | ) | | | (89 | ) | | | 556 | | | | (250 | ) |
Net cash (used in) provided by financing activities | | | (297 | ) | | | 40 | | | | (106 | ) | | | (802 | ) | | | (2 | ) |
Effects of changes in exchange rates on cash and cash equivalents | | | (2 | ) | | | — | | | | — | | | | 5 | | | | 4 | |
| | | | | | | | | | | | | | | | | | | | |
Net (decrease) increase in cash and cash equivalents | | $ | (15 | ) | | $ | 44 | | | $ | (14 | ) | | $ | (129 | ) | | $ | 36 | |
| | | | | | | | | | | | | | | | | | | | |
Selected Quarterly Consolidated Financial Data—Unaudited
Provided below is selected unaudited quarterly financial data for 2014 and 2013:
| | | | | | | | | | | | | | | | |
| | | 2014 | |
(in $ millions) | | First | | | Second | | | Third | | | Fourth | |
Net revenue | | $ | 572 | | | $ | 551 | | | $ | 529 | | | $ | 496 | |
Cost of revenue | | | 353 | | | | 337 | | | | 320 | | | | 314 | |
Operating income | | | 75 | | | | 60 | | | | 21 | | | | 5 | |
Net (loss) income from continuing operations | | | (27 | ) | | | 5 | | | | 155 | | | | (42 | ) |
Net (loss) income | | | (27 | ) | | | 5 | | | | 155 | | | | (42 | ) |
Net (loss) income attributable to the Company | | | (29 | ) | | | 4 | | | | 154 | | | | (43 | ) |
(Loss) income per share from continuing operations: | | | | | | | | | | | | | | | | |
Basic | | | (0.04 | ) | | | 0.05 | | | | 1.75 | | | | (0.35 | ) |
Diluted | | | (0.04 | ) | | | 0.05 | | | | 1.71 | | | | (0.35 | ) |
46
| | | | | | | | | | | | | | | | |
| | | 2013 | |
(in $ millions) | | First | | | Second | | | Third | | | Fourth | |
Net revenue | | $ | 548 | | | $ | 537 | | | $ | 511 | | | $ | 480 | |
Cost of revenue | | | 333 | | | | 326 | | | | 313 | | | | 294 | |
Operating income | | | 69 | | | | 56 | | | | 57 | | | | 26 | |
Net loss from continuing operations | | | (22 | ) | | | (105 | ) | | | (27 | ) | | | (53 | ) |
Net loss | | | (22 | ) | | | (105 | ) | | | (27 | ) | | | (49 | ) |
Net loss attributable to the Company | | | (22 | ) | | | (107 | ) | | | (27 | ) | | | (50 | ) |
Loss per share from continuing operations: | | | | | | | | | | | | | | | | |
Basic | | | (0.21 | ) | | | (2.06 | ) | | | (0.45 | ) | | | (0.89 | ) |
Diluted | | | (0.21 | ) | | | (2.06 | ) | | | (0.45 | ) | | | (0.89 | ) |
47
ITEM 7.MANAGEMENT’S DISCUSSION AND ANALYSIS OF FINANCIAL CONDITION AND RESULTS OF OPERATIONS
The following discussion and analysis of our results of operations and financial condition for each of the years ended December 31, 2014, 2013 and 2012 should be read in conjunction with our consolidated financial statements and accompanying notes reported in accordance with US GAAP and included elsewhere in this Annual Report on Form 10-K. All share and per share data in this Annual Report on Form 10-K gives retroactive effect to the Share Consolidation, which was effective on September 5, 2014, for all periods presented. The following discussion and analysis includes forward-looking statements that reflect the current view of management and involve risks and uncertainties. Our actual results may differ materially from those contained in any forward-looking statements as a result of factors discussed below and elsewhere in this Annual Report on Form 10-K, particularly under the headings “Item 1A: Risk Factors” and “Forward-Looking Statements.”
Overview
We are a leading travel commerce platform providing distribution, technology, payment and other solutions for the $7 trillion global travel and tourism industry. We facilitate travel commerce by connecting the world’s leading travel providers, such as airlines and hotel chains, with online and offline travel agencies and other travel buyers in our proprietary B2B travel commerce platform. We processed over $90 billion of travel spending in 2014. Since 2012, we have strategically invested in products with a focus on redefining our Travel Commerce Platform to address the trends, inefficiencies and unmet needs of all components of the travel value chain.
We have one reporting segment, and we further classify revenue according to its source as either Travel Commerce Platform revenue (comprised of Air and Beyond Air) or Technology Services revenue. For the year ended December 31, 2014, Air, Beyond Air and Technology Services represented 75%, 20% and 5%, respectively, of our net revenue.
Travel Commerce Platform
Our Travel Commerce Platform combines state-of-the-art technology with features, functionality and innovative solutions to address the high-volume and growing transaction processing requirements for the evolving needs of the travel industry.
Air
We provide comprehensive real-time search, pricing, booking, change, payment and integrated itinerary creation for travelers who use the services of online and offline travel agencies for both leisure and business travel. We provide such services to approximately 651 airlines globally, including approximately 98 LCCs. Our access to business travelers, merchandising capabilities and ability to process complex itineraries have attracted and allowed for the full integration of several fast-growing LCCs such as Air Asia, easyJet, Ryanair and Spirit Airlines into our Travel Commerce Platform.
Beyond Air
We have expanded our Travel Commerce Platform with a fast growing portfolio of Beyond Air initiatives. Our Beyond Air portfolio includes hospitality, payment solutions, advertising and other platform services.
For the hospitality sector of the travel industry, we provide innovative distribution and merchandising solutions for hotel, car rental, rail, cruise-line and tour operators. Based on our estimates, we offer the largest inventory of hotel properties on any travel platform in the world via our innovative distribution and merchandising solutions for both chain and independent hotels.
48
For the payment solutions, eNett’s core offering is a VAN that automatically generates unique MasterCard numbers used to process payments globally. eNett’s operations currently focus on Asia Pacific and Europe, and we believe the model is highly scalable.
In addition to hospitality and payments, we utilize the broad connections and extensive data managed by our Travel Commerce Platform to provide advertising solutions to approximately 5,000 advertisers that allow our travel providers to easily and cost-effectively promote upgrades, ancillary products or services, package deals and other offers. We also offer other platform services, including subscription services, processing services, business intelligence data services and marketing-oriented analytical tools, to travel agencies, travel providers and other travel data users.
Technology Services
We provide critical hosting solutions to airlines, such as pricing, shopping, ticketing, ground handling and other services, enabling them to focus on their core business competencies and reduce costs. We also host and manage reservations, inventory management and other related critical systems for Delta and in May 2014, we signed a new long-term agreement to continue to run the system infrastructure for the Delta platform in our Atlanta data center. In addition, we own 51% of InterGlobe, an application development services provider based in New Delhi, India that is used for both internal and external software development.
Management Performance Metrics
Our management team monitors the performance of our operations against our strategic objectives. We assess our performance using both financial and non-financial measures. As a Travel Commerce Platform, we measure performance primarily on the basis of changes in both Reported Segments and RevPas. Travel Commerce Platform RevPas is computed by dividing Travel Commerce Platform revenue by the total number of Reported Segments. Travel Commerce Platform revenue is generated from a wide portfolio of products and services, including traditional air bookings, ancillaries, hospitality, payment solutions, advertising and other platform services. Reported Segments is defined as travel provider revenue generating units (net of cancellations) sold by our travel agency network, geographically presented by region based upon the point of sale location. We also use other GAAP and non-GAAP measures as performance metrics.
49
The table below sets out our performance metrics:
| | | | | | | | | | | | | | | | | | | | | | | | | | | | | | | | |
(in $ millions, except share data, Reported Segments and
RevPas) | | Year Ended
December 31, | | | Change | | | Year Ended
December, 31 | | | Change | |
| | 2014 | | | 2013 | | | | | | % | | | 2013 | | | 2012 | | | | | | % | |
Net revenue | | $ | 2,148 | | | $ | 2,076 | | | $ | 72 | | | | 3 | | | $ | 2,076 | | | $ | 2,002 | | | $ | 74 | | | | 4 | |
Operating income | | | 161 | | | | 208 | | | | (47 | ) | | | (23 | ) | | | 208 | | | | 138 | | | | 70 | | | | 51 | |
Net income (loss) | | | 91 | | | | (203 | ) | | | 294 | | | | * | | | | (203 | ) | | | (292 | ) | | | 89 | | | | 30 | |
Income (loss) per share – diluted (in $) | | | 0.98 | | | | (4.52 | ) | | | 5.50 | | | | * | | | | (4.52 | ) | | | (35.93 | ) | | | 31.41 | | | | 87 | |
Adjusted EBITDA(1) | | | 540 | | | | 517 | | | | 23 | | | | 5 | | | | 517 | | | | 494 | | | | 23 | | | | 5 | |
Adjusted Net Loss(2) | | | (11 | ) | | | (48 | ) | | | 37 | | | | 78 | | | | (48 | ) | | | (80 | ) | | | 32 | | | | 40 | |
Adjusted Loss per Share – diluted(3) (in $) | | | (0.12 | ) | | | (1.06 | ) | | | 0.94 | | | | 89 | | | | (1.06 | ) | | | (9.84 | ) | | | 8.78 | | | | 89 | |
Net cash provided by operating activities | | | 58 | | | | 100 | | | | (42 | ) | | | (42 | ) | | | 100 | | | | 181 | | | | (81 | ) | | | (45 | ) |
Adjusted Free Cash Flow(4) | | | (39 | ) | | | 20 | | | | (59 | ) | | | * | | | | 20 | | | | 104 | | | | (84 | ) | | | (81 | ) |
Reported Segments | | | 356 | | | | 350 | | | | 6 | | | | 2 | | | | 350 | | | | 347 | | | | 3 | | | | 1 | |
Travel Commerce Platform RevPas | | $ | 5.70 | | | $ | 5.60 | | | $ | 0.10 | | | | 2 | | | $ | 5.60 | | | $ | 5.40 | | | $ | 0.20 | | | | 4 | |
| (1) | Adjusted EBITDA is defined as Adjusted Net Income (Loss) excluding depreciation and amortization of property and equipment, amortization of customer loyalty payments, interest expense, net, and provision for (benefit from) income taxes. |
| (2) | Adjusted Net Income (Loss) is defined as net income (loss) from continuing operations excluding amortization of acquired intangible assets, gain (loss) on early extinguishment of debt, share of earnings (losses) in equity method investments, the contribution from the terminated MSA with United Airlines and items that are excluded under our debt covenants, such as gain on the sale of shares of Orbitz Worldwide, non-cash equity-based compensation, certain corporate and restructuring costs, certain litigation and related costs and other non-cash items such as foreign currency gains (losses) on euro denominated debt and earnings hedges along with any income tax related to these exclusions. |
| (3) | Adjusted Income (Loss) per Share—diluted is defined as Adjusted Net Income (Loss) for the period divided by the weighted average number of dilutive common shares. |
| (4) | Adjusted Free Cash Flow is defined as net cash provided by (used in) operating activities of continuing operations, adjusted to remove the impact of cash paid for other adjusting items which we believe are unrelated to our ongoing operations and to deduct capital expenditures on property and equipment additions, including capital lease repayments (“Capital Expenditure”). |
Adjusted Net Income (Loss) and Adjusted EBITDA are supplemental measures of operating performance that do not represent, and should not be considered as, alternatives to net income (loss), as determined under US GAAP. In addition, Adjusted Net Income (Loss) and Adjusted EBITDA may not be comparable to similarly named measures used by other companies. The presentation of Adjusted Net Income (Loss) and Adjusted EBITDA have limitations as analytical tools, and these measures should not be considered in isolation or as a substitute for analysis of our results as reported under US GAAP.
We have included Adjusted Net Income (Loss) and Adjusted EBITDA as they are primary metrics used by management to evaluate and understand the underlying operations and business trends, forecast future results and determine future capital investment allocations. They are also used by our Board of Directors to determine incentive compensation for future periods.
50
The following table provides a reconciliation of net income (loss) to Adjusted Net Loss and to Adjusted EBITDA:
| | | | | | | | | | | | |
| | | Year Ended December 31, | |
(in $ millions) | | 2014 | | | 2013 | | | 2012 | |
Net income (loss) from continuing operations | | $ | 91 | | | $ | (207 | ) | | $ | (299 | ) |
Adjustments: | | | | | | | | | | | | |
Amortization of intangible assets(1) | | | 77 | | | | 80 | | | | 82 | |
Loss (gain) on early extinguishment of debt | | | 108 | | | | 49 | | | | (6 | ) |
Share of losses (earnings) in equity method investments | | | 1 | | | | (10 | ) | | | 74 | |
Loss of MSA with United Airlines(2) | | | — | | | | — | | | | (21 | ) |
Gain on sale of shares of Orbitz Worldwide | | | (356 | ) | | | — | | | | — | |
Equity-based compensation and related taxes | | | 44 | | | | 6 | | | | 2 | |
Corporate and restructuring costs(3) | | | 14 | | | | 7 | | | | 19 | |
Litigation and related costs(4) | | | — | | | | 12 | | | | 53 | |
Other – non cash(5) | | | 12 | | | | 15 | | | | 16 | |
Tax impact of adjustments | | | (2 | ) | | | — | | | | — | |
| | | | | | | | | | | | |
Adjusted Net Loss | | | (11 | ) | | | (48 | ) | | | (80 | ) |
Adjustments: | | | | | | | | | | | | |
Depreciation and amortization of property and equipment | | | 156 | | | | 126 | | | | 145 | |
Amortization of customer loyalty payments(6) | | | 76 | | | | 63 | | | | 60 | |
Interest expense, net | | | 278 | | | | 356 | | | | 346 | |
Remaining provision for income taxes | | | 41 | | | | 20 | | | | 23 | |
| | | | | | | | | | | | |
Adjusted EBITDA | | $ | 540 | | | $ | 517 | | | $ | 494 | |
| | | | | | | | | | | | |
| (1) | Relates primarily to intangible assets acquired in the sale of Travelport to Blackstone in 2006 and from the acquisition of Worldspan in 2007. |
| (2) | Reflects the historical contribution to operating income of a terminated MSA with United Airlines |
| (3) | Relates to costs associated with corporate development transactions and costs incurred to enhance our organization’s efficiency. |
| (4) | Litigation and related costs represent costs related to various claims, legal proceedings, intellectual property and other commercial, employment and tax matters. In 2012, litigation and related costs predominately relate to litigation with American Airlines and former bondholders. |
| (5) | Other—non cash includes (i) unrealized losses (gains) on foreign currency derivatives contracts and revaluation losses (gains) of our euro denominated debt of $12 million, $13 million and $15 million for the years ended December 31, 2014, 2013 and 2012, respectively, (ii) write-off and impairment of non-current assets of $2 million and $1 million for the years ended December 31, 2014 and 2013, respectively, and (iii) other items of $(2) million, $1 million and $1 million for the years ended December 31, 2014, 2013 and 2012, respectively. |
| (6) | Excludes the amortization of customer loyalty payments related to United Airlines of $2 million for the year ended December 31, 2012. |
We have included Adjusted Income (Loss) per Share—diluted as we believe it is a useful measure for our investors as it represents, on a per share basis, our consolidated results, taking into account depreciation and amortization on property and equipment and amortization of customer loyalty payments, which we believe are ongoing costs of doing business, as well as other items which are not allocated to the operating businesses such as interest expense and related taxes but excluding the effects of certain expenses not directly tied to the core operations of our businesses. Adjusted Income (Loss) per Share—diluted has similar limitations as Adjusted EBITDA and Adjusted Net Income (Loss) and may not be comparable to similarly named measures used by other companies. In addition, Adjusted Net Income (Loss) does not include all items that affect our net income / (loss) and net income / (loss) per share for the period. Therefore, we think it is important to evaluate these measures along with our consolidated statements of operations.
For a discussion of Adjusted Free Cash Flow, please see “Liquidity and Capital Resources—Cash Flows.”
51
Factors Affecting Our Results of Operations
Factors Affecting Our Industry Generally
Factors affecting our industry generally and our results of operations include:
| | • | | Macroeconomic and Travel Industry Conditions: Our business model is primarily transaction based and is not based on end-user pricing. Our business and results of operations are, therefore, dependent upon travel volumes, particularly air passengers, and, to an increasing degree, non-air travel volumes, that are affected by general macroeconomic conditions. These conditions include the rate of growth in GDP, the availability and cost of consumer finance, interest and exchange rates, unemployment levels, fuel prices and terrorism, as well as other factors that may affect the travel and tourism industry. The overall impact on the travel and tourism industry of these and other factors can also be influenced by travelers’ perception of, and reaction to, the scope, severity and timing of such conditions. The travel industry has historically shown strong and resilient growth, typically outperforming general macroeconomic performance. Based on IATA Traffic data, scheduled air passenger volume growth has outperformed global GDP growth by approximately two times since 2004. |
| | • | | Pricing Trends for Air Travel Distribution: In recent years, the airline industry, especially in the United States and Europe, has undergone a rapid wave of consolidation, resulting in capacity moderation and increased pricing power for airlines. Airlines around the world also are addressing factors such as fluctuations in fuel and increases in labor and operating costs, which are putting pressure on their margins. Although network airlines are focused on reducing overhead costs such as the cost of distribution through a traditional GDS, they are also looking for ways to increase their yield through sales of ancillaries, sales to higher-yield passengers, such as business travelers, and growing the number of higher value bookings outside of their home markets. Our Travel Commerce Platform enables airlines to substantially increase their distribution reach through away bookings, which we price at a premium to home bookings. As this part of our business grows, our financial performance will benefit. Our Travel Commerce Platform offers a broad portfolio of value-added functionalities that enables airlines to effectively pursue these revenue enhancing initiatives. The ability of our platform to add this value is unique in the indirect distribution channel, which allows us to enter into value-linked pricing of airline contracts that shift the focus of the negotiation away from cost and onto value creation. As a result, we have been able to grow our RevPas over the last two years even when traditional GDS air segment fees have been under pressure. |
We believe that securing the content of the world’s leading airlines is value-enhancing for our Travel Commerce Platform, and as a result, we have entered into full content agreements with an increasing number of airlines over recent years. We have full content or distribution parity agreements with approximately 110 airlines, including LCCs, worldwide. These agreements accounted for 64% of our Air revenue for the year ended December 31, 2014. We offer airlines a discount for giving us access to this content. Contracts with airlines that do not provide us with this preferential access include terms that generally allow us to increase segment fees on thirty days notice. The mix of types of airline agreements on our Travel Commerce Platform will continue to impact our revenue. Our value-based pricing model has been instrumental in driving RevPas growth in recent years.
Travel agency commissions constitute a large portion of our operating costs and continue to increase due to competitive factors. As experienced in recent years, we expect to stem the average rate of increase in commissions as a result of the industry leading features, functionality and innovative solutions offered on our Travel Commerce Platform.
| | • | | Increasing Expansion and Importance of LCCs: Over the past decade, LCCs have become a substantial segment of the air travel industry, generating additional demand for air travel through low fares. LCCs have continued to grow, with LCCs’ share of global air travel volume expected to increase from 17% of revenue passenger kilometers in 2012 to 21% of revenue passenger kilometers by 2032, according to |
52
| | Airbus. LCCs have traditionally relied on direct distribution, but are now increasingly targeting the indirect channel to support their future growth aspirations and expand their offering into higher yield markets and to higher yield customers. |
Increasingly, we believe that LCCs desire to grow their away bookings, reach leisure travelers seeking complex itineraries typically booked through travel agencies and increase their access to business travelers that use corporate booking tools accessible through GDSs. In addition, we believe that LCCs desire to sell their products, including ancillaries, through the indirect channel in the same manner they sell through the direct channel. Unlike a traditional GDS, we provide XML connectivity and merchandising capabilities, and, therefore, believe we are a natural partner for LCCs. Our access to business travelers, merchandising capabilities and ability to process complex itineraries have attracted and allowed for the full integration of several prominent and fast-growing LCCs such as AirAsia, easyJet, Ryanair and Spirit Airlines into our fully integrated Travel Commerce Platform.
| | • | | Consolidations Within the Airline Industry: The airline industry has experienced consolidation. Examples include the merger between Delta and Northwest Airlines in 2008, the merger between United Airlines and Continental Airlines in 2010, the merger between British Airways and Iberia in 2011 and the merger between American Airlines and US Airways in 2013. Further consolidation among airlines could increase our customer concentration, reduce airline seat capacity and increase the negotiating ability of airline travel providers. |
We have been impacted by consolidations within the airline industry in the past. As a result of the merger of United Airlines with Continental Airlines in 2010, we discontinued servicing the United Airlines reservation system in March 2012 as they migrated to the Continental Airlines system. United Airlines, the surviving airline in the merger between United Airlines and Continental Airlines, remains a full content travel provider on our Travel Commerce Platform.
| | • | | Growing Demand for Improved Distribution in the Fragmented Hotel Industry: The hotel industry remains highly fragmented, with the top ten global hotel chains representing less than 20% of room revenue in every region except North America, Australasia and the Middle East and Africa, according to Euromonitor International. The majority of hotels that currently distribute through traditional GDSs consist of large chain hotels that represent a small percentage of total hotel inventory. Independent hotels, as well as small and mid-size chain hotels, have been historically left outside of the traditional GDS distribution channel primarily due to technology connectivity issues. Developments in technology and the ability to aggregate hotel content from OTAs through meta-search technology, however, have created a significant opportunity for growth in this area of distribution, including targeting business travelers. We have already seen the impact of these trends through the growth in our hotel bookings and believe we are well positioned to meet the growing needs of independent hotels and small- to medium-sized chain hotels through our specifically tailored technology solutions. |
| | • | | Growth in Technology Enabled B2B Payment Solutions: Traditionally, travel payments from travel agencies to travel providers have been settled through a variety of methods, such as cash, EFTs, corporate cards, lodge cards and other methods. All of these traditional payment methods bear numerous inefficiencies as well as significant credit-related and fraud-related risks that are costly and time consuming leaving a “white space” for an alternative innovative model, such as VANs. Growth in technology enabled B2B payment solutions benefits us directly through our majority ownership of eNett. In 2014, eNett generated revenue of $67 million, representing an approximately 49% increase from 2013. We expect eNett to rapidly increase its penetration rate in the travel industry and continue to increase its share of our revenue growth. |
53
Factors Affecting the Company
Factors affecting our results of operations, but not necessarily our entire industry, include:
| | • | | Geographic Mix: Our geographically dispersed footprint helps insulate us from particular country or regional instability, allows for optimal information technology efficiency and enhances our value proposition to travel providers. We are well positioned to capture higher value business from travel providers operating in away markets, which results in higher per transaction revenue for both us and the travel providers we serve. The table below sets forth revenue by region percentages for our Travel Commerce Platform for the years ended December 31, 2014, 2013 and 2012: |
| | | | | | | | | | | | |
| | | Year Ended
December 31, | |
(in percentages) | | 2014 | | | 2013 | | | 2012 | |
Asia Pacific | | | 20 | | | | 19 | | | | 18 | |
Europe | | | 30 | | | | 31 | | | | 29 | |
Latin America and Canada | | | 4 | | | | 4 | | | | 4 | |
Middle East and Africa | | | 14 | | | | 14 | | | | 15 | |
| | | | | | | | | | | | |
International | | | 68 | | | | 68 | | | | 66 | |
United States | | | 32 | | | | 32 | | | | 34 | |
| | | | | | | | | | | | |
Travel Commerce Platform | | | 100 | | | | 100 | | | | 100 | |
| | | | | | | | | | | | |
We expect some of the regions in which we currently operate, such as Asia Pacific, Latin America and the Middle East, to experience growth in travel that is greater than the global average due to factors such as economic growth and a growing middle class, while more mature regions, such as the United States, remain stable. As these emerging travel regions may grow at a higher rate than mature regions, the geographic distribution of our revenue may similarly shift.
| | • | | Customer Mix: We believe our customer mix is broadly diversified, supporting our stable and recurring business model with high revenue visibility. We provide air distribution services to approximately 400 airlines globally, including approximately 100 LCCs. In addition, we serve numerous Beyond Air travel providers, including over 650,000 hotel properties (of which over 550,000 are independent hotel properties), over 35,000 car rental locations and 61 cruise-line and tour operators. We aggregate travel content across over 67,000 travel agency locations representing 259,000 online and offline travel agency terminals worldwide, which in turn serves millions of end customers globally. None of our travel buyers or travel providers accounted for more than 10% of our revenue for the year ended December 31, 2014. |
In general, our business is characterized by multi-year travel provider and travel agency contracts. In 2014, we had 38 planned airline contract renewals, and we successfully renewed all such contracts. We currently have 60 and 48 planned airline contract renewals in 2015 and 2016, respectively, including contracts which roll on annual basis. Travel agency contracts representing approximately 22%, 12%, 22% and 44% of 2014 revenue are up for renewal in 2015, 2016, 2017 and beyond, respectively. We did not lose any material travel buyer contract in the last three years. We cannot guarantee that we will be able to renew our travel provider or travel agency agreements in the future on favorable economic terms, or at all.
| | • | | Renegotiated Legacy Contracts: Orbitz Worldwide is currently the largest travel agency on our Travel Commerce Platform and accounted for 6%, 7% and 8% of our net revenue in the years ended December 31, 2014, 2013 and 2012, respectively. In February 2014, we entered into a new long-term agreement under which Orbitz Worldwide will use our services in the United States and other countries. Under the new agreement, which replaced our existing agreement with Orbitz Worldwide, we paid incremental benefits in 2014, and we will pay further increased fees in later years for each air, car and hotel segment. In addition, Orbitz Worldwide will receive wider flexibility to use traditional GDS providers for services beginning in 2015. In exchange for the enhanced payments, Orbitz |
54
| | Worldwide agreed to generate a minimum specified book of business through our Travel Commerce Platform and pay a shortfall payment if the minimum volume is not met. |
In May 2014, we restructured and extended our Technology Services relationship with Delta. Delta reacquired the data and intellectual property rights central to its passenger service and flight operations systems. We continue to run the systems infrastructure and hosting for the Delta platform in our Atlanta data center on our hardware and with our systems monitoring and support. Effective July 1, 2014, we transitioned approximately 178 employees to Delta and we estimate there will be a minor impact to our revenue, costs and Adjusted EBITDA in future.
| | • | | Seasonality: Our revenue can experience seasonal fluctuations, reflecting seasonal demand trends for the products and services we offer. These trends generally cause our revenue to be higher in the first and second quarters as compared to the third and fourth quarters of the calendar year. Revenue typically peaks during these times as travelers plan and purchase their upcoming spring and summer travel. |
| | • | | Foreign Exchange Fluctuations: We are exposed to movements in currency exchange rates that impact our operating results. While substantially all of our revenue is denominated in US dollars, a portion of our operating cost base, primarily commissions, is transacted in non-US dollar currencies (principally, the British pound, Euro and Australian dollar). |
| | • | | Litigation and Related Costs:We are involved in various claims, legal proceedings and governmental inquiries related to contract disputes, business practices, intellectual property and other commercial, employment and tax matters. We believe we have adequately accrued for such matters, and for costs of defending against such matters. However, litigation is inherently unpredictable and although we believe that our accruals are adequate and we have valid defenses in these matters, unfavorable resolutions could occur, which could have a material adverse effect on our results of operations or cash flows in a particular reporting period. |
Components of Revenue and Expenses
Revenue Model
Travel Commerce Platform
| | • | | Transaction Volume Model: This is our core model and is used broadly across our Travel Commerce Platform. The fee we charge per segment is not dependent on the transaction value of the segment, but is affected by other factors such as whether the booking was made in the travel providers’ home market or in an away market. We also receive revenue for cancellations of bookings previously made on our system and when tickets are issued by us that were originally booked on an alternative system. Revenue for air travel reservations is recognized at the time of the booking, net of estimated cancellations. Revenue for car and hotel reservations in Beyond Air is recognized upon fulfillment of the reservation. |
| | • | | Transaction Value Model: eNett earns revenue as a percentage of total transaction value in the form of interchange fees payable by banks. Revenue is recognized when the payment is processed. |
| | • | | Subscription Fee Model: We collect subscription fees from travel agencies, internet sites and other subscribers to access the applications on our Travel Commerce Platform, including providing the ability to access schedule and fare information, book reservations and issue tickets. Revenue is recognized when the services are performed. |
Technology Services
We collect fees, generally on a monthly basis under long-term contracts, for providing critical hosting solutions and other services to airlines such as pricing, shopping, ticketing, ground handling and other solutions. Revenue is recognized when the services are performed.
55
Cost of Revenue
Cost of revenue consists primarily of:
| | • | | Commissions: Payments or other consideration to travel agencies and NDCs for reservations made on our Travel Commerce Platform that accrue on a monthly basis. Commissions are provided in two ways depending on the terms of the contract: (i) variable per segment on a periodic basis over the term of the contract and (ii) upfront at the inception or modification of contracts, which is capitalized and amortized over the expected life of the contract and includes customer loyalty payments. The variable and amortized portion of the upfront incentive consideration is recorded to cost of revenue. Cost of revenue also includes incentive considerations to travel agencies and bank service charges for eNett. |
| | • | | Technology Costs: The direct technology costs related to revenue production, consisting of the maintenance and development costs for the mainframes, servers and software that is the shared infrastructure used to run our Travel Commerce Platform and Technology Services. Such costs consist of: |
| | • | | service contracts with IBM, Cisco and other technology service providers, including on-site around-the-clock support for computer equipment and the cost of software licenses used to run our Travel Commerce Platform and our data center; |
| | • | | other operating costs associated with running our Travel Commerce Platform, including facility and other running costs of our data center; |
| | • | | telecommunication and technology costs related to maintaining the networks between us and our travel providers and our hosting solutions; and |
| | • | | salaries and benefits paid to employees for the development, delivery and implementation of software; the maintenance of mainframes, servers and software used in our data center; and customer support, including call center operations. |
Selling, General and Administrative Expenses
Selling, general and administrative expenses consist of (i) workforce-related expenses for sales, finance, legal, human resources and administrative support employees and (ii) non-workforce expenses, including accounting, tax and other professional services fees, legal related costs, bad debt expense and other miscellaneous items.
Depreciation and Amortization
Depreciation and amortization consists of depreciation expense on property and equipment and amortization expense on certain intangible assets. Property and equipment is primarily comprised of internally developed software, purchased software licenses and computer equipment. Depreciation is computed using the straight-line method over the estimated useful lives of the assets.
Definite-lived intangible assets are amortized, and such assets relate to customer and vendor contracts acquired in the sale of Travelport to Blackstone in 2006 and from our acquisition of Worldspan in 2007. Amortization is computed using the straight-line method over the estimated useful lives of the assets, unless another method is more appropriate.
Interest Expense, net
Interest expense, net is primarily comprised of (i) interest expense on our borrowings, financial expense on hedging derivatives and the amortization of deferred financing fees, less (ii) financial income received from our hedging derivatives and interest earned from short-term investments and bank deposits, plus / less (iii) the change in the fair value of derivatives that do not qualify for hedge accounting.
56
(Loss) Gain on Early Extinguishment of Debt
(Loss) gain on early extinguishment of debt is primarily comprised of (i) loss on extinguishment of debt, (ii) unamortized debt finance costs and debt discounts written-off and (iii) early repayment penalties related to our financial arrangements.
Provision of Income Taxes
Our tax provision differs significantly from the U.S. Federal statutory rate primarily as a result of (i) being subject to income tax in numerous non-U.S. jurisdictions with varying income tax rates, (ii) a valuation allowance continued to be maintained in various jurisdictions including the US due to the historical losses in such jurisdictions, (iii) certain expenses that are not deductible for tax or do not secure an effective tax deduction under the relevant jurisdictions and (iv) certain income or gains which are not subject to tax.
Share of Earnings (Losses) in Equity Method Investments
We recorded earnings (losses) in relation to our proportional share of ownership of Orbitz Worldwide and our other equity method investment. On December 31 2014, our ownership interest in Orbitz Worldwide was reduced to less than 1%. Our other equity method investment is not material to our consolidated financial statements.
Results of Operations
Year Ended December 31, 2014 Compared to Year Ended December 31, 2013
| | | | | | | | | | | | | | | | |
| | | Year Ended
December 31, | | | Change | |
(in $ millions) | | 2014 | | | 2013 | | | $ | | | % | |
Net revenue | | $ | 2,148 | | | $ | 2,076 | | | $ | 72 | | | | 3 | |
| | | | | | | | | | | | | | | | |
Costs and expenses | | | | | | | | | | | | | | | | |
Cost of revenue | | | 1,324 | | | | 1,266 | | | | 58 | | | | 5 | |
Selling, general and administrative | | | 430 | | | | 396 | | | | 34 | | | | 9 | |
Depreciation and amortization | | | 233 | | | | 206 | | | | 27 | | | | 13 | |
| | | | | | | | | | | | | | | | |
Total costs and expenses | | | 1,987 | | | | 1,868 | | | | 119 | | | | 6 | |
| | | | | | | | | | | | | | | | |
Operating income | | | 161 | | | | 208 | | | | (47 | ) | | | (23 | ) |
Interest expense, net | | | (278 | ) | | | (356 | ) | | | 78 | | | | 22 | |
Loss on early extinguishment of debt | | | (108 | ) | | | (49 | ) | | | (59 | ) | | | (121 | ) |
Gain on sale of shares of Orbitz Worldwide | | | 356 | | | | — | | | | 356 | | | | * | |
| | | | | | | | | | | | | | | | |
Income (loss) from continuing operations before income taxes and share of (losses) earnings in equity method investments | | | 131 | | | | (197 | ) | | | 328 | | | | 166 | |
Provision for income taxes | | | (39 | ) | | | (20 | ) | | | (19 | ) | | | (90 | ) |
Share of (losses) earnings in equity method investments | | | (1 | ) | | | 10 | | | | (11 | ) | | | (111 | ) |
| | | | | | | | | | | | | | | | |
Net income (loss) from continuing operations | | | 91 | | | | (207 | ) | | | 298 | | | | 144 | |
Gain from disposal of discontinued operations, net of tax | | | — | | | | 4 | | | | (4 | ) | | | (100 | ) |
| | | | | | | | | | | | | | | | |
Net income (loss) | | $ | 91 | | | $ | (203 | ) | | $ | 294 | | | | 145 | |
| | | | | | | | | | | | | | | | |
57
Net Revenue
Net revenue is comprised of:
| | | | | | | | | | | | | | | | |
| | | Year Ended
December 31, | | | Change | |
(in $ millions) | | 2014 | | | 2013 | | | $ | | | % | |
Air | | $ | 1,607 | | | $ | 1,588 | | | $ | 19 | | | | 1 | |
Beyond Air | | | 424 | | | | 371 | | | | 53 | | | | 14 | |
| | | | | | | | | | | | | | | | |
Travel Commerce Platform | | | 2,031 | | | | 1,959 | | | | 72 | | | | 4 | |
Technology Services | | | 117 | | | | 117 | | | | — | | | | 1 | |
| | | | | | | | | | | | | | | | |
Net revenue | | $ | 2,148 | | | $ | 2,076 | | | $ | 72 | | | | 3 | |
| | | | | | | | | | | | | | | | |
For the year ended December 31, 2014, Net revenue increased by $72 million, or 3%, compared to the year ended December 31, 2013. This increase was driven by an increase in Travel Commerce Platform revenue of $72 million, or 4%.
Travel Commerce Platform
The table below sets forth Travel Commerce Platform RevPas and Reported Segments:
| | | | | | | | | | | | | | | | |
| | | Year Ended
December 31, | | | Change | |
| | | 2014 | | | 2013 | | | $ | | | % | |
Travel Commerce Platform RevPas(in $) | | $ | 5.70 | | | $ | 5.60 | | | $ | 0.10 | | | | 2 | |
Reported Segments(in millions) | | | 356 | | | | 350 | | | | 6 | | | | 2 | |
The increase in Travel Commerce Platform revenue of $72 million, or 4%, was due to a $53 million, or 14%, increase in our Beyond Air revenue and a $19 million, or 1%, increase in our Air revenue. Overall, there was a 2% increase in both Travel Commerce Platform RevPas and Reported Segments.
Our Travel Commerce Platform continues to benefit from growth in Air revenue and Beyond Air revenue. The value of transactions processed on the Travel Commerce Platform increased to $90 billion for the year ended December 31, 2014 from $87.7 billion for the year ended December 31, 2013. We increased our airline tickets sold to 122 million from 120 million and our percentage of Air segment revenue from away bookings remained flat at 62%. We increased our hospitality segments per 100 airline tickets issued to 43 from 41, our hotel room nights sold to 63 million from 61 million, and our car rental days sold to 85 million from 76 million.
The table below sets forth Travel Commerce Platform revenue by region:
| | | | | | | | | | | | | | | | |
| | | Year Ended
December 31, | | | Change | |
(in $ millions) | | 2014 | | | 2013 | | | $ | | | % | |
Asia Pacific | | $ | 400 | | | $ | 369 | | | $ | 31 | | | | 8 | |
Europe | | | 615 | | | | 596 | | | | 19 | | | | 3 | |
Latin America and Canada | | | 88 | | | | 86 | | | | 2 | | | | 3 | |
Middle East and Africa | | | 280 | | | | 277 | | | | 3 | | | | 1 | |
| | | | | | | | | | | | | | | | |
International | | | 1,383 | | | | 1,328 | | | | 55 | | | | 4 | |
United States | | | 648 | | | | 631 | | | | 17 | | | | 2 | |
| | | | | | | | | | | | | | | | |
Travel Commerce Platform | | $ | 2,031 | | | $ | 1,959 | | | $ | 72 | | | | 4 | |
| | | | | | | | | | | | | | | | |
58
The table below sets forth Reported Segments and RevPas by region:
| | | | | | | | | | | | | | | | | | | | | | | | | | | | | | | | |
| | | Segments(in millions) | | | RevPas(in $) | |
| | | Year Ended
December 31, | | | Change | | | Year Ended
December, 31 | | | Change | |
| | | 2014 | | | 2013 | | | | | | % | | | 2014 | | | 2013 | | | $ | | | % | |
Asia Pacific | | | 58 | | | | 56 | | | | 2 | | | | 3 | | | $ | 6.90 | | | $ | 6.58 | | | $ | 0.32 | | | | 5 | |
Europe | | | 86 | | | | 85 | | | | 1 | | | | 1 | | | | 7.15 | | | | 6.96 | | | | 0.19 | | | | 3 | |
Latin America and Canada | | | 15 | | | | 15 | | | | — | | | | 5 | | | | 5.75 | | | | 5.88 | | | | (0.13 | ) | | | (2 | ) |
Middle East and Africa | | | 39 | | | | 39 | | | | — | | | | — | | | | 7.22 | | | | 7.15 | | | | 0.07 | | | | 1 | |
| | | | | | | | | | | | | | | | | | | | | | | | | | | | | | | | |
International | | | 198 | | | | 195 | | | | 3 | | | | 2 | | | | 6.98 | | | | 6.81 | | | | 0.17 | | | | 3 | |
United States | | | 158 | | | | 155 | | | | 3 | | | | 2 | | | | 4.10 | | | | 4.07 | | | | 0.03 | | | | 1 | |
| | | | | | | | | | | | | | | | | | | | | | | | | | | | | | | | |
Travel Commerce Platform | | | 356 | | | | 350 | | | | 6 | | | | 2 | | | $ | 5.70 | | | $ | 5.60 | | | $ | 0.10 | | | | 2 | |
| | | | | | | | | | | | | | | | | | | | | | | | | | | | | | | | |
International
Our International Travel Commerce Platform revenue increased $55 million, or 4%, due to a 3% increase in RevPas and a 2% increase in Reported Segments. The RevPas increase across the regions was a result of growing our Beyond Air offerings, including growth in payment solutions, hospitality and advertising. Our International Travel Commerce Platform revenue as a percentage of Total Travel Commerce Platform revenue was 68% for each of the years ended December 31, 2014 and 2013.
Asia Pacific
Revenue in Asia Pacific increased $31 million, or 8%, due to a 5% increase in RevPas and a 3% increase in Reported Segments. RevPas increased due to growth in Air and Beyond Air revenue, including increased revenue from other platform services. Reported Segments increased due to strong growth in India and South Korea.
Europe
Revenue in Europe increased $19 million, or 3%, due to a 3% increase in RevPas and a 1% increase in Reported Segments. RevPas increased due to Beyond Air growth, including increased revenue from eNett.
Latin America and Canada
Revenue in Latin America and Canada increased $2 million, or 3%, due to a 5% increase in Reported Segments offset by a 2% decrease in RevPas. Reported Segment growth was due to strong growth in Canada.
Middle East and Africa
Revenue in the Middle East and Africa increased $3 million, or 1%, due to a 1% increase in RevPas as a result of an increase in Air revenue.
United States
Revenue in the United States increased $17 million, or 2%, primarily due to a 2% increase in Reported Segments and a 1% increase in RevPas.
Technology Services
Technology Services revenue was flat at $117 million.
59
Cost of Revenue
Cost of revenue is comprised of:
| | | | | | | | | | | | | | | | |
| | | Year Ended
December 31, | | | Change | |
(in $ millions) | | 2014 | | | 2013 | | | $ | | | % | |
Commissions | | $ | 1,022 | | | $ | 978 | | | $ | 44 | | | | 5 | |
Technology costs | | | 302 | | | | 288 | | | | 14 | | | | 5 | |
| | | | | | | | | | | | | | | | |
Cost of revenue | | $ | 1,324 | | | $ | 1,266 | | | $ | 58 | | | | 5 | |
| | | | | | | | | | | | | | | | |
Cost of revenue increased by $58 million, or 5%, primarily as a result of a $44 million, or 5%, increase in commission costs. Commissions paid to travel agencies increased due to a 2% increase in travel distribution cost per segment, a 2% increase in Reported Segments and incremental commission costs from our payment processing business. Commissions included amortization of customer loyalty payments of $76 million and $63 million for the years ended December 31, 2014 and 2013, respectively. Technology costs across the shared infrastructure that runs our Travel Commerce Platform and Technology Services increased by $14 million, or 5%, due to continued expansion of our operations and investments in technology.
Selling, General and Administrative (SG&A)
SG&A is comprised of:
| | | | | | | | | | | | | | | | |
| | | Year Ended
December 31, | | | Change | |
(in $ millions) | | 2014 | | | 2013 | | | $ | | | % | |
Workforce | | $ | 291 | | | $ | 294 | | | | (3 | ) | | | (1 | ) |
Non-workforce | | | 69 | | | | 62 | | | | 7 | | | | 9 | |
| | | | | | | | | | | | | | | | |
Sub-total | | | 360 | | | | 356 | | | | 4 | | | | 1 | |
Non-core corporate costs | | | 70 | | | | 40 | | | | 30 | | | | 79 | |
| | | | | | | | | | | | | | | | |
SG&A | | $ | 430 | | | $ | 396 | | | $ | 34 | | | | 9 | |
| | | | | | | | | | | | | | | | |
SG&A expenses increased by $34 million, or 9%, during the year ended December 31, 2014 compared to December 31, 2013. SG&A expenses include $70 million and $40 million of charges for the years ended December 31, 2014 and 2013, respectively, for non-core corporate costs that are removed from Adjusted EBITDA. Excluding these items, our SG&A expenses for the year ended December 31, 2014 compared to the year ended December 31, 2013 increased by $4 million, or 1%. Workforce expenses, which include the wages and benefits of our selling, marketing, advertising, finance and legal personnel decreased by $3 million, or 1%, primarily as a result of lower pension expense of $10 million and lower employee incentive plan expenses of $4 million, offset by increase in wages and benefits of approximately $11 million as a result of increased headcount and merit increases. Non-workforce expenses, which include costs of finance and legal professional fees, facilities, communications and marketing and foreign exchange related costs, increased $7 million, or 9%, primarily due to unfavorable foreign exchange movement.
Non-core corporate costs of $70 million and $40 million for the years ended December 31, 2014 and 2013, respectively, represent costs related to strategic transactions and restructurings, equity-based compensation, certain legal and related costs and foreign currency gains and losses related to euro denominated debt and derivatives. The increase of $30 million is primarily due to a $38 million increase in our equity-based compensation and related costs due to RSUs granted in the second quarter of 2014, accelerated vesting of our time-based RSUs in the third quarter of 2014 and equity awards granted post our IPO and a $7 million increase in corporate and restructuring costs, partially offset by a $12 million reduction in legal and related costs.
60
Depreciation and Amortization
Depreciation and amortization is comprised of:
| | | | | | | | | | | | | | | | |
| | | Year Ended
December 31, | | | Change | |
(in $ millions) | | 2014 | | | 2013 | | | $ | | | % | |
Depreciation on property and equipment | | $ | 156 | | | $ | 126 | | | $ | 30 | | | | 24 | |
Amortization of acquired intangible assets | | | 77 | | | | 80 | | | | (3 | ) | | | (4 | ) |
| | | | | | | | | | | | | | | | |
Total depreciation and amortization | | $ | 233 | | | $ | 206 | | | $ | 27 | | | | 13 | |
| | | | | | | | | | | | | | | | |
Total depreciation and amortization increased by $27 million, or 13%. Depreciation on property and equipment increased $30 million, or 24%, primarily due to a higher capitalized cost of internally developed software as we continue to develop our systems to enhance our Travel Commerce Platform. Amortization of acquired intangible assets decreased by $3 million, or 4%, as the useful lives expired on a portion of the assets acquired on the sale of Travelport to Blackstone in 2006 and the acquisition of Worldspan in 2007.
Interest Expense, Net
Interest expense, net, decreased by $78 million, or 22%, as a result of the decrease in our debt balance as a result of deleveraging transactions during the year, repayment of debt from proceeds of our IPO, and our new credit agreement entered into in September 2014.
Loss on Early Extinguishment of Debt
During the year ended December 31, 2014, we completed several deleveraging transactions and refinanced our term loans under a new senior secured credit agreement, repaying all of our then existing indebtedness, excluding capital leases. These transactions were accounted for as an extinguishment of debt resulting in a loss on early extinguishment of $108 million.
During 2013, we amended our senior secured credit agreement, repaid dollar denominated term loans under our 2012 secured credit agreement and refinanced our senior notes resulting in $49 million loss on early extinguishment of debt.
Gain on Sale of Shares of Orbitz Worldwide
During the year ended December 31, 2014, we sold 48 million shares of common stock of Orbitz Worldwide in underwritten offerings for net proceeds of $366 million and recognized a gain of $356 million. As of December 31, 2014, we owned less than 1% of the outstanding shares of common stock of Orbitz Worldwide from July 2014 and no longer account our investment in Orbitz Worldwide as equity method investment.
Provision for Income Taxes
Our tax provision differs significantly from the US Federal statutory rate primarily as a result of (i) being subject to income tax in numerous non-US jurisdictions with varying income tax rates, (ii) a valuation allowance continued to be maintained in various jurisdictions including the US due to the historical losses in such jurisdictions, (iii) certain expenses that are not deductible for tax or do not secure an effective tax deduction under the relevant jurisdictions and (iv) certain income or gains which are not subject to tax.
61
Share of (Losses) Earnings in Equity Method Investments
Our share of losses in equity method investments was primarily from Orbitz Worldwide and was $1 million for the period from January 1, 2014 to July 22, 2014 compared to earnings of $10 million for the year ended December 31, 2013. During the period ended July 22, 2014, these earnings reflect approximately 44% of ownership interest until May 2014 (following our sale of 8.6 million shares of Orbitz Worldwide’s common stock) and approximately 36% of ownership interest from May 2014 until July 22, 2014 when we sold substantially all of the remaining shares of Orbitz Worldwide for approximately $312 million and used the proceeds to repay a portion of our outstanding first lien term loans. Consequently, we discontinued equity method of accounting as of July 22, 2014. For the year December 31, 2013, these earnings reflect approximately 45% of our ownership interest in Orbitz Worldwide.
Year Ended December 31, 2013 Compared to Year Ended December 31, 2012
| | | | | | | | | | | | | | | | |
| | | Year Ended
December 31, | | | Change | |
(in $ millions) | | 2013 | | | 2012 | | | $ | | | % | |
Net revenue | | $ | 2,076 | | | $ | 2,002 | | | $ | 74 | | | | 4 | |
| | | | | | | | | | | | | | | | |
Costs and expenses | | | | | | | | | | | | | | | | |
Cost of revenue | | | 1,266 | | | | 1,191 | | | | 75 | | | | 6 | |
Selling, general and administrative | | | 396 | | | | 446 | | | | (50 | ) | | | (11 | ) |
Depreciation and amortization | | | 206 | | | | 227 | | | | (21 | ) | | | (9 | ) |
| | | | | | | | | | | | | | | | |
Total costs and expenses | | | 1,868 | | | | 1,864 | | | | 4 | | | | — | |
| | | | | | | | | | | | | | | | |
Operating income | | | 208 | | | | 138 | | | | 70 | | | | 51 | |
Interest expense, net | | | (356 | ) | | | (346 | ) | | | (10 | ) | | | (3 | ) |
(Loss) gain on early extinguishment of debt | | | (49 | ) | | | 6 | | | | (55 | ) | | | * | |
| | | | | | | | | | | | | | | | |
Loss from continuing operations before income taxes and share of earnings (losses) in equity method investments | | | (197 | ) | | | (202 | ) | | | 5 | | | | 2 | |
Provision for income taxes | | | (20 | ) | | | (23 | ) | | | 3 | | | | 11 | |
Share of earnings (losses) in equity method investments | | | 10 | | | | (74 | ) | | | 84 | | | | * | |
| | | | | | | | | | | | | | | | |
Net loss from continuing operations | | | (207 | ) | | | (299 | ) | | | 92 | | | | 31 | |
Gain from disposal of discontinued operations, net of tax | | | 4 | | | | 7 | | | | (3 | ) | | | (34 | ) |
| | | | | | | | | | | | | | | | |
Net loss | | $ | (203 | ) | | $ | (292 | ) | | $ | 89 | | | | 30 | |
| | | | | | | | | | | | | | | | |
Net Revenue
Net revenue is comprised of:
| | | | | | | | | | | | | | | | |
| | | Year Ended
December 31, | | | Change | |
(in $ millions) | | 2013 | | | 2012 | | | $ | | | % | |
Air | | $ | 1,588 | | | $ | 1,548 | | | $ | 40 | | | | 3 | |
Beyond Air | | | 371 | | | | 326 | | | | 45 | | | | 14 | |
| | | | | | | | | | | | | | | | |
Travel Commerce Platform | | | 1,959 | | | | 1,874 | | | | 85 | | | | 5 | |
Technology Services | | | 117 | | | | 128 | | | | (11 | ) | | | (9 | ) |
| | | | | | | | | | | | | | | | |
Net revenue | | $ | 2,076 | | | $ | 2,002 | | | $ | 74 | | | | 4 | |
| | | | | | | | | | | | | | | | |
62
For the year ended December 31, 2013, Net revenue increased by $74 million, or 4%, compared to the year ended December 31, 2012. This increase was driven by an increase in Travel Commerce Platform revenue of $85 million, or 5%, offset by a decrease of $11 million, or 9%, in Technology Services revenue.
As a result of the merger of United Airlines and Continental Airlines, we discontinued servicing the United Airlines reservation system in March 2012 when they migrated to the Continental Airlines system. United Airlines, the surviving airline in the merger between United Airlines and Continental Airlines, remains a full content travel provider on our Travel Commerce Platform. In 2012, the MSA with United contributed $19 million to Technology Services revenue and $8 million to Travel Commerce Platform revenue. Excluding the impact of the loss of the United Airlines MSA, Net revenue would have increased by $101 million, or 5%, with a $93 million increase in Travel Commerce Platform revenue and an $8 million increase in Technology Services revenue.
Travel Commerce Platform
The table below sets forth Travel Commerce Platform RevPas and Reported Segments:
| | | | | | | | | | | | | | | | |
| | | Year Ended
December 31, | | | Change | |
| | | 2013 | | | 2012 | | | $ | | | % | |
Travel Commerce Platform RevPas (in $) | | $ | 5.60 | | | $ | 5.40 | | | $ | 0.20 | | | | 4 | |
Reported Segments (in millions) | | | 350 | | | | 347 | | | | 3 | | | | 1 | |
The increase in Travel Commerce Platform revenue of $85 million, or 5%, was due to a $40 million, or 3%, increase in Air revenue and a $45 million, or 14%, increase in Beyond Air revenue. Overall, there was a 4% increase in Travel Commerce Platform Revpas and 1% increase in Reported Segments. Excluding the loss of the MSA with United Airlines, Air revenue would have increased by $48 million, or 3%. The loss of the MSA with United Airlines did not impact Beyond Air revenue.
Our Travel Commerce Platform continues to benefit from growth in Air revenue and Beyond Air revenue. The value of transactions processed on the Travel Commerce Platform increased to $87.7 billion for the year ended December 31, 2013 from $85.3 billion for the year ended December 31, 2012. We increased our airline tickets sold to 120 million from 116 million and our percentage of Air segment revenue from away bookings increased to 62% from 60%. We increased our hospitality segments per 100 airline tickets issued to 41 from 40 and we increased our hotel rooms nights sold to 61 million from 58 million, our car rental days sold to 76 million from 72 million.
The table below sets forth Travel Commerce Platform revenue by region:
| | | | | | | | | | | | | | | | |
| | | Year Ended
December 31, | | | Change | |
(in $ millions) | | 2013 | | | 2012 | | | $ | | | % | |
Asia Pacific | | $ | 369 | | | $ | 336 | | | $ | 33 | | | | 10 | |
Europe | | | 596 | | | | 549 | | | | 47 | | | | 9 | |
Latin America and Canada | | | 86 | | | | 77 | | | | 9 | | | | 12 | |
Middle East and Africa | | | 277 | | | | 270 | | | | 7 | | | | 3 | |
| | | | | | | | | | | | | | | | |
International | | | 1,328 | | | | 1,232 | | | | 96 | | | | 8 | |
United States | | | 631 | | | | 642 | | | | (11 | ) | | | (2 | ) |
| | | | | | | | | | | | | | | | |
Travel Commerce Platform | | $ | 1,959 | | | $ | 1,874 | | | $ | 85 | | | | 5 | |
| | | | | | | | | | | | | | | | |
63
The table below sets forth Reported Segments and RevPas revenue by region:
| | | | | | | | | | | | | | | | | | | | | | | | | | | | | | | | |
| | | Segments(in millions) | | | RevPas(in $) | |
| | | Year Ended
December 31, | | | Change | | | Year Ended
December, 31 | | | Change | |
| | | 2013 | | | 2012 | | | | | | % | | | 2013 | | | 2012 | | | $ | | | % | |
Asia Pacific | | | 56 | | | | 54 | | | | 2 | | | | 4 | | | $ | 6.58 | | | $ | 6.21 | | | $ | 0.37 | | | | 6 | |
Europe | | | 85 | | | | 82 | | | | 3 | | | | 4 | | | | 6.96 | | | | 6.67 | | | | 0.29 | | | | 5 | |
Latin America and Canada | | | 15 | | | | 13 | | | | 2 | | | | 14 | | | | 5.88 | | | | 6.02 | | | | (0.14 | ) | | | (2 | ) |
Middle East and Africa | | | 39 | | | | 39 | | | | — | | | | — | | | | 7.15 | | | | 6.98 | | | | 0.17 | | | | 3 | |
| | | | | | | | | | | | | | | | | | | | | | | | | | | | | | | | |
International | | | 195 | | | | 188 | | | | 7 | | | | 4 | | | | 6.81 | | | | 6.55 | | | | 0.26 | | | | 4 | |
United States | | | 155 | | | | 159 | | | | (4 | ) | | | (3 | ) | | | 4.07 | | | | 4.03 | | | | 0.04 | | | | 1 | |
| | | | | | | | | | | | | | | | | | | | | | | | | | | | | | | | |
Travel Commerce Platform | | | 350 | | | | 347 | | | | 3 | | | | 1 | | | $ | 5.60 | | | $ | 5.40 | | | $ | 0.20 | | | | 4 | |
| | | | | | | | | | | | | | | | | | | | | | | | | | | | | | | | |
International
Our International Travel Commerce Platform revenue increased $96 million, or 8%, due to a 4% increase in Reported Segments and a 4% increase in RevPas. The RevPas increase across the regions was a result of growing our ancillary Air revenue, hospitality and advertising revenue and an approximately 137% increase in eNett net revenue. Our International Travel Commerce Platform revenue as a percentage of Total Travel Commerce Platform revenue increased from 66% for the year ended December 31, 2012 to 68% for the year ended December 31, 2013.
Asia Pacific
Revenue in Asia Pacific increased $33 million, or 10%, due to a 4% increase in Reported Segments and a 6% increase in RevPas. Reported Segments increased by 2 million primarily due to strong volume growth of 23% in Australia driven by the increase in seats sold on Virgin Australia, partially offset by declining volumes in India primarily as a result of Kingfisher Airlines ceasing operations in October 2012. RevPas growth of 6% was primarily due to growth in our Beyond Air business due to increased revenue at eNett.
Europe
Revenue in Europe increased $47 million, or 9%, due to a 4% increase in Reported Segments and a 5% increase in RevPas. Reported Segment growth was particularly strong in Eastern Europe with 2 million incremental segments booked in Russia and the Ukraine. RevPas growth of 5% was primarily driven by an increase in higher yielding away segments and an increase in revenue from eNett.
Latin America and Canada
Revenue in Latin America and Canada increased $9 million, or 12%, due to a 14% increase in Reported Segments, partially offset by a 2% decrease in RevPas. Reported Segments increased by 2 million primarily due to higher volumes in Canada resulting from the expansion of our Air Canada content offerings. The 2% decrease in RevPas was driven by the change in mix of volumes among our travel providers.
Middle East and Africa
Revenue in the Middle East and Africa increased $7 million, or 3%, due to a 3% increase in RevPas, with Reported Segments remaining constant. Growth in volumes in Africa was offset by declines in the Middle East. RevPas growth of 3% was primarily driven by an increase in higher yielding away segments.
64
United States
Revenue in the United States decreased $11 million, or 2%, due to a 3% decrease in Reported Segments, partially offset by a 1% increase in RevPas. The 3% decrease in Reported Segments was primarily due to the loss of 2 million segments booked through the United Airlines hosting system, which we no longer host as United Airlines now uses the system previously used by Continental Airlines. Excluding the impact of the loss of the United Airlines MSA, revenue in the United States would have decreased by $3 million.
Technology Services
Technology Services revenue decreased by $11 million, or 9%, primarily as a result of the loss of $19 million as a result of the loss of hosting revenue earned in 2012 through the MSA with United Airlines. Excluding the loss of the loss of the MSA with United Airlines, Technology Services revenue would have increased by $8 million, or 7%, primarily as a result of an increase in third-party revenue from our development operations.
Cost of Revenue
Cost of revenue is comprised of:
| | | | | | | | | | | | | | | | |
| | | Year Ended
December 31, | | | Change | |
(in $ millions) | | 2013 | | | 2012 | | | $ | | | % | |
Commissions | | $ | 978 | | | $ | 919 | | | $ | 59 | | | | 6 | |
Technology costs | | | 288 | | | | 272 | | | | 16 | | | | 6 | |
| | | | | | | | | | | | | | | | |
Cost of revenue | | $ | 1,266 | | | $ | 1,191 | | | $ | 75 | | | | 6 | |
| | | | | | | | | | | | | | | | |
Cost of revenue increased by $75 million, or 6%, as a result of 59 million, or 6%, increase in commission costs and a $16 million, or 6%, increase in technology costs. Commissions paid to travel agencies increased due to a 1% increase in Reported Segments, a 3% increase in travel distribution costs per segment and incremental commission costs for eNett. Commissions include amortization of customer loyalty payments of $63 million in 2013 and $62 million in 2012. Technology costs across the shared infrastructure that runs our Travel Commerce Platform and Technology Services increased by $16 million, or 6%. This increase was due to the continued expansion of our operations and investment in technology to meet the increased processing capacity required to operate our Travel Commerce Platform. Excluding the impact of the loss of the United Airlines MSA, cost of revenue would have increased by $81 million, or 7%.
Selling, General and Administrative (SG&A)
SG&A is comprised of:
| | | | | | | | | | | | | | | | |
| | | Year Ended
December 31, | | | Change | |
(in $ millions) | | 2013 | | | 2012 | | | $ | | | % | |
Workforce | | $ | 294 | | | $ | 285 | | | $ | 9 | | | | 3 | |
Non-workforce | | | 62 | | | | 71 | | | | (9 | ) | | | (13 | ) |
| | | | | | | | | | | | | | | | |
Sub-total | | | 356 | | | | 356 | | | | — | | | | — | |
Non-core corporate costs | | | 40 | | | | 90 | | | | (50 | ) | | | (56 | ) |
| | | | | | | | | | | | | | | | |
SG&A | | $ | 396 | | | $ | 446 | | | $ | (50 | ) | | | (11 | ) |
| | | | | | | | | | | | | | | | |
SG&A expenses decreased by $50 million, or 11%. SG&A expenses for the years ended December 31, 2013 and 2012 included $40 million and $90 million charges, respectively, for non-core corporate costs that are
65
removed from Adjusted EBITDA. Excluding these items, our SG&A expenses remained flat. Workforce expenses, which include the wages and benefits of our selling, marketing, advertising, finance and legal personnel increased by $9 million, or 3%, primarily as a result of a 1% increase in headcount and an increase in merit pay. Non-workforce expenses decreased by $9 million, or 13%, primarily as a result of a reduction in legal costs and outsourced customer support costs.
Non-core corporate costs represent costs related to strategic transactions and restructurings, equity-based compensation, legal and related costs and foreign currency gains (losses) related to euro denominated debt and derivatives. Non-core corporate costs decreased by $50 million in 2013, primarily as a result of a $41 million reduction in litigation costs and a $12 million reduction in other non-core corporate costs.
Depreciation and Amortization
Depreciation and amortization is comprised of:
| | | | | | | | | | | | | | | | |
| | | Year Ended
December 31, | | | Change | |
(in $ millions) | | 2013 | | | 2012 | | | $ | | | % | |
Depreciation on property and equipment | | $ | 126 | | | $ | 145 | | | $ | (19 | ) | | | (13 | ) |
Amortization of acquired intangible assets | | | 80 | | | | 82 | | | | (2 | ) | | | (2 | ) |
| | | | | | | | | | | | | | | | |
Total depreciation and amortization | | $ | 206 | | | $ | 227 | | | $ | (21 | ) | | | (9 | ) |
| | | | | | | | | | | | | | | | |
Total depreciation and amortization decreased by $21 million, or 9%. Depreciation of property and equipment decreased $19 million primarily due to assets that were acquired in 2007 in connection with our acquisition of Worldspan reaching the end of their five year useful life. Amortization of acquired intangible assets decreased by $2 million, or 2%, as the useful lives expired on a portion of the assets acquired on the sale of Travelport to Blackstone in 2006 and the acquisition of Worldspan in 2007.
Interest Expense, Net
Interest expense, net, increased by $10 million, or 3%, primarily due to higher effective interest rates on our debt, offset by a reduction in debt due to the extinguishment of our payment-in-kind (“PIK”) term loans in 2013.
(Loss) Gain on Early Extinguishment of Debt
During 2013, we amended our senior secured credit agreement, repaid dollar denominated term loans under our 2012 secured credit agreement and refinanced our senior notes resulting in a $49 million loss on early extinguishment of debt, which was comprised of $39 million of unamortized debt finance costs written-off, $5 million of unamortized debt discount written-off and $5 million of early repayment penalty.
During 2012, we repurchased $26 million of euro and dollar denominated senior notes at a discount, resulting in a $6 million gain from early extinguishment of debt.
Provision for Income Taxes
Our tax provision differs significantly from the US Federal statutory rate primarily as a result of (i) being subject to income tax in numerous non-US jurisdictions with varying income tax rates, (ii) a valuation allowance continued to be maintained in various jurisdictions including the US due to the historical losses in such jurisdictions, (iii) certain expenses that are not deductible for tax or do not secure an effective tax deduction under the relevant jurisdiction.
66
Share of Earnings (Losses) in Equity Method Investments
Our share of equity in earnings (losses) of investment in Orbitz Worldwide was $10 million for the year ended December 31, 2013, compared to $(74) million for the year ended December 31, 2012. These earnings (losses) reflect our 45% ownership interest (46% ownership in 2012) in Orbitz Worldwide.
Liquidity and Capital Resources
Our principal sources of liquidity are (i) cash and cash equivalents, (ii) cash flows generated from operations and (iii) borrowings under our revolving credit facility. As of December 31, 2014, 2013 and 2012, our cash and cash equivalents, cash held as collateral and revolving credit facility availability were as follows:
| | | | | | | | | | | | |
| | | Year Ended
December 31, | |
(in $ millions) | | 2014 | | | 2013 | | | 2012 | |
Cash and cash equivalents | | $ | 139 | | | $ | 154 | | | $ | 110 | |
Cash held as collateral | | | 26 | | | | 79 | | | | 137 | |
Revolving credit facility availability | | | 86 | | | | 120 | | | | 98 | |
With the cash and cash equivalents on our consolidated balance sheets, our ability to generate cash from operations and access to our revolving credit facility and other lending sources, we believe we have sufficient liquidity to meet our ongoing needs for at least the next 12 months.
Working Capital
Our cash flows from operations are significantly impacted by revenue derived from, and commissions paid to, travel providers and travel agencies. The end of period balance sheet items related to this activity is referred to as “Trading Working Capital” and consists of accounts receivables and deferred revenue from travel providers and travel agencies, current prepaid travel agency incentive payments and accrued liabilities for commissions. We view Trading Working Capital as a key liquidity measure to understand our cash sources and uses from operations.
The table below sets out our Trading Working Capital as of December 31, 2014 and 2013, which is then reconciled to our Working Capital:
| | | | | | | | | | | | |
(in $ millions) | | December 31,
2014 | | | December 31,
2013 | | | Change | |
Accounts Receivable, net | | $ | 184 | | | $ | 177 | | | $ | 7 | |
Accrued commissions and incentives | | | (260 | ) | | | (253 | ) | | | (7 | ) |
Deferred revenue and prepaid incentives, net | | | (15 | ) | | | (10 | ) | | | (5 | ) |
| | | | | | | | | | | | |
Trading Working Capital | | | (91 | ) | | | (86 | ) | | | (5 | ) |
Cash and cash equivalents | | | 139 | | | | 154 | | | | (15 | ) |
Accounts payable and employee related | | | (132 | ) | | | (152 | ) | | | 20 | |
Accrued interest | | | (18 | ) | | | (73 | ) | | | 55 | |
Current portion of long-term debt | | | (56 | ) | | | (45 | ) | | | (11 | ) |
Taxes | | | 17 | | | | (8 | ) | | | 25 | |
Other assets (liabilities), net | | | (2 | ) | | | (5 | ) | | | 3 | |
| | | | | | | | | | | | |
Working Capital | | $ | (143 | ) | | $ | (215 | ) | | $ | 72 | |
| | | | | | | | | | | | |
| | | |
Consolidated Balance Sheets: | | | | | | | | | | | | |
Total current assets | | $ | 412 | | | $ | 466 | | | | | |
Total current liabilities | | | (555 | ) | | | (681 | ) | | | | |
| | | | | | | | | | | | |
Working Capital | | $ | (143 | ) | | $ | (215 | ) | | | | |
| | | | | | | | | | | | |
67
As of December 31, 2014, we had a Working Capital net liability of $143 million, compared to $215 million as of December 31, 2013, a decrease of $72 million. The $72 million decrease in net liability is primarily due to a $55 million decrease in accrued interest, $25 million decrease in taxes, $20 million decrease in accounts payable and employee related, offset by $11 million increase in current portion of long term debt, $5 million increase in Trade Working Capital net liability, as described below, and a $15 million decrease in cash and cash equivalents as discussed in “—Cash Flows” below.
As our business grows and our revenue and corresponding commissions and incentive expenses increase, our receivables and accruals increase. The fluctuations in these balances are the primary contributors to the changes to our Trading Working Capital. As of December 31, 2014 and 2013, our Trading Working Capital as a percentage of net revenue earned during the last twelve months was (4)% and (4)%, respectively.
The table below sets out information on our accounts receivable:
| | | | | | | | | | | | |
| | | December 31, 2014 | | | December 31, 2013 | | | Change | |
Accounts receivable, net(in $ millions) | | $ | 184 | | | $ | 177 | | | $ | 7 | |
Accounts receivable, net – Days Sales Outstanding (“DSO”) | | | 37 | | | | 38 | | | | (1 | ) |
Substantially all of our Air revenue within our Travel Commerce Platform is collected through the Airline Clearing House (“ACH”) and other similar clearing houses. ACH requires participants to deposit certain balances into their demand deposit accounts by certain deadlines, which facilitates a timely settlement process. For the year ended December 31, 2014, Air revenue accounted for approximately 75% of our revenue, however, only 53% of our outstanding receivables related to customers using ACH as of December 31, 2014. The ACH receivables are collected on average in 31 days. Beyond Air revenue is generally not collected through the ACH process and takes longer to collect. Our average net collection period was 37 DSO for total accounts receivable, net, at December 31, 2014, as compared to 38 days at December 31, 2013. The decrease in our DSO is primarily due to earlier payment of Beyond Air receivables in December 2014 compared to December 2013. Growth in Air revenue in the month of December 2014 compared to December 2013, contributed to the increase in our accounts receivable balance.
We pay commissions to travel agencies on varying contractual terms, including payments made on a monthly, quarterly, semi-annual and annual basis. For the year ended December 31, 2014, our commissions increased by $44 million, or 5%, resulting in an increased balance in accrued commissions and incentives of $7 million.
68
The table below sets out our Trading Working Capital as of December 31, 2013 and 2012, which is then reconciled to our Working Capital:
| | | | | | | | | | | | |
| | | Asset (Liability) | | | | |
(in $ millions) | | December 31,
2013 | | | December 31,
2012 | | | Change | |
Accounts Receivable, net | | $ | 177 | | | $ | 150 | | | $ | 27 | |
Accrued commissions and incentives | | | (253 | ) | | | (211 | ) | | | (42 | ) |
Deferred revenue and prepaid incentives, net | | | (10 | ) | | | (11 | ) | | | 1 | |
| | | | | | | | | | | | |
Trading Working Capital | | | (86 | ) | | | (72 | ) | | | (14 | ) |
Cash and cash equivalents | | | 154 | | | | 110 | | | | 44 | |
Accounts payable and employee related | | | (152 | ) | | | (145 | ) | | | (7 | ) |
Accrued interest | | | (73 | ) | | | (69 | ) | | | (4 | ) |
Current portion of long-term debt | | | (45 | ) | | | (38 | ) | | | (7 | ) |
Taxes | | | (8 | ) | | | (12 | ) | | | 4 | |
Other assets (liabilities), net | | | (5 | ) | | | (37 | ) | | | 32 | |
| | | | | | | | | | | | |
Working Capital | | $ | (215 | ) | | $ | (263 | ) | | $ | 48 | |
| | | | | | | | | | | | |
| | | |
Consolidated Balance Sheets: | | | | | | | | | | | | |
Total current assets | | $ | 466 | | | $ | 432 | | | | | |
Total current liabilities | | | (681 | ) | | | (695 | ) | | | | |
| | | | | | | | | | | | |
Working Capital | | $ | (215 | ) | | $ | (263 | ) | | | | |
| | | | | | | | | | | | |
As of December 31, 2013, we had a Working Capital net liability of $(215) million, compared to $(263) million as of December 31, 2012, a decrease of $48 million. The $48 million decrease in net liability is primarily due to a $14 million increase in Trading Working Capital net liability activities as described below, offset by a $32 million decrease in other assets (liabilities), net primarily due to the resolution of certain litigation related liabilities and disposal of assets held for sale and a $44 million increase in cash as discussed in “Cash Flows.”
As our business grows and our revenue and corresponding commissions and incentives expenses increase, our receivables and accruals increase. The fluctuations in these balances are the primary contributors to the changes to our Trading Working Capital. As of December 31, 2013 and 2012, our Trading Working Capital as a percentage of net revenue was (4) %.
The table below sets out information on our accounts receivable:
| | | | | | | | | | | | |
| | | December 31, 2013 | | | December 31, 2012 | | | Change | |
Accounts receivable, net(in $ millions) | | $ | 177 | | | $ | 150 | | | $ | 27 | |
Accounts receivable, net – Days Sales Outstanding (“DSO”) | | | 38 | | | | 35 | | | | 3 | |
Substantially all of our Air revenue within our Travel Commerce Platform is collected through the ACH and other similar clearing houses. ACH requires participants to deposit certain balances into their demand deposit accounts by certain deadlines, which facilitates a timely settlement process. For the years ended December 31, 2013 and 2012, Air revenue accounted for 76% and 77% of our revenue, respectively, however only 50% of our outstanding receivables were due from customers using ACH. The ACH receivables are collected on average in 31 days. Beyond Air revenue is generally not collected through the ACH process and take a longer period of time to collect. Our average net collection period was 38 DSO for total accounts receivable, net at December 31, 2013, as compared to 35 days at December 31, 2012. The increase in our DSO is primarily due to the growth of our Beyond Air revenue, which along with growth in our Air revenue in the month of December 2013 compared to December 2012, contributed to the increase in our accounts receivable balance.
69
We pay commissions to travel agencies on varying contractual terms, including payments made on a monthly, quarterly, semi-annual and annual basis. For the year ended December 2013, our commissions increased by $59 million, or 6%, resulting in an increased balance in accrued commissions and incentives of $42 million.
Cash Flows
The following table summarizes the changes to our cash flows provided by (used in) operating, investing and financing activities for the years ended December 31, 2014, 2013 and 2012:
| | | | | | | | | | | | |
| | | Year Ended December 31, | |
(in $ millions) | | 2014 | | | 2013 | | | 2012 | |
Cash provided by (used in): | | | | | | | | | | | | |
Operating activities | | $ | 58 | | | $ | 100 | | | $ | 181 | |
Investing activities | | | 226 | | | | (96 | ) | | | (89 | ) |
Financing activities | | | (297 | ) | | | 40 | | | | (106 | ) |
Effect of exchange rate changes | | | (2 | ) | | | — | | | | — | |
| | | | | | | | | | | | |
Net (decrease) increase in cash and cash equivalents | | $ | (15 | ) | | $ | 44 | | | $ | (14 | ) |
| | | | | | | | | | | | |
We believe our important measures of liquidity are Adjusted Free Cash Flow and Unlevered Adjusted Free Cash Flow. These measures are useful indicators of our ability to generate cash to meet our liquidity demands. We believe these measures provide investors with an understanding of how assets are performing and measures management’s effectiveness in managing cash. We define Unlevered Adjusted Free Cash Flow as Adjusted Free Cash Flow excluding the impact of interest payments. We believe these measures give management and investors a better understanding of the cash flows generated by our underlying business, as our interest payments are primarily related to the debt incurred in relation to previous business acquisitions, cash paid for other adjusting items are unrelated to the underlying business and our Capital Expenditures are primarily related to the development of our operating platforms.
Adjusted Free Cash Flow and Unlevered Adjusted Free Cash Flow are non-GAAP measures and may not be comparable to similarly named measures used by other companies. These measures should not be considered as measures of liquidity or cash flows from operations as determined under US GAAP. The following table provides a reconciliation of net cash provided by (used in) operating activities to Adjusted Free Cash Flow and to Unlevered Adjusted Free Cash Flow which is defined as Adjusted Free Cash Flow excluding cash interest payments. Unlevered Free Cash Flow is not a measurement of our financial performance under GAAP and should not be considered in isolation or as an alternative to net earnings or any other performance measures derived in accordance with GAAP or as alternatives to cash flows from operating activities as measures of liquidity. The management uses Unlevered Adjusted Free Cash Flow to determine how much cash would be available to the providers of capital and debt and assess cash generated if the Company’s debt were to be repaid.
70
We have also supplementally provided as part of this reconciliation, a reconciliation of Adjusted EBITDA, our primary key performance measure, to net cash provided by (used in) operating activities.
| | | | | | | | | | | | |
| | | Year Ended December 31, | |
(in $ millions) | | 2014 | | | 2013 | | | 2012 | |
Adjusted EBITDA | | $ | 540 | | | $ | 517 | | | $ | 494 | |
Interest payments | | | (294 | ) | | | (273 | ) | | | (232 | ) |
Tax payments | | | (26 | ) | | | (29 | ) | | | (16 | ) |
Customer loyalty payments | | | (93 | ) | | | (78 | ) | | | (47 | ) |
Changes in Trading Working Capital | | | (13 | ) | | | (5 | ) | | | 31 | |
Changes in accounts payable and employee related payables | | | (33 | ) | | | 7 | | | | 19 | |
Pension liability contribution | | | (7 | ) | | | (3 | ) | | | (27 | ) |
Changes in other assets and liabilities | | | 31 | | | | 11 | | | | 7 | |
United MSA | | | — | | | | — | | | | 23 | |
Other adjusting items(1) | | | (47 | ) | | | (47 | ) | | | (71 | ) |
| | | | | | | | | | | | |
Net cash provided by operating activities | | | 58 | | | | 100 | | | | 181 | |
Add: other adjusting items(1) | | | 47 | | | | 47 | | | | 71 | |
Less: United MSA cash | | | — | | | | — | | | | (40 | ) |
Less: capital expenditures on property and equipment additions | | | (112 | ) | | | (107 | ) | | | (92 | ) |
Less: repayment of capital lease obligations | | | (32 | ) | | | (20 | ) | | | (16 | ) |
| | | | | | | | | | | | |
Adjusted Free Cash Flow | | | (39 | ) | | | 20 | | | | 104 | |
Add: interest payments | | | 294 | | | | 273 | | | | 232 | |
| | | | | | | | | | | | |
Unlevered Adjusted Free Cash Flow | | $ | 255 | | | $ | 293 | | | $ | 336 | |
| | | | | | | | | | | | |
| (1) | Other adjusting items relate to payments for costs included within operating income but excluded from Adjusted EBITDA. These include (i) $26 million of payments relating to the accrued sponsor monitoring fee for the year ended December 31, 2014, (ii) $21 million, $24 million and $20 million of corporate cost payments during the years ended December 31, 2014, 2013 and 2012, respectively, (iii) $23 million and $28 million of litigation and related costs payments for the years ended December 31, 2013 and 2012, respectively, (iii) $15 million payments towards a historical dispute related to terminated arrangement with a former distributor in Middle East during the year ended December 31, 2012, (iv) $7 million of payments during the year ended December 31, 2012, in relation to the FASA acquired with the purchase of Worldspan in 2007 and (v) $1 million of restructuring related payments made during the year ended December 31, 2012. |
Year Ended December 31, 2014 Compared to Year Ended December 31, 2013
As of December 31, 2014, we had $139 million of cash and cash equivalents, a decrease of $15 million compared to December 31, 2013. The following discussion summarizes changes to our cash flows from operating, investing and financing activities for the year ended December 31, 2014 compared to the year ended December 31, 2013.
Operating Activities: For the year ended December 31, 2014, cash provided by operating activities was $58 million compared to $100 million for the year ended December 31, 2013. The decrease of $42 million is primarily a result of $21 million of higher interest payments in respect of refinancing of our debt during 2014, $15 million of higher customer loyalty payments and changes in working capital including Trading Working Capital, accounts payable and employee related payable and other assets and liabilities.
The changes in Trading Working Capital of $(13) million and $(5) million for the years ended December 31, 2014 and 2013, respectively, are discussed in “—Working Capital.”
Investing Activities: The cash provided by (used in) investing activities for the year ended December 31, 2014 was $226 million compared to $(96) million for the year ended December 31, 2013. The increase of $322
71
million primarily relates to (i) $366 million proceeds from the sales of shares of Orbitz Worldwide, offset by (ii) the purchase of an equity method investment of $10 million, (iii) businesses acquired for $18 million, net of cash, and (iv) a $5 million increase in additions to property and equipment.
Our investing activities for the years ended December 31, 2014 and 2013 include:
| | | | | | | | | | | | |
| | | Year Ended
December 31, | |
(in $ millions) | | 2014 | | | 2013 | | | Change | |
Cash additions to software developed for internal use | | $ | 82 | | | $ | 79 | | | $ | 3 | |
Cash additions to computer equipment and other | | | 30 | | | | 28 | | | | 2 | |
| | | | | | | | | | | | |
Total | | $ | 112 | | | $ | 107 | | | $ | 5 | |
| | | | | | | | | | | | |
Our Capital Expenditures, substantially all of which relate to the Travel Commerce Platform, include cash additions for software developed for internal use and computer equipment as well as cash used for the repayment of capital lease obligations. For the years ended December 31, 2014 and 2013, we repaid capital lease obligations of $32 million and $20 million, respectively, which is primarily towards hardware in within our data center. We finance these investments over an average period of 3 to 5 years in line with the expected life of the equipment.
Cash additions to software developed for internal use represent the continuing development of our systems to enhance our Travel Commerce Platform. Our expenditures have been focused on key areas, including investing in our data center by implementing zTPF software on our mainframes, the development of our uAPI that underpins our new and existing applications, the development of Smartpoint, our innovative booking solution delivering multisource content and pricing, and the development of our Travelport Merchandising Platform to allow airlines to showcase their content in travel agency workflows.
Cash additions to computer equipment and other are primarily for our continuing investment in our data center.
We view our Capital Expenditure for the period to include cash additions to our property and equipment and capital lease repayments and was $144 million and $127 million for the years ended December 31, 2014 and 2013, respectively. Our Travel Commerce Platform and Technology Services are run on IBM mainframes, which need continual upgrades, support and enhancements to meet increased processing and capacity demands put on our systems.
Financing Activities: During 2014, we completed multiple deleveraging and equity transactions, including:
| | • | | Sale of 47.6 million shares of common stock of Orbitz Worldwide in May and July 2014, for net proceeds of $366 million, of which $312 million was used to repay a portion of the principal amount of our term loans. |
| | • | | Multiple debt-for-equity exchanges completed in March, June and July 2014, in which we issued approximately 28.8 million of our common shares in exchange for approximately $571 million principal amount of debt. |
| | • | | Debt refinancing consummated in September 2014 in which we entered into a new senior secured credit facility comprised of first lien term loans in an aggregate principal balance of $2,375 million, less an original issuance discount of $30 million and a revolving credit facility of $100 million, as well as a senior unsecured bridge loan of $425 million. We used the net proceeds from these borrowings to repay our existing first and second lien term loans and to redeem all of our outstanding senior and senior subordinated notes. |
| | • | | Our initial public offering completed on September 25, 2014, which generated net proceeds of approximately $445 million, of which $425 million were used to repay the senior unsecured bridge loan. |
72
During 2014, we also purchased for $65 million additional equity in our consolidated subsidiary eNett, received $53 million from the release of cash provided as collateral under our letter of credit facility, paid $32 million in capital leases related to computer and equipment used in our data center, paid $23 million in taxes on behalf of our employees related to the vesting of equity awards and paid a dividend of $9 million in December 2014 on our outstanding common shares.
Cash provided by financing activities for the year ended December, 2013 was $40 million reflecting the net impact of our comprehensive refinancing activities during 2013. This primarily comprised of (i) $2,169 million of proceeds from term loans, (ii) $58 million net release of cash collateralized, offset by (iii) $1,667 million repayments of term loans, (iv) $413 million repayment of senior notes, (v) $20 million net repayment of revolver borrowings, (vi) $55 million of debt finance costs and (vii) $20 million of capital lease repayments.
Year Ended December 31, 2013 Compared to Year Ended December 31, 2012
At December 31, 2013, we had $154 million of cash and cash equivalents, an increase of $44 million compared to December 31, 2012. The following discussion summarizes changes to our cash flows from operating, investing and financing activities for the year ended December 31, 2013 compared to the year ended December 31, 2012.
Operating Activities: For the year ended December 31, 2013, cash provided by operating activities was $100 million compared to $181 million for the year ended December 31, 2012. The decrease of $81 million is primarily a result of (i) a $41 million increase in interest payments resulting from increased interest costs of $52 million due to higher interest rates on our debt following our refinancing in 2013, (ii) a $31 million increase in customer loyalty payments as we signed a number of larger travel agencies and airlines to long term agreements, (iii) a $36 million decrease in cash provided by Trading Working Capital and (iv) a $13 million increase in income tax payments, partially offset by (v) a $24 million decrease in defined benefit pension plan funding and (vi) a $24 million decrease in payments related to other items.
The changes in Trading Working Capital of $(5) million and $31 million for the years ended December 31, 2013 and 2012, respectively, are discussed in “—Working Capital.”
Investing Activities: The cash used in investing activities for the year ended December 31, 2013 was primarily related to $107 million for cash property and equipment additions offset by $17 million net cash received from the sale of land and buildings held for sale as of December 31, 2012. The cash used in investing activities for the year ended December 31, 2012 was primarily related to $92 million for property and equipment additions.
Our investing activities for the years ended December 31, 2013 and 2012 include:
| | | | | | | | | | | | |
| | | Year Ended
December 31, | |
(in $ millions) | | 2013 | | | 2012 | | | Change | |
Cash additions to software developed for internal use | | $ | 79 | | | $ | 43 | | | $ | 36 | |
Cash additions to computer equipment and other | | | 28 | | | | 49 | | | | (21 | ) |
| | | | | | | | | | | | |
Total | | $ | 107 | | | $ | 92 | | | $ | 15 | |
| | | | | | | | | | | | |
Our Capital Expenditures, substantially all of which relate to the Travel Commerce Platform, include cash additions for software developed for internal use and computer equipment as well as cash used for the repayment of capital lease obligations. For the years ended December 31, 2013 and 2012, we repaid capital lease obligations of $20 million and $16 million, respectively. Our investment in capital leases during 2012 included investments in assets from our IBM long term contracts when we signed a long term contract with IBM for additional computer equipment and software resulting in increased Capital Expenditures.
73
Repayment of capital lease obligations of $20 million and $16 million for the years ended December 31, 2013 and 2012, respectively, represents the investment we have made in the hardware within our data center. Our investment in capital leases during 2012 included investments in assets from our IBM long term contract.
Financing Activities: The net cash provided by financing activities for the year ended December 31, 2013 was $40 million, reflecting the net impact of our comprehensive refinancing activities during 2013. This primarily comprised of (i) $2,169 million of proceeds from term loans, (ii) $58 million net release of cash collateralized, offset by (iii) $1,667 million repayments of term loans, (iv) $413 million repayment of senior notes, (v) $20 million net repayment of revolver borrowings, (vi) $55 million of debt finance costs and (vii) $20 million of capital lease repayments. The cash used in financing activities for the year ended December 31, 2012 was $106 million and primarily comprised of (i) a $165 million repayment of term loans, (ii) $15 million of net repayments of revolver borrowings, (iii) $20 million of repurchases of senior notes, (iv) $42 million of net cash payments on the settlement of derivative contracts, (v) $20 million of debt finance costs and (vi) $16 million of capital lease repayments, offset by (vii) $170 million of proceeds from term loans.
Financing Arrangements
As of December 31, 2014, our financing arrangements include our new senior secured credit facility and obligations under our capital leases. The following table summarizes our Net Debt position as of December 31, 2014 and December 31, 2013:
| | | | | | | | | | | | | | | | |
(in $ millions) | | Interest
rate | | | Maturity | | | December 31,
2014 | | | December 31,
2013 | |
Secured debt | | | | | | | | | | | | | | | | |
Senior Secured Credit Agreement | | | | | | | | | | | | | | | | |
Term loans | | | | | | | | | | | | | | | | |
Dollar denominated | | | L+5% | | | | September 2021 | | | $ | 2,347 | | | $ | — | |
Dollar denominated(repaid and/or exchanged in 2014) | | | L+5% | | | | | | | | — | | | | 1,525 | |
Revolver borrowings | | | | | | | | | | | | | | | | |
Dollar denominated | | | L+5% | | | | September 2019 | | | | — | | | | — | |
Dollar denominated (terminated in September 2014) | | | L+5% | | | | | | | | — | | | | — | |
Second Lien Credit Agreement | | | | | | | | | | | | | | | | |
Tranche 1 dollar denominated term loan(repaid and/or exchanged in 2014) | | | L+8% | | | | | | | | — | | | | 644 | |
Tranche 2 dollar denominated term loan(repaid in September 2014) | | | 8 3⁄8% | | | | | | | | — | | | | 234 | |
Unsecured debt | | | | | | | | | | | | | | | | |
Senior Notes | | | | | | | | | | | | | | | | |
Dollar denominated notes(repaid and/or exchanged in 2014) | | | 13 7⁄8% | | | | | | | | — | | | | 411 | |
Dollar denominated floating rate notes(repaid and/or exchanged in 2014) | | | L+8 5⁄8% | | | | | | | | — | | | | 188 | |
Senior Subordinated Notes | | | | | | | | | | | | | | | | |
Dollar denominated notes(repaid and/or exchanged in 2014) | | | 11 7⁄8% | | | | | | | | — | | | | 272 | |
Euro denominated notes(repaid and/or exchanged in 2014) | | | 10 7⁄8% | | | | | | | | — | | | | 192 | |
Capital leases | | | | | | | | | | | 93 | | | | 107 | |
| | | | | | | | | | | | | | | | |
Total debt | | | | | | | | | | | 2,440 | | | | 3,573 | |
Less: cash and cash equivalents | | | | | | | | | | | (139 | ) | | | (154 | ) |
Less: cash held as collateral | | | | | | | | | | | (26 | ) | | | (79 | ) |
| | | | | | | | | | | | | | | | |
Net Debt(1) | | | | | | | | | | $ | 2,275 | | | $ | 3,340 | |
| | | | | | | | | | | | | | | | |
74
| (1) | Net Debt is defined as total debt comprised of current and non-current portion of long-term debt minus cash and cash equivalents and cash held as collateral. Net Debt is not a measurement of our indebtedness under GAAP and should not be considered in isolation or as alternative to assess our total debt or any other measures derived in accordance with GAAP. The management uses Net Debt to review the Company’s overall liquidity, financial flexibility, capital structure and leverage. Further, we believe, certain debt rating agencies, creditors and credit analysts monitor our Net Debt as part of their assessment of our business. |
Debt-for-Equity Exchanges:
During the year ended December 31, 2014, we effectuated several debt-for-equity exchange transactions, pursuant to which we exchanged $571 million of our indebtedness, comprising (i) $154 million of dollar denominated senior subordinated notes, (ii) $159 million (€117 million) of euro denominated senior subordinated notes, (iii) $84 million of dollar denominated fixed rate senior notes, (iv) $83 million of dollar denominated floating rate senior notes, (v) $70 million of dollar denominated term loans under our senior secured credit agreement and (vi) $21 million of dollar denominated Tranche 1 term loans under our second lien credit agreement, for 29 million of our common shares. We recorded these transactions as extinguishment of debt and recognized a loss of $28 million in our consolidated statements of operations for year ended December 31, 2014.
Debt Repayment from Proceeds of Sale of Shares of Orbitz Worldwide:
In July 2014, we repaid $312 million of term loans outstanding under our old senior secured credit agreement from the proceeds received from the sale of shares of Orbitz Worldwide and recorded a loss of $5 million for early extinguishment of debt in our consolidated statements of operations for the year ended December 31, 2014.
Debt Refinancing:
In September 2014, we consummated a refinancing of our remaining debt. As a result of this refinancing, we entered into: (i) a new senior secured credit agreement comprised of (a) a single tranche of first lien term loans in an aggregate principal amount of $2,375 million maturing in September 2021, issued at a discount of 1.25%, with quarterly installments of 0.25% of the principal amount payable commencing February 2015 and (b) a revolving credit facility of $100 million (which may be increased in accordance with certain incremental facility provisions set forth therein) maturing in September 2019; and (ii) a senior unsecured bridge loan agreement in an aggregate principal amount of $425 million which was subsequently repaid with proceeds from the IPO. We used the net proceeds from these borrowings to repay the balance remaining under the term loans outstanding under the old senior secured credit agreement and second lien credit agreement, senior notes and senior subordinated notes. We recorded the debt refinancing transaction as the issuance of new debt and extinguishment of old debt and recognized a loss of $75 million in our consolidated statements of operations for the year ended December 31, 2014.
The interest rate per annum applicable to the term loans is based on, at our election, (i) LIBOR, plus 5.00% or base rate (as defined in the agreement), plus 4.00%. The term loans are subject to a LIBOR floor of 1.00% and 2.00% in the case of base rates. We expect to pay interest based on LIBOR. The interest rate per annum applicable to the bridge loan is LIBOR, plus 5.75%, subject to a LIBOR floor of 1.00%. The applicable rate of 5.00% for LIBOR loans and 4.00% for base rate loans is subject to reduction, subject to the attainment of improved credit ratings and reduced Consolidated First Lien Net Leverage Ratio (as defined in the agreement).
During the year ended December 31, 2014, we (i) repaid $8 million as quarterly repayment on our old term loans, (ii) capitalized $13 million related to payment-in-kind interest into the senior notes and second lien Tranche 2 dollar denominated term loans and (iii) repaid $32 million under our capital lease obligations and entered into $18 million of new capital leases for information technology assets.
75
Foreign exchange fluctuations resulted in a $3 million decrease in the principal amount of euro denominated loans during the year ended December 31, 2014.
Revolving Credit Facility and Letters of Credit Facility:
Effective upon our debt refinancing on September 2, 2014, our $120 million revolving credit facility and $137 million cash collateralized letters of credit facility under the old senior secured credit agreement were terminated. Under the new senior secured credit agreement, we have a $100 million revolving credit facility with a consortium of banks, which contains a letter of credit sub-limit of $50 million. The new senior secured credit agreement further permits the issuance of certain cash collateralized letters of credit in addition to such sub-limit, whereby 103% of cash collateral has to be maintained for outstanding letters of credit. The new senior secured credit agreement also includes customary uncommitted incremental facility provisions, including the ability to increase the revolving credit facility by up to $50 million.
During the year ended December 31, 2014, we borrowed and repaid $75 million, all under our old revolving credit facility. As of December 31, 2014, under our new revolving credit facility, we had no outstanding borrowings and had utilized $14 million for the issuance of letters of credit, with a balance of $86 million remaining under our revolving credit capacity. Further, as of December 31, 2014, we also had $25 million of cash collateralized letters of credit issued and outstanding, against which we have provided $26 million as cash collateral.
Subsequent to our refinancing in September 2014, substantially all of our debt is now scheduled for repayment in September 2021.
On January 16, 2015, we amended our credit agreement to increase the amount of revolving credit commitments by $25 million, resulting in a total of $125 million of revolving credit facility commitments available to us.
Travelport Finance (Luxembourg) S.a.r.l., our indirect 100% owned subsidiary, is the obligor (the “Obligor”) under our long-term debt arrangements. All obligations under our long-term debt arrangements are unconditionally guaranteed by certain of our foreign subsidiaries, and, subject to certain exceptions, each of our existing and future domestic 100% owned subsidiaries. In addition, our secured debt is unconditionally guaranteed by certain additional existing non-domestic 100% owned subsidiaries. All obligations under our secured debt, and the guarantees of those obligations, are secured by substantially all the following assets of the Obligor and each guarantor, subject to certain exceptions: (i) a pledge of 100% of the capital stock and intercompany indebtedness of the Obligor and each guarantor; (ii) a pledge of 100% of the capital stock and intercompany indebtedness of certain other subsidiaries directly owned by the obligor or any other guarantor subject to certain exceptions and limitations; and (iii) a security interest in, and mortgages on, substantially all tangible and intangible assets of the Obligor and each U.S. guarantor subject to additional collateral and guarantee obligations.
Borrowings under our new senior secured credit agreement are subject to amortization and prepayment requirements, and our senior secured credit agreement contains various covenants, including leverage ratios, events of default and other provisions.
Our new senior secured credit agreement limits certain of our subsidiaries’ ability to:
| | • | | incur additional indebtedness; |
| | • | | pay dividends on, repurchase or make distributions in respect of equity interests or make other restricted payments; |
| | • | | make certain investments; |
76
| | • | | create liens on certain assets to secure debt; |
| | • | | consolidate, merge, sell or otherwise dispose of all or substantially all of our assets; |
| | • | | enter into certain transactions with affiliates; and |
| | • | | designate our subsidiaries as unrestricted subsidiaries. |
As of December 31, 2014, our consolidated first lien net leverage ratio, as determined under our senior secured credit agreement, was 4.34 compared to the maximum allowable of 6.00 and we were in compliance with such other covenants under our credit agreement.
Foreign Currency and Interest Rate Risk
Subsequent to our debt refinancing in September 2014, our debt is exposed to interest rate risks only, although prior to this refinancing our euro denominated debt was also exposed to risks associated with foreign currency exchange rate movements. We use hedging strategies and derivative financial instruments to create an appropriate mix of fixed and floating rate debt and to manage our exposure to changes in foreign currency exchange rates, where applicable. The primary interest rate exposure during the year ended December 31, 2014 and 2013 was due to interest rate fluctuations in the United States and Europe, specifically USLIBOR and EURIBOR interest rates. In the past, we have used foreign currency forward contracts, interest rate caps and interest rate swaps for hedging purposes.
We also use foreign currency forward contracts to manage our exposure to changes in foreign currency exchange rates associated with our foreign currency denominated receivables and payables and forecasted earnings of our foreign subsidiaries. We primarily enter into foreign currency forward contracts to manage our foreign currency exposure to the British pound, Euro and Australian dollar.
During the year ended December 31, 2014 and 2013, none of the derivative financial instruments used to manage our interest rate and foreign currency exposures were designated as accounting hedges except for interest rate cap derivative instruments which were designated as accounting hedges until June 2014. The fluctuations in the fair value of interest rate derivative financial instruments not designated as hedges for accounting purposes are recorded as a component of interest expense, net, in our consolidated statements of operations. Losses on these interest rate derivative financial instruments amounted to $1 million, $3 million and $4 million for the years ended December 31, 2014, 2013 and 2012, respectively. The fluctuations in the fair value of foreign currency derivative financial instruments not designated as hedges for accounting purposes are recorded as a component of selling, general and administrative expenses in our consolidated statements of operations. Losses on these foreign currency derivative financial instruments amounted to $19 million, $4 million and $0 million for the years ended December 31, 2014, 2013 and 2012, respectively. The fluctuations in the fair values of our derivative financial instruments partially offset the impact of the changes in the value of the underlying risks they are intended to economically hedge.
In 2013, we entered into interest rate cap derivative contracts to cap the USLIBOR rate at 1.5%. The purpose of these contracts was to hedge the risk of increase in interest costs on our floating rate debt due to an increase in USLIBOR rates. We had designated these interest rate cap derivative contracts as accounting cash flow hedges and recorded the effective portion of changes in fair value of these derivative contracts, amounting to a loss of $4 million during the year ended December 31, 2014, as a component of other comprehensive loss. In June 2014, we ceased hedge accounting for our interest rate cap derivative instruments. The exchange of our common shares for our term loans in July 2014 reduced the principal amount of debt being hedged to under 100% of the notional amount of interest rate cap contracts. Following our announcement of the proposed refinancing of our capital structure in August 2014, we determined that the underlying future hedge accounted interest cashflows were not probable of occurring, and that the hedge effectiveness could no longer be achieved. Losses of $8 million, previously accumulated within other comprehensive income (loss) were then recognized within our consolidated statements of operations.
77
As of December 31, 2014, our foreign exchange derivative contracts cover transactions for periods that do not exceed one year. As of December 31, 2014, we had a net liability position of $16 million related to derivative instruments associated with our foreign currency denominated receivables and payables, and forecasted earnings of our foreign subsidiaries.
Financial Obligations
Contractual Obligations
The following table summarizes our future contractual obligations as of December 31, 2014. The table below does not include future cash payments related to (i) contingent payments that may be made to third parties at a future date, (ii) income tax payments for which the timing is uncertain, (iii) the various guarantees and indemnities described in the notes to the consolidated financial statements or (iv) obligations related to pension and other post-retirement defined benefit plans.
| | | | | | | | | | | | | | | | | | | | | | | | | | | | |
| | | Year Ending December 31, | |
(in $ millions) | | 2015 | | | 2016 | | | 2017 | | | 2018 | | | 2019 | | | Thereafter | | | Total | |
Debt(1) | | $ | 56 | | | $ | 50 | | | $ | 45 | | | $ | 27 | | | $ | 26 | | | $ | 2,236 | | | $ | 2,440 | |
Interest payments(2) | | | 152 | | | | 148 | | | | 144 | | | | 141 | | | | 140 | | | | 246 | | | | 971 | |
Operating leases(3) | | | 12 | | | | 11 | | | | 9 | | | | 8 | | | | 7 | | | | 31 | | | | 78 | |
Purchase commitments(4) | | | 47 | | | | 45 | | | | — | | | | — | | | | — | | | | — | | | | 92 | |
| | | | | | | | | | | | | | | | | | | | | | | | | | | | |
Total | | $ | 267 | | | $ | 254 | | | $ | 198 | | | $ | 176 | | | $ | 173 | | | $ | 2,513 | | | $ | 3,581 | |
| | | | | | | | | | | | | | | | | | | | | | | | | | | | |
| (1) | The debt maturity includes $28 million of debt discount on term loans under the Senior Secured Credit Agreement and is considered under “Thereafter” in the table above. |
| (2) | Interest on floating rate debt is based on the interest rate as of December 31, 2014 of LIBOR plus 5%, where LIBOR has a floor of 1%. As of December 31, 2014, we have $18 million of accrued interest on our consolidated balance sheet. |
| (3) | Primarily reflects non-cancellable operating leases on facilities and data processing equipment. |
| (4) | Primarily reflects our agreement with a third party for data center services. |
Our obligations related to defined benefit and post-retirement plans are actuarially determined on an annual basis at our financial year end. As of December 31, 2014, plan contributions of $3 million are expected to be made in 2015. Funding projections beyond 2015 are not practical to estimate. Income tax liabilities for uncertain tax positions are excluded as we are not able to make a reasonably reliable estimate of the amount and period of related future payments. As of December 31, 2014, we had $26 million of gross unrecognized tax benefit for uncertain tax positions.
Other Commitments
Company Litigation: We are involved in various claims, legal proceedings and governmental inquiries related to contract disputes, business practices, intellectual property and other commercial, employment and tax matters. We believe we have adequately accrued for such matters as appropriate or, for matters not requiring accrual, we will not have a material adverse effect on our results of operations, financial position or cash flows based on information currently available. However, litigation is inherently unpredictable and although we believe our accruals are adequate and/or that we have valid defenses in these matters, unfavorable resolutions could occur, which could have a material effect on our results of operations or cash flows in a particular reporting period.
Standard Guarantees/Indemnifications: In the ordinary course of business, we enter into numerous agreements that contain standard guarantees and indemnities whereby we indemnify another party for breaches of representations and warranties. In addition, many of these parties are also indemnified against any third-party
78
claim resulting from the transaction that is contemplated in the underlying agreement. Such guarantees or indemnifications are granted under various agreements, including those governing (i) purchases, sales or outsourcing of assets or businesses, (ii) leases of real estate, (iii) licensing of trademarks, (iv) use of derivatives, and (v) issuances of debt securities. The guarantees or indemnifications issued are for the benefit of the (i) buyers in sale agreements and sellers in purchase agreements, (ii) landlords in lease contracts, (iii) licensees of our trademarks, (iv) financial institutions in derivative contracts, and (v) underwriters in debt security issuances. While some of these guarantees extend only for the duration of the underlying agreement, many survive the expiration of the term of the agreement or extend into perpetuity (unless subject to a legal statute of limitations). There are no specific limitations on the maximum potential amount of future payments that we could be required to make under these guarantees, nor are we able to develop an estimate of the maximum potential amount of future payments to be made under these guarantees, as the triggering events are not subject to predictability and there is little or no history of claims against us under such arrangements. With respect to certain of the aforementioned guarantees, such as indemnifications of landlords against third-party claims for the use of real estate property leased by us, we maintain insurance coverage that mitigates any potential payments to be made.
Other Off-Balance Sheet Arrangements
We had no other off balance sheet arrangements during the year ended December 31, 2014.
Critical Accounting Policies
In presenting our consolidated financial statements in conformity with US GAAP, we are required to make estimates and assumptions that affect the amounts reported and related disclosures. Several of the estimates and assumptions required relate to matters that are inherently uncertain as they pertain to future events. If there is a significant unfavorable change to current conditions, it could result in a material adverse impact to our consolidated results of operations, financial position and liquidity. We believe the estimates and assumptions used when preparing our consolidated financial statements were the most appropriate at that time. Presented below are those accounting policies that we believe require subjective and complex judgments that could potentially affect our reported results.
Revenue Recognition
Travel Commerce Platform Revenue
Travel Commerce Platform revenue primarily utilizes a transaction volume model to recognize revenue. We charge a fee per segment booked. We also receive a fee for cancellations of bookings previously made on our system and where tickets were issued by us that were originally booked on an alternative system.
Revenue for air travel reservations is recognized at the time of the booking of the reservation, net of estimated cancellations and anticipated incentives for travel agencies. Cancellations prior to the date of departure are estimated based on the historical level of cancellations, which have not been significant historically. Certain of our more significant contracts provide for incentive payments based upon business volume. Anticipated incentives are calculated on a consistent basis and frequently reviewed. In circumstances where expected cancellation rates or booking behavior changes, our estimates are revised, and in these circumstances, future cancellation and incentive estimates could vary materially, with a corresponding variation in net revenue. Factors which could have a significant effect on our estimates include global security issues, epidemics or pandemics, natural disasters, general economic conditions, the financial condition of travel providers, and travel related accidents. Revenue for car and hotel reservations, in Beyond Air, is recognized upon fulfillment of the reservation. Given hotel and car reservations can be cancelled at any time without penalty, revenue is recognized upon the fulfillment of the reservation when it is contractually billed and collectability of the revenue is reasonably assured.
Our payment processing revenue is earned as a percentage of total transaction value in the form of interchange fees payable by banks. Revenue is recognized when the payment is processed.
79
We collect annual subscription fees from travel agencies, internet sites and other subscribers to access the applications on our Travel Commerce Platform, including providing the ability to access schedule and fare information, book reservations and issue tickets. These fees are recognized when the services are performed.
Our Travel Commerce Platform is served through a combination of owned SMOs and a network of non-owned NDCs. The NDCs are used in regions where we do not have our own SMOs to distribute our products. In cases where NDCs are owned by airlines, we may pay a commission to the NDCs/airlines for the sales of distribution services to the travel agencies and also receive revenue from the same NDCs/airlines for the sales of segments through our platform. We account for the fees received from the NDCs/airlines as revenue, and commissions paid to NDCs/airlines as cost of revenue. Fees received and commissions paid are presented in the consolidated statements of operations on a gross basis, as the benefits derived from the sale of the segment are sufficiently separable from the commissions paid.
Technology Services Revenue
We collect fees, generally on a monthly basis under long-term contracts, for providing hosting solutions and other services to airlines such as pricing, shopping, ticketing, ground handling and other solutions. Such revenue is recognized when the services are performed.
Customer Loyalty Payments and Prepaid Incentives
We make payments to travel agencies for their usage of our Travel Commerce Platform. These payments may be made at the time of signing a long-term agreement, at specified intervals of time, upon reaching specified transaction thresholds or for each transaction processed through our Travel Commerce Platform.
Where the payments are made to travel agencies and travel providers with an objective of increasing the number of travel bookings and to improve the travel agencies’ or travel providers’ loyalty, instrumented through contractual agreements with a term greater than a year, and the travel agency or the travel provider commits to achieve our economic objectives, the payments are considered as customer loyalty payments and capitalized as intangible assets. These intangible assets are amortized over the period of contractual agreement on a straight line basis unless another method is more appropriate. The amortization expense is recognized within cost of revenue or revenue on the consolidated statements of operations. In addition, we estimate the recoverability of customer loyalty payments based upon the expected future cash flows from transactions generated by the related travel agencies. If the estimate of the future recoverability of amounts capitalized declines, cost of revenue will increase as the amounts are written-off. For the years ended December 31, 2014, 2013 and 2012, we did not recognize any significant impairment of customer loyalty payments. As of December 31, 2014 and December 31, 2013, customer loyalty payments, net of accumulated amortization, amounted to $177 million and $152 million, respectively.
Where payments are based on a per transaction basis, these are expensed in the month the transactions are generated. Where they are paid on signing the contract or at specified dates they are capitalized as prepaid incentives and expensed as the related revenue is recognized. As of December 31, 2014 and December 31, 2013, we recorded prepaid incentives of $21 million and $42 million, respectively, which are included in other current and non-current assets on our consolidated balance sheets.
Where payments are to be made upon the achievement of specified objectives, these are assessed as to the likelihood and amount of ultimate payment and expense recognized as incurred. If the estimate of payments to be made to travel agencies in future periods changes, based upon developments in the travel industry or upon the facts and circumstances of a specific travel agency, cost of revenue could increase or decrease accordingly.
Equity-Based Compensation
We account for our stock awards and options by recognizing compensation expense, measured at the grant date based on the fair value of the award net of estimated forfeitures, on a straight-line basis over the award vesting period.
80
Common Share Valuation
Prior to our initial public offering, the fair value of the common shares underlying our stock-based awards was determined by the Board of Directors with input from management and contemporaneous third-party valuations. We believe that our Board of Directors and management have the relevant experience and expertise to determine the fair value of our common shares. Given the absence of a public trading market of our common shares prior to September 25, 2014, and in accordance with theAmerican Institute of Certified Public Accountants Accounting and Valuation Guide: Valuation of Privately-Held-Company Equity Securities Issued as Compensation, our Board of Directors and management exercised reasonable judgment and considered numerous objective and subjective factors to determine the best estimate of the fair value of our common shares including:
| | • | | contemporaneous valuations of our common shares performed by an unrelated third-party valuation specialist; |
| | • | | our debt-for-equity exchanges with the debt holders; |
| | • | | debt valuations obtained from independent third-party brokers; |
| | • | | likelihood of achieving a liquidity event, such as an initial public offering or a sale of the Company; |
| | • | | our historical and projected operating and financial results, including Capital Expenditures; |
| | • | | current business conditions and performance; |
| | • | | market performance and financial results of comparable publicly-traded companies; |
| | • | | amounts of indebtedness; |
| | • | | industry or Company-specific considerations; |
| | • | | lack of marketability of our common shares; |
| | • | | tax considerations; and |
| | • | | the U.S. and global capital market conditions. |
The nature of the material assumptions and estimates considered to determine the fair market value of our common shares were highly complex and subjective.
In valuing our common shares through September 25, 2014, our Board of Directors and management determined the business enterprise value (“EV”) of our business generally using the income approach and the market approach.
The income approach estimates fair value based on the expectation of future cash flows that will generate such as cash earnings, cost savings, tax deductions, and the proceeds from disposition of assets. These future cash flows are discounted to their present values using a discount rate which reflects the risks inherent in our cash flows. This approach requires significant judgment in estimating projected growth rates and cost trends and in determining a discount rate adjusted for the risks associated with our business.
Under the market approach, we use both the market comparable method and market pricing based on recent transactions. The market comparable method estimates fair value based on a comparison of Travelport to comparable public companies in similar lines of business. From the comparable companies, a representative market value multiple is determined which is applied to Travelport’s operating results to estimate our value. In our valuations, the multiple of the comparable companies was determined using a ratio of the EV to projected revenue and/or earnings before interest, taxes and depreciation and amortization for the last twelve months. Our peer group of companies included a number of industry leaders in transaction processing, travel distribution, and internet related businesses similar to, or adjacent to our own business. The market comparable method requires judgment in selecting the public companies that are most similar to our business and in the application of the relevant market multiples to our financial performance metrics. We have from time to time updated the set of comparable companies utilized as new or more relevant information became available, including changes in the market and our business models and input from third party market experts.
81
Under the market approach, we also used market pricing based on the recent transactions method. In 2014, many of our debt holders converted their debt into our equity in arm’s length transactions, and as a result, we exchanged $571 million of our debt into our equity. Based on the value assigned to the common shares in these transactions, we determined the value of our common shares.
Once we determined our EV under each approach, we applied a weighting to the income approach and the market approach primarily based on the recent transactions, relevance of the peer companies chosen for the market approach analysis as well as other relevant factors. We then reduced the EV by our total net debt to arrive at the estimated fair value of our common shares. Based on this information, our Board of Directors and management made the final determination of the estimated fair value of our equity and common shares.
Restricted Shares
Restricted shares are measured based on the fair market value of the underlying shares on the date of the grant. Our common shares are delivered on the vesting dates with the applicable statutory tax withholding requirements to be satisfied per the terms of the applicable award agreements.
Stock Options
We measure the value of stock-option awards at the grant date fair value as calculated by the Black-Scholes option-pricing model which requires the input of highly subjective assumptions, including the fair value of the underlying common shares, the expected term of the option, the expected volatility of the price of our common shares, risk-free interest rates, and the expected dividend yield of our common shares. The assumptions used in our option-pricing model represent management’s best estimates. These estimates involve inherent uncertainties and the application of management’s judgment. If these assumptions change and different factors are used, our stock-based compensation expense could be materially different in the future. These assumptions are as follows:
| • | | Fair value of our common shares: Prior to September 25, 2014, as our shares were not publicly traded, we estimated the fair value of common shares, as discussed in “Common Share Valuation” above. However upon our initial public offering, our shares got listed and we now have readily determinable fair value of our shares. |
| • | | Expected term: The expected term was estimated using the simplified method. The simplified method calculates the expected term as the average of the time to vesting and the contractual life of the option. |
| • | | Volatility: As we do not have a trading history for our common shares, the expected share price volatility for our common shares was estimated by taking the average of the median historic price volatility and the median implied volatility of traded stock for industry peers based on daily price observations over a period equivalent to the expected term of the stock option grants. Industry peers consist of several public companies in the business services, travel and transportation services and computer programming, data processing and other computer services. We intend to continue to consistently apply this process using the same or similar public companies until a sufficient amount of historical information regarding the volatility of our own share price becomes available, or unless circumstances change such that the identified companies are no longer similar to us, in which case, more suitable companies whose share prices are publicly available would be used in the calculation. |
| • | | Risk-free rate: The risk-free interest rate is based on the yields of U.S. Treasury securities with maturities appropriate for the term of employee options. |
| • | | Dividend yield: Prior to September 25, 2014, we did not pay cash dividends. Consequently, we used an expected dividend yield of zero. However, we now have a dividend policy, pursuant to which we have applied appropriate dividend yield assumption to our fair value calculation. |
82
If any of the assumptions used in the Black-Scholes option-pricing model change significantly, stock-based compensation expense may differ materially in the future from that recorded in the current period. The fair value of the stock options granted during the year ended December 31, 2014 was estimated at the date of grant using the Black-Scholes option pricing model. The weighted-average assumptions used in calculating the fair value of stock options are described in Note 16—Equity-based compensation to the consolidated financial statements included in this Annual Report on Form 10-K.
Pension and Other Post-Retirement Defined Benefits
We provide post-employment defined benefits to a number of our current and former employees. Costs associated with post-employment defined benefits include pension and post-retirement health care expenses for employees, retirees and surviving spouses and dependents.
The determination of the obligation and expense for our pension and other post-retirement employee benefits, such as retiree health care, is dependent on certain assumptions used by actuaries in calculating such amounts. Certain of the more important assumptions are described in Note 13—Employee Benefit Plans to the consolidated financial statements included in this Annual Report on form 10-K and include the discount rate, expected long-term rate of return on plan assets, rates of increase in health care costs, retirement rates, mortality rates and other factors. The effects of any modification to those assumptions are either recognized immediately or amortized over future periods in accordance with US GAAP. Actual results that differ from assumptions used are accumulated and generally amortized over future periods.
The primary assumptions affecting our accounting for employee benefits are:
| | • | | Discount rate: The discount rate is used to calculate pension and post-retirement employee benefit obligations. The discount rate assumption is based on a constant effective yield from matching projected plan cash flows to high quality (AA) bond yields of corresponding maturities as of the measurement date. We used weighted average discount rates of 4.2 % for defined benefit pension plans and 4.4 % for post-retirement benefit plans to determine our pension and other benefit obligations as of December 31, 2014. |
The impact of a 100 basis point increase or decrease in the discount rate for defined benefit pension plans would be to decrease pension liabilities by $81 million or increase pension liabilities by $101 million, respectively, as of December 31, 2014. The sensitivity to a 100 basis point increase or decrease in the discount rate assumption related to our pre-tax employee benefit expense for 2014 would be to decrease or increase, respectively, the 2014 pre-tax pension expense by $1 million and $4 million.
| | • | | Expected long-term rate of return on plan assets: The expected long-term rate of return is used in the calculation of net periodic benefit cost. The required use of the expected long-term rate of return on plan assets may result in recognized returns that are greater or less than the actual returns on those plan assets in any given year. The expected long-term rate of return for plan assets has been determined using historical returns for the different asset classes held by our trusts and its asset allocation, as well as inputs from internal and external sources regarding expected capital market return, inflation and other variables. In determining the pension expense for 2014, we used a weighted average expected long-term rate of return on plan assets of 7.0%. |
Actual returns on pension assets for 2014, 2013 and 2012 were 7.8%, 9.3% and 11.6%, respectively, compared to the expected rate of return assumption of 7.0 %, 7.2% and 7.2%, respectively. The impact of a 100 basis point increase or decrease in the expected return on assets for 2014 would have been to decrease or increase the 2014 pre-tax pension expense by $6 million.
83
During the year ended December 31, 2014, we adopted the RP-2014 mortality tables and the Mortality Improvement Scale MP-2014 published by the Society of Actuaries’ Retirement Plans Experience Committee. The RP-2014 mortality tables represent the new standard for defined benefit mortality assumptions and anticipate longer life expectancies. The MP-2014 projection scale is used to factor in projected mortality improvements over time, based on age and date of birth (i.e., two-dimension generational). The adoption of the updated mortality tables and the Mortality Improvement Scale increased the Company’s pension liability by approximately $36 million.
While we believe these assumptions are appropriate, significant differences in actual experience or significant changes in these assumptions may materially affect our defined benefit pension and post-retirement employee benefit obligations and our future expense. See Note 13—Employee Benefit Plans to the annual consolidated financial statements for more information regarding our retirement benefit plans.
Impairment of Goodwill and Trademarks and Tradenames
We review the carrying value of goodwill and indefinite-lived intangible assets annually or more frequently if circumstances indicate impairment may have occurred. We may first perform a qualitative assessment, evaluating a number of key factors, to determine if the fair value of the reporting unit is more likely than not greater than the carrying amount. If, as a result of qualitative assessment, or if we determine quantitatively that the fair value of the reporting unit is less than its carrying value, we proceed to assess impairment of goodwill and other indefinite-lived intangible assets.
The determination of the fair value requires us to make significant judgments and estimates, including projections of future cash flows from the business. These estimates and required assumptions include estimated revenue and revenue growth rates, operating margins used to calculate projected future cash flows, future economic and market conditions, and the estimated weighted average cost of capital (“WACC”). We base our estimates on assumptions we believe to be reasonable but that are unpredictable and inherently uncertain. Actual future results may differ from those estimates.
We perform our annual impairment testing of goodwill and indefinite-lived intangible assets in the fourth quarter of each year, subsequent to completing our annual forecasting process. We have adopted a quantitative approach to test goodwill and indefinite-lived assets for impairment for the year ended December 31, 2014. In performing this test, we determine fair value using the present value of expected future cash flows. The key assumptions applied in our impairment testing of goodwill and other indefinite-lived intangible assets during the fourth quarter of 2014 were (i) estimated cash flows based on financial projections for periods from 2015 through 2019, which were extrapolated to perpetuity, (ii) terminal values based on terminal growth rates not exceeding 2% - 3% and (iii) discount rates, based on WACC, ranging from 10 % to 15 %. As a result of the impairment testing performed in 2014, 2013 and 2012 we concluded that the fair value of goodwill and other indefinite-lived intangible assets exceeded the carrying value of the assets. As a result no impairment of intangibles was recorded in our consolidated statement of operations in any of these years.
Impairment of Definite-Lived Assets
We review the carrying value of these assets if indicators of impairment are present and determine whether the sum of the estimated undiscounted future cash flows attributable to these assets is less than the carrying value. If less, we recognize an impairment loss based on the excess of the carrying amount of the definite-lived asset over its respective fair value. In estimating the fair value, we are required to make a number of assumptions including assumptions related to projections of future cash flows, estimated growth and discount rates. A change in these underlying assumptions could cause a change in the results of the tests and, as such, could result in impairment in future periods. No indicators were identified during any of the years 2014, 2013 and 2012 requiring testing of our definite-lived assets for impairment.
84
Income Taxes
We recognize deferred tax assets and liabilities based on the temporary differences between the financial statement carrying amounts and the tax bases of assets and liabilities. We regularly review deferred tax assets by jurisdiction to assess their potential realization and establish a valuation allowance for portions of such assets that we believe will not be ultimately realized. In performing this review, we make estimates and assumptions regarding projected future taxable income, the expected timing of the reversals of existing temporary differences and the implementation of tax planning strategies. A change in these assumptions could cause an increase or decrease to the valuation allowance resulting in an increase or decrease in the effective tax rate, which could materially impact our results of operations. During 2014, a $138 million increase in the valuation allowance was recognized within the provision for income taxes in the consolidated statement of operations.
We operate in numerous countries where our income tax returns are subject to audit and adjustment by local tax authorities. As we operate globally, the nature of the uncertain tax positions is often very complex and subject to change and the amounts at issue can be substantial. It is inherently difficult and subjective to estimate such amounts, as we have to determine the probability of various possible outcomes. We re-evaluate uncertain tax positions on a quarterly basis. This evaluation is based on factors including, but not limited to, changes in facts or circumstances, changes in tax law, effectively settled issues under audit and new audit activity. Such a change in recognition or measurement would result in the recognition of a tax benefit or an additional charge to the tax provision.
We are currently a defendant in income tax litigation bought by the India Tax Department (“ITD”) in a long-running dispute whereby ITD asserts that Travelport has a permanent establishment in India and is subject to tax there. The dispute dates back to assessment year ended March 31, 1995. For assessment years ended March 31, 1996 through March 31, 2007 we have favorable judgments from the Delhi High Court ruling that no income is chargeable to tax. ITD has appealed the decisions to the Supreme Court and a trial date is awaited. Our dispute continues before lower level appellate authorities for subsequent years.
We continue aggressively to defend these claims by ITD and we do not believe the outcome of the proceedings will result in a material impact on our business or financial conditions. The range of possible outcomes is wide, including the possibility of substantial repayments, and we consider that our balance sheet position is appropriate.
ITEM 7A.QUANTITATIVE AND QUALITATIVE DISCLOSURES ABOUT MARKET RISK
We are exposed to a variety of market risks, including changes in foreign currency exchange rates and interest rates. Our exposure to market risks is managed through the use of derivative financial instruments when considered appropriate.
We use foreign currency forward contracts to manage foreign currency exchange rate risk associated with our foreign currency denominated receivables and payables, and forecasted earnings of our foreign subsidiaries.
During 2014 and in prior years we have used interest rate caps, interest rate swaps, foreign currency forward contracts and foreign currency options to manage interest rate and foreign currency exchange rate risk associated with our euro denominated and floating rate debt.
We are exclusively an end user of these derivative financial instruments. We do not engage in trading, market making or other speculative activities in the derivatives markets. We manage our exposure to counterparty credit risk related to our use of derivative financial instruments through minimum credit standards and diversification of counterparties. Our counterparties are substantial investment and commercial banks with significant experience in providing such derivative financial instruments. More detailed information about these derivative financial instruments is provided in Note 11—Financial Instruments to the consolidated financial statements.
85
We assess our market risk based on changes in interest rates and foreign currency exchange rates utilizing a sensitivity analysis that measures the potential impact on earnings, fair values and cash flows based on a hypothetical 100 basis point change (increase and decrease) in interest rates and a 10% change (increase and decrease) in the exchange rates of underlying currencies being hedged, against the US dollar as of December 31, 2014. There are certain limitations inherent in this sensitivity analyses as our overall market risk is influenced by a wide variety of factors, including the volatility present within markets and the liquidity of markets. These “shock tests” are constrained by several factors, including the necessity to conduct analysis based on a single point in time and the inability to include complex market reactions normally arising from the market shifts modeled.
Interest Rate Risk
Our primary interest rate exposure as of December 31, 2014 was due to interest rate fluctuations in the United States, specifically the impact of USLIBOR interest rates on our variable rate borrowings. We anticipate such interest rate risk will remain a market risk exposure for the foreseeable future.
We assess our interest rate market risk utilizing a sensitivity analysis based on a hypothetical 100 basis point change (increase or decrease) in interest rates. We have determined, through such analysis, that a 100 basis point increase in interest rates as of December 31, 2014 would increase our annualized interest charge by $6 million. Due to the 1.00% LIBOR floor on our term loans a 100 basis point decrease in interest rates as of December 31, 2014 would not change our annualized interest charge.
Foreign Currency Risk
We have foreign currency exposure to exchange rate fluctuations, particularly with respect to the British pound, Euro and Australian dollar. We anticipate such foreign currency risk will remain a market risk exposure for the foreseeable future.
We assess our foreign currency market risk utilizing a sensitivity analysis based upon a hypothetical 10% change (increase or decrease) in exchange rate against the US Dollar on the value of our foreign currency derivative instruments as of December 31, 2014. We have determined, through the sensitivity analysis, the impact of a 10% increase in foreign currency exchange rate with respect to the British Pound, Euro and Australian dollar would result in a charge of approximately $29 million on our consolidated statements of operations, while a 10% decrease in foreign currency exchange rate with respect to the same currencies would result in a benefit of $29 million on our consolidated statements of operations.
ITEM 8.FINANCIAL STATEMENTS AND SUPPLEMENTARY DATA
See Financial Statements and Financial Statement Index commencing on Page F-1 hereof.
The consolidated financial statements and related footnotes of Travelport’s former non-controlled affiliate, Orbitz Worldwide, Inc., are included as Exhibits 99.1 and 99.2 to this Form 10-K and are hereby incorporated by reference herein from the Annual Report on Form 10-K for the year ended December 31, 2013 filed by Orbitz Worldwide, Inc. with the SEC on March 6, 2014 and the Quarterly Report on Form 10-Q for the quarter ended June 30, 2014 filed by Orbitz Worldwide, Inc. with the SEC on August 7, 2014, respectively. The Company is required to include the Orbitz Worldwide financial statements in its Form 10-K due to Orbitz Worldwide meeting certain tests of significance under SEC Rule S-X 3-09. The management of Orbitz Worldwide is solely responsible for the form and content of the Orbitz Worldwide financial statements.
ITEM 9.CHANGES IN AND DISAGREEMENTS WITH ACCOUNTANTS ON ACCOUNTING AND FINANCIAL DISCLOSURE
None.
86
ITEM 9A.CONTROLS AND PROCEDURES
(a) Disclosure Controls and Procedures.
The Company maintains disclosure controls and procedures designed to provide reasonable assurance that information required to be disclosed in reports filed under the Securities Exchange Act of 1934, as amended (the “Act”) is recorded, processed, summarized and reported within the specified time periods and accumulated and communicated to management, including its Chief Executive Officer and Chief Financial Officer, as appropriate, to allow timely decisions regarding required disclosure.
Our management, with the participation of our Chief Executive Officer and Chief Financial Officer, has evaluated the effectiveness of our disclosure controls and procedures (as such term is defined in Rules 13a-15(e) and 15d-15(e) under the Act) for the year ended December 31, 2014. Based on such evaluation, our Chief Executive Officer and Chief Financial Officer have concluded that, as of the end of such period, our disclosure controls and procedures are effective.
(b) Management’s Annual Report on Internal Control over Financial Reporting.
The Annual Report on Form 10-K does not include a report of management’s assessment regarding internal control over financial reporting or an attestation report of our independent registered public accounting firm due to a transition period established by the rules of the SEC for newly public companies.
(c) Changes in Internal Control Over Financial Reporting.
There have not been any changes in the Company’s internal control over financial reporting (as such term is defined in Rules 13a-15(f) and 15d-15(f) under the Act) during the Company’s fiscal fourth quarter that have materially affected, or are reasonably likely to materially affect, the Company’s internal control over financial reporting.
ITEM 9B. OTHER INFORMATION
None.
87
PART III
ITEM 10.DIRECTORS, EXECUTIVE OFFICERS AND CORPORATE GOVERNANCE
Executive Officers, Directors and Other Key Officers
The following table sets forth information about our executive officers and directors as of February 15, 2015. Biographical information for each of the executive officers and directors can be found below.
| | | | |
Name | | Age | | Position |
Gordon A. Wilson | | 48 | | President and Chief Executive Officer, Director |
Philip Emery | | 51 | | Executive Vice President and Chief Financial Officer |
Kurt Ekert | | 44 | | Executive Vice President and Chief Commercial Officer |
Matthew Minetola | | 52 | | Executive Vice President and Global Chief Information Officer |
Thomas Murphy | | 46 | | Executive Vice President and General Counsel |
Douglas M. Steenland | | 63 | | Chairman of the Board |
Gavin R. Baiera | | 39 | | Director |
Gregory Blank | | 34 | | Director |
Elizabeth L. Buse | | 54 | | Director |
Michael J. Durham | | 64 | | Director |
Douglas A. Hacker | | 59 | | Director |
The following table sets forth information about our other key officers as of February 15, 2015:
| | | | |
Name | | Age | | Position |
Terence P. Conley | | 51 | | Executive Vice President, Capability and Performance |
Bryan Conway | | 58 | | Senior Vice President and Chief Marketing Officer |
Anthony Hynes | | 41 | | Managing Director and Chief Executive Officer of eNett |
Christopher Roberts | | 48 | | Group Vice President, Corporate Strategy and Development |
Gordon A. Wilson. Mr. Wilson has served as our President and Chief Executive Officer, as well as a member of our Board of Directors, since June 2011. Mr. Wilson served as our Deputy Chief Executive Officer from November 2009 until June 2011 and as President and Chief Executive Officer of Travelport’s GDS business (which includes the Airline IT Solutions business) since January 2007. Mr. Wilson has 26 years of experience in the electronic travel distribution and airline IT industry. Prior to the acquisition of Worldspan, Mr. Wilson served as President and Chief Executive Officer of Galileo. Mr. Wilson was Chief Executive Officer of B2B International Markets for Cendant’s Travel Distribution Services Division from July 2005 to August 2006 and for Travelport’s B2B International Markets from August 2006 to December 2006, as well as Executive Vice President of International Markets from 2003 to 2005. From 2002 to April 2003, Mr. Wilson was Managing Director of Galileo EMEA and Asia Pacific. From 2000 to 2002, Mr. Wilson was Vice President of Galileo EMEA. Mr. Wilson also served as Vice President of Global Customer Delivery based in Denver, Colorado, General Manager of Galileo Southern Africa based in Johannesburg, General Manager of Galileo Portugal and Spain based in Lisbon, and General Manager of Airline Sales and Marketing based in the United Kingdom. Prior to joining Galileo International in 1991, Mr. Wilson held a number of positions in the European airline and chemical industries. Mr. Wilson was selected to serve on our Board of Directors because of the leadership skills, strategic guidance and experience he brings as our President and Chief Executive Officer and operational expertise from his prior experience in the industry.
Philip Emery.Mr. Emery has served as our Executive Vice President and Chief Financial Officer since October 2009 and is responsible for all aspects of finance and accounting, decision support and financial planning and analysis globally. Prior to this role, Mr. Emery had served as Chief Financial Officer of Travelport’s GDS division since September 2006. Mr. Emery is the Chairman of the Board of Directors of eNett.
88
Before joining Travelport, from January 2006 to September 2006, Mr. Emery was an Entrepreneur in Residence with Warburg Pincus. Between 2002 and 2005, Mr. Emery was Chief Financial Officer of Radianz, a global extranet for the financial services industry, based in New York, which was sold to British Telecom in 2005. Prior to that, Mr. Emery worked in a number of global and European strategic planning and financial roles for London Stock Exchange and NASDAQ-listed companies, such as Rexam plc and 3Com Inc., holding roles such as International Finance Director and Controller and Operations Director.
Kurt Ekert. Mr. Ekert has served as our Executive Vice President and Chief Commercial Officer since July 2010 with global responsibility for sales, customer engagement, marketing, product, pricing, supplier services/content and customer support. Prior to this role, Mr. Ekert was Chief Operating Officer of the Company’s former GTA business, where Mr. Ekert led GTA’s commercial and operating functions, as well as all elements of its online consumer business. Before joining GTA, Mr. Ekert was Senior Vice President, Travelport Supplier Services. Also at Travelport, Mr. Ekert has held the positions of Group Vice President, Strategy and Business Development. Mr. Ekert’s prior experience in the travel industry includes serving as the Chief Operating Officer at a corporate booking tool provider then owned by Cendant and a number of senior finance roles at Continental Airlines. Mr. Ekert serves as a director of Passur Aerospace, Inc.
Matthew Minetola. Mr. Minetola is our Executive Vice President and Global Chief Information Officer, with responsibility for leading our Technology organization and the technical delivery of our Travel Commerce Platform. Before joining Travelport in December 2014, Mr. Minetola gained extensive experience in the hardware, software and banking industries over a 30 year period, holding a number of senior, IT leadership roles in various high profile global organizations. Prior to Travelport, Mr. Minetola most recently worked for HP where he spent over 14 years in various global roles, including serving as CIO for their financial services business and also spending three years leading the technology organization for their print business. Mr. Minetola was also Senior Vice President of Information Services for Bank One/First USA Bank –Chase Card Services where he was responsible for driving the bank’s international expansion, leading their distributed computing organization and strategy and overseeing the technology organization of Bank One’s/Chase Internet bank. Earlier in his career, Mr. Minetola was Vice President of Corporate Technology at Advanta Corporation and Director of Worldwide Distributed Processing at Dun and Bradstreet (D&B).
Thomas Murphy. Mr. Murphy joined as our Executive Vice President and General Counsel in January 2015, with responsibility for legal and corporate secretarial functions. Previously, Mr. Murphy was General Counsel at William Hill PLC, the London Stock Exchange listed bookmaking and gaming business, from 2007 to December 2014, where during his time he also acted as Company Secretary from 2007 to 2013, oversaw its global technology function from 2011 to 2014 and its US regulated gaming businesses from 2012 to 2014. Prior to William Hill, Mr. Murphy was General Counsel and Company Secretary at RHM plc, General Counsel at the Automobile Association and held senior in-house legal roles at Centrica plc having originally worked as a solicitor at Clifford Chance LLP.
Douglas M. Steenland.Mr. Steenland has served as our Chairman since May 2013 and as Chairman of our Nominating and Corporate Governance Committee since the pricing of our initial public offering. Mr. Steenland served as a member of our Audit Committee from August 2011 until March 2014 and our Compensation Committee from August 2011 until the pricing of our initial public offering. Mr. Steenland served as our Vice Chairman from August 2011 until May 2013. Mr. Steenland is Chairman of the Board of Performance Food Group Inc. and holds a portfolio of board directorships, including American International Group, Inc., a New York Stock Exchange company, Digital River, Inc., RGIS, Inc. and Hilton Worldwide Inc. Mr. Steenland previously held numerous executive roles during seventeen years with Northwest Airlines Corporation, most recently as President and Chief Executive Officer, from October 2004 until its merger with Delta Air Lines in October 2008. In the past ten years, Mr. Steenland has also served as a director of Northwest Airlines Corporation and Delta Air Lines, Inc. Mr. Steenland was President and Chief Executive Officer of Northwest Airlines Corporation when it filed for Chapter 11 bankruptcy in 2005. Mr. Steenland was selected to serve on our Board of Directors because of his industry expertise and experience as a member of the Board of Directors of other companies.
89
Gavin R. Baiera.Mr. Baiera has served as a member of our Board of Directors since October 2011, a member of our Compensation Committee since October 2011 and a member of our Nominating and Corporate Governance Committee since the pricing of our initial public offering. Mr. Baiera served as a member of our Audit Committee from October 2011 until the pricing of our initial public offering. Mr. Baiera is a Managing Director at Angelo, Gordon & Co., L.P., a privately-held registered investment advisor currently managing approximately $23 billion. Prior to joining Angelo Gordon, Mr. Baiera was co-head of the Strategic Finance Group at Morgan Stanley which was responsible for all origination, underwriting and distribution of restructuring transactions. Prior to joining Morgan Stanley in 2005, Mr. Baiera was a Vice President at General Electric Capital Corporation concentrating on underwriting and investing in restructuring transactions. Mr. Baiera began his career at General Electric Capital Corporation in their financial management program. Mr. Baiera serves on the Board of Directors of Mach Gen, Inc. and Orbitz Worldwide, Inc. Mr. Baiera was selected to serve on our Board of Directors because of his financial and investment expertise.
Gregory Blank.Mr. Blank has served as a member of our Board of Directors and a member of our Audit Committee since May 2013. Mr. Blank served as a member of our Compensation Committee from May 2013 until the pricing of our initial public offering. Mr. Blank is a Principal in the Corporate Private Equity Group of The Blackstone Group, where he focuses primarily on investments in the Technology, Media and Telecommunications and Industrials sectors. Since joining Blackstone in 2009, Mr. Blank has been involved in the evaluation and execution of private equity transactions in a variety of industries and across geographies, including in the United States, Germany, Asia, and Australia/New Zealand. Prior to joining Blackstone, Mr. Blank was an Associate at Texas Pacific Group (TPG) in San Francisco, where he was involved in the evaluation and execution of private equity transactions. Prior to that, Mr. Blank worked in investment banking at Goldman, Sachs & Co. focused on Technology, Media and Telecommunications clients. Mr. Blank serves on the Boards of Directors of The Weather Company, Ipreo and Accuvant, Inc. Mr. Blank was selected to serve on our Board of Directors because of his financial and investment expertise.
Douglas A. Hacker.Mr. Hacker has a member of our Board of Directors, chairman of our Compensation Committee and a member of our Audit Committee since the pricing of our initial public offering. Mr. Hacker served as Executive Vice President, Strategy of UAL Corporation from 2002 to 2006 and as President of UAL Loyalty Services from 2001 to 2002. Prior to that, Mr. Hacker served as Chief Financial Officer of United Airlines from 1994 to 2001. Mr. Hacker is currently an independent business executive and, as such, he serves on the Boards of Directors of the public entities of Aircastle Limited, Columbia Mutual Funds and SpartanNash Company, as well as the private company, NES Rentals. Mr. Hacker was selected to serve on our Board of Directors because of his industry expertise and experience as a member of the Board of Directors of public and private companies.
Elizabeth L. Buse.Ms. Buse has been a member of our Board of Directors and a member of our Nominating and Corporate Governance Committee since the pricing of our initial public offering. Ms. Buse is a Co- Chief Executive Officer of Monitise PLC, where she leads day to-day operations including technology, product, sales and marketing, a position she has held since June of 2014. Before joining Monitise PLC, Ms. Buse held numerous executive roles during her sixteen years with Visa, Inc., most recently as Executive Vice President and Global Executive focusing on Solutions. Ms. Buse serves on the Board of Directors of Monitise PLC. Ms. Buse was selected to serve on our Board of Directors because of her financial and technology expertise and experience as a member of the Board of Directors of other public and private companies.
Michael J. Durham.Mr. Durham has been a member of our Board of Directors and chairman of our Audit Committee since the pricing of our initial public offering. From 2000 to 2012, Mr. Durham was President and Chief Executive Officer of Cognizant Associates, a consulting company he founded. Before founding Cognizant, he served as Director, President and Chief Executive Officer of Sabre, Inc., then a NYSE-listed company providing information technology services to the travel industry. He held those positions from October 1996, the date of Sabre, Inc.’s initial public offering, until October 1999. From 1979, Mr. Durham worked at AMR Corp./American Airlines, serving as Senior Vice President and Treasurer of AMR Corporation and Senior Vice
90
President of Finance and Chief Financial Officer of American Airlines from October 1989 until he assumed the position of President of Sabre. Following Cognizant Associates, Mr. Durham serves on the Boards of Directors of The Hertz Corporation, the leading company in the auto and heavy equipment leasing industries, and of Cambridge Capital Acquisition Corp., a special purpose acquisition corporation formed in January of 2014. During the preceding years, Mr. Durham served on the Boards of Directors of numerous publicly traded and privately held companies, including Asbury Automotive Group Inc. and Acxiom Corporation. Mr. Durham was selected to serve on our Board of Directors because of his financial and industry expertise and experience as a member of other Boards of Directors.
Terence P. Conley.Mr. Conley has served as our Executive Vice President, Capability and Performance since January 2013. Mr. Conley was formerly a Special Advisor and Travelport’s Executive Vice President of Integration, in which position he played a key role in the integration of Worldspan into Travelport. Prior to this role, Mr. Conley was Travelport’s Chief Administrative Officer, responsible for communications, corporate IT, real estate and contact centers. Formerly, Mr. Conley was Executive Vice President of Human Resources and Corporate Services for Cendant Corporation, where he oversaw global HR, facilities management, corporate real estate, events marketing and security functions throughout the enterprise. Prior to joining Cendant, Mr. Conley spent nearly 10 years with the PepsiCo organization, with HR leadership assignments in corporate and all their subsidiaries. His last position with this organization was Vice President of Human Resources at The Pepsi-Cola Company. In this role, Mr. Conley culminated his career by leading the HR aspects of the formation of independent bottling entities as a result of the break-up of the Pepsi-Cola sales and distribution organization. Prior to this role, Mr. Conley was Director of Human Resources with PepsiCo’s Frito Lay division, Director of Human Resources for PepsiCo Corporate and Director of Human Resources with PepsiCo’s KFC unit. Previously, Mr. Conley served in various HR capacities with RH Macy & Company.
Bryan Conway.Mr. Conway has served as our Senior Vice President and Chief Marketing Officer since November 2012. As our Chief Marketing Officer, Mr. Conway has overall responsibility for the definition, lifecycle management and marketing of our products and services to all customer groups. Mr. Conway also oversees market strategy and research, and marketing communications globally. Mr. Conway has performed a wide range of commercial roles in the 26 years he has been with Travelport and its predecessors. Immediately prior to his current appointment as Chief Marketing Officer, Mr. Conway was Global Head of Commercial Operations & Supplier Services for Travelport GDS. Previous positions include Managing Director Europe, Middle East & Africa; Vice President, Airline Services for the same region; and General Manager for Galileo Southern Africa. Mr. Conway moved to Johannesburg from Hong Kong, where he helped establish Galileo’s current presence in Asia, building a network of distributors in the region. Previously, he had undertaken a similar task in Europe and then in Latin America. Mr. Conway joined Galileo International as a Marketing Manager in 1988.
Anthony Hynes. Mr. Hynes is Managing Director and CEO of eNett International, a joint venture formed in June 2009 between PSP International and Travelport, and in which Travelport owns a majority stake. Mr. Hynes has 20 years of strategic and operational business experience, leading companies across the telecommunications, internet, human services, retail, financial services and travel industries. Mr. Hynes has been instrumental in driving innovative payment solutions and business development opportunities that have propelled exponential growth in eNett over recent years. Mr. Hynes was an original founder of PSP International, which was first formed in 2002. Prior to this, he was the founder and Executive Chairman of one of Australia’s largest childcare companies, achieving triple-digit growth, year-on-year for three years, before being bought out by an ASX-listed group.
Christopher Roberts.Mr. Roberts has been our Group Vice President, Corporate Strategy and Development since January 2014. In this role, Mr. Roberts assists in the development of our corporate strategy, including mergers and acquisitions activities, strategic alliances and the development of new business initiatives. Mr. Roberts has extensive executive management experience in a range of high-profile, technology-led companies, including Hewlett Packard, Vodafone and Regus Group Services. From August 2010 until December
91
2013, Mr. Roberts was an executive of Regus Group Services, including the roles of Global Director—New Business Commercialization and Global Product Director—Office, Campus and Services. From September 2006 until August 2010, Mr. Roberts was an executive of British Telecommunications Alliance for Hewlett Packard UK. From January 2005 through August 2006, Mr. Roberts served as Head of Global Service Platforms, One Vodafone, of Vodafone Group Services Limited, and prior to this, from June 2003 until January 2005, as Head of Programme Management for Vodafone Group Technology—Global Service Development.
Board Composition
Our Board currently consists of seven directors. The authorized number of directors may be changed by resolution of our Board. Vacancies on our Board can be filled by resolution of our Board. Each director elected to the Board serves a one-year term.
Board Committees and Membership
Our Board has three standing committees: the Audit Committee, the Compensation Committee and the Nominating and Corporate Governance Committee. The charter of each committee is available, free of charge, on our website (www.travelport.com) under “Investors—Governance—Committee Charters.”
Audit Committee
The Audit Committee provides assistance to the Board in fulfilling its legal and fiduciary obligations in matters involving our accounting, auditing, financial reporting, internal control and legal compliance functions by approving the services performed by our independent registered public accounting firm and reviewing their reports regarding our accounting practices and systems of internal accounting controls. The Audit Committee also oversees the audit efforts of our independent registered public accounting firm and takes those actions as it deems necessary to satisfy itself that the independent registered public accounting firm is independent of management. Our Audit Committee is also responsible for the review, approval or ratification of “related-person transactions” between us or our subsidiaries and related persons. See “Certain Relationships and Related Party Transactions—Review, Approval or Ratification of Related Person Transactions.”
The current composition of the Audit Committee is Michael Durham, Gregory Blank and Douglas Hacker, with Michael Durham serving as the chairman.
The Board has determined that Michael Durham qualifies as an “audit committee financial expert” as defined under applicable SEC rules and also meets the criteria for independence of audit committee members set forth in 10A-3(b)(i) of the Exchange Act.
Compensation Committee
The Compensation Committee determines our general compensation policies and the compensation provided to our directors and officers. The Compensation Committee also reviews and determines bonuses for our officers and other employees. In addition, the Compensation Committee reviews and determines equity based compensation for our directors, officers, employees and consultants and administers our equity incentive plans. Our Compensation Committee also oversees our corporate compensation programs.
The current composition of the Compensation Committee is Douglas Hacker and Gavin Baiera, with Douglas Hacker serving as the chairman.
Nominating and Corporate Governance Committee
Our Nominating and Corporate Governance Committee is responsible for making recommendations to the Board regarding candidates for directorships and the size and composition of the Board. In addition, the
92
Nominating and Corporate Governance Committee is responsible for overseeing our corporate governance guidelines and reporting and making recommendations to the Board concerning corporate governance matters.
The current composition of the Nominating and Corporate Governance Committee is Douglas Steenland, Gavin Baiera and Elizabeth Buse, with Douglas Steenland serving as the chairman.
Board Executive Sessions
The non-management directors of the Board regularly meet alone without any members of management being present. Our Chairman presides at these executive sessions.
Role of Our Board in Risk Oversight
One of the key functions of our Board is informed oversight of our risk management process. Our Board administers this oversight function directly through our Board as a whole, as well as through various standing committees of our Board that address risks inherent in their respective areas of oversight. In particular, our Board is responsible for monitoring and assessing strategic risk exposure, and our Audit Committee has the responsibility to consider and discuss our major financial risk exposures and the steps our management has taken to monitor and control these exposures. The Audit Committee also has the responsibility to review with management the process by which risk assessment and management is undertaken, monitor compliance with legal and regulatory requirements, and review with our independent auditors the adequacy and effectiveness of our internal controls over financial reporting. Our Nominating and Corporate Governance Committee is responsible for periodically evaluating our corporate governance policies and system in light of the governance risks that we face and the adequacy of our policies and procedures designed to address such risks. Our Compensation Committee will assess and monitor whether any of our compensation policies and programs are reasonably likely to have a material adverse effect on us.
Compensation Committee Interlocks and Insider Participation
None of our executive officers currently serves, or in the past year has served, as a member of the board of directors or compensation committee of any entity that has one or more executive officers serving on our Board of Directors or Compensation Committee.
Corporate Governance
We have adopted a Code of Business Conduct and Ethics that applies to all of our officers, directors and employees, including our principal executive officer, principal financial officer and principal accounting officer. In addition, we have adopted a Code of Ethics for Senior Managers. Our Code of Business Conduct and Ethics and Code of Ethics for Senior Managers can be accessed on our website at www.travelport.com. Amendments to, our waivers from, the Code of Business Conduct and Ethics and the Code of Ethics for Senior Managers will be posted on our website.
The purpose of our code is to promote honest and ethical conduct, including the ethical handling of actual or apparent conflicts of interest between personal and professional relationships; to promote full, fair, accurate, timely and understandable disclosure in periodic reports required to be filed by us; and to promote compliance with all applicable rules and regulations that apply to us and our officers and directors. The information on our website is not a part of, or incorporated by reference into, this Annual Report on Form 10-K.
We have also posted current copies of our Corporate Governance Guidelines and Committee Charters on the Investors—Governance page of our website.
You may also obtain copies of these materials for free by writing to our Corporate Secretary at: Travelport Worldwide Limited, Attention: Corporate Secretary, Axis One, Axis Park, Langley, Berkshire SL3 8AG, United Kingdom.
93
Communications with Directors
If a shareholder or any interested party has any concern, question or complaint regarding any accounting, auditing or internal controls matter, any issues arising under the Code of Business Conduct and Ethics or the Code of Ethics for Senior Managers, or any other matter that he or she wishes to communicate with the Board, the non-management directors as a group or any individual director, the shareholder or interested party may write to any of these groups or individuals at c/o Travelport Worldwide Limited, Attention: Chairman, Axis One, Axis Park, Langley, Berkshire SL3 8AG, United Kingdom. Our Chairman will relay the communication to the full Board, director group or individual director, as appropriate. From time to time, the Board may change the process for shareholder communication with the Board or its members. You should refer to the Investors—Governance page of our website at www.travelport.com for any changes in this process.
Whistleblower Hotline
The Board has established a means for employees, customers, suppliers, shareholders and other interested parties to submit confidential and anonymous reports of suspected or actual violations of the Code of Business Conduct and Ethics or other matters. Any employee, shareholder or other interest party may call the Integrity Line and submit a report. The Integrity Line is operational 24 hours a day, seven days a week. Information on our Integrity Line is available in our Code of Business Conduct and Ethics, which is available on the Investors—Governance page of our website at www.travelport.com.
Section 16(a) Beneficial Ownership Reporting Compliance
Section 16(a) of the Exchange Act requires our executive officers, directors and persons who beneficially own more than 10% of our common shares to report to the SEC their ownership of our common shares and changes in that ownership. We reviewed copies of reports filed pursuant to Section 16(a) of the Exchange Act. Based solely on that review, we believe that during 2014, all required filings were timely made in accordance with the requirements of the Exchange Act.
Limitations of Liability and Indemnification Matters
Our corporate bye-laws provide that, to the fullest extent permitted by law, every current and former Director, officer or other legal representative of our company shall be entitled to be indemnified by our company against judgments, fines, penalties, excise taxes, amounts paid in settlement and costs, charges and expenses (including attorneys’ fees and disbursements) resulting from any threatened, pending or completed action, suit or proceeding, whether civil, criminal, administrative or investigative, including, but not limited to, an action by or in the right of the company to procure a judgment in its favor, by reason of the fact that such person is or was a director or officer of the company, or is or was serving in any capacity at the request of the company for any other corporation, partnership, joint venture, trust, employee benefit plan or other enterprise. Persons who are not our Directors or officers may be similarly indemnified in respect of service to the company or to any other entity at the request of the company to the extent our Board of Directors at any time specifies that such persons are entitled to indemnification.
In addition, we and one or more of our affiliates have entered into agreements that indemnify our Directors, executive officers and certain other employees. Such agreements provide for indemnification for related expenses, including attorneys’ fees, judgments, fines and settlement amounts incurred by any of these individuals in any action or proceeding. We believe that these provisions and agreements are necessary to attract and retain qualified persons as our Directors and executive officers.
As of the date of this Annual Report on form 10-K, we are not aware of any pending litigation or proceeding involving any director, officer, employee or agent of our company where indemnification will be required or permitted, nor are we aware of any threatened litigation or proceeding that might result in a claim for indemnification.
94
ITEM 11. EXECUTIVE COMPENSATION
COMPENSATION DISCUSSION AND ANALYSIS
The purpose of this Compensation Discussion and Analysis section is to provide information about the material elements of compensation that are paid, awarded to, or earned by, our “Named Executive Officers,” who consist of our principal executive officer, principal financial officer, the two other most highly compensated executive officers and two of our former executive officers who left the Company in 2014. For fiscal year 2014, our Named Executive Officers were:
| | • | | Gordon A. Wilson, our President and Chief Executive Officer; |
| | • | | Philip Emery, our Executive Vice President and Chief Financial Officer; |
| | • | | Kurt Ekert, our Executive Vice President and Chief Commercial Officer; |
| | • | | Matthew Minetola, our Executive Vice President and Chief Information Officer; |
| | • | | Eric J. Bock, our former Executive Vice President, Chief Legal Officer and Chief Administrative Officer; and |
| | • | | Mark Ryan, our former Executive Vice President and Chief Information Officer. |
All share and per share data in this section gives retroactive effect to the Share Consolidation that was effectuated on September 5, 2014.
For the sake of clarity, as used herein, the “Compensation Committee” refers to the Compensation Committee of Travelport Limited, our wholly-owned subsidiary, for periods prior to our initial public offering and to the Compensation Committee of Travelport Worldwide Limited for any period following our initial public offering.
Compensation Before Our IPO
Compensation Decisions
Our compensation approach was necessarily tied to our stage of development. We were a privately-held company from 2006 until our initial public offering in September 2014. As a result, we were not subject to any stock exchange listing or SEC rules related to Board and compensation committee structure and functioning. Accordingly, the compensation paid to our Named Executive Officers for fiscal year 2014 (which includes compensation relating to grants in prior years, described in the next subsection, Long-Term Incentive Compensation), and the form and manner in which it was paid, is not necessarily indicative of how we will compensate our Named Executive Officers in the future.
Long-Term Incentive Compensation
Prior to becoming a public company and, in each case, after review of our compensation program by the Compensation Committee (discussed above), we have on occasion granted cash retention and long-term incentives to provide for retention of our key executive officers, including our Named Executive Officers, as further reflected in the Summary Compensation Table below. These awards were made to encourage continued employment by our Named Executive Officers and other key executive officers and to reward them for achieving designated goals. Although we made no such awards in 2014, awards were earned and paid during 2014 under the terms of awards made in earlier years, as described in more detail below in footnote (3) of the “Summary Compensation Table”. In addition, a majority of the values for 2014 in the Stock Award column in the “Summary Compensation Table” below relates to equity awards with performance-based vesting that were granted in May 2013 – specifically, $8,320,000 of the $13,000,156 for Mr. Wilson; $3,920,000 of the $6,047,344 for Mr. Emery; $3,920,000 of the $5,728,249 for Mr. Ekert; and all of the $3,920,000 for Mr. Bock.
Perquisites
We modified our perquisites program for our Named Executive Officers to eliminate gross-ups following our initial public offering in 2014, specifically gross ups historically given for financial planning and tax preparation, and certain car allowances.
95
Compensation Upon and After Our IPO
Before our initial public offering, we began administering the compensation program for our Named Executive Officers in a manner consistent with a public company, and our Compensation Committee has continued to review our compensation programs and make such changes to our programs and make necessary and appropriate changes in light of our new status as a public company. The following description covers our compensation process and philosophy both pre-IPO and upon IPO in 2014.
Compensation Process
Our Compensation Committee reviews and approves the compensation of our Named Executive Officers and oversees and administers our executive compensation programs and initiatives. In discharging these functions, our Compensation Committee has historically taken into account multiple factors, including information (such as market data) provided by third-party compensation consultants and others, as well as our Chief Executive Officer’s judgment and knowledge of our industry. Our Chief Executive Officer annually reviews each other executive officer’s (including our Named Executive Officers) performance with the Compensation Committee and recommends appropriate base salary, cash performance awards and grants of long-term equity incentive awards for all other executive officers.
The Compensation Committee annually reviews our Chief Executive Officer’s performance and his base salary, as well as any cash performance awards and grants of long-term incentive awards based on its assessment of his performance with input from any consultants we engage. During 2014, the Compensation Committee met outside the presence of all of our executive officers with regard to discussions specifically addressing our Chief Executive Officer’s compensation. For all other Named Executive Officers, the Compensation Committee met outside the presence of our executive officers except our Chief Executive Officer.
In May 2014, the Compensation Committee retained Pay Governance, LLC (“Pay Governance”) to advise the Committee on executive and equity compensation matters. Pay Governance assisted with the pre-IPO planning including:
| | • | | Confirming post-IPO pay philosophy; |
| | • | | Setting a post-IPO equity strategy; |
| | • | | Providing competitive peer group information on Named Executive Officer pay levels, equity plan designs, and share usage; and |
| | • | | Providing best practice information on other policies related to pay policies and governance. |
To ensure we understand the external labor market and competitive pay environment, we have historically reviewed information on competitive pay levels for our Named Executive Officers using compensation surveys and compared our compensation against a range of both public and private companies in our industry. As part of our planning work for our initial public offering in 2014, the Committee agreed upon a selected peer group of comparable companies to review for competitive pay and practice information. Pay Governance assisted with this process of peer group selection. The peer group was developed by considering companies of similar revenue size and projected market capitalization to ours within similar business sectors. The selected companies are in the internet software and services, internet retail, application software, and data and outsourced services sub-industries. The peer group companies were screened to ensure that their revenues were no more than 2.5 times our annual revenue, with a median revenue size similar to ours. We expect to use the peer group information, focused on the levels approximating the median as one factor in establishing pay levels. Although we believe external market data is very useful, we will also consider other factors such as previous experience, future potential, and performance in establishing pay levels. The peer group companies we selected are as follows:
| | • | | Alliance Data Systems Corporation |
96
| | • | | Blackhawk Network Holdings, Inc. |
| | • | | Concur Technologies, Inc. |
| | • | | Moneygram International Inc. |
| | • | | Total System Services, Inc. |
Compensation Philosophy and Objectives
We have strived to create an executive compensation program that provides both short-term and long-term payments and awards, in order to:
| | • | | attract and retain talent from within the highly competitive global marketplace; |
| | • | | ensure a performance-based delivery of pay that aligns, as much as possible, our Named Executive Officers’ rewards with our shareholders’ interests; |
| | • | | compensate our Named Executive Officers in a manner that incentivizes them to manage our business to meet our long-range objectives; |
| | • | | compensate our Named Executive Officers in a manner commensurate with their and our performance; and |
| | • | | promote a long-term commitment to us. |
To achieve these goals, we have implemented a program consisting of (i) base salary, (ii) annual performance cash bonus and (iii) significant long-term incentive awards with a mix of time and performance related vesting conditions. In addition, we provide certain perquisites and other benefits that are more fully described below. The vesting conditions attached to our equity awards—which have historically required three or more years of service for full vesting, with a material part of awards subject to performance-based vesting—foster and promote a long-term commitment to us while incentivizing our executive officers to drive value, which reflects two of our core philosophies.
Elements of Compensation
For our 2014 fiscal year, our executive compensation program consisted of the following components:
| | • | | annual cash incentive (bonus) awards linked to our overall performance; |
| | • | | grants of long-term compensation; |
| | • | | other executive benefits and perquisites, as described below; and |
| | • | | post-employment compensation. |
97
We combine these elements to formulate compensation packages that provide competitive pay, reward the achievement of financial, operational and strategic objectives and align the interests of our executive officers with those of our shareholders.
Pay Mix
We use the particular elements of compensation described above because we believe that it provides a well-proportioned mix of secure compensation, retention value and at-risk compensation that produces short-term and long-term performance incentives and rewards, and incentivizes our executive officers for superior operational performance and creating value for our shareholders. The mix of metrics used for our annual performance bonus and long-term incentive program likewise provides an appropriate balance between different metrics as well as short-term and long-term performance.
Base Salary
We believe that a competitive base salary is essential in attracting and retaining key executive talent. Historically, the Compensation Committee has reviewed the base salaries of our Named Executive Officers and made adjustments to reflect, among other factors, each Named Executive Officer’s level of experience, responsibilities, expected future contributions to our success and market competitiveness. The base salary established for each of our Named Executive Officers is intended to reflect each individual’s responsibilities, experience, prior performance and other discretionary factors deemed relevant by our Compensation Committee. Base salary is also designed to provide our Named Executive Officers with steady cash flow during the course of the fiscal year that is not contingent on short-term variations in our corporate performance. Our Compensation Committee determines the appropriate salary, usually after a review of market data and discussions with our Chief Executive Officer, taking into account our Named Executive Officers’ experience in the industry with reference to the base salaries of similarly-situated executives in other companies of similar size and stage of development operating in our industry.
The base salaries paid to our Named Executive Officers for 2014 are set forth in the Summary Compensation Table below. We did not change the base salaries for our Named Executive Officers in 2014.
Annual Bonus
Our Compensation Committee has the authority to award annual cash bonuses to our executive officers. The annual cash bonuses are intended to reward the achievement of corporate performance objectives. Our annual bonus program satisfies our goal of incentivizing our executive officers to achieve, and rewarding them for achieving, primarily annual financial metrics important to the success of our business.
Generally, at the commencement of an executive officer’s employment with us, our Compensation Committee, after discussion with our Chief Executive Officer, typically sets a target level of bonus compensation that is structured as a percentage of such executive officer’s annual base salary. In this regard, the employment agreements for our Named Executive Officers specifically provide that the target bonus percentage for Mr. Wilson is 150% of base salary and, for Messrs. Emery, Ekert and Minetola (as well as Messrs. Bock and Ryan prior to their termination of employment), is 100% of base salary. Our Named Executive Officers can each earn up to 200% of their target bonus if the performance targets established by the Compensation Committee are exceeded.
For 2014, our annual bonus program was primarily formulaic and was awarded to our Named Executive Officers based on achievement of specified Adjusted EBITDA and key operational metrics. However, our Compensation Committee does retain the discretion to increase or reduce any bonus paid on an evaluation of a Named Executive Officer’s individual performance. Our Compensation Committee did not exercise its discretion to increase or decrease payments in 2014.
98
The Compensation Committee awarded our Named Executive Officers the annual bonuses for 2014 set forth in the Summary Compensation Table below, which represented 70.5% of the target bonus for Messrs. Wilson, Emery, Ekert and Bock (in the case of Mr. Bock only, pro-rata based on the portion of the year he worked for us).
In connection with our initial public offering, we adopted the annual performance bonus plan described below to maximize our ability to deduct annual bonus amounts under Section 162(m) of the Internal Revenue Code (the “Code”).
Long-Term Incentives
Equity-Based Compensation
We believe that equity-based compensation is an important component of our executive compensation program and that providing a significant portion of our Named Executive Officers’ total compensation package in equity-based compensation aligns the incentives of our Named Executive Officers with the interests of our shareholders and with our long-term corporate success. In addition, our Compensation Committee believes that equity-based compensation awards enable us to attract, motivate, retain and adequately compensate executive talent by providing competitive levels of compensation tied to our long-term value creation.
As part of our IPO planning process during 2014, the Committee carefully considered the best approach for long-term incentive opportunities going forward for Travelport as a public company. The 2014 grants were designed to achieve the following objectives:
| | • | | Be primarily performance-based; |
| | • | | Use a mix of vehicles to recognize a combination of stock price and operating performance; |
| | • | | Provide appropriate pay opportunity focused on the long-term, versus short-term, success of the Company; |
| | • | | Align executive interests with shareholder interests. |
After extensive study and discussion, the Committee made equity grants in 2014 effective upon (or, in the case of Mr. Minetola, after) our initial public offering. These grants are consistent with our go-forward equity grant strategy. We anticipate a similar approach in subsequent years, although the Committee will continue to update the equity approach as needed to reflect external market changes or changes in key metrics for the business.
Size of Grants
The size of the 2014 grants was established after reviewing grant sizes and total compensation for the peer group, as well as considering the individual performance, potential and experience of each member of the senior management team. Awards for our Named Executive Officers were as follows, as set forth in more detail in the “Grants of Plan-Based Awards During 2014” table:
| | | | |
Name | | 2014 Grant Value ($000) | |
Gordon Wilson | | $ | 4,400 | |
Philip Emery | | $ | 2,000 | |
Kurt Ekert | | $ | 1,700 | |
Matthew Minetola | | $ | 1,000 | |
99
Types of Equity Vehicles Used
The equity mix was selected to provide a balanced grant that reflects operating performance, stock price growth and retention as follows:
| | • | | 50% of the value of grant was in the form of performance shares; these are tied to 2015-2016 cumulative adjusted EPS goals plus a subsequent additional time vesting until October 15, 2017; |
| | • | | 25% of the value of grant was in the form of stock options vesting one-fourth on October 15th of 2015, 2016, 2017 and 2018; and |
| | • | | 25% of the value of grant was in the form of time-based restricted stock units vesting one-fourth on October 15th of 2015, 2016, 2017 and 2018. |
Timing of Equity Awards
As a post-IPO company, we intend to transition to annual equity grants to executives and other key employees made in the first quarter of each year. However, in 2014, the Committee decided to make the first equity grant around the time of our initial public offering to recognize this milestone and provide key employees, including our Named Executive Officers (with the exception of Mr. Minetola, who was hired shortly after our initial public offering), with equity grants effective upon our initial public offering. This 2014 grant is intended to take the place of an annual grant in March 2015. Although we do anticipate some new-hire, promotional, retention and other off-cycle equity grants during 2015, our next full annual equity grant will be in the first quarter of 2016, and we expect that going forward our annual equity grants will take place in the first quarter of each year.
Other Executive Benefits and Perquisites
Our Named Executive Officers participate in broad-based welfare and retirement programs on substantially the same basis as other eligible employees, and they may be eligible to participate in the 2014 Employee Stock Purchase Plan. In addition, we provided financial planning and tax preparation, deferred compensation and a car allowance to our U.S. Named Executive Officers, and financial planning, cash contributions in lieu of pension contributions, a car allowance, commuting benefits for our Chief Financial Officer and a travel allowance for our U.K. Named Executive Officers.
None of our Named Executive Officers receive benefits under a defined benefit pension plan. We do, however, provide for limited deferred compensation arrangements, with matching contributions by us in some circumstances, for U.S. executives.
We believe these benefits are generally consistent with those offered by other companies, and specifically with those companies with which we compete for employees, in the applicable jurisdiction in which our Named Executive Officers are employed.
Employment Agreements and Severance and Change of Control Benefits
We believe that a strong, experienced management team is essential to our and our shareholders’ best interests. We recognize that the possibility of a change in control could arise and that such a possibility could result in the departure or distraction of members of the management team to our and our shareholders’ detriment. We have entered into employment agreements with our Named Executive Officers in order to minimize employment security concerns arising in the course of negotiating and completing a significant transaction, as well as to provide post-employment restrictive covenants. These benefits, which are payable only if the executive officer is terminated by us without cause or the executive resigns for good reason (and, in certain cases described below, are enhanced following a change in control) are enumerated and quantified in the sections captioned “Employment Agreements” and “Potential Payments Upon Termination of Employment or Change in Control” below. We do not provide “golden parachute” tax gross-ups.
100
Risk Assessment
We have determined that any risks arising from our compensation programs and policies are not reasonably likely to have a material adverse effect on us. Our compensation programs and policies mitigate risk by combining performance-based, long-term compensation elements with payouts that are highly correlated to the value delivered to shareholders. The combination of performance measures for annual bonuses (which are capped) and the equity compensation programs, share ownership and retention guidelines for executive officers, as well as the multi-year vesting schedules for equity awards encourage employees to maintain both a short and a long-term view with respect to our performance.
Other Compensation Policies
In connection with our initial public offering in 2014, we adopted several policies that we believe are important components of a public-company executive compensation program, which are generally described below.
Share Ownership Policy
In connection with our initial public offering, we have adopted a share ownership policy that requires our directors and key employees, including our Named Executive Officers, to have significant share ownership in us. The share ownership policy requires that each Named Executive Officer holds our common shares with a value equal to or greater than three times his or her base salary, except in the case of the Chief Executive Officer, who is required to have holdings of our common shares with a value equal to or greater than five times his or her salary. While the share ownership policy generally allows a relevant director or key employee five years to attain the relevant ownership threshold, our Named Executive Officers (other than Mr. Minetola, who has five years from the commencement of his employment to comply), are required to meet the relevant ownership threshold effective upon our initial public offering in 2014. The Compensation Committee believes that this share ownership policy aligns the financial interests of our executive officers with those of our shareholders.
Compensation Recovery Policy
Currently, we have not implemented a policy regarding retroactive adjustments to any cash or equity-based incentive compensation paid to our executive officers and other employees where the payments were predicated upon the achievement of financial results that were subsequently the subject of a financial restatement. We will adopt a general compensation recovery (“clawback”) policy covering our annual and long-term incentive award plans and arrangements no later than the date required by the final SEC rules implementing Section 954 of the Dodd-Frank Act.
Derivatives Trading and Hedging Policies
Our general insider trading policy provides that no employee, officer, or member of our Board of Directors may acquire, sell, or trade in any interest or position relating to the future price of our securities, such as a put option, a call option or a short sale (including a short sale “against the box”), or, without our prior consent, engage in hedging transactions (including “cashless collars”). Similarly, our policy generally prohibits our executive officers and members of our Board of Directors from pledging any of their common shares as collateral for a loan or other financial arrangement.
Tax and Accounting Considerations
Section 162(m) Compliance
Section 162(m) of the Code generally disallows public companies a tax deduction for federal income tax purposes of more than $1 million of compensation paid to the chief executive officer and each of the three other most highly-compensated executive officers (other than the chief financial officer) in a taxable year.
101
Compensation above $1 million may generally be deducted if it is “performance-based compensation” within the meaning of the Code. As a newly public company, we intend to generally rely on certain transition relief under 162(m). To the extent such transition relief is inapplicable, however, in approving the amount and form of compensation for our executive officers after becoming a public company, the Compensation Committee will consider all elements of the cost to us of providing such compensation, including the potential impact of Section 162(m). The Compensation Committee believes that the potential deductibility of the compensation payable under those plans and arrangements should be only one of a number of relevant factors taken into consideration, and not the sole governing factor. As a result, the Compensation Committee reserves the discretion to approve compensation arrangements that may not be tax deductible for us, such as base salary, cash incentive awards tied to our financial performances or equity incentive awards with time-based vesting requirements, or which do not comply with an exemption from the deductibility limit when it believes that such arrangements are appropriate to attract and retain executive talent.
“Golden Parachute” Payments
Sections 280G and 4999 of the Code provide that executive officers and directors who hold significant equity interests and certain other service providers may be subject to an excise tax if they receive payments or benefits in connection with a change in control of us that exceeds certain prescribed limits, and that we, or a successor, may forfeit a deduction on the amounts subject to this additional tax. We did not provide any executive officer, including any Named Executive Officer, with a “gross-up” or other reimbursement payment for any tax liability that he or she might owe as a result of the application of Sections 280G or 4999 during 2014 and we have not agreed and are not otherwise obligated to provide any Named Executive Officer with such a “gross-up” or other reimbursement.
Accounting for Stock-Based Compensation
We follow Financial Accounting Standard Board’s Accounting Standards Codification Topic 718 (“FASB ASC Topic 718”) for our stock-based compensation awards. FASB ASC Topic 718 requires companies to measure the compensation expense for all share-based payment awards made to employees and directors, including stock options, based on the grant date “fair value” of these awards. This calculation is performed for accounting purposes and reported in the compensation tables below, even though our executive officers may never realize any value from their awards. FASB ASC Topic 718 also requires companies to recognize the compensation cost of their stock-based compensation awards in their income statements over the period that an executive officer is required to render service in exchange for the option or other award.
COMPENSATION COMMITTEE REPORT
The Compensation Committee has reviewed and discussed the Compensation Discussion and Analysis with management and based on the review and discussions, the Compensation Committee recommended to the Company’s Board of Directors that the Compensation Discussion and Analysis be included herein.
THE COMPENSATION COMMITTEE
Douglas Hacker, Chairman
Gavin Baiera
102
Summary Compensation Table
The following table contains compensation information for our Named Executive Officers for the fiscal year ended December 31, 2014.
| | | | | | | | | | | | | | | | | | | | | | | | | | | | |
Name and Principal Position | | Year | | | Salary
($) | | | Bonus(1)
($) | | | Stock
Awards(2)
($) | | | Non-Equity
Incentive Plan
Compensation(3)
($) | | | All Other
Compensation(4)
($) | | | Total ($) | |
Gordon A. Wilson | | | 2014 | | | | 857,615 | | | | 581,817 | | | | 13,000,156 | (5) | | | 1,387,561 | | | | 200,506 | (7) | | | 16,027,655 | |
President, Chief Executive Officer and
Director (6) | | | 2013 | | | | 910,910 | | | | 149,407 | | | | 4,195,508 | | | | 2,609,009 | | | | 210,983 | | | | 8,075,817 | |
| | | 2012 | | | | 894,025 | | | | 77,372 | | | | 0 | | | | 1,847,495 | | | | 258,809 | | | | 3,077,071 | |
Philip Emery | | | 2014 | | | | 545,755 | | | | 236,556 | | | | 6,047,344 | (5) | | | 577,011 | | | | 132,308 | (8) | | | 7,538,974 | |
Executive Vice President and Chief
Financial Officer (6) | | | 2013 | | | | 579,670 | | | | 49,935 | | | | 2,075,267 | | | | 1,147,978 | | | | 142,201 | | | | 3,995,051 | |
| | | 2012 | | | | 568,925 | | | | 26,277 | | | | 0 | | | | 801,835 | | | | 146,121 | | | | 1,543,158 | �� |
Kurt Ekert | | | 2014 | | | | 550,000 | | | | 327,491 | | | | 5,728,249 | (5) | | | 612,750 | | | | 79,205 | (9) | | | 7,297,695 | |
Executive Vice President and Chief
Commercial Officer | | | 2013 | | | | 550,000 | | | | 26,786 | | | | 1,946,368 | | | | 1,131,250 | | | | 76,681 | | | | 3,731,085 | |
| | | 2012 | | | | 424,231 | | | | 15,092 | | | | 0 | | | | 629,125 | | | | 65,456 | | | | 1,133,904 | |
Matthew Minetola | | | 2014 | | | | 28,846 | | | | 0 | | | | 1,001,789 | | | | 0 | | | | 865 | (10) | | | 1,031,501 | |
Executive Vice President and Chief
Information Officer | | | | | | | | | | | | | | | | | | | | | | | | | | | | |
Eric J. Bock | | | 2014 | | | | 456,923 | | | | 253,424 | | | | 3,920,000 | (5) | | | 417,250 | | | | 90,593 | (12) | | | 5,138,190 | |
Former Executive Vice President, Chief
Legal Officer and Chief Administrative Officer(11) | | | 2013 | | | | 600,000 | | | | 61,864 | | | | 1,991,353 | | | | 1,156,250 | | | | 80,350 | | | | 3,889,817 | |
| | | 2012 | | | | 600,000 | | | | 534,360 | | | | 0 | | | | 839,125 | | | | 164,029 | | | | 2,137,513 | |
| | | | | | | | | | | | | | | | | | | | | | | | | | | | |
Mark Ryan | | | 2014 | | | | 123,077 | | | | 0 | | | | 0 | | | | 87,500 | | | | 598,237 | (14) | | | 808,814 | |
Former Executive Vice President and
Chief Information Officer (13) | | | 2013 | | | | 400,000 | | | | 23,953 | | | | 1,145,266 | | | | 831,250 | | | | 62,556 | | | | 2,463,026 | |
| | | 2012 | | | | 390,000 | | | | 9,154 | | | | 0 | | | | 569,125 | | | | 36,252 | | | | 1,004,530 | |
| (1) | Amounts included in this column reflect (a) discretionary payments to each of our Named Executive Officers in October 2014, April 2014, March 2013, and April 2012, and (b) payments to Mr. Bock in the form of quarterly retention payments in each quarter of 2012. The amounts in this column do not include, however, any amounts paid as annual incentive compensation (bonus), under the 2012 Executive Long-Term Incentive Plan (“2012 LTIP”) or the 2013 LTMIP (as described in footnote 3 below), which are reported separately in the column entitled “Non-Equity Incentive Plan Compensation.” |
| (2) | Amounts included in this column reflect the grant date fair value computed in accordance with FASB ASC Topic 718 for restricted equity units (“REUs”) with service and performance-based vesting conditions; share bonus awards that vested immediately; awards of class A-2 units; and restricted share units (“RSUs”), which took the form of time-based RSUs (“TRSUs”) and performance-based RSUs (“PRSUs”) in the 2013 grants and time-based RSUs (“RSUs”) and performance-based RSUs (“PSUs”) in the 2014 grants, with service and performance-based vesting conditions, granted in the relevant year. As a result, the amounts included in this column relating to grants in prior years do not cover the portion of awards for which the performance goals had not yet been established and communicated. Therefore, when the performance goals have been established and communicated, the grants are included in that year’s Stock Award figure, even though they were awarded in a prior year (e.g. the award of PRSUs to Messrs. Wilson, Emery, Ekert and Bock was made in 2013 but is reflected in the 2014 column). The corresponding maximum grant date fair value for the awards for the applicable year are as follows: for Mr. Wilson: $0 for 2012, $4,195,508 for 2013 and $15,475,156 for 2014; for Mr. Emery: $0 for 2012, $2,075,267 for 2013 and $7,172,344 for 2014; for Mr. Ekert: $0 for 2012, $1,946,368 for 2013 and $6,684,499 for 2014; for Mr. Minetola: $1,501,782 for 2014; for Mr. Bock: $0 for 2012, $1,991,353 for 2013 and $3,920,000 for 2014; and for Mr. Ryan: $0 for 2012, $1,145,266 for 2013 and $0 for 2014. Related fair values consider the right to receive dividends in respect of such equity awards, and, accordingly, dividends paid are not separately reported in this table. Assumptions used in the calculation of these amounts are included in footnote 16, “Equity-Based Compensation,” to the consolidated financial statements included in this document. |
| (3) | Amounts included in this column include amounts paid as annual incentive compensation under our performance-based bonus plan, the performance and time-based amounts paid under the 2012 LTIP, and the 2013 LTMIP (as described in the immediately following sentence). In 2013, we granted awards to certain of our Named Executive Officers pursuant to the 2013 Long-Term Management Incentive Program (“2013 LTMIP”) based on the Compensation Committee’s conclusion that we needed additional incentives to retain our Named Executive Officers. The 2013 LTMIP awards to certain Named Executive Officers are paid based on continued employment and subject to compliance under the covenants in our debt agreements. The awards under this program vest semi-annually over three years (2013-2015), with 12.5% of the award eligible for vesting in each of the first four semi-annual vesting dates and 25% eligible for vesting in each of the last two semi-annual vesting dates. Following a change in control, which for the sake of clarity, did not include our public offering in 2014, earlier “good leavers” are eligible for pro rata vesting for the period of service plus 18 months. For Messrs. Wilson and Emery, amounts payable under the 2012 LTIP were expressed in US dollars, as the awards were made in US dollars, but those amounts were converted into British pounds at the time of payment, which was after the filing of the applicable year’sForm 10-K. Payments to Messrs. Wilson and Emery in respect of the 2013 LTMIP during 2013 and 2014 were also converted into |
103
| | British pounds at the time of payment; those amounts are converted back into US dollars in the table above using the exchange rates at the end of applicable year since the payments were made prior to the applicable year’s Form 10-K. |
| (4) | As detailed in footnote (2) above, the right to receive dividends in respect of equity awards is included in the FASB ASC Topic 718 value and, thus, any dividends paid to our Named Executive Officers are not included in All Other Compensation. |
| (5) | The amounts for 2014 include the value of certain grants that were granted in May 2013, but for which the performance criteria were not finalized and communicated to the executives until May 2014. The amounts relating to the grants approved in 2013 are as follows: $8,320,000 for Mr. Wilson, and $3,920,000 each for Messrs. Ekert, Emery and Bock. |
| (6) | All amounts expressed for Messrs. Wilson and Emery (with the exception of equity awards) were paid in British pounds and have been converted to US dollars at the applicable exchange rate for December 31 of the applicable year, i.e. 1.5593 US dollars to 1 British pound as of December 31, 2014, 1.6562 US dollars to 1 British Pound as of December 31, 2013, and 1.6255 US dollars to 1 British pound as of December 31, 2012. |
| (7) | Includes company matching pension contributions of $77,957, supplemental cash allowance in lieu of pension contributions of $50,677, travel allowance of $7,797, cash car allowance of $49,898, financial planning benefits of $2,885, and tax assistance of $11,292. |
| (8) | Includes company matching pension contributions of $66,146, supplemental cash allowance in lieu of pension contributions of $15,741, travel allowance of $7,797, car allowance benefits of $23,857, financial planning benefits of $1,559 and commuting benefits of $17,208. |
| (9) | Includes company matching 401(k) contributions of $15,600, car allowance benefits of $3,772, financial planning/tax preparation benefits of $13,474, tax assistance on such car allowance and financial planning/tax preparation benefits of $17,051, cash allowance for car benefits of $28,154, and cash allowance for financial planning benefits of $1,154. |
| (10) | Includes company 401(k) contributions of $865. |
| (11) | Mr. Bock’s employment with us terminated on October 1, 2014. |
| (12) | Includes company matching 401(k) contributions of $15,600, deferred compensation match on salary and bonus of $14,268, car allowance benefits of $5,473, financial planning/tax preparation benefits of $9,813, tax assistance on such car allowance and financial planning/tax preparation benefits of $14,094, and cash allowance for car benefits of $17,077. |
| (13) | Mr. Ryan’s employment with us terminated on April 18, 2014. |
| (14) | Includes company matching 401(k) contributions of $7,385, car allowance benefits of $6,546, financial planning/tax preparation benefits of $13,000, tax assistance on such car allowance and financial planning/tax preparation benefits of $15,714, severance pay and benefits of $553,631, and cash allowance for car benefits of $1,962. |
104
Grants of Plan-Based Awards During 2014
On September 5, 2014, effective upon our initial public offering, our Board of Directors approved a grant of Restricted Share Units (“RSUs”), Performance Share Units (“PSUs”) and time-based options under the 2014 Equity Plan to certain of our Named Executive Officers. In addition, on November 4, 2014, our Board of Directors approved a grant of RSUs, PSUs and time-based options to Mr. Minetola effective upon the commencement of his employment on December 1, 2014. The time-based RSUs will vest annually in four equal installments, the PSUs will cliff vest in three years based on our achievement of an adjusted earnings per share target that was established following the grant (and will have the possibility of an additional 100% vesting of the grant of such PSUs based on the achievement of a stretch target that was established), and the options will vest annually in four equal installments, subject to and on the terms and conditions set forth in the award agreements. These grants were denominated in a total dollar value that was converted into a number of RSUs, PSUs and options based upon our initial offering price or, in the case of Mr. Minetola, upon the closing price on the business day immediately prior to the commencement of his employment. The grants were allocated 25%, 50% and 25% into RSUs, PSUs and options, respectively. The total dollar value of such awards to our Named Executive Officers was as follows: Mr. Wilson—$4,400,000; Mr. Emery—$2,000,000; Mr. Ekert—$1,700,000 and Mr. Minetola—$1,000,000. For details about the FASB ASC Topic 718 values for these grants, please refer to the “Summary Compensation Table” and fn (2) to that table.
| | | | | | | | | | | | | | | | | | | | | | | | | | | | | | | | | | | | | | | | | | |
| | | | | | | | Estimated Potential Payouts
Under Non-Equity Incentive
Plan Awards (1) | | | Estimated Future
Payouts
Under Equity Plan
Awards | | | All Other
Stock
Awards:
Number
of Shares
of Stock
Units
(#) | | | All Other
Option
Awards:
Number of
Securities
Underlying
Options(#) | | | Exercise
or Base
Price of
Option
Awards
($/sh) | | | Grant
Date
Fair Value
of Stock
and Option
Awards
($) (3) | |
Name | | Type of Award | | Grant Date | | | Threshold
($) | | | Target
($) | | | Maximum
($) | | | Threshold
(#) | | | Target
(#) (2) | | | | | |
Gordon A. Wilson | | Non-Equity Incentive Plan | | | | | | | 500,000 | | | | 1,786,423 | | | | 3,072,845 | | | | | | | | | | | | | | | | | | | | | | | | | |
President, Chief Executive Officer and
Director | | RSUs(4) | | | 25 Sep 14 | | | | | | | | | | | | | | | | | | | | | | | | 68,750 | | | | | | | | | | | | 1,100,000 | |
| PSUs(5) | | | 25 Sep 14 | | | | | | | | | | | | | | | | 68,750 | | | | 137,500 | | | | | | | | | | | | | | | | 2,475,000 | |
| Options(6) | | | 25 Sep 14 | | | | | | | | | | | | | | | | | | | | | | | | | | | | 171,875 | | | | 16.00 | | | | 1,105,156 | |
| | | | | | | | | | | |
Philip Emery | | Non-Equity Incentive Plan | | | | | | | 200,000 | | | | 745,755 | | | | 1,291,510 | | | | | | | | | | | | | | | | | | | | | | | | | |
Executive Vice President and Chief
Financial Officer | | RSUs(4) | | | 25 Sep 14 | | | | | | | | | | | | | | | | | | | | | | | | 31,250 | | | | | | | | | | | | 500,000 | |
| PSUs(5) | | | 25 Sep 14 | | | | | | | | | | | | | | | | 31,250 | | | | 62,500 | | | | | | | | | | | | | | | | 1,125,000 | |
| Options6) | | | 25 Sep 14 | | | | | | | | | | | | | | | | | | | | | | | | | | | | 78,125 | | | | 16.00 | | | | 502,344 | |
| | | | | | | | | | | |
Kurt Ekert | | Non-Equity Incentive Plan | | | | | | | 225,000 | | | | 775,000 | | | | 1,325,000 | | | | | | | | | | | | | | | | | | | | | | | | | |
Executive Vice President and Chief
Commercial Officer | | RSUs(4) | | | 25 Sep 14 | | | | | | | | | | | | | | | | | | | | | | | | 26,563 | | | | | | | | | | | | 425,008 | |
| PSUs(5) | | | 25 Sep 14 | | | | | | | | | | | | | | | | 26,563 | | | | 53,125 | | | | | | | | | | | | | | | | 956,250 | |
| Options6) | | | 25 Sep 14 | | | | | | | | | | | | | | | | | | | | | | | | | | | | 66,406 | | | | 16.00 | | | | 426,991 | |
| | | | | | | | | | | |
Matthew Minetola | | Non-Equity Incentive Plan | | | | | | | 0 | | | | 0 | | | | 0 | | | | | | | | | | | | | | | | | | | | | | | | | |
Executive Vice President and Chief
Information Officer | | RSUs(4) | | | 1 Dec 14 | | | | | | | | | | | | | | | | | | | | | | | | 14,409 | | | | | | | | | | | | 249,996 | |
| PSUs(5) | | | 1 Dec 14 | | | | | | | | | | | | | | | | 14,409 | | | | 28,818 | | | | | | | | | | | | | | | | 499,992 | |
| Options(6) | | | 1 Dec 14 | | | | | | | | | | | | | | | | | | | | | | | | | | | | 36,023 | | | | 17.35 | | | | 251,171 | |
| | | | | | | | | | | |
Eric Bock | | Non-Equity Incentive Plan | | | | | | | 100,000 | | | | 550,000 | | | | 1,000,000 | | | | | | | | | | | | | | | | | | | | | | | | | |
Former Executive Vice President, Chief
Legal Officer and Chief Administrative Officer | | | | | | | | | | | | | | | | | | | | | | | | | | | | | | | | | | | | | | | | | | |
| | | | | | | | | | | |
| Mark Ryan | | Non-Equity Incentive Plan | | | | | | | 87,500 | | | | 87,500 | | | | 87,500 | | | | | | | | | | | | | | | | | | | | | | | | | |
Former Executive Vice President and Chief
Information Officer | | | | | | | | | | | | | | | | | | | | | | | | | | | | | | | | | | | | | | | | | | |
| (1) | As noted in footnote (3) to the Summary Compensation Table above, these amounts reflect our 2014 annual performance-based bonus plan and the 2013 LTMIP, as applicable. |
| (2) | For the PSUs that were granted in 2014, in the event that target is achieved, all of the PSUs will vest, with the potential for an additional 100% of PSUs vesting for over performance at the maximum set by our Board. |
| (3) | These amounts reflect maximum grant date value of the award computed in accordance with FASB ASC Topic 718. See footnote (2) to the Summary Compensation Table above. The Grant Date Fair Value of the September 2014 grant of PSUs is based upon the fair market value of $18 as of December 31, 2014, the date the performance targets were communicated to all participants. |
| (4) | The RSUs granted in 2014 vest over four years in annual installments. |
| (5) | The PSUs granted in 2014 will vest on October 15, 2017 based on our achievement of certain financial targets. The Grant Date Fair Value for the PSUs granted during 2014 is based on target performance, which would result in vesting of 100% of the underlying shares. |
| (6) | The options granted in 2014 vest over four years in annual installments. |
105
Employment Agreements
We have employment agreements with each of our Named Executive Officers, which supersede all prior understandings regarding their employment. We have also granted our Named Executive Officers equity-based awards The severance arrangements for our Named Executive Officers are described below under “—Potential Payments Upon Termination of Employment or Change in Control.”
Gordon A. Wilson, President and Chief Executive Officer
Travelport International Limited, our wholly-owned, indirect subsidiary, entered into a service agreement with Gordon A. Wilson on May 31, 2011 (as amended on November 7, 2012) in connection Mr. Wilson’s assumption of the role of President and Chief Executive Officer. The service agreement continues until it is terminated by either party giving to the other at least 12 months’ prior written notice. If full notice is not given, we will pay salary and benefits in lieu of notice for any unexpired period of notice, regardless of which party gave notice of termination. Mr. Wilson is eligible for a target annual bonus of 150% of his base salary. Mr. Wilson’s current base salary is £550,000.
Philip Emery, Executive Vice President and Chief Financial Officer
Travelport International Limited, our wholly-owned, indirect subsidiary, entered into a contract of employment with Mr. Emery effective October 1, 2009, as amended on March 28, 2011 and November 24, 2011. Mr. Emery’s employment agreement with us continues until it is terminated by either party giving to the other at least 12 months’ prior written notice. If full notice is not given, we will pay salary (and in certain circumstances following a change in control, target bonus) in lieu of notice for any unexpired period of notice, regardless of which party gave notice of termination. Mr. Emery is eligible for a target annual bonus of 100% of his base salary. Mr. Emery’s current base salary is £350,000.
Kurt Ekert, Executive Vice President and Chief Commercial Officer
Travelport, LP, our wholly-owned, indirect subsidiary, entered into an employment agreement with Kurt Ekert, as amended on November 23, 2011 and March 6, 2013, that has a one-year initial term commencing October 21, 2011. It provides for automatic one-year renewal periods upon the expiration of the initial term or any subsequent term, unless either party provides the notice of non-renewal at least 120 days prior to the end of the then-current term. Mr. Ekert is eligible for a target annual bonus of 100% of his base salary. Mr. Ekert’s current base salary is $550,000.
Matthew Minetola, Executive Vice President and Chief Information Officer
Travelport, LP, our wholly-owned, indirect subsidiary, entered into a letter agreement with Matthew Minetola, pursuant to which his employment with us commenced on December 1, 2014. Mr. Minetola is eligible for a target annual bonus of 100% of his base salary. Mr. Minetola’s current base salary is $375,000.
Eric J. Bock, Former Executive Vice President, Chief Legal Officer and Chief Administrative Officer
Pursuant to the employment agreement for Eric J. Bock, Mr. Bock was eligible for a target annual bonus of 100% of his base salary, which for 2014 was set at $600,000. On August 7, 2014, we entered into a transition and separation agreement with Mr. Bock, which provided for (i) the terms of Mr. Bock’s continued employment with us through October 1, 2014 (the “Transition Date”), (ii) Mr. Bock’s role in the transition of the Chief Legal Officer position to the United Kingdom so as to be co-located with our Chief Executive Officer and Chief Financial Officer, (iii) the transition of other Chief Administrative Officer responsibilities, and (iv) certain transition benefits.
As a general matter, Mr. Bock’s employment continued through the Transition Date under the terms of his employment agreement. Following the Transition Date, Mr. Bock executed a general release in favor of the Company and has continued to comply with his post-employment restrictive covenants and therefore received (or
106
will receive): (i) full vesting of certain TRSUs upon our initial public offering; (ii) vesting as of April 15, 2015 of 75% of certain PRSUs that would otherwise vest on April 15, 2015 if he remained employed with us (based on our actual performance through the applicable performance period), (iii) vesting as of January 1, 2016 of the remaining 25% of such PRSUs that would otherwise vest on April 15, 2015 (based on our actual performance through the applicable performance period); (iv) a pro rata portion of his 2014 annual bonus, based on Travelport’s actual performance (and paid when 2014 bonuses are paid generally in 2015); and (v) 36 months’ continued health and welfare coverage for Mr. Bock and his dependents, though such coverage shall cease if he obtains similar coverage with a new employer, although Mr. Bock did not elect to receive these benefits.
Mark Ryan, Former Executive Vice President and Chief Information Officer
Travelport, LP, our wholly-owned, indirect subsidiary, entered into an employment agreement with Mark Ryan, as amended on December 3, 2012, that had a one-year initial term commencing December 16, 2011. It provided for automatic one-year renewal periods upon the expiration of the initial term or any subsequent term, unless either party provides the notice of non-renewal at least 120 days prior to the end of the then-current term.
Effective March 10, 2014, Mr. Ryan became an advisor to the Company until April 18, 2014. Pursuant to such separation and the separation agreement (including a general release in favor of the Company) Mr. Ryan executed, Mr. Ryan received severance pay and benefits as set forth in his employment agreement, as well as vesting on the next semi-annual vesting date under the 2013 LTMIP. Mr. Ryan was eligible for a target annual bonus of 100% of his annual base salary, and his base annual salary was $400,000 during fiscal year 2014.
Restrictive Covenants
As a result of the restrictive covenants contained in their employment agreements and/or equity award agreements, each of the Named Executive Officers has agreed not to disclose, or retain and use for his or her own benefit or benefit of another person our confidential information. Each Named Executive Officer has also agreed not to directly or indirectly compete with us, not to solicit our employees or clients, engage in, or directly or indirectly manage, operate, or control or join our competitors, or compete with us or interfere with our business or use his or her status with us to obtain goods or services that would not be available in the absence of such a relationship to us. Each equity award agreement during their service as an executive officer provides that these restrictions are in place during their employment for two years thereafter. In the case of Messrs. Ekert, Bock and Ryan, these restrictions in their employment agreements are (or were, in the case of Messrs. Bock and Ryan) effective during their employment and for a period of two years thereafter. In the case of Messrs. Wilson and Emery, the restrictions contained in their employment agreements are effective during their employment and for a period of 12 months thereafter. Should we exercise our right to place Messrs. Wilson or Emery on “garden leave,” the period of time that they are on such leave will be subtracted from and thereby reduce the post-termination length of time that they are subject to these restrictive covenants in their employment agreement.
In addition, each of the Named Executive Officers has agreed to grant us a perpetual, non-exclusive, royalty-free, worldwide, and assignable and sub-licensable license over all intellectual property rights that result from their work while employed with us.
107
Outstanding Equity Awards at 2014 Fiscal-Year End
| | | | | | | | | | | | | | | | | | | | | | | | |
| | | | | Option Awards | | Stock Awards | |
Name | | Type of Award | | Number of
Securities
Underlying
Unexercised
Options (#)
Unexercisable | | Option
Exercise
Price
($) | | Option
Expiration
Date | | Number of
Shares or
Units of
Stock that
have not
Vested (#) | | | Market
Value of
Shares or
Units of
Stock that
have not
Vested ($) | | | Equity Incentive
Plan Awards:
Number of
Unearned Shares,
Units or Other
Rights that have
not Vested (#) | | | Equity Incentive Plan
Awards: Market or
Payout Value of
Unearned Shares,
Units or Other
Rights that
have not
Vested ($) | |
Gordon A. Wilson
President, Chief Executive | | 2013 PRSUs(1)
2014 RSUs(2) | | | | | | | | | 68,750 | | | | 1,237,500 | | | | 416,000 | | | | 7,488,000 | |
Officer and Director | | 2014 PSUs(3) | | | | | | | | | | | | | | | | | 137,500 | | | | 2,475,000 | |
| | 2014 Options(4) | | 171,875 | | 16.00 | | 9/25/2024 | | | | | | | | | | | | | | | | |
Philip Emery
Executive Vice President and | | 2013 PRSUs(1) | | | | | | | | | | | | | | | | | 196,000 | | | | 3,528,000 | |
| | 2014 RSUs(2) | | | | | | | | | 31,250 | | | | 562,500 | | | | | |
Chief Financial Officer | | 2014 PSUs(3) | | | | | | | | | | | | | | | | | 62,500 | | | | 1,125,000 | |
| | 2014 Options(4) | | 78,125 | | 16.00 | | 9/25/2024 | | | | | | | | | | | | | | | | |
Kurt Ekert | | 2013 PRSUs(1) | | | | | | | | | | | | | | | | | 196,000 | | | | 3,528,000 | |
Executive Vice President and Chief | | 2014 RSUs(2) | | | | | | | | | 25,653 | | | | 461,754 | | | | | |
Commercial Officer | | 2014 PSUs(3) | | | | | | | | | | | | | | | | | 53,125 | | | | 956,250 | |
| | 2014 Options(4) | | 66,406 | | 16.00 | | 9/25/2024 | | | | | | | | | | | | | | | | |
Matthew Minetola
Executive Vice President and Chief | | 2014 RSUs(2)
2014 PSUs(3) | | | | | | | | | 14,409 | | | | 259,362 | | | | 28,818 | | | | 518,724 | |
Information Officer | | 2014 Options(4) | | 36,023 | | 17.35 | | 12/1/2024 | | | | | | | | | | | | | | | | |
Eric J. Bock | | | | | | | | | | | | | | | | | | | | | | | | |
Former Executive Vice President, Chief Legal Officer and Chief Administrative Officer | | 2013 PRSUs(5) | | | | | | | | | | | | | | | | | 196,000 | | | | 3,528,000 | |
| (1) | The PRSUs granted under the 2013 LTIP will vest on April 15, 2015 based on our achievement of certain financial targets over 2013 and 2014. |
| (2) | The RSUs granted in 2014 vest over annually over four years. |
| (3) | The PSUs granted in 2014 will vest on October 15, 2017 based on our achievement of certain financial targets. |
| (4) | The options granted in 2014 vest over four years in annual installments. |
| (5) | Pursuant to our transition agreement with Mr. Bock, 75% of the PRSUs that would otherwise have vested (based on our achievement of certain financial targets) will vest on April 15, 2015, with the remaining 25% vesting (also based on our achievement of the same financial targets) on January 1, 2016. |
108
Option Exercises and Stock Vested in 2014
| | | | | | | | | | |
Name | | Plan or Award Type | | Number of Company
Shares Becoming
Vested During
the Year(1) | | | Value Realized on
Vesting ($) | |
Gordon A. Wilson | | | | | | | | | | |
President, Chief Executive Officer and Director | | 2011 RSUs
2013 TRSUs | |
| 6,927
693,334 |
| |
| 24,246
10,781,338 |
|
Philip Emery | | | | | | | | | | |
Executive Vice President and Chief Financial Officer | | 2011 RSUs
2013 TRSUs | |
| 5,404
326,667 |
| |
| 18,914
5,079,678 |
|
Kurt Ekert | | | | | | | | | | |
Executive Vice President and Chief Commercial Officer | | 2011 RSUs
2013 TRSUs | |
| 2,766
326,667 |
| |
| 9,682
5,079,678 |
|
Eric J. Bock | | | | | | | | | | |
Former Executive Vice President, Chief Legal Officer and Chief Administrative Officer | | 2011 RSUs
2013 TRSUs | |
| 4,419
326,667 |
| |
| 15,465
5,079,678 |
|
Mark Ryan | | | | | | | | | | |
Former Executive Vice President and Chief Information Officer | | 2011 RSUs
2013 TRSUs | |
| 3,230
35,556 |
| |
| 11,305
488,888 |
|
| (1) | The vesting events reflected include the January 1, 2014 vesting of RSUs granted in 2011, the April 15, 2014 vesting of TRSUs granted in 2013, and, as applicable, the accelerated vesting of TRSUs upon our offering in September 2014. |
Pension Benefits in 2014
None of our Named Executive Officers are currently participating in a defined benefit plan sponsored by us or our subsidiaries and affiliates.
Nonqualified Deferred Compensation in 2014
All amounts disclosed in this table relate to our Travelport Officer Deferred Compensation Plan (the “Deferred Compensation Plan”). The Deferred Compensation Plan allows certain executives in the United States to defer a portion of their compensation until a later date (which can be during or after their employment), and to receive an employer match on their contributions. In 2014, this compensation included base salary, deal/transaction bonuses, discretionary bonuses and annual bonuses, and the employer match was 100% of employee contributions of up to 6% of the relevant compensation amount. Each participant can elect to receive a single lump payment or annual installments over a period elected by the executive of up to 10 years.
109
In contrast to the Summary Compensation Table and other tables that reflect amounts paid in respect of 2014, the table below reflects deferrals and other contributions occurring in 2014 regardless of the year for which the compensation relates, i.e. the amounts below include amounts deferred in 2014 in respect of 2013 but not amounts deferred in 2015 in respect of 2014.
| | | | | | | | | | | | | | | | | | | | | | | | |
Name | | Beginning
Balance at
Prior FYE
(12/31/2013)
($) | | | Executive
Contributions
in Last FY
($) | | | Company
Contributions
in Last FY
($) | | | Aggregate
Earnings
in Last FY
($) | | | Aggregate
Withdrawals/
Distributions
($) | | | Aggregate
Balance
at Last FYE
(12/31/2014)
($) | |
Gordon A. Wilson | | | — | | | | — | | | | — | | | | — | | | | — | | | | — | |
President, Chief Executive Officer
and Director (1) | | | | | | | | | | | | | | | | | | | | | | | | |
Philip Emery | | | — | | | | — | | | | — | | | | — | | | | — | | | | — | |
Executive Vice President and Chief
Financial Officer (1) | | | | | | | | | | | | | | | | | | | | | | | | |
Kurt Ekert | | | 2,834 | | | | 0 | | | | 0 | | | | 188 | | | | 0 | | | | 3,022 | |
Executive Vice President and Chief
Commercial Officer (2) | | | | | | | | | | | | | | | | | | | | | | | | |
Matthew Minetola | | | 0 | | | | 0 | | | | 0 | | | | 0 | | | | 0 | | | | 0 | |
Executive Vice President and Chief
Information Officer | | | | | | | | | | | | | | | | | | | | | | | | |
Eric J. Bock | | | 1,160,976 | | | | 14,268 | | | | 14,268 | | | | 50,021 | | | | 0 | | | | 1,239,532 | |
Former Executive Vice President,
Chief Legal Officer and Chief | | | | | | | | | | | | | | | | | | | | | | | | |
Administrative Officer | | | | | | | | | | | | | | | | | | | | | | | | |
Mark Ryan | | | 0 | | | | 0 | | | | 0 | | | | 0 | | | | 0 | | | | 0 | |
Former Executive Vice President and
Chief Information Officer | | | | | | | | | | | | | | | | | | | | | | | | |
| (1) | Each of Messrs. Wilson and Emery participate in a United Kingdom defined contribution pension scheme that is similar to a 401(k) plan and, therefore, is not included in this table. |
| (2) | Mr. Ekert was also a participant in the Travelport Americas, LLC Savings Restoration Plan (the “Savings Restoration Plan”), a non-qualified deferred compensation plan in which certain US executives could contribute until January 1, 2008. The balances in this Non-Qualified Deferred Compensation table reflect the Savings Restoration Plan only for Mr. Ekert, as he did not have a balance in the Deferred Compensation Plan in 2014. |
110
Potential Payments Upon Termination of Employment or Change in Control
The following table describes the potential payments and benefits under our compensation and benefit plans and arrangements to which our Named Executive Officers would be entitled upon termination of employment on December 31, 2014. For Mr. Ryan, the table represents what he actually received (or is going to receive) upon termination, as the other situations are not applicable. For additional details of his actual separation payments, as well as the potential payments to Mr. Bock, see above under “Employment Agreements.”
| | | | | | | | | | | | | | | | |
Current | | Cash
Severance
Payment ($) | | | Continuation
of Certain
Benefits
(Present
value) ($) | | | Acceleration
and
Continuation
of Equity
(Unamortized
Expense as of
12/31/2014) ($) | | | Total
Termination
Benefits ($) | |
Gordon A. Wilson | | | | | | | | | | | | | | | | |
Voluntary retirement | | | 0 | | | | 0 | | | | 0 | | | | 0 | |
Involuntary termination | | | 4,288,075 | | | | 0 | | | | 8,962,542 | | | | 13,250,617 | |
Change in Control (CIC) | | | 0 | | | | 0 | | | | 0 | | | | 0 | |
Involuntary or good reason termination after CIC | | | 5,288,075 | | | | 0 | | | | 11,544,250 | | | | 16,832,325 | |
Philip Emery | | | | | | | | | | | | | | | | |
Voluntary retirement | | | 0 | | | | 0 | | | | 0 | | | | 0 | |
Involuntary termination | | | 1,091,510 | | | | 0 | | | | 4,198,252 | | | | 5,289,762 | |
Change in Control (CIC) | | | 0 | | | | 0 | | | | 0 | | | | 0 | |
Involuntary or good reason termination after CIC | | | 1,091,510 | | | | 0 | | | | 5,371,750 | | | | 6,463,260 | |
Kurt Ekert | | | | | | | | | | | | | | | | |
Voluntary retirement | | | 0 | | | | 0 | | | | 0 | | | | 0 | |
Involuntary termination | | | 1,650,000 | | | | 46,111 | | | | 4,097,716 | | | | 5,793,827 | |
Change in Control (CIC) | | | 0 | | | | 0 | | | | 0 | | | | 0 | |
Involuntary or good reason termination after CIC | | | 2,650,000 | | | | 46,111 | | | | 5,095,196 | | | | 7,791,307 | |
Mathew Minetola | | | | | | | | | | | | | | | | |
Voluntary retirement | | | 0 | | | | 0 | | | | 0 | | | | 0 | |
Involuntary termination | | | 406,250 | | | | 0 | | | | 303,443 | | | | 709,693 | |
Change in Control (CIC) | | | 0 | | | | 0 | | | | 0 | | | | 0 | |
Involuntary or good reason termination after CIC | | | 406,250 | | | | 0 | | | | 801,501 | | | | 1,207,751 | |
Mark Ryan | | | | | | | | | | | | | | | | |
Involuntary termination | | | 605,856 | | | | 35,275 | | | | 0 | | | | 641,131 | |
Accrued Pay and Regular Retirement Benefits. The amounts shown in the table above do not include payments and benefits to the extent they are provided on a non-discriminatory basis to our salaried employees generally upon termination of employment, such as:
| | • | | accrued salary and vacation pay (if applicable); |
| | • | | earned but unpaid bonuses; and |
| | • | | distributions of plan balances under our 401(k) plan. |
Deferred Compensation. The amounts shown in the table do not include distributions of plan balances under our Deferred Compensation Plan and Savings Restoration Plan. Those amounts are shown in the Nonqualified Deferred Compensation in 2014 table above.
Death and Disability. A termination of employment due to death or disability does not entitle the Named Executive Officers to any payments or benefits that are not available to salaried employees generally, except a pro-rata portion of their annual bonus for the year of death or disability in the case of Mr. Ekert.
111
Involuntary and Constructive Termination and Change-in-Control Severance Pay. Our Named Executive Officers are entitled to severance pay and benefits (as set forth in more detail below) in the event that their employment is terminated by us without cause or, in the case of Mr. Ekert, if he resigns as a result of a constructive termination or, in the case of Messrs. Wilson and Emery, a resignation due to fundamental breach of contract. The amounts shown in the table are for such “involuntary or constructive terminations” and are based on the following assumptions and provisions in the employment agreements:
| | • | | Covered terminations generally. Eligible terminations include an involuntary termination for reasons other than cause, or, as applicable, a voluntary resignation by the executive as a result of a constructive termination or fundamental breach of contract. |
| | • | | Covered terminations following a Change in Control. Eligible terminations include an involuntary termination for reasons other than cause, or, as applicable, a voluntary resignation by the executive as a result of a constructive termination or fundamental breach of contract following a change in control. |
| | • | | Definitions of Cause and Constructive Termination (only applicable to Mr. Ekert ) |
| | • | | A termination of the executive by us is for cause if it is for any of the following reasons: |
| | • | | the executive’s failure substantially to perform executive’s duties for a period of 10 days following receipt of written notice from the Company of such failure; |
| | • | | theft or embezzlement of company property or dishonesty in the performance of the executive’s duties; |
| | • | | an act or acts on executive’s part constituting (x) a felony under the laws of the United States or state thereof or (y) a crime involving moral turpitude; |
| | • | | the executive’s willful malfeasance or willful misconduct in connection with his duties or any act or omission which is materially injurious to our financial condition or business reputation; or |
| | • | | the executive’s breach of restrictive covenants. |
| | • | | A termination by the executive is as a result of constructive termination if it results from, among other things: |
| | • | | any material reduction in the executive’s base salary or annual bonus (excluding any change in value of equity incentives or a reduction affecting substantially all similarly situated executives); |
| | • | | our failure to pay compensation or benefits when due; |
| | • | | material and sustained diminution to the executive’s duties and responsibilities, except in certain circumstances; |
| | • | | the primary business office for the executive being relocated by more than 50 miles from Parsippany, New Jersey; or |
| | • | | our election not to renew the initial employment term or any subsequent extension thereof (except as a result of the executive’s reaching retirement age, as determined by our policy). |
| | • | | Cash severance payment. For Mr. Wilson, this represents two times the sum of his base salary and target annual bonus. For Mr. Emery, this represents 12 months of salary plus pro-rata target bonus for 2014. For Mr. Ekert, this represents a cash severance payment of two times his base annual salary (and, in certain circumstances following a change in control, one times his target bonus) plus a pro-rata target bonus for 2014. For Mr. Minetola, this represents a cash severance payment of one times his base annual salary plus pro-rata target bonus for 2014. We are also required to give Messrs. Wilson and Emery 12 months of notice or pay in lieu of notice. In the case of Messrs. Emery, Ekert and Minetola, they must execute, deliver and not revoke a separation agreement and general release in order to receive these benefits. In addition, with respect to those Named Executive Officers who received an award under the 2013 LTMIP, for each Named Executive Officer who is terminated without cause or as result of a constructive termination within 18 months after a change in control, this represents |
112
| | accelerated vesting for time served since the last vesting date (December 1, 2014) plus 18 months over the remainder of the three year vesting period,i.e. 100% of unvested amounts based on a December 31, 2014 termination date in such circumstances. All of these cash payments are payable in a lump sum following termination of employment. |
| | • | | Continuation of health, welfare and other benefits (Mr. Ekert only). Represents, following a covered termination, continued health and welfare benefits (at active employee rates) and financial planning benefits, in each case for one year, as well as applicable tax assistance on such benefits, provided he has executed, delivered and not revoked the separation agreement and general release. |
| | • | | Acceleration and continuation of equity awards. For the 2013 LTIP PRSUs, upon a termination without cause, as the result of a constructive termination, death or disability, our currently-employed Named Executive Officers who received such grants will receive vesting of unvested PRSUs at target (100%) based on pro-rata time served in the two year vesting period plus an additional 12 months, up to a maximum of 100%. As a result, a termination on December 31, 2014 results in vesting of 100% (31.5/24 ths ) of the PRSUs. Upon a termination without cause or as the result of a constructive termination within 18 months of a change in control, all unvested PRSUs are vested. For the 2014 grants of RSUs, PSUs and options, upon a termination by the Company without cause, our currently-employed Named Executive Officers receive pro-rata vesting (in the case of the RSUs, since the last vesting date) for time served plus an additional 12 months, with PSUs based on the actual EPS Goal result (which, for purposes of the table above, assuming result at Target), As a result, a termination on December 31, 2014 results in 30% (14.5/48ths) for RSUs and options and 40% (14.5/36ths) for PSUs. In addition, for upon a termination without cause or as the result of a constructive termination, in either case following a change in control, our currently-employed Named Executive Officers will vest in all RSUs, PSUs (at Target) and options granted in 2014. Finally, any accelerated vesting of outstanding equity awards is subject to the executive’s execution of a suitable separation agreement and general release. |
| | • | | Payments Upon Change in Control Alone. The change in control provisions in the current employment agreements and equity award agreements relating to outstanding awards for our currently-employed Named Executive Officers do not provide for any special vesting upon a change in control alone, and severance payments are made only if the executive suffers a covered termination of employment. |
Compensation of Directors
As set forth below, some of our current directors receive compensation for their service as a director and all of our directors receive reimbursement of expenses incurred from their attendance at meetings of our Board of Directors. Directors who are also our employees receive no separate compensation for service on the Board of Directors.
In connection with our initial public offering, our Board of Directors adopted a compensation program for our non-employee directors (the Independent Director Compensation Policy). Pursuant to the Independent Director Compensation Policy, each member of our Board of Directors who is not our employee will receive the following cash compensation for service as a Board member, as applicable:
| | • | | $75,000 per year for service as a Board member (other than the Chairman of the Board of Directors); |
| | • | | $25,000 per year for service as chairperson of the Audit Committee and $20,000 per year for service as chairperson of the Compensation Committee or the Nominating and Corporate Governance Committee; and |
| | • | | $10,000 per year for service as a member of the Audit Committee, $10,000 per year for service as a member of the Compensation Committee and $10,000 per year for service as a member of the Nominating and Corporate Governance Committee. |
In addition, pursuant to the Independent Director Compensation Policy, our non-employee directors (other than the Chairman of the Board of Directors) will receive annual, automatic, non-discretionary grants of RSUs (with one-year cliff vesting) with an initial value of $125,000.
113
As compensation for his service as Chairman of our Board of Directors, effective upon our initial public offering, Mr. Steenland receives $150,000 per year payable in cash and $325,000 payable in RSUs with one-year cliff vesting for his service as Chairman of the Board of Directors, which is inclusive of his services on any committees. In addition, effective upon our initial public offering in 2014, the previously approved (in 2013) grant of options to purchase 320,000 of our common shares at an exercise price of $9.375 per share for Mr. Steenland, which were previously split equally between (i) time-based vesting and (ii) time and performance vesting, were deemed to have met their performance criteria and converted fully into time-based options, with 50% vesting on April 15, 2015 and the remaining 50% vesting on April 15, 2016, subject to Mr. Steenland’s continuous service as our Chairman, unless earlier vested pursuant to the terms of the award agreement.
Our Independent Director Compensation Policy provides that the equity awards shall be granted under, and shall be subject to, the terms and provisions of our 2014 Plan and shall be granted subject to the execution and delivery of award agreements.
It is expected that each non-employee director shall own shares of the Company’s stock equal in value to three times the annual Board cash retainer, except in the case of the Chairman of the Board of Directors, whose ownership of the shares of the Company’s stock shall be equal to four times the annual Board cash retainer. The Compensation Committee shall periodically review the stock ownership guidelines for non-employee directors. Generally, each non-employee director has five years from the date they become subject to the guidelines to meet the applicable ownership threshold.
The following table contains compensation information for our non-employee directors for the year ended December 31, 2014:
| | | | | | | | | | | | | | | | | | | | |
Name | | Year | | | Fee Earned or
Paid in Cash
($) | | | RSU
Awards ($)(1) | | | Option
Awards ($)(1)(2) | | | Total
($)(3) | |
Douglas M. Steenland, Chairman | | | 2014 | | | | 296,739 | | | | 325,000 | | | | 2,180,000 | | | | 2,801,739 | |
Douglas Hacker, Director | | | 2014 | | | | 27,962 | | | | 125,000 | | | | 0 | | | | 152,962 | |
Elizabeth Buse, Director | | | 2014 | | | | 22,636 | | | | 125,000 | | | | 0 | | | | 147,636 | |
Michael Durham, Director | | | 2014 | | | | 26,630 | | | | 125,000 | | | | 0 | | | | 151,630 | |
Gavin Baiera, Director | | | 2014 | | | | 0 | | | | 0 | | | | 0 | | | | 0 | |
Gregory Blank, Director | | | 2014 | | | | 0 | | | | 0 | | | | 0 | | | | 0 | |
Jeff Clarke, Former Director | | | 2014 | | | | 1,389 | | | | 0 | | | | 0 | | | | 1,389 | |
Scott McCarty, Former Director | | | 2014 | | | | 0 | | | | 0 | | | | 0 | | | | 0 | |
| (1) | As with the stock awards set forth in the Summary Compensation Table above, and consistent with note (2) to that table, amounts included in this column reflect the grant date fair value computed in accordance with FASB ASC Topic 718. |
| (2) | For more details about the options we granted to Mr. Steenland in 2013 and their treatment in 2014, see above. |
| (3) | Reflects all fees paid to certain of our directors with respect to 2014 but does not include travel or other business-related reimbursements. |
114
ITEM 12.SECURITY OWNERSHIP OF CERTAIN BENEFICIAL OWNERS AND MANAGEMENT AND RELATED STOCKHOLDER MATTERS
The following table sets forth information regarding the beneficial ownership of our common shares as of February 13, 2015 with respect to:
| | • | | each beneficial owner of more than 5% of our issued and outstanding common shares; |
| | • | | each of our Named Executive Officers; |
| | • | | each of our directors; and |
| | • | | all of our directors and our executive officers as a group. |
The amounts and percentages of shares beneficially owned are reported on the basis of SEC regulations governing the determination of beneficial ownership of securities. Under SEC rules, a person is deemed to be a “beneficial owner” of a security if that person has or shares voting power or investment power, which includes the power to dispose of or to direct the disposition of such security. A person is also deemed to be a beneficial owner of any securities of which that person has a right to acquire beneficial ownership within 60 days. Securities that can be so acquired are deemed to be outstanding for purposes of computing such person’s ownership percentage, but not for purposes of computing any other person’s percentage. Under these rules, more than one person may be deemed to be a beneficial owner of the same securities and a person may be deemed to be a beneficial owner of securities as to which such person has no economic interest.
Except as otherwise indicated in the footnotes below, each of the beneficial owners has, to our knowledge, sole voting and investment power with respect to the indicated common shares. Unless otherwise noted, the address of each beneficial owner is Axis One, Axis Park, Langley, Berkshire, United Kingdom SL3 8AG.
Funds affiliated with Blackstone and certain members of our management beneficially own common shares indirectly through their holdings in TDS Investor (Cayman) L.P., a Cayman limited partnership, (“TDS Investor”). As of February 13, 2015, TDS Investor beneficially owned 12,504,740, or approximately 10.3%, of our outstanding common shares. Other entities and certain members of our management own common shares directly in us.
| | | | | | | | |
Name and Address of Beneficial Owner | | Number of Common Shares
Beneficially Owned(1) | | | Percentage of Common Shares
Beneficially Owned(1) | |
Angelo, Gordon Funds(2) | | | 15,236,979 | | | | 12.6 | % |
FMR LLC(3) | | | 11,926,548 | | | | 9.82 | % |
Amalgamated Gadget, L.P.(4) | | | 9,641,471 | | | | 7.9 | % |
Blackstone Funds(5) | | | 8,599,309 | | | | 7.08 | % |
Morgan Stanley(6) | | | 7,471,343 | | | | 6.15 | % |
Solus Alternative Asset Management LP(7) | | | 6,351,714 | | | | 5.23 | % |
Gordon A. Wilson | | | 589,960 | | | | * | |
Philip Emery | | | 252,644 | | | | * | |
Kurt Ekert | | | 217,595 | | | | * | |
Matthew Minetola | | | 0 | | | | * | |
Thomas Murphy | | | 0 | | | | * | |
Douglas M. Steenland | | | 0 | | | | * | |
Gavin Baiera(8) | | | 0 | | | | * | |
Gregory L. Blank(9) | | | 0 | | | | * | |
Elizabeth L. Buse | | | 0 | | | | * | |
Michael J. Durham | | | 10,000 | | | | * | |
Douglas A. Hacker | | | 15,625 | | | | * | |
All directors and executive officers as a group (11 individuals)(10) | | | 1,085,824 | | | | * | |
| (1) | Includes shares (i) held indirectly through holdings in TDS Investor and (ii) held directly. |
115
| (2) | Reflects beneficial ownership of 1,084,796 common shares held by AG Super Fund International Partners, L.P., 13,878,600 common shares held by Silver Oak Capital, L.L.C., 123,149 common shares held by AG Capital Recovery Partners VI LP, 54,717 common shares held by AG Capital Recovery Partners VII LP, 11,073 common shares held by AG Eleven Partners, 3,093 common shares held by AG MM LP, 2,594 common shares held by AG Princess LP, 74,069 shares held by AG Super Fund LP and 4,888 common shares held by Nutmeg Partners LP (collectively, the “Angelo, Gordon Funds”). The address of the Angelo, Gordon Funds is c/o Angelo, Gordon & Co., L.P., 245 Park Avenue—26th Floor, New York, NY 10167. |
| (3) | Based solely on the Schedule 13G filed by FMR LLC with the SEC on February 13, 2015. The address of FMR LLC is 245 Summer Street, Boston, Massachusetts 02210. |
| (4) | Based on the Schedule 13G filed by Amalgamated Gadget, L.P. with the SEC on February 3, 2015. Reflects ownership of the common shares by Amalgamated Gadget, L.P. (“Amalgamated”) for and on behalf of two funds, R2 Investments, LDC and its wholly owned subsidiary, Q5-R5 Trading, Ltd., pursuant to an investment management agreement. Pursuant to such agreement, Amalgamated has sole voting and dispositive power of such common shares, and such funds have no beneficial ownership of such common shares. The address of Amalgamated is 301 Commerce Street—Suite 3200, Fort Worth, Texas 76102. |
| (5) | Reflects ownership of limited partnership units in TDS Investor, which wholly owns Travelport Intermediate Limited, which owns these common shares directly. The general partner of TDS Investor is TDS Investor (Cayman) GP Ltd. (“TDS GP”). TDS GP is collectively controlled by Blackstone Capital Partners (Cayman) V L.P. (“BCP V”), Blackstone Capital Partners (Cayman) V-A L.P. (“BCP V-A”), BCP (Cayman) V-S L.P. (“BCP V-S”) and BCP V Co-Investors (Cayman) L.P. (collectively with BCP V, BCP V-A and BCP V-S, the “BCP Funds”), Blackstone Family Investment Partnership (Cayman) V L.P. (“BFIP V”) and Blackstone Participation Partnership (Cayman) V L.P. (collectively with BFIP V, the “Blackstone Funds”) and Blackstone Family Investment Partnership (Cayman) V-SMD L.P. (“BFIP V-SMD”). Blackstone Management Associates (Cayman) V. L.P. (“BMA”) is the general partner of each of the BCP Funds. The general partner of each of Blackstone Funds and a general partner and majority in interest owner of BMA is BCP V GP L.L.C. Blackstone Holdings III L.P. is the sole member of BCP V GP L.L.C. The general partner of Blackstone Holdings III L.P. is Blackstone Holdings III GP L.P. The general partner of Blackstone Holdings III GP L.P. is Blackstone Holdings III GP Management L.L.C. The sole member of Blackstone Holdings III GP Management L.L.C. is The Blackstone Group L.P. The general partner of The Blackstone Group L.P. is Blackstone Group Management L.L.C. Blackstone Group Management L.L.C. is wholly owned by Blackstone’s senior managing directors and controlled by its founder, Stephen A. Schwarzman. The general partner of BFIP V-SMD is Blackstone Family GP L.L.C. Blackstone Family GP L.L.C. is wholly owned by Blackstone’s senior managing directors and controlled by its founder, Mr. Schwarzman. Each of such Reporting Persons may be deemed to beneficially own the common shares beneficially owned by Travelport Intermediate Limited, but each (other than Travelport Intermediate Limited to the extent of its direct holdings) disclaims beneficial ownership of such common shares. The address of the Blackstone affiliated persons listed in this footnote is c/o the Blackstone Group L.P., 345 Park Avenue, New York, NY, 10154. |
| (6) | Based solely on the Schedule 13G/A filed by Morgan Stanley with the SEC on February 9, 2015. The address of Morgan Stanley is 1585 Broadway, New York, NY 10036. |
| (7) | Based solely on the Schedule 13G filed by Solus Alternative Asset Management LP, Solus GP LLC and Christopher Pucillo (together, the “Solus Funds”) with the SEC on February 12, 2015. The address of the Solus Funds is 410 Park Avenue, 11th Floor, New York, NY 10022. |
| (8) | Mr. Baiera, a director of the Company, is a Managing Director of Angelo, Gordon & Co, L.P. |
| (9) | Mr. Blank, a director of the Company and TDS Investor, is a Principal of The Blackstone Group. Mr. Blank disclaims beneficial ownership of any shares owned directly or indirectly by the Blackstone Funds. |
| (10) | Shares beneficially owned by the Blackstone Funds and the Angelo, Gordon Funds have been excluded for purposes of the presentation of directors and executive officers as a group. |
116
Securities Authorized for Issuance under Equity Compensation Plans
The following table provides information about our common shares that may be issued upon the exercise of options and restricted stock units (time-based and performance-based) under our existing equity compensation plans as of December 31, 2014:
| | | | | | | | | | | | |
Plan Category | | Number of Securities to be
Issued Upon Exercise of
Outstanding Options,
Warrants, Rights and
Restricted Stock Units(a) | | | Weighted-Average Exercise
Price of Outstanding Options,
Warrants and Rights
(Excluding Restricted Stock
Units) ($) | | | Number of Securities
Remaining Available for
Future Issuance Under
Equity Compensation Plans
(Excluding Securities
Reflected in First Column)(b) | |
Equity compensation plans approved by security holders | | | — | | | | — | | | | — | |
Equity compensation plans not approved by security holders | | | 4,467,293 | | | $ | 14.37 | | | | 7,281,945 | |
Total | | | 4,467,293 | | | $ | 14.37 | | | | 7,281,945 | |
| a) | Includes options and other awards granted under the follow plans established prior to our initial public offering: Travelport Worldwide Limited 2013 Equity Plan and Travelport Worldwide Limited 2014 Omnibus Incentive Plan. |
| b) | Represents 367,063 common shares available for issuance under the Travelport Worldwide Limited 2013 Equity Plan, 4,514,882 common shares available for issuance under the Travelport Worldwide Limited 2014 Omnibus Incentive Plan and 2,400,000 common shares available for issuance under the Travelport Worldwide Limited 2014 Employee Stock Purchase Plan. Does not include common shares that may be issued to management pursuant to our 2013 Long-Term Management Incentive Program, at our option. The Travelport Worldwide Limited 2013 Equity Plan, the Travelport Worldwide Limited 2014 Omnibus Incentive Plan, the Travelport Worldwide Limited 2014 Employee Stock Purchase Plan and the 2013 Long-Term Management Incentive Program are more fully described above under Item 11 of Part III, “Executive Compensation.” |
117
ITEM 13.CERTAIN RELATIONSHIPS AND RELATED TRANSACTIONS, AND DIRECTOR INDEPENDENCE
Transaction and Monitoring Fee Agreement
In 2006, we entered into a Transaction and Monitoring Fee Agreement with an affiliate of Blackstone and an affiliate of Technology Crossover Ventures (“TCV”), pursuant to which we appointed Blackstone and TCV as our advisers to render monitoring, advisory and consulting services during the term of the Transaction and Monitoring Fee Agreement. In consideration for such services, we agreed to pay Blackstone and TCV an annual monitoring fee, or the Monitoring Fee, equal to the greater of $5 million or 1% of adjusted EBITDA (as defined in our senior secured credit agreement). The Monitoring Fee was agreed to be divided among Blackstone and TCV according to their respective beneficial ownership interests in us at the time any payment is made.
Pursuant to the Transaction and Monitoring Fee Agreement, Blackstone and TCV could elect at any time in connection with or in anticipation of a change of control or an initial public offering of us to receive, in lieu of annual payments of the Monitoring Fee, a single lump sum cash payment, or the Advisory Fee, equal to the then present value of all then current and future Monitoring Fees payable to Blackstone and TCV under the Transaction and Monitoring Fee Agreement. The Advisory Fee was agreed to be divided between Blackstone and TCV according to their respective beneficial ownership interests in us at the time such payment is made. In 2007, Blackstone and TCV elected to receive, in lieu of annual payments of the Monitoring Fee, the Advisory Fee in consideration of the termination of the appointment of Blackstone and TCV to render services pursuant to the Transaction and Monitoring Fee Agreement as of the date of such notice.
We agreed to reimburse Blackstone and TCV for out-of-pocket expenses incurred in connection with the Transaction and Monitoring Fee Agreement and to indemnify such entities for losses relating to the services contemplated by the Transaction and Monitoring Fee Agreement and the engagement of Blackstone and TCV pursuant to the Transaction and Monitoring Fee Agreement.
In 2008, we entered into a new Transaction and Monitoring Fee Agreement with Blackstone and TCV, pursuant to which Blackstone and TCV provide us monitoring, advisory and consulting services. Pursuant to the new agreement, payments made by us in 2008, 2010 and subsequent years are credited against the Advisory Fee, which Blackstone and TCV elected to receive in 2007, but did not become due at that time. In March 2013, in connection with our comprehensive refinancing, Blackstone and TCV agreed to a one-third reduction in the amount of fees that would otherwise be payable by us under the Transaction and Monitoring Fee Agreement. In addition, in March 2013, Blackstone and TCV agreed to share a portion of the Monitoring Fee and the Advisory Fee with Angelo Gordon and Q Investments.
In 2012, 2013 and 2014, we made payments of approximately $5 million, $6 million and $3.3 million, respectively, under the new Transaction and Monitoring Fee Agreement. The payments made in 2012, 2013 and 2014 were credited against the Advisory Fee that Blackstone and TCV elected to receive in 2007 and reduced the Advisory Fee to be paid to approximately $23 million. The remaining $23 million Advisory Fee became due, and was paid, upon the consummation of our initial public offering.
Investment and Cooperation Agreement
In 2006, we entered into an Investment and Cooperation Agreement with an affiliate of One Equity Partners (“OEP”). Pursuant to the Investment and Cooperation Agreement, OEP became subject to and entitled to the benefits of the Transaction and Monitoring Fee Agreement so that, to the extent that any transaction or management fee becomes payable to Blackstone or TCV, OEP will be entitled to receive its pro-rata portion of any such fee (based on relative equity ownership in the Company). Accordingly, any Monitoring Fees or Advisory Fee were divided among Blackstone, TCV, OEP, Angelo Gordon and Q Investments according to their respective beneficial ownership interests in us at the time any such payment was made.
118
Orbitz Worldwide
After an internal restructuring in 2008, we owned less than 50% of the outstanding common stock of Orbitz Worldwide, and, as a result, Orbitz Worldwide ceased to be our consolidated subsidiary. We have a subscriber services agreement and various other commercial arrangements with Orbitz Worldwide, and under those commercial agreements with Orbitz Worldwide, we earned approximately $5 million of revenue and recorded approximately $58 million of expense in 2014. Effective July 2014, we ceased to be a more than 5% shareholder in Orbitz Worldwide.
Commercial Transactions with Affiliated Companies
Blackstone has ownership interests in a broad range of companies and has affiliations with other companies. We have entered into commercial transactions on an arms-length basis in the ordinary course of our business with these companies, including the sale of goods and services and the purchase of goods and services. For example, in 2014, we recorded revenue of approximately $24 million and $7 million, respectively, from Hilton Hotels Corporation and Wyndham Hotel Group, which are Blackstone portfolio companies, in connection with travel commerce platform booking fees received. Other than as described herein, none of these transactions or arrangements is material.
In April 2012, we entered into an agreement with an affiliate of Blackstone, which was modified in November 2012, pursuant to which Blackstone agreed to provide us financial advisory and consulting services in connection with refinancing and related transactions. In February and June 2014, we entered into additional agreements with an affiliate of Blackstone, pursuant to which Blackstone agreed to provide us with financial advisory services in connection with, among other things, our various debt-for-equity exchange transactions, exchange offer and refinancing. During 2012, 2013 and 2014, we paid approximately $2 million, $7 million and $18 million, respectively, under these agreements.
In 2014, Morgan Stanley provided us with various investment banking, financing and other financial advisory services in connection with our sale of Orbitz Worldwide shares in May 2014, our initial public offering and our debt refinancing for which Morgan Stanley received customary fees and expenses. During 2014, we paid Morgan Stanley an aggregate of approximately $21 million for such services and in connection with such transactions.
We do not have any commercial relationships with Angelo Gordon or Q Investments.
2013 Refinancing
In connection with our comprehensive refinancing in 2013, our wholly-owned subsidiary acquired all of its outstanding Tranche A PIK Term Loans in exchange for (i) approximately 43.3% of our fully diluted issued and outstanding equity and (ii) $25 million of newly issued 11.875% senior subordinated notes due 2016 of Travelport LLC, an indirect wholly owned subsidiary, and acquired all of its outstanding Tranche B PIK Term Loans in exchange for approximately 34.6% of our fully diluted issued and outstanding equity. Certain investment funds affiliated with or managed by Angelo Gordon and Q Investments, who were shareholders prior to the 2013 refinancing, held a portion of such PIK term loans. In addition, funds affiliated with Blackstone, funds affiliated with TCV, an affiliate of OEP and certain members of our management beneficially own our common shares indirectly through Travelport Intermediate Limited. Travelport Intermediate Limited also held a portion of such PIK term loans. As such, Travelport Intermediate Limited and certain investment funds affiliated with or managed by Angelo Gordon and Q Investments received a pro-rata portion of the equity that was exchanged for such PIK term loans.
Amended and Restated Shareholders’ Agreement
In connection with the 2013 refinancing, we and our direct and indirect parent companies entered into an amended and restated shareholders’ agreement. The new shareholders’ agreement, among other things: (i) allowed certain shareholders to appoint directors; (ii) restricted our ability to enter into certain transactions or
119
take certain actions, authorize or issue new equity securities and amend our organizational documents without the consent of the shareholders; (iii) provided for certain tag-along, drag-along and pre-emptive rights; and (iv) provided shareholders with specified information rights. The operative provisions of the new shareholders’ agreement expired upon the consummation of our initial public offering.
Registration Rights Agreement
In connection with the 2013 refinancing, we entered into a Registration Rights Agreement pursuant to which we may be required to register the sale of our common shares held by certain existing holders. Under the Registration Rights Agreement, certain holders have the right to request us to register the sale of their common shares and may require us to make available shelf registration statements permitting sales of common shares into the market from time to time over an extended period. In addition, substantially all holders of our common shares prior to our initial public offering have the ability to exercise certain piggyback registration rights in connection with registered offerings requested by other holders or initiated by us.
Review, Approval or Ratification of Related Person Transactions
Our Audit Committee is responsible for the review, approval or ratification of “related-person transactions” between us or our subsidiaries and related persons. “Related person” refers to a person or entity who is, or at any point since the beginning of the last fiscal year was, a director, officer, nominee for director, or 5% shareholder of us and their immediate family members. Our Audit Committee has adopted a Related Parties Transaction Policy regarding the approval of related-person transactions. The Audit Committee applies its review procedures as a part of its standard operating procedures.
As a general matter, under our Related Party Transactions Policy, related-party transactions where the amount involved could reasonably be expected to exceed $120,000 in any calendar year and material amendments or modifications of any such transaction are submitted to the Audit Committee for review and approval before the transaction is consummated. If advance approval of a related-party transaction is not obtained, then the transaction must be submitted to the Audit Committee for ratification, as soon as reasonably practicable, but in any event, at the Audit Committee’s next regularly scheduled meeting. If the Audit Committee does not ratify a related-party transaction that has been consummated without its approval, the Audit Committee will, in consultation with our General Counsel, consider whether additional action is necessary, such as terminating the transaction on a prospective basis, rescinding or modifying it in a manner that would facilitate ratification by the Audit Committee.
In the course of its review and approval or ratification of a related-person transaction, as provided in the Audit Committee’s charter and under our Related Party Transactions Policy, the Audit Committee considers:
| | • | | the nature of the related-person’s interest in the transaction; |
| | • | | the material terms of the transaction, including the amount involved and type of transaction; |
| | • | | the importance of the transaction to the related person and to us; |
| | • | | whether the transaction would impair the judgment of a director or executive officer to act in our best interest; and |
| | • | | any other matters the Audit Committee deems appropriate. |
Any member of the Audit Committee who is a related person with respect to a transaction under review may not participate in the deliberations or vote on the approval or ratification of the transaction. However, such a director may be counted in determining the presence of a quorum at a meeting of the Audit Committee at which the transaction is considered.
120
ITEM 14.PRINCIPAL ACCOUNTING FEES AND SERVICES
Principal Accounting Firm Fees. Fees billed to us by Deloitte LLP, the member firms of Deloitte Touche Tohmatsu, and their respective affiliates (collectively, the “Deloitte Entities”) during the years ended December 31, 2014 and 2013 were as follows:
Audit Fees. The aggregate fees billed for the audit of our annual financial statements during the years ended December 31, 2014 and 2013, the reviews of the unaudited consolidated condensed financial statements included in our Quarterly Reports on Form 10-Q, other attest services primarily for comfort letters and consents related to SEC and other registration statements, and statutory audits were approximately $3.8 million and $3.5 million, respectively.
Audit-Related Fees. The aggregate fees billed for audit-related services was $0.3 million and $0.1 million for the years ended December 31, 2014 and 2013, respectively. These fees relate primarily to audits of employee benefit plans and reviewing internal controls.
Tax Fees. The aggregate fees billed for tax services during the years ended December 31, 2014 and 2013 were approximately $5.7 million and $2.3 million, respectively. These fees relate to tax compliance, tax advice and tax planning for the years ended December 31, 2014 and 2013.
Our Audit Committee considered the non-audit services provided by the Deloitte Entities and determined that the provision of such services was compatible with maintaining the Deloitte Entities’ independence. Our Audit Committee also adopted a policy prohibiting Travelport from hiring the Deloitte Entities’ personnel at the manager or partner level, who have been directly involved in performing auditing procedures or providing accounting advice to us, in any role in which such person would be in a position to influence the contents of our financial statements. Our Audit Committee is responsible for appointing our independent auditor and approving the terms of the independent auditor’s services. Our Audit Committee has established a policy for the pre-approval of all audit and permissible non-audit services to be provided by the independent auditor, as described below.
All services performed by the independent auditor in 2014 were pre-approved in accordance with the pre-approval policy and procedures adopted by the Audit Committee at its February 26, 2014 meeting. This policy describes the permitted audit, audit-related, tax and other services (collectively, the “Disclosure Categories”) that the independent auditor may perform. The policy requires that prior to the beginning of each fiscal year, a description of the services (the “Service List”) anticipated to be performed by the independent auditor in each of the Disclosure Categories in the ensuing fiscal year be presented to the Audit Committee for approval.
Any requests for audit, audit-related, tax and other services not contemplated by the Service List must be submitted to the Audit Committee for specific pre-approval, except for de minimis amounts under certain circumstances as described below, and cannot commence until such approval has been granted. Normally, pre-approval is provided at regularly scheduled meetings of the Audit Committee. However, the authority to grant specific pre-approval between meetings may be delegated to one or more members of the Audit Committee. The member or members of the Audit Committee to whom such authority is delegated shall report any pre-approval decisions to the Audit Committee at its next scheduled meeting.
The policy contains a de minimis provision that operates to provide retroactive approval for permissible non-audit services under certain circumstances. Services provided by the Deloitte Entities during 2014 and 2013 under this provision were approximately $0 million for each of these years.
121
PART IV
ITEM 15. EXHIBITS, FINANCIAL STATEMENT SCHEDULES
ITEM 15(A)(1) FINANCIAL STATEMENTS
See Financial Statements and Financial Statements Index commencing on page F-1 hereof.
The consolidated financial statements and related footnotes of Travelport’s former non-controlled affiliate, Orbitz Worldwide, Inc., are included as Exhibits 99.1 and 99.2 to this Form 10-K and are hereby incorporated by reference herein from the Annual Report on Form 10-K for the year ended December 31, 2013 filed by Orbitz Worldwide, Inc. with the SEC on March 6, 2014 and the Quarterly Report on Form 10-Q for the quarter ended June 30, 2014 filed by Orbitz Worldwide, Inc. with the SEC on August 7, 2014, respectively. The Company is required to include the Orbitz Worldwide financial statements in its Form 10-K due to Orbitz Worldwide meeting certain tests of significance under SEC Regulation S-X Rule 3-09. The management of Orbitz Worldwide is solely responsible for the form and content of the Orbitz Worldwide financial statements.
ITEM 15(A)(2) FINANCIAL STATEMENT SCHEDULES
See Schedule II – Valuation and qualifying accounts on page F-52 hereof. All other schedules have been omitted because they are either inapplicable or the required information has been provided in the consolidated financial statements or in the notes therein.
ITEM 15(A)(3) EXHIBITS
See Exhibits Index commencing on page G-1 hereof.
122
SIGNATURES
Pursuant to the requirements of Section 13 or 15(d) of the Securities Exchange Act of 1934, the Registrant has duly caused this report to be signed on its behalf by the undersigned, thereunto duly authorized.
| | | | | | |
| | | | TRAVELPORT WORLDWIDE LIMITED |
| | | |
| | | | By: | | /s/ Antonios Basoukeas |
| | | | | | Antonios Basoukeas |
| | | | | | Chief Accounting Officer |
Date: February 27, 2015
Pursuant to the requirements of the Securities Exchange Act of 1934, this report has been signed by the following persons on behalf of the Registrant and in the capacities and on the dates indicated.
| | | | |
Signature | | Title | | Date |
| | |
/s/ Gordon Wilson (Gordon Wilson) | | Chief Executive Officer and Director | | February 27, 2015 |
| | |
/s/ Philip Emery (Philip Emery) | | Executive Vice President and Chief Financial Officer | | February 27, 2015 |
| | |
/s/ Douglas Steenland (Douglas Steenland) | | Chairman of the Board and Director | | February 27, 2015 |
| | |
/s/ Gavin Baiera (Gavin Baiera) | | Director | | February 27, 2015 |
| | |
/s/ Gregory Blank (Gregory Blank) | | Director | | February 27, 2015 |
| | |
/s/ Michael J. Durham (Michael J. Durham) | | Director | | February 27, 2015 |
| | |
/s/ Douglas Hacker (Douglas Hacker) | | Director | | February 27, 2015 |
| | |
/s/ Elizabeth Buse (Elizabeth Buse) | | Director | | February 27, 2015 |
| | |
/s/ Antonios Basoukeas (Antonios Basoukeas) | | Chief Accounting Officer | | February 27, 2015 |
123
TRAVELPORT WORLDWIDE LIMITED
INDEX TO CONSOLIDATED FINANCIAL STATEMENTS
F-1
REPORT OF INDEPENDENT REGISTERED PUBLIC ACCOUNTING FIRM
To the Board of Directors and Shareholders of Travelport Worldwide Limited
We have audited the accompanying consolidated balance sheets of Travelport Worldwide Limited and subsidiaries (the “Company”) as of December 31, 2014 and 2013, and the related consolidated statements of operations, comprehensive loss, cash flows and changes in total equity (deficit) for each of the three years in the period ended December 31, 2014. Our audits also included the financial statement schedule listed in the Index at Item 15. These financial statements and financial statement schedule are the responsibility of the Company’s management. Our responsibility is to express an opinion on these financial statements and financial statement schedule based on our audits.
We conducted our audits in accordance with the standards of the Public Company Accounting Oversight Board (United States). Those standards require that we plan and perform the audit to obtain reasonable assurance about whether the financial statements are free of material misstatement. The Company is not required to have, nor were we engaged to perform, an audit of its internal control over financial reporting. Our audits included consideration of internal control over financial reporting as a basis for designing audit procedures that are appropriate in the circumstances, but not for the purpose of expressing an opinion on the effectiveness of the Company’s internal control over financial reporting. Accordingly, we express no such opinion. An audit also includes examining, on a test basis, evidence supporting the amounts and disclosures in the financial statements, assessing the accounting principles used and significant estimates made by management, as well as evaluating the overall financial statement presentation. We believe that our audits provide a reasonable basis for our opinion.
In our opinion, such consolidated financial statements present fairly, in all material respects, the financial position of Travelport Worldwide Limited and subsidiaries as of December 31, 2014 and 2013, and the results of their operations and their cash flows for each of the three years in the period ended December 31, 2014, in conformity with accounting principles generally accepted in the United States of America. Also, in our opinion, such financial statement schedule, when considered in relation to the basic consolidated financial statements taken as a whole, presents fairly, in all material respects, the information set forth therein.
/s/ DELOITTE LLP
London, United Kingdom
February 27, 2015
F-2
TRAVELPORT WORLDWIDE LIMITED
CONSOLIDATED STATEMENTS OF OPERATIONS
| | | | | | | | | | | | |
(in $ millions, except share data) | | Year Ended
December 31,
2014 | | | Year Ended
December 31,
2013 | | | Year Ended
December 31,
2012 | |
Net revenue | | $ | 2,148 | | | $ | 2,076 | | | $ | 2,002 | |
| | | | | | | | | | | | |
Costs and expenses | | | | | | | | | | | | |
Cost of revenue | | | 1,324 | | | | 1,266 | | | | 1,191 | |
Selling, general and administrative | | | 430 | | | | 396 | | | | 446 | |
Depreciation and amortization | | | 233 | | | | 206 | | | | 227 | |
| | | | | | | | | | | | |
Total costs and expenses | | | 1,987 | | | | 1,868 | | | | 1,864 | |
| | | | | | | | | | | | |
Operating income | | | 161 | | | | 208 | | | | 138 | |
Interest expense, net | | | (278 | ) | | | (356 | ) | | | (346 | ) |
(Loss) gain on early extinguishment of debt | | | (108 | ) | | | (49 | ) | | | 6 | |
Gain on sale of shares of Orbitz Worldwide | | | 356 | | | | — | | | | — | |
| | | | | | | | | | | | |
Income (loss) from continuing operations before income taxes and share of (losses) earnings in equity method investments | | | 131 | | | | (197 | ) | | | (202 | ) |
Provision for income taxes | | | (39 | ) | | | (20 | ) | | | (23 | ) |
Share of (losses) earnings in equity method investments | | | (1 | ) | | | 10 | | | | (74 | ) |
| | | | | | | | | | | | |
Net income (loss) from continuing operations | | | 91 | | | | (207 | ) | | | (299 | ) |
Gain from disposal of discontinued operations, net of tax | | | — | | | | 4 | | | | 7 | |
| | | | | | | | | | | | |
Net income (loss) | | | 91 | | | | (203 | ) | | | (292 | ) |
Net income attributable to non-controlling interest in subsidiaries | | | (5 | ) | | | (3 | ) | | | — | |
| | | | | | | | | | | | |
Net income (loss) attributable to the Company | | $ | 86 | | | $ | (206 | ) | | $ | (292 | ) |
| | | | | | | | | | | | |
Income (loss) per share – Basic: | | | | | | | | | | | | |
Income (loss) per share – continuing operations | | $ | 1.01 | | | $ | (4.62 | ) | | $ | (36.76 | ) |
Income per share – discontinued operations | | | — | | | | 0.10 | | | | 0.83 | |
| | | | | | | | | | | | |
Basic income (loss) per share | | $ | 1.01 | | | $ | (4.52 | ) | | $ | (35.93 | ) |
| | | | | | | | | | | | |
Weighted average common shares outstanding – Basic | | | 85,771,655 | | | | 45,522,506 | | | | 8,129,920 | |
| | | | | | | | | | | | |
Income (loss) per share – Diluted: | | | | | | | | | | | | |
Income (loss) per share – continuing operations | | $ | 0.98 | | | $ | (4.62 | ) | | $ | (36.76 | ) |
Income per share – discontinued operations | | | — | | | | 0.10 | | | | 0.83 | |
| | | | | | | | | | | | |
Diluted income (loss) per share | | $ | 0.98 | | | $ | (4.52 | ) | | $ | (35.93 | ) |
| | | | | | | | | | | | |
Weighted average common shares outstanding – Diluted | | | 87,864,090 | | | | 45,522,506 | | | | 8,129,920 | |
| | | | | | | | | | | | |
See Notes to the Consolidated Financial Statements
F-3
TRAVELPORT WORLDWIDE LIMITED
CONSOLIDATED STATEMENTS OF COMPREHENSIVE LOSS
| | | | | | | | | | | | |
(in $ millions) | | Year Ended
December 31,
2014 | | | Year Ended
December 31,
2013 | | | Year Ended
December 31,
2012 | |
Net income (loss) | | $ | 91 | | | $ | (203 | ) | | $ | (292 | ) |
| | | | | | | | | | | | |
Other comprehensive (loss) income, net of tax | | | | | | | | | | | | |
Currency translation adjustments, net of tax of $0 | | | (11 | ) | | | (5 | ) | | | 3 | |
Changes in loss on cash flow hedges, net of tax of $0 | | | 4 | | | | (4 | ) | | | — | |
Unrealized actuarial (loss) gain on defined benefit plans, net of tax of $2, $2 and $1 | | | (84 | ) | | | 107 | | | | (13 | ) |
Changes in (loss) gain on equity investment, net of tax of $0 | | | (7 | ) | | | 9 | | | | (3 | ) |
Unrealized gain on available-for-sale securities, net of tax of $0 | | | 6 | | | | — | | | | — | |
| | | | | | | | | | | | |
Other comprehensive (loss) income, net of tax | | | (92 | ) | | | 107 | | | | (13 | ) |
| | | | | | | | | | | | |
Comprehensive loss | | | (1 | ) | | | (96 | ) | | | (305 | ) |
Comprehensive income attributable to non-controlling interest in subsidiaries | | | (5 | ) | | | (3 | ) | | | — | |
| | | | | | | | | | | | |
Comprehensive loss attributable to the Company | | $ | (6 | ) | | $ | (99 | ) | | $ | (305 | ) |
| | | | | | | | | | | | |
See Notes to the Consolidated Financial Statements
F-4
TRAVELPORT WORLDWIDE LIMITED
CONSOLIDATED BALANCE SHEETS
| | | | | | | | |
(in $ millions, except share data) | | December 31,
2014 | | | December 31,
2013 | |
Assets | | | | | | | | |
Current assets: | | | | | | | | |
Cash and cash equivalents | | $ | 139 | | | $ | 154 | |
Accounts receivable (net of allowances for doubtful accounts of $14 and $13) | | | 184 | | | | 177 | |
Deferred income taxes | | | 5 | | | | 1 | |
Other current assets | | | 84 | | | | 134 | |
| | | | | | | | |
Total current assets | | | 412 | | | | 466 | |
Property and equipment, net | | | 414 | | | | 428 | |
Goodwill | | | 997 | | | | 986 | |
Trademarks and tradenames | | | 314 | | | | 314 | |
Other intangible assets, net | | | 619 | | | | 671 | |
Cash held as collateral | | | 26 | | | | 79 | |
Deferred income taxes | | | 9 | | | | 5 | |
Other non-current assets | | | 101 | | | | 139 | |
| | | | | | | | |
Total assets | | $ | 2,892 | | | $ | 3,088 | |
| | | | | | | | |
Liabilities and equity | | | | | | | | |
Current liabilities: | | | | | | | | |
Accounts payable | | $ | 73 | | | $ | 72 | |
Accrued expenses and other current liabilities | | | 426 | | | | 540 | |
Deferred income taxes | | | — | | | | 24 | |
Current portion of long-term debt | | | 56 | | | | 45 | |
| | | | | | | | |
Total current liabilities | | | 555 | | | | 681 | |
Long-term debt | | | 2,384 | | | | 3,528 | |
Deferred income taxes | | | 54 | | | | 18 | |
Other non-current liabilities | | | 237 | | | | 172 | |
| | | | | | | | |
Total liabilities | | | 3,230 | | | | 4,399 | |
| | | | | | | | |
Commitments and contingencies (Note 14) | | | | | | | | |
Shareholders’ equity (deficit): | | | | | | | | |
Preference shares ($0.0025 par value; 225,000,000 shares authorized; no shares issued and outstanding as of December 31, 2014 and 2013, respectively) | | | — | | | | — | |
Common shares ($0.0025 par value; 560,000,000 shares authorized; 121,411,360 and 60,882,046 shares issued and outstanding as of December 31, 2014 and 2013, respectively) | | | — | | | | — | |
Additional paid in capital | | | 2,715 | | | | 1,736 | |
Accumulated deficit | | | (2,898 | ) | | | (2,984 | ) |
Accumulated other comprehensive loss | | | (174 | ) | | | (82 | ) |
| | | | | | | | |
Total shareholders’ equity (deficit) | | | (357 | ) | | | (1,330 | ) |
Equity attributable to non-controlling interest in subsidiaries | | | 19 | | | | 19 | |
| | | | | | | | |
Total equity (deficit) | | | (338 | ) | | | (1,311 | ) |
| | | | | | | | |
Total liabilities and equity | | $ | 2,892 | | | $ | 3,088 | |
| | | | | | | | |
See Notes to the Consolidated Financial Statements
F-5
TRAVELPORT WORLDWIDE LIMITED
CONSOLIDATED STATEMENTS OF CASH FLOWS
| | | | | | | | | | | | |
(in $ millions) | | Year ended
December 31,
2014 | | | Year ended
December 31,
2013 | | | Year ended
December 31,
2012 | |
Operating activities of continuing operations | | | | | | | | | | | | |
Net income (loss) | | $ | 91 | | | $ | (203 | ) | | $ | (292 | ) |
Income from discontinued operations (including gain from disposal), net of tax | | | — | | | | (4 | ) | | | (7 | ) |
| | | | | | | | | | | | |
Net income (loss) from continuing operations | | | 91 | | | | (207 | ) | | | (299 | ) |
Adjustments to reconcile net income (loss) from continuing operations to net cash provided by operating activities: | | | | | | | | | | | | |
Depreciation and amortization | | | 233 | | | | 206 | | | | 227 | |
Amortization of customer loyalty payments | | | 76 | | | | 63 | | | | 62 | |
Gain on sale of shares of Orbitz Worldwide | | | (356 | ) | | | — | | | | — | |
Amortization of debt finance costs | | | 10 | | | | 21 | | | | 37 | |
Accrual of repayment fee and amortization of debt discount | | | 6 | | | | 8 | | | | 2 | |
Loss (gain) on early extinguishment of debt | | | 108 | | | | 49 | | | | (6 | ) |
Loss on foreign exchange derivative instruments | | | 17 | | | | 1 | | | | — | |
Payment-in-kind interest | | | 17 | | | | 38 | | | | 68 | |
Share of losses (earnings) in equity method investments | | | 1 | | | | (10 | ) | | | 74 | |
Equity-based compensation | | | 41 | | | | 6 | | | | 2 | |
Deferred income taxes | | | 6 | | | | (1 | ) | | | 4 | |
Customer loyalty payments | | | (93 | ) | | | (78 | ) | | | (47 | ) |
Pension liability contribution | | | (7 | ) | | | (3 | ) | | | (27 | ) |
FASA liability | | | — | | | | — | | | | (7 | ) |
Changes in assets and liabilities: | | | | | | | | | | | | |
Accounts receivable | | | (11 | ) | | | (27 | ) | | | 22 | |
Other current assets | | | 7 | | | | 5 | | | | (3 | ) |
Accounts payable, accrued expenses and other current liabilities | | | (98 | ) | | | 5 | | | | 37 | |
Other | | | 10 | | | | 24 | | | | 35 | |
| | | | | | | | | | | | |
Net cash provided by operating activities | | $ | 58 | | | $ | 100 | | | $ | 181 | |
| | | | | | | | | | | | |
Investing activities | | | | | | | | | | | | |
Property and equipment additions | | $ | (112 | ) | | $ | (107 | ) | | $ | (92 | ) |
Proceeds from sale of shares of Orbitz Worldwide | | | 366 | | | | — | | | | — | |
Businesses acquired, net of cash | | | (18 | ) | | | — | | | | — | |
Purchase of equity method investment | | | (10 | ) | | | — | | | | — | |
Proceeds from sale of assets held for sale | | | — | | | | 17 | | | | — | |
Other | | | — | | | | (6 | ) | | | 3 | |
| | | | | | | | | | | | |
Net cash provided by (used in) investing activities | | $ | 226 | | | $ | (96 | ) | | $ | (89 | ) |
| | | | | | | | | | | | |
F-6
TRAVELPORT WORLDWIDE LIMITED
CONSOLIDATED STATEMENTS OF CASH FLOWS—(Continued)
| | | | | | | | | | | | |
(in $ millions) | | Year ended
December 31,
2014 | | | Year ended
December 31,
2013 | | | Year ended
December 31,
2012 | |
Financing activities | | | | | | | | | | | | |
Net proceeds from issuance of common shares in initial public offering | | $ | 445 | | | $ | — | | | $ | — | |
Proceeds from term loans | | | 2,345 | | | | 2,169 | | | | 170 | |
Proceeds from bridge loans | | | 425 | | | | — | | | | — | |
Proceeds from revolver borrowings | | | 75 | | | | 73 | | | | 80 | |
Repayment of term loans under senior secured credit agreement | | | (1,477 | ) | | | (1,667 | ) | | | (165 | ) |
Repayment of bridge loans | | | (425 | ) | | | — | | | | — | |
Repayment of term loans under second lien credit agreement | | | (863 | ) | | | — | | | | — | |
Repurchase / repayment of senior notes and senior subordinated notes | | | (588 | ) | | | (413 | ) | | | (20 | ) |
Repayment of revolver borrowings | | | (75 | ) | | | (93 | ) | | | (95 | ) |
Repayment of capital lease obligations | | | (32 | ) | | | (20 | ) | | | (16 | ) |
Debt finance costs | | | (40 | ) | | | (55 | ) | | | (20 | ) |
Release of cash provided as collateral | | | 53 | | | | 137 | | | | — | |
Cash provided as collateral | | | — | | | | (79 | ) | | | — | |
Payment related to early extinguishment of debt | | | (46 | ) | | | — | | | | — | |
Purchase of non-controlling interest in a subsidiary | | | (65 | ) | | | — | | | | — | |
Costs related to exchange of shares for payment-in-kind debt | | | — | | | | (6 | ) | | | — | |
Dividend to shareholders | | | (9 | ) | | | — | | | | — | |
Tax withholding for equity awards | | | (23 | ) | | | (1 | ) | | | (1 | ) |
Dividend to non-controlling interest shareholders | | | (2 | ) | | | (1 | ) | | | — | |
Payment on settlement of derivative instruments | | | — | | | | (8 | ) | | | (51 | ) |
Proceeds from settlement of derivative instruments | | | 3 | | | | 4 | | | | 9 | |
Other | | | 2 | | | | — | | | | 3 | |
| | | | | | | | | | | | |
Net cash (used in) provided by financing activities | | $ | (297 | ) | | $ | 40 | | | $ | (106 | ) |
| | | | | | | | | | | | |
Effect of changes in exchange rates on cash and cash equivalents | | | (2 | ) | | | — | | | | — | |
| | | | | | | | | | | | |
Net (decrease) increase in cash and cash equivalents | | | (15 | ) | | | 44 | | | | (14 | ) |
Cash and cash equivalents at beginning of year | | | 154 | | | | 110 | | | | 124 | |
| | | | | | | | | | | | |
Cash and cash equivalents at end of year | | $ | 139 | | | $ | 154 | | | $ | 110 | |
| | | | | | | | | | | | |
Supplemental disclosure of cash flow information of continuing operations | | | | | | | | | | | | |
Interest payments | | $ | 294 | | | $ | 273 | | | $ | 232 | |
Income tax payments, net | | | 26 | | | | 29 | | | | 16 | |
Non-cash exchange of debt for equity (see Note 10) | | | 571 | | | | 473 | | | | — | |
Non-cash capital lease additions | | | 18 | | | | 32 | | | | 63 | |
Exchange of senior notes due 2014 and 2016 for new senior notes due 2016 (see Note 10) | | | — | | | | 591 | | | | — | |
Exchange of second priority secured notes for Tranche 2 Loans (see Note 10) | | | — | | | | 229 | | | | — | |
Exchange of payment-in-kind debt for new senior subordinated debt (see Note 10) | | | — | | | | 25 | | | | — | |
See Notes to the Consolidated Financial Statements
F-7
TRAVELPORT WORLDWIDE LIMITED
CONSOLIDATED STATEMENTS OF CHANGES IN TOTAL EQUITY (DEFICIT)
| | | | | | | | | | | | | | | | | | | | | | | | | | | | |
| | | Common
Shares | | | Additional
Paid in
Capital | | | Accumulated
Deficit | | | Accumulated
Other
Comprehensive
Loss | | | Non-
Controlling
Interest in
Subsidiaries | | | Total
Equity
(Deficit) | |
(in $ millions, except share data) | | Number | | | Amount | | | | | | |
Balance as of January 1, 2012 | | | 8,119,356 | | | $ | — | | | $ | 1,264 | | | $ | (2,486 | ) | | $ | (176 | ) | | $ | 13 | | | $ | (1,385 | ) |
Equity-based compensation | | | 20,410 | | | | — | | | | 2 | | | | — | | | | — | | | | — | | | | 2 | |
Tax withholding for equity awards | | | (8,227 | ) | | | — | | | | (1 | ) | | | — | | | | — | | | | — | | | | (1 | ) |
Capital contribution from non-controlling interest shareholders | | | — | | | | — | | | | — | | | | — | | | | — | | | | 3 | | | | 3 | |
Comprehensive loss, net of tax | | | — | | | | — | | | | — | | | | (292 | ) | | | (13 | ) | | | — | | | | (305 | ) |
| | | | | | | | | | | | | | | | | | | | | | | | | | | | |
Balance as of December 31, 2012 | | | 8,131,539 | | | | — | | | | 1,265 | | | | (2,778 | ) | | | (189 | ) | | | 16 | | | | (1,686 | ) |
Issue of common shares in exchange for debt, net of expenses | | | 52,373,884 | | | | — | | | | 467 | | | | — | | | | — | | | | — | | | | 467 | |
Dividend to non-controlling interest shareholders | | | — | | | | — | | | | — | | | | — | | | | — | | | | (1 | ) | | | (1 | ) |
Equity-based compensation | | | 652,222 | | | | — | | | | 5 | | | | — | | | | — | | | | 1 | | | | 6 | |
Tax withholding for equity awards | | | (275,599 | ) | | | — | | | | (1 | ) | | | — | | | | — | | | | — | | | | (1 | ) |
Comprehensive (loss) income, net of tax | | | — | | | | — | | | | — | | | | (206 | ) | | | 107 | | | | 3 | | | | (96 | ) |
| | | | | | | | | | | | | | | | | | | | | | | | | | | | |
Balance as of December 31, 2013 | | | 60,882,046 | | | | — | | | | 1,736 | | | | (2,984 | ) | | | (82 | ) | | | 19 | | | | (1,311 | ) |
Issue of common shares in initial public offering, net of expenses | | | 30,000,000 | | | | — | | | | 445 | | | | — | | | | — | | | | — | | | | 445 | |
Issue of common shares in exchange for debt | | | 28,841,012 | | | | — | | | | 585 | | | | — | | | | — | | | | — | | | | 585 | |
Dividend to non-controlling interest shareholders | | | — | | | | — | | | | — | | | | — | | | | — | | | | (2 | ) | | | (2 | ) |
Dividend to shareholders | | | — | | | | — | | | | (9 | ) | | | — | | | | — | | | | — | | | | (9 | ) |
Purchase of non-controlling interest in a subsidiary | | | — | | | | — | | | | (62 | ) | | | — | | | | — | | | | (3 | ) | | | (65 | ) |
Equity-based compensation | | | 3,078,827 | | | | — | | | | 41 | | | | — | | | | — | | | | — | | | | 41 | |
Tax withholding for equity awards | | | (1,390,525 | ) | | | — | | | | (23 | ) | | | — | | | | — | | | | — | | | | (23 | ) |
Tax benefit from equity-based award activity | | | — | | | | — | | | | 2 | | | | — | | | | — | | | | — | | | | 2 | |
Comprehensive income (loss), net of tax | | | — | | | | — | | | | — | | | | 86 | | | | (92 | ) | | | 5 | | | | (1 | ) |
| | | | | | | | | | | | | | | | | | | | | | | | | | | | |
Balance as of December 31, 2014 | | | 121,411,360 | | | $ | — | | | $ | 2,715 | | | $ | (2,898 | ) | | $ | (174 | ) | | $ | 19 | | | $ | (338 | ) |
| | | | | | | | | | | | | | | | | | | | | | | | | | | | |
See Notes to the Consolidated Financial Statements
F-8
TRAVELPORT WORLDWIDE
NOTES TO THE CONSOLIDATED FINANCIAL STATEMENTS
1. Basis of Presentation
Basis of Presentation
Travelport Worldwide Limited (the “Company” or “Travelport”) is a travel commerce platform providing distribution, technology, payment and other solutions for the global travel and tourism industry. With a presence in over 170 countries, Travelport business is comprised of:
The Travel Commerce Platform (formerly known as the global distribution system or “GDS” business), through which the Company facilitates travel commerce by connecting the world’s leading travel providers, such as airlines and hotel chains, with online and offline travel buyers in the Company’s proprietary business to business (“B2B”) travel commerce platform. As travel industry needs evolve, Travelport is utilizing its Travel Commerce Platform to redefine the electronic distribution and merchandising of airline core and ancillary products, as well as extending its reach into the growing world of travel commerce beyond air, including to hotel, car rental, rail, cruise-line and tour operators. In addition, Travelport has leveraged its domain expertise in the travel industry to design a pioneering B2B payment solution that addresses the need of travel agencies to efficiently and securely make payments to travel providers globally. Travelport utilizes the extensive data managed by its platform to provide an array of additional services, such as advertising solutions, subscription services, business intelligence data services, and marketing-oriented analytical tools to travel agencies, travel providers and other travel data users.
Through its Technology Services, Travelport provides critical hosting solutions to airlines, such as pricing, shopping, ticketing, ground handling and other solutions, enabling them to focus on their core business competencies and reduce costs. The Company manages reservations, inventory management and other related critical systems for Delta Air Lines Inc.
During 2014, the Company sold substantially all of the shares of common stock it held in Orbitz Worldwide, Inc. (“Orbitz Worldwide”) and since July 2014, owned less than 1% of its outstanding shares. Consequently, the Company has discontinued the equity method accounting (see Note 4—Orbitz Worldwide).
These consolidated financial statements have been prepared in accordance with accounting principles generally accepted in the United States of America (“US GAAP”).
All share and per share data in the financial statements give retroactive effect to a 1-for-12.5 share consolidation of the Company’s authorized, issued and outstanding shares, which was effective September 5, 2014.
Initial Public Offering (“IPO”)
On September 25, 2014, the Company issued 30 million common shares in an IPO. The shares were sold at a price of $16.00 per share, which generated $445 million of net proceeds from the IPO after deducting underwriting discounts and commissions and offering expenses.
The Company used the net proceeds from the IPO primarily to repay $425 million aggregate principal amount of its bridge loans (see Note 10—Long-Term Debt).
2. Summary of Significant Accounting Policies
Consolidation Policy
The Company’s financial statements include the accounts of Travelport, Travelport’s wholly-owned subsidiaries and entities controlled by Travelport, including where control is exercised by owning a majority of the entity’s outstanding common shares (eNett International (Jersy) Limited, IGT Solutions Private Limited and Travel-IT). The Company has eliminated intercompany transactions and balances in its financial statements.
F-9
TRAVELPORT WORLDWIDE
NOTES TO THE CONSOLIDATED FINANCIAL STATEMENTS
2. Summary of Significant Accounting Policies (Continued)
Use of Estimates
The preparation of financial statements in conformity with US GAAP requires management to make estimates and assumptions that affect the reported amounts and classification of assets and liabilities, disclosure of contingent assets and liabilities at the date of the financial statements, and the reported amounts of revenue and expense during the reporting period. Actual results may differ materially from those estimates.
The Company’s accounting policies, which include significant estimates and assumptions, including the estimation of the collectability of accounts receivable, including amounts due from airlines that are in bankruptcy or which have faced financial difficulties, amounts for future cancellations of airline bookings processed through the Travel Commerce Platform, determination of the fair value of assets and liabilities acquired in a business combination, the evaluation of the recoverability of the carrying value of goodwill and intangible assets, discount rates and rates of return affecting the calculation of the assets and liabilities associated with the employee benefit plans and the evaluation of uncertainties surrounding the calculation of the Company’s tax assets and liabilities.
Revenue Recognition
The Company provides global transaction processing and computer reservation services and provides travel marketing information to airline, car rental and hotel clients as described below.
Travel Commerce Platform Revenue
Travel Commerce Platform revenue primarily utilizes a transaction volume model to recognize revenue. The Company charges a fee per segment booked. The Company also receives a fee for cancellations of bookings previously made on the Company’s system and where tickets were issued by the Company that were originally booked on an alternative system.
Revenue for air travel reservations is recognized at the time of the booking of the reservation when it is contractually billed, net of estimated cancellations and anticipated incentives for customers. Cancellations prior to the date of departure are estimated based on the historical level of cancellations; such cancellations have not been significant, historically. The Company’s beyond air revenue, including hotel and car reservations, is recognized upon fulfillment of the reservation. Given hotel and car reservations can be cancelled at any time without penalty, revenue is recognized upon the fulfillment of the reservation when it is contractually billed and collectability of the revenue is reasonably assured.
The Company’s payment processing revenue is earned as a percentage of total transaction value in the form of interchange fees payable by banks. Revenue is recognized when the payment is processed.
The Company collects annual subscription fees from travel agencies, internet sites and other subscribers to access the applications on its Travel Commerce Platform, including providing the ability to access schedule and fare information, book reservations and issue tickets. These fees are recognized when the services are performed.
Technology Services Revenue
The Company collects fees, generally on a monthly basis under long-term contracts, for providing hosting solutions and other services to airlines such as pricing, shopping, ticketing, ground handling and other solutions. Such revenue is recognized as the services are performed.
F-10
TRAVELPORT WORLDWIDE
NOTES TO THE CONSOLIDATED FINANCIAL STATEMENTS
2. Summary of Significant Accounting Policies (Continued)
Cost of Revenue
Cost of revenue consists of direct costs incurred to generate the Company’s revenue, including commission paid to travel agencies and third-party national distribution companies (“NDCs”), amortization of customer loyalty payments, incentives paid to travel agencies who subscribe to the Company’s Travel Commerce Platform and costs for call center operations, data processing and related technology costs. Cost of revenue excludes depreciation and amortization of acquired intangible assets comprising of customer relationships.
Commission payments represent consideration to travel agencies and NDCs for reservations made on the Company’s Travel Commerce Platform. Commissions are provided in two ways depending on the terms of the contract: (i) variable per segment on a periodic basis over the term of the contract and (ii) upfront at the inception or modification of contracts. Variable commission is accrued in a period based on the estimated number of segments to be booked by the travel agent. For upfront commission, the Company establishes liabilities for these loyalty payments at the inception of the contract and capitalizes the customer loyalty payments as intangible assets. The amortization of the customer loyalty payments is then recognized as a component of revenue or cost of revenue over the life of the contract on a straight line basis (unless another method is more appropriate), as it expects the benefit of those assets, which are the air segments booked on its Travel Commerce Platform, to be realized evenly over the life of the contract.
In markets not supported by the Company’s sales and marketing organizations, the Company utilizes an NDC structure, where feasible, in order to take advantage of the NDC’s local industry knowledge. The NDC is responsible for cultivating the relationship with travel agencies in its territory, installing travel agents’ computer equipment, maintaining the hardware and software supplied to the travel agencies and providing ongoing customer support. The NDC earns a share of the booking fees generated in the NDC’s territory.
Cost of revenue also includes incentive payments to travel agencies for using the Company’s payment solutions. These commission costs are recognized in the same accounting period as the revenue generated from the related activities.
The direct technology costs related to revenue production, consisting of the development and maintenance costs for the mainframes, servers and software that is the shared infrastructure used to run the Company’s Travel Commerce Platform and Technology Services consist of service contracts with technology service providers, including on-site around-the-clock support for computer equipment and the cost of software licenses used to run the Company’s Travel Commerce Platform and its data center, other operating costs associated with running the Company’s Travel Commerce Platform, including facility and related running costs of the Company’s data center, technology costs related to maintaining the networks between the Company and its travel providers and its hosting solutions; salaries and benefits paid to employees for the development, delivery and implementation of software, the maintenance of mainframes, servers and software used in the Company’s data center and customer support, including call center operations. Direct technology costs are recognized as expenses in the period when the liability is incurred.
Advertising Expense
Advertising costs are expensed in the period incurred and include online marketing costs such as search and banner advertising, and offline marketing such as television, media and print advertising. Advertising expense, included in selling, general and administrative expenses on the consolidated statements of operations, was approximately $16 million, $17 million and $15 million for the years ended December 31, 2014, 2013 and 2012, respectively.
F-11
TRAVELPORT WORLDWIDE
NOTES TO THE CONSOLIDATED FINANCIAL STATEMENTS
2. Summary of Significant Accounting Policies (Continued)
Income Taxes
The provision for income taxes for annual periods is determined using the asset and liability method, under which deferred tax assets and liabilities are calculated based on the temporary differences between the financial statement carrying amounts and income tax bases of assets and liabilities using currently enacted tax rates. The deferred tax assets are recorded net of a valuation allowance when, based on the weight of available evidence, it is more likely than not that some portion or all of the recorded deferred tax assets will not be realized in future periods. Decreases to the valuation allowance are recorded as reductions to the provision for income taxes and increases to the valuation allowance result in additional provision for income taxes. The realization of the deferred tax assets, net of a valuation allowance, is primarily dependent on the ability to generate taxable income. A change in the Company’s estimate of future taxable income may require an addition or reduction to the valuation allowance.
The benefit from an uncertain income tax position is not recognized if it has less than a 50% likelihood of being sustained upon audit by the relevant authority. For positions that are more than 50% likely to be sustained, the benefit is recognized at the largest amount that is more-likely-than-not to be sustained. An uncertain income tax position is not recognized if it has less than a 50% likelihood of being sustained. Where a net operating loss carried forward, a similar tax loss or a tax credit carry forward exists, an unrecognized tax benefit is presented as a reduction to a deferred tax asset. Otherwise, the Company classifies its obligations for uncertain tax positions as other non-current liabilities unless expected to be paid within one year. Liabilities expected to be paid within one year are included in the accrued expenses and other current liabilities account. Interest and penalties are recorded in both the accrued expenses and other current liabilities, and other non-current liabilities accounts. The Company recognizes interest and penalties accrued related to unrecognized tax positions as part of the provision for income taxes.
Cash and Cash Equivalents
The Company considers highly-liquid investments purchased with an original maturity of three months or less to be cash equivalents.
Accounts Receivable and Allowance for Doubtful Accounts
The Company’s trade receivables are reported in the consolidated balance sheets net of an allowance for doubtful accounts. The Company evaluates the collectability of accounts receivable based on a combination of factors. In circumstances where the Company is aware of a specific customer’s inability to meet its financial obligations (e.g., bankruptcy filings, failure to pay amounts due to the Company, or other known customer liquidity issues), the Company records a specific reserve for bad debts in order to reduce the receivable to the amount reasonably believed to be collectable. For all other customers, the Company recognizes a reserve for estimated bad debts. Due to the number of different countries in which the Company operates, its policy of determining when a reserve is required to be recorded considers the appropriate local facts and circumstances that apply to an account. Accordingly, the length of time to collect does not necessarily indicate an increased credit risk. In all instances, local review of accounts receivable is performed on a regular basis by considering factors such as historical experience, credit worthiness, the age of the accounts receivable balances, and current economic conditions that may affect a customer’s ability to pay.
Bad debt expense is recorded in selling, general and administrative expenses on the consolidated statements of operations and amounted to $3 million, $4 million and $4 million for the years ended December 31, 2014, 2013 and 2012, respectively.
F-12
TRAVELPORT WORLDWIDE
NOTES TO THE CONSOLIDATED FINANCIAL STATEMENTS
2. Summary of Significant Accounting Policies (Continued)
Derivative Instruments
The Company uses derivative instruments as part of its overall strategy to manage exposure to market risks primarily associated with fluctuations in foreign currency and interest rates. All derivatives are recorded at fair value either as assets or liabilities. As a matter of policy, the Company does not use derivatives for trading or speculative purposes and does not offset derivative assets and liabilities.
As of December 31, 2014, there were no derivative contracts that the Company has designated as accounting hedges, although during 2014 and 2013, the Company had designated its interest-rate cap derivative contracts as cash flow hedges. The effective portion of changes in the fair value of derivative contracts designated as cash flow hedging instruments are recorded as a component of accumulated other comprehensive income (loss). The ineffective portion is reported directly in earnings in the consolidated statements of operations. Amounts included in accumulated other comprehensive income (loss) are recognized in earnings in the same period during which the hedged cash flow affects earnings, or are recognized earlier where the cash flow hedges are determined to be ineffective, or where the derivative contracts are terminated prior to maturity and the cash outflows hedged are not considered as probable of occurring.
Changes in the fair value of derivatives not designated as hedging instruments are recognized directly in earnings in the consolidated statements of operations.
Fair Value Measurement
The financial assets and liabilities on the Company’s consolidated balance sheets that are required to be recorded at fair value on a recurring basis are assets and liabilities related to derivative instruments and available-for-sale securities. Fair value is defined as the price that would be received to sell an asset or paid to transfer a liability in an orderly transaction between market participants at the measurement date. In determining fair value, the Company uses various valuation approaches. A hierarchy has been established for inputs used in measuring fair value that maximizes the use of observable inputs and minimizes the use of unobservable inputs by requiring that the most observable inputs be used when available. Observable inputs are inputs that market participants would use in pricing the asset or liability based on market rates obtained from sources independent of the Company. Unobservable inputs are inputs that reflect the Company’s estimates about the assumptions market participants would use in the pricing of the asset or liability based on the best information available. The hierarchy is broken down into three levels based on the reliability of inputs as follows:
| | |
| Level 1— | | Valuations based on quoted prices in active markets for identical assets or liabilities that the Company has the ability to access. |
| |
| Level 2— | | Valuations based on quoted prices in markets that are not active or for which all significant inputs are observable, either directly or indirectly. |
| |
| Level 3— | | Valuations based on inputs that are unobservable and significant to overall fair value measurement. |
The Company determines the fair value of its derivative instruments using pricing models that use inputs from actively quoted markets for similar instruments that do not entail significant judgment. These amounts include fair value adjustments related to the Company’s own credit risk and counterparty credit risk. When such adjustments constitute more than 15% of the unadjusted fair value of derivative instruments for two successive quarters, the entire instrument is classified within Level 3 of the fair value hierarchy.
The Company determines the fair value of its available-for-sale securities based on the quoted market price of the security as of the reporting date. The change in fair value for available-for-sale securities is recorded, net of taxes, as a component of accumulated other comprehensive loss on the consolidated balance sheets.
F-13
TRAVELPORT WORLDWIDE
NOTES TO THE CONSOLIDATED FINANCIAL STATEMENTS
2. Summary of Significant Accounting Policies (Continued)
Property and Equipment
Property and equipment (including leasehold improvements) are recorded at historical cost, net of accumulated depreciation and amortization. Depreciation, recorded as a component of depreciation and amortization expense on the consolidated statements of operations, is computed using the straight-line method over the estimated useful lives of the related assets. Amortization of leasehold improvements, also recorded as a component of depreciation and amortization, is computed using the straight-line method over the shorter of the estimated benefit period of the related assets or the lease term. Useful lives of various property and equipment are as follows:
| | | | |
Capitalized software | | | 3 to 10 years | |
Furniture, fixtures and equipment | | | 3 to 7 years | |
Buildings | | | up to 30 years | |
Leasehold improvements | | | up to 20 years | |
Capitalization of software developed for internal use commences during the development phase of the project. The Company amortizes software developed for internal use on a straight-line basis when such software is substantially ready for use. For the years ended December 31, 2014, 2013 and 2012, the Company amortized software costs developed for internal use of $87 million, $65 million and $89 million, respectively, as a component of depreciation and amortization expense on the consolidated statements of operations. Travelport policy is to capitalize interest cost as a component of historical cost where an asset is being constructed for Travelport’s own use. The amount of interest on capital projects capitalized was $8 million, $6 million and $3 million for the years ended December 31, 2014, 2013 and 2012, respectively.
Goodwill and Other Intangible Assets
The Company’s intangible assets with indefinite-lives comprise of Goodwill, Trademarks and Tradenames. These indefinite-lived intangible assets are not amortized, but rather are tested for impairment annually, or more frequently if circumstances indicate impairment may have occurred.
The Company’s amortizable intangible assets comprise of (i) acquired intangible assets, consisting of customer and vendor relationships and (ii) customer loyalty payments. The Company generally amortizes these intangible assets on a straight-line basis (unless another method is more appropriate) over their estimated useful lives of:
| | | | |
Acquired intangible assets | | | 5 to 25 years | |
Customer loyalty payments | | | 3 to 7 years (contract period) | |
Impairment of Long-Lived Assets
The Company assesses goodwill and other indefinite-lived intangible assets for impairment annually, or more frequently if circumstances indicate impairment may have occurred. The Company may qualitatively assess impairment factors to determine if it is more likely than not that the fair value of the reporting unit is less than its carrying value and if, as a result of qualitative assessment or if the Company determines quantitatively that the fair value of the reporting unit (determined utilizing estimated future discounted cash flows and assumptions that it believes marketplace participants would utilize) is less than its carrying value, the Company proceeds to assess impairment of goodwill. The level of impairment is assessed by allocating the total estimated fair value of the reporting unit to the fair value of the individual assets and liabilities of that reporting unit, as if that reporting unit is being acquired in a business combination. The remaining value represents the implied fair value of the
F-14
TRAVELPORT WORLDWIDE
NOTES TO THE CONSOLIDATED FINANCIAL STATEMENTS
2. Summary of Significant Accounting Policies (Continued)
goodwill, which if lower than its carrying value results in an impairment of goodwill to the extent the carrying value of goodwill exceeds its implied fair value. Other indefinite-lived assets are tested for impairment by estimating their fair value utilizing estimated future discounted cash flows attributable to those assets and are written down to the estimated fair value where necessary. The Company uses comparative market multiples, if available and other factors to corroborate the discounted cash flow results.
The Company performs its annual impairment testing for goodwill and other indefinite-lived intangible assets in the fourth quarter of each year subsequent to substantially completing its annual forecasting process or more frequently if circumstances indicate impairment may have occurred. The Company performed its annual impairment test during the fourth quarter of 2014 and did not identify any impairment.
The Company evaluates the recoverability of its other long-lived assets, including definite-lived intangible assets, if circumstances indicate impairment may have occurred. This analysis is performed by comparing the respective carrying values of the assets to the current and expected future cash flows, on an undiscounted basis, to be generated from such assets. If such analysis indicates that the carrying value of these assets is not recoverable, the carrying value of such assets is reduced to fair value through a charge to the consolidated statements of operations.
The Company’s available-for-sale securities are reviewed to identify other-than-temporary impairments in value. In evaluating whether a decline in value is other-than-temporary, the Company considers several factors including, but not limited to the following: (1) the extent and the duration of the decline; (2) the reasons for the decline in value; and (3) the financial condition of and near-term prospects of the issuer. The Company also considers the ability and intent to hold the investment for a period of time to allow for a recovery of value. When it is determined that a decline in value of an equity security is other-than-temporary, the equity security is reduced to its fair value, with a corresponding charge to earnings.
Accumulated Other Comprehensive Income (Loss)
Accumulated other comprehensive income (loss), net of taxes, consists of accumulated foreign currency translation adjustments, unrealized gains and losses on derivative financial instruments designated as cash flow hedges, unrealized actuarial gains and losses on defined benefit plans, share of unrealized gains and losses of accumulated other comprehensive income (loss) of equity method investments and unrealized gain and losses related to available-for-sale securities.
Foreign Currency
On consolidation, assets and liabilities of subsidiaries having non-U.S. dollar functional currencies are translated at period end exchange rates and their results of operations are translated into U.S. dollars at the average exchange rates for the period. The gains and losses resulting from translating these financial statements into US dollars, are included in accumulated other comprehensive income (loss) on the consolidated balance sheets and are included in net income (loss) only upon sale or liquidation of the underlying non-U.S. dollar function currency entity.
Transactions in currencies other than functional currency of an entity are recorded at the rate of exchange prevailing on the date of the transaction. Monetary assets and liabilities in currencies other than the functional currency are translated at the rate of exchange prevailing at the balance sheet date. Gains and losses resulting from such transactions and translations are included in earnings as a component of selling, general and administrative expense, in the consolidated statements of operations, except where the balances in non-US dollar functional currency represent certain intercompany loans determined to be of long-term investment in nature, in which case, the translation gains and losses are included in accumulated other comprehensive income (loss) on the consolidated balance sheets. The effect of exchange rates on cash balances denominated in foreign currency is included as a separate component in the consolidated statements of cash flows.
F-15
TRAVELPORT WORLDWIDE
NOTES TO THE CONSOLIDATED FINANCIAL STATEMENTS
2. Summary of Significant Accounting Policies (Continued)
Equity-Based Compensation
The Company has equity-based compensation plans that provide for grants of restricted stock units (“RSUs”) and stock options to employees and non-employee directors of the Company who perform services for the Company.
The Company expenses all equity-based compensation on a straight-line basis over the requisite service period based upon the fair value of the award on the date of grant, the estimated achievement of any performance targets and anticipated staff retention. The awards under equity-based compensation are classified as equity and included as a component of equity on the Company’s consolidated balance sheets, as the ultimate payment of such awards will not be achieved through use of the Company’s cash or other assets.
TDS Investor (Cayman) L.P., the partnership which, prior to the comprehensive refinancing in April 2013, indirectly owned a majority shareholding in the Company, provided for equity-based, long-term incentive programs for the purpose of retaining certain key employees of the Company. Under several plans within these programs, key employees were granted restricted equity units (“REUs”) and/or partnership interests in the Partnership. The Company has recognized the expense related to these awards in its consolidated statements of operations.
Net Income Per Common Share
Basic net income per common share is computed by dividing the net income available to the Company by the weighted average number of common shares outstanding during the period. Diluted net income per common share is computed by dividing the net income available to the Company by the weighted average number of common shares outstanding and potentially dilutive securities outstanding during the period. Potentially dilutive securities include stock options and unvested RSUs outstanding during the period, calculated using the treasury stock method. Potentially dilutive securities are excluded from the computations of diluted earnings per share if their effect would be antidilutive.
Pension and Other Post-Retirement Benefits
The Company sponsors a defined contribution savings plan, under which the Company matches the contributions of participating employees on the basis specified by the plan. The Company’s costs for contributions to this plan are recognized, as a component of selling, general and administrative expense, in the Company’s consolidated statements of operations as such costs are incurred.
The Company also sponsors both non-contributory and contributory defined benefit pension plans whereby benefits are based on an employee’s years of credited service and a percentage of final average compensation, or as otherwise described by the plan. The Company also maintains other post-retirement health and welfare benefit plans for certain eligible employees. The Company recognizes the funded status of its pension and other post-retirement defined benefit plans within other non-current assets, accrued expenses and other current liabilities, and other non-current liabilities on its consolidated balance sheets. The measurement date used to determine benefit obligations and the fair value of assets for all plans is December 31 of each year.
Pension and other post-retirement defined benefit costs are recognized in the Company’s consolidated statements of operations based upon various actuarial assumptions including expected return rates on plan assets, discount rates, employee turnover, healthcare costs and mortality rates. Actuarial gains or losses arise from actual returns on plan assets being different to expected return and from changes in the projected benefit obligation and are deferred within accumulated other comprehensive income (loss), net of tax.
F-16
TRAVELPORT WORLDWIDE
NOTES TO THE CONSOLIDATED FINANCIAL STATEMENTS
2. Summary of Significant Accounting Policies (Continued)
Recently Issued Accounting Pronouncements
Income Statement—Extraordinary and Unusual Items
In January 2015, the Financial Accounting Standards Board (the “FASB”) issued an update as an initiative to reduce complexity in accounting standards by eliminating the concept of extraordinary items from US GAAP. This update eliminates the requirements to consider whether an underlying event or transaction is extraordinary, however the presentation and disclosure guidance for items that are unusual in nature or occur infrequently are retained and are expanded to include items that are both unusual in nature and infrequently occurring. The guidance is applicable to the Company for interim and annual reporting periods beginning after December 15, 2015, with early adoption permitted and may be applied retrospectively or prospectively. The Company does not anticipate an impact on the consolidated financial statements resulting from the adoption of this guidance.
Business Combinations—Pushdown Accounting
In November 2014, the FASB issued guidance on whether and at what threshold an acquired business or not-for-profit organization can apply pushdown accounting. The guidance also gives an acquired business the option to apply pushdown accounting in its separate financial statements when an acquirer obtains control of the acquired business. It requires disclosures that enable users of financial statements to better evaluate the effects of pushdown accounting. This guidance was effective on the date of issuance. There was no impact on the Company’s consolidated financial statements on the adoption of this update.
Going Concern
In August 2014, the FASB issued guidance on disclosures of uncertainties about an entity’s ability to continue as a going concern. The guidance requires management to assess a company’s ability to continue as a going concern and to provide related footnote disclosures in certain circumstances. Disclosures are required when conditions give rise to substantial doubt about the company’s ability to continue as a going concern within one year from the financial statements issuance date. The guidance is applicable to the Company for the annual period ending December 31, 2016 and all annual and interim periods thereafter. The Company does not anticipate an impact on the consolidated financial statements resulting from the adoption of this guidance.
Compensation—Stock Compensation
In June 2014, the FASB issued guidance on accounting for stock compensation where share-based payment awards granted to employees require specific performance targets to be achieved in order for employees to become eligible to vest in the awards and such performance targets could be achieved after an employee completes the requisite service period. The amendment in this update requires a performance target that affects vesting and that could be achieved after the requisite service period to be treated as a performance condition. The guidance is applicable to the Company for interim and annual reporting periods beginning after December 15, 2015, although earlier adoption is permitted. The Company does not anticipate an impact on the consolidated financial statements resulting from the adoption of this guidance.
Revenue Recognition
In May 2014, the FASB issued guidance on revenue from contracts with customers that will supersede most current revenue recognition guidance, including industry-specific guidance. The underlying principle is that an entity will recognize revenue to depict the transfer of goods or services to customers at an amount that the entity expects to be entitled to in exchange for those goods or services. The guidance provides a five-step analysis of
F-17
TRAVELPORT WORLDWIDE
NOTES TO THE CONSOLIDATED FINANCIAL STATEMENTS
2. Summary of Significant Accounting Policies (Continued)
transactions to determine when and how revenue is recognized. Other major provisions include capitalization of certain contract costs, consideration of the time value of money in the transaction price, and allowing estimates of variable consideration to be recognized before contingencies are resolved in certain circumstances. The guidance also requires enhanced disclosures regarding the nature, amount, timing and uncertainty of revenue and cash flows arising from an entity’s contracts with customers. The guidance is applicable to the Company for the interim and annual reporting periods beginning after December 15, 2016, with early adoption not permitted. The guidance permits the use of either a retrospective or cumulative effect transition method. The Company has not yet selected a transition method and is currently evaluating the impact of the amended guidance on its consolidated financial statements.
Discontinued Operations
In April 2014, the FASB issued guidance on discontinued operations that increased the threshold for a disposal to qualify as a discontinued operation and requires new disclosures of both discontinued operations and certain other disposals that do not meet the definition of a discontinued operation. This guidance is applicable to the Company on a prospective basis for interim and annual reporting periods beginning after December 15, 2014 although early adoption is permitted. The Company does not anticipate an impact on the consolidated financial statements resulting from the adoption of this guidance, other than disclosures.
Presentation of an Unrecognized Tax Benefit
In July 2013, the FASB issued guidance on the presentation of an unrecognized tax benefit as a reduction to a deferred tax asset when a net operating loss (“NOL”) carry forward, a similar tax loss, or a tax credit carry forward exists except in certain circumstances. The Company adopted the provisions of this guidance effective January 1, 2014, as required. There was no impact on the consolidated financial statements resulting from the adoption of this guidance.
Accounting for Cumulative Translation Adjustment
In March 2013, the FASB issued guidance on a parent company’s accounting for the cumulative translation adjustment upon derecognition of certain subsidiaries or groups of assets within a foreign entity. The guidance provides the cumulative translation adjustment should be released into net income only if the sale or transfer results in the complete or substantially complete liquidation of the foreign entity in which the subsidiary or group of assets had resided, or, if a controlling financial interest is no longer held. This guidance is applicable to the Company on a prospective basis for interim and annual reporting periods beginning after December 15, 2014 although early adoption is permitted. The Company does not anticipate an impact on the consolidated financial statements resulting from the adoption of this guidance.
F-18
TRAVELPORT WORLDWIDE
NOTES TO THE CONSOLIDATED FINANCIAL STATEMENTS
3. Income Taxes
The provision for income taxes consisted of:
| | | | | | | | | | | | |
(in $ millions) | | Year Ended
December 31,
2014 | | | Year Ended
December 31,
2013 | | | Year Ended
December 31,
2012 | |
Current | | | | | | | | | | | | |
US Federal | | $ | (1 | ) | | $ | — | | | $ | (2 | ) |
US State | | | — | | | | 2 | | | | (2 | ) |
Non-US | | | (29 | ) | | | (21 | ) | | | (17 | ) |
| | | | | | | | | | | | |
| | | (30 | ) | | | (19 | ) | | | (21 | ) |
| | | | | | | | | | | | |
Deferred | | | | | | | | | | | | |
US Federal | | | (10 | ) | | | 3 | | | | (3 | ) |
Non-US | | | 4 | | | | (2 | ) | | | (1 | ) |
| | | | | | | | | | | | |
| | | (6 | ) | | | 1 | | | | (4 | ) |
| | | | | | | | | | | | |
Non-current | | | | | | | | | | | | |
Liabilities for uncertain tax positions | | | (3 | ) | | | (2 | ) | | | 2 | |
| | | | | | | | | | | | |
Provision for income taxes | | $ | (39 | ) | | $ | (20 | ) | | $ | (23 | ) |
| | | | | | | | | | | | |
Income (loss) from continuing operations before income taxes and share of (losses) earnings in equity method investments for US and non-US operations consisted of:
| | | | | | | | | | | | |
(in $ millions) | | Year Ended
December 31,
2014 | | | Year Ended
December 31,
2013 | | | Year Ended
December 31,
2012 | |
US | | $ | 22 | | | $ | 14 | | | $ | (59 | ) |
Non-US | | | 109 | | | | (211 | ) | | | (143 | ) |
| | | | | | | | | | | | |
Income (loss) from continuing operations before income taxes and share of (losses) earnings in equity method investments | | | 131 | | | $ | (197 | ) | | $ | (202 | ) |
| | | | | | | | | | | | |
F-19
TRAVELPORT WORLDWIDE
NOTES TO THE CONSOLIDATED FINANCIAL STATEMENTS
3. Income Taxes (Continued)
Deferred income tax assets and liabilities were comprised of:
| | | | | | | | |
(in $ millions) | | December 31,
2014 | | | December 31,
2013 | |
Deferred tax assets: | | | | | | | | |
NOL and tax credit carry forwards | | $ | 400 | | | $ | 293 | |
Pension liability | | | 51 | | | | 24 | |
Accrued liabilities and deferred income | | | 22 | | | | 17 | |
Equity-based compensation | | | 7 | | | | — | |
Allowance for doubtful accounts | | | 2 | | | | 4 | |
Other assets | | | 4 | | | | 21 | |
Less: Valuation allowance | | | (421 | ) | | | (345 | ) |
| | | | | | | | |
Total deferred tax assets | | | 65 | | | | 14 | |
Netted against deferred tax liabilities | | | (51 | ) | | | (8 | ) |
| | | | | | | | |
Deferred tax assets recognized on the balance sheet | | | 14 | | | | 6 | |
| | | | | | | | |
Deferred tax liabilities: | | | | | | | | |
Accumulated depreciation and amortization | | | (90 | ) | | | (44 | ) |
Other | | | (15 | ) | | | (6 | ) |
| | | | | | | | |
Total deferred tax liabilities | | | (105 | ) | | | (50 | ) |
Netted against deferred tax assets | | | 51 | | | | 8 | |
| | | | | | | | |
Deferred tax liabilities recognized on the balance sheet | | | (54 | ) | | | (42 | ) |
| | | | | | | | |
Net deferred tax liability | | $ | (40 | ) | | $ | (36 | ) |
| | | | | | | | |
The Company believes that it is more likely than not that the benefit from certain US federal, US State and non-US NOL carry forwards and other deferred tax assets will not be realized. Consequently, a valuation allowance of $421 million has been recorded against such deferred tax assets as of December 31, 2014. The Company continues to regularly assess the realizability of all deferred tax assets. Changes in historical earnings performance and future earnings projections, among other factors, may cause the Company to adjust its valuation allowance on deferred tax assets, which would impact its income tax expense in the period the Company determines that these factors have changed. As of December 31, 2014, the Company had federal NOL carry forwards of approximately $291 million, which expire between 2031 and 2034, and State NOL carry forwards which expire between 2015 and 2034. The Company had other non-US NOL carry forwards of $915 million that expire between three years and indefinitely.
Moreover, the ability of the Company to utilize its US NOL carry-forwards to reduce future taxable income is subject to various limitations under the Internal Revenue Code section 382 (“Section 382”). The utilization of such carry-forwards may be limited upon the occurrence of certain ownership changes, including the purchase or sale of shares by 5% shareholders and the offering of shares by the Company during any three-year period resulting in an aggregate change of more than 50% in the beneficial ownership of the Company. In the event of an ownership change, Section 382 imposes an annual limitation on the amount of a Company’s taxable income that can be offset by these carry-forwards.
As a result of the equity transaction that took place on April 15, 2013 (see Note 15—Equity) and also the change in ownership occurring with the IPO on September 25, 2014, the Company determined that ownership changes have occurred under Section 382 and, therefore, the ability to utilize its pre-ownership change NOL carry forwards is
F-20
TRAVELPORT WORLDWIDE
NOTES TO THE CONSOLIDATED FINANCIAL STATEMENTS
3. Income Taxes (Continued)
subject to an annual Section 382 limitation. As of December 31, 2014, the Company does not anticipate this limitation will restrict or reduce the utilization of NOL; however, the Company continues to evaluate the potential impact of the Section 382 limitation. Further, the Company continues to track “owner shifts” for the purpose of Section 382 test.
As a result of certain realization requirements of accounting for equity-based compensation, the table of deferred tax assets and liabilities shown above does not include certain deferred tax assets as of December 31, 2014 that arose directly from tax deductions related to equity-based compensation in excess of compensation recognized for financial reporting. Equity will be increased by $10 million if such deferred tax assets are ultimately realized. The Company uses ordering as prescribed under US GAAP for purposes of determining when excess tax benefits have been realized.
Income and foreign withholding taxes have not been recognized on the excess of the amount for financial reporting over the tax basis of investments in foreign subsidiaries that are essentially permanent in duration. This amount becomes taxable upon a repatriation of assets from the subsidiary or a sale or liquidation of the subsidiary. The amount of such taxable temporary differences totaled $13 million as of December 31, 2014 and the amount of any unrecognized deferred income tax liability on this temporary difference is $2 million.
The Company’s provision for income taxes differs from its tax (provision) benefit at the US Federal statutory rate of 35% as follows:
| | | | | | | | | | | | |
(in $ millions) | | Year Ended
December 31,
2014 | | | Year Ended
December 31,
2013 | | | Year Ended
December 31,
2012 | |
Tax (provision) benefit at US federal statutory rate of 35% | | | (46 | ) | | $ | 69 | | | $ | 71 | |
Taxes on non-US operations at alternative rates | | | 66 | | | | (17 | ) | | | (49 | ) |
Liability for uncertain tax positions | | | (3 | ) | | | (2 | ) | | | 2 | |
Change in valuation allowance | | | (138 | ) | | | (66 | ) | | | (46 | ) |
Non-taxable income | | | 104 | | | | — | | | | — | |
Non-deductible expenses | | | (19 | ) | | | (7 | ) | | | (4 | ) |
Adjustment in respect of prior years | | | 1 | | | | 3 | | | | 5 | |
Other | | | (4 | ) | | | — | | | | (2 | ) |
| | | | | | | | | | | | |
Provision for income taxes | | | (39 | ) | | $ | (20 | ) | | $ | (23 | ) |
| | | | | | | | | | | | |
The Company is subject to income taxes in the US and numerous non-US jurisdictions. The Company’s provision for income taxes is likely to vary materially both from the benefit (provision) at the US Federal statutory tax rate and from year to year. While within a period there may be discrete items that impact the Company’s provision for income taxes, the following items consistently have an impact: (i) the Company is subject to income tax in numerous non-US jurisdictions with varying tax rates, (ii) the Company’s earnings outside of the US are taxed at an effective rate that is lower than the US Federal rate and at a relatively consistent level of charge, (iii) the location of the Company’s debt in countries with no or low rates of federal tax results in limited tax benefit for interest and (iv) a valuation allowance is established against the deferred tax assets relating to the Company’s historical losses to the extent they are unlikely to be realized.
Significant judgment is required in determining the Company’s worldwide provision for income taxes and recording the related assets and liabilities. In the ordinary course of business, there are many transactions and tax positions where the ultimate tax determination is uncertain.
F-21
TRAVELPORT WORLDWIDE
NOTES TO THE CONSOLIDATED FINANCIAL STATEMENTS
3. Income Taxes (Continued)
Although the Company believes there is appropriate support for the positions taken on its tax returns, the Company has recorded liabilities (or reduction of tax assets) representing estimated economic loss upon ultimate settlement for certain positions. The Company believes tax provisions are adequate for all open years, based on assessment of many factors including past experience and interpretations of tax law applied to the facts of each matter. Although the Company believes the recorded assets and liabilities are reasonable, tax regulations are subject to interpretation and tax litigation is inherently uncertain; therefore, the Company’s assessments can involve both a series of complex judgments about future events and reliance on significant estimates and assumptions. While the Company believes the estimates and assumptions supporting the assessments are reasonable, the final determination of tax audits and any other related litigation could be materially different from that which is reflected in historical income tax provisions and recorded assets and liabilities.
With limited exceptions, the Company is no longer subject to US Federal, State and Local, or non-US income tax examinations by tax authorities for tax years before 2006. The Company has undertaken an analysis of material tax positions in its tax accruals for all open years and has identified all outstanding tax positions. The Company expects up to $2 million increase in unrecognized tax benefits within the next twelve months for the uncertain tax positions relating to certain interest exposures. The Company does not expect a significant reduction in the total amount of unrecognized tax benefits within the next twelve months as a result of payments.
The total amount of unrecognized tax benefits (including interest and penalties thereon) that, if recognized, would affect the effective tax rate is $26 million, $24 million and $23 million as of December 31, 2014, 2013 and 2012, respectively.
A reconciliation of the beginning and ending amounts of unrecognized tax benefits is as follows:
| | | | | | | | | | | | |
(in $ millions) | | December 31,
2014 | | | December 31,
2013 | | | December 31,
2012 | |
Unrecognized tax benefit—opening balance | | $ | 24 | | | $ | 23 | | | $ | 25 | |
Gross increases—tax positions in prior periods | | | 2 | | | | 8 | | | | 6 | |
Gross decreases—tax positions in prior periods | | | — | | | | (5 | ) | | | (6 | ) |
Gross increases—tax positions in current period | | | 1 | | | | 1 | | | | — | |
Decrease related to lapsing of statute of limitations | | | (1 | ) | | | (2 | ) | | | (2 | ) |
Settlements | | | — | | | | (1 | ) | | | — | |
| | | | | | | | | | | | |
Unrecognized tax benefit—ending balance | | $ | 26 | | | $ | 24 | | | $ | 23 | |
| | | | | | | | | | | | |
The Company recognizes interest and penalties accrued related to unrecognized tax benefits as part of the provision for income taxes. In 2014, 2013 and 2012, the Company accrued (released) approximately $1 million, $2 million and $(1) million, respectively, for interest and penalties. The total interest and penalties included in the ending balance of unrecognized tax benefits above was $7 million and $6 million as of December 31, 2014 and 2013, respectively. Included in the ending balance of unrecognized tax benefits was $1 million and $1 million as of December 31, 2014 and 2013, respectively, which is expected to be realized in the next twelve months due to lapsing of statute of limitations.
4. Orbitz Worldwide
In May 2014, the Company sold 8.6 million shares of Orbitz Worldwide for net proceeds of $54 million, resulting in a gain on sale of Orbitz Worldwide shares of $52 million. In July 2014, the Company sold a further 39 million shares, representing substantially all of its remaining shares in Orbitz Worldwide, for net proceeds of
F-22
TRAVELPORT WORLDWIDE
NOTES TO THE CONSOLIDATED FINANCIAL STATEMENTS
4. Orbitz Worldwide (Continued)
$312 million, resulting in a gain on sale of shares of $304 million. The gain on sale of shares of Orbitz Worldwide includes gains realized of approximately $5 million for the year ended December 31, 2014, which were accumulated within other comprehensive loss.
As a result of these sales, subsequent to July 2014, the Company owns less than 1% of the outstanding shares of common stock of Orbitz Worldwide and has discontinued the equity method accounting (see Note 21—Subsequent Events). The Company accounts for its current balance of investment in Orbitz Worldwide as an available-for-sale security, with changes in fair value recognized within other comprehensive income (loss) (see Note 5—Other Current Assets). As of December 31, 2013, the carrying value of the Company’s investment in Orbitz Worldwide, applying the equity-method of accounting, was $19 million.
The period ended June 30, 2014 was the last full quarterly period for which the Company accounted for Orbitz Worldwide under the equity method of accounting. Presented below are the summary balance sheets for Orbitz Worldwide as of June 30, 2014 and December 31, 2013:
| | | | | | | | |
(in $ millions) | | June 30,
2014 | | | December 31,
2013 | |
| | | (unaudited) | | | | |
Current assets | | $ | 453 | | | $ | 243 | |
Non-current assets | | | 881 | | | | 865 | |
| | | | | | | | |
Total assets | | $ | 1,334 | | | $ | 1,108 | |
| | | | | | | | |
Current liabilities | | $ | 801 | | | $ | 558 | |
Non-current liabilities | | | 499 | | | | 508 | |
| | | | | | | | |
Total liabilities | | $ | 1,300 | | | | 1,066 | |
| | | | | | | | |
As of June 30, 2014 and December 31, 2013, the Company had balances payable to Orbitz Worldwide for accrued commissions of approximately $17 million and $12 million, respectively, which was included on the Company’s consolidated balance sheets with accrued expenses and other current liabilities.
Presented below are the summary results of operations for Orbitz Worldwide for the six months ended June 30, 2014 and for the years ended December 31, 2013 and 2012:
| | | | | | | | | | | | |
(in $ millions) | | Six Months Ended
June 30, 2014 | | | Year Ended
December 31, 2013 | | | Year Ended
December 31, 2012 | |
| | | (unaudited) | | | | | | | |
Net revenue | | $ | 458 | | | $ | 847 | | | $ | 779 | |
Operating expenses | | | 424 | | | | 782 | | | | 720 | |
Impairment of goodwill, intangible assets, property and equipment and other long-lived assets | | | — | | | | 3 | | | | 321 | |
| | | | | | | | | | | | |
Operating income (loss) | | | 34 | | | | 62 | | | | (262 | ) |
Interest expense, net | | | (18 | ) | | | (44 | ) | | | (37 | ) |
Loss on early extinguishment of debt | | | (2 | ) | | | (18 | ) | | | — | |
| | | | | | | | | | | | |
Income (loss) before income taxes | | | 14 | | | | — | | | | (299 | ) |
(Provision for) benefit from income taxes | | | (13 | ) | | | 165 | | | | (3 | ) |
| | | | | | | | | | | | |
Net income (loss) | | $ | 1 | | | $ | 165 | | | $ | (302 | ) |
| | | | | | | | | | | | |
F-23
TRAVELPORT WORLDWIDE
NOTES TO THE CONSOLIDATED FINANCIAL STATEMENTS
4. Orbitz Worldwide (Continued)
The Company has recorded (losses) earnings of $(1) million, $10 million and $(74) million related to its investment in Orbitz Worldwide for the period from January 1, 2014 to July 22, 2014, and for the years ended December 31, 2013 and 2012 respectively within share of (losses) earnings in equity method investments in the Company’s consolidated statements of operations. The share of the Company’s (losses) earnings of investment in Orbitz Worldwide included share of a non-cash impairment charge related to goodwill, other intangible assets and other long-lived assets recorded by Orbitz Worldwide of $3 million and $321 million during the years ended December 31, 2013 and 2012, respectively.
The Company continued to account for Orbitz Worldwide under the equity method of accounting through July 22, 2014. Orbitz Worldwide does not report monthly or stub period financial information; however, based on the financial information received from Orbitz Worldwide, the Company estimated its proportionate share of earnings for the period July 1, 2014 to July 22, 2014 was not material. The (losses) earnings related to the equity method investment in Orbitz Worldwide are included within the share of (losses) earnings in equity method investments in the consolidated statement of operations.
In the first quarter of 2013, Orbitz Worldwide concluded that a significant portion of its US valuation allowance on deferred tax assets was no longer required, resulting in a recognition of a benefit from income taxes of $158 million in its consolidated statements of operations.
Net revenue disclosed above includes $58 million, $86 million and $98 million of net revenue earned by Orbitz Worldwide through transactions with the Company during the period from January 1, 2014 to July 22, 2014 and during the years ended December 31, 2013 and 2012, respectively.
The Company has various commercial agreements with Orbitz Worldwide, and under those commercial agreements, it earned approximately $5 million, $7 million and $4 million of revenue for the period from January 1, 2014 to July 22, 2014 and for each of the years ended December 31, 2013 and 2012, respectively, and recorded approximately $58 million, $86 million and $98 million of expense for the period from January 1, 2014 to July 22, 2014 and for each of the years ended December 31, 2013 and 2012, respectively. Furthermore, the Company has recorded approximately $0, $3 million and $7 million of interest income related to letters of credit issued by the Company on behalf of Orbitz Worldwide for the period from January 1, 2014 to July 22, 2014 and for each of the years ended December 31, 2013 and 2012, respectively.
5. Other Current Assets
Other current assets consisted of:
| | | | | | | | |
(in $ millions) | | December 31,
2014 | | | December 31,
2013 | |
Sales and use tax receivables | | $ | 28 | | | $ | 30 | |
Prepaid expenses | | | 20 | | | | 22 | |
Prepaid incentives | | | 13 | | | | 20 | |
Restricted cash | | | 9 | | | | 44 | |
Available-for-sale securities | | | 6 | | | | — | |
Derivative assets | | | — | | | | 3 | |
Other | | | 8 | | | | 15 | |
| | | | | | | | |
| | $ | 84 | | | $ | 134 | |
| | | | | | | | |
F-24
TRAVELPORT WORLDWIDE
NOTES TO THE CONSOLIDATED FINANCIAL STATEMENTS
5. Other Current Assets (Continued)
Restricted cash represents cash held on behalf of clients for a short period of time before being transferred to travel industry partners. A compensating balance is held in accrued expenses and other current liabilities as customer prepayments.
Available-for-sale securities represent shares of common stock of Orbitz Worldwide.
6. Property and Equipment, Net
Property and equipment, net, consisted of:
| | | | | | | | | | | | | | | | | | | | | | | | |
| | | December 31, 2014 | | | December 31, 2013 | |
(in $ millions) | | Cost | | | Accumulated
depreciation | | | Net | | | Cost | | | Accumulated
depreciation | | | Net | |
Capitalized software | | $ | 772 | | | $ | (554 | ) | | $ | 218 | | | $ | 650 | | | $ | (449 | ) | | $ | 201 | |
Computer equipment | | | 297 | | | | (175 | ) | | | 122 | | | | 281 | | | | (139 | ) | | | 142 | |
Building and leasehold improvements | | | 24 | | | | (9 | ) | | | 15 | | | | 17 | | | | (8 | ) | | | 9 | |
Construction in progress | | | 59 | | | | — | | | | 59 | | | | 76 | | | | — | | | | 76 | |
| | | | | | | | | | | | | | | | | | | | | | | | |
| | $ | 1,152 | | | $ | (738 | ) | | $ | 414 | | | $ | 1,024 | | | $ | (596 | ) | | $ | 428 | |
| | | | | | | | | | | | | | | | | | | | | | | | |
As of December 31, 2014 and 2013, the Company had capital lease assets of $152 million and $149 million, respectively, with accumulated depreciation of $63 million and $45 million, respectively, included within computer equipment. During the years ended December 31, 2014 and 2013, the Company invested $130 million and $139 million, respectively, in property and equipment, including capital lease additions. Capitalized software includes $6 million of additions resulting from an acquisition of a business in May 2014. Additions in the year ended December 31, 2014 include upgrades to equipment as part of investment in the Company’s Travel Commerce Platform information technology infrastructure.
The Company recorded depreciation expense (including depreciation on assets under capital leases), of $156 million, $126 million and $145 million during the years ended December 31, 2014, 2013 and 2012, respectively.
The amount of interest on capital projects capitalized was $8 million, $6 million and $3 million for the years ended December 31, 2014, 2013 and 2012, respectively.
7. Intangible Assets
The changes in the carrying amount of goodwill and intangible assets for the Company between January 1, 2014 and December 31, 2014 are as follows:
| | | | | | | | | | | | | | | | | | | | |
(in $ millions) | | January 1,
2014 | | | Additions | | | Retirements | | | Foreign
Exchange | | | December 31,
2014 | |
Non-Amortizable Assets: | | | | | | | | | | | | | | | | | | | | |
Goodwill | | $ | 986 | | | | 13 | | | | — | | | | (2 | ) | | | 997 | |
Trademarks and tradenames | | | 314 | | | | — | | | | — | | | | — | | | | 314 | |
Other Intangible Assets: | | | | | | | | | | | | | | | | | | | | |
Acquired intangible assets | | | 1,129 | | | | — | | | | — | | | | — | | | | 1,129 | |
Accumulated amortization | | | (610 | ) | | | (77 | ) | | | — | | | | — | | | | (687 | ) |
| | | | | | | | | | | | | | | | | | | | |
Acquired intangible assets, net | | | 519 | | | | (77 | ) | | | — | | | | — | | | | 442 | |
| | | | | | | | | | | | | | | | | | | | |
Customer loyalty payments | | | 306 | | | | 105 | | | | (77 | ) | | | — | | | | 334 | |
Accumulated amortization | | | (154 | ) | | | (76 | ) | | | 77 | | | | (4 | ) | | | (157 | ) |
| | | | | | | | | | | | | | | | | | | | |
Customer loyalty payments, net | | | 152 | | | | 29 | | | | — | | | | (4 | ) | | | 177 | |
| | | | | | | | | | | | | | | | | | | | |
Other intangible assets, net | | $ | 671 | | | | (48 | ) | | | — | | | | (4 | ) | | | 619 | |
| | | | | | | | | | | | | | | | | | | | |
F-25
TRAVELPORT WORLDWIDE
NOTES TO THE CONSOLIDATED FINANCIAL STATEMENTS
7. Intangible Assets (Continued)
The changes in the carrying amount of goodwill and intangible assets for the Company between January 1, 2013 and December 31, 2013 are as follows:
| | | | | | | | | | | | | | | | | | | | |
(in $ millions) | | January 1,
2013 | | | Additions | | | Retirements | | | Foreign
Exchange | | | December 31,
2013 | |
Non-Amortizable Assets: | | | | | | | | | | | | | | | | | | | | |
Goodwill | | | 986 | | | | — | | | | — | | | | — | | | | 986 | |
Trademarks and tradenames | | | 314 | | | | — | | | | — | | | | — | | | | 314 | |
Other Intangible Assets: | | | | | | | | | | | | | | | | | | | | |
Acquired intangible assets | | | 1,129 | | | | — | | | | — | | | | — | | | | 1,129 | |
Accumulated amortization | | | (530 | ) | | | (80 | ) | | | — | | | | — | | | | (610 | ) |
| | | | | | | | | | | | | | | | | | | | |
Acquired intangible assets, net | | | 599 | | | | (80 | ) | | | — | | | | — | | | | 519 | |
| | | | | | | | | | | | | | | | | | | | |
Customer loyalty payments | | | 274 | | | | 98 | | | | (66 | ) | | | — | | | | 306 | |
Accumulated amortization | | | (156 | ) | | | (63 | ) | | | 66 | | | | (1 | ) | | | (154 | ) |
| | | | | | | | | | | | | | | | | | | | |
Customer loyalty payments, net | | | 118 | | | | 35 | | | | — | | | | (1 | ) | | | 152 | |
| | | | | | | | | | | | | | | | | | | | |
Other intangible assets, net | | | 717 | | | | (45 | ) | | | — | | | | (1 | ) | | | 671 | |
| | | | | | | | | | | | | | | | | | | | |
In May 2014, the Company made an acquisition for cash consideration of $14 million, resulting in goodwill of $8 million.
In December 2014, the Company made another acquisition for cash consideration of $5 million, resulting in goodwill of $5 million. As of December 31, 2014, the Company is in the process of allocating the purchase consideration to acquired identifiable assets and liabilities.
The Company paid cash of $93 million and $78 million for customer loyalty payments during the years ended December 31, 2014 and 2013, respectively. Further, as of December 31, 2014 and 2013, the Company had balances payable of $52 million and $35 million, respectively, for customer loyalty payments (see Note 9—Accrued Expenses and Other Current Liabilities).
Amortization expense for acquired intangible assets was $77 million, $80 million and $82 million for the years ended December 31, 2014, 2013 and 2012, respectively, and is included as a component of depreciation and amortization on the Company’s consolidated statements of operations.
Amortization expense for customer loyalty payments was $76 million, $63 million and $62 million for the years ended December 31, 2014, 2013 and 2012, respectively, and is included within cost of revenue or revenue in the Company’s consolidated statements of operations.
The Company expects amortization expense relating to acquired intangible assets and customer loyalty payments balances as of December 31, 2014 to be:
| | | | | | | | |
| | | Year Ending December 31, | |
(in $ millions) | | Acquired Intangible
Assets | | | Customer Loyalty
Payments | |
2015 | | | 68 | | | | 56 | |
2016 | | | 46 | | | | 40 | |
2017 | | | 42 | | | | 29 | |
2018 | | | 41 | | | | 21 | |
2019 | | | 41 | | | | 10 | |
F-26
TRAVELPORT WORLDWIDE
NOTES TO THE CONSOLIDATED FINANCIAL STATEMENTS
8. Other Non-Current Assets
Other non-current assets consisted of:
| | | | | | | | |
(in $ millions) | | December 31,
2014 | | | December 31,
2013 | |
Deferred financing costs (see Note 10) | | $ | 37 | | | $ | 40 | |
Supplier prepayments | | | 24 | | | | 24 | |
Pension assets | | | 3 | | | | 11 | |
Prepaid incentives | | | 8 | | | | 22 | |
Derivative assets | | | — | | | | 8 | |
Other | | | 29 | | | | 34 | |
| | | | | | | | |
| | $ | 101 | | | $ | 139 | |
| | | | | | | | |
9. Accrued Expenses and Other Current Liabilities
Accrued expenses and other current liabilities consisted of:
| | | | | | | | |
(in $ millions) | | December 31,
2014 | | | December 31,
2013 | |
Accrued commissions and incentives | | $ | 260 | | | $ | 253 | |
Accrued payroll and related | | | 59 | | | | 80 | |
Deferred revenue | | | 27 | | | | 30 | |
Accrued interest expense | | | 18 | | | | 73 | |
Income tax payable | | | 16 | | | | 15 | |
Derivative contracts | | | 16 | | | | 1 | |
Customer prepayments | | | 9 | | | | 44 | |
Pension and post-retirement benefit liabilities | | | 2 | | | | 1 | |
Accrued sponsor monitoring fees | | | — | | | | 26 | |
Other | | | 19 | | | | 17 | |
| | | | | | | | |
| | $ | 426 | | | $ | 540 | |
| | | | | | | | |
Included in accrued commissions and incentives are $52 million and $35 million of accrued customer loyalty payments as of December 31, 2014 and 2013, respectively. Included in accrued payroll and related are $35 million and $57 million of accrued employee bonuses as of December 31, 2014 and 2013, respectively.
F-27
TRAVELPORT WORLDWIDE
NOTES TO THE CONSOLIDATED FINANCIAL STATEMENTS
10. Long-Term Debt
Long-term debt consisted of:
| | | | | | | | | | | | | | | | |
(in $ millions) | | Interest
rate | | | Maturity | | | December 31,
2014 | | | December 31,
2013 | |
Secured debt | | | | | | | | | | | | | | | | |
Senior Secured Credit Agreement | | | | | | | | | | | | | | | | |
Term loans | | | | | | | | | | | | | | | | |
Dollar denominated(1) | | | L+5% | | | | September 2021 | | | $ | 2,347 | | | $ | — | |
Dollar denominated (repaid and/or exchanged in 2014)(2) | | | L+5% | | | | | | | | — | | | | 1,525 | |
Revolver borrowings | | | | | | | | | | | | | | | | |
Dollar denominated | | | L+5% | | | | September 2019 | | | | — | | | | — | |
Dollar denominated (terminated in
2014)(2) | | | L+5% | | | | | | | | — | | | | — | |
Second Lien Credit Agreement | | | | | | | | | | | | | | | | |
Tranche 1 dollar denominated term loan (repaid and/or exchanged in 2014)(3) | | | L+8% | | | | | | | | — | | | | 644 | |
Tranche 2 dollar denominated term loan (repaid in 2014)(4) | | | 8 3⁄8% | | | | | | | | — | | | | 234 | |
Unsecured debt | | | | | | | | | | | | | | | | |
Senior Notes | | | | | | | | | | | | | | | | |
Dollar denominated notes (repaid and/or exchanged in 2014)(5) | | | 13 7⁄8 | % | | | | | | | — | | | | 411 | |
Dollar denominated floating rate notes (repaid and/or exchanged in 2014)(6) | | | L+8 5⁄8 | % | | | | | | | — | | | | 188 | |
Senior Subordinated Notes | | | | | | | | | | | | | | | | |
Dollar denominated notes (repaid and/or exchanged in 2014) | | | 11 7⁄8 | % | | | | | | | — | | | | 272 | |
Euro denominated notes (repaid and/or exchanged in 2014) | | | 10 7⁄8 | % | | | | | | | — | | | | 192 | |
Capital leases | | | | | | | | | | | 93 | | | | 107 | |
| | | | | | | | | | | | | | | | |
Total debt | | | | | | | | | | | 2,440 | | | | 3,573 | |
Less: current portion | | | | | | | | | | | 56 | | | | 45 | |
| | | | | | | | | | | | | | | | |
Long-term debt | | | | | | | | | | $ | 2,384 | | | $ | 3,528 | |
| | | | | | | | | | | | | | | | |
| (1) | Minimum LIBOR floor of 1.00% |
| (2) | Minimum LIBOR floor of 1.25% |
| (3) | Minimum LIBOR floor of 1.5% |
| (4) | Cash interest of 4% and payment-in-kind interest of 4.375% |
| (5) | Cash interest of 11.375% and payment-in-kind interest of 2.5% |
| (6) | Cash interest of LIBOR+6.125% plus payment-in-kind interest of 2.5% |
F-28
TRAVELPORT WORLDWIDE
NOTES TO THE CONSOLIDATED FINANCIAL STATEMENTS
10. Long-Term Debt (Continued)
2014
Debt-for-Equity Exchanges:
During the year ended December 31, 2014, the Company effectuated several debt-for-equity exchange transactions, pursuant to which the Company exchanged $571 million of its indebtedness, comprising (i) $154 million of dollar denominated senior subordinated notes, (ii) $159 million (€117 million) of euro denominated senior subordinated notes, (iii) $84 million of dollar denominated fixed rate senior notes, (iv) $83 million of dollar denominated floating rate senior notes, (v) $70 million of dollar denominated term loans under senior secured credit agreement and (vi) $21 million of dollar denominated Tranche 1 term loans under second lien credit agreement, for 29 million of its common shares. The Company recorded these transactions as extinguishments of debt and recognized a loss of $28 million in its consolidated statements of operations for the year ended December 31, 2014.
Debt Repayment from Proceeds of Sale of Shares of Orbitz Worldwide:
In July 2014, the Company repaid $312 million of term loans outstanding under its senior secured credit agreement from the proceeds received from the sale of shares of Orbitz Worldwide and recorded a loss of $5 million for early extinguishment of debt in its consolidated statements of operations for the year ended December 31, 2014.
Debt Refinancing:
In September 2014, the Company consummated a refinancing of its remaining debt. As a result of this refinancing, the Company entered into: (i) a new senior secured credit agreement comprised of (a) a single tranche of first lien term loans in an aggregate principal amount of $2,375 million maturing in September 2021, issued at a discount of 1.25% and which require quarterly installments payable of 0.25% of the principal amount commencing February 2015, and (b) a revolving credit facility of $100 million (which may be increased in accordance with certain incremental facility provisions set forth therein) maturing in September 2019; and (ii) a senior unsecured bridge loan agreement in an aggregate principal amount of $425 million which was subsequently repaid with proceeds from the IPO. The Company used the net proceeds from these borrowings to repay the balance remaining under the term loans under the old senior secured credit agreement and second lien credit agreement, senior notes and senior subordinated notes. The Company recorded the debt refinancing transaction as the issuance of new debt and extinguishment of old debt and recognized a loss of $75 million in its consolidated statements of operations for the year ended December 31, 2014.
The interest rate per annum applicable to the term loans is based on, at the election of the Company, (i) LIBOR plus 5.00% or base rate (as defined in the agreement) plus 4.00%. The term loans are subject to a LIBOR floor of 1.00% and 2.00% in the case of base rates. The Company expects to pay interest based on LIBOR. The interest rate per annum applicable to the bridge loan was LIBOR plus 5.75%, with a LIBOR floor of 1.00%. The applicable rate of 5.00% for LIBOR loans and 4.00% for base rate loans is subject to reduction, subject to the attainment of improved credit ratings and a reduced Consolidated First Lien Net Leverage Ratio (as defined in the agreement).
During the year ended December 31, 2014, the Company (i) repaid $8 million as its quarterly repayment of term loans, and (ii) capitalized $13 million related to payment-in-kind interest into the senior notes and second lien Tranche 2 dollar denominated term loans.
F-29
TRAVELPORT WORLDWIDE
NOTES TO THE CONSOLIDATED FINANCIAL STATEMENTS
10. Long-Term Debt (Continued)
Foreign exchange fluctuations resulted in a $3 million decrease in the principal amount of euro denominated loans during the year ended December 31, 2014.
Revolving Credit Facility and Letters of Credit Facility:
Effective upon the completion of the debt refinancing on September 2, 2014, the Company’s $120 million revolving credit facility and $137 million cash collateralized letters of credit facility under the old senior secured credit agreement were terminated. Under the new senior secured credit agreement, the Company has a $100 million revolving credit facility with a consortium of banks, which contains a letter of credit sub-limit up to a maximum of $50 million. The new senior secured credit agreement further permits the issuance of certain cash collateralized letters of credit in addition to those that can be issued under the revolving credit facility, whereby 103% of cash collateral has to be maintained for outstanding letters of credit. The new senior secured credit agreement also includes customary uncommitted incremental facility provisions, including the ability to increase the revolving credit facility by up to $50 million.
On January 16, 2015, the Company amended its senior secured credit agreement to increase the amount of revolving credit commitments by $25 million, resulting in a total of $125 million of revolving credit facility commitments available to the Company (see Note 21—Subsequent Events).
During the year ended December 31, 2014, the Company borrowed $75 million and repaid $75 million, all under its old revolving credit facility. As of December 31, 2014, under its new revolving credit facility, the Company had no outstanding borrowings and had utilized $14 million for the issuance of letters of credit, with a balance of $86 million remaining under its revolving credit facility. Further, as of December 31, 2014, the Company also had $25 million of cash collateralized letters of credit issued and outstanding, against which the Company has provided $26 million as cash collateral.
2013
In April 2013, the Company completed an exchange offer for substantially all of its existing senior notes due in September 2014 and March 2016, including the dollar denominated floating rates notes due 2014, euro denominated floating rate notes due 2014, 9.875% dollar denominated notes due 2014 and 9% dollar denominated notes due 2016, for approximately $406 million of new 13.875% senior fixed rate notes due March 2016, bearing cash interest of 11.375% and 2.5% of interest payable as payment-in-kind interest, and approximately $185 million of new senior floating rate notes due March 2016 (together with the new senior fixed rate notes, the “Senior Notes”), bearing cash interest of LIBOR plus 6.125% and 2.5% of interest payable as payment-in-kind interest (the “Senior Notes Exchange Offers”). In connection with the Senior Notes Exchange Offers, the holders of the new Senior Notes provided a waiver and release of all claims asserted related to the Company’s refinancing in 2011. To facilitate the transactions:
| • | | The Company entered into a new second lien secured credit agreement (“Second Lien Credit Agreement”) and issued $630 million of Tranche 1 second priority secured loans, at a discount of 1%, due January 2016 (the “Tranche 1 Loans”). The cash proceeds were used to (i) repay $175 million of indebtedness outstanding under the credit agreement dated as of May 8, 2012 (the “2012 Secured Credit Agreement”), (ii) repay in cash $393 million as part of the Senior Notes Exchange Offers, and (iii) pay consent fees in connection with the Senior Notes Exchange Offers and consent solicitations. The Tranche 1 Loans bear cash interest of LIBOR plus 8%, with a minimum LIBOR floor of 1.5%. During May 2013, the Company further borrowed $15 million under the Second Lien Credit Agreement to redeem the outstanding senior notes held by holders who did not participate in the Senior Notes Exchange Offers. Tranche 1 Loans were subject to a 2% |
F-30
TRAVELPORT WORLDWIDE
NOTES TO THE CONSOLIDATED FINANCIAL STATEMENTS
10. Long-Term Debt (Continued)
| | repayment fee, which were accreted as interest expense over the term of the loans. During the year ended December 31, 2013, $3 million was accreted into the outstanding loan amount and $2 million of debt discount was amortized. |
| • | | The Company completed an exchange offer for its existing Second Priority Secured Notes due December 2016 for an equal principal amount of new term loans under the Second Lien Credit Agreement due December 2016 (the “Tranche 2 Loans”). The Tranche 2 Loans bear interest of 8.375% (cash interest of 4% and payment-in-kind interest of 4.375%). |
| • | | The Company paid a consent fee to holders of the Company’s Senior Subordinated Notes in exchange for a waiver and release of all claims asserted in connection with the Company’s refinancing in 2011 and amended certain restrictive covenants under the indentures for the Senior Subordinated Notes. |
| • | | The Company acquired all of its outstanding Extended Tranche A Loans in exchange for (i) approximately 43.3% of its equity, and (ii) $25 million of newly issued 11.875% Senior Subordinated Notes of the Company due September 2016, and acquired all of its outstanding Extended Tranche B Loans in exchange for approximately 34.6% of its equity. |
In June 2013, the Company amended and restated its senior secured credit agreement (the “Sixth Amended and Restated Credit Agreement”) which, among other things, (i) refinanced in full the outstanding term loans, revolver borrowings and other commitments with the proceeds of a new $1,554 million term loan facility issued at a discount of 1.5% with a maturity date of June 2019 and an initial interest rate equal to LIBOR plus 5% (with a minimum LIBOR floor of 1.25%); (ii) provided for a new $120 million super priority revolving credit facility with a maturity date of June 2018 and an initial interest rate equal to LIBOR plus 4.25% (with a minimum LIBOR floor of 1.25%); (iii) provided for incremental term loan facilities subject to a 3.1 to 1.0 first lien leverage ratio test; (iv) amended the definition of Consolidated EBITDA to add back amortization of customer loyalty payments; and (v) amended certain financial covenants, including the total leverage ratio, the senior secured leverage ratio, the minimum liquidity ratio and limitations on indebtedness, investments and restricted payments. The Company was required to repay the term loans in quarterly installments equal to 1% per annum of the original funded principal amount of $1,554 million (adjusted for any subsequent prepayments), commencing September 2013. During the year ended December 31, 2013, the Company repaid $8 million as its quarterly repayment, and $3 million of debt discount was amortized.
In June 2013, the Company amended its Second Lien Credit Agreement to amend the definitions of (i) Consolidated EBITDA; (ii) total leverage ratio and senior secured leverage ratio; and (iii) certain other definitions to conform to the amendments in Sixth Amended and Restated Credit Agreement.
As a result of the above comprehensive refinancings during the year ended December 31, 2013, the Company recognized a loss on extinguishment of debt of $49 million, which comprised of $39 million of written-off of unamortized debt finance costs, $5 million of unamortized debt discount written-off and $5 million of early repayment penalty.
During the year ended December 31, 2013, the Company borrowed $73 million and repaid $93 million under its revolving credit facility.
As a result of the Company’s Sixth Amended and Restated Credit Agreement, the $13 million of synthetic letter of credit facility was terminated. The Company’s $133 million of letter of credit facility, which was collateralized by $137 million of restricted cash funded from Tranche S loans, was also terminated and replaced with a new $137 million cash collateralized letter of credit facility, maturing in June 2018. The terms under the
F-31
TRAVELPORT WORLDWIDE
NOTES TO THE CONSOLIDATED FINANCIAL STATEMENTS
10. Long-Term Debt (Continued)
new letters of credit facility provided that 103% of cash collateral has to be maintained for outstanding letters of credit. As of December 31, 2013, $77 million of letters of credit were outstanding under the terms of the new facility, against which the Company had provided $79 million as cash collateral, and the Company had $60 million of remaining capacity under its letters of credit facility.
Pursuant to its separation agreement with Orbitz Worldwide, the Company was committed to provide up to $75 million of letters of credit on behalf of Orbitz Worldwide. However, subsequent to April 15, 2013, the date on which the Company completed its comprehensive refinancing, the Company and Orbitz Worldwide ceased to be controlled by affiliates of The Blackstone Group (“Blackstone”), and the Company was no longer obligated to maintain or issue new letters of credit on behalf of Orbitz Worldwide. As of December 31, 2013, there were no letters of credit issued by the Company on behalf of Orbitz Worldwide, and all of the previously issued letters of credit were cancelled.
During the year ended December 31, 2013, $16 million of payment-in-kind interest was capitalized into the Second Priority Secured Notes and Senior Notes. In addition, $6 million of payment-in-kind interest was accrued for the Senior Notes and Tranche 2 Loans and included within other non-current liabilities on the Company’s consolidated balance sheets.
Foreign exchange fluctuations resulted in a $9 million increase in the principal amount of euro denominated loans during the year ended December 31, 2013.
Capital Leases
During 2014, the Company repaid $32 million under its capital lease obligations and entered into $18 million of new capital leases for information technology assets. During 2013, the Company repaid $20 million under its capital lease obligations, terminated $1 million of capital leases and entered into $32 million of new capital leases for information technology assets.
Debt Maturities
Aggregate maturities of debt as of December 31, 2014 are as follows:
| | | | |
(in $ millions) | | Year Ending
December 31, | |
2015 | | | 56 | |
2016 | | | 50 | |
2017 | | | 45 | |
2018 | | | 27 | |
2019 | | | 26 | |
Thereafter(1) | | | 2,236 | |
| | | | |
| | | 2,440 | |
| | | | |
| (1) | Includes $28 million of debt discount on term loans as of December 31, 2014. |
F-32
TRAVELPORT WORLDWIDE
NOTES TO THE CONSOLIDATED FINANCIAL STATEMENTS
10. Long-Term Debt (Continued)
Debt Finance Costs
Debt finance costs are capitalized within other non-current assets on the consolidated balance sheets and amortized over the term of the related debt into earnings as part of interest expense in the consolidated statements of operations. The movement in deferred finance costs is summarized below:
| | | | | | | | | | | | |
(in $ millions) | | Year Ended
December 31,
2014 | | | Year Ended
December 31,
2013 | | | Year Ended
December 31,
2012 | |
Balance as of January 1 | | $ | 40 | | | $ | 73 | | | $ | 97 | |
Capitalization of debt finance costs | | | 40 | | | | 29 | | | | 13 | |
Amortization | | | (10 | ) | | | (21 | ) | | | (37 | ) |
Written-off as loss on extinguishment | | | (33 | ) | | | (39 | ) | | | — | |
Written-off on refinancing of payment-in-kind debt | | | — | | | | (2 | ) | | | — | |
| | | | | | | | | | | | |
Balance as of December 31 | | $ | 37 | | | $ | 40 | | | $ | 73 | |
| | | | | | | | | | | | |
During the year ended December 31, 2014, the Company amortized $10 million of debt finance costs and incurred $46 million primarily consisting of advisory fees and early repayment fees which were recorded directly in the Company’s consolidated statements of operations in connection with the refinancing in the third quarter of 2014.
During the year ended December 31, 2013, the Company amortized $21 million of debt finance costs and incurred $5 million of early repayment penalty on term loans under the 2012 Secured Credit Agreement which were recorded directly in the Company’s consolidated statements of operations in connection with the refinancing in the second quarter of 2013.
Amortization of debt finance costs during 2012 includes $5 million of debt finance costs written off due to early repayment of term loans in May 2012. In December 2012, the Company also incurred $7 million of debt finance costs which were recorded directly in the consolidated statements of operations in connection with amendments made to the senior secured credit agreement.
Debt Covenants and Guarantees
The Company’s new senior secured credit agreement contains a number of covenants that, among other things, restrict, subject to certain exceptions, the ability of the Company’s subsidiaries to incur additional indebtedness or issue preferred stock; create liens on assets; enter into sale and leaseback transactions; engage in mergers or consolidations; sell assets; pay dividends and distributions or repurchase capital stock; make investments, loans or advances; repay subordinated indebtedness; make certain acquisitions; engage in certain transactions with affiliates; change the Company’s lines of business; and change the status of the Company as a passive holding company.
In addition, under the senior secured credit agreement, the Company is required to operate within a maximum consolidated first lien net leverage ratio. The senior secured credit agreement also contains certain customary affirmative covenants and events of default. As of December 31, 2014, the Company was in compliance with all restrictive and financial covenants related to its long-term debt.
F-33
TRAVELPORT WORLDWIDE
NOTES TO THE CONSOLIDATED FINANCIAL STATEMENTS
11. Financial Instruments
The Company uses derivative financial instruments as part of its overall strategy to manage its exposure to market risks primarily associated with fluctuations in foreign currency and interest rates. The Company does not use derivatives for trading or speculative purposes.
As of December 31, 2014, the Company had a net liability position of $16 million related to derivative instruments associated with its foreign currency denominated receivables and payables and forecasted earnings of its foreign subsidiaries.
Interest Rate Risk
The primary interest rate exposure as of December 31, 2014 was to interest rate fluctuations in the United States, specifically the impact of USLIBOR interest rates on dollar denominated variable rate borrowings. However, during 2014 and in previous years, the Company was also exposed to interest rate exposure due to the impact of EURIBOR interest rates on its euro denominated variable rate debt.
During previous years, the Company used interest rate swap derivative contracts, to economically hedge the exposure to fluctuations in the interest rate risk by creating an appropriate mix of fixed and floating interest streams. These derivative instruments were not designated as accounting hedges and changes in the fair value of these derivatives were recorded in consolidated statements of operations when they occurred, which were largely offset by the impact of the changes in the value of the underlying risk they were intended to economically hedge.
In August 2013, the Company’s interest rate swap derivative contracts expired and it entered into interest rate cap derivative contracts to cap the maximum USLIBOR rate to which the Company may be exposed at 1.5%. The purpose of these contracts was to hedge the risk of an increase in interest costs on the Company’s floating rate debt due to an increase in USLIBOR rates above 1.5%. The Company had designated these interest rate cap derivative contracts as accounting cash flow hedges and recorded the effective portion of changes in fair value of these derivative contracts as a component of other comprehensive income (loss) with the ineffective portion recognized in earnings in the consolidated statements of operations. In June 2014, the Company ceased hedge accounting for its interest rate cap derivative instruments. With the exchange of its common shares for the Company’s term loans in July 2014, which reduced the principal amount of debt being hedged to under 100% of the notional amount of interest rate cap contracts and the Company’s refinancing of its capital structure in September 2014, the Company determined that the hedge effectiveness could no longer be achieved. Further, the underlying future interest cash outflows hedged were considered as not probable of occurring, resulting in the Company reclassifying losses of $8 million accumulated within other comprehensive income (loss) and recognizing the loss within its consolidated statements of operations. In August 2014, the Company terminated the interest rate cap derivative contracts and realized $3 million.
Foreign Currency Risk
During 2014 and in previous years, the Company used foreign currency derivative contracts, including forward contracts and currency options, to manage its exposure to changes in foreign currency exchange rates associated with its euro denominated debt, its foreign currency denominated receivables and payables, and forecasted earnings of its foreign subsidiaries (primarily to manage its foreign currency exposure to British pound, Euro and Australian dollar). The Company did not designate these foreign currency derivative contracts as accounting hedges. Fluctuations in the value of these foreign currency derivative contracts were recorded within the Company’s consolidated statements of operations, which partially offset the impact of the changes in the value of the euro denominated debt, foreign currency denominated receivables and payables and forecasted earnings they were intended to economically hedge.
F-34
TRAVELPORT WORLDWIDE
NOTES TO THE CONSOLIDATED FINANCIAL STATEMENTS
11. Financial Instruments (Continued)
As of December 31, 2014, the Company has no foreign exchange risk related to its euro denominated debt as this debt was either exchanged for the Company’s equity in debt-for-equity exchanges or was repaid during 2014.
Credit Risk and Exposure
The Company is exposed to counterparty credit risk in the event of non-performance by counterparties to various agreements and sales transactions. The Company manages such risk by evaluating the financial position and creditworthiness of such counterparties. The Company mitigates counterparty credit risk associated with its derivative contracts by monitoring the amounts at risk with each counterparty to such contracts, periodically evaluating counterparty creditworthiness and financial position, and where possible, dispersing its risk among multiple counterparties. As of December 31, 2014, there were no significant concentrations of counterparty credit risk with any individual counterparty or group of counterparties for derivative contracts.
Fair Value Disclosures for Derivative Instruments
The Company’s financial assets and liabilities recorded at fair value consist primarily of derivative instruments and available-for-sale securities. These amounts have been categorized based upon a fair value hierarchy and while fair value of available-for-sale securities is categorized as Level 1—Quoted Prices in Active Markets, the fair value of derivative instruments were categorized as Level 2—Significant Other Observable Inputs as of December 31, 2014. See Note 2—Summary of Significant Accounting Policies, for a discussion of the Company’s policies regarding this hierarchy.
The fair value of interest rate swap derivative instruments is determined using pricing models based on discounted cash flows that use inputs from actively quoted markets for similar instruments. The fair value of foreign currency forward contracts is determined by comparing the contract rate to a published forward price of the underlying currency, which is based on market rates for comparable transactions. The fair value of interest rate caps and foreign currency option contracts is based on valuations provided by financial institutions which is reviewed by the Company based on market observable data. These fair values are then adjusted for the Company’s own credit risk or counterparty credit risk, as appropriate. This adjustment is calculated based on the default probability of the banking counterparty or the Company and is obtained from active credit default swap markets.
The Company reviews the fair value hierarchy classification for financial assets and liabilities at the end of each quarter. Changes in significant unobservable valuation inputs may trigger reclassification of financial assets and liabilities between fair value hierarchy levels. As of December 31, 2014, credit risk fair value adjustments constituted less than 15% of the unadjusted fair value of derivative instruments. In instances where Credit Valuation Adjustment (“CVA”) comprises 15% or more of the unadjusted fair value of the derivative instrument for two consecutive quarters the Company’s policy is to categorize the derivative as Level 3 of the fair value hierarchy. As the CVA applied to arrive at the fair value of derivatives is less than 15% of the unadjusted fair value of derivative instruments for two consecutive quarters, the Company has categorized derivative fair valuations at Level 2 of the fair value hierarchy. Transfers into and out of Level 3 of the fair value hierarchy are recognized at the end of each quarter when such categorization takes place.
F-35
TRAVELPORT WORLDWIDE
NOTES TO THE CONSOLIDATED FINANCIAL STATEMENTS
11. Financial Instruments (Continued)
Presented below is a summary of the gross fair value of the Company’s derivative contracts recorded on the consolidated balance sheets at fair value.
| | | | | | | | | | | | | | | | | | | | |
| | | | | Fair Value Asset | | | | | Fair Value (Liability) | |
(in $ millions) | | Balance Sheet Location | | December 31,
2014 | | | December 31,
2013 | | | Balance Sheet Location | | December 31,
2014 | | | December 31,
2013 | |
Derivatives designated as hedging instruments: | | | | | | | | | | | | | | | | | | | | |
Interest rate caps | | Other non-current assets | | $ | — | | | $ | 8 | | | Other non-current liabilities | | $ | — | | | $ | — | |
Derivatives not designated as hedging instruments: | | | | | | | | | | | | | | | | | | | | |
Foreign currency contracts | | Other current assets | | | — | | | | 3 | | | Accrued expenses and other current liabilities | | | (16 | ) | | | (1 | ) |
| | | | | | | | | | | | | | | | | | | | |
Total fair value of derivative assets (liabilities) | | | | $ | — | | | $ | 11 | | | | | $ | (16 | ) | | $ | (1 | ) |
| | | | | | | | | | | | | | | | | | | | |
As of December 31, 2014, the notional amounts of foreign currency forward contracts were $291 million. These derivative contracts cover transactions for periods that do not exceed one year.
The following table provides a reconciliation of the movement in the net carrying amount of derivative financial instruments during the year ended December 31, 2014.
| | | | | | | | |
| | | For the Year Ended
December, 31 | |
(in $ millions) | | 2014 | | | 2013 | |
Net derivative asset – opening balance | | $ | 10 | | | $ | 11 | |
Total loss for the period included in net loss | | | (19 | ) | | | (7 | ) |
Total loss for the period accounted through other comprehensive (loss) income | | | (4 | ) | | | (4 | ) |
Premium paid for interest rate cap derivative contracts | | | — | | | | 12 | |
Proceeds from settlement of foreign currency derivative contracts hedging debt instruments, net | | | (3 | ) | | | (3 | ) |
Settlement of foreign currency derivative contracts and interest rate swaps, net | | | — | | | | 4 | |
Termination of foreign currency derivative contracts (settlement pending) | | | — | | | | (3 | ) |
| | | | | | | | |
Net derivative (liability) asset – closing balance | | $ | (16 | ) | | $ | 10 | |
| | | | | | | | |
During the year ended December 31, 2014, the Company received $3 million in relation to certain foreign exchange derivative contracts which were terminated in 2013 and included in other current assets as of December 31, 2013. During the year ended December 31, 2013, the Company paid $7 million in relation to certain foreign exchange derivative contracts which were terminated in 2012 and included within accrued expenses and other current liabilities as of December 31, 2012.
The significant unobservable inputs used to fair value the Company’s derivative financial instruments are probability of default of approximately 5% and a recovery rate of 20% which are applied to the Company’s credit default swap adjustments. As the credit valuation adjustment applied to arrive at the fair value of derivatives is less than 15% of the unadjusted fair value of derivative instruments for two consecutive quarters, the Company has categorized derivative fair valuations at Level 2 of the fair value hierarchy. A 10% change in the significant unobservable inputs will not have a material impact on the fair value of the derivative financial instruments as of December 31, 2014.
F-36
TRAVELPORT WORLDWIDE
NOTES TO THE CONSOLIDATED FINANCIAL STATEMENTS
11. Financial Instruments (Continued)
The table below presents the impact that changes in fair values of derivatives designated as hedges had on other comprehensive (loss) income and on net income (loss) during the year and the impact derivatives not designated as hedges had on net income (loss) during that year:
| | | | | | | | | | | | | | | | | | | | | | | | | | |
| | | Amount of Gain (Loss)
Recognized
in Other
Comprehensive
(Loss) Income | | | | | Amount of Loss
Recorded
in Net Income (Loss) | |
| | | Year Ended
December 31, | | | Location of Gain (Loss)
Recorded in Income (Loss) | | Year Ended
December 31, | |
(in $ millions) | | 2014 | | | 2013 | | | 2012 | | | | 2014 | | | 2013 | | | 2012 | |
Derivatives designated as hedging instruments: | | | | | | | | | | | | | | | | | | | | | | | | | | |
Interest rate caps | | $ | 4 | | | $ | (4 | ) | | $ | — | | | Interest expense, net | | $ | — | | | $ | — | | | $ | — | |
Derivatives not designated as hedging instruments: | | | | | | | | | | | | | | | | | | | | | | | | | | |
Interest rate caps | | | N/A | | | | N/A | | | | — | | | Interest expense, net | | | (9 | ) | | | — | | | | — | |
Interest rate swaps | | | N/A | | | | N/A | | | | — | | | Interest expense, net | | | — | | | | (3 | ) | | | (4 | ) |
Foreign currency contracts | | | N/A | | | | N/A | | | | — | | | Selling, general and administrative | | | (19 | ) | | | (4 | ) | | | — | |
| | | | | | | | | | | | | | | | | | | | | | | | | | |
| | | | | | | | | | | | | | | | $ | (28 | ) | | $ | (7 | ) | | $ | (4 | ) |
| | | | | | | | | | | | | | | | | | | | | | | | | | |
Fair Value Disclosures for All Financial Instruments
The carrying amounts of cash and cash equivalents, accounts receivable, other current assets, accounts payable, and accrued expenses and other current liabilities approximate fair value due to the short-term maturities of these assets and liabilities. The carrying value of cash held as collateral approximates to its fair value.
The fair values of the Company’s other financial instruments are as follows:
| | | | | | | | | | | | | | | | | | | | |
| | | | | | December 31, 2014 | | | December 31, 2013 | |
(in $ millions) | | Fair Value
Hierarchy | | | Carrying
Amount | | | Fair
Value | | | Carrying
Amount | | | Fair Value | |
Asset (liability) | | | | | | | | | | | | | | | | | | | | |
Equity method investments | | | Level 1 | | | | — | | | | — | | | $ | 19 | | | $ | 349 | |
Available-for-sale securities | | | Level 1 | | | | 6 | | | | 6 | | | | — | | | | — | |
Derivative assets | | | Level 2 | | | | — | | | | — | | | | 11 | | | | 11 | |
Derivative liabilities | | | Level 2 | | | | (16 | ) | | | (16 | ) | | | (1 | ) | | | (1 | ) |
Total debt | | | Level 2 | | | | (2,440 | ) | | | (2,461 | ) | | | (3,573 | ) | | | (3,693 | ) |
Available-for-sale securities as of December 31, 2014 and equity method investments as of December 31, 2013 represent the fair value of the Company’s investment in Orbitz Worldwide which is categorized within Level 1 of the fair value hierarchy as the fair value has been determined based on quoted prices of the shares in active markets.
The fair value of the Company’s total debt has been determined by calculating the fair value of term loans, senior notes and senior subordinated notes based on quoted prices obtained from independent brokers for identical debt instruments when traded as an asset and is categorized within Level 2 of the fair value hierarchy.
F-37
TRAVELPORT WORLDWIDE
NOTES TO THE CONSOLIDATED FINANCIAL STATEMENTS
12. Other Non-Current Liabilities
Other non-current liabilities consisted of:
| | | | | | | | |
(in $ millions) | | December 31,
2014 | | | December 31,
2013 | |
Pension and post-retirement benefit liabilities | | $ | 141 | | | $ | 75 | |
Income tax payable | | | 26 | | | | 23 | |
Other | | | 70 | | | | 74 | |
| | | | | | | | |
| | $ | 237 | | | $ | 172 | |
| | | | | | | | |
13. Employee Benefit Plans
Defined Contribution Savings Plan
The Company sponsors a US defined contribution savings plan that provides certain eligible employees of the Company an opportunity to accumulate funds for retirement. The Company matches the contributions of participating employees on the basis specified by the plan. The Company’s contributions to this plan were approximately $13 million, $15 million and $10 million for the years ended December 31, 2014, 2013 and 2012, respectively.
Defined Benefit Pension and Other Post-Retirement Benefit Plans
The Company sponsors U.S. non-contributory defined benefit pension plans, which cover certain eligible employees. The majority of the employees participating in these plans are no longer accruing benefits. Additionally, the Company sponsors contributory defined benefit pension plans in certain non-U.S. subsidiaries with participation in the plans at the employee’s option. Under both the U.S. and non-U.S. plans, benefits are based on an employee’s years of credited service and a percentage of final average compensation, or as otherwise described by the plan. As of December 31, 2014 and 2013, the aggregate accumulated benefit obligations of these plans were $663 million and $581 million, respectively.
The Company’s policy is to contribute amounts sufficient to meet minimum funding requirements as set forth in employee benefit and tax laws, plus such additional amounts as the Company determines to be appropriate. The Company also maintains other post-retirement health and welfare benefit plans for eligible employees of certain U.S. subsidiaries.
The Company sponsors several defined benefit pension plans for certain employees located outside the U.S. The aggregate benefit obligation for these plans was $91 million and $81 million as of December 31, 2014 and 2013, respectively, and the aggregate fair value of plan assets was $93 million and $91 million for December 31, 2014 and 2013, respectively.
F-38
TRAVELPORT WORLDWIDE
NOTES TO THE CONSOLIDATED FINANCIAL STATEMENTS
13. Employee Benefit Plans (Continued)
The Company uses a December 31 measurement date for its defined benefit pension and other post-retirement benefit plans. For such plans, the following tables provide a statement of funded status as of December 31, 2014 and 2013, and summaries of the changes in the benefit obligation and fair value of assets for the years then ended:
| | | | | | | | |
| | | Defined Benefit Pension Plans | |
(in $ millions) | | Year Ended
December 31,
2014 | | | Year Ended
December 31,
2013 | |
Benefit obligation, beginning of year | | $ | 581 | | | $ | 663 | |
Interest cost | | | 27 | | | | 24 | |
Actuarial loss (gain) | | | 94 | | | | (83 | ) |
Benefits paid | | | (34 | ) | | | (24 | ) |
Currency translation adjustment | | | (5 | ) | | | 1 | |
| | | | | | | | |
Benefit obligation, end of year | | $ | 663 | | | $ | 581 | |
| | | | | | | | |
Fair value of plan assets, beginning of year | | $ | 523 | | | $ | 497 | |
Return on plan assets | | | 41 | | | | 46 | |
Employer contribution | | | 7 | | | | 3 | |
Benefits paid | | | (34 | ) | | | (24 | ) |
Currency translation adjustment | | | (6 | ) | | | 1 | |
| | | | | | | | |
Fair value of plan assets, end of year | | | 531 | | | | 523 | |
| | | | | | | | |
Funded status | | $ | (132 | ) | | $ | (58 | ) |
| | | | | | | | |
The amount included in accumulated other comprehensive loss that has not been recognized as a component of net periodic benefit expense relating to unrecognized actuarial losses was $163 million and $78 million as of December 31, 2014 and 2013, respectively.
| | | | | | | | |
| | | Post-Retirement Benefit Plans | |
(in $ millions) | | Year Ended
December 31,
2014 | | | Year Ended
December 31,
2013 | |
Benefit obligation, beginning of year | | $ | 7 | | | $ | 8 | |
Actuarial gains | | | — | | | | (1 | ) |
Benefits paid | | | — | | | | — | |
| | | | | | | | |
Benefits obligation, end of year | | $ | 7 | | | $ | 7 | |
| | | | | | | | |
Fair value of plan assets, beginning and end of year | | | — | | | | — | |
| | | | | | | | |
Funded status | | $ | (7 | ) | | $ | (7 | ) |
| | | | | | | | |
The amount included in accumulated other comprehensive loss that has not been recognized as a component of net periodic post-retirement benefit expense relating to unrecognized actuarial gains was $2 million and $3 million as of December 31, 2014 and 2013, respectively.
F-39
TRAVELPORT WORLDWIDE
NOTES TO THE CONSOLIDATED FINANCIAL STATEMENTS
13. Employee Benefit Plans (Continued)
The following table provides the components of net periodic (benefit) cost for the respective years:
| | | | | | | | | | | | |
| | | Defined Benefit Pension Plans | |
(in $ millions) | | Year Ended
December 31,
2014 | | | Year Ended
December 31,
2013 | | | Year Ended
December 31,
2012 | |
Interest cost | | $ | 27 | | | $ | 24 | | | $ | 25 | |
Expected return on plan assets | | | (35 | ) | | | (34 | ) | | | (31 | ) |
Recognized net actuarial loss | | | 3 | | | | 14 | | | | 13 | |
| | | | | | | | | | | | |
Net periodic (benefit) cost | | $ | (5 | ) | | $ | 4 | | | $ | 7 | |
| | | | | | | | | | | | |
| | | | | | | | | | | | |
| | | Post-Retirement Benefit Plans | |
(in $ millions) | | Year Ended
December 31,
2014 | | | Year Ended
December 31,
2013 | | | Year Ended
December 31,
2012 | |
Interest cost | | $ | — | | | $ | — | | | $ | — | |
Amortization of prior service cost | | | — | | | | — | | | | — | |
Recognized net actuarial gain | | | — | | | | (1 | ) | | | (4 | ) |
| | | | | | | | | | | | |
Net periodic benefit | | $ | — | | | $ | (1 | ) | | $ | (4 | ) |
| | | | | | | | | | | | |
The Company has utilized the following weighted average assumptions to measure the benefit obligation for the defined benefit pension plans and post-retirement benefit plans as of December 31, 2014 and 2013:
| | | | | | | | |
| | | December 31,
2014 | | | December 31,
2013 | |
Defined Benefit Pension Plans | | | | | | | | |
Discount rate | | | 4.2 | % | | | 4.8 | % |
Expected long-term return on plan assets | | | 6.6 | % | | | 7.0 | % |
Post-Retirement Benefit Plans | | | | | | | | |
Discount rate | | | 4.4 | % | | | 5.3 | % |
During the year ended December 31, 2014, the Company adopted the RP-2014 mortality tables and the Mortality Improvement Scale MP-2014 published by the Society of Actuaries’ Retirement Plans Experience Committee. The adoption of the updated mortality tables and the mortality improvement scale increased the Company’s pension liability by approximately $36 million.
The weighted average expected long-term return on plan assets is based on a number of factors including historic plan asset returns over varying long-term periods, long-term capital markets forecasts, expected asset allocations, risk premiums for respective asset classes, expected inflation and other factors. The Company’s post-retirement benefit plans use an assumed health care cost trend rate of approximately 8.5% for 2014 reduced over eight years until a rate of 5% is achieved. The effect of a one-percentage point change in the assumed health care cost trend would not have a material impact on the net periodic benefit costs or the accumulated benefit obligations of the Company’s health and welfare plans.
The Company seeks to produce a return on investment for the plans which is based on levels of liquidity and investment risk that are prudent and reasonable, given prevailing market conditions. The assets of the plans are managed in the long-term interests of the participants and beneficiaries of the plans. The Company manages this allocation strategy with the assistance of independent diversified professional investment management
F-40
TRAVELPORT WORLDWIDE
NOTES TO THE CONSOLIDATED FINANCIAL STATEMENTS
13. Employee Benefit Plans (Continued)
organizations. The assets and investment strategy of the Company’s UK based defined plans are managed by an independent custodian. The Company’s investment strategy for its US defined benefit plan is to achieve a return sufficient to meet the expected near-term retirement benefits payable under the plan when considered along with the minimum funding requirements. The target allocation of plan assets is 54% in equity securities, 35% in fixed income securities and 11% to all other types of investments.
The fair values of the Company’s pension plan assets by asset category as of December 31, 2014 are as follows:
| | | | | | | | | | | | |
| | | Pension Plan Assets | |
($ in millions) | | Level 1 | | | Level 2 | | | Total | |
Common & commingled trust funds(1) | | | — | | | | 437 | | | | 437 | |
Mutual funds(2) | | | 72 | | | | — | | | | 72 | |
Cash equivalents(3) | | | 22 | | | | — | | | | 22 | |
| | | | | | | | | | | | |
Total | | | 94 | | | | 437 | | | | 531 | |
| | | | | | | | | | | | |
The fair values of the Company’s pension plan assets by asset category as of December 31, 2013 are as follows:
| | | | | | | | | | | | |
| | | Pension Plan Assets | |
($ in millions) | | Level 1 | | | Level 2 | | | Total | |
Common & commingled trust funds(1) | | $ | — | | | $ | 414 | | | $ | 414 | |
Mutual funds(2) | | | 98 | | | | — | | | | 98 | |
Cash equivalents(3) | | | 11 | | | | — | | | | 11 | |
| | | | | | | | | | | | |
Total | | $ | 109 | | | $ | 414 | | | $ | 523 | |
| | | | | | | | | | | | |
| (1) | The underlying investments held in common & commingled trust funds are actively managed equity securities and fixed income investment vehicles that are valued at the net asset value per share provided by the fund administrator multiplied by the number of units held as of the measurement date. |
| (2) | Values of units are based on the closing price reported on the major market on which the investments are traded and provided by the fund administrator. |
| (3) | Cash equivalents comprise of money market funds. |
The Company’s contributions to its defined benefit pension and post-retirement benefit plans are estimated to aggregate $3 million in 2015 as compared to an actual contribution of $7 million in 2014. The decrease in estimated contributions is as a result of a change in US pension funding regulations.
The Company estimates its defined benefit pension and other post-retirement benefit plans will pay benefits to participants as follows:
| | | | | | | | |
(in $ millions) | | Defined Benefit
Pension Plans | | | Post-Retirement
Benefit Plans | |
2015 | | | 30 | | | | — | |
2016 | | | 32 | | | | — | |
2017 | | | 35 | | | | — | |
2018 | | | 39 | | | | — | |
2019 | | | 49 | | | | — | |
Five years thereafter | | | 301 | | | | 1 | |
F-41
TRAVELPORT WORLDWIDE
NOTES TO THE CONSOLIDATED FINANCIAL STATEMENTS
14. Commitments and Contingencies
Commitments
Leases
The Company is committed to making rental payments under non-cancellable operating leases covering various facilities and equipment. Future minimum lease payments required under non-cancellable operating leases as of December 31, 2014 are as follows:
| | | | |
(in $ millions) | | Amount | |
2015 | | | 12 | |
2016 | | | 11 | |
2017 | | | 9 | |
2018 | | | 8 | |
2019 | | | 7 | |
Thereafter | | | 31 | |
| | | | |
| | | 78 | |
| | | | |
During the years ended December 31, 2014, 2013 and 2012, the Company incurred total rental expenses of $16 million, $18 million and $18 million, respectively, primarily related to leases of office facilities.
Commitments under capital leases amounted to $93 million as of December 31, 2014, primarily related to information technology equipment.
Purchase Commitments
In the ordinary course of business, the Company makes various commitments to purchase goods and services from specific suppliers, including those related to capital expenditures. As of December 31, 2014, the Company had approximately $92 million of outstanding purchase commitments, primarily relating to service contracts for information technology, of which $47 million relates to the twelve months ending December 31, 2015. These purchase obligations extend through 2017.
Contingencies
Company Litigation
The Company is involved in various claims, legal proceedings and governmental inquiries related to contract disputes, business practices, intellectual property and other commercial, employment and tax matters. The Company believes it has adequately accrued for such matters as appropriate or, for matters not requiring accrual, believes they will not have a material adverse effect on its results of operations, financial position or cash flows based on information currently available. However, litigation is inherently unpredictable and although the Company believes its accruals are adequate and/or that it has valid defenses in these matters, unfavorable resolutions could occur, which could have a material effect on the Company’s results of operations or cash flows in a particular reporting period.
On March 12, 2013, the Company entered into an agreement to resolve its outstanding litigation with American Airlines and entered into a new long-term distribution agreement. This agreement was approved by the court overseeing the American Airlines bankruptcy proceedings on April 23, 2013.
In connection with the completion of the Company’s comprehensive refinancing, on April 15, 2013, the holders of the Company’s Senior Notes and Senior Subordinated Notes agreed to waive and release all claims asserted and related to the Company’s 2011 debt restructuring. On April 16, 2013, the U.S. District Court for the Southern District of NY dismissed all claims and counterclaims relating to the litigation with prejudice.
F-42
TRAVELPORT WORLDWIDE
NOTES TO THE CONSOLIDATED FINANCIAL STATEMENTS
14. Commitments and Contingencies (Continued)
Standard Guarantees/Indemnification
In the ordinary course of business, the Company enters into numerous agreements that contain standard guarantees and indemnities whereby the Company indemnifies another party for breaches of representations and warranties. In addition, many of these parties are also indemnified against any third-party claim resulting from the transaction that is contemplated in the underlying agreement. Such guarantees or indemnifications are granted under various agreements, including those governing (i) purchases, sales or outsourcing of assets or businesses, (ii) leases of real estate, (iii) licensing of trademarks, (iv) use of derivatives, and (v) issuances of debt securities. The guarantees or indemnifications issued are for the benefit of the (i) buyers in sale agreements and sellers in purchase agreements, (ii) landlords in lease contracts, (iii) licensees of the Company’s trademarks, (iv) financial institutions in derivative contracts, and (v) underwriters in debt security issuances. While some of these guarantees extend only for the duration of the underlying agreement, many survive the expiration of the term of the agreement or extend into perpetuity (unless subject to a legal statute of limitations). There are no specific limitations on the maximum potential amount of future payments the Company could be required to make under these guarantees, nor is the Company able to develop an estimate of the maximum potential amount of future payments to be made under these guarantees, as the triggering events are not subject to predictability and there is little or no history of claims against the Company under such arrangements. With respect to certain of the aforementioned guarantees, such as indemnifications of landlords against third-party claims for the use of real estate property leased by the Company, the Company maintains insurance coverage that mitigates any potential payments to be made.
15. Equity
Description of Capital Stock
The Company has authorized share capital of $1,962,500, consisting of 560,000,000 common shares of par value $0.0025, and 225,000,000 preference shares of par value $0.0025.
Preference Shares
Pursuant to Bermuda law and the Company’s bye-laws, the Company’s Board of Directors by resolution may establish one or more series of preference shares having such number of shares, designations, dividend rates, relative voting rights, conversion or exchange rights, redemption rights, liquidation rights and other relative participation, optional or other special rights, qualifications, limitations or restrictions as may be fixed by the Board without any further shareholder approval. The rights with respect to a series of preferred shares may be greater than the rights attached to the Company’s common shares. It is not possible to state the actual effect of the issuance of any preferred shares on the rights of holders of the Company’s common shares until the Company’s Board determines the specific rights attached to those preferred shares.
The effect of issuing preferred shares could include, among other things, one or more of the following:
| • | | restricting dividends in respect of the Company’s common shares; |
| • | | diluting the voting power of the Company’s common shares or providing that holders of preferred shares have the right to vote on matters as a class; |
| • | | impairing the liquidation rights of the Company’s common shares; or |
| • | | delaying or preventing a change of control of the Company. |
Common Shares
The Company has outstanding 121,411,360 shares, with a par value of $0.0025 per share. The share capital of the Company is divided into shares of a single class the holders of which, subject to the provisions of the bye-
F-43
TRAVELPORT WORLDWIDE
NOTES TO THE CONSOLIDATED FINANCIAL STATEMENTS
15. Equity (Continued)
laws, are (i) entitled to one vote per share, (ii) entitled to such dividends as the Board may from time to time declare, (iii) in the event of a winding-up or dissolution of the Company, whether voluntary or involuntary or for the purpose of a reorganization or otherwise or upon any distribution of capital, entitled to the surplus assets of the Company, and (iv) generally entitled to enjoy all of the rights attaching to shares.
The Board may, subject to the bye-laws and in accordance with Bermudan legislation, declare a dividend to be paid to the shareholders, in proportion to the number of shares held by them. Such dividend may be paid in cash and/or in kind and is subject to limitations under the Company’s debt agreements. No unpaid dividend bears interest. The Board may elect any date as the record date for determining the shareholders entitled to receive any dividend.
On November 4, 2014, the Company’s Board of Directors declared a cash dividend of $0.075 per common share for the third quarter of 2014. Dividends of $9 million were paid on December 18, 2014 to shareholders of record on December 4, 2014. On February 19, 2015, the Company’s Board of Directors declared a cash dividend of $0.075 per common share for the fourth quarter of 2014 (see Note 21—Subsequent Events).
The Board may declare and make such other distributions to the members as may be lawfully made out of the assets of the Company. No unpaid distribution bears interest.
Issuance of Common Shares in IPO
In September 2014, the Company issued 30 million common shares with par value of $0.0025 per share, at a price of $16.00 per share, generating $445 million of net proceeds after deducting underwriting discounts and commissions, and offering expenses. The par value of the shares has been recorded within common shares and the excess of proceeds over the par value of shares has been recorded within additional paid-in-capital on the Company’s consolidated balance sheets as of December 31, 2014.
Issuance of Common Shares in Exchange for Debt
During the year ended December 31, 2014, the Company exchanged $167 million of its senior notes, $313 million of its senior subordinated notes, $70 million of its term loans under the old senior secured credit agreement and $21 million of Tranche 1 term loans under the second lien credit agreement for an aggregate of 29 million of its common shares. The Company recorded the issuance of shares at fair value of $585 million and recognized a loss of $28 million (which includes $12 million of costs incurred) resulting from extinguishment of debt in its consolidated statement of operations.
Purchase of Non-Controlling Interest in a Subsidiary
In June 2014, the Company acquired an additional 16% of equity from the non-controlling shareholders of its majority-owned subsidiary, eNett International (Jersey) Limited (“eNett”), for a total consideration of $65 million thereby increasing its ownership in eNett from 57% to 73%. The excess of consideration paid by the Company of $62 million over the carrying value of the non-controlling interest acquired is recorded within additional paid-in-capital on the Company’s consolidated balance sheets and the cash payment of $65 million has been presented as a financing activity in the Company’s consolidated statements of cash flow. As of December 31, 2014, the Company’s ownership in eNett was diluted to 71% upon the vesting of eNett restricted equity units granted to key employees of eNett.
F-44
TRAVELPORT WORLDWIDE
NOTES TO THE CONSOLIDATED FINANCIAL STATEMENTS
15. Equity (Continued)
Accumulated Other Comprehensive Income (Loss)
Other comprehensive income (loss) represents certain components of revenues, expenses, gains and losses that are included in comprehensive income (loss), but are excluded from net income (loss). Other comprehensive income (loss) amounts are recorded directly as an adjustment to total equity (deficit), net of tax. Accumulated other comprehensive income (loss), net of tax, consisted of:
| | | | | | | | | | | | | | | | | | | | | | | | |
(in $ millions) | | Currency
Translation
Adjustments | | | Unrealized
Gain (Loss) on
Equity
Investments | | | Unrealized
Gain (Loss)
on Cash Flow
Hedges | | | Unrealized
Gain on
Available-
for-Sale
Securities | | | Unrecognized
Actuarial
Gain (Loss)
on
Defined
Benefit
Plans | | | Accumulated
Other
Comprehensive
Income (Loss) | |
Balance as of January 1, 2012 | | | (8 | ) | | | 2 | | | | — | | | | — | | | | (170 | ) | | | (176 | ) |
Activity during period, net of tax of $1(1) | | | 3 | | | | (3 | ) | | | — | | | | — | | | | (13 | ) | | | (13 | ) |
| | | | | | | | | | | | | | | | | | | | | | | | |
Balance as of December 31, 2012 | | | (5 | ) | | | (1 | ) | | | — | | | | — | | | | (183 | ) | | | (189 | ) |
Activity during period, net of tax of $2(1) | | | (5 | ) | | | 9 | | | | (4 | ) | | | — | | | | 107 | | | | 107 | |
| | | | | | | | | | | | | | | | | | | | | | | | |
Balance as of December 31, 2013 | | | (10 | ) | | | 8 | | | | (4 | ) | | | — | | | | (76 | ) | | | (82 | ) |
Activity during period, net of tax of $2(1) | | | (11 | ) | | | (7 | ) | | | 4 | | | | 6 | | | | (84 | ) | | | (92 | ) |
| | | | | | | | | | | | | | | | | | | | | | | | |
Balance as of December 31, 2014 | | | (21 | ) | | | 1 | | | | — | | | | 6 | | | | (160 | ) | | | (174 | ) |
| | | | | | | | | | | | | | | | | | | | | | | | |
| (1) | The tax impact relates to unrecognized actuarial gain (loss) on defined benefit plans. For all other components of accumulated other comprehensive loss, the tax impact was $0 for each of the years ended December 31, 2012, 2013 and 2014. |
16. Equity-Based Compensation
The Company has the following equity-based long-term incentive programs, under which time-based restricted share units (“TRSUs”), performance-based restricted share units (“PRSUs”) performance share units (“PSUs”), and/or stock options of the Company have been granted or authorized for grant to the key employees and directors of the Company:
| • | | 2011 Equity Plan (all of the outstanding TRSUs vested on January 1, 2014) |
| • | | 2014 Omnibus Equity Incentive Plan (“2014 Omnibus Plan”) |
| • | | 2014 Employee Stock Purchase Plan (“2014 ESPP”) |
In December 2011, the Company introduced an equity-based long-term incentive program (the “2011 Equity Plan”) pursuant to which the key employees of the Company were granted shares and restricted share units (“RSUs”). Under this plan, the Board of Directors authorized the grant of 208,000 common shares and 62,286 RSUs to the key employees of the Company. All of the shares and RSUs were recognized as granted for accounting purposes, with the shares vesting immediately and the RSUs vesting on January 1, 2014, dependent on continued service. The grant date fair value of each award under the 2011 Equity Plan was based on a valuation of the total equity of the Company at the time of each grant of an award.
F-45
TRAVELPORT WORLDWIDE
NOTES TO THE CONSOLIDATED FINANCIAL STATEMENTS
16. Equity-Based Compensation (Continued)
During the year ended December 31, 2013, the Board of Directors introduced an equity-based long-term incentive program (the “2013 Equity Plan”) whereby 6.7 million awards were authorized to be granted to certain key employees of the Company. In May 2013, 6 million of RSUs were granted to employees, with two-thirds, or 4 million RSUs, vesting one-sixth semi-annually on April 15 and October 15 each year for a period of three years, if the employee continues to remain in employment. The balance of one-third, or 2 million RSUs, vest on April 15, 2015 upon satisfaction of certain performance conditions. As the performance conditions were not communicated to the employees at the time of grant, the 2 million RSUs were not considered as granted for accounting purposes in May 2013. In May 2014, the Company communicated performance targets for the PRSUs and further granted TRSUs to certain employees. Consequently, 1.9 million RSUs were considered as granted for accounting purposes.
In June 2013, the Board of Directors authorized the grant of 320,000 stock options to the Company’s Non-Executive Chairman, Douglas M. Steenland, which were to vest in April 2016. Of the options granted, 160,000 options were subject to time-based vesting and the balance of 160,000 options were subject to vesting upon achieving certain performance conditions. As the performance conditions were not communicated, only 160,000 options which had time-based vesting were considered as granted for accounting purposes in June 2013. The stock options have a contractual life of five years from the date of grant. In May 2014, the Company communicated performance targets for the 160,000 stock options. Further, in September 2014, the Company modified the terms of the performance-based stock options and converted them fully into time-based options with service conditions, whereby 50% of stock options vest on April 15, 2015 and the remaining 50% vest on April 15, 2016.
In September 2014, upon the consummation of the IPO and under the terms of 2013 Equity Plan, the unvested 2.4 million TRSUs vested immediately, which resulted in additional recognition of compensation cost of approximately $9 million during the year ended December 31, 2014.
On August 4, 2014, the Company’s Board of Directors adopted the 2014 Omnibus Plan, which permits the grant of cash and stock-based incentive awards. The aggregate number of common shares that may be issued or used for reference purposes or with respect to which awards may be granted under the 2014 Omnibus Plan would not exceed 6 million shares. The Company’s employees and the members of its Board of Directors are eligible to receive awards under the 2014 Omnibus Plan. Effective upon the Company’s IPO, the Company’s Board of Directors granted 0.5 million of TRSUs, 0.7 million of PSUs and 0.9 million of stock options under the 2014 Omnibus Plan and 2013 Equity Plan. The TRSUs and stock options vest annually in quarterly installments, on October 15 each year, over a period of four years, if the employee continues to remain in employment during the vesting period. The PSUs vest on October 15, 2017 based on satisfaction of certain performance conditions and continued employment of the employee during the vesting period.
Further, on September 5, 2014, the Company’s Board of Directors adopted the Travelport Worldwide Limited 2014 ESPP which is intended to provide employees of the Company with an opportunity to acquire a proprietary interest in the Company through the purchase of common shares at a discount of up to 15% of the market price of the share. Under the 2014 ESPP, 2.4 million common shares have been reserved as authorized for issuance, none of which have been issued as of December 31, 2014.
F-46
TRAVELPORT WORLDWIDE
NOTES TO THE CONSOLIDATED FINANCIAL STATEMENTS
16. Equity-Based Compensation (Continued)
The fair values of employee options granted were determined using Black-Scholes model and have been estimated as of the date of grant using the following weighted-average assumptions:
| | | | | | |
| | | 2014 | | | 2013 |
Fair value of common share | | | $16 - $20 | | | $4.63 |
Expected term from grant date (in years) | | | 3 - 6.25 | | | 4 |
Risk free interest rate | | | 0.80% - 1.67% | | | 0.85% |
Expected volatility | | | 49% - 60% | | | 65% |
Dividend yield | | | 0% - 2% | | | 0% |
The weighted-average exercise price of options granted during the year ended December 31, 2014 was $15.05 per option, with the remaining weighted average contractual term as of December 31, 2014 of 8.17 years. None of the stock options have vested or have become exercisable as of December 31, 2014.
The activity of the Company’s RSUs and stock options for the years ended December 31, 2014, 2013 and 2012 are presented below:
| | | | | | | | | | | | | | | | |
| | | Restricted Share
Units | | | Stock Options | |
(in dollars, except number of shares, RSUs and stock options) | | Number | | | Weighted
Average
Grant Date
Fair Value | | | Number | | | Weighted
Average
Grant Date
Fair Value | |
Balance as of January 1, 2012 | | | 62,286 | | | $ | 23.13 | | | | — | | | | — | |
Vested(1) | | | (11,463 | ) | | $ | 23.13 | | | | — | | | | — | |
Forfeited | | | (7,296 | ) | | $ | 23.13 | | | | — | | | | — | |
| | | | | | | | | | | | | | | | |
Balance as of December 31, 2012 | | | 43,527 | | | $ | 23.13 | | | | — | | | | — | |
Granted at fair market value | | | 4,065,306 | | | $ | 4.63 | | | | 160,000 | | | $ | 1.50 | |
Vested(1) | | | (652,222 | ) | | $ | 4.63 | | | | — | | | | — | |
Forfeited/cancelled | | | (96,000 | ) | | $ | 4.63 | | | | — | | | | — | |
| | | | | | | | | | | | | | | | |
Balance as of December 31, 2013 | | | 3,360,611 | | | $ | 4.88 | | | | 160,000 | | | $ | 1.50 | |
Granted at fair market value | | | 3,251,661 | | | $ | 18.40 | | | | 1,116,730 | | | $ | 7.46 | |
Vested(1) | | | (3,078,827 | ) | | $ | 4.81 | | | | — | | | | — | |
Forfeited/cancelled | | | (337,023 | ) | | $ | 5.86 | | | | (5,859 | ) | | $ | 6.43 | |
| | | | | | | | | | | | | | | | |
Balance as of December 31, 2014 | | | 3,196,422 | | | $ | 18.68 | | | | 1,270,871 | | | $ | 6.72 | |
| | | | | | | | | | | | | | | | |
| (1) | The Company completed net share settlements for 8,227, 275,599 and 1,390,525 shares for the years ended December 31, 2012, 2013 and 2014, respectively, in connection with employee taxable income created upon issuance of shares. The Company agreed to pay these taxes on behalf of the employees in return for the employees returning an equivalent value of shares. |
The Company’s majority owned subsidiary, eNett, has an equity-based long-term incentive program, pursuant to which the key employees of eNett were granted the right to purchase restricted equity units (“REUs”) in eNett for an exercise price of $1.00 per share of eNett. The REUs vest upon satisfaction of certain performance and service conditions. As of December 31, 2014, approximately 4.6 million REUs were granted, with 3.1 million REUs having been vested. Additionally, the Board of Directors of eNett has approved approximately 2 million REUs which are available for future grants. As of December 31, 2014, eNett has approximately 41 million shares outstanding of which the Company owns approximately 71%. The fair value of the awards granted, as well as the compensation expense recognized, is immaterial for all years presented.
F-47
TRAVELPORT WORLDWIDE
NOTES TO THE CONSOLIDATED FINANCIAL STATEMENTS
16. Equity-Based Compensation (Continued)
Partnership Restricted Equity Units—Class A-2 Units
TDS Investor (Cayman) L.P., the partnership which prior to the comprehensive refinancing in April 2013, indirectly owned a majority shareholding in the Company (the “Partnership”), had an equity-based, long-term incentive program for the purpose of retaining certain key employees of the Company. Under this program, key employees of the Company were granted REUs and profit interests in the Partnership, whereby REUs convert to Class A-2 units pursuant to the terms of the plan. During 2006, the Board of Directors of the Partnership approved the grant of up to approximately 120 million REUs for this incentive plan. The grant date fair value of each award under a plan within the program was based on a valuation of the total equity of the Partnership at the time of each grant of an award.
During 2013, the Board of Directors of the Partnership approved a grant of all the remaining outstanding authorized REUs in the Partnership under the plans, all of which vested during the year. As of December 31, 2013, none of the REUs remained outstanding or authorized for grant and a total of 107.8 million REUs either vested and were converted to Class A-2 units.
The table below sets out the equity-based compensation expense recognized in the consolidated financial statements:
| | | | | | | | | | | | |
(in $ millions) | | Year Ended
December 31,
2014 | | | Year Ended
December 31,
2013 | | | Year Ended
December 31,
2012 | |
REUs | | $ | — | | | $ | 1 | | | $ | 1 | |
RSUs | | | 40 | | | | 5 | | | | 1 | |
Stock options | | | 1 | | | | — | | | | — | |
| | | | | | | | | | | | |
Total equity-based compensation expense | | $ | 41 | | | $ | 6 | | | $ | 2 | |
| | | | | | | | | | | | |
Compensation expense for the years ended December 31, 2014, 2013 and 2012 resulted in a credit to equity (deficit) on the Company’s consolidated balance sheet of $41 million, $6 million and $2 million, respectively, which was offset by a decrease of approximately $23 million, $1 million and $1 million, respectively, due to tax withholding for equity awards as the payment of the taxes is effectively a repurchase of previously granted equity awards.
The Company expects the future equity-based compensation expense in relation to awards recognized for accounting purposes as being granted as of December 31, 2014 will be approximately $42 million based on the fair value of the RSUs and the stock options on the grant date.
F-48
TRAVELPORT WORLDWIDE
NOTES TO THE CONSOLIDATED FINANCIAL STATEMENTS
17. Earnings Per Share
The following table reconciles the numerators and denominators used in the computation of basic and diluted earnings (loss) per share:
| | | | | | | | | | | | |
(in $ millions, except share data) | | Year Ended
December 31,
2014 | | | Year Ended
December 31,
2013 | | | Year Ended
December 31,
2012 | |
Numerator – Basic and Diluted EPS: | | | | | | | | | | | | |
Net income (loss) from continuing operations | | $ | 91 | | | $ | (207 | ) | | $ | (299 | ) |
Net income attributable to non-controlling interest in subsidiaries | | | (5 | ) | | | (3 | ) | | | — | |
| | | | | | | | | | | | |
Net income (loss) from continuing operations attributable to the Company | | $ | 86 | | | $ | (210 | ) | | $ | (299 | ) |
| | | | | | | | | | | | |
| | | |
Denominator – Basic EPS: | | | | | | | | | | | | |
Weighted average common shares outstanding | | | 85,771,655 | | | | 45,522,506 | | | | 8,129,920 | |
| | | | | | | | | | | | |
Income (loss) per share from continuing operations | | $ | 1.01 | | | $ | (4.62 | ) | | $ | (36.76 | ) |
| | | | | | | | | | | | |
Denominator – Diluted EPS: | | | | | | | | | | | | |
Number of shares used for Basic EPS | | | 85,771,655 | | | | 45,522,506 | | | | 8,129,920 | |
Weighted average effect of dilutive securities | | | | | | | | | | | | |
RSUs | | | 1,988,145 | | | | — | | | | — | |
Stock options | | | 104,290 | | | | — | | | | — | |
| | | | | | | | | | | | |
Weighted average common shares outstanding – Diluted | | | 87,864,090 | | | | 45,522,506 | | | | 8,129,920 | |
| | | | | | | | | | | | |
Income (loss) per share from continuing operations | | $ | 0.98 | | | $ | (4.62 | ) | | $ | (36.76 | ) |
| | | | | | | | | | | | |
Basic earnings per share is based on the weighted average number of common shares outstanding during each period. Diluted earnings per share is based on the weighted average number of common shares outstanding and the effect of all dilutive common shares equivalents during each period.
For the year ended December 31, 2014, the Company had 0.2 million of common share equivalents associated with the Company’s stock options that were excluded from the calculation of diluted earnings per share as their inclusion would have been antidilutive as the shares repurchased from the total assumed proceeds applying the treasury stock method exceeded the shares that would have been issued.
For the years ended December 2013 and 2012, the Company had 3.5 million and 0.8 million of common share equivalents, respectively, primarily associated with the Company’s RSUs and stock options. As the Company recorded net losses from continuing operations for these years, all common share equivalents were excluded from the calculation of diluted earnings per share as their inclusion would have been anti-dilutive. As a result, basic and diluted earnings per share are equal for those years.
18. Segment Information
The US GAAP measures which the Chief Operating Decision Maker (the “CODM”) use to evaluate the performance of the Company are net revenue and Adjusted EBITDA, which is defined as net income (loss) from continuing operations excluding depreciation and amortization of property and equipment and acquired intangible assets, amortization of customer loyalty payments, interest, income taxes, gain (loss) on early extinguishment of debt, share of earnings (losses) in equity method investments, and items that the management and the CODM view as outside the normal course of operations such as, gain on sale of shares of Orbitz
F-49
TRAVELPORT WORLDWIDE
NOTES TO THE CONSOLIDATED FINANCIAL STATEMENTS
18. Segment Information (Continued)
Worldwide, non-cash equity-based compensation, certain corporate and restructuring costs, certain litigation and related costs, and other non-cash items such as foreign currency gains (losses) on euro denominated debt and earnings hedges. Such adjustments are also excluded under the Company’s debt covenants.
Reportable segments are determined based on the financial information which is available and utilized on a regular basis by the CODM to assess financial performance and to allocate resources. The Company has one reportable segment.
The Company maintains operations in the United States, United Kingdom and other international territories. The geographic segment information provided below is classified based on geographic location of the Company’s subsidiaries:
| | | | | | | | | | | | | | | | |
(in $ millions) | | United
States | | | United
Kingdom | | | All Other
Countries | | | Total | |
Net Revenue | | | | | | | | | | | | | | | | |
Year ended December 31, 2014 | | | 786 | | | | 174 | | | | 1,188 | | | | 2,148 | |
Year ended December 31, 2013 | | | 772 | | | | 162 | | | | 1,142 | | | | 2,076 | |
Year ended December 31, 2012 | | | 795 | | | | 155 | | | | 1,052 | | | | 2,002 | |
Long-Lived Assets (excluding financial instruments and deferred tax assets) | | | | | | | | | | | | | | | | |
As of December 31, 2014 | | | 1,341 | | | | 18 | | | | 1,112 | | | | 2,471 | |
As of December 31, 2013 | | | 1,478 | | | | 39 | | | | 1,092 | | | | 2,609 | |
As of December 31, 2012 | | | 1,630 | | | | 31 | | | | 1,054 | | | | 2,715 | |
Net revenue by country is determined by the location code for the segment booking for transaction processing revenue and the domicile of the legal entity receiving the revenue for Airline IT Solutions revenue. Travel Commerce Platform revenue, consisting of air and beyond air, accounts for 95% of total Net revenue with revenue from Technology Services accounting for the remaining 5%.
19. Related Party Transactions
Transactions with Entities Related to Owners
Prior to the comprehensive refinancing in April 2013, Blackstone was the ultimate controlling shareholder in the Company. Subsequent to the comprehensive refinancing, Blackstone continued to be a principal shareholder of the Company until September 2014 when the Company issued its common shares in an IPO. Blackstone has ownership interests in a broad range of companies and has affiliations with other companies. The Company has entered into commercial transactions on an arms-length basis in the ordinary course of business with these companies, including the sale and purchase of goods and services. For example, prior to comprehensive refinancing in 2013 and during the year ended December 31, 2012, the Company recorded revenue of approximately $9 million and $23 million, respectively, from Hilton Hotels Corporation and $3 million and $9 million, respectively, from Wyndham Hotel Group, (both Hilton Hotels Corporation and Wyndham Hotel Group being Blackstone portfolio companies) in connection with booking fees received. Other than as described herein, none of these transactions or arrangements is of great enough value to be considered material.
During 2014, 2013 and 2012, the Company paid approximately $11 million, $7 million and $2 million, respectively, to an affiliate of Blackstone for advisory and consulting services incurred in relation to debt for equity exchanges and refinancing transactions.
F-50
TRAVELPORT WORLDWIDE
NOTES TO THE CONSOLIDATED FINANCIAL STATEMENTS
19. Related Party Transactions (Continued)
Pursuant to the Transaction and Monitoring Fee Arrangement (“TMFA”) agreement entered into in 2008 with Blackstone and an affiliate of Technology Crossover Ventures (“TCV”) (who were then principal shareholders of the Company) and its subsequent amendment in March 2013 (where Blackstone and TCV agreed (i) to a one-third reduction in the amount of fees that would otherwise be payable under TMFA, (ii) that the Company had no obligation to pay the advisory fee until the Company’s outstanding indebtedness under the second lien credit agreement is repaid, refined or extended and (iii) to share a portion of the fee with Angelo Gordon and Q Investments), the Company made payments of approximately $26 million, $6 million and $5 million during 2014, 2013 and 2012 respectively. As of December 31, 2014, there is no outstanding balance of obligation under the TMFA; however, as of December 31, 2013, the outstanding advisory fee payable was $26 million.
Transactions with Orbitz Worldwide
During the period from January 1, 2014 to July 22, 2014 and the years ended December 31, 2013 and 2012, (during which Orbitz Worldwide was an equity method investee of the Company), the Company had transactions and outstanding balances with Orbitz Worldwide. These are presented in Note 4.
20. Discontinued Operations
In connection with the sale of the Gullivers Travel Association business to Kuoni in 2011, the Company agreed to indemnify Kuoni up to May 2017 for certain potential tax liabilities relating to pre-sale events. An estimate of the Company’s obligations under those indemnities is included within other non-current liabilities on the Company’s consolidated balance sheets as of December 31, 2014 and 2013.
During the years ended December 31, 2013 and 2012, the Company either settled certain of its obligations under those indemnities and/or determined the liabilities would not be payable due to expiration of the statute of limitations and realized a gain of $4 million and $7 million, respectively.
21. Subsequent Events
On January 16, 2015, the Company amended its senior secured credit agreement to increase the amount of revolving credit commitments by $25 million, resulting in a total of $125 million of revolving credit facility commitments available to the Company.
On February 5, 2015, the Company sold all of its remaining investment in Orbitz Worldwide.
On February 19, 2015, the Company’s Board of Directors declared a cash dividend of $0.075 per common share for the fourth quarter of 2014. The dividend is payable on March 19, 2015 to shareholders of record on March 5, 2015.
F-51
TRAVELPORT WORLDWIDE LIMITED
SCHEDULE II—VALUATION AND QUALIFYING ACCOUNTS
DECEMBER 31, 2014, 2013 AND 2012
| | | | | | | | | | | | | | | | |
(in $ millions) | | Balance at
Beginning of
Period | | | Charged to
Expense or Other
Accounts | | | Write-Offs and
Other Adjustments | | | Balance at End of
Period | |
Allowance for Doubtful Accounts: | | | | | | | | | | | | | | | | |
Year ended December 31, 2014 | | | 13 | | | | 3 | | | | (2 | ) | | | 14 | |
Year ended December 31, 2013 | | | 16 | | | | 4 | | | | (7 | ) | | | 13 | |
Year ended December 31, 2012 | | | 22 | | | | 4 | | | | (10 | ) | | | 16 | |
| | | | |
Valuation Allowance for Deferred Tax Assets: | | | | | | | | | | | | | | | | |
Year ended December 31, 2014 | | | 345 | | | | 166 | | | | (90 | ) | | | 421 | |
Year ended December 31, 2013 | | | 302 | | | | 24 | | | | 19 | | | | 345 | |
Year ended December 31, 2012 | | | 323 | | | | 48 | | | | (69 | ) | | | 302 | |
F-52
EXHIBIT INDEX
| | |
Exhibit No. | | Description |
| |
| 2.1 | | Purchase Agreement by and among Cendant Corporation, Travelport Americas, Inc. (f/k/a Travelport Inc.), and Travelport LLC (f/k/a TDS Investor Corporation, f/k/a TDS Investor LLC), dated as of June 30, 2006 (Incorporated by reference to Exhibit 2.1 to the Registration Statement on Form S-4 of Travelport Limited (333-141714) filed on March 30, 2007). |
| |
| 2.2 | | Amendment to the Purchase Agreement among Cendant Corporation, Travelport Americas, Inc., (f/k/a Travelport Inc.) (f/k/a TDS Investor Corporation, f/k/a TDS Investor LLC) and Travelport Limited (f/k/a TDS Investor (Bermuda), Ltd.), dated as of August 23, 2006, to the Purchase Agreement dated as of June 30, 2006 (Incorporated by reference to Exhibit 2.2 to the Registration Statement on Form S-4 of Travelport Limited (333-141714) filed on March 30, 2007). |
| |
| 2.3 | | Agreement and Plan of Merger by and among Travelport LLC (f/k/a Travelport Inc.) Warpspeed Sub Inc., Worldspan Technologies Inc., Citigroup Venture Capital Equity Partners, L.P., Ontario Teachers Pension Plan Board and Blackstone Management Partners V, L.P., dated as of December 7, 2006 (Incorporated by reference to Exhibit 2.3 to the Registration Statement on Form S-4 of Travelport Limited (333-141714) filed on March 30, 2007). |
| |
| 2.4 | | Separation and Distribution Agreement by and among Cendant Corporation (n/k/a Avis Budget Group, Inc.), Realogy Corporation, Wyndham Worldwide Corporation and Travelport Americas, Inc. (f/k/a Travelport Inc.), dated as of July 27, 2006 (Incorporated by reference to Exhibit 2.1 to Cendant Corporation’s Current Report on Form 8-K dated August 1, 2006). |
| |
| 2.5 | | Share Purchase Agreement, dated March 5, 2011, among Gullivers Services Limited, Travelport (Bermuda) Ltd., Travelport Inc., Travelport Limited, Kuoni Holdings PLC, Kuoni Holding Delaware, Inc., KIT Solution AG and Kuoni Reisen Holding AG (Incorporated by reference to Exhibit 2.5 to the Annual Report on Form 10-K filed by Travelport Limited on March 31, 2011). |
| |
| 3.1 | | Amended and Restated Memorandum of Association of Travelport Worldwide Limited (Incorporated by reference to Exhibit 3.1 to the Current Report on Form 8-K filed by Travelport Worldwide Limited on September 30, 2014). |
| |
| 3.2 | | Amended and Restated Bye-laws of Travelport Worldwide Limited (Incorporated by reference to Exhibit 3.2 to the Current Report on Form 8-K filed by Travelport Worldwide Limited on September 30, 2014). |
| |
| 4.1 | | Amended and Restated Shareholders’ Agreement, dated as of April 15, 2013, among Travelport Worldwide Limited, Travelport Intermediate Limited, TDS Investor (Cayman) L.P., Travelport Limited and the other shareholders party thereto (Incorporated by reference to Exhibit 4.10 to the Annual Report on Form 10-K filed by Travelport Limited on March 10, 2014). |
| |
| 4.2 | | Registration Rights Agreement, dated as of April 15, 2013, among the shareholders referred to therein and Travelport Worldwide Limited (Incorporated by reference to Exhibit 4.14 to the Registration Statement on Form S-1 of Travelport Worldwide Limited (333-196506) filed on August 18, 2014). |
| |
| 10.1 | | Credit Agreement, dated as of September 2, 2014, among Travelport Limited, Travelport Finance (Luxembourg) S.a.r.l., the Guarantors, Deutsche Bank AG New York Branch, as Administrative Agent, Collateral Agent and L/C Issuer, and each lender (Incorporated by reference to Exhibit 10.1 to the Current Report on Form 8-K filed by Travelport Limited on September 4, 2014). |
| |
| 10.2 | | Incremental Amendment, dated as of January 16, 2015, among Travelport Finance (Luxembourg) S.a.r.l., as borrower, Travelport Limited, UBS AG Stamford Branch, as incremental Revolving Credit Lender and additional L/C Issuer, Deutsche Bank AG New York Branch, as Administrative Agent and Collateral Agent, and consented and agreed to by Deutsche Bank AG New York Branch, Credit Suisse AG, Cayman Islands Branch, and Morgan Stanley Senior Funding, Inc., as the existing L/C Issuers (Incorporated by reference to Exhibit 10.1 to the Current Report on Form 8-K filed by Travelport Worldwide Limited on January 22, 2015). |
G-1
| | |
Exhibit No. | | Description |
| |
| 10.3 | | Tax Sharing Agreement among Cendant Corporation (n/k/a Avis Budget Group, Inc.), Realogy Corporation, Wyndham Worldwide Corporation and Travelport Americas, Inc. (f/k/a Travelport Inc.), dated as of July 28, 2006 (Incorporated by reference to Exhibit 10.1 to Cendant Corporation’s Current Report on Form 8-K dated August 1, 2006). |
| |
| 10.4 | | Separation Agreement, dated as of July 25, 2007, by and between Travelport Limited and Orbitz Worldwide, Inc. (Incorporated by reference to Exhibit 10.1 to the Current Report on Form 8-K filed by Travelport Limited on July 27, 2007 (dated July 23, 2007)). |
| |
| 10.5 | | First Amendment to the Separation Agreement, dated as of May 5, 2008, between Travelport Limited and Orbitz Worldwide, Inc. (Incorporated by reference to Exhibit 10.1 to the Current Report on Form 8-K filed by Travelport Limited on May 7, 2008). |
| |
| 10.6 | | Second Amendment to the Separation Agreement, dated as of January 23, 2009, between Travelport Limited and Orbitz Worldwide, Inc. (Incorporated by reference to Exhibit 10.34 to the Annual Report on Form 10-K filed by Travelport Limited on March 12, 2009). |
| |
| 10.7 | | Third Amendment to the Separation Agreement, dated as of May 9, 2013, between Travelport Limited and Orbitz Worldwide, Inc. (Incorporated by reference to Exhibit 10.1 to the Quarterly Report on Form 10-Q filed by Travelport Limited on November 7, 2013). |
| |
| 10.8 | | Tax Sharing Agreement, dated as of July 25, 2007, by and between Travelport Inc. and Orbitz Worldwide, Inc. (Incorporated by reference to Exhibit 10.3 to the Current Report on Form 8-K filed by Travelport Limited on July 27, 2007 (dated July 23, 2007)). 4, 2014 |
| |
| 10.9 | | Subscriber Services Agreement, dated as of February, by and among Orbitz Worldwide, LLC, Travelport, LP and Travelport Global Distribution System B.V. (Incorporated by reference to Exhibit 10.1 to the Quarterly Report on Form10-Q filed by Travelport Limited on May 9, 2014).* |
| |
| 10.10 | | Amended and Restated Employment Agreement of Eric J. Bock, dated as of August 3, 2009 (Incorporated by reference to Exhibit 10.3 to the Quarterly Report on Form 10-Q filed by Travelport Limited on August 6, 2009). |
| |
| 10.11 | | Letter Agreement of Eric J. Bock, dated as of May 27, 2011 (Incorporated by reference to Exhibit 10.3 to the Current Report on Form 8-K filed by Travelport Limited on June 3, 2011 (dated May 27, 2011)). |
| |
| 10.12 | | Service Agreement dated as of May 31, 2011 between Gordon Wilson and Travelport International Limited (Incorporated by reference to Exhibit 10.2 to the Current Report on Form 8-K of Travelport Limited filed on June 3, 2011 (dated May 27, 2011)). |
| |
| 10.13 | | Letter Agreement of Gordon Wilson, dated as of November 7, 2012, between Gordon Wilson and Travelport International Limited. (Incorporated by reference to Exhibit 10.26 to the Annual Report on Form 10-K filed by Travelport Limited on March 12, 2013). |
| |
| 10.14 | | Contract of Employment, dated as of October 1, 2009, among Philip Emery, Travelport International Limited and TDS Investor (Cayman) L.P. (Incorporated by reference to Exhibit 10.1 to the Current Report on Form 8-K filed by Travelport Limited on October 7, 2009). |
| |
| 10.15 | | Letter Agreement, dated March 28, 2011, between Philip Emery and Travelport International Limited (Incorporated by reference to Exhibit 10.46 to the Annual Report on Form 10-K filed by Travelport Limited on March 31, 2011). |
| |
| 10.16 | | Letter Agreement, dated November 24, 2011, between Philip Emery and Travelport International Limited. (Incorporated by reference to Exhibit 10.16 to the Annual Report on Form 10-K filed by Travelport Limited on March 22, 2012). |
G-2
| | |
Exhibit No. | | Description |
| |
| 10.17 | | Employment Agreement of Mark Ryan, effective as of December 16, 2011 (Incorporated by reference to Exhibit 10.30 to the Annual Report on Form 10-K filed by Travelport Limited on March 12, 2013). |
| |
| 10.18 | | Letter Agreement of Mark Ryan, dated as of December 3, 2012 (Incorporated by reference to Exhibit 10.31 to the Annual Report on Form 10-K filed by Travelport Limited on March 12, 2013). |
| |
| 10.19 | | Employment Agreement of Kurt Ekert, dated as of October 21, 2011 (Incorporated by reference to Exhibit 10.20 to the Annual Report on Form 10-K filed by Travelport Limited on March 22, 2012). |
| |
| 10.20 | | Letter Agreement of Kurt Ekert, dated as of November 23, 2011 (Incorporated by reference to Exhibit 10.21 to the Annual Report on Form 10-K filed by Travelport Limited on March 22, 2012). |
| |
| 10.21 | | Letter Agreement of Kurt Ekert, dated as of March 6, 2013 (Incorporated by reference to Exhibit 10.6 to the Quarterly Report on Form 10-Q filed by Travelport Limited on May 9, 2013). |
| |
| 10.22 | | Letter Agreement of Matthew Minetola, dated as of November 4, 2014. |
| |
| 10.23 | | Travelport Officer Deferred Compensation Plan (Amended and Restated as of December 31, 2012) (Incorporated by reference to Exhibit 10.35 to the Annual Report on Form 10-K filed by Travelport Limited on March 12, 2013). |
| |
| 10.24 | | Form of Travelport Worldwide Limited 2011 Equity Plan (Incorporated by reference to Exhibit 10.3 to the Current Report on Form 8-K filed by Travelport Limited on December 20, 2011 (dated December 14, 2011)). |
| |
| 10.25 | | Form of Travelport Worldwide Limited Management Equity Award Agreement (US Named Executive Officers) (Incorporated by reference to Exhibit 10.4 to the Current Report on Form 8-K filed by Travelport Limited on December 20, 2011 (dated December 14, 2011)). |
| |
| 10.26 | | Form of Travelport Worldwide Limited Management Equity Award Agreement (UK Named Executive Officers) (Incorporated by reference to Exhibit 10.5 to the Current Report on Form 8-K filed by Travelport Limited on December 20, 2011 (dated December 14, 2011)). |
| |
| 10.27 | | Form of Travelport Worldwide Limited Management Equity Award Agreement (M. Ryan) (Incorporated by reference to Exhibit 10.46 to the Annual Report on Form 10-K filed by Travelport Limited on March 12, 2013). |
| |
| 10.28 | | 2012 Executive Long-Term Incentive Plan (Incorporated by reference to Exhibit 10.33 to the Annual Report on Form 10-K filed by Travelport Limited on March 22, 2012). |
| |
| 10.29 | | Form of 2013 Long-Term Management Incentive Program Management Award Agreement (US) (Incorporated by reference to Exhibit 10.48 to the Annual Report on Form 10-K filed by Travelport Limited on March 12, 2013). |
| |
| 10.30 | | Form of 2013 Long-Term Management Incentive Program Management Award Agreement (UK) (Incorporated by reference to Exhibit 10.49 to the Annual Report on Form 10-K filed by Travelport Limited on March 12, 2013). |
| |
| 10.31 | | Form of Travelport Worldwide Limited 2013 Equity Plan (Incorporated by reference to Exhibit 10.5 to the Quarterly Report on Form 10-Q filed by Travelport Limited on August 8, 2013). |
| |
| 10.32 | | Form of 2013 Travelport Worldwide Limited Management Equity Award Agreement (US Named Executive Officers) (Incorporated by reference to Exhibit 10.6 to the Quarterly Report on Form 10-Q filed by Travelport Limited on August 8, 2013). |
| |
| 10.33 | | Form of 2013 Travelport Worldwide Limited Management Equity Award Agreement (UK Named Executive Officers) (Incorporated by reference to Exhibit 10.7 to the Quarterly Report on Form 10-Q filed by Travelport Limited on August 8, 2013). |
G-3
| | |
Exhibit No. | | Description |
| |
| 10.34 | | Amendment 11 to the Asset Management Offering Agreement, effective as of July 1, 2002, as amended, among Travelport, LP, International Business Machines Corporation and IBM Credit LLC (Incorporated by reference to Exhibit 10.3 to the Quarterly Report on Form 10-Q filed by Travelport Limited on May 6, 2010).* |
| |
| 10.35 | | Amendment 14 to the Asset Management Offering Agreement, effective as of July 1, 2002, as amended, among Travelport, LP, International Business Machines Corporation and IBM Credit LLC. (Incorporated by reference to Exhibit 10.55 to the Annual Report on Form 10-K filed by Travelport Limited on March 12, 2013).* |
| |
| 10.36 | | Amendment 15 to the Asset Management Offering Agreement, effective as of July 1, 2002, as amended, among Travelport, LP, International Business Machines Corporation and IBM Credit LLC (Incorporated by reference to Exhibit 10.50 to the Annual Report on Form 10-K filed by Travelport Limited on March 10, 2014). |
| |
| 10.37 | | Amendment 16 to the Asset Management Offering Agreement, effective as of July 1, 2002, as amended, among Travelport, LP, International Business Machines Corporation and IBM Credit LLC (Incorporated by reference to Exhibit 10.51 to the Annual Report on Form 10-K filed by Travelport Limited on March 10, 2014).* |
| |
| 10.38 | | Form of Indemnification Agreement between Travelport Limited and its Directors (Incorporated by reference to Exhibit 10.1 to the Current Report on Form 8-K filed by Travelport Limited on December 20, 2011 (dated December 14, 2011)). |
| |
| 10.39 | | Form of Indemnification Agreement between Travelport Limited and certain of its Officers (Incorporated by reference to Exhibit 10.2 to the Current Report on Form 8-K filed by Travelport Limited on December 20, 2011 (dated December 14, 2011)). |
| |
| 10.40 | | Letter Agreement between Travelport Limited and Douglas M. Steenland, effective as of May 1, 2013 (Incorporated by reference to Exhibit 10.4 to the Quarterly Report on Form 10-Q filed by Travelport Limited on May 9, 2013). |
| |
| 10.41 | | Letter Agreement between Travelport Worldwide Limited and Douglas M. Steenland, effective as of September 24, 2014. |
| |
| 10.42 | | Letter Agreement between Travelport Limited and Jeff Clarke, effective as of May 1, 2013 (Incorporated by reference to Exhibit 10.5 to the Quarterly Report on Form 10-Q filed by Travelport Limited on May 9, 2013). |
| |
| 10.43 | | Form of Director Stock Option Agreement (Incorporated by reference to Exhibit 10.8 to the Quarterly Report on Form 10-Q filed by Travelport Limited on August 8, 2013). |
| |
| 10.44 | | Agreement and Release, dated March 5, 2014, between Mark Ryan and Travelport, LP (Incorporated by reference to Exhibit 10.2 to the Quarterly Report on Form 10-Q filed by Travelport Limited on May 8, 2014). |
| |
| 10.45 | | First Amendment to the Subscriber Services Agreement, dated as of May 2, 2014, between Travelport, LP, Travelport Global Distribution System B.V. and Orbitz Worldwide, LLC (Incorporated by reference to Exhibit 10.1 to the Quarterly Report on Form 10-Q filed by Travelport Limited on August 7, 2014).* |
| |
| 10.46 | | Second Amendment to the Subscriber Services Agreement, dated as of July 22, 2014, between Travelport, LP, Travelport Global Distribution System B.V. and Orbitz Worldwide, LLC (Incorporated by reference to Exhibit 10.10 to the Quarterly Report on Form 10-Q filed by Travelport Worldwide Limited on November 6, 2014).* |
| |
| 10.47 | | Travelport Worldwide Limited Annual Performance Bonus Plan (Incorporated by reference to Exhibit 10.62 to the Registration Statement on Form S-1 of Travelport Worldwide Limited (333-196506) filed on September 10, 2014). |
| |
| 10.48 | | Travelport Worldwide Limited 2014 Employee Stock Purchase Plan (Incorporated by reference to Exhibit 10.63 to the Registration Statement on Form S-1 of Travelport Worldwide Limited (333-196506) filed on September 10, 2014). |
G-4
| | |
Exhibit No. | | Description |
| |
| 10.49 | | Form of Travelport Worldwide Limited Management Equity Award Agreement (United States) (Incorporated by reference to Exhibit 10.64 to the Registration Statement on Form S-1 of Travelport Worldwide Limited (333-196506) filed on September 10, 2014). |
| |
| 10.50 | | Form of Travelport Worldwide Limited Management Equity Award Agreement (United Kingdom/RoW) (Incorporated by reference to Exhibit 10.65 to the Registration Statement on Form S-1 of Travelport Worldwide Limited (333-196506) filed on September 10, 2014). |
| |
| 10.51 | | Amendment to Travelport Worldwide Limited 2013 Equity Plan, dated September 5, 2014 (Incorporated by reference to Exhibit 10.66 to the Registration Statement on Form S-1 of Travelport Worldwide Limited (333-196506) filed on September 10, 2014). |
| |
| 10.52 | | Transition and Separation Agreement, dated August 7, 2014, between Travelport Limited and Eric J. Bock (Incorporated by reference to Exhibit 10.67 to the Registration Statement on Form S-1 of Travelport Worldwide Limited (333-196506) filed on September 10, 2014). |
| |
| 10.53 | | Travelport Worldwide Limited 2014 Omnibus Incentive Plan (Incorporated by reference to Exhibit 10.68 to the Registration Statement on Form S-1 of Travelport Worldwide Limited (333-196506) filed on September 10, 2014). |
| |
| 10.54 | | Form of Indemnification Agreement of Travelport Worldwide Limited (Incorporated by reference to Exhibit 10.69 to the Registration Statement on Form S-1 of Travelport Worldwide Limited (333-196506) filed on September 10, 2014). |
| |
| 10.55 | | Form of Director Award Agreement (Restricted Stock Units) (Incorporated by reference to Exhibit 10.9 to the Quarterly Report on Form 10-Q filed by Travelport Worldwide Limited on November 6, 2014). |
| |
| 21 | | List of Subsidiaries. |
| |
| 23 | | Consent of Deloitte LLP. |
| |
| 31.1 | | Certification of Chief Executive Officer Pursuant to Rules 13(a)-14(a) and 15(d)-14(a) as adopted pursuant to Section 302 of the Sarbanes-Oxley Act of 2002. |
| |
| 31.2 | | Certification of Chief Financial Officer Pursuant to Rules 13(a)-14(a) and 15(d)-14(a) as adopted pursuant to Section 302 of the Sarbanes-Oxley Act of 2002. |
| |
| 32 | | Certification Pursuant to 18 U.S.C. Section 1350, as Adopted Pursuant to Section 906 of the Sarbanes-Oxley Act of 2002. |
| |
| 99.1 | | Financial Statements and Supplementary Data of Orbitz Worldwide, Inc. (Incorporated by reference to Exhibit 99 to the Annual Report on Form 10-K filed by Travelport Limited on March 10, 2014). |
| |
| 99.2 | | Financial Statements of Orbitz Worldwide, Inc. |
| |
| 101.INS | | XBRL Instance Document |
| |
| 101.SCH | | XBRL Taxonomy Extension Schema Document |
| |
| 101.CAL | | XBRL Taxonomy Extension Calculation Linkbase Document |
| |
| 101.LAB | | XBRL Taxonomy Extension Labels Linkbase Document |
| |
| 101.PRE | | XBRL Taxonomy Extension Presentation Linkbase Document |
| |
| 101.DEF | | XBRL Taxonomy Extension Definition Linkbase Document |
| * | Portions of this document have been omitted and filed separately with the Securities and Exchange Commission pursuant to a request for confidential treatment pursuant to Rule 24b-2. |
G-5