 Analyst Presentation June 2008 Exhibit 99.1 |
  2 Safe Harbor Disclaimer You are cautioned that certain statements made in this presentation are “forward-looking” statements within the meaning of the Private Securities Litigation Reform Act of 1995. Forward-looking statements include, without limitation, any statement that may project, indicate or imply future results, events, performance or achievements, and may contain the words “expect”, “intend”, “plan”, “anticipate”, “estimate”, “believe”, “will be”, “will continue”, “will likely result”, and similar expressions. In addition, any statement that may be provided by management concerning future financial performance (including future revenues, earnings or growth rates), ongoing business strategies or prospects, and possible actions by Lorillard, Inc. are also forward-looking statements as defined by the Act. Forward-looking statements are based on current expectations and projections about future events and are inherently subject to a variety of risks and uncertainties, many of which are beyond the control of Lorillard, Inc., that could cause actual results to differ materially from those anticipated or projected. Information describing factors that could cause actual results to differ materially from those in forward-looking statements is available in Lorillard, Inc.’s various filings with the Securities and Exchange Commission. These filings are available from the SEC over the Internet or on hard copy, and are, in some cases, available from Lorillard, Inc. as well. Forward-looking statements speak only as of the time they are made, and Lorillard, Inc. expressly disclaim any obligation or undertaking to update these statements to reflect any change in expectations or beliefs or any change in events, conditions or circumstances on which any forward-looking statement is based. This forward-looking statements disclaimer is only a brief summary of Lorillard, Inc.’s statutory forward-looking-statements disclaimer. You are urged to read that disclaimer, which is included in Lorillard’s S-4 filing with the SEC, in full. |
  3 Regulation G Compliance You are also reminded that during this presentation, certain non-GAAP financial measures, such as EBIT, EBITDA and Operating Profit per unit may be discussed. These measures should not be considered an alternative to net income, or any other measure of financial performance or liquidity presented in accordance with generally accepted accounting principles (GAAP). These measures are not necessarily comparable to a similarly titled measure of another company. Please refer to the accompanying slides for information that reconciles these discussed figures with the most comparable GAAP measures. |
  4 Today’s Presenters Martin L. Orlowsky Chairman, President and Chief Executive Officer David H. Taylor Executive Vice President, Finance and Planning, Chief Financial Officer |
 Overview of Lorillard Martin L. Orlowsky Chairman, President and Chief Executive Officer |
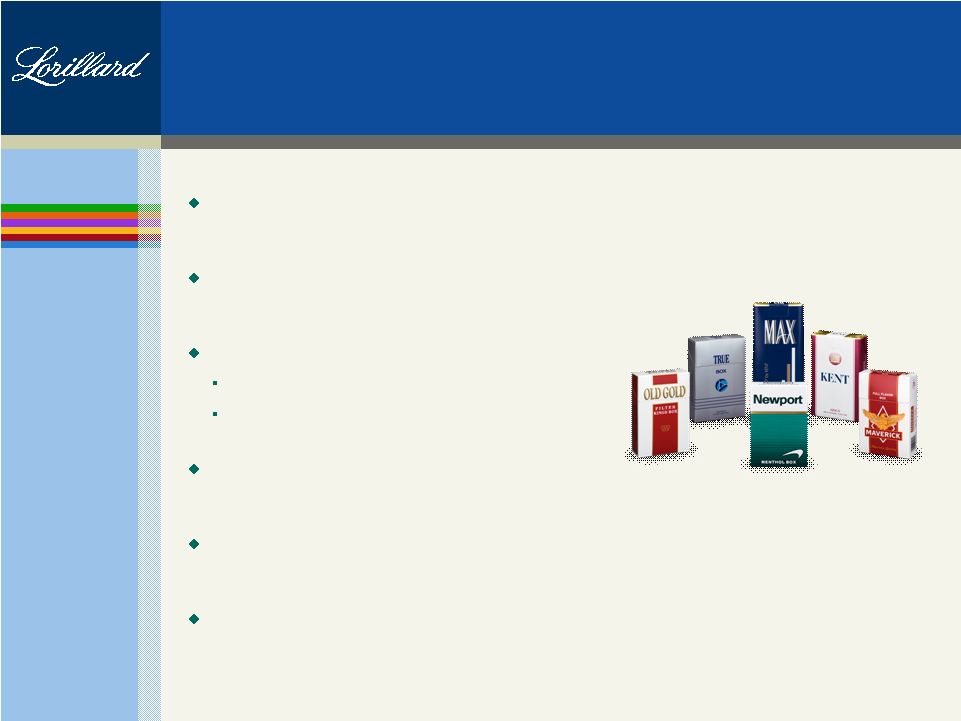  6 Lorillard Overview Third largest tobacco company in the United States Primarily focused on the premium price cigarette market Strong brand portfolio led by the Newport brand #1 menthol cigarette brand #2 overall cigarette brand Other brands include: Old Gold, Maverick, Kent, True and Max Sells products only in the U.S., Puerto Rico and U.S. possessions Headquarters, manufacturing and research facilities in Greensboro, NC |
  7 Investment Highlights Leader in the best performing segments of the cigarette market Significant Newport brand equity Continuous increases in share of market Strategy has resulted in industry-leading relative profitability Track record of strong financial performance Experienced management team Newly independent status of Lorillard will provide financial flexibility to invest in growth initiatives and to continue to generate value for shareholders |
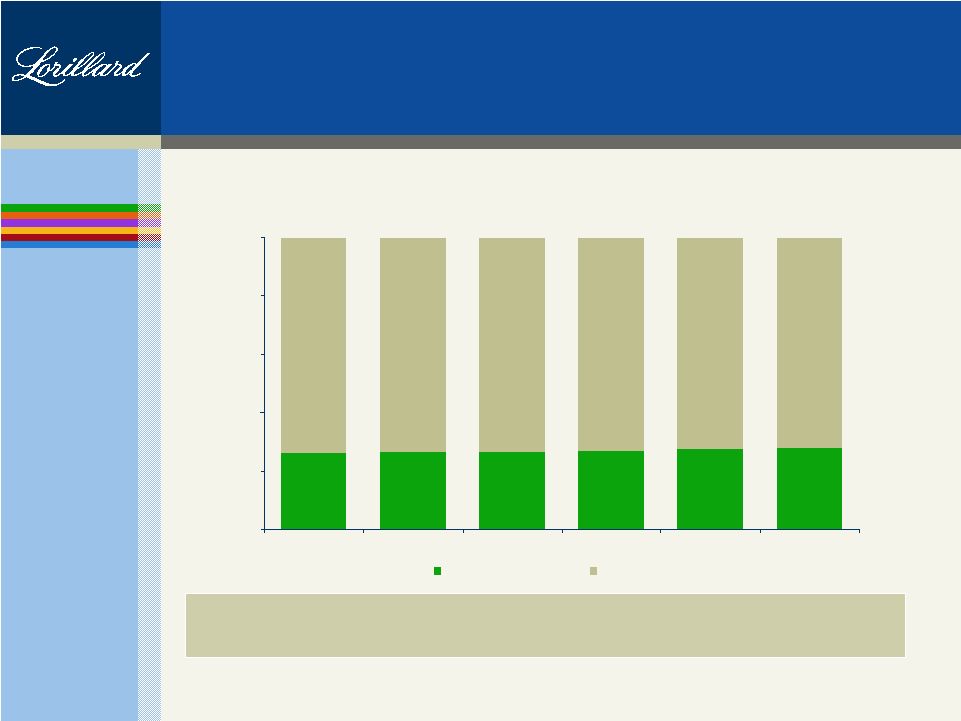
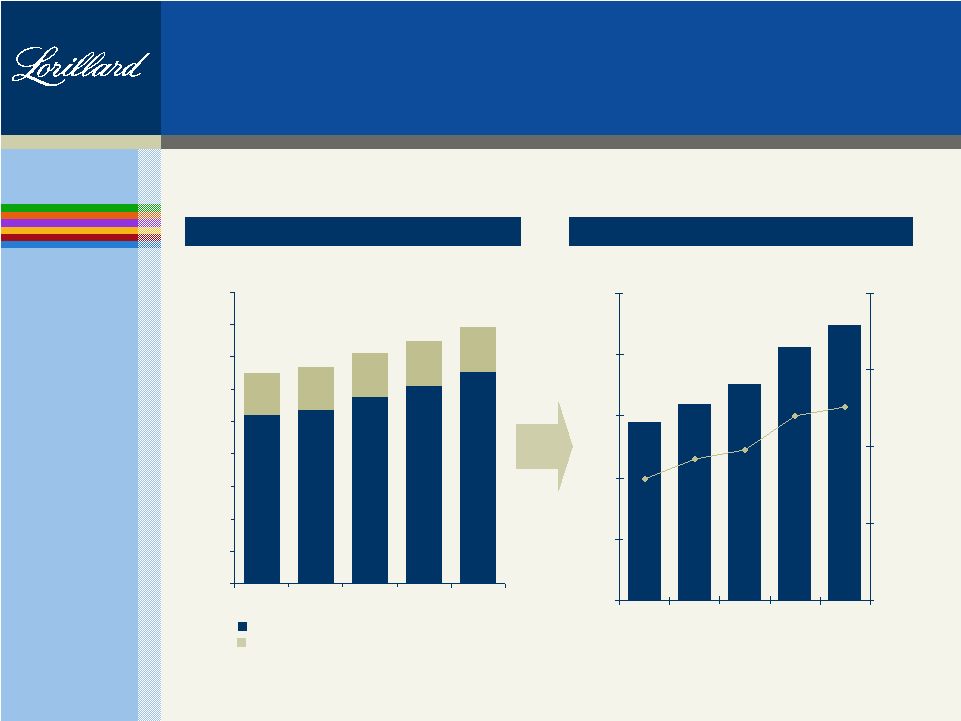  8 $582 $642 $706 $826 $898 19.2% 19.8% 22.6% 17.9% 22.0% $0 $200 $400 $600 $800 $1,000 2003 2004 2005 2006 2007 10.0% 15.0% 20.0% 25.0% 30.0% % of Sales Impressive Financial Performance Net Sales Net Income ($ in millions) ($ in millions) $2,604 $2,690 $2,892 $3,056 $3,281 $652 $658 $676 $699 $688 $0 $500 $1,000 $1,500 $2,000 $2,500 $3,000 $3,500 $4,000 $4,500 2003 2004 2005 2006 2007 $3,256 $3,348 $3,568 $3,755 $3,969 Net Sales (excl. Excise Taxes) Excise Taxes From 2003-2007, net sales grew at a 5.1% CAGR, while net income grew at an 11.5% CAGR |
  9 Experienced Leadership Board of Directors Management Team Members Name Occupation Martin L. Orlowsky Chairman, President and CEO of Lorillard David H. Taylor Director and EVP, Finance and Planning, CFO of Lorillard Richard W. Roedel Kit D. Dietz Principal of Dietz Consulting LLC Additional Directors To Be Named Retired Chairman and CEO of BDO Seidman LLP Name Title Year Joined Martin L. Orlowsky Chairman, President and CEO 1990 David H. Taylor EVP, Finance and Planning, CFO 2008 Ronald S. Milstein 1996 Charles E. Hennighausen EVP, Production Operations 2002 Randy B. Spell EVP, Marketing and Sales 1977 Thomas R. Staab SVP, Finance and Treasurer 1998 SVP, Legal and External Affairs, General Counsel and Secretary |
 Industry Operating Environment |
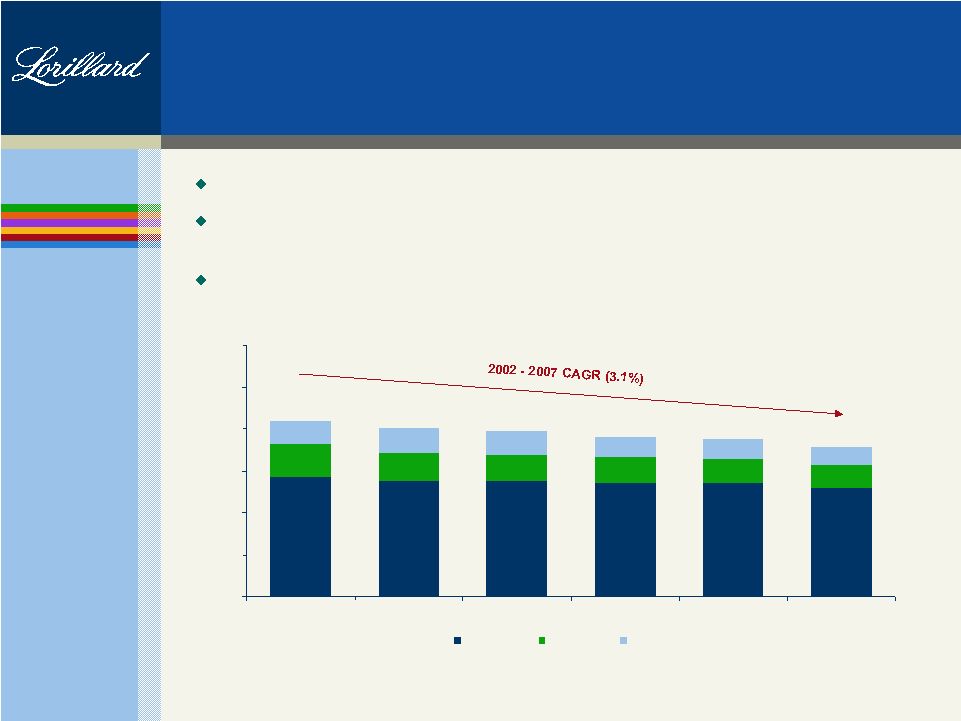  11 Trends in the U.S. Cigarette Market Total U.S. cigarette market size of ~$50 billion Industry unit volume has declined at a 3.1% CAGR over the past 5 years, 3.3% in Q1 2008; premium segment declined at a slower rate (<2.0%) Expected annual declines of 3% to 4% of total over the next several years 286 276 274 271 270 260 79 68 64 60 56 52 54 57 56 51 49 45 418 401 394 382 376 357 0 100 200 300 400 500 600 2002 2003 2004 2005 2006 2007 Premium Discount Deep Discount (billions of cigarettes shipped) Source: Domestic wholesale shipments per MSAI. |
  12 Lorillard is Best Positioned in Market Premium segment is largest in the market (~73% of the market) Segment has gained share of market over the last five years Lorillard has gained share of premium segment over the last five years Premium Segment 28% of the overall cigarette market Segment has gained share of market over last five years Relatively stable in recent years (~100 billion cigarettes shipped per year) Newport is #1 menthol brand and has gained share of menthol segment over the last five years (approx. 33%) Menthol Segment |
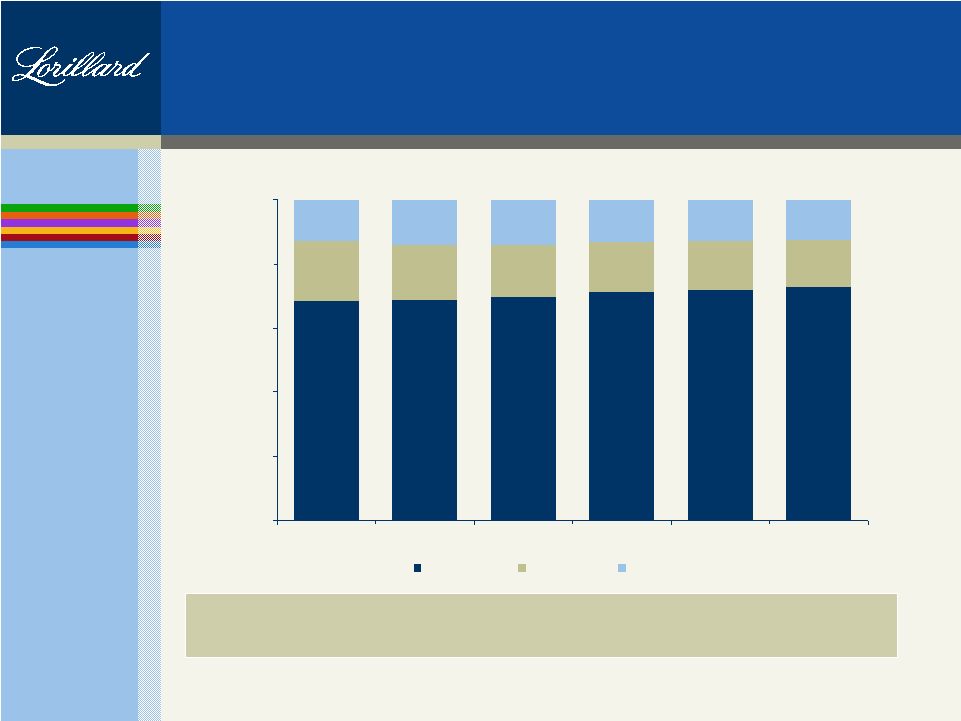  13 Premium Segment Growth 68.3% 68.8% 69.6% 71.1% 71.9% 72.8% 18.8% 17.0% 16.2% 15.7% 15.0% 14.6% 14.3% 13.3% 13.1% 12.6% 14.2% 13.0% 0.0% 20.0% 40.0% 60.0% 80.0% 100.0% 2002 2003 2004 2005 2006 2007 Premium Discount Deep discount In the last 5 years, the premium segment continues to increase as a percentage of the overall market Source: Domestic wholesale shipments per MSAI. |
  14 Menthol / Non-Menthol Segmentation As consumer preferences continue to evolve, Lorillard is best positioned to capitalize on that trend 26.0% 26.4% 26.4% 26.7% 27.4% 27.9% 74.0% 73.6% 73.6% 73.3% 72.6% 72.1% 0.0% 20.0% 40.0% 60.0% 80.0% 100.0% 2002 2003 2004 2005 2006 2007 Menthol Non-Menthol The menthol segment represented ~100 billion of the 357 billion cigarettes shipped in the United States in 2007 Source: Domestic wholesale shipments per MSAI. |
  15 Current Operating Environment Industry could come under greater pressure in 2008 due to macro economic pressures 1 st quarter industry shipments declined at a rate slightly greater than trend Level of competition continues to be high Regulatory legislation Excise tax pressures Litigation |
 Growth Behind a Brand |
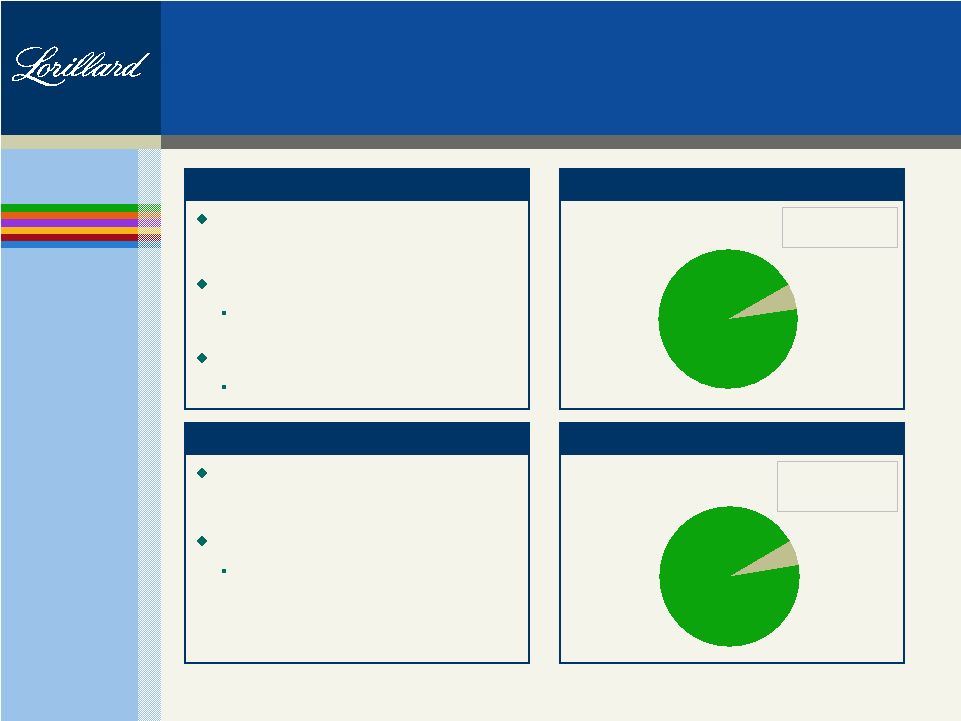  17 Discount 5.7% Premium 94.3% Strong Brand Portfolio is Led by Newport Others 6.1% Newport 93.9% 2007 Sales: $3,969 million Source: Lorillard Shipment Data. (1) Includes Old Gold, Maverick, Kent, True and Max brands. Accounted for 94.3% of 2007 domestic shipments Newport (93.9% of 2007 net sales) Primary driver of profitability Kent, True and Max Mature brands -- harvesting profit Premium Brands Accounted for 5.7% of 2007 domestic shipments Maverick and Old Gold Maintain presence in lower price segment Discount Brands 2007 Net Sales Breakdown by Brand 2007 Volume Breakdown by Price 2007 Domestic Shipments: 35.8 billion (1) |
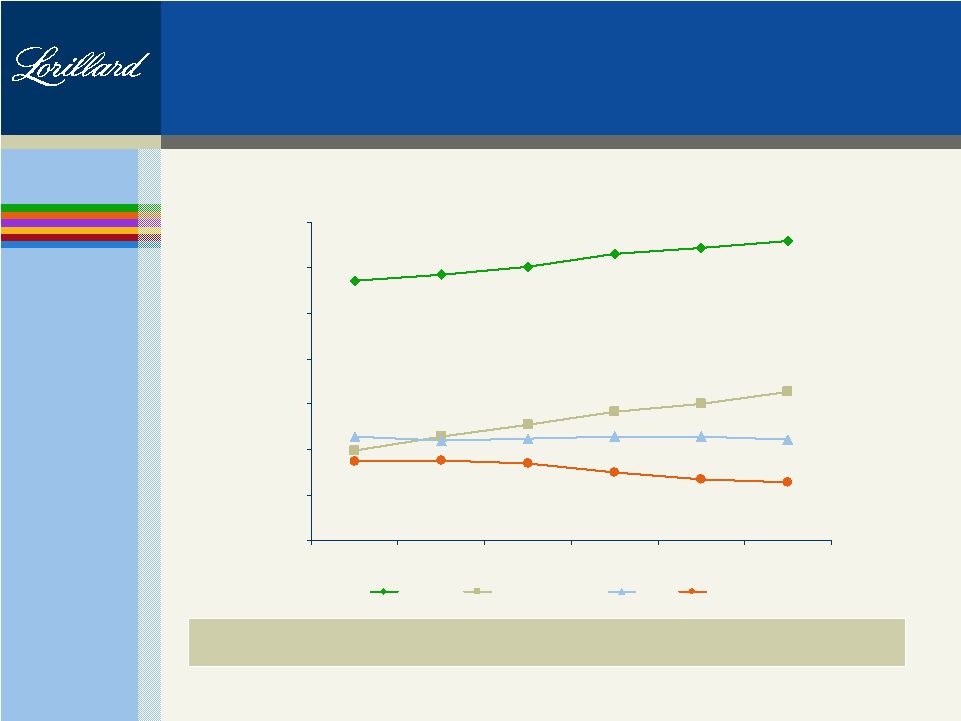  18 Newport is the Leader in the Menthol Segment 28.6% 29.2% 30.1% 31.5% 32.2% 32.9% 11.4% 12.8% 14.2% 15.0% 16.4% 8.7% 8.8% 8.5% 7.5% 6.8% 6.4% 9.9% 11.2% 11.5% 11.4% 11.1% 11.4% 11.0% 0.0% 5.0% 10.0% 15.0% 20.0% 25.0% 30.0% 35.0% 2002 2003 2004 2005 2006 2007 Market Share Newport Marlboro Menthol Kool Salem Newport continues to grow its leadership in the menthol segment Source: Domestic wholesale shipments per MSAI. |
  19 Brand Marketing Strategy Continue to focus on premium price segment Leverage Newport’s strong brand equity position in the marketplace Adjust Newport promotion spending consistent with the brand’s performance and competitive actions Selectively promote Newport in markets / stores with the highest return on investment Maintain presence in the discount segment with Maverick / Old Gold without marketing investment Overall objective is to profitably grow Newport’s market share |
  20 Differentiated Sales Promotion Strategy Higher average retail pricing Fewer free goods promotions Fewer line extensions Brand-building initiatives Selectively promote brand in markets with highest returns on investment Stronger sustainable growth Consistent profitable growth High returns on marketing investments Better brand positioning Lorillard Competition VS. Heavier promotions to buy market share Significant discounting and free goods promotions Extensive and undifferentiated product lines and offerings Growth in volume at cost of profitability Artificially high volumes Price driven sales Most profitable operating model in the industry |
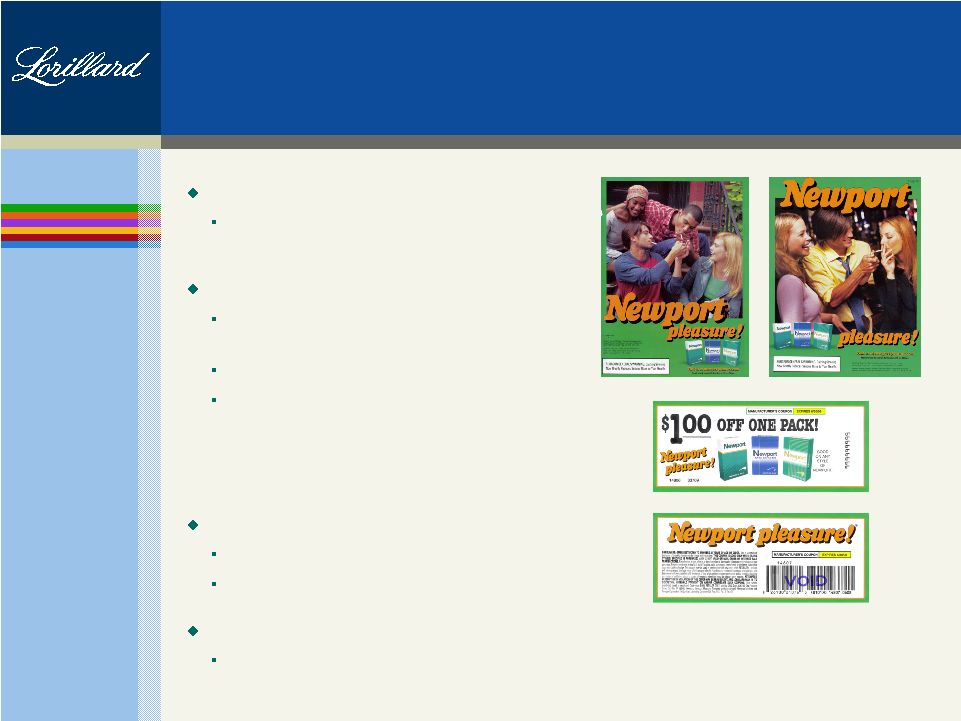  21 Focused Marketing Initiatives Retail Promotions Retail discounts in stores with highest potential returns Relationship Marketing 7.5 million adult smoker names (Lorillard and competition) in database Custom Newport Magazine mailings Targeted incentive program mailings – Retail coupons – Sweepstakes offers – Premium incentives Point-of-Sale Marketing In-store advertising In-store merchandising displays Media Advertising Selective print media |
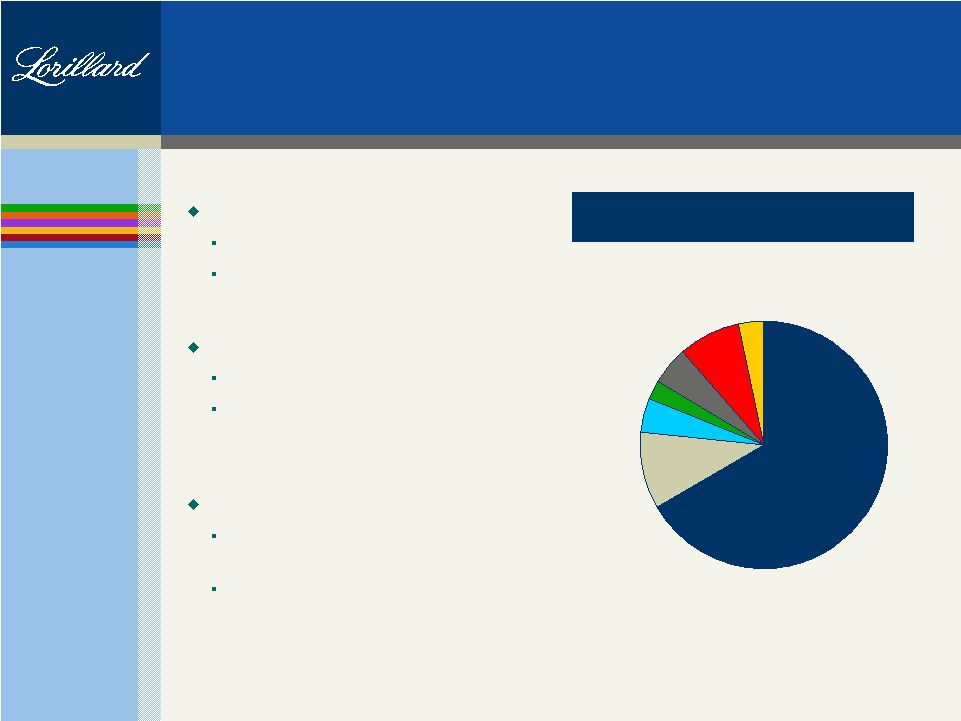  22 Strong Sales and Distribution Network Effective Sales Force Direct salaried Aligned geographically to support business Customer Driven Retail store oriented Cover 279,000 stores per year (95% of total Industry cigarette sales) Wholesale distribution 590 direct buying accounts utilizing 950 distribution centers Rapid order fulfillment – next day delivery Breakdown of Sales Channels by Volume Convenience/ Gas 56% Supermarket 3.4% Cigarette Store 7.9% Grocery 5.1% Drug 2.6% Liquor 4.4% Other 9.9% |
    23 Market Development / Growth Strategy Focus on developed and developing markets: Focus on sales areas that exhibit a combination of Newport and Premium Menthol strength Focus on stores with highest penetration of menthol segment Invest marketing dollars in identified markets / stores for most profitable Newport market share growth Developed Markets Northeast, Southeast Upper Midwest Developing Markets Select States West of the Mississippi |
 Western States Menthol Overview |
  25 Western Myths Lorillard has a weak sales force and distribution network in the West Myth #1 - Newport has virtually no business in the West Myth #2 - Newport is the Menthol Category “Builder” Myth #3 - Lorillard is either unable or unwilling to build business in the West Myth #4 - |
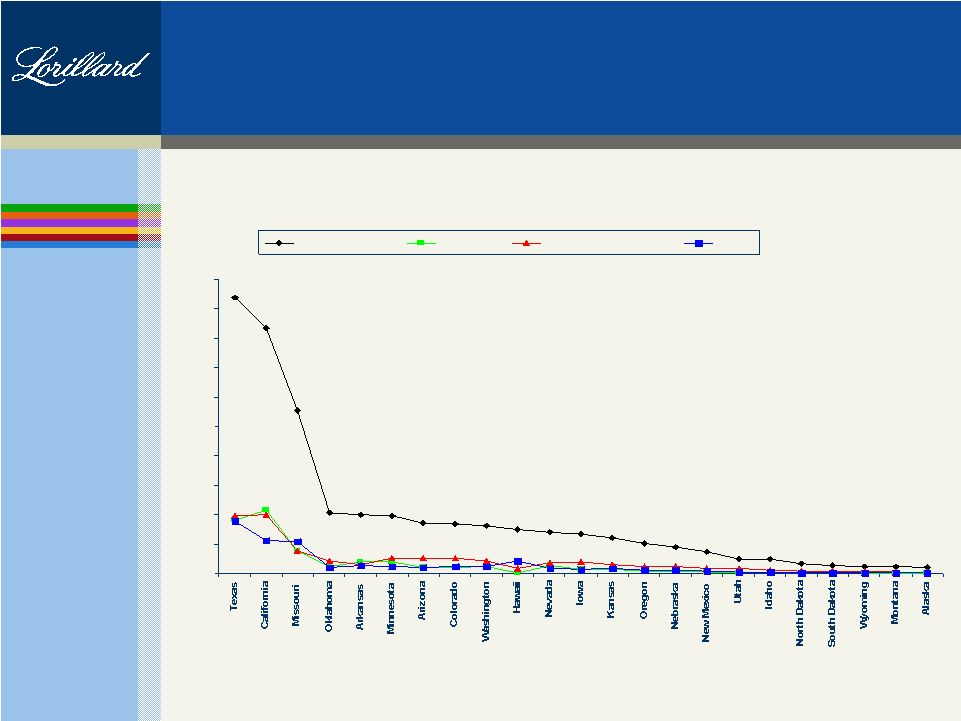
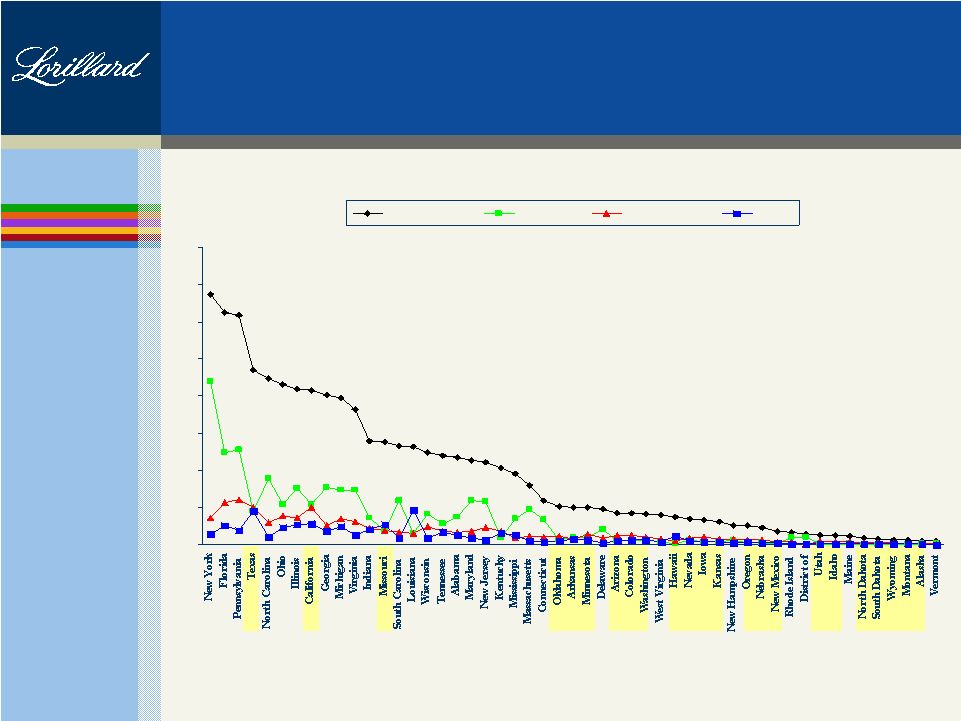  26 Menthol Cigarette Volume By State Source: Lorillard Proprietary Retail Data Billions 0.0 1.0 2.0 3.0 4.0 5.0 6.0 7.0 8.0 Tot Menthol Newport Marlboro M Kool 52 Weeks Ending May 31, 2008 |
  27 Menthol Cigarette Volume By 23 Western States 0.0 0.5 1.0 1.5 2.0 2.5 3.0 3.5 4.0 4.5 5.0 Total Menthol Newport Marlboro Menthol Kool Source: Lorillard Proprietary Retail Data Billions 52 Weeks Ending May 31, 2008 |
  28 0.1% to 0.5% Menthol Volume 0.6% to 0.9% Menthol Volume 1.0% and above Menthol Volume Total 10 7 6 23 2.5 5.3 14.7 22.4 2.6 5.5 15.3 23.4 # of States Menthol Volume (billions) *% Menthol Of Total U.S. Units Western States Percent Menthol Volume Contribution 52 Weeks Ending May 2008 Source: Lorillard Proprietary Retail Data * 96 Billion Units Shipped |
  29 23 Western States Newport Marlboro Menthol Kool / Salem A/O Prem Menthol Discount Menthol 100.00 17.03 22.83 20.68 15.34 24.12 100 84 113 102 76 119 Market Share Menthol Segment Share Index To Menthol Market Menthol Share Overview 23 Western States Source: Lorillard Proprietary Retail Data 3.45 4.62 4.19 3.11 4.89 |
  30 Texas [5.0% (M) Vol] Newport Marlboro Menthol Kool / Salem California [4.4% (M) Vol] Newport Marlboro Menthol Kool / Salem 100.00 19.46 21.20 23.46 100.00 26.13 23.91 17.59 100 86 94 104 100 137 125 92 Index To Menthol Market Menthol Share Overview Strong Western States Source: Lorillard Proprietary Retail Data 4.40 4.80 5.31 4.99 4.56 3.36 Market Share Menthol Segment Share |
  31 Menthol Share Overview Texas By City Texas Dallas Ft. Worth Houston 5.31 8.43 6.19 9.78 23.46 24.29 23.78 29.01 21.20 11.40 16.80 13.85 4.80 3.96 4.37 4.67 19.46 37.57 27.15 25.29 4.40 13.04 7.07 8.52 Newport Marlboro Men Kool / Salem Segment Share Segment Share Segment Share Source: Lorillard Proprietary Retail Data Market Share Market Share Market Share |
  32 California Los Angeles Oakland Sacramento San Bernardino San Diego San Francisco Menthol Share Overview California By City 3.36 4.64 7.09 4.06 4.23 3.35 4.21 17.59 17.55 14.64 15.77 15.30 14.51 17.04 23.91 13.68 6.82 18.45 16.27 26.28 21.78 4.56 3.61 3.30 4.75 4.50 6.07 5.38 26.13 45.73 58.33 35.34 43.94 29.01 34.09 4.99 12.08 28.24 9.10 12.15 6.69 8.42 Segment Share Newport Marlboro Men Kool / Salem Segment Share Segment Share Source: Lorillard Proprietary Retail Data Market Share Market Share Market Share |
  33 Idaho [0.2% (M) Vol] Newport Marlboro Menthol Kool / Salem Montana [0.1% (M) Vol] Newport Marlboro Menthol Kool / Salem 100.00 4.52 26.35 15.15 100.00 6.30 27.64 17.88 100 38 219 126 100 52 228 148 Index To Menthol Market Menthol Share Overview Weak Western States Source: Lorillard Proprietary Retail Data .54 3.17 1.82 .76 3.35 2.17 Market Share Menthol Segment Share |
  34 Growth Opportunities and Strategies New Products and Line Extensions Will introduce if additive to profitable growth Will not dilute Newport brand equity Explore Smokeless Tobacco Opportunity Through Swedish Match Partnership Triumph Snus Test marketing began in February 2008 Too early for conclusions Leverage Lorillard sales and marketing Capital efficient entry to smokeless Potential Acquisition Opportunities Explore and evaluate potential targets Expand product offering Expand geographic reach Must make sense for shareholder value creation Universe of targets is limited |
 Financial Overview David H. Taylor Executive Vice President, Finance and Planning, Chief Financial Officer |
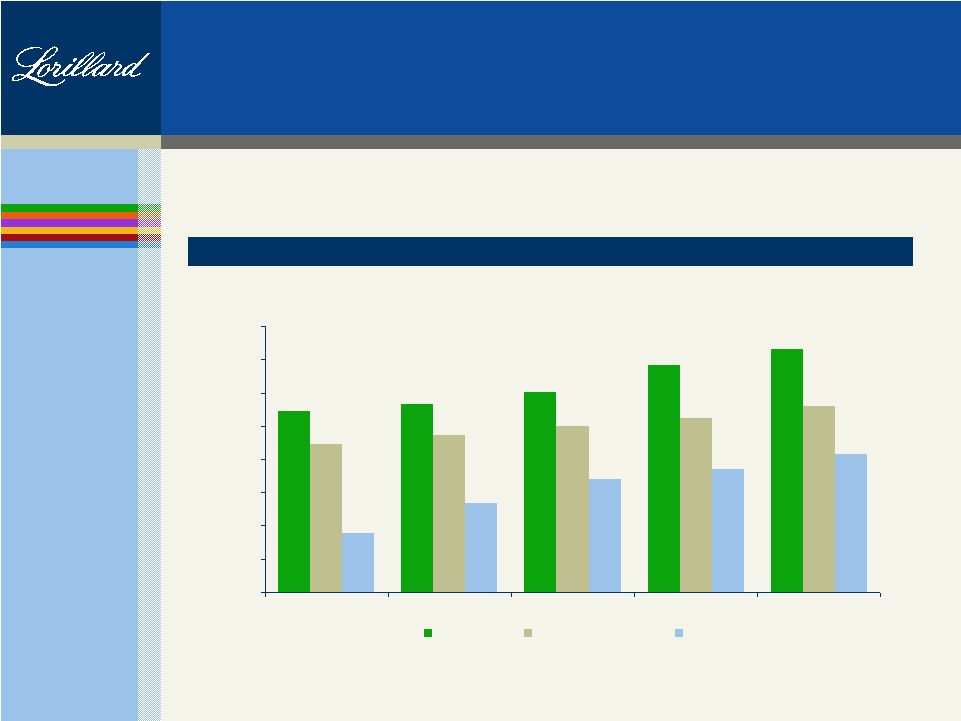  36 Most Profitable Operating Model $27.21 $28.35 $30.10 $34.13 $36.58 $22.29 $23.72 $25.02 $26.29 $28.07 $9.02 $13.43 $17.06 $18.63 $20.79 $0.00 $5.00 $10.00 $15.00 $20.00 $25.00 $30.00 $35.00 $40.00 2003 2004 2005 2006 2007 Adjusted Operating Profit Per 1,000 Cigarettes Lorillard Philip Morris USA Reynolds Profitability of Lorillard vs. Competition Lorillard operates the most profitable business model among major U.S. cigarette companies, consistently outperforming key competitors Note: Based on Lorillard’s analysis of competitors’ public information. |
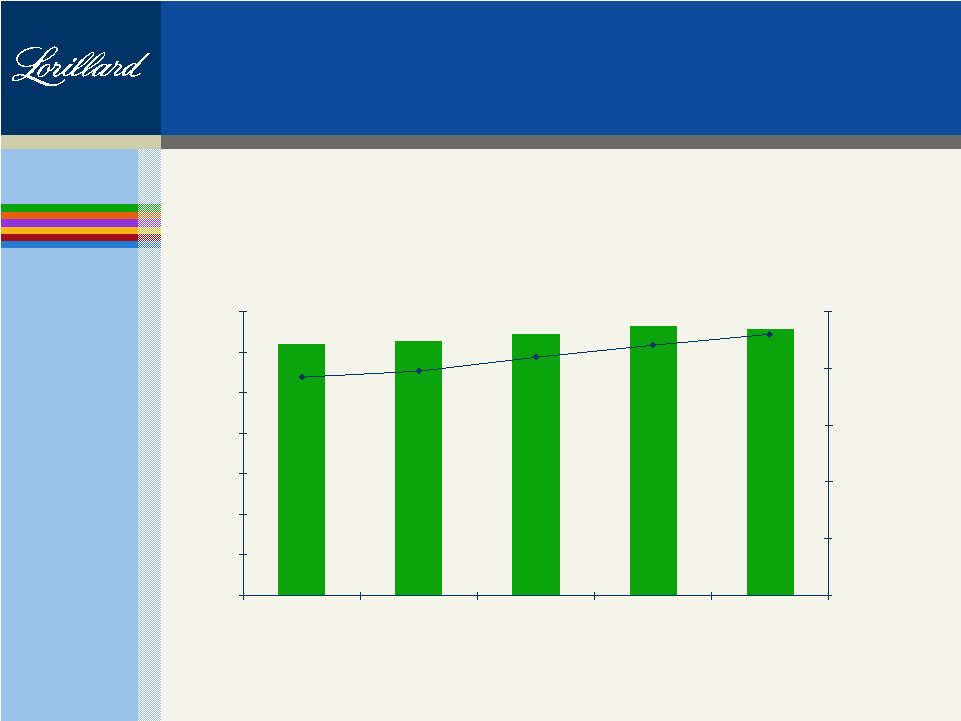  37 Stable Volume and Growing Market Share 31.0 31.3 32.2 33.1 32.8 7.9% 8.4% 9.2% 8.8% 7.7% 0.0 5.0 10.0 15.0 20.0 25.0 30.0 35.0 2003 2004 2005 2006 2007 Volume 0.0% 2.0% 4.0% 6.0% 8.0% 10.0% Market Share Impressive and sustained growth in Newport market share and cigarettes shipped (billions of domestic cigarettes shipped) Source: Domestic wholesale shipments per MSAI. |
  38 Summary Income Statement Solid top-line and earnings profile ($ in millions) 2005 2006 2007 Net Sales $3,568 $3,755 $3,969 % Growth 6.6% 5.2% 5.7% Excise Taxes 676 699 688 Cost of Goods Sold 562 550 571 Settlement Costs 876 911 1,048 Gross Profit $1,454 $1,595 $1,662 % Margin 40.7% 42.5% 41.9% SG&A 370 354 388 Operating Income $1,084 $1,241 $1,274 % Margin 30.4% 33.0% 32.1% Net Income $706 $826 $898 % Growth 10.0% 17.0% 8.7% % Margin 19.8% 22.0% 22.6% EBITDA $1,132 $1,288 $1,314 % Growth 8.7% 13.8% 2.0% % Margin 31.7% 34.3% 33.1% |
  39 Strong Cash Flow Generation Lorillard has a history of generating strong and sustainable cash flow ($ in millions) 2005 2006 2007 Cash Flows from Operating Activities $820 $778 $882 Less: Capital Expenditures (31) (30) (51) Free Cash Flow $789 $748 $831 Less: Dividends to Loews (646) (783) (1,170) Free Cash Flow After Dividends $143 ($35) ($339) |
  40 Conservative Capitalization Profile With $1 billion of new debt issuance, Lorillard’s debt / EBITDA would be ~0.8x Balance preservation of financial flexibility and improving capital structure ($ in millions) Q1 2008 Cash, Cash Equivalents and Marketable Securities $1,607 Other Assets 1,143 Total Assets $2,750 Debt $0 Other Liabilities 1,852 Shareholder's Equity 898 Total Liabilities and Shareholder's Equity $2,750 Credit Statistics Debt / EBITDA 0.0x Debt / Capitalization 0.0% Lorillard expects to issue between $750 million - $1 billion of debt in the near term |
  41 First Quarter 2008 Results Net sales Increase driven primarily by higher average unit prices Unit volume roughly flat, impacted by: – Downward wholesale inventory adjustments – ~200 million fewer promotional units shipped Gross profit unchanged Increases in net sales offset by higher State Settlement costs Net income Decline attributable to: – $13 million of expenses related to the separation – $6 million in higher legal expenses – $22 million less investment income ($ in millions) Q1 '07 Q1 '08 Net Sales $913 $921 Excise Taxes 162 163 Cost of Goods Sold 134 135 Settlement Costs 249 257 Gross Profit $369 $366 % Margin 40.4% 39.7% SG&A 82 100 Operating Income $287 $266 % Margin 31.4% 28.9% Other Income (Expense), net 11 4 Income Taxes (109) (99) Net Income $189 $171 % Margin 20.7% 18.6% EBITDA $297 $275 % Margin 32.5% 29.8% |
  42 Outlook Remainder of 2008 Level of competition will continue to be high Lorillard cost structure will be impacted by: – Transaction costs – Incremental costs related to independence – Legal costs for Engle Positive pricing impact beginning in May Investment income impacted by nature and level of investments and rate environment 2008 and beyond Revenue growth primarily net pricing Settlement costs will continue to grow Operating margins ~32%-33% |
  43 Outlook Revenue Growth Transition Expenses 3.0% - 4.0% ~$25 million Operating Margin 32% - 33% 2009 - 2012 3.0% - 4.0% 32% - 33% ~$9 million per year 2008 |
  44 Long-Term Objectives Revenue Growth EPS Growth Dividend Yield 3% - 4% 5% - 7% ~5% Total Shareholder Return 10% - 12% Modest share repurchase program funded with free cash flow and debt issuance Anticipated dividend payout ratio of ~70% - 75% |
  45 Investment Highlights Leader in the best performing segments of the cigarette market Significant Newport brand equity Continuous increases in share of market Strategy has resulted in industry-leading relative profitability Track record of strong financial performance Experienced management team Newly independent status of Lorillard will provide financial flexibility to invest in growth initiatives and to continue to generate value for shareholders |
  46 Reconciliation of Net Income to EBITDA ($ in millions) 2005 2006 2007 Q1 '07 Q1 '08 Net Income $706 $826 $898 $189 $171 Add: Income Taxes 445 518 485 109 99 Other (Income) Expense, net (67) (103) (109) (11) (4) Operating Income $1,084 $1,241 $1,274 $287 $266 Depreciation and Amortization 48 47 40 10 9 EBITDA $1,132 $1,288 $1,314 $297 $275 |
 Questions |