 Exhibit 99.1 Investor Meetings Investor Meetings March 20-21, 2013 March 20-21, 2013 |
 Safe Harbor Disclaimer Safe Harbor Disclaimer 1 You are cautioned that certain statements made in this presentation are “forward-looking” statements within the meaning of the Private Securities Litigation Reform Act of 1995. Forward-looking statements include, without limitation, any statement that may project, indicate or imply future results, events, performance or achievements, and may contain the words “expect”, “intend”, “plan”, “anticipate”, “estimate”, “believe”, “will be”, “will continue”, “will likely result”, and similar expressions. In addition, any statement that may be provided by management concerning future financial performance (including future revenues, earnings or growth rates), ongoing business strategies or prospects, and possible actions by Lorillard, Inc. are also forward-looking statements as defined by the Act. Forward-looking statements are based on current expectations and projections about future events and are inherently subject to a variety of risks and uncertainties, many of which are beyond the control of Lorillard, Inc., and could cause actual results to differ materially from those anticipated or projected. Information describing factors that could cause actual results to differ materially from those in forward-looking statements is available in Lorillard, Inc.’s various filings with the Securities and Exchange Commission (“SEC”). These filings are available from the SEC over the Internet or on hard copy, and are, in some cases, available from Lorillard, Inc. as well. Forward-looking statements speak only as of the time they are made, and Lorillard, Inc. expressly disclaims any obligation or undertaking to update these statements to reflect any change in expectations or beliefs or any change in events, conditions or circumstances on which any forward-looking statement is based. This forward-looking statements disclaimer is only a brief summary of Lorillard, Inc.’s statutory forward-looking- statements disclaimer. You are urged to read that disclaimer, which is included in Lorillard Inc.’s Form 10-K and Form 10-Q filings with the SEC. |
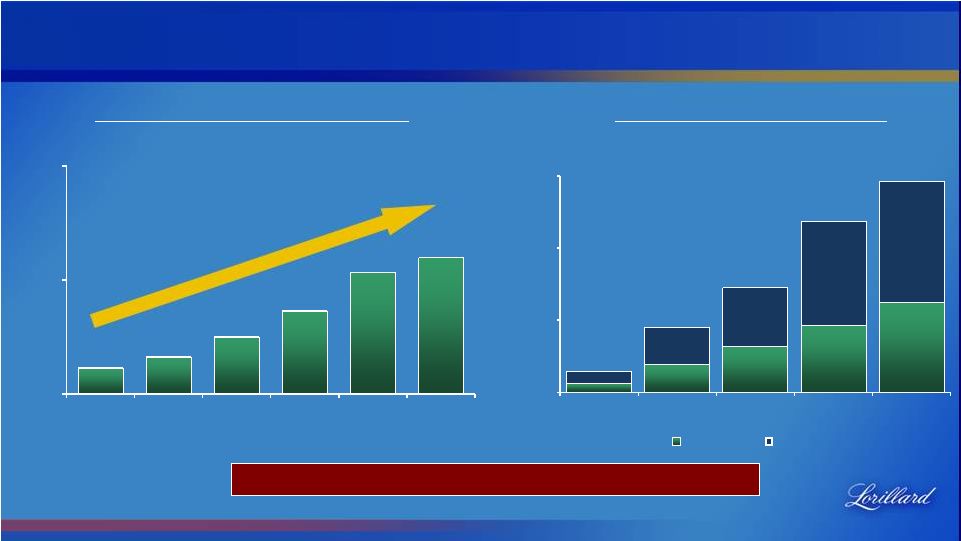
 A Proven and Consistent Record of Success A Proven and Consistent Record of Success Source: Lorillard filings. * Earnings per share data adjusted to reflect 3-for-1 stock split effected January 15, 2013. See reconciliation attached in Appendix A. 2 Retail Market Share 9.0% 9.2% 9.6% 10.0% 10.4% 11.0% 11.8% 12.9% 14.1% Annual Adjusted Earnings Per Share* +11.1% CAGR +570 bps 10 Consecutive Years of Growth Newport Total Lorillard 0% 2% 4% 6% 8% 10% 12% 14% 16% 2002 2003 2004 2005 2006 2007 2008 2009 2010 2011 2012 8.7% $1.35 $1.58 $1.72 $1.71 $1.91 $2.25 $2.63 $2.82 $1.00 $1.50 $2.00 $2.50 $3.00 2005 2006 2007 2008 2009 2010 2011 2012 14.4% |
 A Proven and Consistent Record of Success A Proven and Consistent Record of Success +79% Annualized Dividend Per Share Source: Lorillard filings. Since Lorillard spin-off completed in June 2008. Dividend data adjusted to reflect 3-for-1 stock split effected January 15, 2013. 3 $313 $944 $1,589 $2,312 $3,119 $400 $1,310 $2,026 $3,613 $4,191 $0 $2,500 $5,000 $7,500 2008 2009 2010 2011 2012 Dividends Buybacks $713 $2,254 $3,615 $5,925 $7,310 Cumulative Cash Returned More than $7.3 Billion Cash Returned to Investors $1.23 $1.33 $1.50 $1.73 $2.07 $2.20 $1.00 $2.00 $3.00 Q3 2008 Q3 2009 Q3 2010 Q1 2011 Q1 2012 Q1 2013 |
 2012 Was No Exception 2012 Was No Exception • Net Sales (ex-FET) • Adjusted EPS* • Lorillard Retail Market Share • Lorillard Share of Menthol • Lorillard Share of Premium +4.1% +7.2% +0.3 share points +0.2 share points +0.1 share points $1.4 Billion Cash Returned to Investors in 2012 Source: Lorillard filings. Cash returns made up of $807 MM in dividends plus $578 MM in share repurchases. * See reconciliation attached in Appendix A. |
 Source: Lorillard proprietary retail database (“EXCEL”) and Company estimates. Altria RJR Altria RJR Altria RJR Altria RJR Altria RJR All Others Altria RJR Others 90.5% 8.8% 2012 U.S. Cigarette Market Segmentation Achieved by Relentlessly Pursuing our Strategic Plan Achieved by Relentlessly Pursuing our Strategic Plan 5 0.5% e-Cigs Full Flavor Non-Menthol Non-Full Flavor Non-Menthol Full Flavor Menthol NFF Menthol Discount MST Snus 0.2% 0% 20% 40% 60% 80% 100% 15.1 B Packs/Cans |
 The Foundation of Our Strategy is the Strongest Menthol Brand in the Industry The Foundation of Our Strategy is the Strongest Menthol Brand in the Industry Net Promoter Score 2012 Share of the Menthol Market Source: 2010 Lorillard Adult Consumer Survey and research company benchmarks and Lorillard proprietary retail database (“EXCEL”). 6 Lorillard +0.2 pts Newport Cigarettes Average Cigars Average Overall CPG Average Beverage Average 63% 57% 53% 23% 7% 39.3% Newport Other Lorillard |
 With The Best Pricing Dynamics With The Best Pricing Dynamics Source: Lorillard proprietary retail database (“EXCEL”). Camel Menthol includes Camel Crush. * Traditional premium price defined as within 50 cents of most typical per-pack promotional level 7 2012 Percent of Menthol Promoted With Factory Packed Discounts Newport Menthol Marlboro Mainline Menthol All Marlboro Menthol Marlboro Black Menthol Camel Menthol 2012 Percent of Brand At Traditional Premium Price* Newport Marlboro 1% 49% 26% 13% 36% 92% 69% |
 And Pursuing Close-in Adjacencies And Pursuing Close-in Adjacencies 8 • Just Under 1 share & growing • 90% Incremental • 74% Sourced from Premium • 96% Positive Intent to Purchase • Promotions into 12 new states • Narrows price gap vs. competition • Unit volumes gaining double-digits • Acquired April 2012 • Growing rapidly • Leading technology • Inclusion in harm reduction debate • 30%-40% market share Source: Lorillard proprietary retail database (“EXCEL”) and Newport Non-Menthol Source of Business Survey, 2011 |
 • Category estimated at $1B – with 100% annual growth* • Q4 national retail roll-out – 75,000+ outlets currently • National TV and print advertising campaign ($40 MM 2012 marketing spend) • Product enhancements & quality controls • Increased manufacturing capacity & inventory blu eCigs is a Huge Opportunity blu eCigs is a Huge Opportunity 9 * Source: Nik Modi - UBS Research estimates, research note dated 9/23/2012 |
 And e-cigs is a Business Worth Investing In And e-cigs is a Business Worth Investing In 10 EPS Accretive Within First Full Year • 94% awareness among adult smokers • 23% trial among adult smokers • 5% (or 22% of those who try) become regular users • Likelihood to buy more than doubled from 35% to 75% between 2010 and 2011 • 20% of users indicate they completely replaced cigarette smoking, 36% smoke less, and 99% are previous tobacco consumers • blu eCigs has the highest brand equity as measured by Net Promoter Score methodology (46%) * Source: Lorillard survey of 3,000 adult tobacco consumers, October 2011. blu eCigs – blu eCigs – Key Industry Statistics Key Industry Statistics |
 • National launch in May, no SE required • Appeals to competitive premium menthol smokers • Additional 50¢ buydown in most states • Supported with strong retail point-of-sale marketing • Positive consumer testing with high future purchase intent We Remain Optimistic on 2013 in Cigarettes As Well, Despite Regulatory Headwinds 11 4 92 |
 We are Managing Through Regulatory Headwinds We are Managing Through Regulatory Headwinds 12 • Substantial Equivalence (SE) Applications – Implied 90 day reviews have waited more than 2 years – Process is moving forward; Lorillard has submitted Citizens Petition • FDA Review of Menthol – Awaiting peer-reviewed assessment of science and FDA comments – Lorillard will remain active in the process – providing comments and defending our freedom to operate • Deeming Regulations on e-cigarettes – FDA regulations exerting authority over e-cigs expected in April |
 Three Financial Scenarios Depending on Regulatory Environment – All Delivering Double-Digit Shareholder Return* Three Financial Scenarios Depending on Regulatory Environment – All Delivering Double-Digit Shareholder Return* • Heightened promotion environment (1%-3% pricing) • No new products • Share repurchases from free cash flow • Limited contribution from blu eCigs Low-Double Digit High-Single Digit Mid-Single Digit • Normal historical pricing (4%-5%) • No new products • Share repurchases from free cash flow • Limited contribution from blu eCigs • Normal historical pricing (4%-5%) • New incremental products • Additional leverage-driven share repurchases • Meaningful contribution from blu eCigs 13 Potential Long-Term EPS Growth Rate Scenarios Potential Long-Term EPS Growth Rate Scenarios * As measured by earnings per share growth and the dividend yield. |
 Appendix A Regulation G Reconciliations Appendix A Regulation G Reconciliations Reconciliation of Reported (GAAP) to Adjusted (Non-GAAP) Results (Amounts in millions, except per share data) (Unaudited) Year ended December 31, 2011 Gross Profit Operating Income Net Income Diluted EPS Reported (GAAP) results $2,343 $1,892 $1,116 $2.66 GAAP results include the following: 1) Impact of RAI mark-to-market pension accounting adjustments on Lorillard’s tobacco settlement expense included in cost of sales (25) (25) (15) (0.03) Adjusted (Non-GAAP) results $2,318 $1,867 $1,101 $2.63 Year ended December 31, 2012 Gross Profit Operating Income Net Income Diluted EPS Reported (GAAP) results $2,382 $1,878 $1,099 $2.81 GAAP results include the following: 1) Expenses incurred in conjunction with the acquisition of blu eCigs - 6 4 0.01 2) Impact of RJRT adjustments to its 2001-2005 operating income and restructuring charges on Lorillard’s tobacco settlement expense included in cost of sales 7 7 5 0.01 3) Impact of RAI mark-to-market pension accounting adjustments on Lorillard’s tobacco settlement expense included in cost of sales (8) (8) (5) (0.01) Adjusted (Non-GAAP) results $2,381 $1,883 $1,103 $2.82 14 |
 15 |