Table of Contents
Delaware | 2873 | 56-2677689 | ||
| (State or Other Jurisdiction of Incorporation or Organization) | (Primary Standard Industrial Classification Code Number) | (I.R.S. Employer Identification Number) |
| Stuart H. Gelfond Michael A. Levitt Fried, Frank, Harris, Shriver & Jacobson LLP One New York Plaza New York, New York 10004 (212) 859-8000 | Michael Rosenwasser E. Ramey Layne Vinson & Elkins L.L.P. 666 Fifth Avenue, 26th Floor New York, New York 10103 (212) 237-0000 | Peter J. Loughran Debevoise & Plimpton LLP 919 Third Avenue New York, New York 10022 (212) 909-6000 | G. Michael O’Leary Gislar R. Donnenberg Andrews Kurth LLP 600 Travis, Suite 4200 Houston, Texas 77002 (713) 220-4200 |
Large accelerated filer o | Accelerated filer o | Non-accelerated filer þ (Do not check if a smaller reporting company) | Smaller reporting companyo |
| Proposed Maximum | Proposed Maximum | |||||||||||
| Title of Each Class of | Amount to be | Offering Price per | Aggregate | Amount of | ||||||||
| Securities to be Registered | Registered(1) | Common Unit(2) | Offering Price(1)(2) | Registration Fee | ||||||||
| Common units representing limited partner interests | 22,080,000 | $14.00 | $309,120,000 | $26,929(3) | ||||||||
| (1) | Includes 2,880,000 common units which the underwriters have the option to purchase. |
| (2) | Estimated solely for the purpose of calculating the registration fee pursuant to Rule 457(o) of the Securities Act. |
| (3) | Includes $20,065 previously paid in respect of an aggregate offering price of $250,000,000 based on the registration fee in effect at that time. $6,864 is included with this filing in respect of the additional $59,120,000 of common units being registered hereby. |
Table of Contents
| The information in this preliminary prospectus is not complete and may be changed. These securities may not be sold until the registration statement filed with the Securities and Exchange Commission is effective. This preliminary prospectus is not an offer to sell nor does it seek an offer to buy these securities in any jurisdiction where the offer or sale is not permitted. |
Dated March 29, 2011
Representing Limited Partner Interests

| • | We may not have sufficient available cash to pay any quarterly distribution on our common units. | |
| • | The nitrogen fertilizer business is, and nitrogen fertilizer prices are, cyclical and highly volatile and have experienced substantial downturns in the past. Cycles in demand and pricing could potentially expose us to substantial fluctuations in our operating and financial results, and expose you to substantial volatility in our quarterly cash distributions and material reductions in the trading price of our common units. | |
| • | The amount of our quarterly cash distributions will be directly dependent on the performance of our business and will vary significantly both quarterly and annually. Unlike most publicly traded partnerships, we will not have a minimum quarterly distribution or employ structures intended to consistently maintain or increase distributions over time. | |
| • | We depend on CVR Energy, Inc., or CVR Energy, for the majority of our supply of petroleum coke, or pet coke, an essential raw material used in our operations. Any significant disruption in the supply of pet coke from CVR Energy could negatively impact our results of operations to the extent third-party pet coke is unavailable or available only at higher prices. | |
| • | We depend to a significant extent on CVR Energy and its senior management team to manage our business. | |
| • | Our general partner, an indirect wholly-owned subsidiary of CVR Energy, has fiduciary duties to its owner, CVR Energy, and the interests of CVR Energy may differ significantly from, or conflict with, the interests of our public common unitholders. | |
| • | Our unitholders have limited voting rights, are not entitled to elect our general partner or its directors, and cannot, at initial ownership levels, remove our general partner without the consent of CVR Energy. |
| • | You will experience immediate and substantial dilution of $8.38 per common unit in the net tangible book value of your common units. |
| • | If we were treated as a corporation for U.S. federal income tax purposes, or if we were to become subject to entity-level taxation for state tax purposes, cash available for distribution to you would be substantially reduced. | |
| • | You will be required to pay taxes on your share of our income even if you do not receive any cash distributions from us. |
Per Common Unit | Total | |||
| Initial Public Offering Price | $ | $ | ||
| Underwriting Discounts and Commissions | $ | $ | ||
| Proceeds Before Expenses to Us | $ | $ |
| Morgan Stanley | Barclays Capital | Goldman, Sachs & Co. |
| Dahlman Rose & Company | RBS |
| Simmons & Company International | SunTrust Robinson Humphrey |
Table of Contents
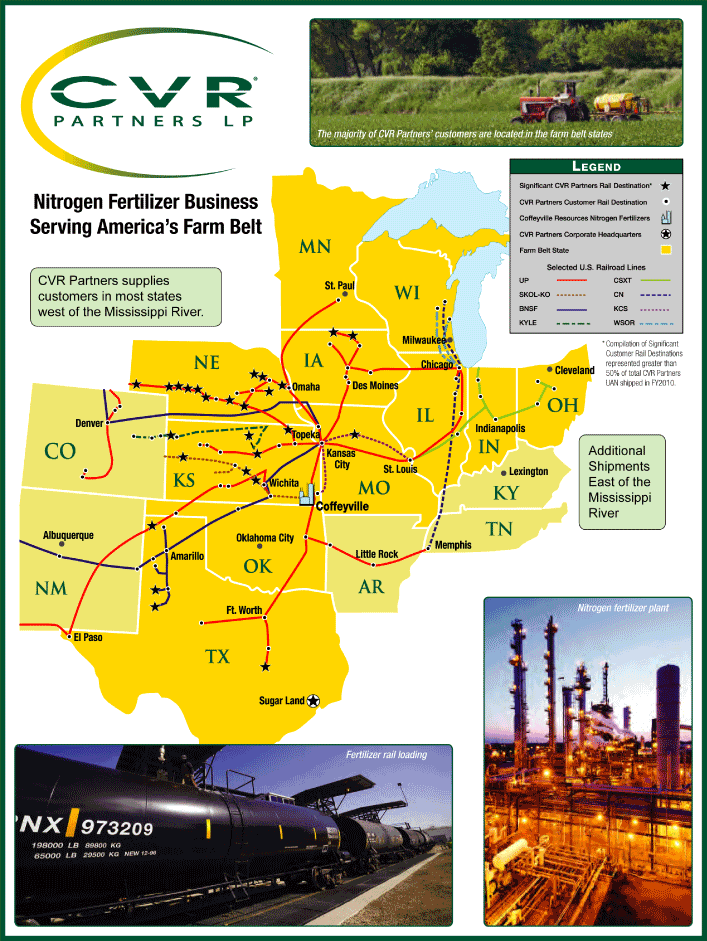
Table of Contents
| Page | ||||
| 1 | ||||
| 1 | ||||
| 1 | ||||
| 4 | ||||
| 5 | ||||
| 6 | ||||
| 7 | ||||
| 7 | ||||
| 8 | ||||
| 12 | ||||
| 13 | ||||
| 18 | ||||
| 18 | ||||
| 36 | ||||
| 42 | ||||
| 46 | ||||
| 48 | ||||
| 48 | ||||
| 49 | ||||
| 49 | ||||
| 49 | ||||
| 49 | ||||
| 50 | ||||
| 51 | ||||
| 52 | ||||
| 54 | ||||
| 54 | ||||
| 56 | ||||
| 58 | ||||
| 60 | ||||
| 64 | ||||
| 64 | ||||
| 64 | ||||
| 64 | ||||
| 64 | ||||
| 64 | ||||
| 65 | ||||
| 68 | ||||
| 68 | ||||
| 68 | ||||
| 70 | ||||
| 72 | ||||
| 72 | ||||
| 79 | ||||
i
Table of Contents
| Page | ||||
| 81 | ||||
| 84 | ||||
| 85 | ||||
| 86 | ||||
| 86 | ||||
| 87 | ||||
| 87 | ||||
| 88 | ||||
| 88 | ||||
| 90 | ||||
| 91 | ||||
| 92 | ||||
| 94 | ||||
| 94 | ||||
| 94 | ||||
| 98 | ||||
| 99 | ||||
| 99 | ||||
| 100 | ||||
| 101 | ||||
| 102 | ||||
| 102 | ||||
| 103 | ||||
| 103 | ||||
| 105 | ||||
| 106 | ||||
| 107 | ||||
| 107 | ||||
| 108 | ||||
| 108 | ||||
| 109 | ||||
| 112 | ||||
| 113 | ||||
| 116 | ||||
| 117 | ||||
| 118 | ||||
| 119 | ||||
| 119 | ||||
| 119 | ||||
| 122 | ||||
| 125 | ||||
| 127 | ||||
| 127 | ||||
| 128 | ||||
| 138 | ||||
ii
Table of Contents
| Page | ||||
| 139 | ||||
| 139 | ||||
| 144 | ||||
| 146 | ||||
| 147 | ||||
| 147 | ||||
| 147 | ||||
| 147 | ||||
| 148 | ||||
| 149 | ||||
| 149 | ||||
| 149 | ||||
| 149 | ||||
| 149 | ||||
| 150 | ||||
| 151 | ||||
| 152 | ||||
| 152 | ||||
| 154 | ||||
| 155 | ||||
| 155 | ||||
| 155 | ||||
| 156 | ||||
| 157 | ||||
| 157 | ||||
| 157 | ||||
| 157 | ||||
| 158 | ||||
| 158 | ||||
| 158 | ||||
| 159 | ||||
| 159 | ||||
| 159 | ||||
| 160 | ||||
| 160 | ||||
| 161 | ||||
| 162 | ||||
| 162 | ||||
| 163 | ||||
| 164 | ||||
| 168 | ||||
| 170 | ||||
| 172 | ||||
| 172 | ||||
| 173 | ||||
| 175 | ||||
iii
Table of Contents
| Page | ||||||||
| 177 | ||||||||
| 178 | ||||||||
| 183 | ||||||||
| 183 | ||||||||
| 183 | ||||||||
| 184 | ||||||||
| P-1 | ||||||||
| F-1 | ||||||||
| EX-8.1 | ||||||||
| EX-10.14 | ||||||||
| EX-10.20 | ||||||||
| EX-23.1 | ||||||||
| EX-23.5 | ||||||||
iv
Table of Contents
1
Table of Contents
| Sensitivity Using | ||||||||||||||||||||||||||||
| Actual | Forecasted | |||||||||||||||||||||||||||
| 2010 Results(3) | 3/31/2012 Prices(1)(4) | |||||||||||||||||||||||||||
| UAN Price | $ | 150 | $ | 200 | $ | 250 | $ | 300 | $ | 350 | $ | 179 | $ | 278 | ||||||||||||||
| Ammonia Price | 300 | 400 | 500 | 600 | 700 | 361 | 547 | |||||||||||||||||||||
Net Sales(2) | 171 | 221 | 271 | 321 | 371 | 180 | 297 | |||||||||||||||||||||
EBITDA(2) | 24 | 74 | 124 | 174 | 224 | 39 | 150 | |||||||||||||||||||||
Available Cash(2) | 13 | 63 | 113 | 163 | 213 | 31 | 140 | |||||||||||||||||||||
| (1) | The price sensitivity analysis in this table is based on the assumptions described in our forecast of EBITDA for the twelve months ending March 31, 2012, including 157,400 ammonia tons sold, 686,200 UAN tons sold, cost of product sold of $48.3 million, direct operating expenses of $84.5 million and selling, general and administrative expenses of $14.2 million. This table is presented to show the sensitivity of our EBITDA forecast for the twelve months ending March 31, 2012 of $150.4 million to specified changes in ammonia and UAN prices. Spot ammonia and UAN prices were $602.50 and $354.08, respectively, per ton as of February 28, 2011. There can be no assurance that we will achieve our EBITDA forecast for the twelve months ending March 31, 2012 or any of the specified levels of EBITDA indicated above, or that UAN and ammonia pricing will achieve any of the levels specified above. See “Our Cash Distribution Policy and Restrictions on Distribution — Forecasted Available Cash” for a reconciliation of our EBITDA forecast to our net income forecast for the twelve months ending March 31, 2012 and a discussion of the assumptions underlying our forecast. | |
| (2) | Dollars in millions. |
| (3) | This column shows (1) actual average UAN and ammonia prices and our actual net sales and EBITDA for the year ended December 31, 2010 and (2) pro forma available cash for the year ended December 31, 2010. See “Our Cash Distribution Policy and Restrictions on Distributions — Pro Forma Available Cash.” |
| (4) | Reflects forecasted average UAN and ammonia pricing for the twelve months ending March 31, 2012 and the production and expense assumptions set forth in footnote 1 above. |
2
Table of Contents
| ($ per ton, unless otherwise noted) | |||||||||||||||||||||||||||||||||||
| CVR Partners’ Ammonia Cost Advantage | CVR Partners’ UAN Cost Advantage | ||||||||||||||||||||||||||||||||||
| Illustrative | Illustrative Competitor | CVR Partners | Illustrative Competitor | CVR Partners | |||||||||||||||||||||||||||||||
| Natural Gas | Total | Competitor | |||||||||||||||||||||||||||||||||
| Delivered | Competitor | Ammonia | Ammonia | Total | UAN | ||||||||||||||||||||||||||||||
| Price | Gas | Ammonia | Ammonia | Cost | cost per ton | Competitor | UAN | Cost | |||||||||||||||||||||||||||
| ($/MMbtu) | Cost(a) | Costs(b)(c)(e) | Costs(d)(e) | Advantage | UAN(f) | UAN Costs(c)(e)(g) | Costs(e)(f)(h) | Advantage | |||||||||||||||||||||||||||
| $ | 4.00 | $ | 132 | $ | 193 | $ | 194 | $ | (1) | $ | 65 | $ | 98 | $ | 87 | $ | 11 | ||||||||||||||||||
| 4.50 | 149 | 210 | 194 | 16 | 72 | 105 | 87 | 18 | |||||||||||||||||||||||||||
| 5.50 | 182 | 243 | 194 | 49 | 85 | 118 | 87 | 31 | |||||||||||||||||||||||||||
| 6.50 | 215 | 276 | 194 | 82 | 99 | 132 | 87 | 45 | |||||||||||||||||||||||||||
| 7.50 | 248 | 309 | 194 | 115 | 113 | 146 | 87 | 59 | |||||||||||||||||||||||||||
| (a) | Assumes 33 MMbtu of natural gas to produce a ton of ammonia, based on Blue Johnson. | |
| (b) | Assumes $27 per ton operating cost for ammonia, based on Blue Johnson. | |
| (c) | Assumes incremental $34 per ton transportation cost from the U.S. Gulf Coast to the mid-continent for ammonia and $15 per ton for UAN, based on recently published rail and pipeline tariffs. | |
| (d) | CVR Partners’ ammonia cost consists of $19 per ton of ammonia in pet coke costs and $175 per ton of ammonia in operating costs for the year ended December 31, 2010. | |
| (e) | The cost data included in this chart for an illustrative competitor assumes property taxes, whereas the cost data included for CVR Partners includes the cost of our property taxes other than property taxes currently in dispute. CVR Partners is currently disputing the amount of property taxes which it has been required to pay in recent years. For information on the effect of disputed property taxes on our actual production costs, see product production cost data and footnote 7 under “— Summary Historical and Pro Forma Consolidated Financial Information.” See also “Management’s Discussion and Analysis of Financial Condition and Results of Operations — Factors Affecting Comparability — Fertilizer Plant Property Taxes.” | |
| (f) | Each ton of UAN contains approximately 0.41 tons of ammonia. Illustrative competitor UAN cost per ton data removes $34 per ton in transportation costs for ammonia. | |
| (g) | Assumes $18 per ton cash conversion cost to UAN, based on Blue Johnson. | |
| (h) | CVR Partners’ UAN conversion cost was $12 per ton for the year ended December 31, 2010. $10.82 per ton of ammonia production costs are not transferable to UAN costs. |
| • | Cost Advantage. We operate the only nitrogen fertilizer production facility in North America that uses pet coke gasification to produce nitrogen fertilizer, which has historically given us a cost advantage over competitors that use natural gas-based production methods. Our costs are approximately 79% fixed and relatively stable, which allows us to benefit directly from increases in nitrogen fertilizer prices. Our variable costs consist primarily of pet coke. Our pet coke costs have historically remained relatively stable, averaging $25 per ton since we began operating under our current structure in October 2007, with a high of $31 per ton for 2008 and a low of $17 per ton for 2010. Third-party pet coke is readily available to us, and we have paid an average cost of $41 per ton for third-party pet coke over the last five years. Substantially all of our nitrogen fertilizer competitors use natural gas as their primary raw material feedstock (with natural gas constituting approximately85-90% of their production costs based on historical data) and are therefore heavily impacted by changes in natural gas prices. | |
| • | Premium Product Focus. We focus on producing higher margin, higher growth UAN nitrogen fertilizer. Historically, UAN has accounted for approximately 80% of our product tons sold. UAN commands a price premium over ammonia and urea on a nutrient ton basis. Unlike ammonia and urea, UAN is easier to apply and can be applied throughout the growing season to crops directly or mixed with crop protection products, which reduces energy and labor costs for farmers. In addition, UAN is safer to handle than ammonia. The convenience of UAN fertilizer has led to an 8.5% increase in its consumption from 2000 through 2010 (estimated) on a nitrogen content basis, whereas ammonia fertilizer consumption decreased by 2.4% for the same period, according to data supplied by Blue Johnson. We plan to expand our UAN upgrading capacity so that we have the flexibility to upgrade all of our ammonia production into UAN. |
3
Table of Contents
| • | Strategically Located Asset. We and other competitors located in the U.S. farm belt share a transportation cost advantage when compared to ourout-of-region competitors in serving the U.S. farm belt agricultural market. We are therefore able to cost-effectively sell substantially all of our products in the higher margin agricultural market, whereas, according to publicly available information prepared by our competitors, a significant portion of our competitors’ revenues are derived from the lower margin industrial market. Because the U.S. farm belt consumes more nitrogen fertilizer than is produced in the region, it must import nitrogen fertilizer from the U.S. Gulf Coast as well as from international producers. Accordingly, U.S. farm belt producers may offer nitrogen fertilizers at prices that factor in the transportation costs ofout-of-region producers without having incurred such costs. We estimate that our plant enjoys a transportation cost advantage of approximately $25 per ton over competitors located in the U.S. Gulf Coast, based on a comparison of our actual transportation costs and recently published rail and pipeline tariffs. Our location on Union Pacific’s main line increases our transportation cost advantage. Our products leave the plant either in trucks for direct shipment to customers (in which case we incur no transportation cost) or in railcars for destinations located principally on the Union Pacific Railroad. We do not incur any intermediate transfer, storage, barge freight or pipeline freight charges. |
| • | Pay Out All of the Available Cash We Generate Each Quarter. Our strategy is to pay out all of the available cash we generate each quarter. We expect that holders of our common units will receive a greater percentage of our operating cash flow when compared to our publicly traded competitors across the broader fertilizer sector, such as Agrium, Potash Corporation, CF Industries, Yara and Terra Nitrogen. These companies have provided an average dividend yield of 0.1%, 0.3%, 0.4%, 1.6% and 6.9%, respectively, as of February 28, 2011, compared to our expected distribution yield of 14.8% (calculated by dividing our forecasted distribution for the twelve months ending March 31, 2012 of $1.92 per common unit by themid-point of the price range on the cover page of this prospectus). The board of directors of our general partner will adopt a policy under which we will distribute all of the available cash we generate each quarter, as described in “Our Cash Distribution Policy and Restrictions On Distributions” on page 54. We do not intend to maintain excess distribution coverage for the purpose of maintaining stability or growth in our quarterly |
4
Table of Contents
| distributions or otherwise to reserve cash for future distributions. Unlike many publicly traded partnerships that have economic general partner interests and incentive distribution rights that entitle the general partner to receive disproportionate percentages of cash distributions as distributions increase (often up to 50%), our general partner will have a non-economic interest and no incentive distribution rights, and will therefore not be entitled to receive cash distributions. Our common unitholders will receive 100% of our cash distributions. |
| • | Pursue Growth Opportunities. We are well positioned to grow organically, through acquisitions, or both. |
| • | Expand UAN Capacity. We intend to move forward with an expansion of our nitrogen fertilizer plant that is designed to increase our UAN production capacity by 400,000 tons, or approximately 50%, per year. This approximately $135 million expansion, for which approximately $31 million had been spent as of December 31, 2010, will allow us the flexibility to upgrade all of our ammonia production when market conditions favor UAN. We expect that this additional UAN production capacity will improve our margins, as UAN has historically been a higher margin product than ammonia. We expect that the UAN expansion will take 18 to 24 months to complete and will be funded with approximately $91.4 million of the net proceeds from this offering. |
| • | Selectively Pursue Accretive Acquisitions. We intend to evaluate strategic acquisitions within the nitrogen fertilizer industry and to focus on disciplined and accretive investments that leverage our core strengths. We have no agreements, understandings or financings with respect to any acquisitions at the present time. |
| • | Continue to Focus on Safety and Training. We intend to continue our focus on safety and training in order to increase our facility’s reliability and maintain our facility’s high on-stream availability. In 2010, our nitrogen fertilizer plant had a recordable incident rate of 0.76, which was our lowest recordable incident rate in over five years. The recordable incident rate reflects the number of recordable incidents per 200,000 hours worked. |
| • | Continue to Enhance Efficiency and Reduce Operating Costs. We are currently engaged in certain projects that will reduce overall operating costs, increase efficiency and utilize byproducts to generate incremental revenue. For example, we have built a low btu gas recovery pipeline between our nitrogen fertilizer plant and CVR Energy’s crude oil refinery, which will allow us to sell off-gas, a byproduct produced by our fertilizer plant, to the refinery. This pipeline was commissioned in March 2011. In addition, we have signed an agreement to sell all of the high purity carbon dioxide, or CO2, produced by our nitrogen fertilizer plant (currently approximately 850,000 tons per year) to an oil and gas exploration and production company. |
| • | Provide High Level of Customer Service. We focus on providing our customers with the highest level of service. The nitrogen fertilizer plant has demonstrated consistent levels of production while operating at close to full capacity. Substantially all of our product shipments are targeted to freight advantaged destinations located in the U.S. farm belt, allowing us to quickly and reliably service customer demand. Furthermore, we maintain our own fleet of railcars, which helps us ensure prompt delivery. As a result of these efforts, many of our largest customers have been our customers since the plant came online in 2000. We believe a continued focus on customer service will allow us to maintain relationships with existing customers and grow our business. |
| • | We estimate that we will produce approximately 100,000 to 105,000 tons of ammonia during the quarter ended March 31, 2011, of which approximately 33,000 to 35,000 net tons will be available for sale, and the rest will be upgraded to 163,000 to 170,000 tons of UAN. During the quarter ended March 31, 2010, the plant |
5
Table of Contents
| • | We estimate that the average plant gate price for tons of ammonia recognized in revenue during the quarter ended March 31, 2011 will be approximately $560 to $565 and the average plant gate price for tons of UAN recognized in revenue during the quarter ended March 31, 2011 will be approximately $200 to $210. During the quarter ended March 31, 2010, the average plant gate price for tons of ammonia recognized in revenue was $282 and the average plant gate price for tons of UAN recognized in revenue was $167. |
| • | We estimate that the tons sold of ammonia during the quarter ended March 31, 2011 will be approximately 23,500 to 26,500 and the tons sold of UAN during the quarter ended March 31, 2011 will be approximately 169,500 to 175,500. During the quarter ended March 31, 2010, we sold approximately 31,200 tons of ammonia and 155,800 tons of UAN. |
6
Table of Contents
7
Table of Contents
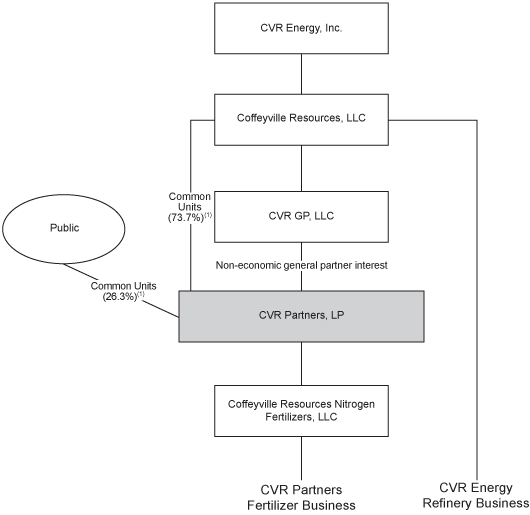
| Issuer | CVR Partners, LP, a Delaware limited partnership. |
| Common units offered to the public | 19,200,000 common units. |
| Option to purchase additional common units from us | If the underwriters exercise their option to purchase additional common units in full, we will issue 22,080,000 common units to the public. |
| Units outstanding after this offering | 73,000,000 common units (excluding 5,000,000 common units which are subject to issuance under our long-term incentive plan). If the underwriters do not exercise their option to purchase additional common units, we will issue 2,880,000 common units to Coffeyville Resources upon the option’s expiration. If and to the extent the underwriters exercise their option to purchase additional common units, the number of common units purchased by the underwriters pursuant to such exercise will be issued to the public and the remainder, if any, will be issued to Coffeyville Resources. Accordingly, the exercise of the underwriters’ option will not affect the total number of common units outstanding. |
| In addition, our general partner will own a non-economic general partner interest in us which will not entitle it to receive distributions. |
| Use of Proceeds | We estimate that the net proceeds to us in this offering, after deducting underwriting discounts and commissions and the estimated expenses of this offering, will be approximately $228.1 million (based on an assumed initial public offering price of $13.00 per common unit, the mid-point of the price range set forth on the cover page of this prospectus). We intend to use: |
| • approximately $18.4 million to make a distribution to Coffeyville Resources in satisfaction of our obligation to reimburse it for certain capital expenditures it made on our behalf with respect to the nitrogen fertilizer business prior to October 24, 2007; |
| • approximately $89.3 million to make a special distribution to Coffeyville Resources in order to, among other things, fund the offer to purchase Coffeyville Resources’ senior secured notes required upon consummation of this offering; |
| • approximately $26 million to purchase (and subsequently extinguish) the incentive distribution rights, or IDRs, currently owned by our general partner; | ||
| • approximately $3 million to pay financing fees resulting from our new credit facility; and |
| • the balance for general partnership purposes, including approximately $91.4 million to fund the intended UAN expansion. |
| If the underwriters exercise their option to purchase 2,880,000 additional common units in full, the additional net proceeds would be approximately $34.8 million (based upon the mid-point of the price range set forth on the cover page of this prospectus). The net proceeds from any exercise of such option will be paid as a special distribution |
8
Table of Contents
| to Coffeyville Resources. See “The Transactions and Our Structure and Organization” and “Use of Proceeds.” |
| Cash Distributions | Within 45 days after the end of each quarter, beginning with the quarter ending June 30, 2011, we expect to make cash distributions to unitholders of record on the applicable record date. | |
| The board of directors of our general partner will adopt a policy pursuant to which we will distribute all of the available cash we generate each quarter. Available cash for each quarter will be determined by the board of directors of our general partner following the end of such quarter. We expect that available cash for each quarter will generally equal our cash flow from operations for the quarter, less cash needed for maintenance capital expenditures, debt service and other contractual obligations, and reserves for future operating or capital needs that the board of directors of our general partner deems necessary or appropriate. We do not intend to maintain excess distribution coverage for the purpose of maintaining stability or growth in our quarterly distribution or otherwise to reserve cash for distributions, and we do not intend to incur debt to pay quarterly distributions. We expect to finance substantially all of our growth externally, either by debt issuances or additional issuances of equity. | ||
| Because our policy will be to distribute all the available cash we generate each quarter, without reserving cash for future distributions or borrowing to pay distributions during periods of low cash flow from operations, our unitholders will have direct exposure to fluctuations in the amount of cash generated by our business. We expect that the amount of our quarterly distributions, if any, will vary based on our operating cash flow during such quarter. Our quarterly cash distributions, if any, will not be stable and will vary from quarter to quarter as a direct result of variations in our operating performance and cash flow caused by fluctuations in the price of nitrogen fertilizers and in the amount of forward and prepaid sales we have in any given quarter. Such variations in the amount of our quarterly distributions may be significant. Unlike most publicly traded partnerships, we will not have a minimum quarterly distribution or employ structures intended to consistently maintain or increase distributions over time. The board of directors of our general partner may change our distribution policy at any time and from time to time. Our partnership agreement does not require us to pay cash distributions on a quarterly or other basis. |
| Based upon our forecast for the twelve months ending March 31, 2012, and assuming the board of directors of our general partner declares distributions in accordance with our cash distribution policy, we expect that our aggregate distributions for the twelve months ending March 31, 2012 will be approximately $140.1 million, or $1.92 per common unit. See “Our Cash Distribution Policy and Restrictions on Distributions — Forecasted Available Cash.” Unanticipated events may occur which could materially adversely affect the actual results we achieve during the forecast period. Consequently, our actual results of operations, cash flows, need for reserves and financial condition during the forecast period may vary from the forecast, and such variations may be material. Prospective investors are cautioned not to place undue reliance on our forecast and should make their own |
9
Table of Contents
| independent assessment of our future results of operations, cash flows and financial condition. In addition, the board of directors of our general partner may be required to or elect to eliminate our distributions at any time during periods of reduced prices or demand for our nitrogen fertilizer products, among other reasons. Please see “Risk Factors.” | ||
| From time to time we make prepaid sales, whereby we receive cash during one quarter in respect of product to be produced and sold in a future quarter but we do not record revenue in respect of the related product sales until the quarter when product is delivered. All cash on our balance sheet in respect of prepaid sales on the date of the closing of this offering will not be distributed to Coffeyville Resources at the closing of this offering but will be reserved for distribution to holders of common units. |
| For a calculation of our ability to make distributions to unitholders based on our pro forma results of operations for the year ended December 31, 2010, please read “Our Cash Distribution Policy and Restrictions on Distributions” on page 54. Our pro forma available cash generated during the year ended December 31, 2010 would have been $30.9 million. See “Our Cash Distribution Policy and Restrictions on Distributions — Pro Forma Available Cash.” |
| Incentive Distribution Rights | None. | |
| Subordination Period | None. | |
| Issuance of additional units | Our partnership agreement authorizes us to issue an unlimited number of additional units and rights to buy units for the consideration and on the terms and conditions determined by the board of directors of our general partner without the approval of our unitholders. See “Common Units Eligible for Future Sale” and “The Partnership Agreement — Issuance of Additional Partnership Interests.” |
| Limited voting rights | Our general partner manages and operates us. Unlike the holders of common stock in a corporation, you will have only limited voting rights on matters affecting our business. You will have no right to elect our general partner or our general partner’s directors on an annual or other continuing basis. Our general partner may be removed by a vote of the holders of at least 662/3% of the outstanding common units, including any common units owned by our general partner and its affiliates (including Coffeyville Resources, a wholly-owned subsidiary of CVR Energy), voting together as a single class. Upon completion of this offering, our general partner and its affiliates, through Coffeyville Resources, will own an aggregate of approximately 73.7% of our outstanding common units (approximately 69.8% if the underwriters exercise their option to purchase additional common units in full). This will give Coffeyville Resources the ability to prevent removal of our general partner. See “The Partnership Agreement — Voting Rights.” |
| Call right | If at any time our general partner and its affiliates (including Coffeyville Resources) own more than 80% of the common units, our general partner will have the right, but not the obligation, to purchase all, but not less than all, of the common units held by public unitholders at a |
10
Table of Contents
| price not less than their then-current market price, as calculated pursuant to the terms of our Partnership Agreement. See “The Partnership Agreement — Call Right.” |
| Estimated ratio of taxable income to distributions | We estimate that if you own the common units you purchase in this offering through the record date for distributions for the twelve months ending December 31, 2012, you will be allocated, on a cumulative basis, an amount of U.S. federal taxable income for that period that will be 50% or less of the cash distributed to you with respect to that period. For example, if you receive an annual distribution of $1.92 per common unit, we estimate that your average allocable U.S. federal taxable income per year will be no more than $0.96 per common unit. See “Material U.S. Federal Income Tax Consequences — Tax Consequences of Common Unit Ownership — Ratio of Taxable Income to Distributions.” |
| Material U.S. Federal Income Tax Consequences | For a discussion of material U.S. federal income tax consequences that may be relevant to prospective unitholders, see “Material U.S. Federal Income Tax Consequences.” |
| Exchange Listing | Our common units have been approved for listing on the New York Stock Exchange, subject to official notice of issuance, under the symbol “UAN.” |
| Risk Factors | See “Risk Factors” beginning on page 18 of this prospectus for a discussion of factors that you should carefully consider before deciding to invest in our common units. |
11
Table of Contents
| (1) | Assumes the underwriters do not exercise their option to purchase additional common units, which would instead be issued to Coffeyville Resources upon the option’s expiration. If and to the extent the underwriters exercise their option to purchase additional common units, the units purchased pursuant to such exercise will be issued to the public and the remainder, if any, will be issued to Coffeyville Resources. Accordingly, the exercise of the underwriters’ option will not affect the total number of units outstanding. If the underwriters’ option is exercised in full, then Coffeyville Resources would own 69.8% of the common units and the public would own 30.2% of the common units. |
12
Table of Contents
13
Table of Contents
| Historical | Pro Forma | ||||||||||||||||
| Year Ended | Year Ended | Year Ended | Year Ended | ||||||||||||||
| December 31, | December 31, | December 31, | December 31, | ||||||||||||||
| 2010 | 2009 | 2008 | 2010 | ||||||||||||||
| (unaudited) | |||||||||||||||||
| (dollars in millions, except per unit data and as otherwise indicated) | |||||||||||||||||
Statement of Operations Data: | |||||||||||||||||
| Net sales | $ | 180.5 | $ | 208.4 | $ | 263.0 | $ | 180.5 | |||||||||
Cost of product sold — Affiliates(1) | 5.8 | 9.5 | 11.1 | 5.8 | |||||||||||||
Cost of product sold — Third Parties(1) | 28.5 | 32.7 | 21.5 | 28.5 | |||||||||||||
| 34.3 | 42.2 | 32.6 | 34.3 | ||||||||||||||
Direct operating expenses — Affiliates(1)(2) | 2.3 | 2.1 | 0.4 | 2.3 | |||||||||||||
Direct operating expenses — Third Parties(1) | 84.4 | 82.4 | 85.7 | 84.4 | |||||||||||||
| 86.7 | 84.5 | 86.1 | 86.7 | ||||||||||||||
Selling, general and administrative expenses — Affiliates(1)(2) | 16.7 | 12.3 | 1.1 | 16.7 | |||||||||||||
Selling, general and administrative expenses — Third Parties(1) | 3.9 | 1.8 | 8.4 | 3.9 | |||||||||||||
| 20.6 | 14.1 | 9.5 | 20.6 | ||||||||||||||
Depreciation and amortization(3) | 18.5 | 18.7 | 18.0 | 18.5 | |||||||||||||
| Operating income | $ | 20.4 | $ | 48.9 | $ | 116.8 | $ | 20.4 | |||||||||
Other income (expense)(4) | 12.9 | 9.0 | 2.1 | 0.4 | |||||||||||||
| Interest (expense) and other financing costs | — | — | — | (5.7 | ) | ||||||||||||
| Gain (loss) on derivatives | — | — | — | — | |||||||||||||
| Income before income taxes | $ | 33.3 | $ | 57.9 | $ | 118.9 | $ | 15.1 | |||||||||
| Income tax expense | — | — | — | — | |||||||||||||
| Net income | $ | 33.3 | $ | 57.9 | $ | 118.9 | $ | 15.1 | |||||||||
| Pro forma net income per common unit, basic and diluted | $ | 0.21 | |||||||||||||||
| Pro forma number of common units, basic and diluted | 73,000,000 | ||||||||||||||||
Financial and Other Data: | |||||||||||||||||
| Cash flows provided by operating activities | 75.9 | 85.5 | 123.5 | ||||||||||||||
| Cash flows (used in) investing activities | (9.0 | ) | (13.4 | ) | (23.5 | ) | |||||||||||
| Cash flows (used in) financing activities | (29.6 | ) | (75.8 | ) | (105.3 | ) | |||||||||||
EBITDA(5) | 38.7 | 67.6 | 134.9 | 38.7 | |||||||||||||
| Capital expenditures for property, plant and equipment | 10.1 | 13.4 | 23.5 | ||||||||||||||
Key Operating Data: | |||||||||||||||||
Product pricing (plant gate) (dollars per ton)(6): | |||||||||||||||||
| Ammonia | $ | 361 | $ | 314 | $ | 557 | |||||||||||
| UAN | 179 | 198 | 303 | ||||||||||||||
Product production cost (exclusive of depreciation expense) (dollars per ton)(7): | |||||||||||||||||
| Ammonia | $ | 212.70 | $ | 206.92 | $ | 246.39 | |||||||||||
| UAN | 95.19 | 94.92 | 96.78 | ||||||||||||||
Pet coke cost (dollars per ton)(8): | |||||||||||||||||
| Third-party | 40 | 37 | 39 | ||||||||||||||
| CVR Energy | 11 | 22 | 30 | ||||||||||||||
| Production (thousand tons): | |||||||||||||||||
Ammonia (gross produced)(9) | 392.7 | 435.2 | 359.1 | ||||||||||||||
Ammonia (net available for sale)(9) | 155.6 | 156.6 | 112.5 | ||||||||||||||
| UAN | 578.3 | 677.7 | 599.2 | ||||||||||||||
On-stream factors(10): | |||||||||||||||||
| Gasifier | 89.0 | % | 97.4 | % | 87.8 | % | |||||||||||
| Ammonia | 87.7 | % | 96.5 | % | 86.2 | % | |||||||||||
| UAN | 80.8 | % | 94.1 | % | 83.4 | % | |||||||||||
14
Table of Contents
| Historical | Pro Forma | ||||||||||||||||
| Year Ended | Year Ended | Year Ended | Year Ended | ||||||||||||||
| December 31, | December 31, | December 31, | December 31, | ||||||||||||||
| 2010 | 2009 | 2008 | 2010 | ||||||||||||||
| (unaudited) | |||||||||||||||||
| (in millions) | |||||||||||||||||
Balance Sheet Data: | |||||||||||||||||
| Cash and cash equivalents | $ | 42.7 | $ | 5.4 | $ | 9.1 | $ | 143.7 | |||||||||
| Working capital | 27.1 | 135.5 | 60.4 | 125.0 | |||||||||||||
| Total assets | 452.2 | 551.5 | 499.9 | 551.7 | |||||||||||||
| Total debt including current portion | — | — | — | 125.0 | |||||||||||||
| Partners’ capital | 402.2 | 519.9 | 458.8 | 378.1 | |||||||||||||
| (1) | Amounts shown are exclusive of depreciation and amortization. |
| (2) | Our direct operating expenses (exclusive of depreciation and amortization) and selling, general and administrative expenses (exclusive of depreciation and amortization) for the years ended December 31, 2010, 2009 and 2008 include a charge related to CVR Energy’s share-based compensation expense allocated to us by CVR Energy for financial reporting purposes in accordance with Financial Accounting Standards Board, or FASB, Accounting Standards Codification, or ASC, 718Compensation —Stock Compensation, or ASC 718. These charges will continue to be attributed to us following the closing of this offering. We are not responsible for the payment of cash related to any share-based compensation allocated to us by CVR Energy. See “Management’s Discussion and Analysis of Financial Condition and Results of Operations — Critical Accounting Policies — Share-Based Compensation.” The charges were: |
| Historical | Pro Forma | ||||||||||||||||
| Year Ended | Year Ended | Year Ended | Year Ended | ||||||||||||||
| December 31, | December 31, | December 31, | December 31, | ||||||||||||||
| 2010 | 2009 | 2008 | 2010 | ||||||||||||||
| (unaudited) | |||||||||||||||||
| (in millions) | |||||||||||||||||
| Direct operating expenses (exclusive of depreciation and amortization) | $ | 0.7 | $ | 0.2 | $ | (1.6 | ) | $ | 0.7 | ||||||||
| Selling, general and administrative expenses (exclusive of depreciation and amortization) | 8.3 | 3.0 | (9.0 | ) | 8.3 | ||||||||||||
| Total | $ | 9.0 | $ | 3.2 | $ | (10.6 | ) | $ | 9.0 | ||||||||
| (3) | Depreciation and amortization is comprised of the following components as excluded from direct operating expenses and selling, general and administrative expenses: |
| Historical | Pro Forma | ||||||||||||||||
| Year Ended | Year Ended | Year Ended | Year Ended | ||||||||||||||
| December 31, | December 31, | December 31, | December 31, | ||||||||||||||
| 2010 | 2009 | 2008 | 2010 | ||||||||||||||
| (unaudited) | |||||||||||||||||
| (in millions) | |||||||||||||||||
| Depreciation and amortization excluded from direct operating expenses | $ | 18.5 | $ | 18.7 | $ | 18.0 | $ | 18.5 | |||||||||
| Depreciation and amortization excluded from selling, general and administrative expenses | — | — | — | — | |||||||||||||
| Total depreciation and amortization | $ | 18.5 | $ | 18.7 | $ | 18.0 | $ | 18.5 | |||||||||
15
Table of Contents
| (4) | Other income (expense) is comprised of the following components included in our consolidated statement of operations: |
| Historical | Pro Forma | ||||||||||||||||
| Year Ended | Year Ended | Year Ended | Year Ended | ||||||||||||||
| December 31, | December 31, | December 31, | December 31, | ||||||||||||||
| 2010 | 2009 | 2008 | 2010 | ||||||||||||||
| (unaudited) | |||||||||||||||||
| (in millions) | |||||||||||||||||
Interest income(a) | $ | 13.1 | $ | 9.0 | $ | 2.0 | $ | 0.6 | (b) | ||||||||
| Other income (expense) | (0.2 | ) | — | 0.1 | (0.2 | ) | |||||||||||
| Other income (expense) | $ | 12.9 | $ | 9.0 | $ | 2.1 | $ | 0.4 | |||||||||
| (a) | Interest income for the years ended December 31, 2010, 2009 and 2008 is primarily attributable to a due from affiliate balance owed to us by Coffeyville Resources as a result of affiliate loans. The due from affiliate balance was distributed to Coffeyville Resources in December 2010. Accordingly, such amounts are no longer owed to us. |
| (b) | Reflects interest income earned on average cash balance. |
| (5) | EBITDA is defined as net income plus interest expense and other financing costs, income tax expense and depreciation and amortization, net of interest income. | |
| We present EBITDA because it is a material component in our calculation of available cash. In addition, EBITDA is a material term utilized in our new credit facility in order to determine our leverage ratio (ratio of debt to EBITDA) and our interest coverage ratio (ratio of EBITDA to interest expense). We are required to maintain specified levels of leverage and interest coverage each quarter, and the leverage ratio also affects the amount of interest we are required to pay. EBITDA is also used as a supplemental financial measure by management and by external users of our financial statements, such as investors and commercial banks, to assess: |
| • | the financial performance of our assets without regard to financing methods, capital structure or historical cost basis; and | |
| • | our operating performance and return on invested capital compared to those of other publicly traded limited partnerships, without regard to financing methods and capital structure. |
| EBITDA should not be considered an alternative to net income, operating income, net cash provided by operating activities or any other measure of financial performance or liquidity presented in accordance with GAAP. EBITDA may have material limitations as a performance measure because it excludes items that are necessary elements of our costs and operations. In addition, EBITDA presented by other companies may not be comparable to our presentation, since each company may define these terms differently. |
| Historical | Pro Forma | ||||||||||||||||
| Year | Year | Year | Year | ||||||||||||||
| Ended | Ended | Ended | Ended | ||||||||||||||
| December 31, | December 31, | December 31, | December 31, | ||||||||||||||
| 2010 | 2009 | 2008 | 2010 | ||||||||||||||
| (unaudited) | |||||||||||||||||
| (in millions) | |||||||||||||||||
Net income | $ | 33.3 | $ | 57.9 | $ | 118.9 | $ | 15.1 | |||||||||
| Add: | |||||||||||||||||
| Interest expense and other financing costs | — | — | — | 5.7 | |||||||||||||
| Interest income | (13.1 | ) | (9.0 | ) | (2.0 | ) | (0.6 | ) | |||||||||
| Income tax expense | — | — | — | — | |||||||||||||
| Depreciation and amortization | 18.5 | 18.7 | 18.0 | 18.5 | |||||||||||||
EBITDA | $ | 38.7 | $ | 67.6 | $ | 134.9 | $ | 38.7 | |||||||||
16
Table of Contents
| (6) | Plant gate price per ton represents net sales less freight costs and hydrogen revenue (from hydrogen sales to CVR Energy’s refinery) divided by product sales volume in tons in the reporting period. Plant gate price per ton is shown in order to provide a pricing measure that is comparable across the fertilizer industry. | |
| (7) | Product production cost per ton (exclusive of depreciation expense) includes the total amount of operating expenses incurred during the production process (including raw material costs) in dollars per product ton divided by the total number of tons produced. This amount includes the full amount of property taxes and electric charges paid in each period. CVR Partners is currently disputing the amount of property taxes paid in each period. CVR Partners favorably settled an electric rate dispute with the City of Coffeyville during the third quarter of 2010. This dispute unfavorably affected production cost per ton in 2009 and, once settled in the third quarter, favorably affected production cost per ton in 2010. Excluding the amount of property tax which CVR Partners is disputing and the electric rate dispute and settlement, (i) for the year ended December 31, 2010, the product production cost per ton (exclusive of depreciation expense) for ammonia would have been $193.86 and for UAN would have been $87.46, (ii) for the year ended December 31, 2009, the product production cost per ton (exclusive of depreciation expense) for ammonia would have been $181.23 and for UAN would have been $84.37, and (iii) for the year ended December 31, 2008, the product production cost per ton (exclusive of depreciation expense) for ammonia would have been $222.37 and for UAN would have been $86.89. For a discussion of the property tax dispute, see “Management’s Discussion and Analysis of Financial Conditions and Results of Operations — Factors Affecting Comparability — Fertilizer Plant Property Taxes.” | |
| (8) | We use 1.1 tons of pet coke to produce 1.0 ton of ammonia. | |
| (9) | The gross tons produced for ammonia represent the total ammonia produced, including ammonia produced that was upgraded into UAN. The net tons available for sale represent the ammonia available for sale that was not upgraded into UAN. | |
| (10) | On-stream factor is the total number of hours operated divided by the total number of hours in the reporting period. Excluding the impact of the downtime associated with the Linde air separation unit outage, the rupture of the high-pressure UAN vessel and the major scheduled turnaround, the on-stream factors for the year ended December 31, 2010 would have been 97.6% for gasifier, 96.8% for ammonia and 96.1% for UAN. Excluding the Linde air separation unit outage in 2009, the on-stream factors would have been 99.3% for gasifier, 98.4% for ammonia and 96.1% for UAN for the year ended December 31, 2009. Excluding the turnaround performed in 2008 the on-stream factors would have been 91.7% for gasifier, 90.2% for ammonia and 87.4% for UAN for the year ended December 31, 2008. |
17
Table of Contents
| • | Our partnership agreement will not provide for any minimum quarterly distribution and our quarterly distributions, if any, will be subject to significant fluctuations directly related to the cash we generate after payment of our fixed and variable expenses due to the nature of our business. | |
| • | The amount of distributions we make, if any, and the decision to make any distribution at all will be determined by the board of directors of our general partner, whose interests may differ from those of our common unitholders. Our general partner has limited fiduciary and contractual duties, which may permit it to favor its own interests or the interests of CVR Energy to the detriment of our common unitholders. | |
| • | The new credit facility that we will enter into upon the closing of this offering, and any credit facility or other debt instruments we enter into in the future, may limit the distributions that we can make. The new credit facility will provide that we can make distributions to holders of our common units, but only if we are in compliance with our leverage ratio and interest coverage ratio covenants on a pro forma basis after giving effect to any distribution, and there is no default or event of default under the facility. In addition, any future credit facility may contain other financial tests and covenants that we must satisfy. Any failure to comply with these tests and covenants could result in the lenders prohibiting distributions by us. | |
| • | The amount of available cash for distribution to our unitholders depends primarily on our cash flow, and not solely on our profitability, which is affected by non-cash items. As a result, we may make distributions during periods when we record losses and may not make distributions during periods when we record net income. | |
| • | The actual amount of available cash will depend on numerous factors, some of which are beyond our control, including UAN and ammonia prices, our operating costs, global and domestic demand for nitrogen fertilizer products, fluctuations in our working capital needs, and the amount of fees and expenses incurred by us. |
18
Table of Contents
| • | UnderSection 17-607 of the Delaware Revised Uniform Limited Partnership Act, or Delaware Act, we may not make a distribution to our limited partners if the distribution would cause our liabilities to exceed the fair value of our assets. |
19
Table of Contents
20
Table of Contents
21
Table of Contents
22
Table of Contents
23
Table of Contents
| • | unscheduled maintenance or catastrophic events such as a major accident or fire, damage by severe weather, flooding or other natural disaster; |
24
Table of Contents
| • | labor difficulties that result in a work stoppage or slowdown; | |
| • | environmental proceedings or other litigation that compel the cessation of all or a portion of the operations at our nitrogen fertilizer plant; | |
| • | increasingly stringent environmental regulations; | |
| • | a disruption in the supply of pet coke to our nitrogen fertilizer plant; and | |
| • | a governmental ban or other limitation on the use of nitrogen fertilizer products, either generally or specifically those manufactured at our plant. |
25
Table of Contents
| • | weather patterns and field conditions (particularly during periods of traditionally high nitrogen fertilizer consumption); | |
| • | quantities of nitrogen fertilizers imported to and exported from North America; | |
| • | current and projected grain inventories and prices, which are heavily influenced by U.S. exports and world-wide grain markets; and | |
| • | U.S. governmental policies, including farm and biofuel policies, which may directly or indirectly influence the number of acres planted, the level of grain inventories, the mix of crops planted or crop prices. |
26
Table of Contents
27
Table of Contents
28
Table of Contents
29
Table of Contents
| • | Although we believe we will have sufficient liquidity under our new credit facility to run our business, under extreme market conditions there can be no assurance that such funds would be available or sufficient, and in such a case, we may not be able to successfully obtain additional financing on favorable terms, or at all. | |
| • | Market volatility could exert downward pressure on the price of our common units, which may make it more difficult for us to raise additional capital and thereby limit our ability to grow. | |
| • | Market conditions could result in our significant customers experiencing financial difficulties. We are exposed to the credit risk of our customers, and their failure to meet their financial obligations when due because of bankruptcy, lack of liquidity, operational failure or other reasons could result in decreased sales and earnings for us. |
30
Table of Contents
| • | unforeseen difficulties in the acquired operations and disruption of the ongoing operations of our business; | |
| • | failure to achieve cost savings or other financial or operating objectives with respect to an acquisition; | |
| • | strain on the operational and managerial controls and procedures of our business, and the need to modify systems or to add management resources; | |
| • | difficulties in the integration and retention of customers or personnel and the integration and effective deployment of operations or technologies; | |
| • | assumption of unknown material liabilities or regulatory non-compliance issues; | |
| • | amortization of acquired assets, which would reduce future reported earnings; | |
| • | possible adverse short-term effects on our cash flows or operating results; and | |
| • | diversion of management’s attention from the ongoing operations of our business. |
31
Table of Contents
32
Table of Contents
33
Table of Contents
| • | the requirement that a majority of the board of directors of our general partner consist of independent directors; |
34
Table of Contents
| • | the requirement that the board of directors of our general partner have a nominating/corporate governance committee that is composed entirely of independent directors; and | |
| • | the requirement that the board of directors of our general partner have a compensation committee that is composed entirely of independent directors. |
35
Table of Contents
| • | Neither our partnership agreement nor any other agreement will require the owners of our general partner, including CVR Energy, to pursue a business strategy that favors us. The affiliates of our general partner, including CVR Energy, have fiduciary duties to make decisions in their own best interests and in the best interest of holders of CVR Energy’s common stock, which may be contrary to our interests. In addition, our general partner is allowed to take into account the interests of parties other than us or our unitholders, such as its owners or CVR Energy, in resolving conflicts of interest, which has the effect of limiting its fiduciary duty to our unitholders. | |
| • | Our general partner has limited its liability and reduced its fiduciary duties under our partnership agreement and has also restricted the remedies available to our unitholders for actions that, without the limitations, might constitute breaches of fiduciary duty. As a result of purchasing common units, unitholders consent to |
36
Table of Contents
| some actions and conflicts of interest that might otherwise constitute a breach of fiduciary or other duties under applicable state law. |
| • | The board of directors of our general partner will determine the amount and timing of asset purchases and sales, capital expenditures, borrowings, repayment of indebtedness and issuances of additional partnership interests, each of which can affect the amount of cash that is available for distribution to our common unitholders. | |
| • | Our partnership agreement does not restrict our general partner from causing us to pay it or its affiliates for any services rendered to us or entering into additional contractual arrangements with any of these entities on our behalf. There is no limitation on the amounts our general partner can cause us to pay it or its affiliates. |
| • | Our general partner may exercise its rights to call and purchase all of our common units if at any time it and its affiliates (including Coffeyville Resources) own more than 80% of the common units. |
| • | Our general partner will control the enforcement of obligations owed to us by it and its affiliates. In addition, our general partner will decide whether to retain separate counsel or others to perform services for us. | |
| • | Our general partner determines which costs incurred by it and its affiliates are reimbursable by us. | |
| • | The executive officers of our general partner, and the majority of the directors of our general partner, also serve as directorsand/or executive officers of CVR Energy. The executive officers who work for both CVR Energy and our general partner, including our chief executive officer, chief operating officer, chief financial officer and general counsel, divide their time between our business and the business of CVR Energy. These executive officers will face conflicts of interest from time to time in making decisions which may benefit either us or CVR Energy. |
| • | Our partnership agreement permits our general partner to make a number of decisions in its individual capacity, as opposed to its capacity as general partner. This entitles our general partner to consider only the interests and factors that it desires, and it has no duty or obligation to give any consideration to any interest of, or factors affecting, our common unitholders. Decisions made by our general partner in its individual capacity will be made by Coffeyville Resources as the sole member of our general partner, and not by the board of directors of our general partner. Examples include the exercise of the general partner’s call right, its voting rights with respect to any common units it may own, its registration rights and its determination whether or not to consent to any merger or consolidation or amendment to our partnership agreement. | |
| • | Our partnership agreement provides that our general partner will not have any liability to us or our unitholders for decisions made in its capacity as general partner so long as it acted in good faith, meaning it believed that the decisions were in our best interests. | |
| • | Our partnership agreement provides that our general partner and the officers and directors of our general partner will not be liable for monetary damages to us for any acts or omissions unless there has been a final and non-appealable judgment entered by a court of competent jurisdiction determining that our general |
37
Table of Contents
| partner or those persons acted in bad faith or engaged in fraud or willful misconduct or, in the case of a criminal matter, acted with knowledge that such person’s conduct was criminal. |
| • | Our partnership agreement generally provides that affiliate transactions and resolutions of conflicts of interest not approved by the conflicts committee of the board of directors of our general partner and not involving a vote of unitholders must be on terms no less favorable to us than those generally provided to or available from unrelated third parties or be “fair and reasonable.” In determining whether a transaction or resolution is “fair and reasonable,” our general partner may consider the totality of the relationship between the parties involved, including other transactions that may be particularly advantageous or beneficial to us. |
38
Table of Contents
| • | we were conducting business in a state but had not complied with that particular state’s partnership statute; or | |
| • | limited partners’ right to act with other unitholders to remove or replace our general partner, to approve some amendments to our partnership agreement or to take other actions under our partnership agreement constituted “control” of our business. |
39
Table of Contents
| • | the level of our distributions and our earnings or those of other companies in our industry or other publicly traded partnerships; | |
| • | the failure of securities analysts to cover our common units after this offering or changes in financial estimates by analysts; | |
| • | announcements by us or our competitors of significant contracts or acquisitions; | |
| • | variations in quarterly results of operations; | |
| • | loss of a large customer or supplier; |
40
Table of Contents
| • | market prices of nitrogen fertilizers; | |
| • | general economic conditions; | |
| • | terrorist acts; | |
| •�� | changes in the applicable environmental regulations; | |
| • | changes in accounting standards, policies, guidance, interpretations or principles; | |
| • | future sales of our common units; and | |
| • | investor perceptions of us and the industries in which our products are used. |
| • | the proportionate ownership interest of unitholders immediately prior to the issuance will decrease; | |
| • | the amount of cash distributions on each unit will decrease; | |
| • | the ratio of our taxable income to distributions may increase; | |
| • | the relative voting strength of each previously outstanding unit will be diminished; and | |
| • | the market price of the common units may decline. |
41
Table of Contents
42
Table of Contents
43
Table of Contents
44
Table of Contents
45
Table of Contents
| • | our ability to make cash distributions on the units; | |
| • | the volatile nature of our business and the variable nature of our distributions; | |
| • | the ability of our general partner to modify or revoke our distribution policy at any time; | |
| • | our ability to forecast our future financial condition or results of operations and our future revenues and expenses; | |
| • | the cyclical nature of our business; | |
| • | our largely fixed costs and the potential decline in the price of natural gas, which is the main resource used by our competitors and which will lower our competitors’ cost to produce nitrogen fertilizer products without lowering ours; | |
| • | the potential decline in the price of natural gas; | |
| • | a decrease in ethanol production; | |
| • | intense competition from other nitrogen fertilizer producers; | |
| • | adverse weather conditions, including potential floods; | |
| • | the seasonal nature of our business; | |
| • | the dependence of our operations on a few third-party suppliers, including providers of transportation services and equipment; | |
| • | our reliance on pet coke that we purchase from CVR Energy; | |
| • | the supply and price levels of essential raw materials; | |
| • | the risk of a material decline in production at our nitrogen fertilizer plant; | |
| • | potential operating hazards from accidents, fire, severe weather, floods or other natural disasters; | |
| • | the risk associated with governmental policies affecting the agricultural industry; | |
| • | the volatile nature of ammonia, potential liability for accidents involving ammonia that cause interruption to our business, severe damage to property or injury to the environment and human health and potential increased costs relating to transport of ammonia; | |
| • | capital expenditures and potential liabilities arising from environmental laws and regulations; | |
| • | our potential inability to obtain or renew permits; | |
| • | existing and proposed environmental laws and regulations, including those relating to climate change, alternative energy or fuel sources, and on the end-use and application of fertilizers; |
46
Table of Contents
| • | new regulations concerning the transportation of hazardous chemicals, risks of terrorism and the security of chemical manufacturing facilities; | |
| • | our lack of asset diversification; | |
| • | our dependence on significant customers; | |
| • | the potential loss of our transportation cost advantage over our competitors; | |
| • | our ability to comply with employee safety laws and regulations; | |
| • | potential disruptions in the global or U.S. capital and credit markets; | |
| • | the success of our acquisition and expansion strategies; | |
| • | our potential inability to successfully implement our business strategies, including the completion of significant capital programs; | |
| • | additional risks, compliance costs and liabilities from expansions or acquisitions; | |
| • | our reliance on CVR Energy’s senior management team; | |
| • | the potential shortage of skilled labor or loss of key personnel; | |
| • | our ability to continue to license the technology used in our operations; | |
| • | successfully defending against third-party claims of intellectual property infringement; | |
| • | restrictions in our debt agreements; | |
| • | the dependence on our subsidiary for cash to meet our debt obligations; | |
| • | our limited operating history as a stand-alone company; | |
| • | potential increases in costs and distraction of management resulting from the requirements of being a publicly traded partnership; | |
| • | exemptions we will rely on in connection with NYSE corporate governance requirements; | |
| • | risks relating to evaluations of internal controls required by Section 404 of the Sarbanes-Oxley Act; | |
| • | risks relating to our relationships with CVR Energy; | |
| • | control of our general partner by CVR Energy; | |
| • | the conflicts of interest faced by our senior management team, which operates both us and CVR Energy, and our general partner; | |
| • | limitations on the fiduciary duties owed by our general partner which are included in the partnership agreement; and | |
| • | changes in our treatment as a partnership for U.S. income or state tax purposes. |
47
Table of Contents
| • | We will distribute to Coffeyville Resources, a wholly owned subsidiary of CVR Energy, all cash on our balance sheet before the closing date of this offering (other than cash in respect of prepaid sales); |
| • | Each of Coffeyville Resources’ and CVR Special GP LLC’s, or Special GP, interests in us will be converted into 50,869,080 and 50,920 common units, respectively; |
| • | Special GP, a wholly-owned subsidiary of Coffeyville Resources, will be merged with and into Coffeyville Resources, with Coffeyville Resources continuing as the surviving entity; |
| • | We will offer and sell 19,200,000 common units in this offering (22,080,000 common units if the underwriters exercise their option in full) and pay related discounts, commissions and expenses; |
| • | Simultaneously with the closing of this offering, we will be released from our obligations as a guarantor under Coffeyville Resources’ existing ABL credit facility, its 9.0% First Lien Senior Secured Notes due 2015 and its 10.875% Second Lien Senior Secured Notes due 2017; | |
| • | Our general partner will sell to us its incentive distribution rights, or IDRs, for $26.0 million in cash (representing fair market value), which will be paid as a distribution to its current owners, which include members of our senior management, and we will extinguish such IDRs; | |
| • | Our general partner and Coffeyville Resources will enter into a second amended and restated agreement of limited partnership, the form of which is attached hereto as Appendix A; | |
| • | We will distribute $18.4 million of the offering proceeds to Coffeyville Resources in satisfaction of our obligation to reimburse it for certain capital expenditures it made with respect to the nitrogen fertilizer business prior to October 24, 2007; |
| • | We will make a special distribution of $89.3 million of the proceeds of this offering to Coffeyville Resources in order to, among other things, fund the offer to purchase Coffeyville Resources’ senior secured notes required upon consummation of this offering; |
| • | We will enter into a new credit facility, which will include a $125.0 million term loan and a $25.0 million revolving credit facility and pay associated financing costs; |
| • | At the closing of this offering, we will draw the $125.0 million term loan in full and use $92.1 million of the proceeds therefrom to fund a special distribution to Coffeyville Resources in order to, among other things, fund the offer to purchase Coffeyville Resources’ senior secured notes required upon consummation of this offering; |
| • | Coffeyville Acquisition III, the current owner of CVR GP, LLC, our general partner, will sell our general partner, which will hold a non-economic general partner interest in us, to Coffeyville Resources for nominal consideration; |
| • | If the underwriters exercise their option in full, we will issue an additional 2,880,000 common units and distribute the net proceeds, estimated to be approximately $34.8 million, to Coffeyville Resources. If the option is exercised in full and closed on the same date as this offering, the special distribution we make to Coffeyville Resources from the proceeds of our term loan will be reduced from $92.1 million to $87.2 million, and the special distribution we make to Coffeyville Resources from the proceeds of this offering will be increased from $89.3 million to $94.2 million; and |
| • | To the extent the underwriters do not exercise their option to purchase additional common units, we will issue those common units to Coffeyville Resources. |
48
Table of Contents
49
Table of Contents
| • | approximately $18.4 million will be distributed to Coffeyville Resources to satisfy our obligation to reimburse it for certain capital expenditures it made on our behalf with respect to the nitrogen fertilizer business prior to October 24, 2007; |
| • | approximately $89.3 million will be used to make a special distribution to Coffeyville Resources in order to, among other things, fund the offer to purchase Coffeyville Resources’ senior secured notes required upon consummation of this offering; |
| • | approximately $26 million will be used to purchase (and subsequently extinguish) the incentive distribution rights currently owned by our general partner; | |
| • | approximately $3 million will be used by us to pay financing fees in connection with entering into our new credit facility; and |
| • | the balance will be used for general partnership purposes, including approximately $91.4 million to fund the intended approximately $135 million UAN expansion, for which approximately $31 million had been spent as of December 31, 2010. |
50
Table of Contents
| As of December 31, 2010 | ||||||||
| Pro Forma | ||||||||
| Actual | Adjusted | |||||||
| (unaudited) | ||||||||
| (in thousands) | ||||||||
| Cash and cash equivalents | $ | 42,745 | $ | 143,660 | ||||
New revolving credit facility(1) | — | — | ||||||
New term loan facility(2) | — | 125,000 | ||||||
| Partners’ capital: | ||||||||
| Equity held by public: | ||||||||
| Common units: none issued and outstanding actual; 19,200,000 issued and outstanding pro forma | — | 228,128 | ||||||
| Equity held by CVR Energy and its affiliates: | ||||||||
| Special general partner’s interest: 30,303,000 units issued and outstanding actual; none issued and outstanding pro forma | 397,951 | — | ||||||
| Special limited partner’s interest: 30,333 units issued and outstanding actual; none issued and outstanding pro forma | 398 | — | ||||||
Common units: none issued and outstanding actual; 53,800,000 issued and outstanding pro forma(2) | — | 149,998 | ||||||
| General partner’s interest | 3,854 | — | ||||||
| Total partners’ capital | 402,203 | 378,126 | ||||||
| Total capitalization | $ | 402,203 | $ | 503,126 | ||||
| (1) | We expect to have approximately $25.0 million of available capacity under our new revolving credit facility at the closing of this offering. |
| (2) | We expect to draw $125.0 million under a new term loan facility at the closing of this offering. We will use $92.1 million of the proceeds therefrom to pay a special distribution to Coffeyville Resources in order to, among other things, fund the offer to purchase Coffeyville Resources’ senior secured notes required upon consummation of this offering. The pro forma capitalization with respect to the common units held by CVR Energy and its affiliates has been adjusted for the term loan facility distribution as well as the other distributions to Coffeyville Resources which are part of the Transactions. |
51
Table of Contents
| Assumed initial public offering price per common unit | $ | 13.00 | ||||||
Pro forma net tangible book value per unit before this offering(1) | $ | 2.03 | ||||||
| Increase in net tangible book value per unit attributable to purchasers in this offering and use of proceeds | $ | 2.59 | ||||||
Less: Pro forma net tangible book value per unit after this offering(2) | $ | 4.62 | ||||||
| Immediate dilution in net tangible book value per common unit to purchasers in this offering | $ | 8.38 | ||||||
| (1) | Determined by dividing the net tangible book value of our assets less total liabilities by the number of units outstanding prior to this offering. | |
| (2) | Determined by dividing our pro forma net tangible book value, after giving effect to the application of the net proceeds of this offering, by the total number of units to be outstanding after this offering. |
| Units Acquired | Total Consideration | |||||||||||||||
| Number | Percent | Amount | Percent | |||||||||||||
| Coffeyville Resources | 53,800,000 | 73.7 | % | $ | 149,998,000(1 | ) | 39.7 | % | ||||||||
| New investors | 19,200,000 | 26.3 | % | $ | 228,128,000(2 | ) | 60.3 | % | ||||||||
| Total | 73,000,000 | 100.0 | % | $ | 378,126,000 | 100.0 | % | |||||||||
| (1) | Reflects the value of the assets contributed in 2007 as recorded at historical cost in accordance with GAAP, as adjusted for distributions and other capital account adjustments. |
| (2) | Reflects the net proceeds of this offering after deducting the underwriting discounts and estimated offering expenses payable by us. |
52
Table of Contents
53
Table of Contents
| • | Our unitholders have no contractual or other legal right to receive cash distributions from us on a quarterly or other basis. The board of directors of our general partner will adopt a policy pursuant to which we will distribute to our unitholders each quarter all of the available cash we generate each quarter, as determined quarterly by the board of directors, but it may change this policy at any time. | |
| • | Our business performance is expected to be more seasonal and volatile, and our cash flows are expected to be less stable, than the business performance and cash flows of most publicly traded partnerships. As a result, our quarterly cash distributions will be volatile and are expected to vary quarterly and annually. Unlike most |
54
Table of Contents
| publicly traded partnerships, we will not have a minimum quarterly distribution or employ structures intended to consistently maintain or increase quarterly distributions over time. Furthermore, none of our limited partnership interests, including those held by Coffeyville Resources, will be subordinate in right of distribution payment to the common units sold in this offering. |
| • | The amount of distributions we pay under our cash distribution policy and the decision to make any distribution is determined by the board of directors of our general partner. Our partnership agreement will not provide for any minimum quarterly distributions. | |
| • | UnderSection 17-607 of the Delaware Act, we may not make a distribution to our limited partners if the distribution would cause our liabilities to exceed the fair value of our assets. | |
| • | We expect that our distribution policy will be subject to restrictions on distributions under our new credit facility. The new credit facility will provide that we can make distributions to holders of our common units, but only if we are in compliance with our leverage ratio and interest coverage ratio covenants on a pro forma basis after giving effect to any distribution and there is no default or event of default under the facility. See “Management’s Discussion and Analysis of Financial Condition and Results of Operations — Liquidity and Capital Resources — New Credit Facility.” Should we be unable to satisfy these restrictions under our new credit facility, we would be prohibited from making cash distributions to you. | |
| • | We may lack sufficient cash to make distributions to our unitholders due to a number of factors that would adversely affect us, including but not limited to decreases in net sales or increases in operating expenses, principal and interest payments on debt, working capital requirements, capital expenditures or anticipated cash needs. See “Risk Factors” for information regarding these factors. |
| • | “CVR Partners, LP Unaudited Pro Forma Available Cash for the Year Ended December 31, 2010,” in which we present our estimate of the amount of pro forma available cash we would have had for the year ended December 31, 2010, based on our unaudited pro forma condensed consolidated financial statements included elsewhere in this prospectus. See “Unaudited Pro Forma Condensed Consolidated Financial Statements” on page P-1; and | |
| • | “CVR Partners, LP Estimated Available Cash for the Twelve Months Ending March 31, 2012,” in which we present our unaudited forecast of available cash for the twelve months ending March 31, 2012. |
55
Table of Contents
56
Table of Contents
Unaudited Pro Forma Available Cash for the
Year Ended December 31, 2010
| Pro Forma | ||||
| Year Ended | ||||
| December 31, 2010 | ||||
| (unaudited) | ||||
| (in millions, except | ||||
| per unit data) | ||||
Net income(a) | $ | 15.1 | ||
| Add: | ||||
Interest expense and other financing costs(b) | 5.1 | |||
| Income tax expense | — | |||
| Depreciation and amortization | 18.5 | |||
EBITDA(c) | 38.7 | |||
| Subtract: | ||||
Debt service costs(d) | 4.4 | |||
Estimated incremental general and administrative expenses(e) | 3.5 | |||
Maintenance capital expenditures(f) | 8.9 | |||
| Add: | ||||
Share-based compensation expense(g) | 9.0 | |||
| Available Cash | $ | 30.9 | ||
| Distribution on a per unit basis | $ | 0.42 | ||
New Credit Facility(h) | ||||
Interest coverage ratio(h) | 9.3x | |||
Leverage ratio(h) | 2.0x | |||
| (a) | Pro forma net income assumes that the due from affiliate balance was distributed to Coffeyville Resources as of January 1, 2010 and the interest income associated with that balance was eliminated. | |
| (b) | Interest expense and other financing costs represents the interest expense and fees, net of interest income, related to our borrowings, assuming that our new credit facility had been put in place on January 1, 2010, and also reflects the amortization of deferred financing fees related to our new credit facility. We assume that we will make term loan borrowings of $125.0 million under our new credit facility at the closing of this offering at an assumed interest rate of 4.0%. | |
| (c) | EBITDA is defined as net income plus interest expense and other financing costs, income tax expense and depreciation and amortization, net of interest income. We calculate available cash as used in this table as EBITDA less interest expense and other financing costs paid, debt amortization payments, estimated incremental general and administrative expenses associated with being a public company and maintenance capital expenditures, plus non-cash share-based compensation expense. | |
| We present EBITDA because it is a material component in our calculation of available cash. In addition, EBITDA is a material term utilized in our new credit facility in order to determine our leverage ratio (ratio of debt to EBITDA) and our interest coverage ratio (ratio of EBITDA to interest expense). EBITDA and available cash are also used as supplemental financial measures by management and by external users of our financial statements, such as investors and commercial banks, to assess: | ||
| • the financial performance of our assets without regard to financing methods, capital structure or historical cost basis; and | ||
| • our operating performance and return on invested capital compared to those of other publicly traded limited partnerships, without regard to financing methods and capital structure. |
57
Table of Contents
| EBITDA and available cash should not be considered alternatives to net income, operating income, net cash provided by operating activities or any other measure of financial performance or liquidity presented in accordance with GAAP. EBITDA and available cash may have material limitations as performance measures because they exclude items that are necessary elements of our costs and operations. In addition, EBITDA and available cash presented by other companies may not be comparable to our presentation, since each company may define these terms differently. | ||
| (d) | Debt service is defined as net interest expense and other financing costs paid. | |
| (e) | Reflects an adjustment for estimated incremental general and administrative expenses we expect that we will incur as a publicly traded limited partnership, such as costs associated with SEC reporting requirements, including annual and quarterly reports to unitholders, tax return andSchedule K-1 preparation and distribution, independent auditor fees, investor relations activities, and registrar and transfer agent fees. | |
| (f) | Reflects actual maintenance capital expenditures during the period. | |
| (g) | Reflects an adjustment for share-based expense which is not subject to reimbursement by us. We are allocated non-cash share-based compensation expense from CVR Energy for purposes of financial statement reporting. CVR Energy accounts for share-based compensation in accordance with ASC 718, Compensation — Stock Compensation as well as guidance regarding the accounting for share-based compensation granted to employees of an equity-method investee. In accordance with SAB Topic 1-B, CVR Energy allocates costs between itself and us based upon the percentage of time a CVR Energy employee provides services to us. In accordance with the services agreement, we will not be responsible for the payment of cash related to any share-based compensation which CVR Energy allocates to us. | |
| (h) | Our new credit facility will require us to maintain a minimum interest coverage ratio (ratio of Consolidated Adjusted EBITDA (as defined under our new credit facility) to interest) of 3.0 to 1.0 and (ii) a maximum leverage ratio (ratio of debt to Consolidated Adjusted EBITDA) of (a) as of any fiscal quarter ending after the closing date and prior to December 31, 2011, 3.50 to 1.0, and (b) as of any fiscal quarter ending on or after December 31, 2011, 3.0 to 1.0, calculated in each case on a trailing four quarter basis. |
58
Table of Contents
Estimated Available Cash for the
Twelve Months Ending March 31, 2012
| Twelve Months Ending | ||||
| March 31, 2012 | ||||
Net Sales | $ | 297.4 | ||
| Cost of product sold (exclusive of depreciation and amortization) - Affiliates | 15.9 | |||
| Cost of product sold (exclusive of depreciation and amortization) - Third Parties | 32.4 | |||
| Direct operating expenses (exclusive of depreciation and amortization) - Affiliates | 16.1 | |||
| Direct operating expenses (exclusive of depreciation and amortization) - Third Parties | 68.4 | |||
| Selling, general and administrative expenses (exclusive of depreciation and amortization) - Affiliates | 8.5 | |||
| Selling, general and administrative expenses (exclusive of depreciation and amortization) - Third Parties | 5.7 | |||
| Interest expense and other financing costs | 5.7 | |||
| Interest income | (0.7 | ) | ||
| Income tax expense | — | |||
| Depreciation and amortization | 19.7 | |||
Net Income | $ | 125.7 | ||
| Adjustments to reconcile net income to EBITDA: | ||||
| Add: | ||||
| Interest expense and other financing costs | 5.7 | |||
| Income tax expense | — | |||
| Depreciation and amortization | 19.7 | |||
| Subtract: | ||||
| Interest income | 0.7 | |||
59
Table of Contents
| Twelve Months Ending | ||||
| March 31, 2012 | ||||
EBITDA | $ | 150.4 | ||
| Adjustments to reconcile EBITDA to available cash | ||||
| Subtract: | ||||
| Debt service costs | 4.4 | |||
| Maintenance capital expenditures (includes environmental, health and safety expenditures) | 5.9 | |||
Available cash | $ | 140.1 | ||
| New Credit Facility | ||||
| Interest coverage ratio | 26.5x | |||
| Leverage ratio | 0.7x | |||
60
Table of Contents
61
Table of Contents
62
Table of Contents
| • | no material nonperformance or credit-related defaults by suppliers, customers or vendors; | |
| • | no new regulation or interpretation of existing regulations that, in either case, would be materially adverse to our business; | |
| • | no material accidents, weather-related incidents, floods, unscheduled turnarounds or other downtime or similar unanticipated events; | |
| • | no material adverse change in the markets in which we operate resulting from substantially lower natural gas prices, reduced demand for nitrogen fertilizer products or significant changes in the market prices and supply levels of pet coke; | |
| • | no material decreases in the prices we receive for our nitrogen fertilizer products; | |
| • | no material changes to market or overall economic conditions; and | |
| • | an annual inflation rate of 2.0% to 3.0%. |
63
Table of Contents
64
Table of Contents
65
Table of Contents
| Year Ended December 31, | ||||||||||||||||||||
| 2010 | 2009 | 2008 | 2007 | 2006 | ||||||||||||||||
| (dollars in millions, except per unit data and as otherwise indicated) | ||||||||||||||||||||
Statement of Operations Data: | ||||||||||||||||||||
| Net sales | $ | 180.5 | $ | 208.4 | $ | 263.0 | $ | 187.4 | $ | 170.0 | ||||||||||
Cost of product sold — Affiliates(1) | 5.8 | 9.5 | 11.1 | 4.5 | 5.2 | |||||||||||||||
Cost of product sold — Third Parties(1) | 28.5 | 32.7 | 21.5 | 28.6 | 28.2 | |||||||||||||||
| 34.3 | 42.2 | 32.6 | 33.1 | 33.4 | ||||||||||||||||
Direct operating expenses — Affiliates(1)(2) | 2.3 | 2.1 | 0.4 | 2.2 | 1.9 | |||||||||||||||
Direct operating expenses — Third Parties(1) | 84.4 | 82.4 | 85.7 | 64.5 | 61.7 | |||||||||||||||
| 86.7 | 84.5 | 86.1 | 66.7 | 63.6 | ||||||||||||||||
Selling, general and administrative expenses — Affiliates(1)(2) | 16.7 | 12.3 | 1.1 | 18.1 | 9.9 | |||||||||||||||
Selling, general and administrative expenses — Third Parties(1) | 3.9 | 1.8 | 8.4 | 2.3 | 3.0 | |||||||||||||||
| 20.6 | 14.1 | 9.5 | 20.4 | 12.9 | ||||||||||||||||
Net costs associated with flood(3) | — | — | — | 2.4 | — | |||||||||||||||
Depreciation and amortization(4) | 18.5 | 18.7 | 18.0 | 16.8 | 17.1 | |||||||||||||||
| Operating income | $ | 20.4 | $ | 48.9 | $ | 116.8 | $ | 48.0 | $ | 43.0 | ||||||||||
Other income (expense), net(5) | 12.9 | 9.0 | 2.1 | 0.2 | (6.9 | ) | ||||||||||||||
| Interest expense | — | — | — | (23.6 | ) | (23.5 | ) | |||||||||||||
| Gain (loss) on derivatives, net | — | — | — | (0.5 | ) | 2.1 | ||||||||||||||
| Income (loss) before income taxes | $ | 33.3 | $ | 57.9 | $ | 118.9 | $ | 24.1 | $ | 14.7 | ||||||||||
| Income tax (expense) benefit | — | — | — | — | — | |||||||||||||||
| Net income (loss) | $ | 33.3 | $ | 57.9 | $ | 118.9 | $ | 24.1 | $ | 14.7 | ||||||||||
Pro forma net income per common unit, basic and diluted(6): | $ | 0.46 | $ | 0.79 | $ | 1.63 | $ | 0.33 | $ | 0.20 | ||||||||||
| Pro forma number of common units, basic and diluted in millions: | 73.0 | 73.0 | 73.0 | 73.0 | 73.0 | |||||||||||||||
Balance Sheet Data: | ||||||||||||||||||||
| Cash and cash equivalents | $ | 42.7 | $ | 5.4 | $ | 9.1 | $ | 14.5 | $ | — | ||||||||||
| Working capital | 27.1 | 135.5 | 60.4 | 7.5 | (0.5 | ) | ||||||||||||||
| Total assets | 452.2 | 551.5 | 499.9 | 429.9 | 416.1 | |||||||||||||||
| Total debt, including current portion | — | — | — | — | — | |||||||||||||||
| Partners capital/divisional equity | 402.2 | 519.9 | 458.8 | 400.5 | 397.6 | |||||||||||||||
Financial and Other Data: | ||||||||||||||||||||
| Cash flows provided by operating activities | 75.9 | 85.5 | 123.5 | 46.5 | 34.1 | |||||||||||||||
| Cash flows (used in) investing activities | (9.0 | ) | (13.4 | ) | (23.5 | ) | (6.5 | ) | (13.3 | ) | ||||||||||
| Cash flows (used in) financing activities | (29.6 | ) | (75.8 | ) | (105.3 | ) | (25.5 | ) | (20.8 | ) | ||||||||||
| Capital expenditures for property, plant and equipment | 10.1 | 13.4 | 23.5 | 6.5 | 13.3 | |||||||||||||||
| Net distribution to parent | $ | 160.0 | $ | — | $ | 50.0 | $ | 31.5 | $ | 20.8 | ||||||||||
Key Operating Data: | ||||||||||||||||||||
| Production volume (thousand tons): | ||||||||||||||||||||
| Ammonia (gross produced) | 392.7 | 435.2 | 359.1 | 326.7 | 369.3 | |||||||||||||||
| Ammonia (net available for sale) | 155.6 | 156.6 | 112.5 | 91.8 | 111.8 | |||||||||||||||
| UAN (tons in thousands) | 578.3 | 677.7 | 599.2 | 576.9 | 633.1 | |||||||||||||||
On-stream factors(7): | ||||||||||||||||||||
| Gasifier | 89.0 | % | 97.4 | % | 87.8 | % | 90.0 | % | 92.5 | % | ||||||||||
| Ammonia | 87.7 | % | 96.5 | % | 86.2 | % | 87.7 | % | 89.3 | % | ||||||||||
| UAN | 80.8 | % | 94.1 | % | 83.4 | % | 78.7 | % | 88.9 | % | ||||||||||
66
Table of Contents
| (1) | Amounts are shown exclusive of depreciation and amortization. |
| (2) | Our direct operating expenses (exclusive of depreciation and amortization) and selling, general and administrative expenses (exclusive of depreciation and amortization) for the years ended December 31, 2010, 2009, 2008, 2007 and 2006 include a charge related to CVR Energy’s share-based compensation expense allocated to us by CVR Energy for financial reporting purposes in accordance with ASC 718. These charges will continue to be attributed to us following the closing of this offering. We are not responsible for the payment of cash related to any share-based compensation allocated to us by CVR Energy. See “Management’s Discussion and Analysis of Financial Condition and Results of Operations — Critical Accounting Policies — Share-Based Compensation.” The amounts were: |
| Year Ended December 31, | ||||||||||||||||||||
| 2010 | 2009 | 2008 | 2007 | 2006 | ||||||||||||||||
| (in millions) | ||||||||||||||||||||
| Direct operating expenses (exclusive of depreciation and amortization) | $ | 0.7 | $ | 0.2 | $ | (1.6 | ) | $ | 1.2 | $ | 0.8 | |||||||||
| Selling, general and administrative expenses (exclusive of depreciation and amortization) | 8.3 | 3.0 | (9.0 | ) | 9.7 | 3.2 | ||||||||||||||
| Total | $ | 9.0 | $ | 3.2 | $ | (10.6 | ) | $ | 10.9 | $ | 4.0 | |||||||||
| (3) | Total gross costs recorded as a result of the flood damage to our nitrogen fertilizer plant for the year ended December 31, 2007 were approximately $5.8 million, including approximately $0.8 million recorded for depreciation for temporarily idle facilities, $0.7 million for internal salaries and $4.3 million for other repairs and related costs. An insurance receivable of approximately $3.3 million was also recorded for the year December 31, 2007 for the probable recovery of such costs under CVR Energy’s insurance policies. | |
| (4) | Depreciation and amortization is comprised of the following components as excluded from direct operating expenses and selling, general and administrative expenses and as included in net costs associated with flood: |
| Year Ended December 31, | ||||||||||||||||||||
| 2010 | 2009 | 2008 | 2007 | 2006 | ||||||||||||||||
| (in millions) | ||||||||||||||||||||
| Depreciation and amortization excluded from direct operating expenses | $ | 18.5 | $ | 18.7 | $ | 18.0 | $ | 16.8 | $ | 17.1 | ||||||||||
| Depreciation and amortization excluded from selling, general and administrative expenses | — | — | — | — | — | |||||||||||||||
| Depreciation included in net costs associated with flood | — | — | — | 0.8 | — | |||||||||||||||
| Total depreciation and amortization | $ | 18.5 | $ | 18.7 | $ | 18.0 | $ | 17.6 | $ | 17.1 | ||||||||||
| (5) | Miscellaneous income (expense) is comprised of the following components included in our consolidated statement of operations: |
| Year Ended December 31, | ||||||||||||||||||||
| 2010 | 2009 | 2008 | 2007 | 2006 | ||||||||||||||||
| (in millions) | ||||||||||||||||||||
Interest income(a) | $ | 13.1 | $ | 9.0 | $ | 2.0 | $ | 0.3 | $ | 1.4 | ||||||||||
| Loss on extinguishment of debt | — | — | — | (0.2 | ) | (8.5 | ) | |||||||||||||
| Other income (expense) | (0.2 | ) | — | 0.1 | 0.1 | 0.2 | ||||||||||||||
| Miscellaneous income (expense) | $ | 12.9 | $ | 9.0 | $ | 2.1 | $ | 0.2 | $ | (6.9 | ) | |||||||||
| (a) | Interest income for the years ended December 31, 2010, 2009 and 2008 is primarily attributable to a due from affiliate balance owed to us by Coffeyville Resources as a result of affiliate loans. The due from affiliate balance was distributed to Coffeyville Resources in December 2010. Accordingly, such amounts are no longer owed to us. |
| (6) | We have omitted earnings per share through the date CRNF, our operating subsidiary, was contributed to us because during those periods we operated under a divisional equity structure. We have omitted net income per unitholder during the period we operated as a partnership through the closing of this offering because during those periods we operated under a different capital structure than what we will operate under following the closing of this offering, and, therefore, the information is not meaningful. | |
| (7) | On-stream factor is the total number of hours operated divided by the total number of hours in the reporting period. Excluding the impact of the Linde air separation unit outage, the rupture of the high-pressure UAN vessel and the major scheduled turnaround, the on-stream factors for the year ended December 31, 2010 would have been 97.6% for gasifier, 96.8% for ammonia and 96.1% for UAN. Excluding the Linde air separation unit outage in 2009, the on-stream factors would have been 99.3% for gasifier, 98.4% for ammonia and 96.1% for UAN for the year ended December 31, 2009. Excluding the turnaround performed in 2008 the on-stream factors would have been 91.7% for gasifier, 90.2% for ammonia and 87.4% for UAN for the year ended December 31, 2008. Excluding the impact of the flood in 2007 the on-stream factors would have been 94.6% for gasifier, 92.4% for ammonia and 83.9% for UAN for the year ended December 31, 2007. |
67
Table of Contents
FINANCIAL CONDITION AND RESULTS OF OPERATIONS
68
Table of Contents
69
Table of Contents
70
Table of Contents
71
Table of Contents
72
Table of Contents
| Year Ended December 31, | ||||||||||||
Business Financial Results | 2010 | 2009 | 2008 | |||||||||
| (in millions) | ||||||||||||
| Net sales | $ | 180.5 | $ | 208.4 | $ | 263.0 | ||||||
| Cost of product sold (exclusive of depreciation and amortization) — Affiliates | 5.8 | 9.5 | 11.1 | |||||||||
| Cost of products sold (exclusive of depreciation and amortization) — Third Parties | 28.5 | 32.7 | 21.5 | |||||||||
| 34.3 | 42.2 | 32.6 | ||||||||||
Direct operating expenses (exclusive of depreciation and amortization) — Affiliates(1) | 2.3 | 2.1 | 0.4 | |||||||||
Direct operating expenses (exclusive of depreciation and amortization) — Third Parties(1) | 84.4 | 82.4 | 85.7 | |||||||||
| 86.7 | 84.5 | 86.1 | ||||||||||
Selling, general and administrative expenses (exclusive of depreciation and amortization) — Affiliates(1) | 16.7 | 12.3 | 1.1 | |||||||||
Selling, general and administrative expenses (exclusive of depreciation and amortization) — Third Parties(1) | 3.9 | 1.8 | 8.4 | |||||||||
| 20.6 | 14.1 | 9.5 | ||||||||||
Depreciation and amortization(2) | 18.5 | 18.7 | 18.0 | |||||||||
| Operating income | 20.4 | 48.9 | 116.8 | |||||||||
| Net income | 33.3 | 57.9 | 118.9 | |||||||||
| (1) | Our direct operating expenses (exclusive of depreciation and amortization) and selling, general and administrative expenses (exclusive of depreciation and amortization) for the years ended December 31, 2010, 2009 and 2008 include a charge related to CVR Energy’s share-based compensation expense allocated to us by CVR Energy for financial reporting purposes in accordance with ASC 718. We are not responsible for the payment of cash related to any share-based compensation allocated to us by CVR Energy. See “Management’s Discussion and Analysis of Financial Condition and Results of Operations — Critical Accounting Policies — Share-Based Compensation.” The charges were: |
| Year Ended December 31, | ||||||||||||
| 2010 | 2009 | 2008 | ||||||||||
| (in millions) | ||||||||||||
| Direct operating expenses (exclusive of depreciation and amortization) | $ | 0.7 | 0.2 | $ | (1.6 | ) | ||||||
| Selling, general and administrative expenses (exclusive of depreciation and amortization) | 8.3 | 3.0 | (9.0 | ) | ||||||||
| Total | $ | 9.0 | $ | 3.2 | $ | (10.6 | ) | |||||
| (2) | Depreciation and amortization is comprised of the following components as excluded from direct operating expense and selling, general and administrative expense and as included in net costs associated with flood: |
| Year Ended December 31, | ||||||||||||
| 2010 | 2009 | 2008 | ||||||||||
| (in millions) | ||||||||||||
| Depreciation and amortization excluded from direct operating expenses | $ | 18.5 | $ | 18.7 | $ | 18.0 | ||||||
| Depreciation and amortization excluded from selling, general and administrative expenses | — | — | — | |||||||||
| Total depreciation and amortization | $ | 18.5 | $ | 18.7 | $ | 18.0 | ||||||
73
Table of Contents
| Annual Average For | ||||||||||||
| Year Ended | ||||||||||||
| December 31, | ||||||||||||
Market Indicators | 2010 | 2009 | 2008 | |||||||||
| Natural gas (dollars per MMbtu) | $ | 4.38 | $ | 4.16 | $ | 8.91 | ||||||
| Ammonia — Southern Plains (dollars per ton) | 437 | 306 | 707 | |||||||||
| UAN — corn belt (dollars per ton) | 266 | 218 | 422 | |||||||||
| Year Ended December 31, | ||||||||||||
Company Operating Statistics | 2010 | 2009 | 2008 | |||||||||
| (dollars in millions, except per unit data and as otherwise indicated) | ||||||||||||
| Production (thousand tons): | ||||||||||||
Ammonia (gross produced)(1) | 392.7 | 435.2 | 359.1 | |||||||||
Ammonia (net available for sale)(1) | 155.6 | 156.6 | 112.5 | |||||||||
| UAN | 578.3 | 677.7 | 599.2 | |||||||||
| Pet coke consumed (thousand tons) | 436.3 | 483.5 | 451.9 | |||||||||
Pet coke (cost per ton)(2) | $ | 17 | $ | 27 | $ | 31 | ||||||
| Sales (thousand tons): | ||||||||||||
| Ammonia | 164.7 | 159.9 | 99.4 | |||||||||
| UAN | 580.7 | 686.0 | 594.2 | |||||||||
| Total | 745.4 | 845.9 | 693.6 | |||||||||
Product price (plant gate) (dollars per ton)(3): | ||||||||||||
| Ammonia | $ | 361 | $ | 314 | $ | 557 | ||||||
| UAN | $ | 179 | $ | 198 | $ | 303 | ||||||
On-stream factor(4): | ||||||||||||
| Gasifier | 89.0 | % | 97.4 | % | 87.8 | % | ||||||
| Ammonia | 87.7 | % | 96.5 | % | 86.2 | % | ||||||
| UAN | 80.8 | % | 94.1 | % | 83.4 | % | ||||||
| Reconciliation to net sales (dollars in millions): | ||||||||||||
| Freight in revenue | $ | 17.0 | $ | 21.3 | $ | 18.9 | ||||||
| Hydrogen revenue | 0.1 | 0.8 | 9.0 | |||||||||
| Sales net plant gate | 163.4 | 186.3 | 235.1 | |||||||||
| Total net sales | $ | 180.5 | $ | 208.4 | $ | 263.0 | ||||||
| (1) | The gross tons produced for ammonia represent the total ammonia produced, including ammonia produced that was upgraded into UAN. The net tons available for sale represent the ammonia available for sale that was not upgraded into UAN. |
| (2) | Our pet coke cost per ton purchased from CVR Energy averaged $11, $22 and $30 for the years ended December 31, 2010, 2009 and 2008, respectively. Third-party pet coke prices averaged $40, $37 and $39 for the years ended December 31, 2010, 2009 and 2008, respectively. |
| (3) | Plant gate price per ton represents net sales less freight revenue and hydrogen revenue divided by product sales volume in tons in the reporting period. Plant gate price per ton is shown in order to provide a pricing measure that is comparable across the fertilizer industry. |
74
Table of Contents
| (4) | On-stream factor is the total number of hours operated divided by the total number of hours in the reporting period. Excluding the impact of the downtime associated with the Linde air separation unit outage, the rupture of the high pressure UAN vessel and the major scheduled turnaround, the on-stream factors for the year ended December 31, 2010 would have been 97.6% for gasifier, 96.8% for ammonia and 96.1% for UAN. Excluding the Linde air separation unit outage in 2009, the on-stream factors would have been 99.3% for gasifier, 98.4% for ammonia and 96.1% for UAN for the year ended December 31, 2009. Excluding the turnaround performed in 2008, the on-stream factors would have been 91.7% for gasifier, 90.2% for ammonia and 87.4% for UAN for the year ended December 31, 2008. |
| Year Ended December 31, 2010 | Year Ended December 31, 2009 | Total Variance | Price | Volume | ||||||||||||||||||||||||||||||||||||
| Volume (1) | $ per ton (2) | Sales $ (3) | Volume (1) | $ per ton (2) | Sales $ (3) | Volume (1) | Sales $ (3) | Variance | Variance | |||||||||||||||||||||||||||||||
| (in millions) | ||||||||||||||||||||||||||||||||||||||||
| Ammonia | 164,668 | $ | 382 | $ | 63.0 | 159,860 | $ | 342 | $ | 54.6 | 4,808 | $ | 8.4 | $ | 6.5 | $ | 1.9 | |||||||||||||||||||||||
| UAN | 580,684 | $ | 202 | $ | 117.4 | 686,009 | $ | 223 | $ | 153.0 | (105,325 | ) | $ | (35.6 | ) | $ | (14.2 | ) | $ | (21.4 | ) | |||||||||||||||||||
| (1) | Sales volume in tons. | |
| (2) | Includes freight charges. | |
| (3) | Sales dollars in millions. |
75
Table of Contents
76
Table of Contents
| Year Ended December 31, 2009 | Year Ended December 31, 2008 | Total Variance | Price | Volume | ||||||||||||||||||||||||||||||||||||
| Volume (1) | $ per ton (2) | Sales $ (3) | Volume (1) | $ per ton (2) | Sales $ (3) | Volume (1) | Sales $ (3) | Variance | Variance | |||||||||||||||||||||||||||||||
| (in millions) | ||||||||||||||||||||||||||||||||||||||||
| Ammonia | 159,860 | $ | 342 | $ | 54.6 | 99,374 | $ | 596 | $ | 59.2 | 60,486 | $ | (4.6 | ) | $ | (25.3 | ) | $ | 20.7 | |||||||||||||||||||||
| UAN | 686,009 | $ | 223 | $ | 153.0 | 594,203 | $ | 328 | $ | 194.8 | 91,806 | $ | (41.7 | ) | $ | (62.2 | ) | $ | 20.5 | |||||||||||||||||||||
| (1) | Sales volume in tons. | |
| (2) | Includes freight charges. | |
| (3) | Sales dollars in millions. |
77
Table of Contents
78
Table of Contents
79
Table of Contents
| • | Income Approach: To determine fair value, we discounted the expected future cash flows for the reporting unit utilizing observable market data to the extent available. The discount rate used for the 2010 and 2009 impairment test was 14.6% and 13.4%, respectively, representing the estimated weighted-average costs of capital, which reflects the overall level of inherent risk involved in the reporting unit and the rate of return an outside investor would expect to earn. | |
| • | Market-Based Approach: To determine the fair value of the reporting unit, we also utilized a market based approach. We used the guideline company method, which focuses on comparing our risk profile and growth prospects to select reasonably similar publicly traded companies. |
80
Table of Contents
81
Table of Contents
| • | incur, assume or permit to exist additional indebtedness, guarantees and other contingent obligations; | |
| • | incur liens; | |
| • | make negative pledges; | |
| • | pay dividends or make other distributions; | |
| • | make payments to our subsidiary; |
82
Table of Contents
| • | make certain loans and investments; | |
| • | consolidate, merge or sell all or substantially all of our assets; | |
| • | enter into sale-leaseback transactions; and | |
| • | enter into transactions with affiliates. |
| Actual | Estimated | |||||||||||||||||||
| 2010 | 2011 | 2012 | 2013 | 2014 | ||||||||||||||||
| ($ in millions) | ||||||||||||||||||||
| UAN expansion | 1.0 | 40.0 | 65.0 | — | — | |||||||||||||||
| Other | 0.2 | 2.4 | — | — | — | |||||||||||||||
| Growth capital expenditures | 1.2 | 42.4 | 65.0 | — | — | |||||||||||||||
| Maintenance capital expenditures | $ | 8.9 | $ | 6.5 | $ | 11.4 | $ | 7.4 | $ | 7.5 | ||||||||||
| Total estimated capital spending before turnaround expenses | 10.1 | 48.9 | 76.4 | 7.4 | 7.5 | |||||||||||||||
| Major scheduled turnaround expenses | 3.5 | — | 4.0 | — | 4.0 | |||||||||||||||
| Total estimated capital spending including major scheduled turnaround expense | $ | 13.6 | $ | 48.9 | $ | 80.4 | $ | 7.4 | $ | 11.5 | ||||||||||
83
Table of Contents
84
Table of Contents
85
Table of Contents
| Payments Due by Period | ||||||||||||||||||||||||||||
| Total | 2011 | 2012 | 2013 | 2014 | 2015 | Thereafter | ||||||||||||||||||||||
| (in millions) | ||||||||||||||||||||||||||||
Long-term debt(1) | $ | — | $ | — | $ | — | $ | — | $ | — | $ | — | $ | — | ||||||||||||||
Operating leases(2) | 16.8 | 4.4 | 4.5 | 3.7 | 2.0 | 1.2 | 1.0 | |||||||||||||||||||||
Unconditional purchase obligations(3) | 55.0 | 5.6 | 5.7 | 6.0 | 6.0 | 6.1 | 25.6 | |||||||||||||||||||||
Unconditional purchase obligations with affiliates(4) | 110.1 | 6.3 | 6.4 | 6.6 | 6.6 | 6.6 | 77.6 | |||||||||||||||||||||
Environmental liabilities(5) | 0.1 | 0.1 | — | — | — | — | — | |||||||||||||||||||||
| Total | $ | 182.0 | $ | 16.4 | $ | 16.6 | $ | 16.3 | $ | 14.6 | $ | 13.9 | $ | 104.2 | ||||||||||||||
| (1) | We will enter into a new credit facility in connection with the closing of this offering. The new credit facility will include a $125.0 million term loan, which will be fully drawn at closing, and a $25.0 million revolving credit facility, which will be undrawn at closing. On a pro forma basis giving effect to these borrowings, the principal payments due by period in respect thereof would be zero for 2011 through 2015 and $125.0 million thereafter, and the interest payments due by period in respect thereof based on a current expected interest rate of 4.0% would have been $3.9 million for 2011, $5.1 million for 2012, $5.1 million for 2013, $5.1 million for 2014, $5.1 million for 2015 and $1.2 million thereafter. These amounts have not been included in the table above as they were not contractual obligations as of December 31, 2010. | |
| (2) | We lease various facilities and equipment, primarily railcars, under non-cancelable operating leases for various periods. | |
| (3) | The amount includes commitments under an electric supply agreement with the city of Coffeyville and a product supply agreement with Linde. | |
| (4) | The amount includes commitments under our long-term pet coke supply agreement with CVR Energy having an initial term that ends in 2027, subject to renewal. | |
| (5) | Represents our estimated remaining costs of remediation to address environmental contamination resulting from a reported release of UAN in 2005 pursuant to the State of Kansas Voluntary Cleanup and Property Redevelopment Program. |
86
Table of Contents
87
Table of Contents
88
Table of Contents
(Millions of Metric Tons)
Source: International Fertilizer Industry Association; U.S. Bureau of the Census, International Data Base
Millions of Tonnes, Stock to Use Ratio
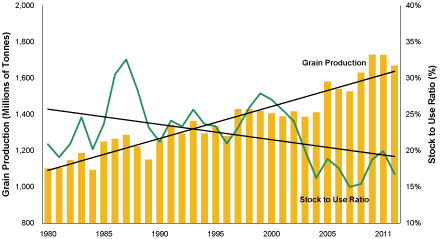
Source: USDA
89
Table of Contents
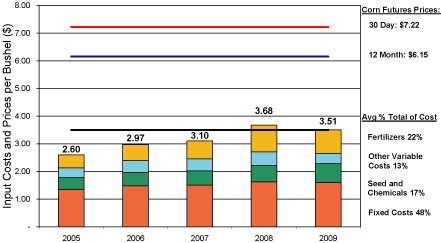
90
Table of Contents
Southern Plains Ammonia and Farm Belt Urea
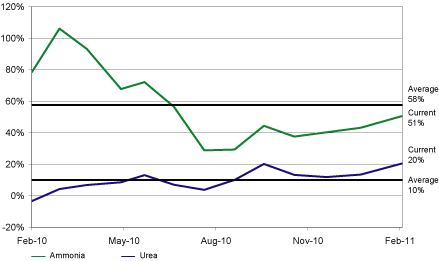
91
Table of Contents
United States and Western Europe
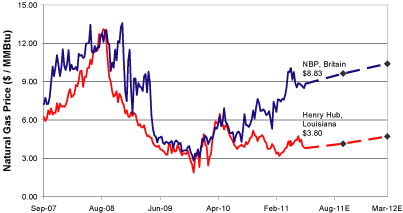
Historical Sources: NBP Weekly Spot Rate, Henry Hub Weekly Spot Rate
Forecast Sources: NBP Forward Rate 3/7/2011, Henry Hub Futures Nymex Exchange 3/7/2011
92
Table of Contents
($ per ton)
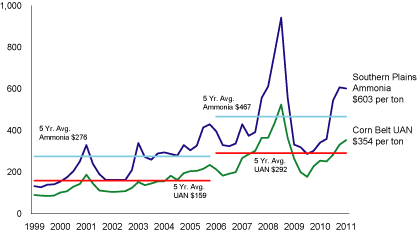
Prices ($ per ton)
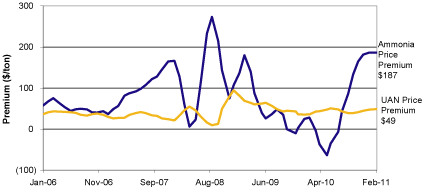
Source: Blue, Johnson & Associates, Inc. Report, 2010, Green Markets for U.S. Gulf prices after September 2010.
93
Table of Contents
94
Table of Contents
| Sensitivity Using | ||||||||||||||||||||||||||||
| Actual | Forecasted | |||||||||||||||||||||||||||
| 2010 Results(3) | 3/31/2012 Prices(1)(4) | |||||||||||||||||||||||||||
| UAN Price | $ | 150 | $ | 200 | $ | 250 | $ | 300 | $ | 350 | $ | 179 | $ | 278 | ||||||||||||||
| Ammonia Price | 300 | 400 | 500 | 600 | 700 | 361 | 547 | |||||||||||||||||||||
Net Sales(2) | 171 | 221 | 271 | 321 | 371 | 180 | 297 | |||||||||||||||||||||
EBITDA(2) | 24 | 74 | 124 | 174 | 224 | 39 | 150 | |||||||||||||||||||||
Available Cash(2) | 13 | 63 | 113 | 163 | 213 | 31 | 140 | |||||||||||||||||||||
| (1) | The price sensitivity analysis in this table is based on the assumptions described in our forecast of EBITDA for the twelve months ending March 31, 2012, including 157,400 ammonia tons sold, 686,200 UAN tons sold, cost of product sold of $48.3 million, direct operating expenses of $84.5 million and selling, general and administrative expenses of $14.2 million. This table is presented to show the sensitivity of our EBITDA forecast for the twelve months ending March 31, 2012 of $150.4 million to specified changes in ammonia and UAN prices. Spot ammonia and UAN prices were $602.50 and $354.08, respectively, per ton as of February 28, 2011. There can be no assurance that we will achieve our EBITDA forecast for the twelve months ending March 31, 2012 or any of the specified levels of EBITDA indicated above, or that UAN and ammonia pricing will achieve any of the levels specified above. See “Our Cash Distribution Policy and Restrictions on Distribution — Forecasted Available Cash” for a reconciliation of our EBITDA forecast to our net income forecast for the twelve months ending March 31, 2012 and a discussion of the assumptions underlying our forecast. | |
| (2) | Dollars in millions. |
| (3) | This column shows (1) actual average UAN and ammonia prices and our actual net sales and EBITDA for the year ended December 31, 2010 and (2) pro forma available cash for the year ended December 31, 2010. See “Our Cash Distribution Policy and Restrictions on Distributions — Pro Forma Available Cash.” |
| (4) | Reflects forecasted average UAN and ammonia pricing for the twelve months ending March 31, 2012 and the production and expense assumptions set forth in footnote 1 above. |
95
Table of Contents
| ($ per ton, unless otherwise noted) | |||||||||||||||||||||||||||||||||||
| CVR Partners’ Ammonia Cost Advantage | CVR Partners’ UAN Cost Advantage | ||||||||||||||||||||||||||||||||||
| Illustrative | Illustrative Competitor | CVR Partners | Illustrative Competitor | CVR Partners | |||||||||||||||||||||||||||||||
| Natural Gas | Total | Competitor | |||||||||||||||||||||||||||||||||
| Delivered | Competitor | Ammonia | Ammonia | Total | UAN | ||||||||||||||||||||||||||||||
| Price | Gas | Ammonia | Ammonia | Cost | cost per ton | Competitor | UAN | Cost | |||||||||||||||||||||||||||
| ($/MMbtu) | Cost(a) | Costs(b)(c)(e) | Costs(d)(e) | Advantage | UAN(f) | UAN Costs(c)(e)(g) | Costs(e)(f)(h) | Advantage | |||||||||||||||||||||||||||
| $ | 4.00 | $ | 132 | $ | 193 | $ | 194 | $ | (1) | $ | 65 | $ | 98 | $ | 87 | $ | 11 | ||||||||||||||||||
| 4.50 | 149 | 210 | 194 | 16 | 72 | 105 | 87 | 18 | |||||||||||||||||||||||||||
| 5.50 | 182 | 243 | 194 | 49 | 85 | 118 | 87 | 31 | |||||||||||||||||||||||||||
| 6.50 | 215 | 276 | 194 | 82 | 99 | 132 | 87 | 45 | |||||||||||||||||||||||||||
| 7.50 | 248 | 309 | 194 | 115 | 113 | 146 | 87 | 59 | |||||||||||||||||||||||||||
| (a) | Assumes 33 MMbtu of natural gas to produce a ton of ammonia, based on Blue Johnson. | |
| (b) | Assumes $27 per ton operating cost for ammonia, based on Blue Johnson. | |
| (c) | Assumes incremental $34 per ton transportation cost from the U.S. Gulf Coast to the mid-continent for ammonia and $15 per ton for UAN, based on recently published rail and pipeline tariffs. | |
| (d) | CVR Partners’ ammonia cost consists of $19 per ton of ammonia in pet coke costs and $175 per ton of ammonia in operating costs for the year ended December 31, 2009. | |
| (e) | The cost data included in this chart for an illustrative competitor assumes property taxes, whereas the cost data included for CVR Partners includes the cost of our property taxes other than property taxes currently in dispute. CVR Partners is currently disputing the amount of property taxes which it has been required to pay in recent years. For information on the effect of disputed property taxes on our actual production costs, see product production cost data and footnote 7 under “Prospectus Summary — Summary Historical and Pro Forma Consolidated Financial Information.” See also “Management’s Discussion and Analysis of Financial Condition and Results of Operations — Factors Affecting Comparability — Fertilizer Plant Property Taxes.” | |
| (f) | Each ton of UAN contains approximately 0.41 tons of ammonia. Illustrative competitor UAN cost per ton data removes $34 per ton in transportation costs for ammonia. | |
| (g) | Assumes $18 per ton cash conversion cost to UAN, based on Blue Johnson. | |
| (h) | CVR Partners’ UAN conversion cost was $12 per ton for the year ended December 31, 2010. $10.82 per ton of ammonia production costs are not transferable to UAN costs. |
| • | Cost Advantage. We operate the only nitrogen fertilizer production facility in North America that uses pet coke gasification to produce nitrogen fertilizer, which has historically given us a cost advantage over competitors that use natural gas-based production methods. Our costs are approximately 79% fixed and relatively stable, which allows us to benefit directly from increases in nitrogen fertilizer prices. Our fixed costs consist primarily of electrical energy, employee labor, maintenance, including contract labor, and outside services. Our variable costs consist primarily of pet coke. Our pet coke costs have historically remained relatively stable, averaging $25 per ton since we began operating under our current structure in October 2007, with a high of $31 per ton for 2008 and a low of $17 per ton for 2010. Third-party pet coke prices have averaged $41 per ton for third-party pet coke over the last five years, with a high of $49 per ton for 2007 and a low of $34 per ton for 2006. Substantially all of our nitrogen fertilizer competitors use natural gas as their primary raw material feedstock (with natural gas constituting approximately85-90% of their production costs based on historical data) and are therefore heavily impacted by changes in natural gas prices. |
| • | Premium Product Focus. We focus on producing higher margin, higher growth UAN nitrogen fertilizer. Historically, UAN has accounted for approximately 80% of our product tons sold. UAN commands a price premium over ammonia and urea on a nutrient ton basis. Unlike ammonia and urea, UAN is easier to apply and can be applied throughout the growing season to crops directly or mixed with crop protection products, |
96
Table of Contents
| which reduces energy and labor costs for farmers. In addition, UAN is safer to handle than ammonia. The convenience of UAN fertilizer has led to an 8.5% increase in its consumption from 2000 through 2010 (estimated) on a nitrogen content basis, whereas ammonia fertilizer consumption decreased by 2.4% for the same period, according to data supplied by Blue Johnson. We currently upgrade 60% of our ammonia production into UAN and plan to expand our upgrading capacity to have the flexibility to upgrade all of our ammonia production into UAN. |
| • | Strategically Located Asset. We and other competitors located in the U.S. farm belt share a transportation cost advantage when compared to ourout-of-region competitors in serving the U.S. farm belt agricultural market. In 2010, approximately 45% of the corn planted in the United States was grown within a $35/UAN ton freight train rate of our nitrogen fertilizer plant. We are therefore able to cost-effectively sell substantially all of our products in the higher margin agricultural market, whereas, according to publicly available information prepared by our competitors, a significant portion of our competitors’ revenues are derived from the lower margin industrial market. Because the U.S. farm belt consumes more nitrogen fertilizer than is produced in the region, it must import nitrogen fertilizer from the U.S. Gulf Coast as well as from international producers. Accordingly, U.S. farm belt producers may offer nitrogen fertilizers at prices that factor in the transportation costs ofout-of-region producers without having incurred such costs. We estimate that our plant enjoys a transportation cost advantage of approximately $25 per ton over competitors located in the U.S. Gulf Coast, based on a comparison of our actual transportation costs and recently published rail and pipeline tariffs. Our location on Union Pacific’s main line increases our transportation cost advantage by lowering the costs of bringing our products to customers. Our products leave the plant either in trucks for direct shipment to customers (in which case we incur no transportation cost) or in railcars for destinations located principally on the Union Pacific Railroad. We do not incur any intermediate transfer, storage barge freight or pipeline freight charges. |
97
Table of Contents
| • | Pay Out All of the Available Cash We Generate Each Quarter. Our strategy is to pay out all of the available cash we generate each quarter. We expect that holders of our common units will receive a greater percentage of our operating cash flow when compared to our publicly traded competitors across the broader fertilizer sector, such as Agrium, Potash Corporation, CF Industries, Yara and Terra Nitrogen. These companies have provided an average dividend yield of 0.1%, 0.3%, 0.4%, 1.6% and 6.9%, respectively, as of February 28, 2011, compared to our expected distribution yield of 14.8% (calculated by dividing our forecasted distribution for the twelve months ending March 31, 2012 of $1.92 per common unit by the mid-point of the price range on the cover page of this prospectus). The board of directors of our general partner will adopt a policy under which we will distribute all of the available cash we generate each quarter, as described in “Our Cash Distribution Policy and Restrictions On Distributions” on page 54. We do not intend to maintain excess distribution coverage for the purpose of maintaining stability or growth in our quarterly distributions or otherwise to reserve cash for future distributions, and we do not intend to incur debt to pay quarterly distributions. Unlike many publicly traded partnerships that have economic general partner interests and incentive distribution rights that entitle the general partner to receive disproportionate percentages of cash distributions as distributions increase (often up to 50%), our general partner will have a non-economic interest and no incentive distribution rights, and will therefore not be entitled to receive cash distributions. Our common unitholders will receive 100% of our cash distributions. |
| • | Pursue Growth Opportunities. We are well positioned to grow organically, through acquisitions, or both. |
| • | Expand UAN Capacity. We intend to move forward with an expansion of our nitrogen fertilizer plant that is designed to increase our UAN production capacity by 400,000 tons, or approximately 50%, per year. This approximately $135 million expansion, for which approximately $31 million had been spent as of December 31, 2010, will allow us the flexibility to upgrade all of our ammonia production when market conditions favor UAN. We expect that this additional UAN production capacity will improve our margins, as UAN has historically been a higher margin product than ammonia. We expect that the UAN expansion will take 18 to 24 months to complete and will be funded with approximately $91.4 million of the net proceeds from this offering. |
| • | Selectively Pursue Accretive Acquisitions. We intend to evaluate strategic acquisitions within the nitrogen fertilizer industry and to focus on disciplined and accretive investments that leverage our core strengths. We have no agreements, understandings or financings with respect to any acquisitions at the present time. |
| • | Continue to Focus on Safety and Training. We intend to continue our focus on safety and training in order to increase our facility’s reliability and maintain our facility’s high on-stream availability. We have developed a series of comprehensive safety programs, involving active participation of employees at all levels of the organization, that are aimed at preventing recordable incidents. In 2010, our nitrogen fertilizer plant had a recordable incident rate of 0.76, which was our lowest recordable incident rate in over five years. The recordable incident rate reflects the number of recordable incidents per 200,000 hours worked. |
| • | Continue to Enhance Efficiency and Reduce Operating Costs. We are currently engaged in certain projects that will reduce overall operating costs, increase efficiency, and utilize byproducts to generate incremental revenue. For example, we have built a low btu gas recovery pipeline between our nitrogen fertilizer plant and CVR Energy’s crude oil refinery, which will allow us to sell off-gas, a byproduct produced by our fertilizer plant, to the refinery. This pipeline was commissioned in March 2011. In addition, we have formulated a plan to address the CO2 released by our nitrogen fertilizer plant. To that end, we have signed an agreement to sell all of the high purity CO2 produced by our nitrogen fertilizer plant (currently approximately 850,000 tons per year) to an oil and gas exploration and production company for purposes of enhanced oil recovery. |
98
Table of Contents
| • | Provide High Level of Customer Service. We focus on providing our customers with the highest level of service. The nitrogen fertilizer plant has demonstrated consistent levels of production while operating at close to full capacity. Substantially all of our product shipments are targeted to freight advantaged destinations located in the U.S. farm belt, allowing us to quickly and reliably service customer demand. Furthermore, we maintain our own fleet of railcars capable of safely transporting UAN and ammonia, which helps us ensure prompt delivery. As a result of these efforts, many of our largest customers have been our customers since the plant came on line in 2000, and our customer retention rate year to year has been consistently high. We believe a continued focus on customer service will allow us to maintain relationships with existing customers and grow our business. |
99
Table of Contents
100
Table of Contents
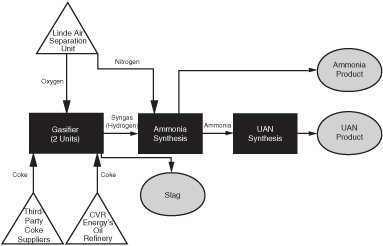
101
Table of Contents
102
Table of Contents
| • | restrictions on operations or the need to install enhanced or additional controls; | |
| • | the need to obtain and comply with permits and authorizations; | |
| • | liability for the investigation and remediation of contaminated soil and groundwater at current and former facilities (if any) and off-site waste disposal locations; and | |
| • | specifications for the products we market, primarily UAN and ammonia. |
103
Table of Contents
104
Table of Contents
105
Table of Contents
| • | services from CVR Energy’s employees in capacities equivalent to the capacities of corporate executive officers, including chief executive officer, chief operating officer, chief financial officer, general counsel, and vice president for environmental, health and safety, except that those who serve in such capacities under the agreement serve us on a shared, part-time basis only, unless we and CVR Energy agree otherwise; | |
| • | administrative and professional services, including legal, accounting services, human resources, insurance, tax, credit, finance, government affairs and regulatory affairs; | |
| • | management of our property and the property of our operating subsidiary in the ordinary course of business; | |
| • | recommendations on capital raising activities, including the issuance of debt or equity interests, the entry into credit facilities and other capital market transactions; | |
| • | managing or overseeing litigation and administrative or regulatory proceedings, establishing appropriate insurance policies, and providing safety and environmental advice; | |
| • | recommending the payment of distributions; and | |
| • | managing or providing advice for other projects as may be agreed by CVR Energy and our general partner from time to time. |
106
Table of Contents
107
Table of Contents
| • | the requirement that a majority of the board of directors of our general partner consist of independent directors; | |
| • | the requirement that the board of directors of our general partner have a nominating/corporate governance committee that is composed entirely of independent directors; and | |
| • | the requirement that the board of directors of our general partner have a compensation committee that is composed entirely of independent directors. |
108
Table of Contents
Name | Age | Position With Our General Partner | ||||
| John J. Lipinski | 60 | Chairman of the Board, Chief Executive Officer and President | ||||
| Stanley A. Riemann | 59 | Chief Operating Officer | ||||
| Edward A. Morgan | 41 | Chief Financial Officer and Treasurer | ||||
| Edmund S. Gross | 60 | Senior Vice President, General Counsel and Secretary | ||||
| Kevan A. Vick | 56 | Executive Vice President and Fertilizer General Manager | ||||
| Christopher G. Swanberg | 53 | Vice President, Environmental, Health and Safety | ||||
| Donna R. Ecton | 63 | Director | ||||
| Scott L. Lebovitz | 35 | Director | ||||
| George E. Matelich | 54 | Director | ||||
| Frank M. Muller, Jr. | 68 | Director | ||||
| Stanley de J. Osborne | 40 | Director | ||||
| John K. Rowan | 32 | Director | ||||
109
Table of Contents
110
Table of Contents
111
Table of Contents
| • | CVR Energy makes available to our general partner the services of the CVR Energy executive officers and employees who serve as our general partner’s executive officers; and | |
| • | We, our general partner and our operating subsidiary, as the case may be, are obligated to reimburse CVR Energy for any allocated portion of the costs that CVR Energy incurs in providing compensation and benefits to such CVR Energy employees, with the exception of costs attributable to share-based compensation. |
112
Table of Contents
| • | To align the executive officers’ interest with that of the stockholders and stakeholders, which provides long-term economic benefits to the stockholders; | |
| • | To provide competitive financial incentives in the form of salary, bonuses and benefits with the goal of retaining and attracting talented and highly motivated executive officers; and | |
| • | To maintain a compensation program whereby the executive officers, through exceptional performance and equity ownership, will have the opportunity to realize economic rewards commensurate with appropriate gains of other equity holders and stakeholders. |
113
Table of Contents
114
Table of Contents
| • | John J. Lipinski demonstrated leadership and the capacity to perform well in the challenging economic environment, leading the company to emerge with a projected profitable year based upon nine months results despite a first quarter that was challenging industry-wide. In addition, Mr. Lipinski contributed to an overall improved and strengthened balance sheet, improvement of the company’s capital structure and enhancement and increased capacity of the crude gathering business. Mr. Lipinski also provided direction and leadership to CVR Energy generally and to the core management team, which leadership generated operational achievements and record operating performance levels of the refinery during the first ten months of the year with decreased operating costs resulting from increased efficiencies. | |
| • | Edward A. Morgan demonstrated leadership in the finance and accounting organization and contributed to the company’s successful capital restructuring with the completion of credit facility amendments and the issuance of senior notes. Mr. Morgan also contributed to an improved and strengthened balance sheet, with a focus on financing alternatives and the development and enhancement of internal audit in-house resources. | |
| • | Kevan A. Vick demonstrated leadership within the fertilizer business that contributed to the overall strong performance of the facility, contributed to the completion of a successful major scheduled turnaround with no unexpected increased costs, and provided leadership and direction to the fertilizer team for an effective response to the rupture of a high-pressure UAN vessel resulting in a safe and prompt reopening of the facility. | |
| • | Stanley A. Riemann provided leadership and support to the fertilizer business during its response to the rupture of a high-pressure UAN vessel and provided direction. Mr. Riemann also provided leadership at the refinery that led to the refining assets being operated at a high degree of reliability, thereby generating record levels of operating performance. Mr. Riemann also contributed to reduction and efficiencies in the cost and capital spend program. Additionally, Mr. Riemann’s leadership and direction resulted in continued favorable safety records for both the refinery and the fertilizer facility. | |
| • | Edmund S. Gross effectively led CVR Energy’s legal department. In addition, he managed significant litigation matters for both CVR Energy as well as the refining and fertilizer businesses. Not only has Mr. Gross been involved in litigation matters, but he has also been directly involved in the successful negotiation of significant commercial contracts for both the refining and fertilizer businesses. |
115
Table of Contents
116
Table of Contents
| All Other | ||||||||||||||||||||
Name and Principal Position | Year | Salary ($) | Bonus ($)(1) | Compensation ($) | Total ($) | |||||||||||||||
John J. Lipinski, Chief Executive Officer(2) | 2009 | 170,400 | 426,000 | 2,614 | (3) | 599,014 | ||||||||||||||
| 2010 | 138,916 | 266,667 | 1,390 | 406,973 | ||||||||||||||||
Edward A. Morgan, Chief Financial Officer(2)(4) | 2009 | 42,837 | 64,238 | 34,335 | (5) | 141,410 | ||||||||||||||
| 2010 | 49,469 | 50,400 | 1,204 | 101,073 | ||||||||||||||||
Kevan A. Vick, Executive Vice President and Fertilizer General Manager(2) | 2009 | 245,000 | 196,000 | 13,929 | (6) | 454,929 | ||||||||||||||
| 2010 | 245,000 | 196,000 | 16,178 | 457,178 | ||||||||||||||||
Stanley A. Riemann, Chief Operating Officer(2) | 2009 | 140,270 | 280,540 | 4,148 | (3) | 424,958 | ||||||||||||||
| 2010 | 62,493 | 124,500 | 1,895 | 188,888 | ||||||||||||||||
Edmund S. Gross, Senior Vice President and General Counsel(2)(6) | 2009 | 94,500 | 94,500 | 3,682 | (3) | 192,682 | ||||||||||||||
| 2010 | 52,254 | 45,804 | 1,915 | 99,973 | ||||||||||||||||
| (1) | Bonuses are reported for the year in which they were earned, though they may have been paid the following year. | |
| (2) | The table does not include the fair value of stock awards granted to the named executive officers in 2009 and 2010 because such amounts were not reimbursed by us. | |
| (3) | For 2010, includes the portion of the following benefits for the relevant named executive officers that were reimbursed by us in accordance with the services agreement described herein: (a) company contributions to the named executive officers’ accounts under CVR Energy’s 401(k) plan and (b) premiums paid on behalf of the named executive officers with respect to CVR Energy’s basic life insurance program. Note that premiums paid on behalf of the named executive officers with respect to CVR Energy’s executive life insurance program are not included because such amounts are not reimbursed by us. | |
| (4) | In the case of Mr. Morgan, his compensation amounts for 2009 reflect amounts earned following the date he joined CVR Energy in May 2009. | |
| (5) | For 2010, includes the portion of the following benefits for Mr. Morgan that were reimbursed by us in accordance with the services agreement described herein: (a) company contribution to the named executive officers’ accounts under CVR Energy’s 401(k) plan and (b) premiums paid on behalf of the named executive officers with respect to CVR Energy’s basic life insurance program. Note that premiums paid on behalf of the named executive officers with respect to CVR Energy’s executive life insurance program are not included because such amounts are not reimbursed by us. | |
| (6) | For 2010, includes the portion of the following benefits for Mr. Vick that were reimbursed by us in accordance with the services agreement described herein: (a) car allowance, (b) company contribution to the named executive officers’ accounts under CVR Energy’s 401(k) plan and (c) premiums paid on behalf of the named executive officers with respect to CVR Energy’s basic life insurance program. Note that premiums paid on behalf of the named executive officers with respect to CVR Energy’s executive life insurance program are not included because such amounts are not reimbursed by us. |
117
Table of Contents
| Fees Earned or Paid in | ||||||||
Name | Cash | Total Compensation | ||||||
Donna R. Ecton(1) | $ | 90,000 | $ | 90,000 | ||||
| Frank M. Muller, Jr. | $ | 75,000 | $ | 75,000 | ||||
| (1) | In addition to the $75,000 annual fee earned by Ms. Ecton for her service on the board of directors of our general partner, she also received an additional $15,000 for her service as chair of the audit committee. |
118
Table of Contents
119
Table of Contents
120
Table of Contents
| Cash Severance | Benefit Continuation | |||||||||||||||||||||||||||||||||||||||
| Termination | Termination | |||||||||||||||||||||||||||||||||||||||
| without Cause | without Cause | |||||||||||||||||||||||||||||||||||||||
| or with Good | or with Good | |||||||||||||||||||||||||||||||||||||||
| Death | Disability | Retirement | Reason | Death | Disability | Retirement | Reason | |||||||||||||||||||||||||||||||||
| (1) | (2) | (1) | (2) | |||||||||||||||||||||||||||||||||||||
| John J. Lipinski | $ | 4,950,000 | $ | 4,950,000 | $ | 2,250,000 | $ | 4,950,000 | $ | 11,700,000 | $ | — | $ | — | $ | 26,788 | $ | 26,788 | $ | 26,788 | ||||||||||||||||||||
| Edward A. Morgan | — | — | 378,000 | 693,000 | 1,764,000 | — | — | 25,620 | 12,810 | 25,620 | ||||||||||||||||||||||||||||||
| Kevan A. Vick | — | — | 196,000 | 441,000 | 637,000 | — | — | 25,620 | 12,810 | 12,810 | ||||||||||||||||||||||||||||||
| Stanley A. Riemann | — | — | 830,000 | 1,452,500 | 3,942,500 | — | — | 17,859 | 13,394 | 22,324 | ||||||||||||||||||||||||||||||
| Edmund S. Gross | — | — | 347,000 | 694,000 | 1,735,000 | — | — | 25,620 | 12,810 | 25,620 | ||||||||||||||||||||||||||||||
| (1) | Severance payments and benefits in the event of termination without cause or resignation for good reason not in connection with a change in control. | |
| (2) | Severance payments and benefits in the event of termination without cause or resignation for good reason in connection with a change in control. |
121
Table of Contents
| Termination without | ||||||||||||||||||||
| Cause or | ||||||||||||||||||||
| Death | Disability | Retirement | with Good Reason | |||||||||||||||||
| (1) | (2) | |||||||||||||||||||
| John J. Lipinski | $ | 6,753,050 | $ | 6,753,050 | $ | 6,753,050 | — | $ | 6,753,050 | |||||||||||
| Edward A. Morgan | $ | 1,902,630 | $ | 1,902,630 | $ | 1,902,630 | — | $ | 1,649,640 | |||||||||||
| Kevan A. Vick | $ | 431,643 | $ | 431,643 | $ | 431,643 | — | $ | 431,643 | |||||||||||
| Stanley A. Riemann | $ | 2,093,155 | $ | 2,093,155 | $ | 2,093,155 | — | $ | 2,093,155 | |||||||||||
| Edmund S. Gross | $ | 1,745,806 | $ | 1,745,806 | $ | 1,745,806 | — | $ | 1,745,806 | |||||||||||
| (1) | Termination without cause or resignation for good reasonnot in connection with a change in control. | |
| (2) | Termination without cause or resignation for good reason in connection with a change in control. |
122
Table of Contents
123
Table of Contents
124
Table of Contents
| • | our general partner; | |
| • | each of our general partner’s directors; | |
| • | each of our general partner’s executive officers; | |
| • | each unitholder known by us to beneficially hold five percent or more of our outstanding units; and | |
| • | all of our general partner’s named executive officers and directors as a group. |
| Percentage of | ||||||||
| Total Common | ||||||||
| Units to be | ||||||||
| Common Units to be | Beneficially | |||||||
Name of Beneficial Owner | Beneficially Owned | Owned(1) | ||||||
CVR GP, LLC(2) | — | — | ||||||
Coffeyville Resources, LLC(3) | 53,800,000 | 73.7 | % | |||||
| John J. Lipinski | — | — | ||||||
| Stanley A. Riemann | — | — | ||||||
| Edward A. Morgan | — | — | ||||||
| Edmund S. Gross | — | — | ||||||
| Kevan A. Vick | — | — | ||||||
| Christopher G. Swanberg | — | — | ||||||
| Donna R. Ecton | — | — | ||||||
| Scott L. Lebovitz | — | — | ||||||
| George E. Matelich | — | — | ||||||
| Frank M. Muller, Jr. | — | — | ||||||
| Stanley de J. Osborne | — | — | ||||||
| John K. Rowan | — | — | ||||||
| All directors and executive officers of our general partner as a group (12 persons) | — | — | ||||||
| * | Less than 1% |
| (1) | Based on 73,000,000 common units outstanding following this offering. |
| (2) | CVR GP, LLC, a wholly-owned subsidiary of Coffeyville Resources, is our general partner and manages and operates our business and has a non-economic general partner interest. |
| (3) | Coffeyville Resources, LLC is an indirect wholly-owned subsidiary of CVR Energy, a publicly traded company. The directors of CVR Energy are John J. Lipinski, C. Scott Hobbs, Scott L. Lebovitz, George E. Matelich, Steve A. Nordaker, Stanley de J. Osborne, John K. Rowan, Joseph E. Sparano and Mark E. Tomkins. The units owned by Coffeyville Resources, LLC, as reflected in the table, are common units. The table assumes the underwriters do not exercise their option to purchase 2,880,000 additional common units and such units are therefore issued to Coffeyville Resources upon the option’s expiration. If such option is exercised in full, Coffeyville Resources will beneficially own 50,920,000 common units, or 69.8% of total common units outstanding. |
125
Table of Contents
| Shares Beneficially | ||||||||
| Owned As of | ||||||||
| March 1, 2011 | ||||||||
Name and Address | Number | Percent | ||||||
John J. Lipinski(a) | 622,336 | * | ||||||
Stanley A. Riemann(b) | 137,889 | * | ||||||
| Edward A. Morgan | 140,824 | * | ||||||
Edmund S. Gross(c) | 119,496 | * | ||||||
Kevan A. Vick(d) | 29,435 | * | ||||||
Christopher G. Swanberg(e) | 44,273 | * | ||||||
| Donna R. Ecton | 3,500 | * | ||||||
Scott L. Lebovitz(f) | 8,353 | * | ||||||
| Frank M. Muller, Jr. | 200 | * | ||||||
George E. Matelich(g) | 7,988,179 | 9.1 | % | |||||
Stanley de J. Osborne(g) | 7,988,179 | 9.1 | % | |||||
| John K. Rowan | — | — | ||||||
| All directors and executive officers, as a group (12 persons) | 9,094,485 | 10.4 | % | |||||
| * | Less than 1% | |
| (a) | Mr. Lipinski also indirectly owns 20,113 shares of common stock of CVR Energy through his interests in common units of Coffeyville Acquisition but does not have the power to vote or dispose of these additional shares. | |
| (b) | Mr. Riemann also indirectly owns 12,377 shares of common stock of CVR Energy through his interests in common units of Coffeyville Acquisition but does not have the power to vote or dispose of these shares. | |
| (c) | Mr. Gross also indirectly owns 928 shares of common stock of CVR Energy through his interests in common units of Coffeyville Acquisition but does not have the power to vote or dispose of these additional shares. | |
| (d) | Mr. Vick also indirectly owns 7,736 shares of common stock of CVR Energy through his interests in common units of Coffeyville Acquisition but does not have the power to vote or dispose of these additional shares. | |
| (e) | Mr. Swanberg also indirectly owns 773 shares of common stock of CVR Energy through his interests in common units of Coffeyville Acquisition but does not have the power to vote or dispose of these additional shares. | |
| (f) | Represents shares beneficially owned by Goldman, Sachs & Co. Mr. Lebovitz is a managing director of Goldman, Sachs & Co. Mr. Lebovitz disclaims beneficial ownership of these shares of common stock of CVR Energy except to the extent of his pecuniary interest, if any. | |
| (g) | Represents shares owned by Coffeyville Acquisition which is controlled by the Kelso Funds. Messrs. Matelich and Osborne are the sole directors of Coffeyville Acquisition. Kelso Investment Associates VII, L.P., or KIA VII, a Delaware limited partnership, and KEP VI, LLC, or KEP VI, a Delaware limited liability company, are members of Coffeyville Acquisition and own substantially all of the common units of Coffeyville Acquisition. KIA VII owns common units of Coffeyville Acquisition that correspond to 6,240,910 shares of common stock of CVR Energy, and KEP VI owns common units in Coffeyville Acquisition that correspond to 1,545,368 shares of common stock of CVR Energy. KIA VII and KEP VI, due to their common control, could be deemed to beneficially own each of the other’s shares of common stock of CVR Energy but each disclaims such beneficial ownership. Messrs. Berney, Bynum, Connors, Goldberg, Loverro, Matelich, Moore, Nickell, Osborne, Wahrhaftig and Wall (the “Kelso Individuals”) may be deemed to share beneficial ownership of shares of common stock of CVR Energy owned of record or beneficially owned by KIA VII, KEP VI and Coffeyville Acquisition by virtue of their status as managing members of KEP VI and of Kelso GP VII, LLC, a Delaware limited liability company, the principal business of which is serving as the general partner of Kelso GP VII, L.P., a Delaware limited partnership, the principal business of which is serving as the general partner of KIA VII. Each of the Kelso Individuals share investment and voting power with respect to the ownership interests owned by KIA VII, KEP VI and Coffeyville Acquisition but disclaim beneficial ownership of such interests. Mr. Collins may be deemed to share beneficial ownership of shares of common stock owned of record or beneficially owned by KEP VI and Coffeyville Acquisition by virtue of his status as a managing member of KEP VI. Mr. Collins shares investment and voting power with the Kelso Individuals with respect to ownership interests owned by KEP VI and Coffeyville Acquisition but disclaims beneficial ownership of such interests. Coffeyville Acquisition may elect to sell its shares of CVR Energy at any time. |
126
Table of Contents
| Formation Stage | ||
| The consideration received by CVR | • 30,333,333 special units. | |
| Energy and its affiliates for the contribution of assets and liabilities to | • The general partner interest and associated incentive distribution rights, or IDRs. | |
| us in October 2007 | • Our agreement, contingent on our completing an initial public or private offering, to reimburse Coffeyville Resources for certain capital expenditures made with respect to the nitrogen fertilizer business. | |
| Pre-IPO Operational Stage | ||
| Distributions of Operating Cash Flow | • In 2008, we paid a distribution of $50.0 million to Coffeyville Resources. | |
| Loans to Coffeyville Resources | • In 2009 and 2010, we maintained a lending relationship with Coffeyville Resources in order to supplement Coffeyville Resources’ working capital needs. We were paid interest on those borrowings, which we recorded as a due from affiliate balance, equal to the interest rate Coffeyville Resources paid on its revolving credit facility. The $160.0 million due from affiliate balance, which bore interest at a rate of 8.5% per annum for the year ended December 31, 2010, was distributed to Coffeyville Resources on December 31, 2010. | |
| Offering Stage | ||
| Distributions to Coffeyville Resources | • We will distribute to Coffeyville Resources all cash on our balance sheet before the closing date of this offering (other than cash in respect of prepaid sales). | |
| • We will use approximately $18.4 million of the proceeds of this offering to make a distribution to Coffeyville Resources in satisfaction of our obligation to reimburse it for certain capital expenditures made with respect to the nitrogen fertilizer business. |
| • We will also use approximately $89.3 million of the proceeds of this offering to make a special distribution to Coffeyville Resources in order to, among other things, fund the offer to purchase Coffeyville Resources’ senior secured notes required upon consummation of this offering; |
| • We will also draw our new $125.0 million term loan in full, and make a special distribution to Coffeyville Resources of $92.1 million of the proceeds therefrom in order to, among other things, fund the offer to purchase Coffeyville Resources’ senior secured notes required upon consummation of this offering. |
127
Table of Contents
| Purchase of CVR GP, LLC | • We will use approximately $26.0 million of the proceeds of this offering to purchase (and subsequently extinguish) the IDRs owned by our general partner. The proceeds of this sale will be paid as a distribution to the owners of Coffeyville Acquisition III, which include the Goldman Sachs Funds, the Kelso Funds and members of our senior management. | |
| Conversion of Special Units | • In connection with this offering, all of the special units owned by CVR Energy and its affiliates will be converted into common units. | |
| Post-IPO Operational Stage |
| Distributions to CVR Energy and its affiliates | • We will generally make cash distributions to the unitholders pro rata, including to Coffeyville Resources, as the holder of common units. Immediately following this offering, based on ownership of our common units at such time, CVR Energy and its subsidiaries will own approximately 73.7% of our common units and would receive a pro rata percentage of the available cash that we distribute in respect thereof. |
| Payments to our general partner and its affiliates | • We will reimburse our general partner and its affiliates for all expenses incurred on our behalf. In addition we will reimburse CVR Energy for certain operating expenses and for the provision of various general and administrative services for our benefit under the services agreement. | |
| Liquidation Stage | ||
| Liquidation | • Upon our liquidation, our unitholders will be entitled to receive liquidating distributions according to their respective capital account balances. |
128
Table of Contents
129
Table of Contents
130
Table of Contents
131
Table of Contents
132
Table of Contents
133
Table of Contents
134
Table of Contents
| • | any refinery restricted business acquired as part of a business or package of assets if a majority of the value of the total assets or business acquired is not attributable to a refinery restricted business, as determined in good faith by our general partner’s board of directors; however, if at any time we complete such an acquisition, we must, within 365 days of the closing of the transaction, offer to sell the refinery-related assets to CVR Energy for their fair market value plus any additional tax or other similar costs that would be required to transfer the refinery-related assets to CVR Energy separately from the acquired business or package of assets; | |
| • | engaging in any refinery restricted business subject to the offer to CVR Energy described in the immediately preceding bullet point pending CVR Energy’s determination whether to accept such offer and pending the closing of any offers CVR Energy accepts; | |
| • | engaging in any refinery restricted business if CVR Energy has previously advised us that it has elected not to cause it to acquire or seek to acquire such business; or | |
| • | acquiring up to 9.9% of any class of securities of any publicly traded company that engages in any refinery restricted business. |
| • | any fertilizer restricted business acquired as part of a business or package of assets if a majority of the value of the total assets or business acquired is not attributable to a fertilizer restricted business, as determined in good faith by CVR Energy’s board of directors, as applicable; however, if at any time CVR Energy completes such an acquisition, it must, within 365 days of the closing of the transaction, offer to sell the fertilizer-related assets to us for their fair market value plus any additional tax or other similar costs that would be required to transfer the fertilizer-related assets to us separately from the acquired business or package of assets; | |
| • | engaging in any fertilizer restricted business subject to the offer to us described in the immediately preceding bullet point pending our determination whether to accept such offer and pending the closing of any offers the we accept; |
135
Table of Contents
| • | engaging in any fertilizer restricted business if we have previously advised CVR Energy that we have elected not to acquire such business; or | |
| • | acquiring up to 9.9% of any class of securities of any publicly traded company that engages in any fertilizer restricted business. |
| • | services from CVR Energy’s employees in capacities equivalent to the capacities of corporate executive officers, except that those who serve in such capacities under the agreement shall serve us on a shared, part-time basis only, unless we and CVR Energy agree otherwise; | |
| • | administrative and professional services, including legal, accounting services, human resources, insurance, tax, credit, finance, government affairs and regulatory affairs; | |
| • | management of our property and the property of our operating subsidiary in the ordinary course of business; | |
| • | recommendations on capital raising activities to the board of directors of our general partner, including the issuance of debt or equity interests, the entry into credit facilities and other capital market transactions; | |
| • | managing or overseeing litigation and administrative or regulatory proceedings, and establishing appropriate insurance policies for us, and providing safety and environmental advice; | |
| • | recommending the payment of distributions; and | |
| • | managing or providing advice for other projects, including acquisitions, as may be agreed by CVR Energy and our general partner from time to time. |
136
Table of Contents
137
Table of Contents
| Amount to be Distributed by | ||||
Entity/Individual | Coffeyville Acquisition III | |||
| (in millions) | ||||
| The Goldman Sachs Funds | $ | 11.7 | ||
| The Kelso Funds | $ | 11.5 | ||
| John J. Lipinski | $ | 1.1 | ||
| Stanley A. Riemann | $ | 0.4 | ||
| Edmund S. Gross | $ | 0.1 | ||
| Kevan A. Vick | $ | 0.2 | ||
| All management members, as a group | $ | 2.4 | ||
| Total distributions | $ | 26.0 | ||
138
Table of Contents
| • | approved by the conflicts committee of the board of directors of our general partner, although our general partner is not obligated to seek such approval; | |
| • | approved by the vote of a majority of the outstanding common units, excluding any units owned by the general partner or any of its affiliates, although our general partner is not obligated to seek such approval; | |
| • | on terms no less favorable to us than those generally being provided to or available from unrelated third parties; or | |
| • | fair and reasonable to us, taking into account the totality of the relationships between the parties involved, including other transactions that may be particularly favorable or advantageous to us. |
139
Table of Contents
| • | permits our general partner to make a number of decisions in its individual capacity, as opposed to its capacity as general partner, thereby entitling our general partner to consider only the interests and factors |
140
Table of Contents
| that it desires, and imposes no duty or obligation on our general partner to give any consideration to any interest of, or factors affecting, us, our affiliates or any limited partner; |
| • | provides that our general partner shall not have any liability to us or our unitholders for decisions made in its capacity as general partner so long as it acted in good faith, meaning it believed that the decision was in the best interests of our partnership; | |
| • | generally provides that affiliated transactions and resolutions of conflicts of interest not approved by the conflicts committee of the board of directors of our general partner and not involving a vote of unitholders must be on terms no less favorable to us than those generally being provided to or available from unrelated third parties or be “fair and reasonable” to us, as determined by our general partner in good faith, and that, in determining whether a transaction or resolution is “fair and reasonable,” our general partner may consider the totality of the relationships between the parties involved, including other transactions that may be particularly advantageous or beneficial to us; | |
| • | provides that our general partner and its officers and directors will not be liable for monetary damages to us or our limited partners for any acts or omissions unless there has been a final and non-appealable judgment entered by a court of competent jurisdiction determining that the general partner or its officers or directors acted in bad faith or engaged in fraud or willful misconduct or, in the case of a criminal matter, acted with knowledge that the conduct was criminal; and | |
| • | provides that in resolving conflicts of interest, it will be presumed that in making its decision, the general partner or its conflicts committee acted in good faith, and in any proceeding brought by or on behalf of any limited partner or the partnership, the person bringing or prosecuting such proceeding will have the burden of overcoming such presumption. |
| • | the expenses associated with being a public company and other general and administrative expenses; | |
| • | interest expense and other financing costs related to current and future indebtedness; | |
| • | amount and timing of asset purchases and sales; | |
| • | cash expenditures; | |
| • | borrowings; and | |
| • | issuance of additional units. |
141
Table of Contents
| • | approved by a majority of the members of our conflicts committee; | |
| • | approved by a majority of outstanding common units (excluding those owned by our general partner and its affiliates); | |
| • | on terms no less favorable to us than those generally being provided to or available from unrelated third parties; or | |
| • | “fair and reasonable” to us, taking into account the totality of the relationships between the parties involved (including other transactions that may be particularly favorable or advantageous to us) |
142
Table of Contents
| • | the making of any expenditures, the lending or borrowing of money, the assumption or guarantee of, or other contracting for, indebtedness and other liabilities, the issuance of evidences of indebtedness, including indebtedness that is convertible into securities of the partnership, and the incurring of any other obligations; | |
| • | the making of tax, regulatory and other filings, or rendering of periodic or other reports to governmental or other agencies having jurisdiction over our business or assets; | |
| • | the acquisition, disposition, mortgage, pledge, encumbrance, hypothecation or exchange of any or all of our assets or the merger or other combination of us with or into another person; | |
| • | the negotiation, execution and performance of any contracts, conveyances or other instruments; | |
| • | the distribution of partnership cash; | |
| • | the selection and dismissal of employees and agents, outside attorneys, accountants, consultants and contractors and the determination of their compensation and other terms of employment or hiring; | |
| • | the maintenance of insurance for our benefit and the benefit of our partners; | |
| • | the formation of, or acquisition of an interest in, and the contribution of property and the making of loans to, any further limited or general partnerships, joint ventures, corporations, limited liability companies or other entities; | |
| • | the control of any matters affecting our rights and obligations, including the bringing and defending of actions at law or in equity and otherwise engaging in the conduct of litigation, arbitration or mediation and the incurring of legal expense and the settlement of claims and litigation; |
143
Table of Contents
| • | the indemnification of any person against liabilities and contingencies to the extent permitted by law; | |
| • | the purchase, sale or other acquisition or disposition of our securities, or the issuance of additional options, rights, warrants and appreciation rights relating to our securities; and | |
| • | the entering into of agreements with any of its affiliates to render services to us or to itself in the discharge of its duties as our general partner. |
| • | the default fiduciary duties under by the Delaware Act; | |
| • | the standards contained in our partnership agreement that replace the default fiduciary duties; and | |
| • | certain rights and remedies of limited partners contained in the Delaware Act. |
| State law fiduciary duty standards | Fiduciary duties are generally considered to include an obligation to act in good faith and with due care and loyalty. The duty of care, in the absence of a provision in a partnership agreement providing otherwise, would generally require a general partner to act for the partnership in the same manner as a prudent person would act on his own behalf. The duty of loyalty, in the absence of a provision in a partnership agreement providing otherwise, would generally require that any action taken or transaction engaged in be entirely fair to the Partnership. | |
| Partnership agreement modified standards | Our partnership agreement contains provisions that waive or consent to conduct by our general partner and its affiliates that might otherwise raise issues as to compliance with fiduciary duties or applicable law. For example, our partnership agreement provides that when our general partner is acting in its capacity as our general partner, as opposed to in its individual capacity, it must act in “good faith” and will not be subject to any other standard under applicable law. In addition, when our general partner is acting in its individual capacity, |
144
Table of Contents
| as opposed to in its capacity as our general partner, it may act without any fiduciary obligation to us or the unitholders whatsoever. These contractual standards reduce the obligations to which our general partner would otherwise be held. | ||
| Our partnership agreement generally provides that affiliated transactions and resolutions of conflicts of interest not involving a vote of unitholders and that are not approved by the conflicts committee of the board of directors of our general partner must be: | ||
| • on terms no less favorable to us than those generally being provided to or available from unrelated third parties; or | ||
| • “fair and reasonable” to us, taking into account the totality of the relationships between the parties involved (including other transactions that may be particularly favorable or advantageous to us). | ||
| All conflicts of interest disclosed in this prospectus (including our agreements and other arrangements with CVR Energy) have been approved by all of our partners under the terms of our partnership agreement. | ||
| If our general partner does not seek approval from the conflicts committee of its board of directors or the common unitholders, and its board of directors determines that the resolution or course of action taken with respect to the conflict of interest satisfies either of the standards set forth in the bullet points above, then it will be presumed that, in making its decision, the board of directors, which may include board members affected by the conflict of interest, acted in good faith, and in any proceeding brought by or on behalf of any limited partner or the partnership, the person bringing or prosecuting such proceeding will have the burden of overcoming such presumption. These standards reduce the obligations to which our general partner would otherwise be held. |
| Rights and remedies of limited partners | The Delaware Act generally provides that a limited partner may institute legal action on behalf of the partnership to recover damages from a third party where a general partner has refused to institute the action or where an effort to cause a general partner to do so is not likely to succeed. These actions include actions against a general partner for breach of its fiduciary duties or of our partnership agreement. In addition, the statutory or case law of some jurisdictions may permit a limited partner to institute legal action on behalf of it and all other similarly situated limited partners to recover damages from a general partner for violations of its fiduciary duties to the limited partners. |
| Partnership agreement modified standards | In addition to the other more specific provisions limiting the obligations of our general partner, our partnership agreement further provides that our general partner and its officers and directors will not be liable for monetary damages to us or our limited partners for errors of judgment or for any acts or omissions unless there has been a final and non-appealable judgment by a court of competent jurisdiction determining that the general partner or its officers and directors acted in bad faith or engaged in fraud or willful misconduct or, in the case of a criminal matter, acted with knowledge that such person’s conduct was criminal. |
145
Table of Contents
146
Table of Contents
| • | surety bond premiums to replace lost or stolen certificates, taxes and other governmental charges; | |
| • | special charges for services requested by a holder of a common unit; and | |
| • | other similar fees or charges. |
| • | represents that the transferee has the capacity, power and authority to become bound by our partnership agreement; | |
| • | automatically agrees to be bound by the terms and conditions of, and is deemed to have executed, our partnership agreement; and | |
| • | gives the consents and approvals contained in our partnership agreement, such as the approval of all transactions and agreements entered into in connection with our formation and this offering. |
147
Table of Contents
148
Table of Contents
| • | with regard to distributions of cash, see “How We Make Cash Distributions”; | |
| • | with regard to the fiduciary duties of our general partner, see “Conflicts of Interest and Fiduciary Duties”; | |
| • | with regard to the authority of our general partner to manage our business and activities, see “Management — Management of CVR Partners, LP”; | |
| • | with regard to the transfer of common units, see “Description of Our Common Units — Transfer of Common Units”; and | |
| • | with regard to allocations of taxable income and taxable loss, see “Material U.S. Federal Income Tax Consequences.” |
149
Table of Contents
| Issuance of additional partnership interests | No approval right. See “— Issuance of Additional Partnership Interests.” | |
| Amendment of our partnership agreement | Certain amendments may be made by our general partner without the approval of the common unitholders. Other amendments generally require the approval of a unit majority. See “— Amendment of Our Partnership Agreement.” | |
| Merger of our partnership or the sale of all or substantially all of our assets | Unit majority in certain circumstances. See “— Merger, Sale or Other Disposition of Assets.” | |
| Dissolution of our partnership | Unit majority. See “— Termination and Dissolution.” | |
| Continuation of our partnership upon dissolution | Unit majority. See “— Termination and Dissolution.” | |
| Withdrawal of our general partner | Under most circumstances, the approval of a majority of the common units, excluding common units held by our general partner and its affiliates, is required for the withdrawal of our general partner prior to March 31, 2021. See “— Withdrawal or Removal of Our General Partner.” |
| Removal of our general partner | Not less than 662/3% of the outstanding common units, including common units held by our general partner and its affiliates. See “— Withdrawal or Removal of Our General Partner.” |
| Transfer of the general partner interest | Our general partner may transfer all, but not less than all, of its general partner interest in us without a vote of our unitholders to an affiliate or another person in connection with its merger or consolidation with or into, or sale of all or substantially all of its assets to, such person. The approval of a majority of the common units, excluding common units held by our general partner and its affiliates, is required in other circumstances for a transfer of the general partner interest to a third party prior to March 31, 2021. See “— Transfer of General Partner Interests.” | |
| Transfer of ownership interests in our general partner | No approval required at any time. See “— Transfer of Ownership Interests in Our General Partner.” |
| • | arising out of or relating in any way to the partnership agreement (including any claims, suits or actions to interpret, apply or enforce the provisions of the partnership agreement or the duties, obligations or liabilities |
150
Table of Contents
| among limited partners or of limited partners to us, or the rights or powers of, or restrictions on, the limited partners or us); |
| • | brought in a derivative manner on our behalf; | |
| • | asserting a claim of breach of a fiduciary duty owed by any director, officer or other employee of us or our general partner, or owed by our general partner, to us or the limited partners; | |
| • | asserting a claim arising pursuant to any provision of the Delaware Act; or | |
| • | asserting a claim governed by the internal affairs doctrine |
| • | to remove or replace our general partner; | |
| • | to approve some amendments to our partnership agreement; or | |
| • | to take other action under our partnership agreement |
151
Table of Contents
152
Table of Contents
| • | a change in our name, the location of our principal place of business, our registered agent or our registered office; | |
| • | the admission, substitution, withdrawal or removal of partners in accordance with our partnership agreement; | |
| • | a change that our general partner determines to be necessary or appropriate for us to qualify or to continue our qualification as a limited partnership or a partnership in which the limited partners have limited liability under the laws of any state or to ensure that neither we nor our subsidiary will be treated as an association taxable as a corporation or otherwise taxed as an entity for U.S. federal income tax purposes (to the extent not already so treated or taxed); | |
| • | an amendment that is necessary, in the opinion of our counsel, to prevent us or our general partner or its directors, officers, agents, or trustees from in any manner being subjected to the provisions of the Investment Company Act of 1940, the Investment Advisers Act of 1940, or “plan asset” regulations adopted under the Employee Retirement Income Security Act of 1974, or ERISA, whether or not substantially similar to plan asset regulations currently applied or proposed; | |
| • | an amendment that our general partner determines to be necessary or appropriate for the creation, authorization, or issuance of additional partnership interests or rights to acquire partnership interests, as otherwise permitted by our partnership agreement; | |
| • | any amendment expressly permitted in our partnership agreement to be made by our general partner acting alone; | |
| • | an amendment effected, necessitated or contemplated by a merger agreement that has been approved under the terms of our partnership agreement; | |
| • | any amendment that our general partner determines to be necessary or appropriate for the formation by us of, or our investment in, any corporation, partnership or other entity, as otherwise permitted by our partnership agreement; | |
| • | a change in our fiscal year or taxable year and related changes; | |
| • | mergers with or conveyances to another limited liability entity that is newly formed and has no assets, liabilities or operations at the time of the merger or conveyance other than those it receives by way of the merger or conveyance; or | |
| • | any other amendments substantially similar to any of the matters described above. |
153
Table of Contents
| • | do not adversely affect in any material respect the partners considered as a whole or any particular class of partners; | |
| • | are necessary or appropriate to satisfy any requirements, conditions, or guidelines contained in any opinion, directive, order, ruling, or regulation of any federal or state agency or judicial authority or contained in any federal or state statute; | |
| • | are necessary or appropriate to facilitate the trading of limited partner interests or to comply with any rule, regulation, guideline, or requirement of any securities exchange on which the limited partner interests are or will be listed for trading; | |
| • | are necessary or appropriate for any action taken by our general partner relating to splits or combinations of common units under the provisions of our partnership agreement; or | |
| • | are required to effect the intent expressed in this prospectus or the intent of the provisions of our partnership agreement or are otherwise contemplated by our partnership agreement. |
154
Table of Contents
| • | the action would not result in the loss of limited liability under Delaware law of any limited partner; and | |
| • | neither our partnership nor our subsidiary would be treated as an association taxable as a corporation or otherwise be taxable as an entity for U.S. federal income tax purposes upon the exercise of that right to continue (to the extent not already so treated or taxed). |
155
Table of Contents
| • | an affiliate of our general partner (other than an individual), or | |
| • | another entity as part of the merger or consolidation of our general partner with or into another entity or the transfer by our general partner of all or substantially all of its assets to another entity, |
156
Table of Contents
| • | obtain proof of the nationality, citizenship or other related status of our limited partner (and their owners, to the extent relevant); and | |
| • | permit us to redeem the common units held by any person whose nationality, citizenship or other related status creates substantial risk of cancellation or forfeiture of any property or who fails to comply with the procedures instituted by the board to obtain proof of the nationality, citizenship or other related status. The redemption price in the case of such redemption will be the average of the daily closing prices per unit for the 20 consecutive trading days immediately prior to the date set for redemption. |
157
Table of Contents
| • | obtain proof of the U.S. federal income tax status of our partner (and their owners, to the extent relevant); and | |
| • | permit us to redeem the common units held by any person whose tax status has or is reasonably likely to have a material adverse effect on the maximum applicable rates or who fails to comply with the procedures instituted by the general partner to obtain proof of the U.S. federal income tax status. The redemption price in the case of such redemption will be the average of the daily closing prices per unit for the 20 consecutive trading days immediately prior to the date set for redemption. |
158
Table of Contents
159
Table of Contents
160
Table of Contents
| • | 1% of the total number of the class of securities outstanding; or | |
| • | the average weekly reported trading volume of the common units for the four calendar weeks prior to the sale. |
161
Table of Contents
162
Table of Contents
163
Table of Contents
164
Table of Contents
| • | gross income from operations exceeds the amount required to make anticipated quarterly distributions on all common units, yet we only distribute the anticipated quarterly distributions on all common units; or | |
| • | we make a future offering of common units and use the net proceeds of this offering in a manner that does not produce substantial additional deductions during the period described above, such as to repay indebtedness outstanding at the time of this offering or to acquire property that is not eligible for depreciation or amortization for U.S. federal income tax purposes or that is depreciable or amortizable at a rate significantly slower than the rate applicable to our assets at the time of this offering. |
165
Table of Contents
| • | interest on indebtedness properly allocable to property held for investment; | |
| • | our interest expense attributed to portfolio income; and | |
| • | the portion of interest expense incurred to purchase or carry an interest in a passive activity to the extent attributable to portfolio income. |
| • | his relative contributions to us; | |
| • | the interests of all the partners in profits and losses; |
166
Table of Contents
| • | the interest of all the partners in cash flow; and | |
| • | the rights of all the partners to distributions of capital upon liquidation. |
| • | any of our income, gain, loss or deduction with respect to those common units would not be reportable by the unitholder; | |
| • | any cash distributions received by the unitholder as to those common units would be fully taxable; and | |
| • | all of these distributions may be subject to tax as ordinary income. |
167
Table of Contents
168
Table of Contents
169
Table of Contents
170
Table of Contents
| • | a short sale; | |
| • | an offsetting notional principal contract; or | |
| • | a futures or forward contract with respect to the partnership interest or substantially identical property. |
171
Table of Contents
172
Table of Contents
173
Table of Contents
| (a) | the name, address and taxpayer identification number of the beneficial owner and the nominee; |
| (b) | a statement regarding whether the beneficial owner is: |
| 1. | a person that is not a U.S. person; | |
| 2. | a foreign government, an international organization or any wholly-owned agency or instrumentality of either of the foregoing; or | |
| 3. | a tax-exempt entity; |
| (c) | the amount and description of common units held, acquired or transferred for the beneficial owner; and |
| (d) | specific information including the dates of acquisitions and transfers, means of acquisitions and transfers, and acquisition cost for purchases, as well as the amount of net proceeds from sales. |
| (1) | for which there is, or was, “substantial authority”; or | |
| (2) | as to which there is a reasonable basis and the pertinent facts of that position are disclosed on the return. |
174
Table of Contents
| • | accuracy-related penalties with a broader scope, significantly narrower exceptions, and potentially greater amounts than described above at “— Accuracy-Related Penalties;” | |
| • | for those persons otherwise entitled to deduct interest on federal tax deficiencies, nondeductibility of interest on any resulting tax liability; and | |
| • | in the case of a listed transaction, an extended statute of limitations. |
175
Table of Contents
176
Table of Contents
| • | whether the investment is prudent under Section 404(a)(1)(B) of ERISA; | |
| • | whether in making the investment, that plan will satisfy the diversification requirements of Section 404(a)(1)(C) of ERISA; and | |
| • | whether the investment will result in recognition of unrelated business taxable income by the plan and, if so, the potential after-tax investment return. |
177
Table of Contents
| Number of | ||||
Name | Common Units | |||
| Morgan Stanley & Co. Incorporated | ||||
| Barclays Capital Inc. | ||||
| Goldman, Sachs & Co. | ||||
| Dahlman Rose & Company, LLC | ||||
| RBS Securities Inc. | ||||
| Simmons & Company International | ||||
| SunTrust Robinson Humphrey, Inc. | ||||
| Total | 19,200,000 | |||
178
Table of Contents
| Total | ||||||||||||
| Per Unit | No Exercise | Full Exercise | ||||||||||
| Public Offering Price | $ | $ | $ | |||||||||
| Underwriting discounts and commissions to be paid by us | $ | $ | $ | |||||||||
| Proceeds, before expenses, to us | $ | $ | $ | |||||||||
179
Table of Contents
180
Table of Contents
181
Table of Contents
182
Table of Contents
183
| P-1 | ||||
| P-2 | ||||
| P-3 | ||||
| P-4 | ||||
Audited Consolidated Financial Statements: | ||||
| F-1 | ||||
| F-2 | ||||
| F-3 | ||||
| F-4 | ||||
| F-5 | ||||
| F-6 |
184
Table of Contents
P-1
Table of Contents
BALANCE SHEET
AS OF DECEMBER 31, 2010
| Actual | Pro Forma | |||||||||||
| As of | Pro Forma | As of | ||||||||||
| December 31, 2010 | Adjustments | December 31, 2010 | ||||||||||
| (in thousands) | ||||||||||||
ASSETS | ||||||||||||
| Current assets: | ||||||||||||
| Cash and cash equivalents | $ | 42,745 | $ | (24,085 | )(a) | $ | 143,660 | |||||
| 249,600 | (b) | |||||||||||
| (20,798 | )(c) | |||||||||||
| (18,400 | )(d) | |||||||||||
| 125,000 | (e) | |||||||||||
| (3,000 | )(f) | |||||||||||
| (92,125 | )(g) | |||||||||||
| (89,277 | )(h) | |||||||||||
| (26,000 | )(i) | |||||||||||
| Accounts receivable, net of allowance for doubtful accounts of $43 | 5,036 | — | 5,036 | |||||||||
| Inventories | 19,830 | — | 19,830 | |||||||||
| Due from affiliate | — | — | — | |||||||||
| Prepaid expenses and other current assets, including $2,587 on a historical basis and $269 on a pro forma basis, respectively, from affiliates | 5,557 | (2,089 | )(c) | 1,150 | ||||||||
| (2,318 | )(j) | |||||||||||
| Total current assets | 73,168 | 96,508 | 169,676 | |||||||||
| Property, plant, and equipment, net of accumulated depreciation | 337,938 | — | 337,938 | |||||||||
| Intangible assets, net | 46 | — | 46 | |||||||||
| Goodwill | 40,969 | — | 40,969 | |||||||||
| Deferred financing costs | — | 3,000 | (f) | 3,000 | ||||||||
| Other long-term assets | 44 | — | 44 | |||||||||
| Total assets | $ | 452,165 | $ | 99,508 | $ | 551,673 | ||||||
| LIABILITIES AND PARTNERS’ CAPITAL | ||||||||||||
| Current liabilities: | ||||||||||||
| Accounts payable, including $3,323 due from affiliates on a historical and pro forma basis | $ | 17,758 | $ | (1,415 | )(c) | $ | 16,343 | |||||
| Personnel accruals | 1,848 | — | 1,848 | |||||||||
| Deferred revenue | 18,660 | — | 18,660 | |||||||||
| Accrued expenses and other current liabilities | 7,810 | — | 7,810 | |||||||||
| Total current liabilities | 46,076 | (1,415 | ) | 44,661 | ||||||||
| Long-term liabilities: | ||||||||||||
| Long-term debt | — | 125,000 | (e) | 125,000 | ||||||||
| Other long-term liabilities | 3,886 | — | 3,886 | |||||||||
| Total long-term liabilities | 3,886 | 125,000 | 128,886 | |||||||||
| Commitments and contingencies | ||||||||||||
| Partners’ capital: | ||||||||||||
| Special general partner’s interest, 30,303,000 units issued and outstanding | 397,951 | (24,061 | )(a) | — | ||||||||
| (2,316 | )(j) | |||||||||||
| (371,574 | )(k) | |||||||||||
| Limited partner’s interest, 30,333 units issued and outstanding | 398 | (24 | )(a) | — | ||||||||
| (2 | )(j) | |||||||||||
| (372 | )(k) | |||||||||||
| Managing general partner’s interest | 3,854 | (3,854 | )(i) | — | ||||||||
| Total partners’ capital | 402,203 | (402,203 | ) | — | ||||||||
| PRO FORMA PARTNERS’ CAPITAL | ||||||||||||
| Unitholders’ equity: | ||||||||||||
| Equity held by public: | ||||||||||||
| Common units: 19,200,000 common units issued and outstanding | — | 249,600 | (b) | 228,128 | ||||||||
| (21,472 | )(c) | |||||||||||
| Equity held by parent: | ||||||||||||
| Common units: 53,800,000 common units issued and outstanding | — | 371,946 | (k) | 149,998 | ||||||||
| (18,400 | )(d) | |||||||||||
| (92,125 | )(g) | |||||||||||
| (89,277 | )(h) | |||||||||||
| (22,146 | )(i) | |||||||||||
| General partner interest | — | — | (l) | — | ||||||||
| Total pro forma partners’ capital | — | 378,126 | 378,126 | |||||||||
| Total liabilities and partners’ capital | $ | 452,165 | $ | 99,508 | $ | 551,673 | ||||||
pro forma condensed consolidated financial statements.
P-2
Table of Contents
STATEMENT OF OPERATIONS
FOR THE YEAR ENDED DECEMBER 31, 2010
| Actual | Pro Forma | |||||||||||
| Year Ended | Pro Forma | Year Ended | ||||||||||
| December 31, 2010 | Adjustments | December 31, 2010 | ||||||||||
| (in thousands) | ||||||||||||
| Net sales | $ | 180,468 | $ | — | $ | 180,468 | ||||||
| Operating costs and expenses: | ||||||||||||
| Cost of product sold (exclusive of depreciation and amortization) — Affiliates | 5,764 | — | 5,764 | |||||||||
| Cost of product sold (exclusive of depreciation and amortization) — Third Parties | 28,564 | — | 28,564 | |||||||||
| 34,328 | — | 34,328 | ||||||||||
| Direct operating expenses (exclusive of depreciation and amortization) — Affiliates | 2,308 | — | 2,308 | |||||||||
| Direct operating expenses (exclusive of depreciation and amortization) — Third Parties | 84,371 | — | 84,371 | |||||||||
| 86,679 | — | 86,679 | ||||||||||
| Selling, general & administrative expenses (exclusive of depreciation and amortization) — Affiliates | 16,748 | — | 16,748 | |||||||||
| Selling, general & administrative expenses (exclusive of depreciation and amortization) — Third Parties | 3,894 | — | 3,894 | |||||||||
| 20,642 | — | 20,642 | ||||||||||
| Depreciation and amortization | 18,463 | — | 18,463 | |||||||||
| Total operating costs and expenses | 160,112 | — | 160,112 | |||||||||
| Operating income | 20,356 | 20,356 | ||||||||||
| Other income (expense): | ||||||||||||
| Interest expense and other financing costs | — | (5,000 | )(a) | (5,735 | ) | |||||||
| (610 | )(b) | |||||||||||
| (125 | )(c) | |||||||||||
| Interest income | 13,124 | (13,117 | )(d) | 657 | ||||||||
| 650 | (e) | |||||||||||
| Other income (expense) | (148 | ) | — | (148 | ) | |||||||
| Total other income (expense) | 12,976 | (18,202 | ) | (5,226 | ) | |||||||
| Income before income taxes | 33,332 | (18,202 | ) | 15,130 | ||||||||
| Income tax expense | 26 | — | 26 | |||||||||
| Net income | $ | 33,306 | $ | (18,202 | ) | $ | 15,104 | |||||
| Common unitholders’ interest in net income | $ | 15,104 | ||||||||||
| Income per common unit (basic and diluted) | $ | 0.21 | ||||||||||
| Weighted average number of common units outstanding | 73,000,000 | |||||||||||
pro forma condensed consolidated financial statements.
P-3
Table of Contents
NOTES TO THE UNAUDITED PRO FORMA CONDENSED
CONSOLIDATED FINANCIAL STATEMENTS
| (1) | Organization and Basis of Presentation |
| • | The Partnership will distribute to Coffeyville Resources, LLC (“CRLLC”) all cash on its balance sheet before the closing date of this offering of common units described in the sixth bullet below (other than cash in respect of prepaid sales); |
| • | Each of CRLLC’s and CVR Special GP, LLC’s, or Special GP, interests in the Partnership will be converted into 50,869,080 and 50,920 common units, respectively; |
| • | Special GP, a wholly-owned subsidiary of CRLLC, will be merged with and into CRLLC, with CRLLC continuing as the surviving entity; |
| • | The Partnership will offer and sell 19,200,000 common units to the public in this offering and pay related commissions and expenses; |
| • | The Partnership will be released from its obligations as a guarantor under CRLLC’s existing ABL credit facility, its 9.0% First Lien Senior Secured Notes due 2015 and its 10.875% Second Lien Senior Secured Notes due 2017; | |
| • | The Partnership’s general partner will sell to the Partnership its incentive distribution rights, or IDRs, for $26.0 million in cash (representing fair market value), which will be paid as a distribution to its current owners, which include affiliates of funds associated with Goldman, Sachs & Co. and Kelso & Company, L.P., and the Partnership will extinguish such IDRs; | |
| • | The general partner of the Partnership and CRLLC, a wholly owned subsidiary of CVR Energy, Inc. (“CVR Energy”), will enter into a second amended and restated agreement of limited partnership; | |
| • | The Partnership will distribute $18.4 million of the offering proceeds to CRLLC in satisfaction of the Partnership’s obligation to reimburse it for certain capital expenditures it made with respect to the nitrogen fertilizer business prior to October 24, 2007; |
| • | The Partnership will make a special distribution of $89.3 million of the proceeds of this offering to CRLLC in order to, among other things, fund the offer to purchase CRLLC’s senior secured notes required upon consummation of this offering; |
| • | The Partnership will enter into a new credit facility, which will include a $125.0 million term loan and a $25.0 million revolving credit facility both due in 2016, will draw the $125.0 million term loan in full, pay associated financing costs, and use $92.1 million of the proceeds therefrom to fund a special distribution to CRLLC in order to, among other things, fund the offer to purchase CRLLC’s senior secured notes required upon consummation of this offering; |
P-4
Table of Contents
NOTES TO THE UNAUDITED PRO FORMA CONDENSED
CONSOLIDATED FINANCIAL STATEMENTS — (Continued)
| • | Coffeyville Acquisition III LLC (“CALLC III”), the current owner of CVR GP, LLC, the Partnership’s general partner, will sell the Partnership’s general partner which holds a non-economic general partner interest to CRLLC for nominal consideration; and |
| • | The Partnership will issue an additional 2,880,000 common units to CRLLC upon the expiration of the Underwriters’ option to purchase additional common units. |
| (2) | Partnership Interest |
| • | common units representing limited partner interests, a portion of which the Partnership will sell in the initial public offering (approximately 26.3% of all of the Partnership’s outstanding units); and |
| • | a general partner interest, which is not entitled to any distributions, will be held by the Partnership’s general partner. |
| (3) | Pro Forma Balance Sheet Adjustments and Assumptions |
| (a) | Reflects the distribution by the Partnership of all cash on hand immediately prior to the completion of the initial public offering to the Partnership’s Special GP and Special LP unit holders (other than cash in respect of prepaid sales). For purposes of the pro forma balance sheet at December 31, 2010, this amount is limited to the cash on hand excluding prepaid sales at December 31, 2010 of $24.1 million. The Partnership estimates that the actual amount to be distributed upon the closing of the initial public offering will be approximately $36.4 million. |
| (b) | Reflects the issuance by CVR Partners of 19,200,000 common units to the public at an initial offering price of $13.00 per common unit resulting in aggregate gross proceeds of $249.6 million. |
| (c) | Reflects the payment of underwriting commissions of $17.5 million and other estimated offering expenses of $4.0 million for a total of $21.5 million which will be allocated to the newly issued public common units. As of December 31, 2010 of the $4.0 million of estimated offering expenses $0.7 million had been prepaid and $1.4 million had been accrued. | |
| (d) | Reflects the distribution of approximately $18.4 million to reimburse CRLLC for certain capital expenditures it made with respect to the nitrogen fertilizer business prior to October 24, 2007. | |
| (e) | Reflects the term debt incurred of $125.0 million. |
| (f) | Reflects the estimated deferred financing costs of $3.0 million associated with the new credit facility. |
P-5
Table of Contents
NOTES TO THE UNAUDITED PRO FORMA CONDENSED
CONSOLIDATED FINANCIAL STATEMENTS — (Continued)
| (g) | Reflects the distribution of term debt proceeds of $92.1 million. |
| (h) | Reflects the distribution to CRLLC of $89.3 million of cash resulting from the initial public offering. |
| (i) | Reflects the purchase of the IDRs of the managing general partner interest for $26.0 million, which represents the fair market value. | |
| (j) | Reflects the elimination of the interest receivable associated with the “Due from Affiliate” balance that was distributed on December 31, 2010 in connection with the Partnership’s initial public offering. | |
| (k) | Reflects the conversion of the Special GP and Special LP interest holders’ units to common units. | |
| (l) | Reflects the non-economic general partner interest with nominal value. |
| (4) | Pro Forma Statement of Operations Adjustments and Assumptions |
| (a) | Reflects the inclusion of interest expense relating to the new credit facility at an assumed rate of 4.0% with no balance outstanding under the revolver. A 1/8 percent change in interest rate would result in a change in interest expense of $0.2 million. | |
| (b) | Reflects the amortization of related debt issuance costs of the new credit facility over a five year term. | |
| (c) | Reflects the commitment fee of 0.50% on the estimated unused portion of the $25.0 million revolving credit facility. | |
| (d) | The due from affiliate balance was distributed to CRLLC on December 31, 2010 in connection with the Partnership’s initial public offering. Accordingly, such amounts will no longer be owed to the Partnership. Reflects the elimination of historical interest income generated from the outstanding due from affiliate balance. | |
| (e) | Reflects the inclusion of interest income earned on the average cash balance. |
| (5) | Pro Forma Net Income Per Unit |
P-6
Table of Contents
F-1
Table of Contents
| December 31, | ||||||||
| 2010 | 2009 | |||||||
| (in thousands) | ||||||||
ASSETS | ||||||||
| Current assets: | ||||||||
| Cash and cash equivalents | $ | 42,745 | $ | 5,440 | ||||
| Accounts receivable, net of allowance for doubtful accounts of $43 and $83, respectively | 5,036 | 2,779 | ||||||
| Inventories | 19,830 | 21,936 | ||||||
| Due from affiliate | — | 131,002 | ||||||
| Prepaid expenses and other current assets, including $2,587 and $1,333 from affiliates at December 31, 2010 and December 31, 2009, respectively | 5,557 | 1,969 | ||||||
| Total current assets | 73,168 | 163,126 | ||||||
| Property, plant, and equipment, net of accumulated depreciation | 337,938 | 347,258 | ||||||
| Intangible assets, net | 46 | 56 | ||||||
| Goodwill | 40,969 | 40,969 | ||||||
| Other long-term assets | 44 | 90 | ||||||
| Total assets | $ | 452,165 | $ | 551,499 | ||||
| LIABILITIES AND PARTNERS’ CAPITAL | ||||||||
| Current liabilities: | ||||||||
| Accounts payable, including $3,323 and $1,304 due to affiliates at December 31, 2010 and December 31, 2009, respectively | $ | 17,758 | $ | 7,476 | ||||
| Personnel accruals | 1,848 | 1,614 | ||||||
| Deferred revenue | 18,660 | 10,265 | ||||||
| Accrued expenses and other current liabilities | 7,810 | 8,279 | ||||||
| Total current liabilities | 46,076 | 27,634 | ||||||
| Long-term liabilities: | ||||||||
| Other long-term liabilities | 3,886 | 3,981 | ||||||
| Total long-term liabilities | 3,886 | 3,981 | ||||||
| Commitments and contingencies | ||||||||
| Partners’ capital: | ||||||||
| Special general partner’s interest, 30,303,000 units issued and outstanding | 397,951 | 515,514 | ||||||
| Limited partner’s interest, 30,333 units issued and outstanding | 398 | 516 | ||||||
| Managing general partner’s interest | 3,854 | 3,854 | ||||||
| Total partners’ capital | 402,203 | 519,884 | ||||||
| Total liabilities and partners’ capital | $ | 452,165 | $ | 551,499 | ||||
F-2
Table of Contents
| Year Ended December 31, | ||||||||||||
| 2010 | 2009 | 2008 | ||||||||||
| (in thousands) | ||||||||||||
| Net sales | $ | 180,468 | $ | 208,371 | $ | 262,950 | ||||||
| Operating costs and expenses: | ||||||||||||
| Cost of product sold (exclusive of depreciation and amortization) — Affiliates | 5,764 | 9,506 | 11,084 | |||||||||
| Cost of product sold (exclusive of depreciation and amortization) — Third Parties | 28,564 | 32,652 | 21,476 | |||||||||
| 34,328 | 42,158 | 32,560 | ||||||||||
| Direct operating expenses (exclusive of depreciation and amortization) — Affiliates | 2,308 | 2,136 | 388 | |||||||||
| Direct operating expenses (exclusive of depreciation and amortization) — Third Parties | 84,371 | 82,317 | 85,745 | |||||||||
| 86,679 | 84,453 | 86,133 | ||||||||||
| Selling, general and administrative expenses (exclusive of depreciation and amortization) — Affiliates | 16,748 | 12,310 | 1,056 | |||||||||
| Selling, general and administrative expenses (exclusive of depreciation and amortization) — Third Parties | 3,894 | 1,902 | 8,407 | |||||||||
| 20,642 | 14,212 | 9,463 | ||||||||||
| Depreciation and amortization | 18,463 | 18,685 | 17,987 | |||||||||
| Total operating costs and expenses | 160,112 | 159,508 | 146,143 | |||||||||
| Operating income | 20,356 | 48,863 | 116,807 | |||||||||
| Other income (expense): | ||||||||||||
| Interest income | 13,124 | 8,999 | 2,045 | |||||||||
| Other income (expense) | (148 | ) | 31 | 107 | ||||||||
| Total other income (expense) | 12,976 | 9,030 | 2,152 | |||||||||
| Income before income taxes | 33,332 | 57,893 | 118,959 | |||||||||
| Income tax expense | 26 | 15 | 25 | |||||||||
| Net income | $ | 33,306 | $ | 57,878 | $ | 118,934 | ||||||
F-3
Table of Contents
| Special | Managing | |||||||||||||||
| General | Limited | General | Total | |||||||||||||
| Partner’s | Partner’s | Partner’s | Partners’ | |||||||||||||
| Interest | Interest | Interest | Capital | |||||||||||||
| (in thousands) | ||||||||||||||||
| Balance at December 31, 2007 | $ | 396,242 | $ | 397 | $ | 3,854 | $ | 400,493 | ||||||||
| Net income | 118,815 | 119 | — | 118,934 | ||||||||||||
| Share-based compensation expense - Affiliates | (10,608 | ) | (11 | ) | — | (10,619 | ) | |||||||||
| Cash distribution | (49,950 | ) | (50 | ) | — | (50,000 | ) | |||||||||
| Balance at December 31, 2008 | 454,499 | 455 | 3,854 | 458,808 | ||||||||||||
| Net income | 57,820 | 58 | — | 57,878 | ||||||||||||
| Share-based compensation expense - Affiliates | 3,195 | 3 | — | 3,198 | ||||||||||||
| Balance at December 31, 2009 | 515,514 | 516 | 3,854 | 519,884 | ||||||||||||
| Net income | 33,273 | 33 | — | 33,306 | ||||||||||||
| Share-based compensation expense - Affiliates | 9,004 | 9 | — | 9,013 | ||||||||||||
| Property distribution | (159,840 | ) | (160 | ) | — | (160,000 | ) | |||||||||
| Balance at December 31, 2010 | $ | 397,951 | $ | 398 | $ | 3,854 | $ | 402,203 | ||||||||
F-4
Table of Contents
| Year Ended December 31, | ||||||||||||
| 2010 | 2009 | 2008 | ||||||||||
| (in thousands) | ||||||||||||
| Cash flows from operating activities: | ||||||||||||
| Net income | $ | 33,306 | $ | 57,878 | $ | 118,934 | ||||||
| Adjustments to reconcile net income to net cash provided by operating activities: | ||||||||||||
| Depreciation and amortization | 18,463 | 18,685 | 17,987 | |||||||||
| Allowance for doubtful accounts | (39 | ) | 20 | 47 | ||||||||
| Loss on disposition of fixed assets | 1,897 | 16 | 3,815 | |||||||||
| Share-based compensation - Affiliates | 9,013 | 3,198 | (10,619 | ) | ||||||||
| Write-off of CVR Partners, LP initial public offering costs | — | — | 2,539 | |||||||||
| Accounts receivable | (2,218 | ) | 3,191 | (3,220 | ) | |||||||
| Inventories | 2,106 | 5,695 | (11,477 | ) | ||||||||
| Insurance receivable | (4,500 | ) | — | — | ||||||||
| Insurance proceeds | 3,161 | — | — | |||||||||
| Prepaid expenses and other current assets | (2,689 | ) | 1,549 | (2,566 | ) | |||||||
| Other long-term assets | 1 | (128 | ) | (8 | ) | |||||||
| Accounts payable | 9,394 | (9,224 | ) | 10,131 | ||||||||
| Deferred revenue | 8,395 | 4,517 | (7,413 | ) | ||||||||
| Accrued expenses and other current liabilities | (306 | ) | 110 | 5,315 | ||||||||
| Other accrued long-term liabilities | (39 | ) | 27 | — | ||||||||
| Net cash provided by operating activities | 75,945 | 85,534 | 123,465 | |||||||||
| Cash flows from investing activities: | ||||||||||||
| Capital expenditures | (10,082 | ) | (13,388 | ) | (23,518 | ) | ||||||
| Insurance proceeds | 1,114 | — | — | |||||||||
| Proceeds from sale of assets | — | 18 | — | |||||||||
| Net cash used in investing activities | (8,968 | ) | (13,370 | ) | (23,518 | ) | ||||||
| Cash flows from financing activities: | ||||||||||||
| Deferred costs of initial public offering | (674 | ) | — | (2,283 | ) | |||||||
| Due from affiliate | (28,998 | ) | (75,799 | ) | (53,061 | ) | ||||||
| Partners’ cash distribution | — | — | (50,000 | ) | ||||||||
| Net cash used in financing activities | (29,672 | ) | (75,799 | ) | (105,344 | ) | ||||||
| Net increase (decrease) in cash and cash equivalents | 37,305 | (3,635 | ) | (5,397 | ) | |||||||
| Cash and cash equivalents, beginning of period | 5,440 | 9,075 | 14,472 | |||||||||
| Cash and cash equivalents, end of period | $ | 42,475 | $ | 5,440 | $ | 9,075 | ||||||
| Supplemental disclosures | ||||||||||||
| Non-cash investing and financing activities: | ||||||||||||
| Accrual of construction in progress additions | $ | 888 | $ | (4,872 | ) | $ | 3,661 | |||||
| Partners’ property distribution | $ | (160,000 | ) | $ | — | $ | — | |||||
F-5
Table of Contents
| (1) | Formation of the Partnership, Organization and Nature of Business |
F-6
Table of Contents
| (2) | Basis of Presentation |
F-7
Table of Contents
| (3) | Summary of Significant Accounting Policies |
F-8
Table of Contents
| December 31, | ||||||||
| 2010 | 2009 | |||||||
| (in thousands) | ||||||||
Accrued interest receivables(1) | $ | 2,318 | $ | 961 | ||||
| Deferred initial public offering costs | 2,089 | — | ||||||
Other(1) | 1,150 | 1,008 | ||||||
| $ | 5,557 | $ | 1,969 | |||||
| (1) | The accrued interest receivable represents amounts due from CRLLC, a related party, in connection with the due from affiliate balance. Additionally, included in the table above are amounts owed to the Partnership related to activities associated with the feedstock and shared services agreement. See Note 14 (“Related Party Transactions”) for additional discussion of amounts owed to the Partnership related to the due from affiliate balance and detail of amounts owed to the Partnership related to the feedstock and shared services agreement. |
| Range of Useful | ||
Asset | Lives, in Years | |
| Improvements to land | 15 to 20 | |
| Buildings | 20 to 30 | |
| Machinery and equipment | 5 to 30 | |
| Automotive equipment | 5 | |
| Furniture and fixtures | 3 to 7 |
F-9
Table of Contents
F-10
Table of Contents
F-11
Table of Contents
F-12
Table of Contents
| Year Ended December 31, | ||||||||||||
| 2010 | 2009 | 2008 | ||||||||||
| (in thousands) | ||||||||||||
| Direct operating expenses (exclusive of depreciation and amortization) | $ | 2,145 | $ | 2,811 | $ | 3,007 | ||||||
| Selling, general and administrative expenses (exclusive of depreciation and amortization) | 8,485 | 9,310 | 10,048 | |||||||||
| $ | 10,630 | $ | 12,121 | $ | 13,055 | |||||||
| (4) | Partners’ Capital |
F-13
Table of Contents
| • | common units representing limited partner interests, a portion of which the Partnership will sell in the Offering; and | |
| • | a general partner interest, which is not entitled to any distributions, and which will be held by the Partnership’s general partner. |
| (5) | Inventories |
| December 31, | ||||||||
| 2010 | 2009 | |||||||
| (in thousands) | ||||||||
| Finished goods | $ | 3,645 | $ | 6,624 | ||||
| Raw materials and precious metals | 4,077 | 4,089 | ||||||
| Parts and supplies | 12,108 | 11,223 | ||||||
| $ | 19,830 | $ | 21,936 | |||||
F-14
Table of Contents
| (6) | Property, Plant, and Equipment |
| December 31, | ||||||||
| 2010 | 2009 | |||||||
| (in thousands) | ||||||||
| Land and improvements | $ | 2,492 | $ | 1,689 | ||||
| Buildings | 724 | 650 | ||||||
| Machinery and equipment | 397,236 | 389,537 | ||||||
| Automotive equipment | 391 | 404 | ||||||
| Furniture and fixtures | 245 | 233 | ||||||
| Construction in progress | 32,776 | 33,182 | ||||||
| $ | 433,864 | $ | 425,695 | |||||
| Accumulated depreciation | 95,926 | 78,437 | ||||||
| $ | 337,938 | $ | 347,258 | |||||
| (7) | Goodwill and Intangible Assets |
| • | Income Approach: To determine fair value, the Company discounted the expected future cash flows for the reporting unit utilizing observable market data to the extent available. For the 2010 and 2009 valuation, the discount rates used were 14.6% and 13.4%, respectively, representing the estimated weighted-average costs of capital, which reflects the overall level of inherent risk involved in the reporting unit and the rate of return an outside investor would expect to earn. | |
| • | Market-Based Approach: To determine the fair value of the reporting unit, the Company also utilized a market-based approach. The Company used the guideline company method, which focuses on comparing the Company’s risk profile and growth prospects to select reasonably similar companies. |
F-15
Table of Contents
| (8) | Accrued Expenses and Other Current Liabilities |
| December 31, | ||||||||
| 2010 | 2009 | |||||||
| (in thousands) | ||||||||
| Property taxes | $ | 7,025 | $ | 5,807 | ||||
| Capital asset and dismantling obligation | 250 | 750 | ||||||
| Other accrued expenses | 535 | 1,722 | ||||||
| $ | 7,810 | $ | 8,279 | |||||
| (9) | Nitrogen Fertilizer Incident |
| (10) | Income Taxes |
F-16
Table of Contents
| (11) | Benefit Plans |
| (12) | Share-Based Compensation |
F-17
Table of Contents
| *Compensation Expense | ||||||||||||||||||||||
| Benchmark | Original | Increase (Decrease) for the | ||||||||||||||||||||
| Value | Awards | Years Ended December 31, | ||||||||||||||||||||
Award Type | (per Unit) | Issued | Grant Date | 2010 | 2009 | 2008 | ||||||||||||||||
| (in thousands) | ||||||||||||||||||||||
| Override Operating Units(a) | $ | 11.31 | 919,630 | June 2005 | $ | 56 | $ | 346 | $ | (1,516 | ) | |||||||||||
| Override Operating Units(b) | $ | 34.72 | 72,492 | December 2006 | 1 | 18 | (107 | ) | ||||||||||||||
| Override Value Units(c) | $ | 11.31 | 1,839,265 | June 2005 | 4,751 | 1,207 | (2,877 | ) | ||||||||||||||
| Override Value Units(d) | $ | 34.72 | 144,966 | December 2006 | 217 | 64 | (123 | ) | ||||||||||||||
| Override Units(e) | $ | 10.00 | 138,281 | October 2007 | — | — | (1 | ) | ||||||||||||||
| Override Units(f) | $ | 10.00 | 642,219 | February 2008 | 473 | 5 | 2 | |||||||||||||||
| Total | $ | 5,498 | $ | 1,640 | $ | (4,622 | ) | |||||||||||||||
| * | As CVR Energy’s common stock price increases or decreases, compensation expense associated with the unvested CALLC and CALLC II override units increases or is reversed in correlation with the calculation of the fair value under the probability-weighted expected return method. |
| (a) Override Operating Units | (b) Override Operating Units | |||||||||||||||
| December 31, | December 31, | |||||||||||||||
| 2009 | 2008 | 2009 | 2008 | |||||||||||||
| Estimated forfeiture rate | None | None | None | None | ||||||||||||
| CVR Energy’s closing stock price | $ | 6.86 | $ | 4.00 | $ | 6.86 | $ | 4.00 | ||||||||
| Estimated fair value (per unit) | $ | 11.95 | $ | 8.25 | $ | 1.40 | $ | 1.59 | ||||||||
| Marketability and minority interest discounts | 20.0 | % | 15.0 | % | 20.0 | % | 15.0 | % | ||||||||
| Volatility | 50.7 | % | 68.8 | % | 50.7 | % | 68.8 | % | ||||||||
F-18
Table of Contents
| (c) Override Value Units | (d) Override Value Units | |||||||||||||||||||||||
| December 31, | December 31, | |||||||||||||||||||||||
| 2010 | 2009 | 2008 | 2010 | 2009 | 2008 | |||||||||||||||||||
| Estimated forfeiture rate | None | None | None | None | None | None | ||||||||||||||||||
| Derived service period | 6 years | 6 years | 6 years | 6 years | 6 years | 6 years | ||||||||||||||||||
| CVR Energy’s closing stock price | $ | 15.18 | $ | 6.86 | $ | 4.00 | $ | 15.18 | $ | 6.86 | $ | 4.00 | ||||||||||||
| Estimated fair value (per unit) | $ | 22.39 | $ | 5.63 | $ | 3.20 | $ | 6.56 | $ | 1.39 | $ | 1.59 | ||||||||||||
| Marketability and minority interest discounts | 20.0 | % | 20.0 | % | 15.0 | % | 20.0 | % | 20.0 | % | 15.0 | % | ||||||||||||
| Volatility | 43.0 | % | 50.7 | % | 68.8 | % | 43.0 | % | 50.7 | % | 68.8 | % | ||||||||||||
| Minimum | Forfeiture | |||
Period Held | Percentage | |||
| 2 years | 75 | % | ||
| 3 years | 50 | % | ||
| 4 years | 25 | % | ||
| 5 years | 0 | % | ||
F-19
Table of Contents
| December 31, | ||||||
| 2010 | 2009 | 2008 | ||||
| Estimated forfeiture rate | None | None | None | |||
| Derived Service Period | Forfeiture schedule | Forfeiture schedule | Forfeiture schedule | |||
| Estimated fair value (per unit) | $2.60 | $0.08 | $0.02 | |||
| Marketability and minority interest discounts | 10.0% | 20.0% | 20.0% | |||
| Volatility | 47.6% | 59.7% | 64.3% | |||
| December 31, | ||||||||||||
| 2010 | 2009 | 2008 | ||||||||||
| Service Phantom interest (per point) | $ | 14.64 | $ | 11.37 | $ | 8.25 | ||||||
| Performance Phantom interest (per point) | $ | 21.25 | $ | 5.48 | $ | 3.20 | ||||||
F-20
Table of Contents
| (13) | Commitments and Contingencies |
| Operating | Unconditional | |||||||
| Leases | Purchase Obligations(1) | |||||||
| (in thousands) | ||||||||
| Year ending December 31, 2011 | $ | 4,464 | $ | 11,918 | ||||
| Year ending December 31, 2012 | 4,476 | 12,072 | ||||||
| Year ending December 31, 2013 | 3,664 | 12,526 | ||||||
| Year ending December 31, 2014 | 2,029 | 12,606 | ||||||
| Year ending December 31, 2015 | 1,173 | 12,689 | ||||||
| Thereafter | 1,028 | 103,314 | ||||||
| $ | 16,834 | $ | 165,125 | |||||
| (1) | The Partnership’s purchase obligation for pet coke from CVR Energy has been derived from a calculation of the average pet coke price paid to CVR Energy over the preceding two year period. |
F-21
Table of Contents
F-22
Table of Contents
F-23
Table of Contents
| (14) | Related Party Transactions |
F-24
Table of Contents
F-25
Table of Contents
F-26
Table of Contents
| • | services from CVR Energy’s employees in capacities equivalent to the capacities of corporate executive officers, except that those who serve in such capacities under the agreement shall serve the Partnership on a shared, part-time basis only, unless the Partnership and CVR Energy agree otherwise; | |
| • | administrative and professional services, including legal, accounting services, human resources, insurance, tax, credit, finance, government affairs and regulatory affairs; | |
| • | management of the Partnership’s property and the property of its operating subsidiary in the ordinary course of business; | |
| • | recommendations on capital raising activities to the board of directors of the Partnership’s managing general partner, including the issuance of debt or equity interests, the entry into credit facilities and other capital market transactions; | |
| • | managing or overseeing litigation and administrative or regulatory proceedings, and establishing appropriate insurance policies for the Partnership, and providing safety and environmental advice; | |
| • | recommending the payment of distributions; and | |
| • | managing or providing advice for other projects as may be agreed by CVR Energy and its managing general partner from time to time. |
F-27
Table of Contents
| (15) | Major Customers and Suppliers |
| December 31, | ||||||||||||
| 2010 | 2009 | 2008 | ||||||||||
Nitrogen Fertilizer | ||||||||||||
| Customer A | 12 | % | 15 | % | 13 | % | ||||||
| Customer B | 10 | % | 9 | % | 5 | % | ||||||
| 22 | % | 24 | % | 18 | % | |||||||
| December 31, | ||||||||||||
| 2010 | 2009 | 2008 | ||||||||||
| Supplier A | 5 | % | 5 | % | 5 | % | ||||||
F-28
Table of Contents
SECOND AMENDED AND RESTATED
AGREEMENT OF LIMITED PARTNERSHIP
OF
CVR PARTNERS, LP
Table of Contents
| Page | ||||||
| ARTICLE I DEFINITIONS | ||||||
| Section 1.1 | Definitions | A-1 | ||||
| Section 1.2 | Construction | A-9 | ||||
| ARTICLE II ORGANIZATION | ||||||
| Section 2.1 | Formation | A-9 | ||||
| Section 2.2 | Name | A-9 | ||||
| Section 2.3 | Registered Office; Registered Agent; Principal Office; Other Offices | A-10 | ||||
| Section 2.4 | Purpose and Business | A-10 | ||||
| Section 2.5 | Powers | A-10 | ||||
| Section 2.6 | Term | A-10 | ||||
| Section 2.7 | Title to Partnership Assets | A-10 | ||||
| ARTICLE III RIGHTS OF LIMITED PARTNERS | ||||||
| Section 3.1 | Limitation of Liability | A-11 | ||||
| Section 3.2 | Management of Business | A-11 | ||||
| Section 3.3 | Outside Activities of the Limited Partners | A-11 | ||||
| Section 3.4 | Rights of Limited Partners | A-11 | ||||
| ARTICLE IV CERTIFICATES; RECORD HOLDERS; TRANSFER OF PARTNERSHIP INTERESTS; REDEMPTION OF PARTNERSHIP INTERESTS | ||||||
| Section 4.1 | Certificates | A-12 | ||||
| Section 4.2 | Mutilated, Destroyed, Lost or Stolen Certificates | A-12 | ||||
| Section 4.3 | Record Holders | A-12 | ||||
| Section 4.4 | Transfer Generally | A-13 | ||||
| Section 4.5 | Registration and Transfer of Limited Partner Interests | A-13 | ||||
| Section 4.6 | Transfer of the General Partner Interest | A-14 | ||||
| Section 4.7 | Restrictions on Transfers | A-14 | ||||
| Section 4.8 | Eligibility Certificates; Ineligible Holders | A-15 | ||||
| Section 4.9 | Redemption of Partnership Interests of Ineligible Holders | A-16 | ||||
| ARTICLE V CAPITAL CONTRIBUTIONS AND ISSUANCE OF PARTNERSHIP INTERESTS | ||||||
| Section 5.1 | Contributions by the General Partner and its Affiliates | A-16 | ||||
| Section 5.2 | Interest and Withdrawal | A-17 | ||||
| Section 5.3 | Capital Accounts | A-17 | ||||
| Section 5.4 | Issuances of Additional Partnership Interests | A-19 | ||||
| Section 5.5 | Preemptive Right | A-20 | ||||
| Section 5.6 | Splits and Combinations | A-20 | ||||
| Section 5.7 | Fully Paid and Non-Assessable Nature of Limited Partner Interests | A-20 | ||||
| Section 5.8 | Extinguishment of the IDRs | A-20 | ||||
A-i
Table of Contents
| Page | ||||||
| ARTICLE VI ALLOCATIONS AND DISTRIBUTIONS | ||||||
| Section 6.1 | Allocations for Capital Account Purposes | A-21 | ||||
| Section 6.2 | Allocations for Tax Purposes | A-23 | ||||
| Section 6.3 | Distributions to Record Holders | A-24 | ||||
| ARTICLE VII MANAGEMENT AND OPERATION OF BUSINESS | ||||||
| Section 7.1 | Management | A-24 | ||||
| Section 7.2 | Certificate of Limited Partnership | A-26 | ||||
| Section 7.3 | �� | Restrictions on the General Partner’s Authority | A-26 | |||
| Section 7.4 | Reimbursement of the General Partner | A-26 | ||||
| Section 7.5 | Outside Activities | A-27 | ||||
| Section 7.6 | Loans from the General Partner; Loans or Contributions from the Partnership or Group Members | A-28 | ||||
| Section 7.7 | Indemnification | A-28 | ||||
| Section 7.8 | Liability of Indemnitees | A-30 | ||||
| Section 7.9 | Resolution of Conflicts of Interest; Standards of Conduct and Modification of Duties | A-30 | ||||
| Section 7.10 | Other Matters Concerning the General Partner | A-31 | ||||
| Section 7.11 | Purchase or Sale of Partnership Interests | A-32 | ||||
| Section 7.12 | Registration Rights of the General Partner and its Affiliates | A-32 | ||||
| Section 7.13 | Reliance by Third Parties | A-33 | ||||
| ARTICLE VIII BOOKS, RECORDS, ACCOUNTING AND REPORTS | ||||||
| Section 8.1 | Records and Accounting | A-34 | ||||
| Section 8.2 | Fiscal Year | A-34 | ||||
| Section 8.3 | Reports | A-34 | ||||
| ARTICLE IX TAX MATTERS | ||||||
| Section 9.1 | Tax Returns and Information | A-34 | ||||
| Section 9.2 | Tax Elections | A-35 | ||||
| Section 9.3 | Tax Controversies | A-35 | ||||
| Section 9.4 | Withholding | A-35 | ||||
| ARTICLE X ADMISSION OF PARTNERS | ||||||
| Section 10.1 | Admission of Limited Partners | A-35 | ||||
| Section 10.2 | Admission of Successor General Partner | A-36 | ||||
| Section 10.3 | Amendment of Agreement and Certificate of Limited Partnership | A-36 | ||||
| ARTICLE XI WITHDRAWAL OR REMOVAL OF PARTNERS | ||||||
| Section 11.1 | Withdrawal of the General Partner | A-36 | ||||
| Section 11.2 | Removal of the General Partner | A-37 | ||||
| Section 11.3 | Interest of Departing General Partner and Successor General Partner | A-38 | ||||
| Section 11.4 | Withdrawal of Limited Partners | A-38 | ||||
A-ii
Table of Contents
| Page | ||||||
| ARTICLE XII DISSOLUTION AND LIQUIDATION | ||||||
| Section 12.1 | Dissolution | A-39 | ||||
| Section 12.2 | Continuation of the Business of the Partnership After Dissolution | A-39 | ||||
| Section 12.3 | Liquidator | A-39 | ||||
| Section 12.4 | Liquidation | A-40 | ||||
| Section 12.5 | Cancellation of Certificate of Limited Partnership | A-40 | ||||
| Section 12.6 | Return of Contributions | A-40 | ||||
| Section 12.7 | Waiver of Partition | A-40 | ||||
| Section 12.8 | Capital Account Restoration | A-40 | ||||
| ARTICLE XIII AMENDMENT OF PARTNERSHIP AGREEMENT; MEETINGS; RECORD DATE | ||||||
| Section 13.1 | Amendments to be Adopted Solely by the General Partner | A-41 | ||||
| Section 13.2 | Amendment Procedures | A-42 | ||||
| Section 13.3 | Amendment Requirements | A-42 | ||||
| Section 13.4 | Special Meetings | A-42 | ||||
| Section 13.5 | Notice of a Meeting | A-43 | ||||
| Section 13.6 | Record Date | A-43 | ||||
| Section 13.7 | Adjournment | A-43 | ||||
| Section 13.8 | Waiver of Notice; Approval of Meeting; Approval of Minutes | A-43 | ||||
| Section 13.9 | Quorum and Voting | A-43 | ||||
| Section 13.10 | Conduct of a Meeting | A-44 | ||||
| Section 13.11 | Action Without a Meeting | A-44 | ||||
| Section 13.12 | Right to Vote and Related Matters | A-44 | ||||
| ARTICLE XIV MERGER | ||||||
| Section 14.1 | Authority | A-45 | ||||
| Section 14.2 | Procedure for Merger or Consolidation | A-45 | ||||
| Section 14.3 | Approval by Partners of Merger or Consolidation | A-45 | ||||
| Section 14.4 | Certificate of Merger | A-46 | ||||
| Section 14.5 | Amendment of Partnership Agreement | A-46 | ||||
| Section 14.6 | Effect of Merger | A-46 | ||||
| ARTICLE XV RIGHT TO ACQUIRE LIMITED PARTNER INTERESTS | ||||||
| Section 15.1 | Right to Acquire Limited Partner Interests | A-47 | ||||
A-iii
Table of Contents
| Page | ||||||
| ARTICLE XVI GENERAL PROVISIONS | ||||||
| Section 16.1 | Addresses and Notices | A-48 | ||||
| Section 16.2 | Further Action | A-48 | ||||
| Section 16.3 | Binding Effect | A-48 | ||||
| Section 16.4 | Integration | A-48 | ||||
| Section 16.5 | Creditors | A-48 | ||||
| Section 16.6 | Waiver | A-48 | ||||
| Section 16.7 | Counterparts | A-48 | ||||
| Section 16.8 | Applicable Law; Forum, Venue and Jurisdiction | A-49 | ||||
| Section 16.9 | Invalidity of Provisions | A-49 | ||||
| Section 16.10 | Consent of Partners | A-49 | ||||
| Section 16.11 | Facsimile Signatures | A-49 | ||||
| Section 16.12 | Third Party Beneficiaries | A-49 | ||||
A-iv
Table of Contents
PARTNERSHIP OF CVR PARTNERS, LP
A-1
Table of Contents
A-2
Table of Contents
A-3
Table of Contents
A-4
Table of Contents
A-5
Table of Contents
A-6
Table of Contents
A-7
Table of Contents
A-8
Table of Contents
A-9
Table of Contents
A-10
Table of Contents
A-11
Table of Contents
A-12
Table of Contents
A-13
Table of Contents
A-14
Table of Contents
A-15
Table of Contents
A-16
Table of Contents
A-17
Table of Contents
A-18
Table of Contents
A-19
Table of Contents
A-20
Table of Contents
A-21
Table of Contents
A-22
Table of Contents
A-23
Table of Contents
A-24
Table of Contents
A-25
Table of Contents
A-26
Table of Contents
A-27
Table of Contents
A-28
Table of Contents
A-29
Table of Contents
A-30
Table of Contents
A-31
Table of Contents
A-32
Table of Contents
A-33
Table of Contents
A-34
Table of Contents
A-35
Table of Contents
A-36
Table of Contents
A-37
Table of Contents
A-38
Table of Contents
A-39
Table of Contents
A-40
Table of Contents
A-41
Table of Contents
A-42
Table of Contents
A-43
Table of Contents
A-44
Table of Contents
A-45
Table of Contents
A-46
Table of Contents
A-47
Table of Contents
A-48
Table of Contents
A-49
Table of Contents
| By: |
| Title: |
| By: |
| Title: |
Second Amended and Restated Partnership Agreement
of
CVR Partners, LP
A-50
Table of Contents
to the Second Amended and Restated
Agreement of Limited Partnership of
CVR Partners, LP
Representing Limited Partner Interests in
CVR Partners, LP
| No. | Common Units |
A-51
Table of Contents
Dated: | CVR Partners, LP | |
| Countersigned and Registered by: | By: CVR GP LLC | |
| [Transfer Agent], As Transfer Agent and Registrar | By: | |
Name: | ||
Title: | ||
By: | ||
Name: | ||
Title: |
A-52
Table of Contents
| TEN COM — as tenants in common TEN ENT — as tenants by the entireties JT TEN — as joint tenants with right of survivorship and not as tenants in common | UNIF GIFT/TRANSFERS MIN ACT Custodian (Cust) (Minor) Under Uniform Gifts/Transfers to CD Minors Act (State) |
CVR PARTNERS, LP
| (Please print or typewrite name and address of assignee) | (Please insert Social Security or other identifying number of assignee) |
Date: | NOTE: The signature to any endorsement hereon must correspond with the name as written upon the face of this Certificate in every particular. without alteration, enlargement or change. | |
| THE SIGNATURE(S) MUST BE GUARANTEED BY AN ELIGIBLE GUARANTOR INSTITUTION (BANKS, STOCKBROKERS, SAVINGS AND LOAN ASSOCIATIONS AND CREDIT UNIONS WITH MEMBERSHIP IN AN APPROVED SIGNATURE GUARANTEE MEDALLION PROGRAM), PURSUANT TO S.E.C.RULE 17Ad-15 | (Signature) (Signature) |
A-53
Table of Contents
| Acquisition | The acquisition of Predecessor on June 24, 2005 by Coffeyville Acquisition LLC, an entity controlled by the Goldman Sachs Funds and the Kelso Funds at that time. | |
| Blue Johnson | Blue, Johnson & Associates, Inc. | |
| capacity | Capacity is defined as the throughput a process unit is capable of sustaining, either on a calendar or stream day basis. The throughput may be expressed in terms of maximum sustainable, nameplate or economic capacity. The maximum sustainable or nameplate capacities may not be the most economical. The economic capacity is the throughput that generally provides the greatest economic benefit based on considerations such as feedstock costs, product values and downstream unit constraints. | |
| catalyst | A substance that alters, accelerates, or instigates chemical changes, but is neither produced, consumed nor altered in the process. | |
| Coffeyville Acquisition III | Coffeyville Acquisition III LLC, the owner of CVR GP, LLC prior to the Transactions, which is owned by the Goldman Sachs Funds, the Kelso Funds and certain members of CVR Energy’s senior management team. | |
| Coffeyville Resources | Coffeyville Resources, LLC, the subsidiary of CVR Energy which was our sole limited partner prior to this offering and which will directly own our general partner and common units following the Transactions. | |
| corn belt | The primary corn producing region of the United States, which includes Illinois, Indiana, Iowa, Minnesota, Missouri, Nebraska, Ohio and Wisconsin. | |
| CVR Energy | CVR Energy, Inc., a publicly traded company listed on the New York Stock Exchange under the ticker symbol “CVI,” which following this offering will indirectly own our general partner. | |
| ethanol | A clear, colorless, flammable oxygenated hydrocarbon. Ethanol is typically produced chemically from ethylene, or biologically from fermentation of various sugars from carbohydrates found in agricultural crops and cellulosic residues from crops or wood. It is used in the United States as a gasoline octane enhancer and oxygenate. | |
| farm belt | Refers to the states of Illinois, Indiana, Iowa, Kansas, Minnesota, Missouri, Nebraska, North Dakota, Ohio, Oklahoma, South Dakota, Texas and Wisconsin. | |
| feedstocks | Petroleum products, such as crude oil and natural gas liquids, that are processed and blended into refined products, such as gasoline, diesel fuel and jet fuel, that are produced by a refinery. | |
| general partner | CVR GP, LLC, our general partner which, following the Transactions, will be a wholly-owned subsidiary of Coffeyville Resources. |
B-1
Table of Contents
| MMbtu | One million British thermal units: a measure of energy. One Btu of heat is required to raise the temperature of one pound of water one degree Fahrenheit. | |
| the Partnership | We, us and our refer to our business, which is referred to in our financial statements as (1) Predecessor from January 1, 2005 until June 24, 2005 and (2) Successor for all periods thereafter, unless the context otherwise requires or as otherwise indicated. | |
| pet coke | A coal-like substance that is produced during the refining process. | |
| plant gate price | The unit price of fertilizer, in dollars per ton, offered on a delivered basis, and excluding shipment costs. | |
| Predecessor | Coffeyville Resources Nitrogen Fertilizers, LLC, the subsidiary of Coffeyville Group Holdings, LLC that held our business between March 3, 2004 and June 24, 2005. | |
| recordable incident | An injury, as defined by OSHA. All work-related deaths and illnesses, and those work-related injuries which result in loss of consciousness, restriction of work or motion, transfer to another job, or require medical treatment beyond first aid. | |
| slag | A glasslike substance removed from the gasifier containing the metal impurities originally present in pet coke. | |
| slurry | A byproduct of the fluid catalytic cracking process that is sold for further processing or blending with fuel oil. | |
| spot market | A market in which commodities are bought and sold for cash and delivered immediately. | |
| Successor | (1) Coffeyville Resources Nitrogen Fertilizers, LLC from June 24, 2005 through October 23, 2007 and (2) CVR Partners, LP and its consolidated subsidiary, Coffeyville Resources Nitrogen Fertilizers, LLC, on and after October 24, 2007. | |
| syngas | A mixture of gases (largely carbon monoxide and hydrogen) that results from heating coal in the presence of steam. | |
| throughput | The volume processed through a unit or a refinery. | |
| ton | One ton is equal to 2,000 pounds. | |
| turnaround | A periodically required standard procedure to refurbish and maintain a facility that involves the shutdown and inspection of major processing units. | |
| UAN | UAN is an aqueous solution of urea and ammonium nitrate used as a fertilizer. |
B-2
Table of Contents

Table of Contents
Table of Contents
| Item 13. | Other Expenses of Issuance and Distribution. |
| SEC registration fee | $ | 26,929 | ||
| FINRA filing fee | 31,412 | |||
| The New York Stock Exchange listing fee | 200,000 | |||
| Accounting fees and expenses | 500,000 | |||
| Legal fees and expenses | 2,300,000 | |||
| Printing and engraving expenses | 850,000 | |||
| Transfer agent and registrar fees and expenses | 25,000 | |||
| Miscellaneous expenses | 66,659 | |||
| Total | $ | 4,000,000 | ||
| Item 14. | Indemnification of Directors and Officers. |
| Item 15. | Recent Sales of Unregistered Securities. |
II-1
Table of Contents
| Item 16. | Exhibits and Financial Statement Schedules. |
Number | Exhibit Title | |||
| 1 | .1 | Form of Underwriting Agreement. | ||
| 3 | .1 | Form of Amended and Restated Certificate of Limited Partnership of CVR Partners, LP. | ||
| 3 | .2 | Form of Second Amended and Restated Agreement of Limited Partnership of CVR Partners, LP (incorporated by reference to Appendix A to the Prospectus contained within the Registrant’s Registration Statement on Form S-1). | ||
| 3 | .3 | Certificate of Formation of CVR GP, LLC. | ||
| 3 | .4 | Form of Third Amended and Restated Limited Liability Company Agreement of CVR GP, LLC. | ||
| 4 | .1 | Specimen certificate for the common units (incorporated by reference to Appendix A to the Prospectus contained within the Registrant’s Registration Statement on Form S-1). | ||
| 5 | .1 | Opinion of Fried, Frank, Harris, Shriver & Jacobson LLP as to the legality of the securities being registered. | ||
| 8 | .1* | Form of opinion of Vinson & Elkins L.L.P. relating to tax matters. | ||
| 10 | .1 | License Agreement For Use of the Texaco Gasification Process, Texaco Hydrogen Generation Process, and Texaco Gasification Power Systems, dated as of May 30, 1997 by and between Texaco Development Corporation and Farmland Industries, Inc., as amended (certain portions of this exhibit have been omitted pursuant to a request for confidential treatment). | ||
| 10 | .2 | Amended and RestatedOn-Site Product Supply Agreement dated as of June 1, 2005, between Linde, Inc. (f/k/a The BOC Group, Inc.) and Coffeyville Resources Nitrogen Fertilizers, LLC (certain portions of this exhibit have been omitted pursuant to a request for confidential treatment). | ||
| 10 | .2.1 | First Amendment to Amended and Restated On-Site Product Supply Agreement, dated as of October 31, 2008, between Coffeyville Resources Nitrogen Fertilizers, LLC and Linde, Inc. (incorporated by reference to Exhibit 10.3 of the Form 10-Q filed by CVR Energy, Inc. on November 13, 2008). | ||
| 10 | .3 | Amended and Restated Electric Services Agreement dated August 1, 2010, between Coffeyville Resources Nitrogen Fertilizers, LLC and the City of Coffeyville, Kansas (incorporated by reference to Exhibit 10.1 of theForm 8-K filed by CVR Energy, Inc. on August 25, 2010). | ||
| 10 | .4 | Coke Supply Agreement, dated as of October 25, 2007, by and between Coffeyville Resources Refining & Marketing, LLC and Coffeyville Resources Nitrogen Fertilizers, LLC (incorporated by reference to Exhibit 10.5 of theForm 10-Q filed by CVR Energy, Inc. on December 6, 2007). | ||
| 10 | .5 | Form of Amended and Restated Cross Easement Agreement by and between Coffeyville Resources Refining & Marketing, LLC and Coffeyville Resources Nitrogen Fertilizers, LLC. | ||
| 10 | .6 | Environmental Agreement, dated as of October 25, 2007, by and between Coffeyville Resources Refining & Marketing, LLC and Coffeyville Resources Nitrogen Fertilizers, LLC (incorporated by reference to Exhibit 10.7 of theForm 10-Q filed by CVR Energy, Inc. on December 6, 2007). | ||
| 10 | .6.1 | Supplement to Environmental Agreement, dated as of February 15, 2008, by and between Coffeyville Resources Refining and Marketing, LLC and Coffeyville Resources Nitrogen Fertilizers, LLC (incorporated by reference to Exhibit 10.17.1 of the Form 10-K filed by CVR Energy, Inc. on March 28, 2008). | ||
| 10 | .6.2 | Second Supplement to Environmental Agreement, dated as of July 23, 2008, by and between Coffeyville Resources Refining and Marketing, LLC and Coffeyville Resources Nitrogen Fertilizers, LLC (incorporated by reference to Exhibit 10.1 of the Form 10-Q filed by CVR Energy, Inc. on August 14, 2008). | ||
| 10 | .7 | Form of Amended and Restated Feedstock and Shared Services Agreement by and between Coffeyville Resources Refining & Marketing, LLC and Coffeyville Resources Nitrogen Fertilizers, LLC. | ||
| 10 | .8 | Raw Water and Facilities Sharing Agreement, dated as of October 25, 2007, by and between Coffeyville Resources Refining & Marketing, LLC and Coffeyville Resources Nitrogen Fertilizers, LLC (incorporated by reference to Exhibit 10.9 of theForm 10-Q filed by CVR Energy, Inc. on December 6, 2007). | ||
| 10 | .9 | Form of Amended and Restated Services Agreement by and among CVR Partners, LP, CVR GP, LLC, and CVR Energy, Inc. | ||
| 10 | .10 | Form of Amended and Restated Omnibus Agreement by and among CVR Energy, Inc., CVR GP, LLC, and CVR Partners, LP. | ||
II-2
Table of Contents
Number | Exhibit Title | |||
| 10 | .11 | Form of Amended and Restated Registration Rights Agreement by and among CVR Partners, LP and Coffeyville Resources, LLC. | ||
| 10 | .12 | Form of Amended and Restated Contribution, Conveyance and Assumption Agreement, by and among Coffeyville Resources, LLC, CVR GP, LLC, CVR Special GP, LLC, CVR Partners, LP and Coffeyville Acquisition III LLC. | ||
| 10 | .13† | CVR Partners, LP Long-Term Incentive Plan. | ||
| 10 | .13.1† | Form of Director Phantom Unit Agreement | ||
| 10 | .13.2† | Form Director Stock Option Agreement | ||
| 10 | .14* | Form of Credit and Guaranty Agreement among Coffeyville Resources Nitrogen Fertilizers, LLC, CVR Partners, LP, certain subsidiaries of holdings party thereto, lenders party thereto, and Goldman Sachs Lending Partners LLC. | ||
| 10 | .15† | Third Amended and Restated Employment Agreement, dated as of January 1, 2011, by and between CVR Energy, Inc. and Edmund S. Gross. | ||
| 10 | .16† | Third Amended and Restated Employment Agreement, dated as of January 1, 2011, by and between CVR Energy, Inc. and John J. Lipinski. | ||
| 10 | .17† | Second Amended and Restated Employment Agreement, dated as of January 1, 2011, by and between CVR Energy, Inc. and Edward Morgan. | ||
| 10 | .18† | Third Amended and Restated Employment Agreement, dated as of January 1, 2011, by and between CVR Energy, Inc. and Stanley A. Riemann. | ||
| 10 | .19† | Third Amended and Restated Employment Agreement, dated as of January 1, 2011, by and between CVR Energy, Inc. and Kevan A. Vick. | ||
| 10 | .20* | Form of Trademark License Agreement by and among CVR Energy, Inc. and CVR Partners, LP. | ||
| 21 | .1 | List of Subsidiaries of CVR Partners, LP. | ||
| 23 | .1* | Consent of KPMG LLP. | ||
| 23 | .2 | Consent of Fried, Frank, Harris, Shriver & Jacobson LLP (included in Exhibit 5.1). | ||
| 23 | .3* | Consent of Vinson & Elkins L.L.P. (included in Exhibit 8.1). | ||
| 23 | .4 | Consent of Blue, Johnson & Associates, Inc. | ||
| 23 | .5* | Consent of Blue, Johnson & Associates, Inc. | ||
| 23 | .6 | Consent of BNA Subsidiaries, LLC (d/b/a Pike & Fisher). | ||
| 24 | .1 | Power of Attorney. | ||
| * | Included with this filing. |
| † | Denotes management contract or compensatory plan or arrangement. |
| (b) | None. |
| Item 17. | Undertakings. |
II-3
Table of Contents
II-4
Table of Contents
| By: | CVR GP, LLC, its managing general partner |
| By: | /s/ John J. Lipinski |
Chairman of the Board, Chief Executive Officer and
President of CVR GP, LLC
Signature | Title | Date | ||||
/s/ John J. Lipinski John J. Lipinski | Chairman of the Board, Chief Executive Officer and President of CVR GP, LLC (Principal Executive Officer) | March 29, 2011 | ||||
/s/ Edward A. Morgan Edward A. Morgan | Chief Financial Officer and Treasurer of CVR GP, LLC (Principal Financial and Accounting Officer) | March 29, 2011 | ||||
* Donna R. Ecton | Director of CVR GP, LLC | March 29, 2011 | ||||
* Scott L. Lebovitz | Director of CVR GP, LLC | March 29, 2011 | ||||
* George E. Matelich | Director of CVR GP, LLC | March 29, 2011 | ||||
* Frank M. Muller, Jr. | Director of CVR GP, LLC | March 29, 2011 | ||||
* Stanley de J. Osborne | Director of CVR GP, LLC | March 29, 2011 | ||||
* John K. Rowan | Director of CVR GP, LLC | March 29, 2011 | ||||
| *By: | /s/ John J. Lipinski John J. Lipinski As Attorney-in-Fact | |||||
II-5