Investor Presentation September 2012 Exhibit 99.1 |
2 Safe Harbor The following information contains forward-looking statements based on management’s current expectations and beliefs, as well as a number of assumptions concerning future events. These statements are subject to risks, uncertainties, assumptions and other important factors. You are cautioned not to put undue reliance on such forward-looking statements (including forecasts and projections regarding our future performance) because actual results may vary materially from those expressed or implied as a result of various factors, including those noted in the Company’s filings with the Securities and Exchange Commission. CVR Partners, LP assumes no obligation to, and expressly disclaims any obligation to, update or revise any forward-looking statements, whether as a result of new information, future events or otherwise. |
3 Key Strategic Drivers Experienced management team Fully utilized capacity High run time rates Strategically located assets Solid market fundamentals supports future growth • Growth oriented partnership formed by CVR Energy, Inc. in June 2007, with IPO in April 2011 • Manufacturing facility produces ammonia and Urea Ammonium Nitrate (UAN) • Facility located in Coffeyville, Kansas and produces 5% of total UAN demand in United States |
4 Experienced Management |
5 Fully Utilized Capacity & High Run Rates (1) Adjusted for third-party outage. |
Strategically Located Assets • Located in corn belt • 56% of corn planted in 2011 was within $40/UAN ton freight rate of plant • $25/ton transportation advantage to corn belt vs. U.S. Gulf Coast • No intermediate transfer, storage, barge freight or pipeline freight charges 6 |
7 Solid Market Fundamentals Key Demand Drivers |
8 Solid Market Fundamentals Consistent Fertilizer Demand Growth • Nitrogen represents ~63% of fertilizer consumption (1) • Nitrogen based fertilizers have most stable demand because must be applied annually – Primary determinant of crop yield (1) Per the International Fertilizer Industry Association. |
9 Solid Market Fundamentals Farmer Profitability Supports Fertilizer Price • Corn consumes the largest amount of nitrogen fertilizer • Farmers are expected to generate substantial proceeds at currently forecasted corn prices • Farmer incentivized to use nitrogen at corn price much lower than current spot • Nitrogen fertilizer represents small portion of farmer’s total input costs |
10 Solid Market Fundamentals Supply/Demand Supports Increased Planting -4,000 -2,000 0 2,000 4,000 6,000 8,000 10,000 12,000 16,000 2000 2004 2008 2012E 2016E 2020E Production Imports Exports Consumption U.S. Nitrogen Production & Consumption Source: Fertecon. 14,000 0 30 60 90 120 150 180 0 20 40 60 80 100 Planted Yield Yield Trendline U.S. Corn Planted & Yields Source: USDA. |
11 Solid Market Fundamentals UAN Demand & U.S. Imports Country 2007 2008 2009 2010 2011 Trinidad & Tobago 0 0 0 777 1,010 Russia 749 953 658 749 674 Canada 685 487 427 437 617 Romania 472 185 29 254 487 Egypt 176 174 0 123 117 Lithuania 514 431 69 79 489 Ukraine 344 173 0 73 30 Poland 142 123 0 0 0 Estonia 0 13 30 117 92 Netherlands 18 28 0 44 144 Bulgaria 58 58 0 33 21 Germany 55 13 69 30 153 Belarus 96 0 0 0 0 Rest of world 38 3 3 2 29 Total 3,347 2,641 1,285 2,718 3,853 U.S. Imports of UAN (000’s of UAN Tons) U.S. imports for UAN expected to be ~26% of total demand in 2020 Source: USDA. U.S. World 2011 Demand Supply 0 5,000 10,000 15,000 20,000 25,000 U.S. World Source: Fertecon. 2020E UAN Demand/Supply |
12 Growth Strategies Current 12-24 Months 3-5 Years Operational efficiency Plant expansion Specialty products Distribution Mergers and acquisitions Plant development |
13 UAN Expansion Overview – Increase exposure to strong UAN market dynamics – Expand UAN capacity by 330K tons per year (~50%) to ~1MM tons/year – Upgrade 100% of ammonia to UAN – On-line at beginning of 2013 Total cost of $125MM-$130MM – $78MM spent through 06/30/12 Annualized incremental impact – EBITDA: ~$20MM – Available for distribution: ~$0.25/unit UAN Price Premium to Ammonia |
14 Financial Statistics See page 21 for a reconciliation of net income to EBITDA. See page 21 for a reconciliation of net income to EBITDA less maintenance capital. |
15 Solid Start for 2012 YTD 6/30/12 YTD 6/30/11 Change Sales $159.7 $138.1 15.6% EBITDA (1) $78.1 $65.4 19.4% Adjusted EBITDA (2) $82.1 $70.9 15.8% Operating Income $67.5 $56.1 20.3% Distributable Cash Flow (3) $82.0 $29.7 n/a DCF/Unit (3) $1.123 $0.407 n/a $US millions, except per unit data Expect DCF/Unit of $1.65 to $1.85 for 2012 Full Year -- Benefit to 2013 Cash Available for Distribution of ~$0.50/Unit from UAN Expansion and No Turnaround -- (1) See page 21 for a reconciliation of net income to EBITDA. (2) See page 21 for reconciliation of EBITDA to Adjusted EBITDA. (3) Reflects post IPO (April 13 – June 30). |
16 Strong Financial Profile Financial Flexibility to Support Growth Initiatives (US$ in millions) Capitalization As of 6/30/12 Cash & Equivalents $196.4 Credit Facility due April 2016 Term Loan 125.0 $25 million Revolver Total Debt $125.0 Partners' Equity 477.1 Total Capitalization $602.1 LTM EBITDA (1) $168.0 LTM Interest Expense (1) 5.0 Key Credit Statistics Total Debt / LTM EBITDA 0.7x LTM EBITDA / Interest Expense 33.6x Total Debt / Book Cap. 20.8% Liquidity As of 6/30/12 Cash & Equivalents $196.4 $25 million Revolver 25.0 Less: Drawn Amount Less: Letters of Credit Total Liquidity $221.4 (1) See page 21 for a reconciliation of LTM 06/30/12 EBITDA and interest expense . |
17 A Bright Outlook Strong industry fundamentals High-quality & strategically-located assets Premium product focus Attractive growth opportunities Pay out 100% of available cash each quarter No IDR’s Experienced management team |
Appendix |
19 Fertilizer Plant Schematic |
20 Non-GAAP Financial Measures To supplement the actual results in accordance with U.S. generally accepted accounting principles (GAAP), for the applicable periods, the Company also uses certain non-GAAP financial measures as discussed below, which are adjusted for GAAP-based results. The use of non-GAAP adjustments are not in accordance with or an alternative for GAAP. The adjustments are provided to enhance the overall understanding of the Company’s financial performance for the applicable periods and are also indicators that management utilizes for planning and forecasting future periods. The non-GAAP measures utilized by the Company are not necessarily comparable to similarly titled measures of other companies. The Company believes that the presentation of non-GAAP financial measures provides useful information to investors regarding the Company’s financial condition and results of operations because these measures, when used in conjunction with related GAAP financial measures (i) together provide a more comprehensive view of the Company’s core operations and ability to generate cash flow, (ii) provide investors with the financial analytical framework upon which management bases financial and operational planning decisions, and (iii) presents measurements that investors and rating agencies have indicated to management are useful to them in assessing the Company and its results of operations. |
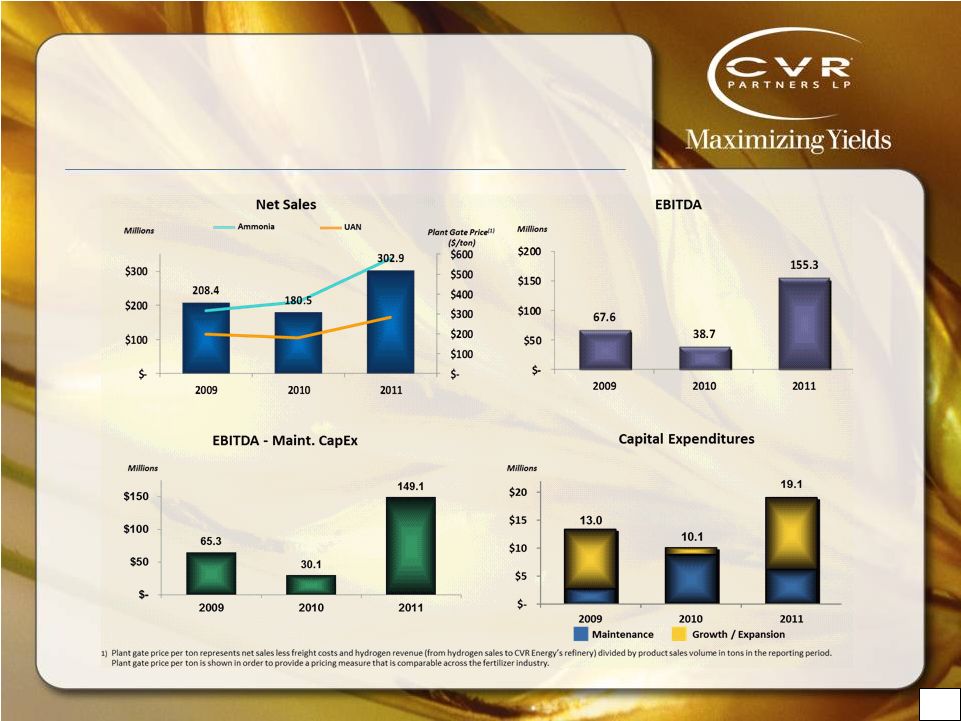
21 Non-GAAP Reconciliation EBITDA: Represents net income before the effect of interest expense, interest income, income tax expense (benefit) and depreciation and amortization. EBITDA is not a calculation based upon GAAP; however, the amounts included in EBITDA are derived from amounts included in the consolidated statement of operations of the Company. See below for reconciliation of net income to EBITDA, EBITDA to Adjusted EBITDA, & EBITDA less maintenance capital See below for reconciliation of net income to EBITDA & EBITDA to Adjusted EBITDA Adjusted EBITDA: Represents EBITDA adjusted for the impact of share-based compensation, and, where applicable, major scheduled turnaround expense and loss on disposition of assets. We present Adjusted EBITDA because it is a key measure used in material covenants in our credit facility. Adjusted EBITDA is not a recognized term under GAAP and should not be substituted for net income as a measure of our liquidity. Management believes that Adjusted EBITDA enables investors and analysts to better understand our liquidity and our compliance with the covenants contained in our credit facility. See below for reconciliation of LTM 06/30/12 EBITDA & Interest Expense (in $US millions) For the Fiscal Years 2009 2010 2011 Net income 57.9 $ 33.3 $ 132.4 $ Interest expense - - 4.0 Interest (income) (9.0) (13.1) - Depreciation and amortization 18.7 18.5 18.9 Income tax expense - - - EBITDA $ 67.6 $ Loss on disposition of assets - 1.4 - Turnaround - 3.5 - Share-based compensation 3.2 9.0 7.3 Adjusted EBITDA 70.8 $ 52.6 $ 162.6 $ EBITDA 67.6 $ 38.7 $ 155.3 $ Maintenance capital 2.3 8.6 6.2 EBITDA less maintenance capital 65.3 $ 30.1 $ 149.1 $ 155.3 (in $US millions) Interest EBITDA Expense 6 months ended 6/30/12 78.1 $ 2.2 $ 12 months ended 12/31/11 155.3 4.0 Less: 6 months ended 6/30/11 65.4 1.2 LTM 06/30/12 168.0 $ 5.0 $ $ 38.7 (in $US millions) 2011 2012 Net income 54.9 $ 65.3 $ Interest expense, net 1.2 2.2 Interest (income) - (0.1) Depreciation and amortization 9.3 10.6 Income tax expense - 0.1 EBITDA 65.4 $ $ 78.1 Share-based compensation 5.5 4.0 Adjusted EBITDA 70.9 $ 82.1 $ Six Months Ended June 30, |