 Corporate Presentation September 2013 NASDAQ: RSOL SERVING SOLAR SINCE 1978 Exhibit 99.1 |
 This presentation includes forward-looking statements relating to matters that are not historical facts. Forward-looking statements may be identified by the use of words such as "expect," "intend," "believe," "will," "should" or comparable terminology or by discussions of strategy. While Real Goods Solar believes its assumptions and expectations underlying forward-looking statements are reasonable, there can be no assurance that actual results will not be materially different. Risks and uncertainties that could cause materially different results include, among others, receiving shareholder approval for the merger with Mercury Energy, Inc., successfully closing the merger and other acquisitions, realizing synergies and other benefits from the merger and other acquisitions, introduction of new products and services, the possibility of negative economic conditions, and other risks and uncertainties included in Real Goods Solar’s filings with the Securities and Exchange Commission. Real Goods Solar assumes no duty to update any forward-looking statements. © 2013 Real Goods Solar. All Rights Reserved. Important Cautions Regarding Forward Looking Statements 2 SERVING SOLAR SINCE 1978 NASDAQ:RSOL |
 SERVING SOLAR SINCE 1978 Key Stats: RSOL (NASDAQ) 3 Stock Price (9/5/2013) $2.00 52 Week Low-High $0.40 - $7.17 Avg. Daily Vol. (3 mo.) 1,974,610 Shares Outstanding 1 30.2M Public Float, est. 18.3M Insider Holdings ~26% Institutional Holdings ~35% Market Cap $60.5M Enterprise Value $60.3M EV/Revenue (ttm) 0.7x Net Revenue (ttm) $90.6M EPS (ttm) $(1.84) Cash (mrq) $6.9M Total Assets (mrq) $29.8M Total Debt (mrq) $6.8M Total Liabilities (mrq) $27.9M Employees ~385 Data source: S&P Capital IQ (ttm) – trailing twelve months as of Jun. 30, 2013 (mrq) – most recent quarter as of Jun. 30, 2013 1) Shares outstanding as of August 8, 2013 NASDAQ:RSOL |
 NASDAQ:RSOL SERVING SOLAR SINCE 1978 Who We Are Real Goods Solar is one of the nation’s largest and pioneering solar energy providers and first public pure-play We’ve installed well over 100 MW of solar systems corresponding to 15,500+ residential, commercial, government, and utility installations nationwide We offer a comprehensive end-to-end solution for our customers to reduce their utility costs while also reducing their carbon footprint Significant investments and process improvements in the past 18 months have created a highly scalable business model with additional opportunity for margin capture 4 |
 Longstanding Commitment to the Sector and Deep Knowledge of Solar *Currently in 13 edition with over 500,000 sold. 1978 Real Goods Solar Trading Company opens first store; sold the first solar panels in retail at over $100/W 1982 First Solar Living Source Book printed* 1986 Launched mail order catalog (95% customers off grid) 1991 Public offering directly to customers 1992 Launched National Tour of solar homes 1996 Opened Solar Living Center 2001 Merged with Gaiam 2003 Launched residential division 2008 IPO 2008 – 2009 Acquired Marin Solar, Carlson Solar, Independent Energy Systems, Regrid Power 2011 Acquired Alteris – became a major national residential and commercial solar company 2012 Mid 2012, new CEO hired to address key challenges post Alteris and to restore profitability and growth 2013 Company surpassed 15,500 installations corresponding to well over 100MW of solar energy deployed since inception August 2013 Completed Acquisition of assets of Syndicated Solar and announced agreement to acquire Mercury Energy 5 th NASDAQ:RSOL SERVING SOLAR SINCE 1978 |
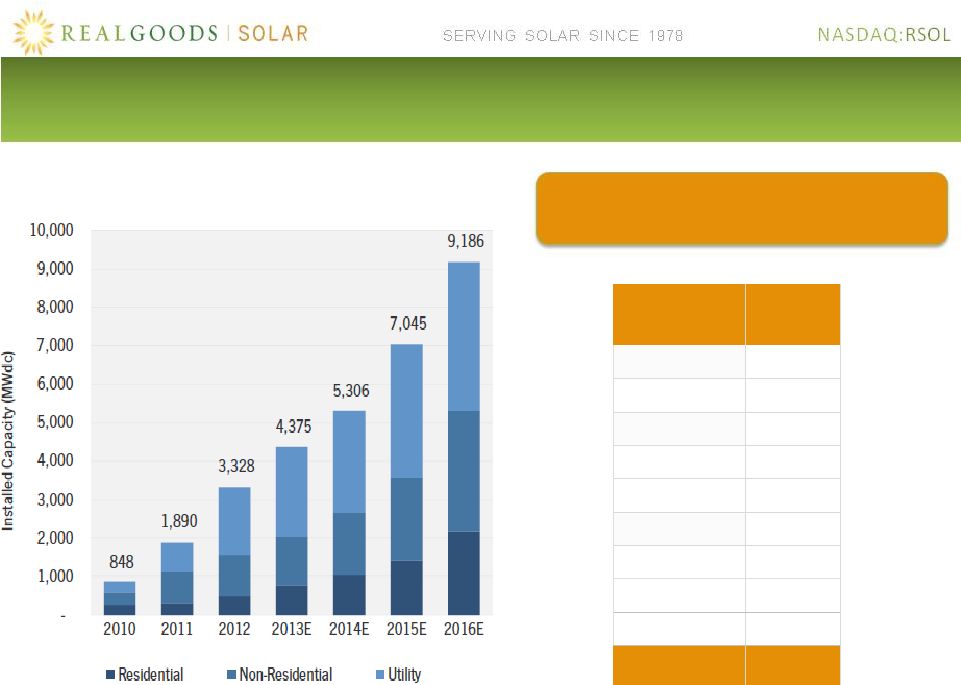
 SERVING SOLAR SINCE 1978 Solar represents an unlimited supply of renewable energy Solar has now become an attractive investment Not dependent on new construction Strong state and federal mandates Equipment costs trending lower while technology is improving Solar per kWh cost approaching or at grid parity in key states (even with decreasing incentives), as utility rates rise Broader availability of consumer financing Solar industry to see investment of $800 billion to $1.2 trillion over next decade ¹ Bright Future for Solar Power Bright Future for Solar Power 6 Strong Outlook for Growth in Solar Power (U.S., in Giga Watts - GW) 2 NASDAQ:RSOL SERVING SOLAR SINCE 1978 1. Source Enerdata; McKinsey Global Solar Initiative 2. Source: http://www.seia.org/ - U.S. Solar Market Insight: Year-in-review 2012 Report – Solar Energy Industries Association (SEIA) and GTM Research |
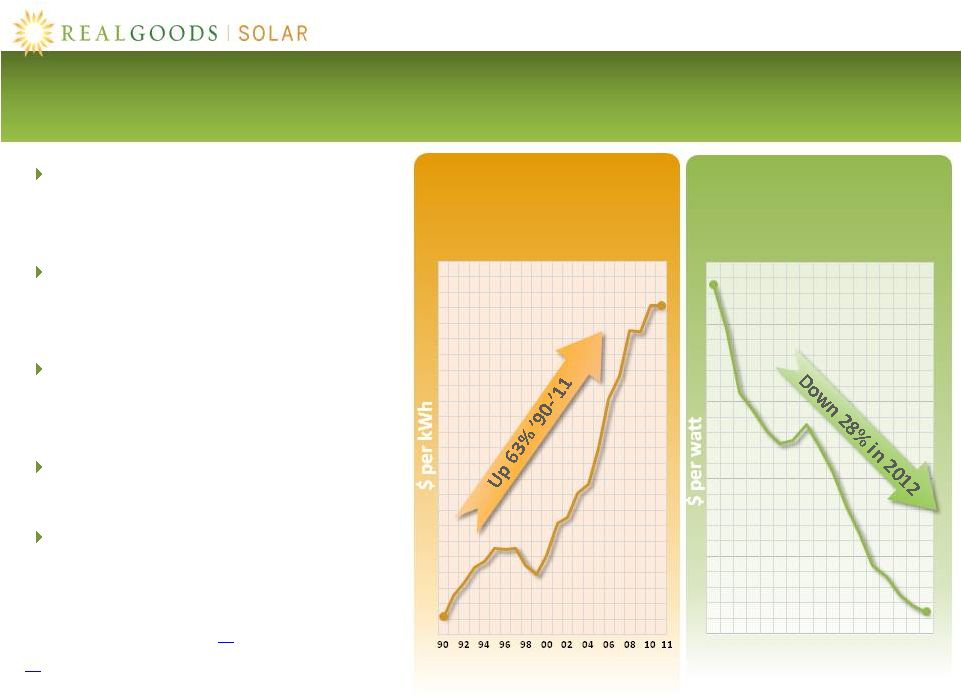 Utility rates rising in key Solar states: average cost per kWh up ~63% to ~$0.13 from 1990 to 2011 High utility rates in key solar States: average cost per kWh ranging from $0.12-$0.33 in June 2013 Solar significantly reduces short and long-term customer utility costs with ROI as high as 30%+ Price of solar-PV modules expected to drop 10% annually until 2020 Solar equipment manufacturing capacity expected to double over the next 3-5 years Key Market Drivers: Rising Electric Bills & Declining Solar-PV Module Prices 1) Energy Information Administration (EIA), historical data for CA, CO, NJ, NY & VT. Released Oct. 1, 2012. Next update Sept. 2013. 2) EIA Electricity Monthly Update, data for CA, MI, NY, DC, MD, NJ, CT, RI, MA, NH, VT Released Aug. 22, 2013. Next update: Sept. 23, 2013. 3) McKinsey Report: Solar Power: Darkest before dawn. April 2012. 7 Source: US Energy Information Administration SERVING SOLAR SINCE 1978 Average Electric Utility Rates in Key Solar States Keep Rising…. …While Falling U.S. Solar-PV Module Prices Makes Solar More Affordable $0.13 $2.76 $0.64 $0.08 Q1-09 Q1-10 Q1-11 Q1-12 Q1-13 1 2 3 NASDAQ:RSOL Source: GTM Research and U.S. Solar Market Insight 3 |
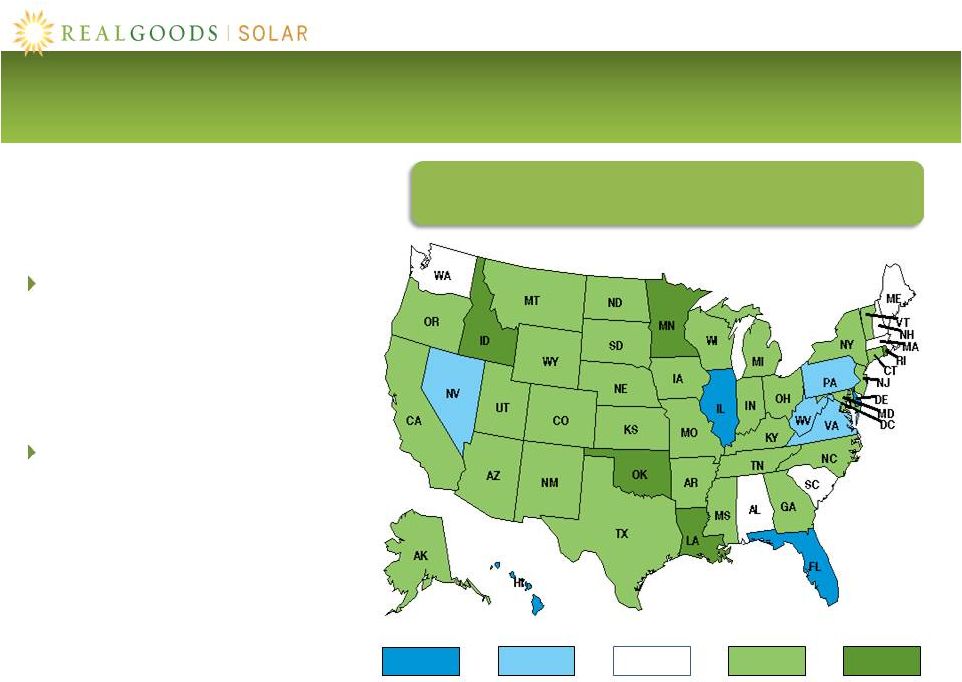 SERVING SOLAR SINCE 1978 NASDAQ:RSOL June 2013 vs. June 2012: Cost of Electricity Rising in Key U.S. Solar States 8 Source: Energy Information Administration, Electricity Monthly Update. Released Aug. 22, 2013. Next update: Sept. 23, 2013. Average electricity costs across the U.S. increased 3.2% to 10.47 cents per kWh 25 States saw average electricity costs increase by more than 3% -9% - -3% -3% - -1% 1% - 9% 9% - 30% -1% - 1% U.S. Electric Industry Percent Change in Average Cents per kWh, June 2013 vs. June 2012 |
 We Offer Solutions Across Multiple Market Segments 9 More than 15,500 Installations Nationwide – More than 100MW Real Goods Solar Utility Commercial Residential NASDAQ:RSOL SERVING SOLAR SINCE 1978 |
 Alteris Renewables Acquisition of Alteris in Late 2011 Created a Strong National Player with a Balanced Portfolio 10 SERVING SOLAR SINCE 1978 Northeast based 4,000+ installs 25+ MW Primarily commercial Very strong presence in the education sector Acquisition successfully integrated by late 2012 NASDAQ:RSOL |
 Marquee Customers 11 In addition to a strong residential track record, we have successfully provided solar solutions to many key commercial customers across the country such as… NASDAQ:RSOL SERVING SOLAR SINCE 1978 |
 On Track for Record Top & Bottom Line Growth in 2013 12 ($ millions) 1) Guidance issued and only effective on 9/9/2013 Estimated revenue of $115-120 million for 2013, excluding Mercury Pro forma 2013 revenue, with Mercury of $132-137 million $115-$120 $132-$137 2012 was a challenging year as we completed the integration of Alteris and addressed key organizational issues We expect to be EBITDA positive for the second half of 2013 and achieve profitability in Q4 NASDAQ:RSOL $12.1 $16.8 $18.9 $39.2 $64.3 $77.3 $109.3 $92.9 SERVING SOLAR SINCE 1978 |
 We Have Made Foundational Improvements to the Business in the Past 12 months Setting the Stage for the Next Leg of Our Journey 13 New management quickly established and drove three corporate-wide priorities • Getting back on our historical growth performance and trajectory • Investing in project development and sales talent and capabilities • We increased commercial backlog by 91% at the end of Q2 2013 compared to the end of Q4 2012 • Improving cash flow and liquidity • Much more disciplined management of working capital • Aggressive focus on lead-time reduction from origination to conversion • Strengthened the balance sheet with net proceeds of $8.4 million from private placement of equity securities in June 2013; Q2 2013 ended and we expect Q3 2013 to end with zero drawn against our $6.5 million line of credit • Reducing operating expenses and improving productivity • Improved key business processes in sales and operations • Eliminated resource redundancies and flattened the management structure • On a run-rate basis, we will exit Q3 2013 at $2 million lower opex than Q3 2012 while having grown the business (over $8 million of annualized opex reduction) Successfully completed the integration of Alteris and added top-notch management talent in key areas NASDAQ:RSOL SERVING SOLAR SINCE 1978 |
 14 Source: GTM Research and SEIA, Q1 USSMI Report State California 6 Colorado HQ +2 Connecticut 2 Missouri 1 New Jersey 1 New York 1 Rhode Island 1 Vermont 1 1 Total 17 US PV Installations Office Locations Massachusetts • 17 offices in key solar states • Installations in more than 30 states We Are now Ready to Better Capture the Growth Runway with a Stronger Foundation and Footprint |
 We Offer Our Customers a Comprehensive End-to-End Solution 15 Benefits of being a full turnkey solar provider Real Goods Solar operates as a turnkey solar solution provider in addition to its extensive ‘EPC’ (Engineering, Procurement and Construction) capabilities. • Single point of contact simplifies communication for the customers • Ensures quality and reduces risks • Project costs are well-defined and tightly-managed • Improved customer experience and confidence Origination Engineering Construction Operations/ Maintenance Performance Site evaluation Financing arrangements • Contracting • Engineering Specification • Custom Design • Incentive Processing • Product Selection • Permitting • Construction • Utility Integration • System Commissioning • Site Monitoring • Preventative Maintenance • Warranty Management • Customer & Partner Integration • Production Guarantee • Optimize ROI • • NASDAQ:RSOL SERVING SOLAR SINCE 1978 |
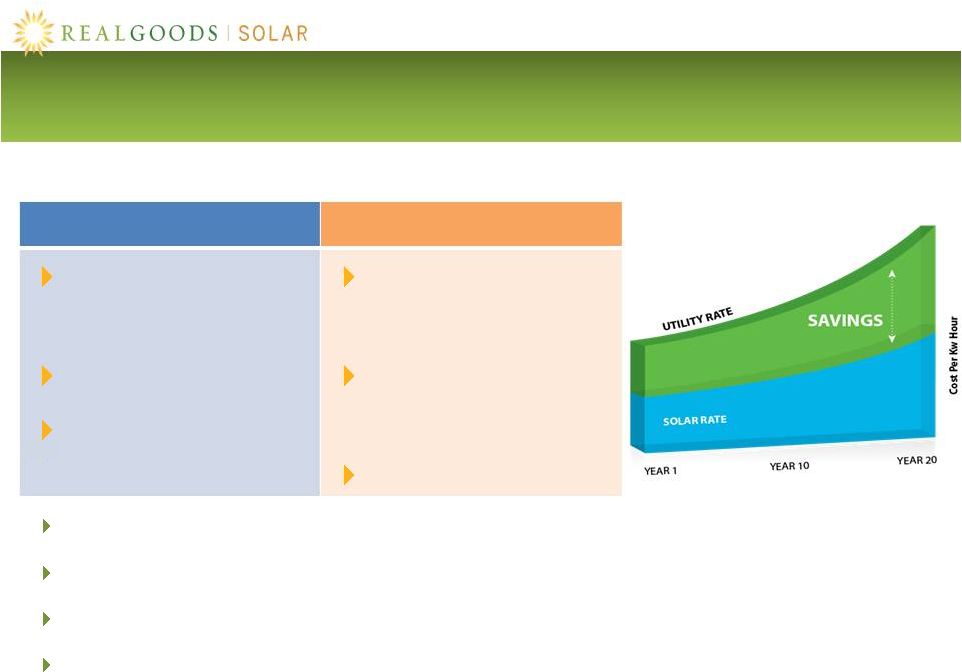 The Economics are Compelling with Purchase or The Economics are Compelling with Purchase or Lease of Solar Energy Systems Lease of Solar Energy Systems 16 Purchase Lease Typical Payback in seven years or less in many geographies Minimal risk No money down Power Purchase Agreement Fixed cost of electricity for life of system Immediate savings Investment in solar provides a natural hedge against rising energy prices Monetize solar rebates and tax incentives: 30% Renewable Energy Tax Credit Customers typically make purchase decisions based on reducing monthly utility bill Corporate programs to reduce carbon footprint are also emerging as strong enablers NASDAQ:RSOL SERVING SOLAR SINCE 1978 ROI as good as 20%-30% |
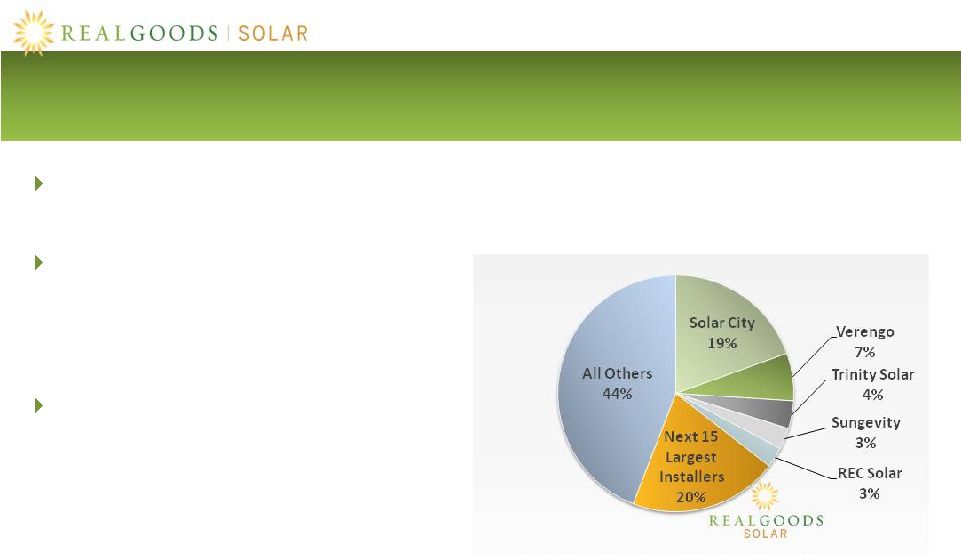 Industry is still immature and very fragmented Most players in the downstream have limited financial strength and with no real value creation option Real Goods Solar has the platform to pursue highly selective acquisitions to strategically accelerate growth and to increase the overall depth, breadth, and performance of the company In Addition to Organic Growth, Selective Acquisition will be a Strong Source of Value Creation 17 Real Goods Solar a leading installer among more than 2,000 nationwide ¹ Source: GTM Research “Five Residential PV Installers to Watch in 2013, U.S. PV Leaderboard.” 1) Company estimate. NASDAQ:RSOL SERVING SOLAR SINCE 1978 U.S. Residential Solar Installers 2012 Market Share |
 Acquisition of Syndicated Solar Strengthens Residential Division 18 18 NASDAQ:RSOL SERVING SOLAR SINCE 1978 Syndicated Solar Expanded footprint to Missouri and enhanced presence in Colorado and California Added 40+ employees mostly in the front-end Rapid growth over past few years through: • Efficient residential sales processes • Highly scalable and nimble business model • Integrated software tools Revenue up 192% from $2.5 million in 2011 to $7.3 million in 2012 |
 Mercury Solar Systems Based in Port Chester, New York, one of the region’s top solar companies Adds sales and operational talent and complementary geographies Commercial and residential customers across Northeast, totaling nearly 2,000 solar installations • Installed 50+ MWs of solar projects that have cumulatively generated $250+ million in revenues Signed definitive agreement to acquire Mercury for 7.9 million shares of consideration subject to certain customary adjustments Upon closing, Mercury will add 50+ employees and ~$10 million of cash and no debt Expected Mercury Solar Systems Acquisition to Expand Northeast Commercial & Residential Capabilities 19 3,588kW - Manalapan, NY 1,288 kW - Robbinsville, NJ NASDAQ:RSOL SERVING SOLAR SINCE 1978 |
 35-year Track Record: Longer than any other major player Substantial market Depth and Breadth: strong residential and commercial capabilities with deep knowledge of key verticals Highly Integrated: end-to-end capabilities all the way from lead generation and project development to design, construction, commissioning, and O&M Nationwide Presence: able to deliver cost-effective solar solutions to homeowners and businesses in multiple states Low Risk Business Model: broad geographic spread and diversified client base (across different segments and geographical markets) Strong Consumer Brand: well recognized, opens doors Opportunity for Margin Expansion: SG&A productivity and project finance Leadership Depth and Talent: senior team with a proven track record High Potential for Investor Value Creation: through organic growth and through selective acquisitions and against a backdrop of highly undervalued stock compared to peers Our Competitive Advantages and Key Takeaways 20 NASDAQ:RSOL SERVING SOLAR SINCE 1978 |
 Contact Us NASDAQ: RSOL RealGoodsSolar.com Real Goods Solar, Inc. 833 West South Boulder Road Louisville, CO 80027 Tel 303.222.8400 Kam Mofid, CEO Tony DiPaolo, CFO Investor Relations Liolios Group, Inc. Ron Both Tel 949.574.3860 RSOL@liolios.com 21 SERVING SOLAR SINCE 1978 NASDAQ:RSOL |
 Appendix 22 SERVING SOLAR SINCE 1978 NASDAQ:RSOL |
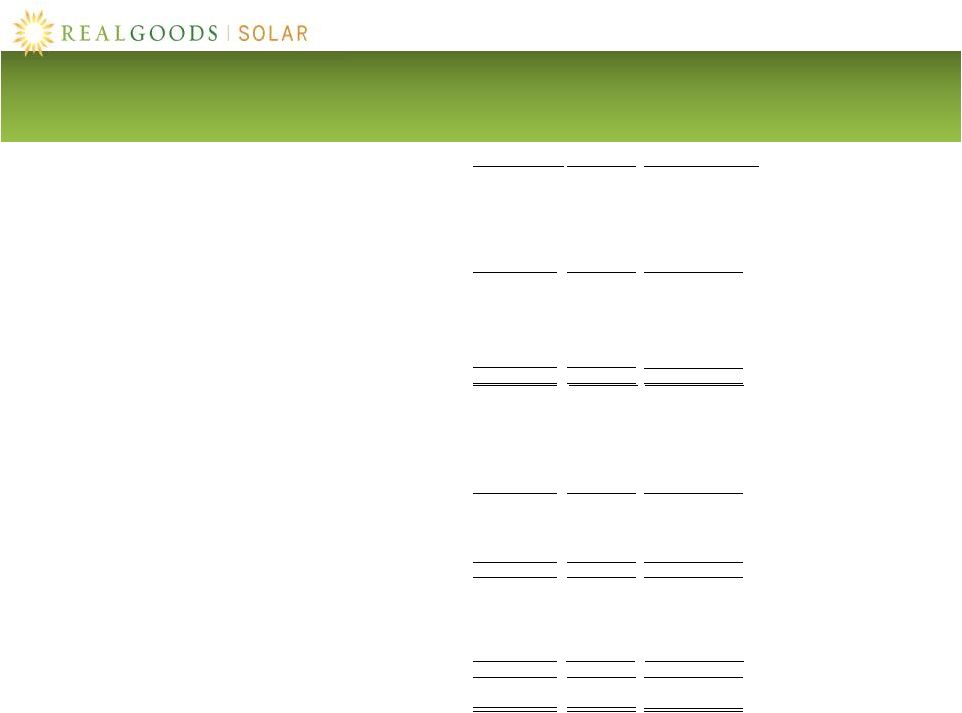
 NASDAQ:RSOL SERVING SOLAR SINCE 1978 Pro Forma Income Statement June 30, 2013 23 June 30, 2013 - 6 months ended Real Goods Solar Mercury Pro Forma Combined Revenue 37,458 7,677 45,135 Cost of revenue 28,099 5,592 33,691 Gross Profit 9,359 2,085 11,444 Selling and operating 12,317 2,834 14,902 General and administrative 3,579 748 4,327 Total operating expenses 15,896 3,582 19,229 Loss from operations (6,537) (1,497) (7,785) Interest and other expense 164 5 169 Earnings (loss) before income taxes (6,701) (1,502) (7,954) Income tax expense (benefit) - - - Net earnings (loss) (6,701) (1,502) (7,954) Net earnings (loss) per common share Basic (0.25) (0.23) Diluted (0.25) (0.23) Weighted-average common shares outstanding Basic 27,253 35,153 Diluted 27,253 35,153 |
 Pro Forma Balance Sheet June 30, 2013 24 Costs in excess of billings on uncompleted contracts Billings in excess of costs on uncompleted contracts Real Goods Solar Mercury Pro Forma Combined Assets Current assets Cash and cash equivalents 6,859 11,507 17,416 Accounts receivable , net 10,194 979 11,173 2,749 1,386 4,135 Inventory, net 4,697 1,154 5,851 Other current assets 1,710 1,194 2,904 Total current assets 26,209 16,220 41,479 Property and Equipment 3,596 695 4,291 Goodwill and intangibles, net - 3,681 9,262 Notes receivable, net - 160 160 Deferred tax assets - 4,163 - Other assets - 125 125 Total assets 29,805 25,044 55,317 Liabilities and Stockholders' Equity Current Liabilities Accounts payable 10,183 3,199 13,382 Accrued liabilities 3,315 1,250 4,565 2,474 479 2,953 Related party debt 3,600 - 3,600 Other current liabilities 776 421 1,197 Total current liabilities 20,348 5,349 25,697 Related party debt 3,150 - 3,150 Common stock warrant liability 3,702 - 3,702 Other liabilities 696 3,676 696 Total liabilities 27,896 9,025 33,245 Stockholders' equity Common stock 3 22 11 Preferred stock - 14,219 - Additional paid in capital 86,870 27,009 107,975 Accumulated deficit (84,964) (25,231) (85,914) Total stockholders' equity 1,909 16,019 22,072 Total liabilities and stockholders' equity 29,805 25,044 55,317 NASDAQ:RSOL SERVING SOLAR SINCE 1978 |
 SERVING SOLAR SINCE 1978 Additional Information About the Pending Acquisition of Mercury Energy, Inc. Important Disclosure 25 NASDAQ:RSOL This communication does not constitute an offer to sell or the solicitation of an offer to buy any securities or a solicitation of any vote or approval. The transaction described herein will be submitted to the shareholders of each of Real Goods Solar and Mercury for approval. Real Goods Solar has filed with the Securities and Exchange Commission a registration statement on Form S-4 containing a joint proxy statement/prospectus of Real Goods Solar and Mercury as well as other relevant documents in connection with the transaction. SHAREHOLDERS ARE URGED TO READ IN THEIR ENTIRETY THE REGISTRATION STATEMENT AND JOINT PROXY STATEMENT/PROSPECTUS WHEN THEY BECOME AVAILABLE, AND ANY OTHER RELEVANT DOCUMENTS FILED WITH THE SECURITIES AND EXCHANGE COMMISSION, AS WELL AS ANY AMENDMENTS OR SUPPLEMENTS TO THOSE DOCUMENTS, BECAUSE THEY WILL CONTAIN IMPORTANT INFORMATION ABOUT REAL GOODS SOLAR, MERCURY AND THE PROPOSED TRANSACTION. A free copy of the registration statement and joint proxy statement/prospectus as well as other filings containing information about Real Goods Solar and Mercury, may be obtained at the SEC’s website (www.sec.gov). These documents may also be obtained, free of charge, from the investor relations section of Real Goods Solar’s website (www.RealGoodsSolar.com) or by directing a request to 833 W. South Boulder Road, Louisville, Colorado 80027, Attention: Secretary, Real Goods Solar, Inc., heidi.french@realgoods.com or (303) 222-8430. Real Goods Solar and its directors and executive officers may be deemed to be participants in the solicitation of proxies from the shareholders of Real Goods Solar in connection with the transaction. Information about Real Goods Solar’s directors and executive officers is set forth in Real Goods Solar’s Amendment No. 1 to Annual Report on Form 10-K/A for the year ended December 31, 2012, as filed with the Securities and Exchange Commission on April 30, 2013. Additional information regarding the interests of those participants and other persons who may be deemed participants in the transaction may be obtained by reading the joint proxy statement/prospectus regarding the transaction when it becomes available. Free copies of these documents may be obtained as described above. This document shall not constitute an offer to sell or the solicitation of an offer to buy or subscribe for any securities, nor shall there be any sale of securities in any jurisdiction in which such offer, solicitation or sale would be unlawful prior to registration or qualification under the securities laws of any such jurisdiction. No offering of securities shall be made except by means of a prospectus meeting the requirements of Section 10 of the U.S. Securities Act of 1933, as amended. |