Exhibit 99.1
Exhibit 99.1
A Foundation Built for Opportunity
The Highly Anticipated NYSE Listing of a Market Leading Net Lease REIT (Ticker “COLE”)
June 4, 2013
Disclosures
Tender Offer
This presentation is for informational purposes only and is not an offer to buy or the solicitation of an offer to sell any securities of Cole Real Estate Investments, Inc. (“Cole”). The tender offer will be made only pursuant to an offer to purchase, letter of transmittal and related materials that Cole intends to distribute to its stockholders and file with the U.S. Securities and Exchange Commission (“SEC”). The full details of the tender offer, including complete instructions on how to tender stock, will be included in the offer to purchase, the letter of transmittal and other related material that Cole will distribute to stockholders and file with the SEC upon commencement of the tender offer. Stockholders are urged to carefully read the offer to purchase, the letter of transmittal and other related materials when they become available because they will contain important information, including the terms and conditions of the tender offer. Stockholders may obtain free copies of the offer to purchase, the letter of transmittal and other related materials that Cole files with the SEC at the SEC’s website at: http://www.sec.gov or by calling the information agent for the contemplated tender offer, who will be identified in the materials filed with the SEC at the commencement of the tender offer. In addition, copies of the documents filed by Cole with the SEC will be available free of charge by directing a written request to Cole Real Estate Investments, 2325 East Camelback Road, Suite 1100, Phoenix, Arizona 85016, Attention: Investor Relations.
Tenants, Trademarks and Logos
Thepropertiespicturedhavebeen acquiredbyCole. Corporatetenants may also occupy numerous properties that are not owned by Cole or Cole?sponsored programs. Cole is not affiliated or associated with, is not endorsed by, does not endorse, and is not sponsored by or a sponsor of the tenants or the joint venture partners shown, or of their products or services pictured or mentioned. The names, logos and all related product and service names, design marks and slogans are the trademarks or service marks of their respective companies.
© 2013 Cole Real Estate Investments, Inc. All Rights Reserved.

Forward-Looking Statements
In addition to historical information, this presentation contains forward?looking statements within the meaning of Section 27A of the Securities Act of 1933, as amended, and Section 21E of the Securities Exchange Act of 1934, as amended. These forward?looking statements, which are based on current expectations, estimates and projections about the industry and markets in which Cole operates, include beliefs of and assumptions made by Cole’s management, and involve risks and uncertainties that could significantly affect the financial results of Cole. Words such as “may,” “expects,” “anticipates,” “intends,” “plans,” “believes,” “projects,” “seeks,” “estimates,” “would,” “could” and “should” and variations of such words and similar expressions are intended to identify such forward?looking statements, which generally are not historical in nature. Such forward?looking statements include, but are not limited to, statements about the benefits of the business combination transaction that led to the creation of Cole, future financial and operating results, and the company’s plans, objectives, expectations and intentions. All statements that address operating performance, events or developments that we expect or anticipate will occur in the future — including statements relating to earnings accretion, cost savings, an anticipated NYSE listing and increased liquidity — are forward?looking statements. These statements are not guarantees of future performance and involve certain risks, uncertainties and assumptions that are difficult to predict. Although we believe the expectations reflected in any forward?looking statements are based on reasonable assumptions, we can give no assurance that our expectations will be attained and therefore, actual outcomes and results may differ materially from what is expressed or forecasted in such forward?looking statements. Some of the factors that may affect outcomes and results include, but are not limited to: (i) national, international, regional and local economic climates, (ii) changes in financial markets, interest rates, credit spreads, and foreign currency exchange rates, (iii) changes in the real estate markets, (iv) continued ability to source new investments, (v) increased or unanticipated competition for our properties, (vi) risks associated with acquisitions, (vii) maintenance of real estate investment trust status, (viii) availability of financing and capital, (ix) changesindemandfor developedproperties, and(x) those additional risks and factors discussed in reports filed by Cole with the SEC from time to time. Cole does not make any undertaking with respect to updating any forward?looking statements appearing in this presentation.
© 2013 Cole Real Estate Investments, Inc. All Rights Reserved.
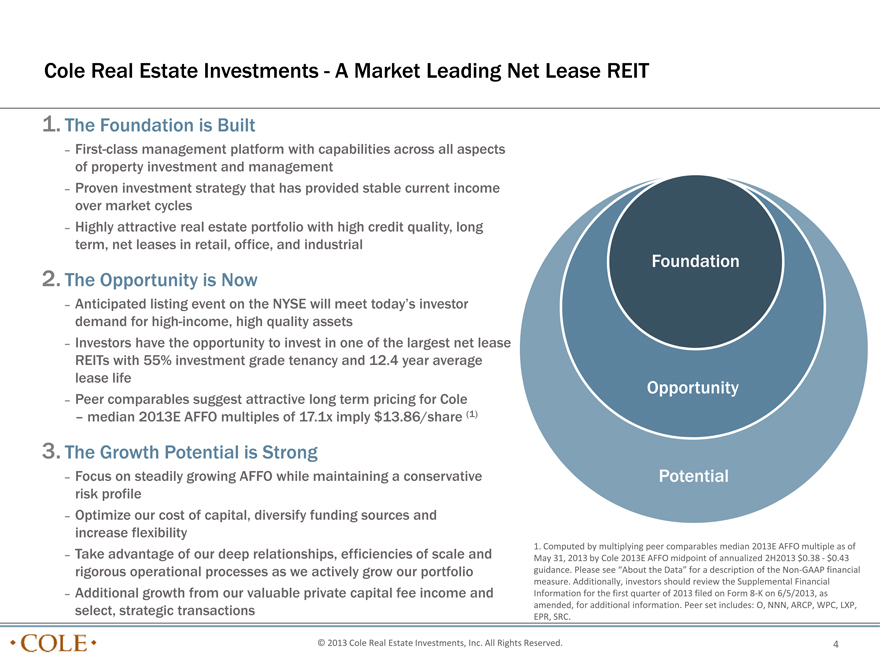
Cole Real Estate Investments - A Market Leading Net Lease REIT
1. The Foundation is Built
– First-class management platform with capabilities across all aspects of property investment and management
– Proven investment strategy that has provided stable current income over market cycles
– Highly attractive real estate portfolio with high credit quality, long term, net leases in retail, office, and industrial
2. The Opportunity is Now
– Anticipated listing event on the NYSE will meet today’s investor demand for high-income, high quality assets
– Investors have the opportunity to invest in one of the largest net lease REITs with 55% investment grade tenancy and 12.4 year average lease life
– Peer comparables suggest attractive long term pricing for Cole – median 2013E AFFO multiples of 17.1x imply $13.86/share (1)
3. The Growth Potential is Strong
– Focus on steadily growing AFFO while maintaining a conservative risk profile
– Optimize our cost of capital, diversify funding sources and increase flexibility
– Take advantage of our deep relationships, efficiencies of scale and rigorous operational processes as we actively grow our portfolio
– Additional growth from our valuable private capital fee income and select, strategic transactions
Foundation
1. Computed by multiplying peer Opportunity comparables median 2013E AFFO multiple as of May 31, 2013 by Cole 2013E AFFO midpoint of annualized 2H2013 $0.38 - $0.43 guidance. Please see “About the Data” for a description of the Non-GAAP financial measure. Additionally, investors should review the Supplemental Financial Information for the first quarter of 2013 filed on Form 8-K on 6/5/2013, as amended, for additional information. Peer set includes: O, NNN, ARCP, WPC, LXP, EPR, SRC.
© 2013 Cole Real Estate Investments, Inc. All Rights Reserved. 4
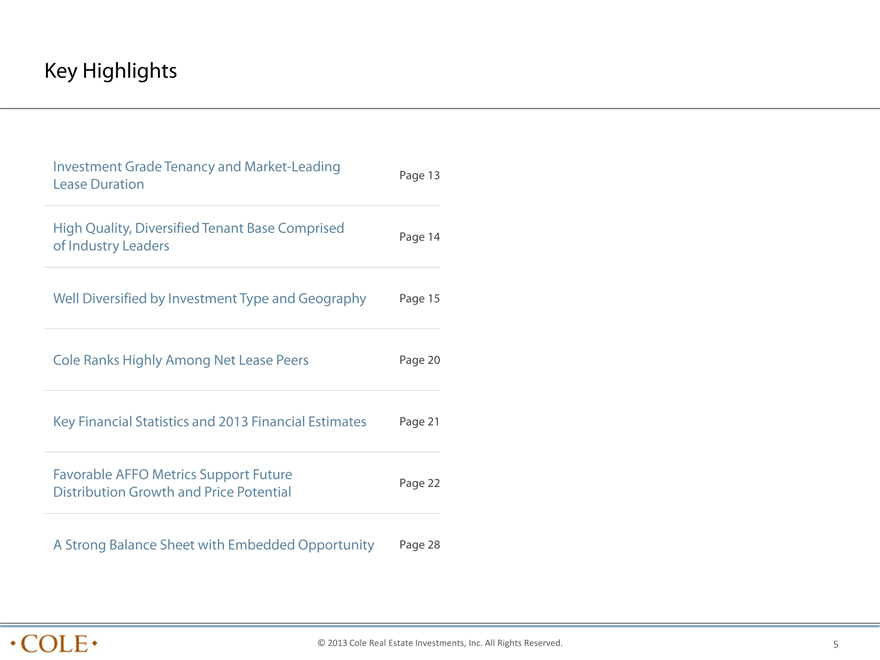
Key Highlights
Investment Grade Tenancy and Market-Leading
Page 13
Lease Duration
High Quality, Diversified Tenant Base Comprised
Page 14 of Industry Leaders
Well Diversified by Investment Type and Geography Page 15 Cole Ranks Highly Among Net Lease Peers Page 20 Key Financial Statistics and 2013 Financial Estimates Page 21
Favorable AFFO Metrics Support Future
Page 22
Distribution Growth and Price Potential
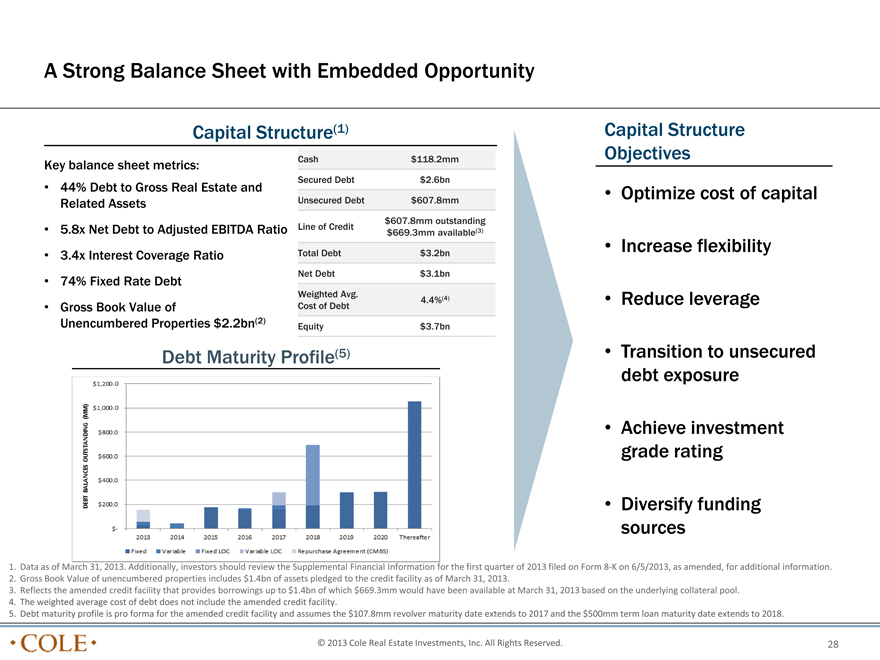
A Strong Balance Sheet with Embedded Opportunity Page 28
© 2013 Cole Real Estate Investments, Inc. All Rights Reserved.
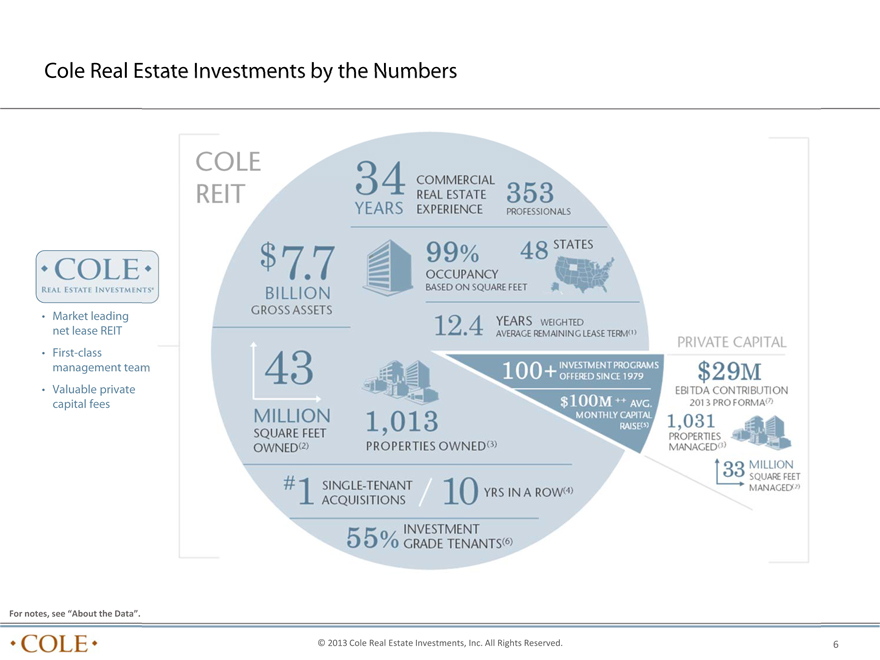
Cole Real Estate Investments by the Numbers
• Market leading net lease REIT
• First-class management team
• Valuable private capital fees
For notes, see “About the Data”.
© 2013 Cole Real Estate Investments, Inc. All Rights Reserved. 6
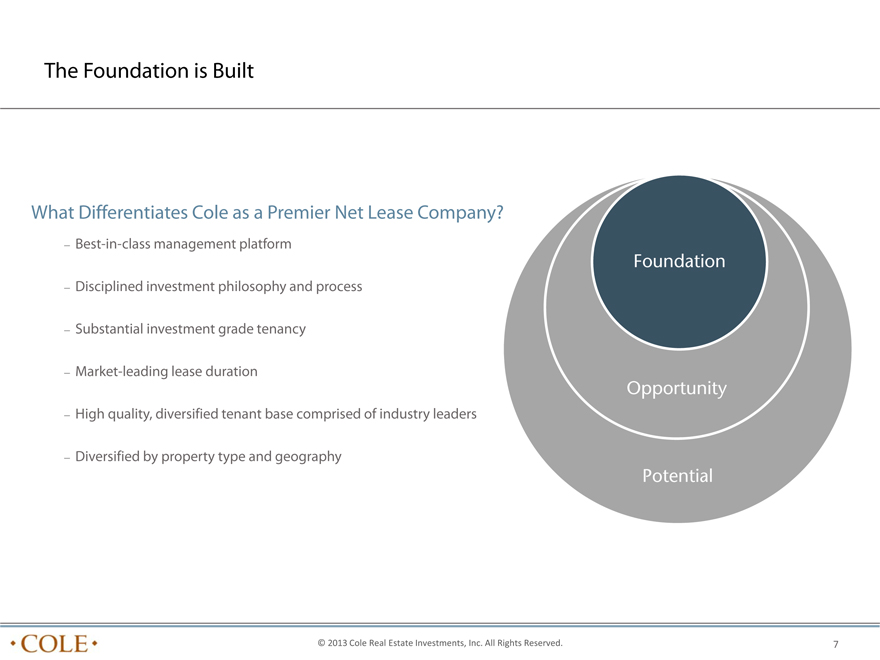
The Foundation is Built
What Differentiates Cole as a Premier Net Lease Company?
– Best-in-class management platform
– Disciplined investment philosophy and process
– Substantial investment grade tenancy
– Market-leading lease duration
– High quality, diversified tenant base comprised of industry leaders
– Diversified by property type and geography
Foundation
Opportunity
Potential
© 2013 Cole Real Estate Investments, Inc. All Rights Reserved.
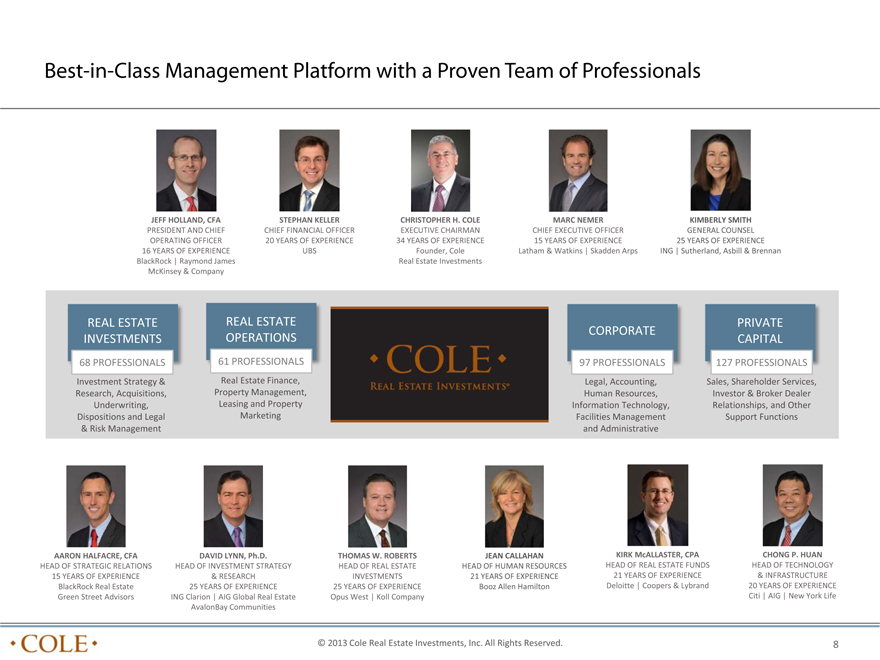
Best-in-Class Management Platform with a Proven Team of Professionals
JEFF HOLLAND, CFA STEPHAN KELLER CHRISTOPHER H. COLE MARC NEMER KIMBERLY SMITH
PRESIDENT AND CHIEF CHIEF FINANCIAL OFFICER EXECUTIVE CHAIRMAN CHIEF EXECUTIVE OFFICER GENERAL COUNSEL OPERATING OFFICER 20 YEARS OF EXPERIENCE 34 YEARS OF EXPERIENCE 15 YEARS OF EXPERIENCE 25 YEARS OF EXPERIENCE
16 YEARS OF EXPERIENCE UBS Founder, Cole Latham & Watkins | Skadden Arps ING | Sutherland, Asbill & Brennan BlackRock | Raymond James Real Estate Investments McKinsey & Company
REAL ESTATE REAL ESTATE PRIVATE
CORPORATE
INVESTMENTS OPERATIONS CAPITAL
68 PROFESSIONALS 61 PROFESSIONALS 97 PROFESSIONALS 127 PROFESSIONALS
Investment Strategy & Real Estate Finance, Legal, Accounting, Sales, Shareholder Services,
Research, Acquisitions, Property Management, Human Resources, Investor & Broker Dealer
Underwriting, Leasing and Property Information Technology, Relationships, and Other
Dispositions and Legal Marketing Facilities Management Support Functions
& Risk Management and Administrative
AARON HALFACRE, CFA DAVID LYNN, Ph.D. THOMAS W. ROBERTS JEAN CALLAHAN KIRK McALLASTER, CPA CHONG P. HUAN
HEAD OF STRATEGIC RELATIONS HEAD OF INVESTMENT STRATEGY HEAD OF REAL ESTATE HEAD OF HUMAN RESOURCES HEAD OF REAL ESTATE FUNDS HEAD OF TECHNOLOGY
15 YEARS OF EXPERIENCE & RESEARCH INVESTMENTS 21 YEARS OF EXPERIENCE 21 YEARS OF EXPERIENCE & INFRASTRUCTURE BlackRock Real Estate 25 YEARS OF EXPERIENCE 25 YEARS OF EXPERIENCE Booz Allen Hamilton Deloitte | Coopers & Lybrand 20 YEARS OF EXPERIENCE Green Street Advisors ING Clarion | AIG Global Real Estate Opus West | Koll Company Citi | AIG | New York Life AvalonBay Communities
© 2013 Cole Real Estate Investments, Inc. All Rights Reserved.
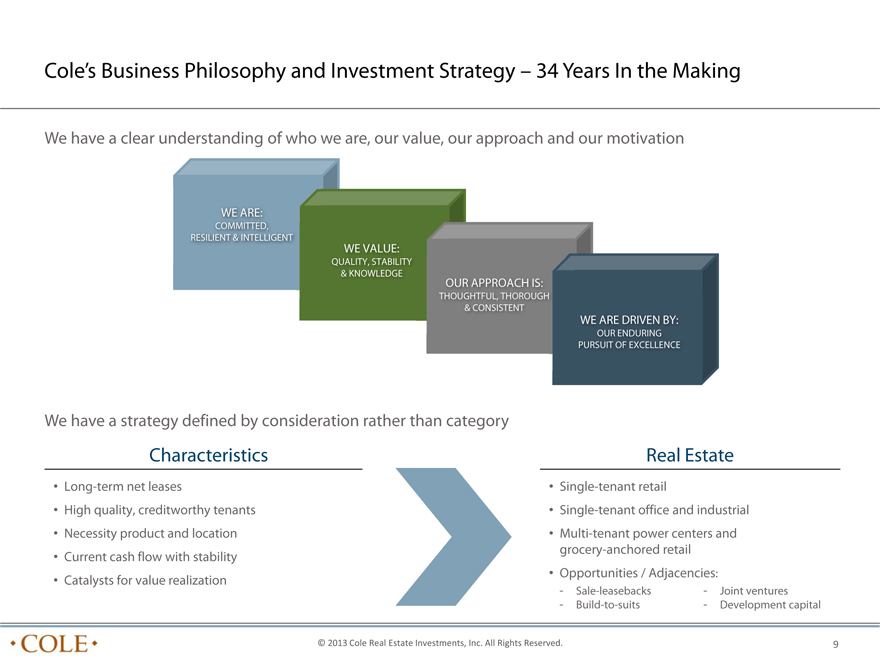
Cole’s Business Philosophy and Investment Strategy – 34 Years In the Making
We have a clear understanding of who we are, our value, our approach and our motivation
WE ARE:
COMMITTED,
RESILIENT & INTELLIGENT
WE VALUE:
QUALITY, STABILITY
& KNOWLEDGE
OUR APPROACH IS:
THOUGHTFUL, THOROUGH
& CONSISTENT
WE ARE DRIVEN BY:
OUR ENDURING
PURSUIT OF EXCELLENCE
We have a strategy defined by consideration rather than category
Characteristics Real Estate
• Long-term net leases • Single-tenant retail
• High quality, creditworthy tenants • Single-tenant office and industrial
• Necessity product and location • Multi-tenant power centers and grocery-anchored retail
• Current cash flow with stability
• Opportunities / Adjacencies:
• Catalysts for value realization
? Sale-leasebacks ? Joint ventures
? Build-to-suits ? Development capital
�� 2013 Cole Real Estate Investments, Inc. All Rights Reserved.
9
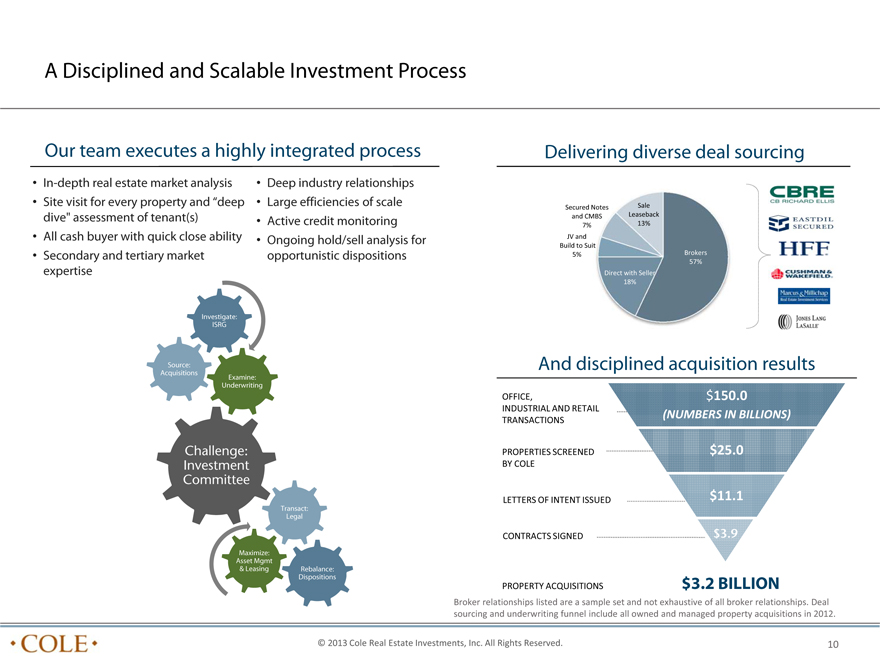
A Disciplined and Scalable Investment Process
Our team executes a highly integrated process
• In-depth real estate market analysis • Deep industry relationships
• Site visit for every property and “deep • Large efficiencies of scale dive” assessment of tenant(s) • Active credit monitoring
• All cash buyer with quick close ability • Ongoing hold/sell analysis for
• Secondary and tertiary market opportunistic dispositions expertise
Delivering diverse deal sourcing
Secured Notes Sale
and CMBS Leaseback
7% 13%
JV and
Build to Suit
5% Brokers
57%
Direct with Seller
18%
Investigate:
ISRG
Source:
Acquisitions
Examine:
Underwriting
Challenge:
Investment
Committee
Transact:
Legal
Maximize:
Asset Mgmt
& Leasing Rebalance:
Dispositions
And disciplined acquisition results
OFFICE, $150.0 INDUSTRIAL AND RETAIL
(NUMBERS IN BILLIONS)
TRANSACTIONS
PROPERTIES SCREENED $25.0 BY COLE
LETTERS OF INTENT ISSUED $11.1
CONTRACTS SIGNED $3.9
PROPERTY ACQUISITIONS $3.2 BILLION
Broker relationships listed are a sample set and not exhaustive of all broker relationships. Deal sourcing and underwriting
funnel include all owned and managed property acquisitions in 2012.
© 2013 Cole Real Estate Investments, Inc. All Rights Reserved.
10
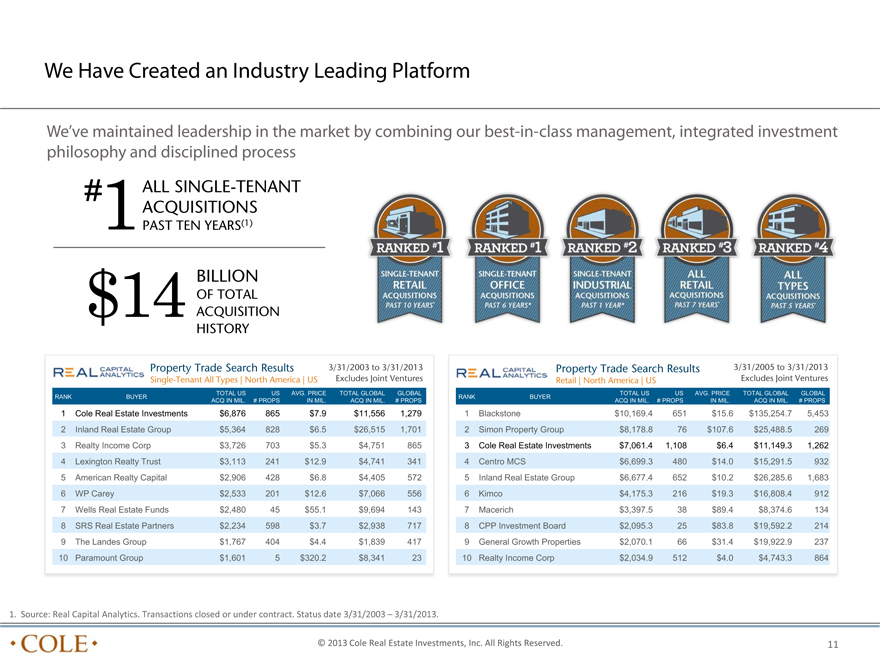
We Have Created an Industry Leading Platform
We’ve maintained leadership in the market by combining our best-in-class management, integrated investment philosophy and disciplined process
# ALL SINGLE-TENANT ACQUISITIONS
1PAST TEN YEARS(1)
BILLION
OF TOTAL
$14 ACQUISITION HISTORY
Property Trade Search Results 3/31/2003 to 3/31/2013 Property Trade Search Results 3/31/2005 to 3/31/2013 Single-Tenant All Types | North America | US Excludes Joint Ventures Retail | North America | US Excludes Joint Ventures
TOTAL US US AVG. PRICE TOTAL GLOBAL GLOBAL TOTAL US US AVG. PRICE TOTAL GLOBAL GLOBAL RANK BUYER RANK BUYER
ACQ IN MIL. # PROPS IN MIL. ACQ IN MIL. # PROPS ACQ IN MIL. # PROPS IN MIL. ACQ IN MIL. # PROPS
1 | | Cole Real Estate Investments $6,876 865 $7.9 $11,556 1,279 1 Blackstone $10,169.4 651 $15.6 $135,254.7 5,453 |
2 | | Inland Real Estate Group $5,364 828 $6.5 $26,515 1,701 2 Simon Property Group $8,178.8 76 $107.6 $25,488.5 269 |
3 | | Realty Income Corp $3,726 703 $5.3 $4,751 865 3 Cole Real Estate Investments $7,061.4 1,108 $6.4 $11,149.3 1,262 |
4 | | Lexington Realty Trust $3,113 241 $12.9 $4,741 341 4 Centro MCS $6,699.3 480 $14.0 $15,291.5 932 |
5 | | American Realty Capital $2,906 428 $6.8 $4,405 572 5 Inland Real Estate Group $6,677.4 652 $10.2 $26,285.6 1,683 |
6 | | WP Carey $2,533 201 $12.6 $7,066 556 6 Kimco $4,175.3 216 $19.3 $16,808.4 912 |
7 | | Wells Real Estate Funds $2,480 45 $55.1 $9,694 143 7 Macerich $3,397.5 38 $89.4 $8,374.6 134 |
8 | | SRS Real Estate Partners $2,234 598 $3.7 $2,938 717 8 CPP Investment Board $2,095.3 25 $83.8 $19,592.2 214 |
9 The Landes Group $1,767 404 $4.4 $1,839 417 9 General Growth Properties $2,070.1 66 $31.4 $19,922.9 237
10 Paramount Group $1,601 5 $320.2 $8,341 23 10 Realty Income Corp $2,034.9 512 $4.0 $4,743.3 864
1. Source: Real Capital Analytics. Transactions closed or under contract. Status date 3/31/2003 – 3/31/2013.
© 2013 Cole Real Estate Investments, Inc. All Rights Reserved.
11
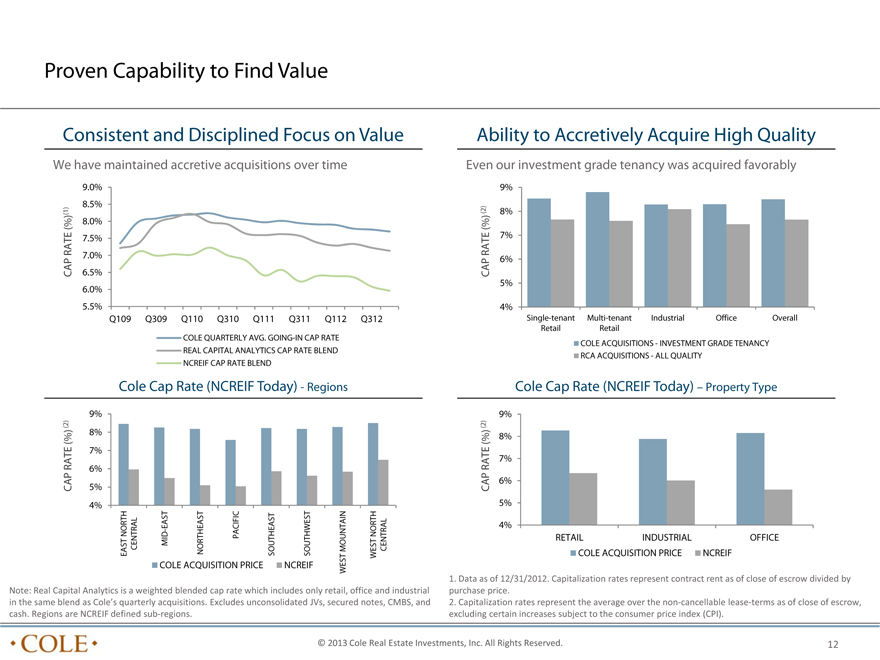
Proven Capability to Find Value
Consistent and Disciplined Focus on Value Ability to Accretively Acquire High Quality
We have maintained accretive acquisitions over time Even our investment grade tenancy was acquired favorably
9.0% 9%
8.5%
(%) 8.0% (%) RATE 7.5% RATE 7%
7.0% 6%
CAP 6.5% CAP
6.0% 5% 5.5% 4%
Q109 Q309 Q110 Q310 Q111 Q311 Q112 Q312 Single-tenant Multi-tenant Industrial Office Overall Retail Retail COLE QUARTERLY AVG. GOING-IN CAP RATE
COLE ACQUISITIONS—INVESTMENT GRADE TENANCY REAL CAPI
TAL ANALYTICS CAP RATE BLEND
RCA ACQUISITIONS—ALL QUALITY NCREIF CAP RATE BLEND
Cole Cap Rate (NCREIF Today)—Regions Cole Cap Rate (NCREIF Today) – Property Type
9% 9%
(%) (%) 8% 7% RATE RATE 7% 6% CAP 5% CAP 6%
4% 5%
EAST 4% NORTH MID- NORTH
CENTRAL PACIFIC MOUNTAIN CENTRAL RETAIL INDUSTRIAL OFFICE EAST NORTHEAST SOUTHEAST SOUTHWEST WEST COLE ACQUISITION PRICE NCREIF
COLE ACQUISITION PRICE NCREIF WEST
1. Data as of 12/31/2012. Capitalization rates represent contract rent as of close of escrow divided by Note: Real Capital
Analytics is a weighted blended cap rate which includes only retail, office and industrial purchase
price. in the same blend as Cole’s quarterly acquisitions. Excludes unconsolidated JVs, secured notes, CMBS, and 2.
Capitalization rates represent the average over the non?cancellable lease?terms as of close of escrow, cash. Regions are
NCREIF defined sub?regions. excluding certain increases subject to the consumer price index (CPI).
© 2013 Cole Real Estate Investments, Inc. All Rights Reserved.
12

Investment Grade Tenancy and Market-Leading Lease Duration
12.4 Lease Expiration Profile 69.0%
Years
Weighted Average Lease Term(1)
Cole’s business has the longest weighted average lease term
13.1% 9.6% of all net lease peers, providing highl
y visible, predictable 5.4% 0.6% 1.0% 1.3% cash flows
2013 2014 2015 3-5 Years 5-7 Years 7-10 Years 10+ Years
42%
13%
55% Investment Grade Implied Investment Grade
Investment Grade Tenants Rating % of Total Implied Rating % of Total
Not Rated
23% AAA to AA- 7.7% AAA to AA- 1.4%
• 42% of Cole’s annual rent is derived from tenants rated Investment
A+ to A- 12.0% A+ to A- 5.5%
Grade investment grade and another 13% from tenants with
42% BBB+ to BBB- 22.1% BBB+ to BBB- 5.8%
Below an implied rating of investment grade Investment
41.8% 12.7%
Grade
• Cole performs extensive upfront credit analysis and 22%
Example Tenant Rating Example Tenant Implied Rating
ongoing credit monitoring for all tenants Wells Fargo AA- Publix AAA Implied
Amazon AA- Dollar Tree AAA
• Implied investment grade ratings are based on Moody’s Investment
Grade Wal-Mart AA Buffalo Wild Wings AA-
Credit Edge or Moody’s KMV in conjunction with 13%
Target A+ Cost Plus AA-current financial statements Tractor Supply A+ Home Depot A-
1. Lease Expiration shows certain information regarding the lease expirations of Cole’s real estate portfolio, including
consolidated joint ventures, as of March 31, 2013, based on annualized rental revenue, during each of the next ten years,
excluding JVs and CMBS/Secured notes receivable. See net lease peers on page 20.
2. Credit rating percentages based on straight line rental revenue; they exclude JVs and CMBS/Secured notes receivable. Moody’s Credit Edge was used to determine implied credit rating for public non?rated tenants.
Moody’s KMV was used to determine implied credit rating for private non?rated tenants. Example tenants are from the
Cole portfolio. 45% of the portfolio is not rated, has no implied rating, is below investment grade, or has a below
investment grade implied rating.
© 2013 Cole Real Estate Investments, Inc. All Rights Reserved.
13
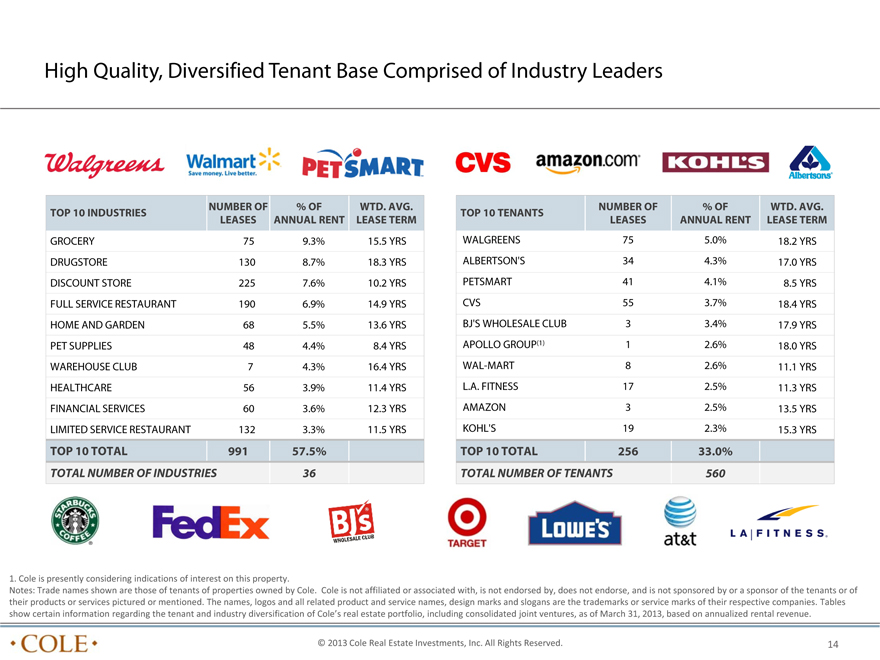
High Quality, Diversified Tenant Base Comprised of Industry Leaders
NUMBER OF % OF WTD. AVG. NUMBER OF % OF WTD. AVG. TOP 10 INDUSTRIES TOP 10 TENANTS
LEASES ANNUAL RENT LEASE TERM LEASES ANNUAL RENT LEASE TERM
GROCERY 75 9.3% 15.5 YRS WALGREENS 75 5.0% 18.2 YRS DRUGSTORE 130 8.7% 18.3 YRS ALBERTSON’S 34 4.3% 17.0 YRS
DISCOUNT STORE 225 7.6% 10.2 YRS PETSMART 41 4.1% 8.5 YRS FULL SERVICE RESTAURANT 190 6.9% 14.9 YRS CVS 55 3.7% 18.4 YRS HOME AND GARDEN 68 5.5% 13.6 YRS BJ’S WHOLESALE CLUB 3 3.4% 17.9 YRS PET SUPPLIES 48 4.4% 8.4 YRS APOLLO GROUP(1) 1 2.6% 18.0 YRS WAREHOUSE CLUB 7 4.3% 16.4 YRS WAL-MART 8 2.6% 11.1 YRS HEALTHCARE 56 3.9% 11.4 YRS L.A. FITNESS 17 2.5% 11.3 YRS
FINANCIAL SERVICES 60 3.6% 12.3 YRS AMAZON 3 2.5% 13.5 YRS LIMITED SERVICE RESTAURANT 132 3.3% 11.5 YRS KOHL’S 19 2.3% 15.3 YRS
TOP 10 TOTAL 991 57.5% TOP 10 TOTAL 256 33.0%
TOTAL NUMBER OF INDUSTRIES 36 TOTAL NUMBER OF TENANTS 560
1. Cole is presently considering indications of interest on this property.
Notes: Trade names shown are those of tenants of properties owned by Cole. Cole is not affiliated or associated with,
is not endorsed by, does not endorse, and is not sponsored by or a sponsor of the tenants or of their products or services pictured or mentioned. The names, logos and all related
product and service names, design marks and slogans are the trademarks or service marks of their respective companies.
Tables show certain information regarding the tenant and industry diversification of Cole’s real estate portfolio, including
consolidated joint ventures, as of March 31, 2013, based on annualized rental revenue.
© 2013 Cole Real Estate Investments, Inc. All Rights Reserved.
14
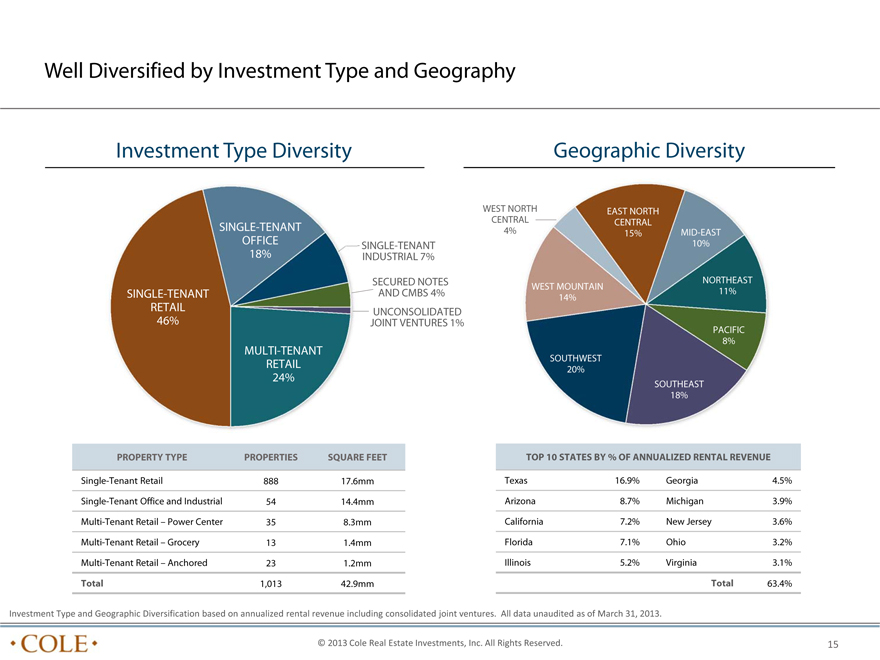
Well Diversified by Investment Type and Geography
Investment Type Diversity Geographic Diversity
WEST NORTH EAST NORTH
CENTRAL CENTRAL
SINGLE-TENANT 4% 15% MID-EAST
OFFICE SINGLE-TENANT 10%
18% INDUSTRIAL 7%
SECURED NOTES NORTHEAST
WEST MOUNTAIN
SINGLE-TENANT AND CMBS 4% 14% 11%
RETAIL UNCONSOLIDATED
46% JOINT VENTURES 1%
PACIFIC
8%
MULTI-TENANT
SOUTHWEST
RETAIL 20%
24%
SOUTHEAST
18%
PROPERTY TYPE PROPERTIES SQUARE FEET TOP 10 STATES BY % OF ANNUALIZED RENTAL REVENUE
Single-Tenant Retail 888 17.6mm Texas 16.9% Georgia 4.5%
Single-Tenant Office and Industrial 54 14.4mm Arizona 8.7% Michigan 3.9%
Multi-Tenant Retail – Power Center 35 8.3mm California 7.2% New Jersey 3.6%
Multi-Tenant Retail – Grocery 13 1.4mm Florida 7.1% Ohio 3.2%
Multi-Tenant Retail – Anchored 23 1.2mm Illinois 5.2% Virginia 3.1%
Total 1,013 42.9mm Total 63.4%
Investment Type and Geographic Diversification based on annualized rental revenue including consolidated joint
ventures. All data unaudited as of March 31, 2013.
© 2013 Cole Real Estate Investments, Inc. All Rights Reserved. 15
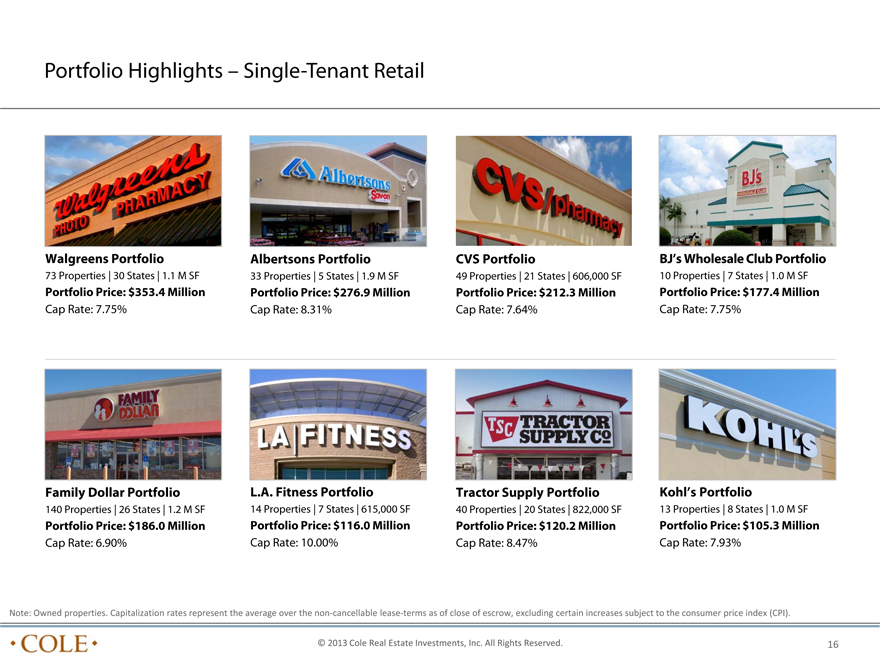
Portfolio Highlights – Single-Tenant Retail
Walgreens Portfolio Albertsons Portfolio CVS Portfolio BJ’s Wholesale Club Portfolio
73 Properties | 30 States | 1.1 M SF 33 Properties | 5 States | 1.9 M SF 49 Properties | 21 States | 606,000 SF 10 Properties | 7 States | 1.0 M SF
Portfolio Price: $353.4 Million Portfolio Price: $276.9 Million Portfolio Price: $212.3 Million Portfolio Price: $177.4 Million
Cap Rate: 7.75% Cap Rate: 8.31% Cap Rate: 7.64% Cap Rate: 7.75%
Family Dollar Portfolio L.A. Fitness Portfolio Tractor Supply Portfolio Kohl’s Portfolio
140 Properties | 26 States | 1.2 M SF 14 Properties | 7 States | 615,000 SF 40 Properties | 20 States | 822,000 SF 13 Properties | 8 States | 1.0 M SF
Portfolio Price: $186.0 Million Portfolio Price: $116.0 Million Portfolio Price: $120.2 Million Portfolio Price: $105.3 Million
Cap Rate: 6.90% Cap Rate: 10.00% Cap Rate: 8.47% Cap Rate: 7.93%
Note: Owned properties. Capitalization rates represent the average over the non?cancellable lease?terms as of close of escrow, excluding certain increases subject to the consumer price index (CPI).
© 2013 Cole Real Estate Investments, Inc. All Rights Reserved.
16
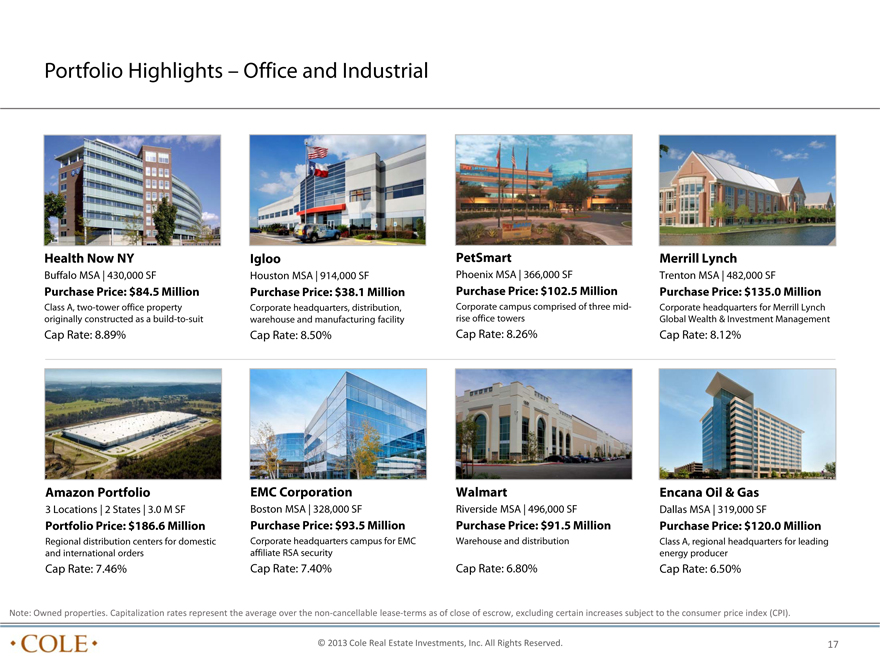
Portfolio Highlights – Office and Industrial
Health Now NY Igloo PetSmart Merrill Lynch
Buffalo MSA | 430,000 SF Houston MSA | 914,000 SF Phoenix MSA | 366,000 SF Trenton MSA | 482,000 SF
Purchase Price: $84.5 Million Purchase Price: $38.1 Million Purchase Price: $102.5 Million Purchase Price: $135.0 Million
Class A, two-tower office property Corporate headquarters, distribution, Corporate campus comprised of three mid- Corporate headquarters for Merrill Lynch originally constructed as a build-to-suit warehouse and manufacturing facility rise office towers Global Wealth & Investment Management
Cap Rate: 8.89% Cap Rate: 8.50% Cap Rate: 8.26% Cap Rate: 8.12%
Amazon Portfolio EMC Corporation Walmart Encana Oil & Gas
3 | | Locations | 2 States | 3.0 M SF Boston MSA | 328,000 SF Riverside MSA | 496,000 SF Dallas MSA | 319,000 SF |
Portfolio Price: $186.6 Million Purchase Price: $93.5 Million Purchase Price: $91.5 Million Purchase Price: $120.0 Million
Regional distribution centers for domestic Corporate headquarters campus for EMC Warehouse and distribution Class A, regional headquarters for leading and international orders affiliate RSA security energy producer
Cap Rate: 7.46% Cap Rate: 7.40% Cap Rate: 6.80% Cap Rate: 6.50%
Note: Owned properties. Capitalization rates represent the average over the non?cancellable lease?terms as of close of escrow, excluding certain increases subject to the consumer price index (CPI).
© 2013 Cole Real Estate Investments, Inc. All Rights Reserved.
17
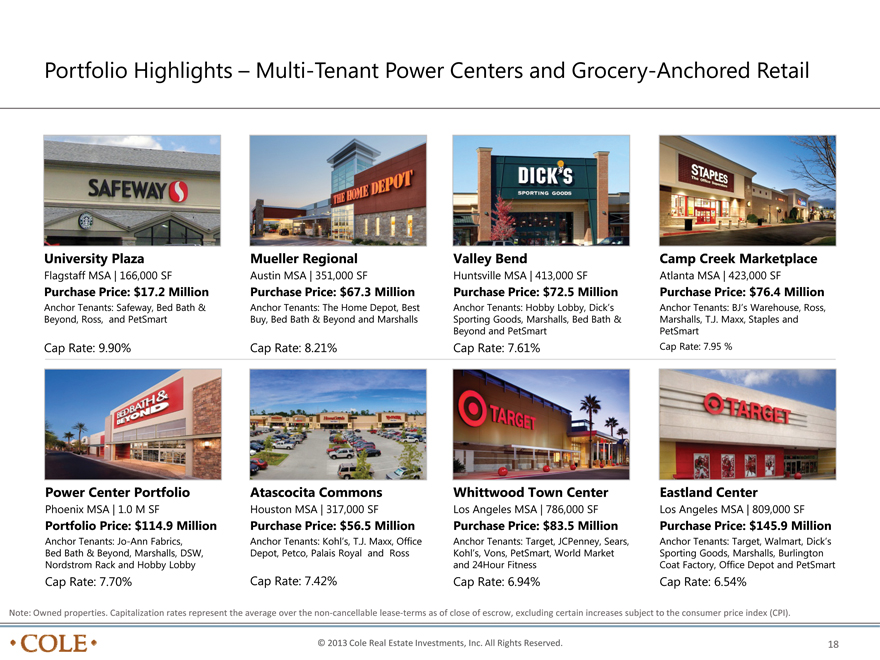
Portfolio Highlights – Multi-Tenant Power Centers and Grocery-Anchored Retail
University Plaza
Flagstaff MSA | 166,000 SF
Purchase Price: $17.2 Million
Anchor Tenants: Safeway, Bed Bath & Beyond, Ross, and PetSmart
Cap Rate: 9.90%
Mueller Regional
Austin MSA | 351,000 SF
Purchase Price: $67.3 Million
Anchor Tenants: The Home Depot, Best Buy, Bed Bath & Beyond and Marshalls
Cap Rate: 8.21%
Valley Bend
Huntsville MSA | 413,000 SF
Purchase Price: $72.5 Million
Anchor Tenants: Hobby Lobby, Dick’s Sporting Goods, Marshalls, Bed Bath & Beyond and PetSmart
Cap Rate: 7.61%
Camp Creek Marketplace
Atlanta MSA | 423,000 SF
Purchase Price: $76.4 Million
Anchor Tenants: BJ’s Warehouse, Ross, Marshalls, T.J. Maxx, Staples and PetSmart Cap Rate: 7.95 %
Power Center Portfolio
Phoenix MSA | 1.0 M SF
Portfolio Price: $114.9 Million
Anchor Tenants: Jo-Ann Fabrics, Bed Bath & Beyond, Marshalls, DSW,
Nordstrom Rack and Hobby Lobby
Cap Rate: 7.70%
Atascocita Commons
Houston MSA | 317,000 SF
Purchase Price: $56.5 Million
Anchor Tenants: Kohl’s, T.J. Maxx, Office Depot, Petco, Palais Royal and Ross
Cap Rate: 7.42%
Whittwood Town Center
Los Angeles MSA | 786,000 SF
Purchase Price: $83.5 Million
Anchor Tenants: Target, JCPenney, Sears, Kohl’s, Vons, PetSmart, World Market and 24Hour Fitness
Cap Rate: 6.94%
Eastland Center
Los Angeles MSA | 809,000 SF
Purchase Price: $145.9 Million
Anchor Tenants: Target, Walmart, Dick’s Sporting Goods, Marshalls, Burlington
Coat Factory, Office Depot and PetSmart
Cap Rate: 6.54%
Note: Owned properties. Capitalization rates represent the average over the non-cancellable lease-terms as of close of escrow, excluding certain increases subject to the consumer price index (CPI).
© 2013 Cole Real Estate Investments, Inc. All Rights Reserved. 18
The Opportunity is Now
Cole Represents a Compelling Opportunity to Achieve High-Quality Income with Upside Potential peers Foundation
– Highly ranked among net lease
– Strong financial composition
– Favorable AFFO metrics support future distribution growth and price potential
Opportunity
Potenti al
© 2013 Cole Real Estate Investments, Inc. All Rights Reserved. 19
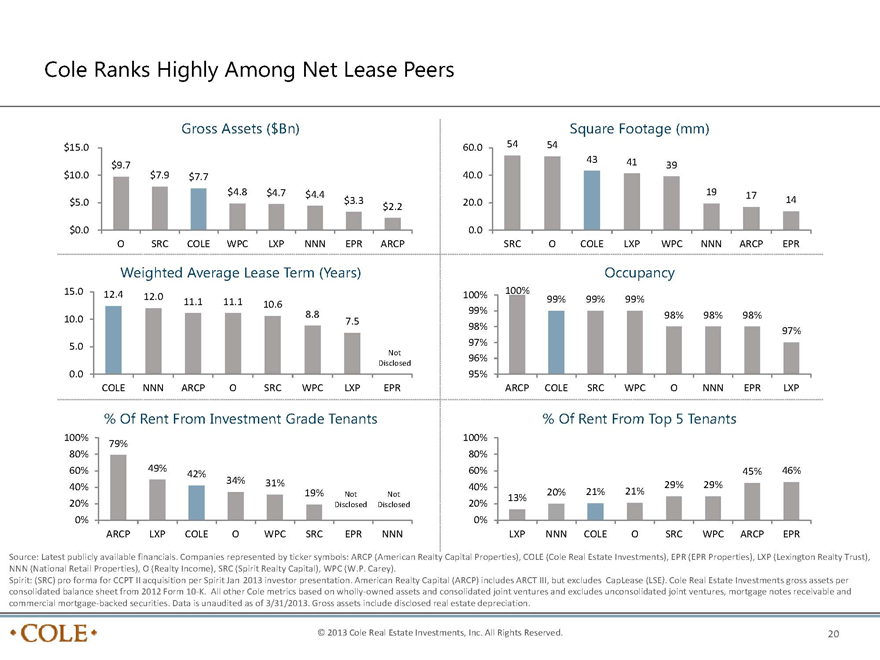
Cole Ranks Highly Among Net Lease Peers
Gross Assets ($Bn)
$15.0
$10.0
$5.0
$0.0
$9.7
$7.9 $7.7
$4.8 $4.7 $4.4
$3.3
$2.2
O SRC COLE WPC LXP NNN EPR ARCP
Weighted Average Lease Term (Years)
15.0
10.0
5.0
0.0
12.4 12.0 11.1 11.1 10.6 8.8 7.5
Not Disclosed
COLE NNN ARCP O SRC WPC LXP EPR
% Of Rent From Investment Grade Tenants
100%
80%
60%
40%
20%
0%
79% 49% 42% 34% 31% 19% Not Disclosed Not Disclosed
ARCP LXP COLE O WPC SRC EPR NNN
Square Footage (mm)
60.0
40.0
20.0
0.0
54 54 43 41 39 19 17 14
SRC O COLE LXP WPC NNN ARCP EPR
Occupancy
100%
99%
98%
97%
96%
95%
100% 99% 99% 99% 98% 98% 98% 97%
ARCP COLE SRC WPC O NNN EPR LXP
% Of Rent From Top 5 Tenants
100%
80%
60%
40%
20%
0%
13% 20% 21% 21% 29% 29% 45% 46%
LXP NNN COLE O SRC WPC ARCP EPR
Source: Latest publicly available financials. Companies represented by ticker symbols: ARCP (American Realty Capital Properties), COLE (Cole Real Estate Investments), EPR (EPR Properties), LXP (Lexington Realty Trust), NNN (National Retail Properties), O (Realty Income), SRC (Spirit Realty Capital), WPC (W.P. Carey).
Spirit: (SRC) pro forma for CCPT II acquisition per Spirit Jan-2013 investor presentation. American Realty Capital (ARCP) includes ARCT III, but excludes CapLease (LSE). Cole Real Estate Investments gross assets per consolidated balance sheet from 2012 Form 10-K. All other Cole metrics based on wholly-owned assets and consolidated joint ventures and excludes unconsolidated joint ventures, mortgage notes receivable and commercial mortgage-backed securities. Data is unaudited as of 3/31/2013. Gross assets include disclosed real estate depreciation.
COLE
© 2013 Cole Real Estate Investments, Inc. All Rights Reserved.
20
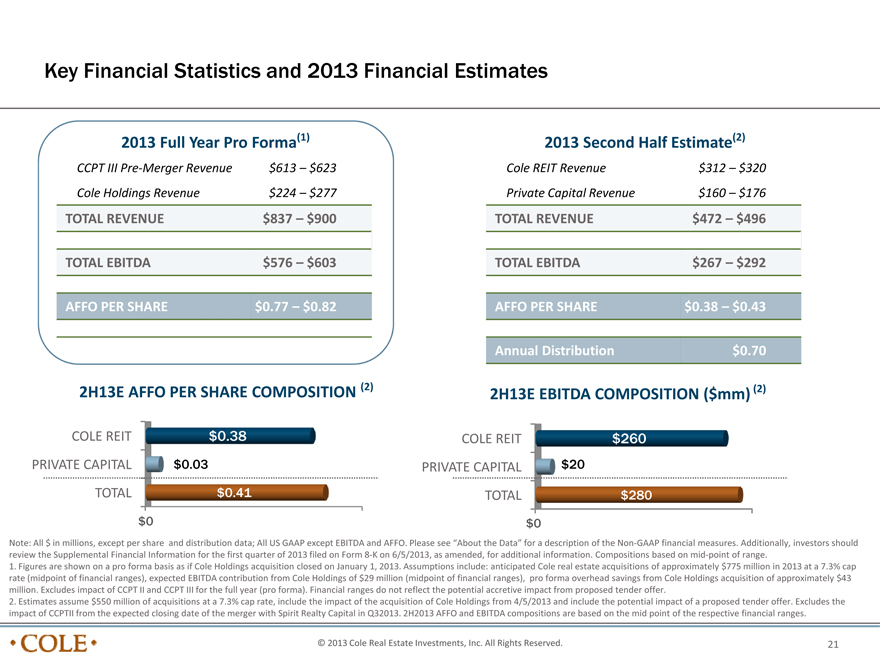
Key Financial Statistics and 2013 Financial Estimates
2013 Full Year Pro Forma(1)
CCPT III Pre-Merger Revenue $613 – $623
Cole Holdings Revenue $224 – $277
TOTAL REVENUE $837 – $900
TOTAL EBITDA $576 – $603
AFFO PER SHARE $0.77 – $0.82
2013 Second Half Estimate(2)
Cole REIT Revenue $312 – $320
Private Capital Revenue $160 – $176
TOTAL REVENUE $472 – $496
TOTAL EBITDA $267 – $292
AFFO PER SHARE $0.38 – $0.43
Annual Distribution $0.70
2H13E AFFO PER SHARE COMPOSITION (2)
COLE REIT $0.38
PRIVATE CAPITAL $0.03
TOTAL $0.41
$0
2H13E EBITDA COMPOSITION ($mm) (2)
COLE REIT $260
PRIVATE CAPITAL $20
TOTAL $280
$0
Note: All $ in millions, except per share and distribution data; All US GAAP except EBITDA and AFFO. Please see “About the Data” for a description of the Non-GAAP financial measures. Additionally, investors should review the Supplemental Financial Information for the first quarter of 2013 filed on Form 8-K on 6/5/2013, as amended, for additional information. Compositions based on mid-point of range.
1. Figures are shown on a pro forma basis as if Cole Holdings acquisition closed on January 1, 2013. Assumptions include: anticipated Cole real estate acquisitions of approximately $775 million in 2013 at a 7.3% cap rate (midpoint of financial ranges), expected EBITDA contribution from Cole Holdings of $29 million (midpoint of financial ranges), pro forma overhead savings from Cole Holdings acquisition of approximately $43 million. Excludes impact of CCPT II and CCPT III for the full year (pro forma). Financial ranges do not reflect the potential accretive impact from proposed tender offer.
2. Estimates assume $550 million of acquisitions at a 7.3% cap rate, include the impact of the acquisition of Cole Holdings from 4/5/2013 and include the potential impact of a proposed tender offer. Excludes the impact of CCPTII from the expected closing date of the merger with Spirit Realty Capital in Q32013. 2H2013 AFFO and EBITDA compositions are based on the mid point of the respective financial ranges.
© 2013 Cole Real Estate Investments, Inc. All Rights Reserved. 21
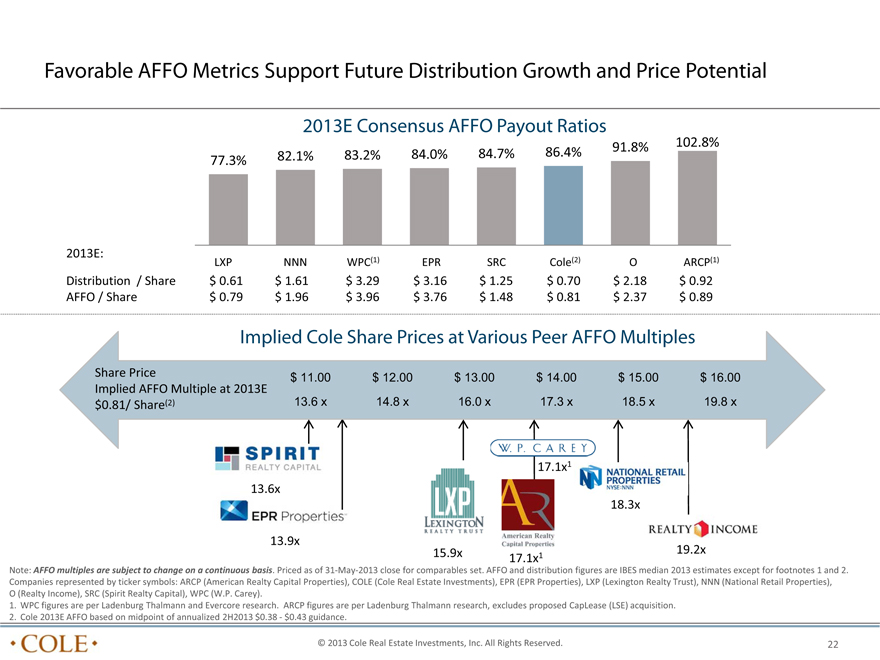
Favorable AFFO Metrics Support Future Distribution Growth and Price Potential
2013E Consensus AFFO Payout Ratios
91.8% 102.8%
82.1% 83.2% 84.0% 84.7% 86.4%
77.3%
2013E:
LXP NNN WPC(1) EPR SRC Cole(2) O ARCP(1)
Distribution / Share $ 0.61 $ 1.61 $ 3.29 $ 3.16 $ 1.25 $ 0.70 $ 2.18 $ 0.92
AFFO / Share $ 0.79 $ 1.96 $ 3.96 $ 3.76 $ 1.48 $ 0.81 $ 2.37 $ 0.89
Implied Cole Share Prices at Various Peer AFFO Multiples
Share Price $ 11.00 $ 12.00 $ 13.00 $ 14.00 $ 15.00 $ 16.00
Implied AFFO Multiple at 2013E
$0.81/ | | Share(2) 13.6 x 14.8 x 16.0 x 17.3 x 18.5 x 19.8 x |
17.1x1
13.6x
18.3x
13.9x
15.9x 19.2x
17.1x1
Note: AFFO multiples are subject to change on a continuous basis. Priced as of 31? May? 2013 close for comparables set. AFFO and distribution figures are IBES median 2013 estimates except for footnotes 1 and 2. Companies represented by ticker symbols: ARCP (American Realty Capital Properties), COLE (Cole Real Estate Investments), EPR (EPR Properties), LXP (Lexington Realty Trust), NNN (National Retail Properties), O (Realty Income), SRC (Spirit Realty Capital), WPC (W.P. Carey).
1. WPC figures are per Ladenburg Thalmann and Evercore research. ARCP figures are per Ladenburg Thalmann research, excludes proposed CapLease (LSE) acquisition.
2. Cole 2013E AFFO based on midpoint of annualized 2H2013 $0.38 $ ? 0.43 guidance.
© 2013 Cole Real Estate Investments, Inc. All Rights Reserved.
22
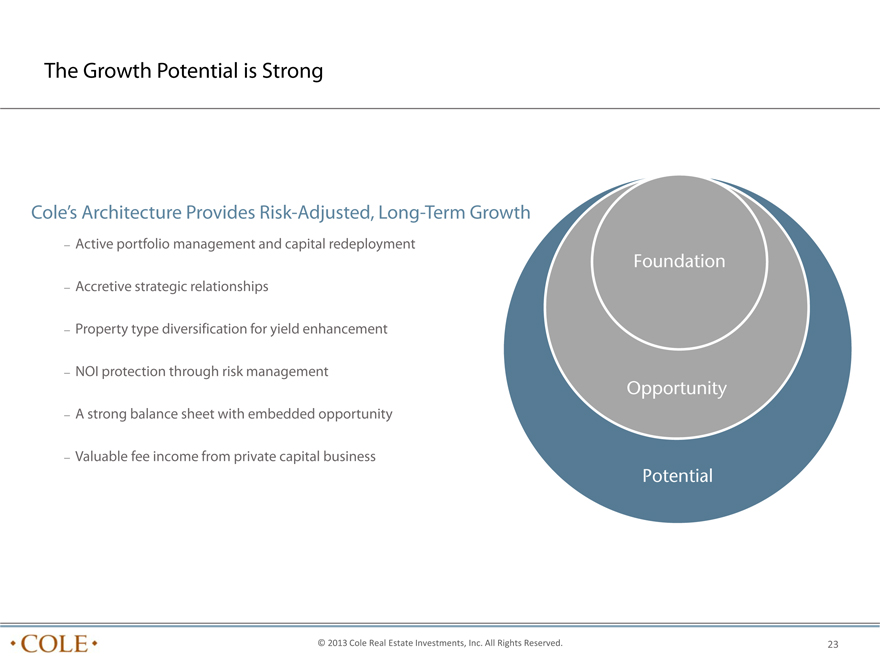
The Growth Potential is Strong
Cole’s Architecture Provides Risk-Adjusted, Long-Term Growth
– Active portfolio management and capital redeployment
Foundation
– Accretive strategic relationships
– Property type diversification for yield enhancement
– NOI protection through risk management
Opportunity
– A strong balance sheet with embedded opportunity
– Valuable fee income from private capital business
Potential
© 2013 Cole Real Estate Investments, Inc. All Rights Reserved.
23
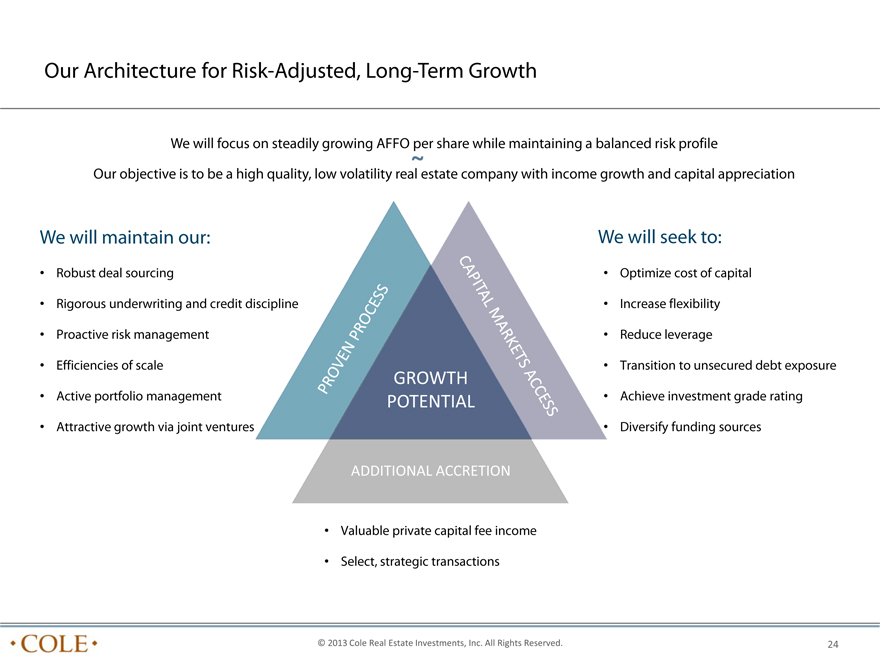
Our Architecture for Risk-Adjusted, Long-Term Growth
We will focus on steadily growing AFFO per share while maintaining a balanced risk profile
Our objective is to be a high quality, low volatility real ~ estate company with income growth and capital appreciation
We will maintain our:
• Robust deal sourcing
• Rigorous underwriting and credit discipline
• Proactive risk management
• Efficiencies of scale
• Active portfolio management
• Attractive growth via joint ventures
GROWTH POTENTIAL
ADDITIONAL ACCRETION
• Valuable private capital fee income
• Select, strategic transactions
We will seek to:
• Optimize cost of capital
• Increase flexibility
• Reduce leverage
• Transition to unsecured debt exposure
• Achieve investment grade rating
• Diversify funding sources
© 2013 Cole Real Estate Investments, Inc. All Rights Reserved.
24
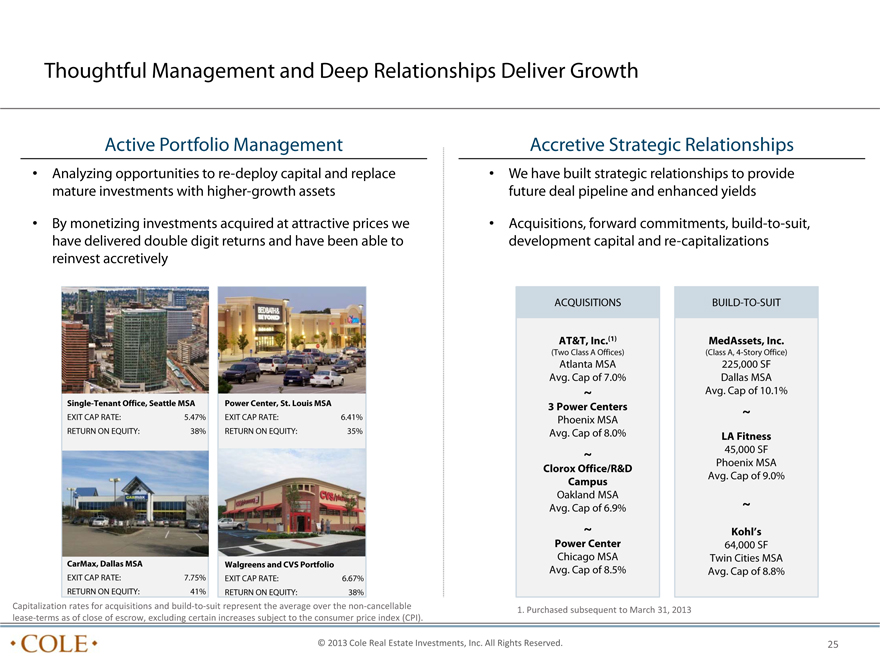
Thoughtful Management and Deep Relationships Deliver Growth
Active Portfolio Management Accretive Strategic Relationships
• Analyzing opportunities to re-deploy capital and replace • We have built strategic relationships to provide mature investments with higher-growth assets future deal pipeline and enhanced yields
• By monetizing investments acquired at attractive prices we • Acquisitions, forward commitments, build-to-suit, have delivered double digit returns and have been able to development capital and re-capitalizations reinvest accretively
ACQUISITIONS BUILD-TO-SUIT
AT&T, Inc.(1) MedAssets, Inc.
(Two Class A Offices) (Class A, 4-Story Office) Atlanta MSA 225,000 SF Avg. Cap of 7.0% Dallas MSA
~ Avg. Cap of 10.1%
Single-Tenant Office, Seattle MSA Power Center, St. Louis MSA 3 Power Centers
~
EXIT CAP RATE: 5.47% EXIT CAP RATE: 6.41% Phoenix MSA
RETURN ON EQUITY: 38% RETURN ON EQUITY: 35% Avg. Cap of 8.0% LA Fitness
~ 45,000 SF
Phoenix MSA
Clorox Office/R&D
Avg. Cap of 9.0%
Campus
Oakland MSA
Avg. Cap of 6.9% ~
~ Kohl’s Power Center 64,000 SF Chicago MSA Twin Cities MSA
CarMax, Dallas MSA Walgreens and CVS Portfolio
Avg. Cap of 8.5% Avg. Cap of 8.8% EXIT CAP RATE: 7.75% EXIT CAP RATE: 6.67% RETURN ON EQUITY: 41% RETURN ON EQUITY: 38%
Capitalization rates for acquisitions and build? to? suit represent the average over the non? cancellable lease? terms as of close of escrow, excluding certain increases subject to the consumer price index (CPI). 1. Purchased subsequent to March 31, 2013
© 2013 Cole Real Estate Investments, Inc. All Rights Reserved. 25
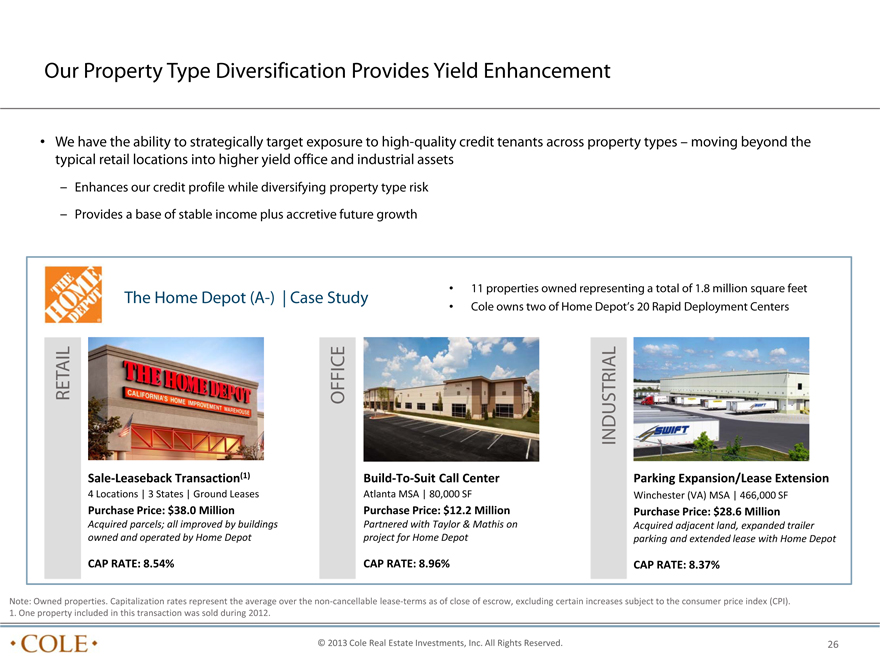
Our Property Type Diversification Provides Yield Enhancement
• We have the ability to strategically target exposure to high-quality credit tenants across property types – moving beyond the typical retail locations into higher yield office and industrial assets
– Enhances our credit profile while diversifying property type risk
– Provides a base of stable income plus accretive future growth
• 11 properties owned representing a total of 1.8 million square feet
The Home Depot (A-) | Case Study
• Cole owns two of Home Depot’s 20 Rapid Deployment Centers
RETAIL OFFICE INDUSTRIAL
Sale? Leaseback Transaction(1) Build? To? Suit Call Center Parking Expansion/Lease Extension
4 | | Locations | 3 States | Ground Leases Atlanta MSA | 80,000 SF Winchester (VA) MSA | 466,000 SF |
Purchase Price: $38.0 Million Purchase Price: $12.2 Million Purchase Price: $28.6 Million
Acquired parcels; all improved by buildings Partnered with Taylor & Mathis on Acquired adjacent land, expanded trailer owned and operated by Home Depot project for Home Depot parking and extended lease with Home Depot
CAP RATE: 8.54% CAP RATE: 8.96% CAP RATE: 8.37%
Note: Owned properties. Capitalization rates represent the average over the non? cancellable lease? terms as of close of escrow, excluding certain increases subject to the consumer price index (CPI).
1. One property included in this transaction was sold during 2012.
© 2013 Cole Real Estate Investments, Inc. All Rights Reserved.
26
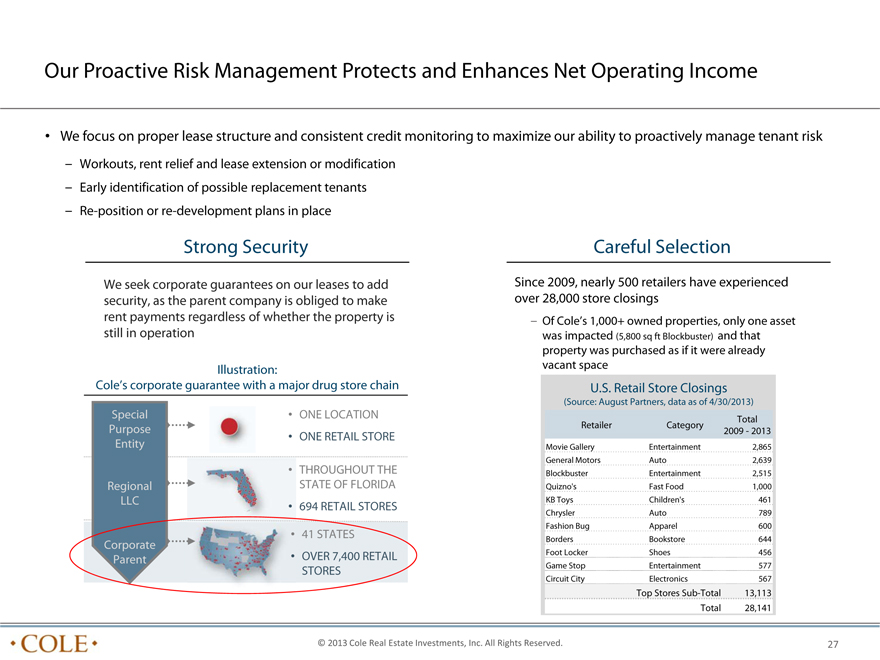
Our Proactive Risk Management Protects and Enhances Net Operating Income
• We focus on proper lease structure and consistent credit monitoring to maximize our ability to proactively manage tenant risk
– Workouts, rent relief and lease extension or modification
– Early identification of possible replacement tenants
– Re-position or re-development plans in place
Strong Security
We seek corporate guarantees on our leases to add security, as the parent company is obliged to make rent payments regardless of whether the property is still in operation
Illustration:
Cole’s corporate guarantee with a major drug store chain
Special • ONE LOCATION Purpose
• ONE RETAIL STORE
Entity
• THROUGHOUT THE
Regional STATE OF FLORIDA LLC
• 694 RETAIL STORES
• 41 STATES
Corporate • OVER 7,400 RETAIL Parent STORES
Careful Selection
Since 2009, nearly 500 retailers have experienced over 28,000 store closings
– Of Cole’s 1,000+ owned properties, only one asset
was impacted (5,800 sq ft Blockbuster) and that
property was purchased as if it were already vacant space U.S. Retail Store Closings
(Source: August Partners, data as of 4/30/2013)
Total Retailer Category 2009—2013 Movie Gallery Entertainment 2,865 General Motors Auto 2,639 Blockbuster Entertainment 2,515 Quizno’s Fast Food 1,000 KB Toys Children’s 461 Chrysler Auto 789 Fashion Bug Apparel 600 Borders Bookstore 644 Foot Locker Shoes 456 Game Stop Entertainment 577 Circuit City Electronics 567 Top Stores Sub-Total 13,113 Total 28,141
© 2013 Cole Real Estate Investments, Inc. All Rights Reserved.
27
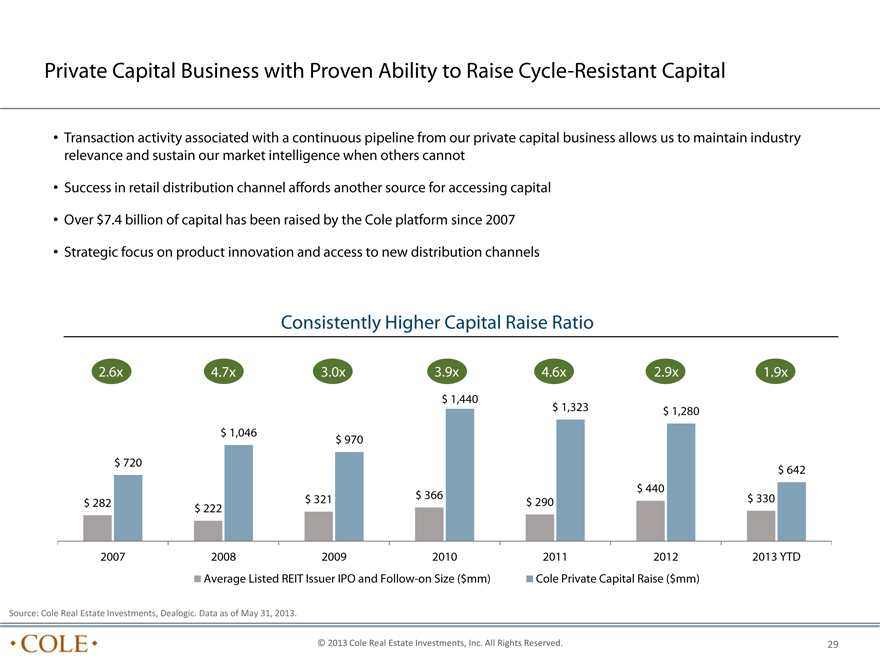
Private Capital Business with Proven Ability to Raise Cycle-Resistant Capital
• Transaction activity associated with a continuous pipeline from our private capital business allows us to maintain industry relevance and sustain our market intelligence when others cannot
• Success in retail distribution channel affords another source for accessing capital
• Over $7.4 billion of capital has been raised by the Cole platform since 2007
• Strategic focus on product innovation and access to new distribution channels
Consistently Higher Capital Raise Ratio
2.6x 4.7x 3.0x 3.9x 4.6x 2.9x 1.9x $ 1,440 $ 1,323 $ 1,280 $ 1,046 $ 970 $ 720 $ 642 $ 440 $ 321 $ 366 $ 330 $ 282 $ 290 $ 222
2007 2008 2009 2010 2011 2012 2013 YTD Average Listed REIT Issuer IPO and Follow-on Size ($mm) Cole Private Capital Raise ($mm)
Source: Cole Real Estate Investments, Dealogic. Data as of May 31, 2013.
© 2013 Cole Real Estate Investments, Inc. All Rights Reserved. 29
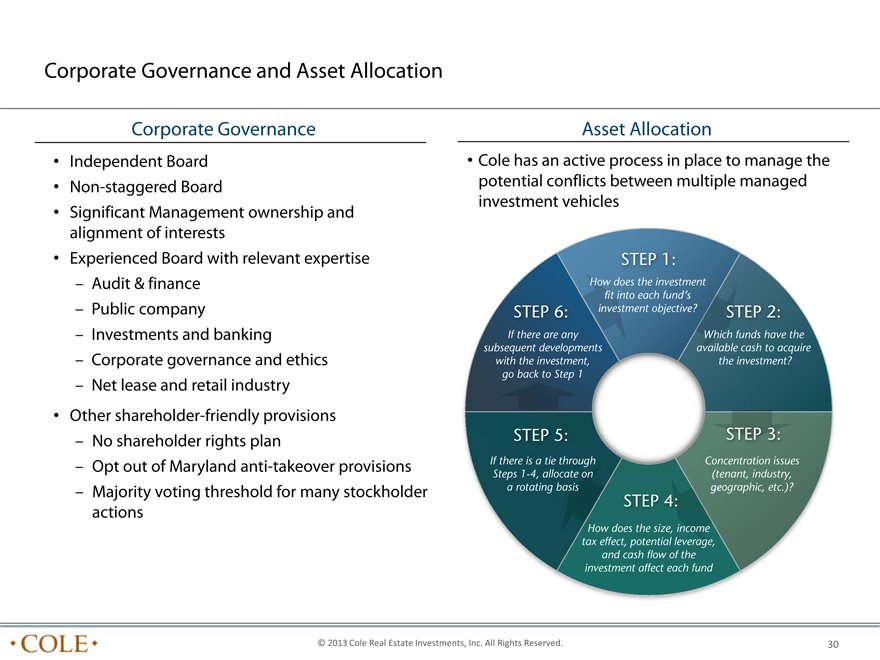
Corporate Governance and Asset Allocation
Corporate Governance
• Independent Board
• Non-staggered Board
• Significant Management ownership and alignment of interests
• Experienced Board with relevant expertise
– Audit & finance
– Public company
– Investments and banking
– Corporate governance and ethics
– Net lease and retail industry
• Other shareholder-friendly provisions
– No shareholder rights plan
– Opt out of Maryland anti-takeover provisions
– Majority voting threshold for many stockholder actions
Asset Allocation
• Cole has an active process in place to manage the potential conflicts between multiple managed investment vehicles
STEP 1:
How does the investment fit into each fund’s
STEP 6: investment objective? STEP 2: If there are any Which funds have the subsequent developments available cash to acquire with the investment, the investment? go back to Step 1
STEP 5: STEP 3:
If there is a tie through Concentration issues Steps 1-4, allocate on (tenant, industry, a rotating basis STEP 4: geographic, etc.)?
How does the size, income tax effect, potential leverage, and cash flow of the investment affect each fund
© 2013 Cole Real Estate Investments, Inc. All Rights Reserved.
30
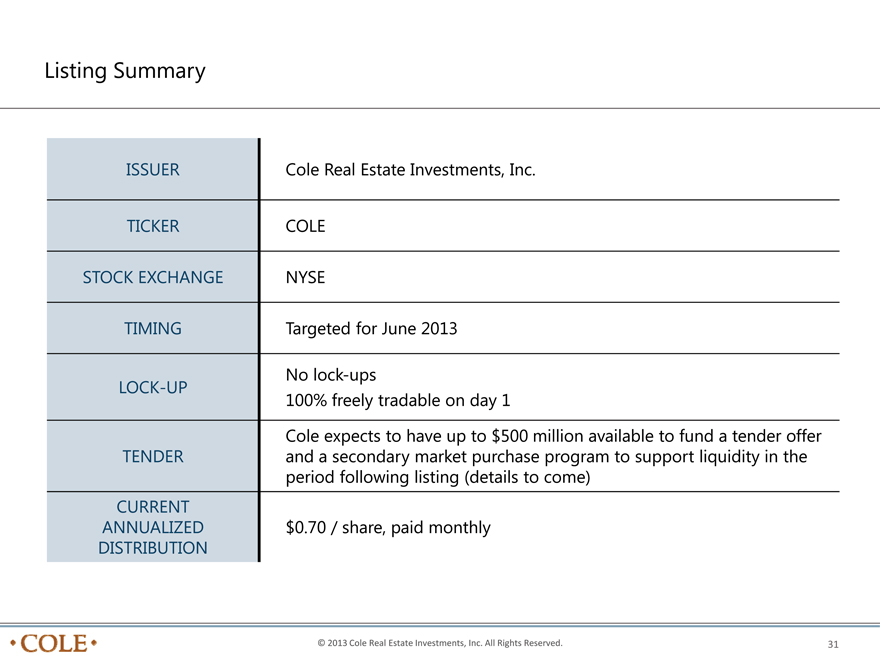
Listing Summary
ISSUER Cole Real Estate Investments, Inc.
TICKER COLE
STOCK EXCHANGE NYSE
TIMING Targeted for June 2013
LOCK-UP No lock-ups
100% freely tradable on day 1
Cole expects to have up to $500 million available to fund a tender offer
TENDER and a secondary market purchase program to support liquidity in the
period following listing (details to come)
CURRENT
ANNUALIZED $0.70 / share, paid monthly
DISTRIBUTION
© 2013 Cole Real Estate Investments, Inc. All Rights Reserved. 31
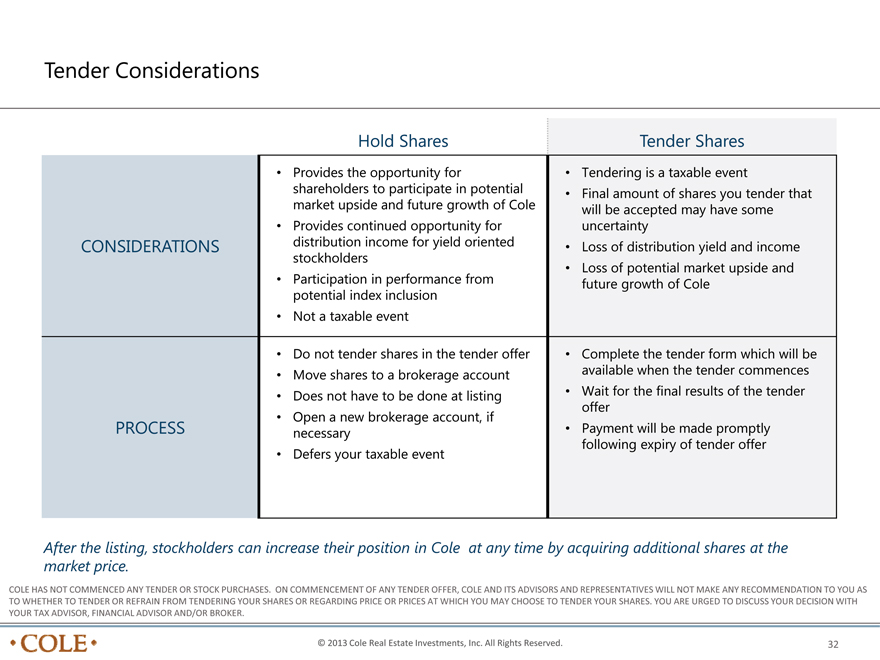
Tender Considerations
CONSIDERATIONS
PROCESS
Hold Shares
Provides the opportunity for shareholders to participate in potential market upside and future growth of Cole
Provides continued opportunity for distribution income for yield oriented stockholders
Participation in performance from potential index inclusion
Not a taxable event
Do not tender shares in the tender offer
Move shares to a brokerage account
Does not have to be done at listing
Open a new brokerage account, if necessary
Defers your taxable event
Tender Shares
Tendering is a taxable event
Final amount of shares you tender that will be accepted may have some uncertainty
Loss of distribution yield and income
Loss of potential market upside and future growth of Cole
Complete the tender form which will be available when the tender commences
Wait for the final results of the tender offer
Payment will be made promptly following expiry of tender offer
After the listing, stockholders can increase their position in Cole at any time by acquiring additional shares at the market price.
COLE HAS NOT COMMENCED ANY TENDER OR STOCK PURCHASES. ON COMMENCEMENT OF ANY TENDER OFFER, COLE AND ITS ADVISORS AND REPRESENTATIVES WILL NOT MAKE ANY RECOMMENDATION TO YOU AS TO WHETHER TO TENDER OR REFRAIN FROM TENDERING YOUR SHARES OR REGARDING PRICE OR PRICES AT WHICH YOU MAY CHOOSE TO TENDER YOUR SHARES. YOU ARE URGED TO DISCUSS YOUR DECISION WITH YOUR TAX ADVISOR, FINANCIAL ADVISOR AND/OR BROKER.
© 2013 Cole Real Estate Investments, Inc. All Rights Reserved. 32
About the Data
Slide Notes: “Cole Real Estate Investments by the Numbers”
The depicted pie chart graphically illustrates the composition of metrics associated with the owned assets (COLE REIT) and managed assets (PRIVATE CAPITAL) with the ratio shown being reflective of their respective contributions to total annual AFFO. Managed assets include, in part, those assets held within Cole as of March 31, 2013 (unless otherwise noted), and Credit Property Trust II, Inc., a Cole-sponsored program which we anticipate will no longer be under management following Q3 2013.
1. Weighted Average Remaining Lease Term is based on annualized straight-line rental revenue.
2. Square feet owned based on wholly owned assets and consolidated joint ventures and excludes unconsolidated joint ventures, mortgage notes receivable and commercial mortgage-backed securities. Square feet managed includes, in part, those assets held within Cole Credit Property Trust II.
3. Properties owned based on wholly owned assets and consolidated joint ventures and excludes unconsolidated joint ventures, mortgage notes receivable and commercial mortgage-backed securities. Properties managed includes, in part, those assets held within Cole Credit Property Trust II.
4. Real Capital Analytics, U.S. Single-Tenant All Types 3/31/2003 to 3/31/2013, excludes joint ventures.
5. Cole raised over $6b in capital over the last 60 months, or approximately $100mm each month. Average monthly capital raise for 2012 and 2013 was $107mm and $114mm, respectively (as of April 30, 2013).
6. 55% investment grade includes 13% related to tenants with an implied rating of investment grade. Credit rating percentages based on straight line rental revenue; they exclude JVs and CMBS/Secured notes receivable. Moody’s Credit Edge was used to determine implied credit rating for public non-rated tenants. Moody’s KMV was used to determine implied credit rating for private non-rated tenants.
7. Pro-forma estimate assumes Cole Holdings acquisition closed on 1/1/2013. Expected EBITDA contribution from Cole Holdings of $29 million (midpoint of financial ranges). Excludes impact of CCPTII and Cole for the full year (pro forma).
© 2013 Cole Real Estate Investments, Inc. All Rights Reserved. 33
About the Data (continued)
Non-GAAP Financial Measures
FFO and AFFO
Funds From Operations (“FFO”) is a non-GAAP financial performance measure defined by the National Association of Real Estate Investment Trusts (“NAREIT”) and widely recognized by investors and analysts as one measure of operating performance of a real estate company. The FFO calculation excludes items such as real estate depreciation and amortization, gains and losses on the sale of depreciable real estate and impairments of depreciable real estate. Depreciation and amortization as applied in accordance with GAAP implicitly assumes that the value of real estate assets diminishes predictably over time. Since real estate values have historically risen or fallen with market conditions, it is management’s view, and we believe the view of many industry investors and analysts, that the presentation of operating results for real estate companies by using the historical cost accounting method alone is insufficient. In addition, FFO excludes gains and losses from the sale of depreciable real estate and impairment charges on depreciable real estate, which we believe provides management and investors with a helpful additional measure of the performance of our real estate portfolio, as it allows for comparisons, year to year, that reflect the impact on operations from trends in items such as occupancy rates, rental rates, operating costs, general and administrative expenses, and interest costs. We compute FFO in accordance with NAREIT’s definition.
In addition to FFO, we use Adjusted Funds From Operations (“AFFO”) as a non-GAAP supplemental financial performance measure to evaluate the operating performance of our real estate portfolio. AFFO, as defined by our company, excludes from FFO merger and acquisition related costs, amortization and write off of deferred financing costs, straight-line rent adjustments, above and below market lease intangibles amortization, realized loss on derivatives and debt prepayment fees, gain on sale of marketable securities, other amortization or accretion, other gains, adjustments for discontinued operations and our proportionate share of adjustments for unconsolidated joint ventures, all of which are required to be expensed or recorded as additions to revenue or other income in accordance with GAAP. In evaluating the performance of our portfolio over time, management employs business models and analyses that differentiate the costs to acquire investments from the investments’ revenues and expenses. Management believes that excluding the items noted above from AFFO provides investors with supplemental performance information that is consistent with the performance models and analysis used by management, and provides investors a view of the performance of our portfolio over time, including after the Company ceases to acquire properties on a frequent and regular basis. AFFO also allows for a comparison of the performance of our portfolio with other REITs that are not currently engaging in acquisitions and mergers, as well as a comparison of our performance with that of other REITs, as AFFO, or an equivalent measure, is routinely reported by REITs, and we believe often used by analysts and investors for comparison purposes.
For all of these reasons, we believe FFO and AFFO, in addition to net income and cash flows from operating activities, as defined by GAAP, are helpful supplemental performance measures and useful in understanding the various ways in which our management evaluates the performance of our real estate portfolio over time. However, not all REITs calculate FFO and AFFO the same way, so comparisons with other REITs may not be meaningful. FFO and AFFO should not be considered as alternatives to net
income or to cash flows from operating activities, and are not intended to be used as a liquidity measure indicative of cash flow available to fund our cash needs.
© 2013 Cole Real Estate Investments, Inc. All Rights Reserved.
34
About the Data (continued)
Non-GAAP Financial Measures continued
EBITDA and Adjusted EBITDA
Adjusted EBITDA as disclosed represents EBITDA, or earnings before interest, taxes, depreciation and amortization, modified to include other adjustments to GAAP net income for merger expenses which are considered non-recurring and gain/losses in real estate, foreign exchange and derivatives which are not considered fundamental attributes of our business plans and do not affect our overall long-term operating performance. We exclude these items from Adjusted EBITDA as they are not the primary drivers in our decision making process. Our assessment of our operations is focused on long-term sustainability and not on such non-cash items, which may cause short term fluctuations in net income but have no impact on cash flows. We believe that Adjusted EBITDA is a useful supplemental measure to investors and analysts for assessing the performance of our business segments, although it does not represent net income that is computed in accordance with GAAP. Therefore, Adjusted EBITDA should not be considered as an alternative to net income or as an indicator of our financial performance. We use Adjusted EBITDA as one measure of our operating performance when we formulate corporate goals and evaluate the effectiveness of our strategies. Adjusted EBITDA may not be comparable to similarly titled measures of other companies.
© 2013 Cole Real Estate Investments, Inc. All Rights Reserved.
35