
November 5, 2013 2013 Third Quarter Earnings Presentation www.ColeREIT.com Exhibit 99.3

2© 2013 Cole Real Estate Investments, Inc. All Rights Reserved. Disclosures The properties pictured have been acquired by Cole. Corporate tenants may also occupy numerous properties that are not owned by Cole or Cole-sponsored programs. Cole is not affiliated or associated with, is not endorsed by, does not endorse, and is not sponsored by or a sponsor of the tenants or the joint venture partners shown, or of their products or services pictured or mentioned. The names, logos and all related product and service names, design marks and slogans are the trademarks or service marks of their respective companies. Tenants, Trademarks and Logos
3© 2013 Cole Real Estate Investments, Inc. All Rights Reserved. In addition to historical information, this presentation contains forward-looking statements within the meaning of Section 27A of the Securities Act of 1933, as amended, and Section 21E of the Securities Exchange Act of 1934, as amended. These forward- looking statements, which are based on current expectations, estimates and projections about the industry and markets in which Cole operates, include beliefs of and assumptions made by Cole’s management, and involve risks and uncertainties that could significantly affect the financial results of Cole. Words such as “may,” “expects,” “anticipates,” “intends,” “plans,” “believes,” “projects,” “seeks,” “estimates,” “would,” “could” and “should” and variations of such words and similar expressions are intended to identify such forward-looking statements, which generally are not historical in nature. Such forward-looking statements include, but are not limited to, statements about future financial and operating results and the Cole’s plans, objectives, expectations and intentions. All statements that address operating performance, events or developments that Cole expects or anticipates will occur in the future are forward-looking statements. These statements are not guarantees of future performance and involve certain risks, uncertainties and assumptions that are difficult to predict. Although Cole believes the expectations reflected in any forward-looking statements are based on reasonable assumptions, it can give no assurance that its expectations will be attained and therefore, actual outcomes and results may differ materially from what is expressed or forecasted in such forward-looking statements. Some of the factors that could cause actual results to differ materially from any forward-looking statements include, among others, (i) changes in national, international, regional and local economic conditions, (ii) changes in financial markets, interest rates, credit spreads, and foreign currency exchange rates, (iii) changes in real estate conditions, (iv) continued ability to source new investments, (v) risks associated with acquisitions, (vi) construction costs that may exceed estimates, and construction delays, (vii) lease-up risks, rent relief, and inability to obtain new tenants upon the expiration or termination of existing leases, (viii) maintenance of real estate investment trust status, (ix) legal matters, (x) availability of financing and capital generally, (xi) inability to obtain financing or refinance existing debt and the potential need to fund tenant improvements or other capital expenditures out of operating cash flows, (xii) changes in demand for properties, and (xiii) risks associated with the ability to consummate the merger with American Realty Capital Properties, Inc. (“ARCP”) and the timing of the closing of the ARCP Merger, and (xiv) additional risks and factors discussed in reports filed by Cole with the SEC from time to time. Cole does not make any undertaking with respect to updating any forward looking statements appearing in this presentation. Forward-Looking Statements
4© 2013 Cole Real Estate Investments, Inc. All Rights Reserved. Additional Information About the Merger with ARCP and Where to Find It This communication does not constitute an offer to sell or the solicitation of an offer to buy any securities or a solicitation of any vote or approval. In connection with the proposed merger with ARCP, ARCP and Cole expect to prepare and file with the SEC a joint proxy statement and ARCP expects to prepare and file with the SEC a registration statement on Form S-4 containing a joint proxy statement/prospectus and other documents with respect to Cole’s proposed merger with ARCP. The joint proxy/prospectus will contain important information about the proposed transaction and related matters. INVESTORS ARE URGED TO READ THE PROXY STATEMENT/PROSPECTUS (INCLUDING ALL AMENDMENTS AND SUPPLEMENTS THERETO) AND OTHER RELEVANT DOCUMENTS FILED BY ARCP OR COLE WITH THE SEC IF AND WHEN THEY BECOME AVAILABLE BECAUSE THEY WILL CONTAIN IMPORTANT INFORMATION ABOUT ARCP, COLE AND THE PROPOSED MERGER. Investors and stockholders of ARCP and Cole may obtain free copies of the registration statement, the joint proxy statement/prospectus and other relevant documents filed by ARCP and Cole with the SEC (if and when they become available) through the website maintained by the SEC at www.sec.gov. Copies of the documents filed by ARCP with the SEC are also available free of charge on ARCP’s website at www.arcpreit.com and copies of the documents filed by Cole with the SEC are available free of charge on Cole’s website at www.coleREIT.com. Participants in Solicitation Relating to the Merger with ARCP ARCP, Cole, AR Capital, LLC and their respective directors and executive officers may be deemed to be participants in the solicitation of proxies from ARCP’s and Cole’s stockholders in respect of the proposed merger. Information regarding ARCP’s directors and executive officers can be found in ARCP’s definitive proxy statement filed with the SEC on April 30, 2013. Information regarding the Cole’s directors and executive officers can be found in Cole’s definitive proxy statement filed with the SEC on April 11, 2013. Additional information regarding the interests of such potential participants will be included in the joint proxy statement/prospectus and other relevant documents filed with the SEC in connection with the proposed merger if and when they become available. These documents are available free of charge on the SEC’s website and from ARCP or Cole, as applicable, using the sources indicated above. Important Notices
5© 2013 Cole Real Estate Investments, Inc. All Rights Reserved. Information Overview 2013 Third Quarter Highlights Page 6 Financials » Operating Results » 2013 Fourth Quarter Guidance » Current Dividend and Payout Ratios » Balance Sheet Activity Pages 7 - 10 Private Capital Management Page 11 Real Estate Portfolio Review » Portfolio Construction History » Current Portfolio Composition » Adjusted Net Operating Income » Weighted Average Lease Term Remaining (WALT) and Occupancy » Credit Quality » Geographic Diversification » Industry Diversification » Tenancy Diversification Pages 12 - 19 About the Data Pages 20 - 22
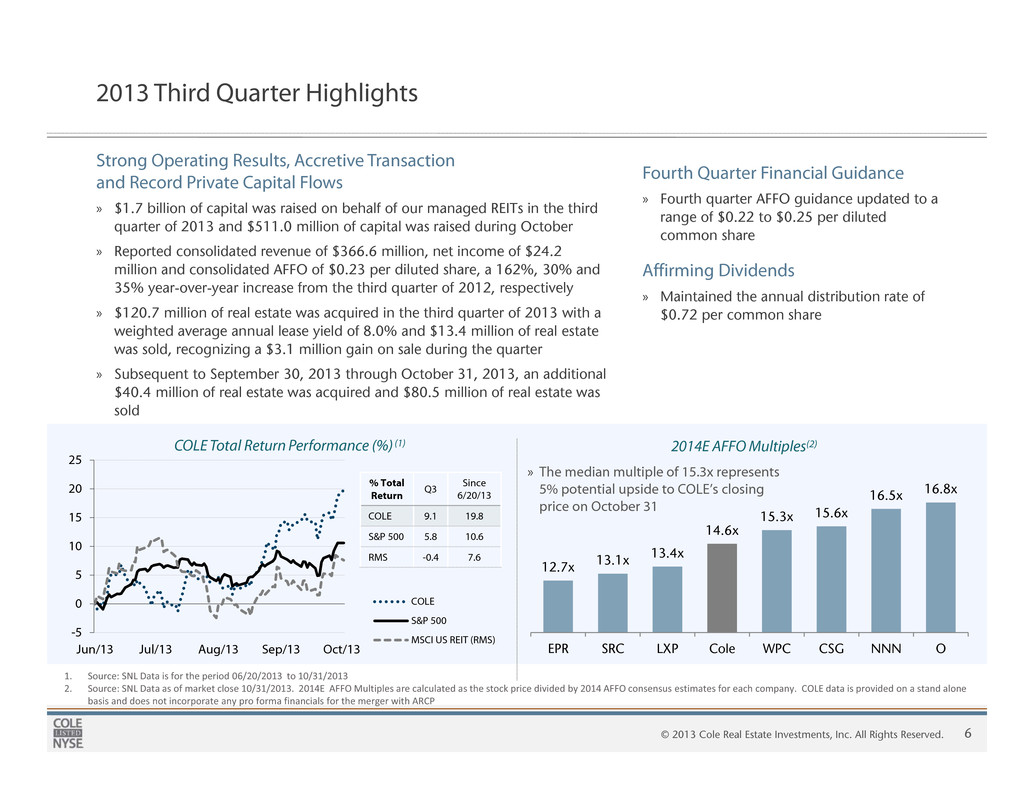
6© 2013 Cole Real Estate Investments, Inc. All Rights Reserved. 12.7x 13.1x 13.4x 14.6x 15.3x 15.6x 16.5x 16.8x EPR SRC LXP Cole WPC CSG NNN O -5 0 5 10 15 20 25 Jun/13 Jul/13 Aug/13 Sep/13 Oct/13 COLE S&P 500 MSCI US REIT (RMS) % Total Return Q3 Since 6/20/13 COLE 9.1 19.8 S&P 500 5.8 10.6 RMS -0.4 7.6 2013 Third Quarter Highlights Strong Operating Results, Accretive Transaction and Record Private Capital Flows » $1.7 billion of capital was raised on behalf of our managed REITs in the third quarter of 2013 and $511.0 million of capital was raised during October » Reported consolidated revenue of $366.6 million, net income of $24.2 million and consolidated AFFO of $0.23 per diluted share, a 162%, 30% and 35% year-over-year increase from the third quarter of 2012, respectively » $120.7 million of real estate was acquired in the third quarter of 2013 with a weighted average annual lease yield of 8.0% and $13.4 million of real estate was sold, recognizing a $3.1 million gain on sale during the quarter » Subsequent to September 30, 2013 through October 31, 2013, an additional $40.4 million of real estate was acquired and $80.5 million of real estate was sold COLE Total Return Performance (%) (1) 1. Source: SNL Data is for the period 06/20/2013 to 10/31/2013 2. Source: SNL Data as of market close 10/31/2013. 2014E AFFO Multiples are calculated as the stock price divided by 2014 AFFO consensus estimates for each company. COLE data is provided on a stand alone basis and does not incorporate any pro forma financials for the merger with ARCP 2014E AFFO Multiples(2) » The median multiple of 15.3x represents 5% potential upside to COLE’s closing price on October 31 Fourth Quarter Financial Guidance » Fourth quarter AFFO guidance updated to a range of $0.22 to $0.25 per diluted common share Affirming Dividends » Maintained the annual distribution rate of $0.72 per common share

7© 2013 Cole Real Estate Investments, Inc. All Rights Reserved. Financials Operating Results Summary Financial Results ($ in thousands, except per share data) Three Months Ended Sept. 30, 2013 Three Months Ended Sept. 30, 2012 Total Real Estate Investment Private Capital Management Year-Over-Year % Change Total Real Estate Investment Net Income $ 24,189 $ 10,928 $ 13,261 30% $ 18,567 $ 18,567 EBITDA (1) $ 129,363 $ 102,713 $ 26,650 18% $ 109,474 $ 109,474 Normalized EBITDA(1) $ 168,631 $ 140,810 $ 27,821 37% $ 123,086 $ 123,086 Annualized Normalized EBITDA $ 674,524 $ 492,344 Funds From Operations (FFO) (1) $ 73,105 $ 59,844 $ 13,261 13% $ 64,496 $ 64,496 FFO per common share, diluted $ 0.15 $ 0.12 $ 0.03 7% $ 0.14 $ 0.14 Adjusted Funds From Operations (AFFO) (1) (2) $ 112,772 $ 94,532 $ 18,240 40% $ 80,640 $ 80,640 AFFO per common share, diluted $ 0.23 $ 0.19 $ 0.04 35% $ 0.17 $ 0.17 Weighted average shares outstanding, diluted 495,479,956 476,353,149 For more information, reference the supplemental financial information for the third quarter of 2013 furnished to the SEC on Form 8-K on November 5, 2013 (“Supplemental Financial Information”). Private Capital Management data is not applicable for the three months ended September 30, 2012 as the acquisition of Cole Holdings Corporation occurred on April 5, 2013. 1. EBITDA, Normalized EBITDA, FFO and AFFO are non-GAAP measures. See “About the Data” for a description of our non-GAAP measures and accompanying Supplemental Financial Information for GAAP reconciliation. 2. During each of the three months ended September 30, 2013 and September 30, 2012, the Company capitalized expenses incurred related to the ongoing maintenance of the properties, including tenant improvements and leasing commissions, of $2.1 million.
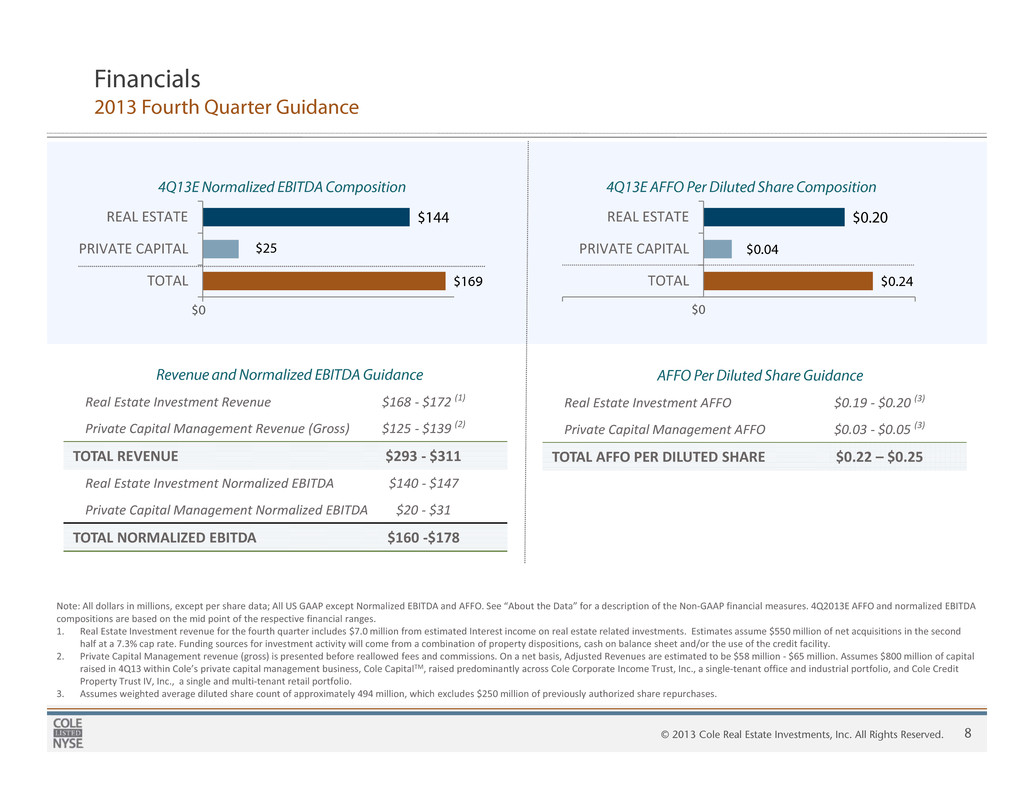
8© 2013 Cole Real Estate Investments, Inc. All Rights Reserved. Note: All dollars in millions, except per share data; All US GAAP except Normalized EBITDA and AFFO. See “About the Data” for a description of the Non-GAAP financial measures. 4Q2013E AFFO and normalized EBITDA compositions are based on the mid point of the respective financial ranges. 1. Real Estate Investment revenue for the fourth quarter includes $7.0 million from estimated Interest income on real estate related investments. Estimates assume $550 million of net acquisitions in the second half at a 7.3% cap rate. Funding sources for investment activity will come from a combination of property dispositions, cash on balance sheet and/or the use of the credit facility. 2. Private Capital Management revenue (gross) is presented before reallowed fees and commissions. On a net basis, Adjusted Revenues are estimated to be $58 million - $65 million. Assumes $800 million of capital raised in 4Q13 within Cole’s private capital management business, Cole CapitalTM, raised predominantly across Cole Corporate Income Trust, Inc., a single-tenant office and industrial portfolio, and Cole Credit Property Trust IV, Inc., a single and multi-tenant retail portfolio. 3. Assumes weighted average diluted share count of approximately 494 million, which excludes $250 million of previously authorized share repurchases. $0.24 $0.04 $0.20 TOTAL PRIVATE CAPITAL REAL ESTATE 4Q13E AFFO Per Diluted Share Composition $169 $25 $144 TOTAL PRIVATE CAPITAL REAL ESTATE 4Q13E Normalized EBITDA Composition Revenue and Normalized EBITDA Guidance Real Estate Investment Revenue $168 - $172 (1) Private Capital Management Revenue (Gross) $125 - $139 (2) TOTAL REVENUE $293 - $311 Real Estate Investment Normalized EBITDA $140 - $147 Private Capital Management Normalized EBITDA $20 - $31 TOTAL NORMALIZED EBITDA $160 -$178 $0 $0 AFFO Per Diluted Share Guidance Real Estate Investment AFFO $0.19 - $0.20 (3) Private Capital Management AFFO $0.03 - $0.05 (3) TOTAL AFFO PER DILUTED SHARE $0.22 – $0.25 Financials 2013 Fourth Quarter Guidance

9© 2013 Cole Real Estate Investments, Inc. All Rights Reserved. Financials Current Dividend and Payout Ratios 2014E Consensus AFFO Payout Ratios(3) 1. Dividend yield is calculated by dividing annualized dividends per common share by closing stock price on September 30, 2013. AFFO payout ratio is calculated as the annualized third quarter dividend ($0.72) divided by annualized third quarter AFFO ($0.92). 2. The dividend amount represents dividends paid on an annualized basis , which increased to $0.70 for dividends paid beginning on April 5, 2013 and again to $0.72 for dividends paid beginning on August 1, 2013. 3. Source: SNL Financial. Payout ratio is calculated as the annualized current dividend divided by consensus 2014 AFFO estimates. Data as of 10/31/2013. COLE data is provided on a stand alone basis and does not incorporate any pro forma financials for the merger with ARCP. Cole has consistently delivered a monthly dividend to investors » Dividend Yield at September 30, 2013: 5.9%(1) » Q3 2013 AFFO payout ratio: 78%(1) 2013 Dividend History(2) $0.65 $0.65 $0.65 $0.70 $0.70 $0.70 $0.70 $0.72 $0.72 $0.72 J a n F e b M a r A p r M a y J u n J u l A u g S e p O c t LXP COLE WPC NNN EPR SRC CSG O Payout Ratio 69% 74% 77% 78% 78% 82% 83% 88% Dividend/share $0.60 $0.72 $3.36 $1.62 $3.16 $0.66 $0.50 $2.18 Consensus 2014E AFFO/share $0.87 $0.97 $4.34 $2.09 $4.07 $0.80 $0.60 $2.48 69% 74% 77% 78% 78% 82% 83% 88%
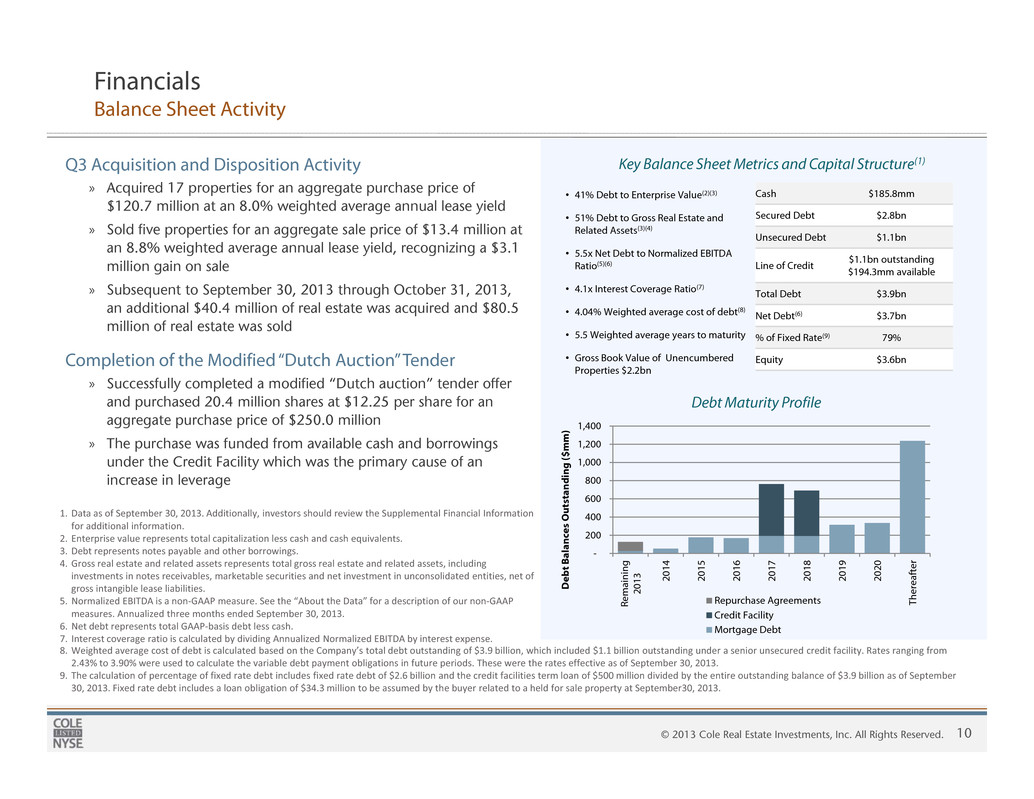
10© 2013 Cole Real Estate Investments, Inc. All Rights Reserved. - 200 400 600 800 1,000 1,200 1,400 R e m a i n i n g 2 0 1 3 2 0 1 4 2 0 1 5 2 0 1 6 2 0 1 7 2 0 1 8 2 0 1 9 2 0 2 0 T h e r e a f t e r D e b t B a l a n c e s O u t s t a n d i n g ( $ m m ) Repurchase Agreements Credit Facility Mortgage Debt Key Balance Sheet Metrics and Capital Structure(1) Debt Maturity Profile Cash $185.8mm Secured Debt $2.8bn Unsecured Debt $1.1bn Line of Credit $1.1bn outstanding $194.3mm available Total Debt $3.9bn Net Debt(6) $3.7bn % of Fixed Rate(9) 79% Equity $3.6bn 1. Data as of September 30, 2013. Additionally, investors should review the Supplemental Financial Information for additional information. 2. Enterprise value represents total capitalization less cash and cash equivalents. 3. Debt represents notes payable and other borrowings. 4. Gross real estate and related assets represents total gross real estate and related assets, including investments in notes receivables, marketable securities and net investment in unconsolidated entities, net of gross intangible lease liabilities. 5. Normalized EBITDA is a non-GAAP measure. See the “About the Data” for a description of our non-GAAP measures. Annualized three months ended September 30, 2013. 6. Net debt represents total GAAP-basis debt less cash. 7. Interest coverage ratio is calculated by dividing Annualized Normalized EBITDA by interest expense. • 41% Debt to Enterprise Value(2)(3) • 51% Debt to Gross Real Estate and Related Assets(3)(4) • 5.5x Net Debt to Normalized EBITDA Ratio(5)(6) • 4.1x Interest Coverage Ratio(7) • 4.04% Weighted average cost of debt(8) • 5.5 Weighted average years to maturity • Gross Book Value of Unencumbered Properties $2.2bn Q3 Acquisition and Disposition Activity » Acquired 17 properties for an aggregate purchase price of $120.7 million at an 8.0% weighted average annual lease yield » Sold five properties for an aggregate sale price of $13.4 million at an 8.8% weighted average annual lease yield, recognizing a $3.1 million gain on sale » Subsequent to September 30, 2013 through October 31, 2013, an additional $40.4 million of real estate was acquired and $80.5 million of real estate was sold Completion of the Modified “Dutch Auction” Tender » Successfully completed a modified “Dutch auction” tender offer and purchased 20.4 million shares at $12.25 per share for an aggregate purchase price of $250.0 million » The purchase was funded from available cash and borrowings under the Credit Facility which was the primary cause of an increase in leverage Financials Balance Sheet Activity 8. Weighted average cost of debt is calculated based on the Company’s total debt outstanding of $3.9 billion, which included $1.1 billion outstanding under a senior unsecured credit facility. Rates ranging from 2.43% to 3.90% were used to calculate the variable debt payment obligations in future periods. These were the rates effective as of September 30, 2013. 9. The calculation of percentage of fixed rate debt includes fixed rate debt of $2.6 billion and the credit facilities term loan of $500 million divided by the entire outstanding balance of $3.9 billion as of September 30, 2013. Fixed rate debt includes a loan obligation of $34.3 million to be assumed by the buyer related to a held for sale property at September30, 2013.
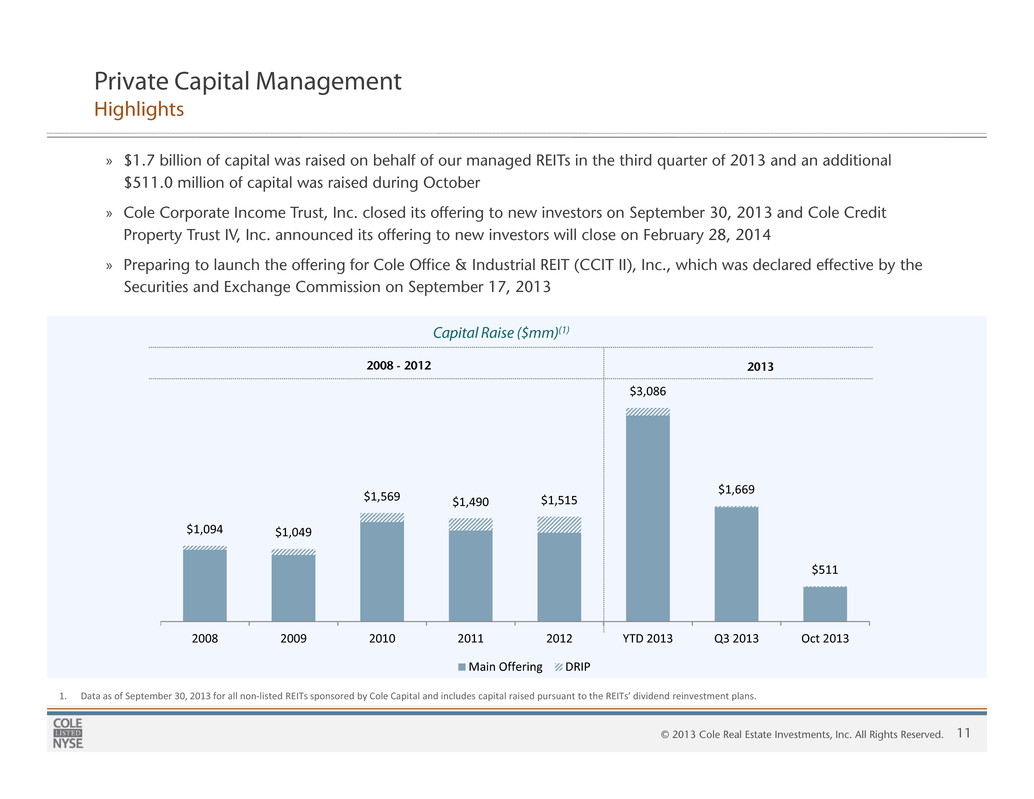
11© 2013 Cole Real Estate Investments, Inc. All Rights Reserved. Private Capital Management Highlights » $1.7 billion of capital was raised on behalf of our managed REITs in the third quarter of 2013 and an additional $511.0 million of capital was raised during October » Cole Corporate Income Trust, Inc. closed its offering to new investors on September 30, 2013 and Cole Credit Property Trust IV, Inc. announced its offering to new investors will close on February 28, 2014 » Preparing to launch the offering for Cole Office & Industrial REIT (CCIT II), Inc., which was declared effective by the Securities and Exchange Commission on September 17, 2013 1. Data as of September 30, 2013 for all non-listed REITs sponsored by Cole Capital and includes capital raised pursuant to the REITs’ dividend reinvestment plans. Capital Raise ($mm)(1) 2008 - 2012 2013 $1,094 $1,049 $1,569 $1,490 $1,515 $3,086 $1,669 $511 2008 2009 2010 2011 2012 YTD 2013 Q3 2013 Oct 2013 Main Offering DRIP
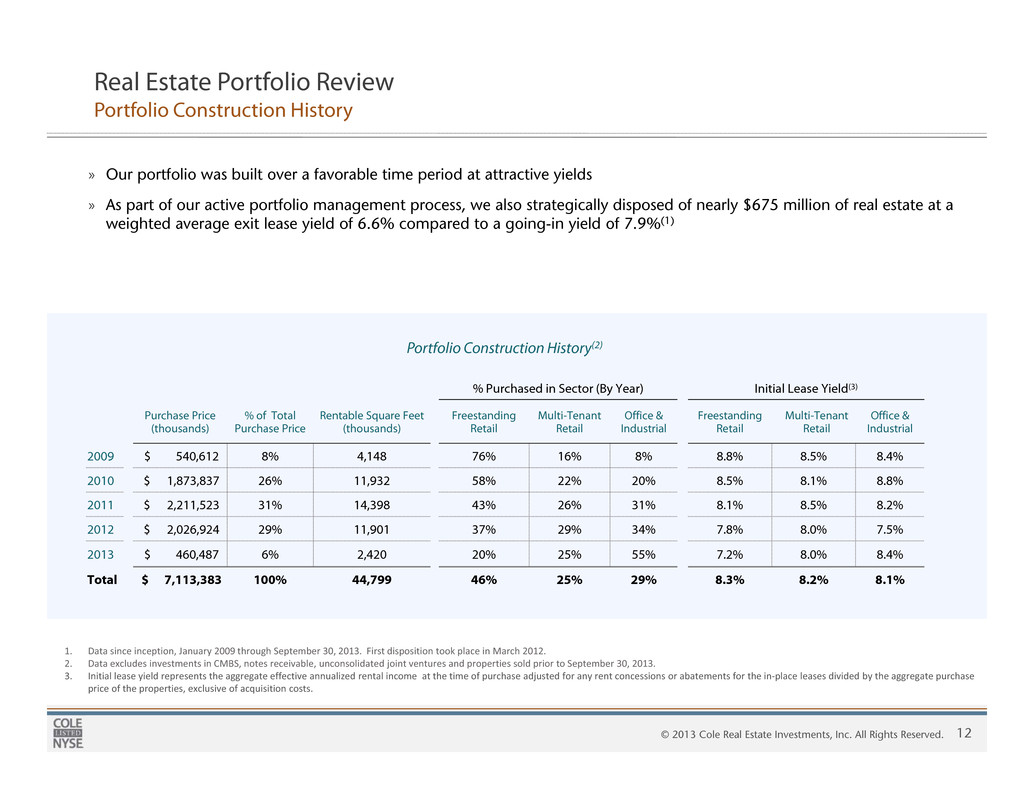
12© 2013 Cole Real Estate Investments, Inc. All Rights Reserved. Real Estate Portfolio Review Portfolio Construction History % Purchased in Sector (By Year) Initial Lease Yield(3) Purchase Price (thousands) % of Total Purchase Price Rentable Square Feet (thousands) Freestanding Retail Multi-Tenant Retail Office & Industrial Freestanding Retail Multi-Tenant Retail Office & Industrial 2009 $ 540,612 8% 4,148 76% 16% 8% 8.8% 8.5% 8.4% 2010 $ 1,873,837 26% 11,932 58% 22% 20% 8.5% 8.1% 8.8% 2011 $ 2,211,523 31% 14,398 43% 26% 31% 8.1% 8.5% 8.2% 2012 $ 2,026,924 29% 11,901 37% 29% 34% 7.8% 8.0% 7.5% 2013 $ 460,487 6% 2,420 20% 25% 55% 7.2% 8.0% 8.4% Total $ 7,113,383 100% 44,799 46% 25% 29% 8.3% 8.2% 8.1% Portfolio Construction History(2) 1. Data since inception, January 2009 through September 30, 2013. First disposition took place in March 2012. 2. Data excludes investments in CMBS, notes receivable, unconsolidated joint ventures and properties sold prior to September 30, 2013. 3. Initial lease yield represents the aggregate effective annualized rental income at the time of purchase adjusted for any rent concessions or abatements for the in-place leases divided by the aggregate purchase price of the properties, exclusive of acquisition costs. » Our portfolio was built over a favorable time period at attractive yields » As part of our active portfolio management process, we also strategically disposed of nearly $675 million of real estate at a weighted average exit lease yield of 6.6% compared to a going-in yield of 7.9%(1)
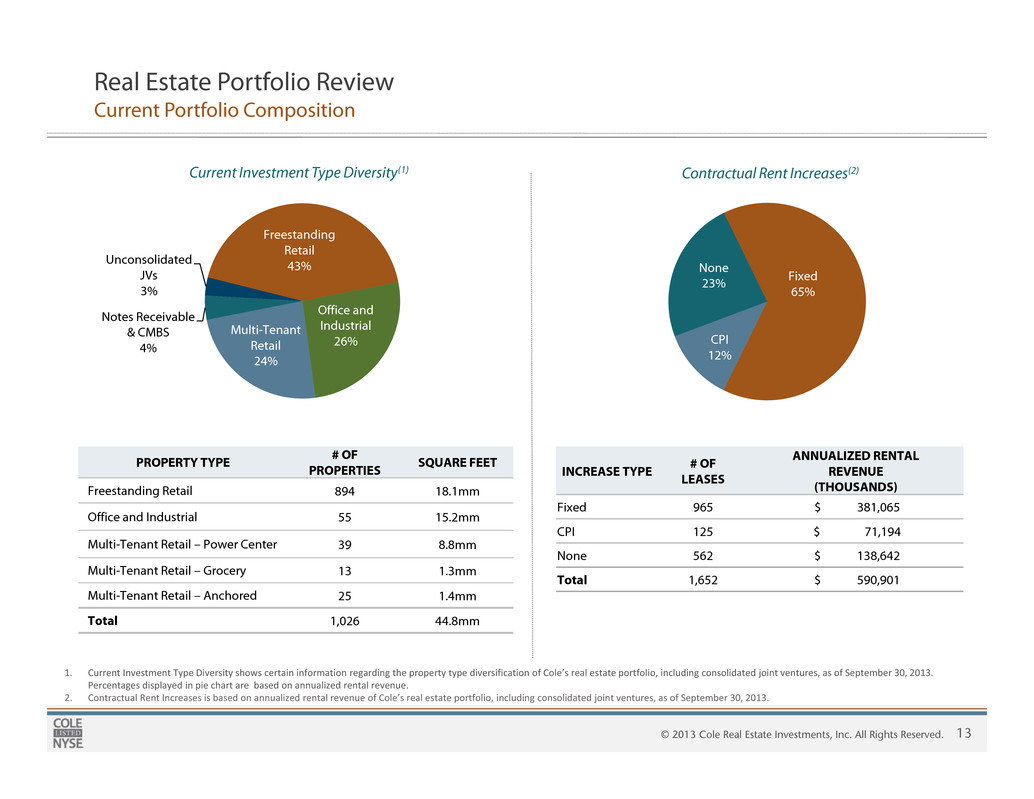
13© 2013 Cole Real Estate Investments, Inc. All Rights Reserved. Freestanding Retail 43% Office and Industrial 26% Multi-Tenant Retail 24% Notes Receivable & CMBS 4% Unconsolidated JVs 3% Real Estate Portfolio Review Current Portfolio Composition PROPERTY TYPE # OF PROPERTIES SQUARE FEET Freestanding Retail 894 18.1mm Office and Industrial 55 15.2mm Multi-Tenant Retail – Power Center 39 8.8mm Multi-Tenant Retail – Grocery 13 1.3mm Multi-Tenant Retail – Anchored 25 1.4mm Total 1,026 44.8mm Current Investment Type Diversity(1) 1. Current Investment Type Diversity shows certain information regarding the property type diversification of Cole’s real estate portfolio, including consolidated joint ventures, as of September 30, 2013. Percentages displayed in pie chart are based on annualized rental revenue. 2. Contractual Rent Increases is based on annualized rental revenue of Cole’s real estate portfolio, including consolidated joint ventures, as of September 30, 2013. Fixed 65% CPI 12% None 23% Contractual Rent Increases(2) INCREASE TYPE # OF LEASES ANNUALIZED RENTAL REVENUE (THOUSANDS) Fixed 965 $ 381,065 CPI 125 $ 71,194 None 562 $ 138,642 Total 1,652 $ 590,901
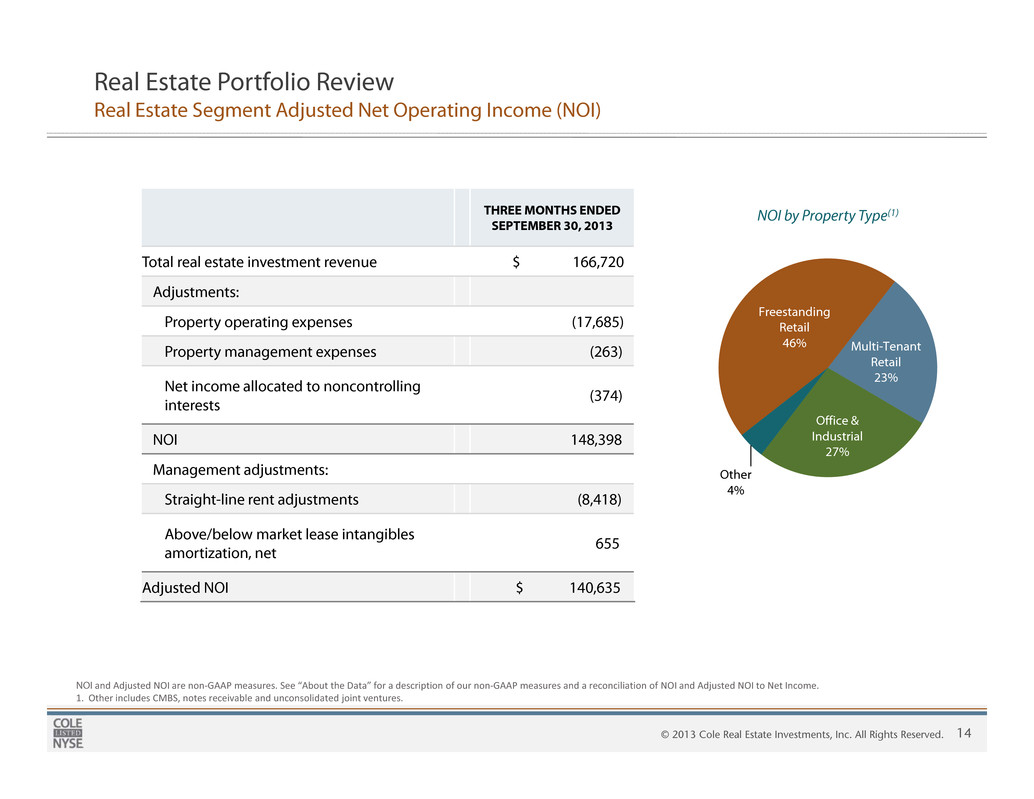
14© 2013 Cole Real Estate Investments, Inc. All Rights Reserved. Real Estate Portfolio Review Real Estate Segment Adjusted Net Operating Income (NOI) NOI and Adjusted NOI are non-GAAP measures. See “About the Data” for a description of our non-GAAP measures and a reconciliation of NOI and Adjusted NOI to Net Income. 1. Other includes CMBS, notes receivable and unconsolidated joint ventures. Freestanding Retail 46% Multi-Tenant Retail 23% Office & Industrial 27% Other 4% NOI by Property Type(1)THREE MONTHS ENDED SEPTEMBER 30, 2013 Total real estate investment revenue $ 166,720 Adjustments: Property operating expenses (17,685) Property management expenses (263) Net income allocated to noncontrolling interests (374) NOI 148,398 Management adjustments: Straight-line rent adjustments (8,418) Above/below market lease intangibles amortization, net 655 Adjusted NOI $ 140,635

15© 2013 Cole Real Estate Investments, Inc. All Rights Reserved. Real Estate Portfolio Review Weighted Average Lease Term Remaining (WALT) and Occupancy Freestanding Retail Multi-Tenant Retail Office and Industrial 0.1% 0.8% 1.2% 5.2% 10.0% 12.8% 69.9% 2013 2014 2015 3-5 Years 5-7 Years 7-10 Years 10+ Years 11.9 Years WALT(1) 99% Portfolio Occupancy 0.0% 0.0% 0.0% 0.0% 3.8% 11.2% 85.0% 2013 2014 2015 3-5 Years 5-7 Years 7-10 Years 10+ Years 0.5% 3.1% 4.6% 18.2% 28.0% 16.4% 29.2% 2013 2014 2015 3-5 Years 5-7 Years 7-10 Years 10+ Years 0.0% 0.0% 0.0% 1.9% 4.0% 11.9% 82.2% 2013 2014 2015 3-5 Years 5-7 Years 7-10 Years 10+ Years 1. Weighted average lease term (WALT) remaining is calculated using the remaining non-cancelable lease terms. 2. Lease Expiration Profile data shows certain information regarding the lease expirations of Cole’s real estate portfolio, including consolidated joint ventures, as of September 30, 2013, based on annualized rental revenue, during each of the next ten years and thereafter. Lease Expiration Profile(2) Lease Expiration Profile(2) Lease Expiration Profile(2)Lease Expiration Profile (2) 100% Portfolio Occupancy 14.5 Years WALT(1) 11.8 Years WALT(1) 100% Portfolio Occupancy 7.3 Years WALT(1) 96% Portfolio Occupancy Anchored – 98% Occupied Power Center - 96% Occupied Grocery - 98% Occupied Overall Portfolio

16© 2013 Cole Real Estate Investments, Inc. All Rights Reserved. Real Estate Portfolio Review Credit Quality(1) Overall Portfolio Multi-Tenant Retail Office and Industrial 38% Investment Grade Rating % of Total AAA to AA- 4.3% A+ to A- 3.7% BBB+ to BBB- 29.6% 37.6% Rating % of Total AAA to AA- 1.8% A+ to A- 13.3% BBB+ to BBB- 15.2% 30.3% Rating % of Total AAA to AA- 18.2% A+ to A- 34.7% BBB+ to BBB- 11.7% 64.6% Investment Grade 43% Implied Investment Grade 16% Below Investment Grade 21% Implied Below Investment Grade 8% Not Rated 12% Example Tenant Rating USAA AA+ Wal-Mart AA Amazon AA- Target A+ Home Depot A- 43% Investment Grade Rating % of Total AAA to AA- 7.6% A+ to A- 14.9% BBB+ to BBB- 20.9% 43.4% 16% Implied Investment Grade Implied Rating % of Total AAA to AA- 4.2% A+ to A- 3.3% BBB+ to BBB- 8.1% 15.6% 1. Credit ratings based on annualized rental revenue from tenants with credit ratings of BBB- or higher. Tenant credit rating may reflect the credit rating of the parent company or a guarantor. Moody’s Credit Edge was used to determine implied credit rating for public non-rated tenants. Moody’s KMV was used to determine implied credit rating for private non-rated tenants. Data for implied ratings as of October 11, 2013. Example tenants are from the Cole portfolio. (IG: Investment Grade, NR: Not Rated). Freestanding Retail 59% Investment Grade Tenants Example Tenant Implied Rating Dollar Tree AAA Cost Plus AAA Tractor Supply AA+ Cracker Barrel AA Aaron’s Rents A 21% Implied Investment Grade 30% Investment Grade 65% Investment Grade 17% Implied Investment Grade 5% Implied Investment Grade 59% Investment Grade Tenants 47% Investment Grade Tenants 70% Investment Grade Tenants IG 65% Implied IG 5% Below IG 13% Implied Below IG 13% NR 4% IG 30% Implied IG 17% Below IG 22% Implied Below IG 4% NR 27%IG 38% Implied IG 21% Below IG 25% Implied Below IG 6% NR 10%
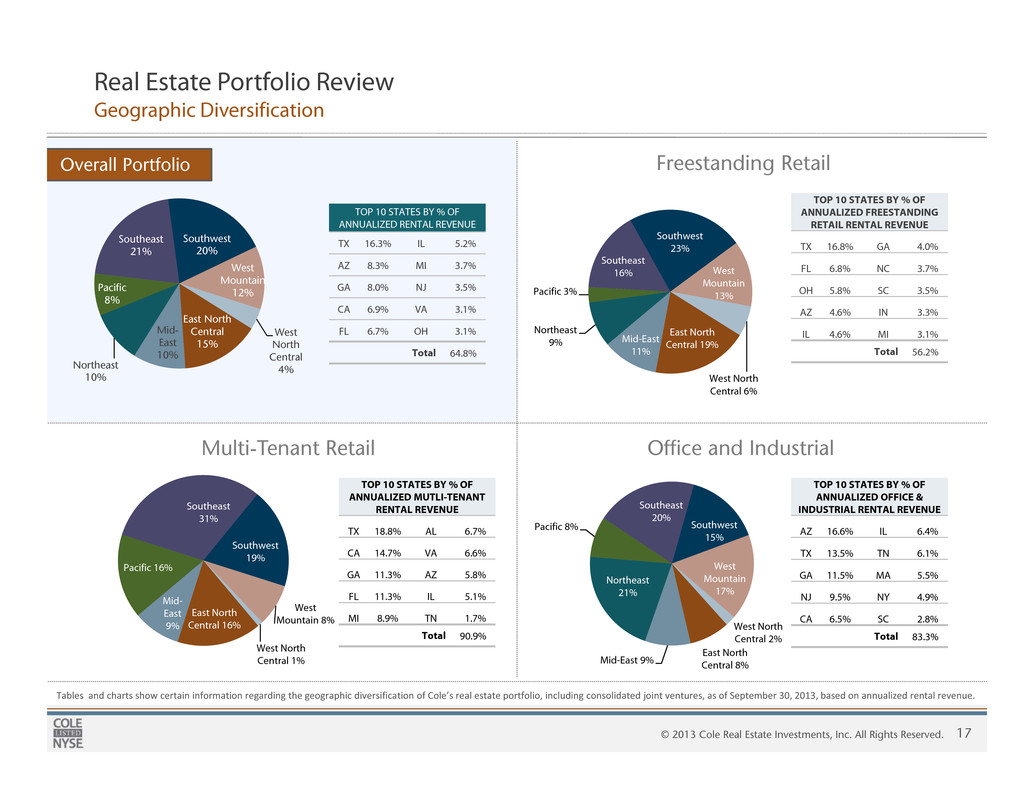
17© 2013 Cole Real Estate Investments, Inc. All Rights Reserved. Real Estate Portfolio Review Geographic Diversification Tables and charts show certain information regarding the geographic diversification of Cole’s real estate portfolio, including consolidated joint ventures, as of September 30, 2013, based on annualized rental revenue. Multi-Tenant Retail Office and Industrial TOP 10 STATES BY % OF ANNUALIZED RENTAL REVENUE TX 16.3% IL 5.2% AZ 8.3% MI 3.7% GA 8.0% NJ 3.5% CA 6.9% VA 3.1% FL 6.7% OH 3.1% Total 64.8% East North Central 15% Mid- East 10% Northeast 10% Pacific 8% Southeast 21% Southwest 20% West Mountain 12% West North Central 4% TOP 10 STATES BY % OF ANNUALIZED FREESTANDING RETAIL RENTAL REVENUE TX 16.8% GA 4.0% FL 6.8% NC 3.7% OH 5.8% SC 3.5% AZ 4.6% IN 3.3% IL 4.6% MI 3.1% Total 56.2% TOP 10 STATES BY % OF ANNUALIZED MUTLI-TENANT RENTAL REVENUE TX 18.8% AL 6.7% CA 14.7% VA 6.6% GA 11.3% AZ 5.8% FL 11.3% IL 5.1% MI 8.9% TN 1.7% Total 90.9% TOP 10 STATES BY % OF ANNUALIZED OFFICE & INDUSTRIAL RENTAL REVENUE AZ 16.6% IL 6.4% TX 13.5% TN 6.1% GA 11.5% MA 5.5% NJ 9.5% NY 4.9% CA 6.5% SC 2.8% Total 83.3% East North Central 19%Mid-East 11% Northeast 9% Pacific 3% Southeast 16% Southwest 23% West Mountain 13% West North Central 6% East North Central 16% Mid- East 9% Pacific 16% Southeast 31% Southwest 19% West Mountain 8% West North Central 1% East North Central 8%Mid-East 9% Northeast 21% Pacific 8% Southeast 20% Southwest 15% West Mountain 17% West North Central 2% Freestanding RetailOverall Portfolio

18© 2013 Cole Real Estate Investments, Inc. All Rights Reserved. Real Estate Portfolio Review Industry Diversification Tables show certain information regarding the industry diversification of Cole’s real estate portfolio, including consolidated joint ventures, as of September 30, 2013, based on annualized rental revenue. 1. Weighted average lease term (WALT) remaining is calculated using the remaining non-cancelable lease terms. TOP 10 INDUSTRIES NUMBER OF LEASES % OF ANNUALIZED RENTAL REVENUE WALT(1) GROCERY 79 9.1% 15.0 Years DRUGSTORE 127 8.1% 17.8 Years DISCOUNT STORE 105 7.8% 9.9 Years FULL SERVICE RESTAURANT 168 6.4% 14.4 Years HOME AND GARDEN 71 5.4% 13.9 Years PET SUPPLIES 41 4.4% 7.8 Years WAREHOUSE CLUB 7 4.1% 15.9 Years HEALTHCARE 60 3.8% 10.9 Years COMMUNICATIONS 34 3.7% 8.7 Years FINANCIAL SERVICES 53 3.4% 11.8 Years TOP 10 TOTAL 745 56.2% TOTAL NUMBER OF INDUSTRIES 35 INDUSTRY NUMBER OF LEASES % OF ANNUALIZED FREESTANDING RETAIL RENTAL REVENUE WALT(1) DRUGSTORE 120 15.6% 18.5 Years GROCERY 60 15.1% 15.7Years FULL SERVICE RESTAURANT 72 10.7% 17.2Years DISCOUNT STORE 40 8.8% 12.1Years HOME AND GARDEN 55 7.7% 13.2 Years CONVENIENCE STORE 80 6.3% 14.0 Years WAREHOUSE CLUB 5 6.3% 16.0 Years LIMITED SERVICE RESTAURANT 30 4.5% 13.8 Years AUTOMOTIVE 74 4.4% 12.2 Years FITNESS 15 4.4% 10.8 Years TOTAL 551 83.8% INDUSTRY NUMBER OF LEASES % OF ANNUALIZED MULTI-TENANT RETAIL RENTAL REVENUE WALT(1) DISCOUNT STORE 64 10.5% 5.7 Years APPAREL 115 9.7% 4.8 Years GROCERY 19 8.3% 12.6 Years PET SUPPLIES 34 7.3% 6.0 Years SPECIALTY RETAIL 91 6.8% 6.5 Years FULL SERVICE RESTAURANT 96 5.9% 5.0 Years HOME FURNISHINGS 39 5.3% 4.7 Years HOBBY, BOOKS AND MUSIC 41 5.2% 5.0 Years DEPARTMENT STORE 15 5.0% 13.5 Years LIMITED SERVICE RESTAURANT 108 4.5% 6.0 Years TOTAL 622 68.5% INDUSTRY NUMBER OF LEASES % OF ANNUALIZED OFFICE & INDUSTRIAL RENTAL REVENUE WALT(1) COMMUNICATIONS 3 11.6% 9.3 Years HEALTHCARE 12 11.5% 11.9 Years OTHER PROFESSIONAL SERVICES 6 10.1% 10.9 Years EDUCATION 1 8.7% 17.5 Years WHOLESALE 3 8.3% 13.0 Years FINANCIAL SERVICES 2 8.1% 10.4 Years MANUFACTURING 5 8.0% 10.2 Years INSURANCE SERVICES 4 6.9% 9.4 Years PET SUPPLIES 3 5.1% 9.9 Years MINING AND NATURAL RESOURCES 1 4.7% 13.8 Years TOTAL 40 83.0% Multi-Tenant Retail Office and Industrial Freestanding RetailOverall Portfolio

19© 2013 Cole Real Estate Investments, Inc. All Rights Reserved. TENANT NUMBER OF LEASES % OF ANNUALIZED MULTI-TENANT RENTAL REVENUE WALT(1) CREDIT RATING(2) PETSMART 28 6.4% 5.9 Years BB+ KOHL'S 7 3.6% 13.8 Years BBB+ ROSS 17 3.4% 4.6 Years A- BED BATH & BEYOND 16 3.1% 4.6 Years BBB+ BEST BUY 10 3.1% 4.7 Years BB DICK'S SPORTING GOODS 7 2.5% 6.1 Years Not Rated TJ MAXX 10 2.1% 4.4 Years A HOBBY LOBBY 6 1.9% 6.6 Years Not Rated L.A. FITNESS 3 1.9% 10.7 Years Not Rated HOME DEPOT 3 1.7% 15.0 Years A- TOTAL 107 29.7% Real Estate Portfolio Review Tenancy Diversification TOP 10 TENANTS NUMBER OF LEASES % OF ANNUALIZED RENTAL REVENUE WALT(1) CREDIT RATING (2) WALGREENS 73 4.6% 17.7 Years BBB PETSMART 34 4.1% 7.9 Years BB+ ALBERTSON'S 34 4.1% 16.5 Years B CVS 53 3.4% 17.9 Years BBB+ AT&T 10 3.4% 9.1 Years A- BJ'S WHOLESALE CLUB 3 3.2% 17.4 Years B WAL-MART 10 2.7% 10.9 Years AA APOLLO GROUP 1 2.5% 17.5 Years Not Rated L.A. FITNESS 17 2.4% 10.8 Years Not Rated KOHL'S 20 2.4% 14.4 Years BBB+ TOP 10 TOTAL 255 32.8% TOTAL NUMBER OF TENANTS 600 TENANT NUMBER OF LEASES % OF ANNUALIZED FREESTANDING RETAIL RENTAL REVENUE WALT(1) CREDIT RATING(2) WALGREENS 71 9.7% 17.7 Years BBB ALBERTSON'S 33 8.4% 17.1 Years B CVS 48 5.8% 19.9 Years BBB+ BJ'S WHOLESALE CLUB 2 5.1% 18.0 Years B FAMILY DOLLAR 7 4.7% 13.6 Years BBB- L.A. FITNESS 14 4.2% 10.8 Years Not Rated TRACTOR SUPPLY 40 3.9% 11.6 Years Not Rated KOHL'S 13 3.1% 14.8 Years BBB+ ON THE BORDER 26 3.1% 16.8 Years Not Rated WAL-MART 8 3.1% 9.2 Years AA TOTAL 262 51.1% TENANT NUMBER OF LEASES % OF ANNUALIZED OFFICE & INDUSTRIAL RENTAL REVENUE WALT(1) CREDIT RATING(2) AT&T 2 11.6% 9.3 Years A- APOLLO GROUP 1 8.7% 17.5 Years Not Rated AMAZON 3 8.3% 13.0 Years AA- MERRILL LYNCH 1 6.6% 11.2 Years A PETSMART 3 5.1% 9.9 Years BB+ ENCANA OIL & GAS 1 4.7% 13.8 Years Not Rated HEALTHNOW 1 4.6% 10.8 Years BBB HOME DEPOT 4 4.3% 16.6 Years A- RSA SECURITY 2 4.1% 10.4 Years A WAL-MART 1 3.7% 12.5 Years AA TOTAL 19 61.7% Multi-Tenant Retail Office and Industrial Freestanding Retail Tables show certain information regarding the tenant and industry diversification of Cole’s real estate portfolio, including consolidated joint ventures, as of September 30, 2013, based on annualized rental revenue. 1. Weighted average lease term (WALT) remaining is calculated using the remaining non-cancelable lease terms. 2. Credit ratings based on annualized rental revenue from tenants with credit ratings of BBB- or higher. Tenant credit rating may reflect the credit rating of the parent company or a guarantor. Overall Portfolio
20© 2013 Cole Real Estate Investments, Inc. All Rights Reserved. About the Data Supplemental Information The Company’s supplemental financial information for the third quarter ended September 30, 2013, and the Company’s Form 10-Q report for the same period, were filed on November 5, 2013 and are available on the Company’s website at www.coleREIT.com. Non-GAAP Financial Measures FFO and AFFO Funds From Operations (“FFO”) is a non-GAAP financial performance measure defined by the National Association of Real Estate Investment Trusts (“NAREIT”) and widely recognized by investors and analysts as one measure of operating performance of a real estate company. The FFO calculation excludes items such as real estate depreciation and amortization, gains and losses on the sale of depreciable real estate and impairments of depreciable real estate. Depreciation and amortization as applied in accordance with GAAP implicitly assumes that the value of real estate assets diminishes predictably over time. Since real estate values have historically risen or fallen with market conditions, it is management's view, and the Company believes the view of many industry investors and analysts, that the presentation of operating results for real estate companies by using the historical cost accounting method alone is insufficient. In addition, FFO excludes gains and losses from the sale of depreciable real estate and impairment charges on depreciable real estate, which the Company believes provides management and investors with a helpful additional measure of the performance of the Company’s real estate portfolio, as it allows for comparisons, year to year, that reflect the impact on operations from trends in items such as occupancy rates, rental rates, operating costs, general and administrative expenses, and interest costs. The Company computes FFO in accordance with NAREIT’s definition. In addition to FFO, the Company uses Adjusted Funds From Operations (“AFFO”) as a non-GAAP supplemental financial performance measure to evaluate the operating performance of the Company. AFFO, as defined by the Company, excludes from FFO items such as acquisition and merger related costs that are required to be expensed in accordance with GAAP, straight-line rental revenue, certain charges such as amortization of intangibles, listing and tender offer related costs, stock-based compensation and gains and losses. The Company’s management believes that excluding these costs from FFO provides investors with supplemental performance information that is consistent with the performance models and analysis used by management, and provides investors a view of the performance of the Company’s portfolio over time, including after the Company ceases to acquire properties on a frequent and regular basis. AFFO also allows for a comparison of the performance of the Company’s operations with other traded REITs that are not currently engaging in acquisitions and mergers, as well as a comparison of the Company’s performance with that of other traded REITs, as AFFO, or an equivalent measure, is routinely reported by traded REITs, and the Company believes often used by analysts and investors for comparison purposes. See next page.
21© 2013 Cole Real Estate Investments, Inc. All Rights Reserved. About the Data (continued) Non-GAAP Financial Measures continued FFO and AFFO (continued) For all of these reasons, the Company believes FFO and AFFO, in addition to net income and cash flows from operating activities, as defined by GAAP, are helpful supplemental performance measures and useful in understanding the various ways in which the Company’s management evaluates the performance of the Company over time. However, not all REITs calculate FFO and AFFO the same way, so comparisons with other REITs may not be meaningful. FFO and AFFO should not be considered as alternatives to net income or to cash flows from operating activities, and are not intended to be used as a liquidity measure indicative of cash flow available to fund the Company’s cash needs. AFFO may provide investors with a view of the Company’s future performance and of the sustainability of the Company’s current dividend policy. However, because AFFO excludes items that are an important component in an analysis of the historical performance of a property, AFFO should not be construed as a historic performance measure. Neither the SEC, NAREIT, nor any other regulatory body has evaluated the acceptability of the exclusions contemplated to adjust FFO in order to calculate AFFO and its use as a non-GAAP financial performance measure. EBITDA and Normalized EBITDA Normalized EBITDA as disclosed represents EBITDA, or earnings before interest, taxes, depreciation and amortization, modified to include other adjustments to GAAP net income for merger expenses which are considered non-recurring and gains/losses in real estate and derivatives which are not considered fundamental attributes of the Company’s business plans and do not affect the Company’s overall long-term operating performance. The Company excludes these items from Normalized EBITDA as they are not the primary drivers in the Company’s decision making process. In addition, the Company’s assessment of the Company’s operations is focused on long-term sustainability and not on such non-cash items, which may cause short term fluctuations in net income but have no impact on cash flows. The Company believes that Normalized EBITDA is a useful supplemental measure to investors and analysts for assessing the performance of the Company’s business segments, although it does not represent net income that is computed in accordance with GAAP. Therefore, Normalized EBITDA should not be considered as an alternative to net income or as an indicator of the Company’s financial performance. The Company uses Normalized EBITDA as one measure of its operating performance when formulating corporate goals and evaluating the effectiveness of the Company’s strategies. Normalized EBITDA may not be comparable to similarly titled measures of other companies.

22© 2013 Cole Real Estate Investments, Inc. All Rights Reserved. About the Data (continued) Non-GAAP Financial Measures continued GAAP Reconciliations Reconciliations of net income to FFO, AFFO and Normalized EBITDA are provided in the Supplemental Financial Information for the third quarter of 2013 furnished to the SEC on Form 8-K on November 5, 2013. Lease Yield Lease yield is calculated as the average annual rental income, adjusted for any rent concessions or abatements, for the in-place leases over the non- cancellable lease term at the respective property divided by the property purchase price, exclusive of acquisition costs. In general, our properties are subject to long-term triple net or double net leases, and the future costs associated with the double net leases are unpredictable and may reduce the yield. NOI and Adjusted NOI Net Operating Income (“NOI”) is a non-GAAP performance measure used to evaluate the operating performance of a real estate company. NOI represents rental and other property income and tenant reimbursement income less property operating expenses. NOI excludes income from discontinued operations, interest expense, depreciation and amortization, general and administrative expenses, merger related compensation and merger and acquisition related expenses. Adjusted NOI excludes the impact of certain GAAP adjustments to rental revenue, such as straight-line rent adjustments, amortization of above market intangible lease assets or the amortization of below market lease intangible liabilities. It is management’s view that NOI and Adjusted NOI provide investors relevant and useful information because it reflects only income and operating expense items that are incurred at the property level and presents them on an unleveraged basis. NOI and Adjusted NOI should not be considered as an alternative to net income. Further, NOI and Adjusted NOI may not be comparable to similarly titled measures of other companies. Please see below for a reconciliation of net income to NOI and Adjusted NOI. NOI GAAP RECONCILIATION THREE MONTHS ENDED SEPTEMBER 30, 2013 Net income attributable to the Company $ 10,928 Adjustments: Interest and other expense, net 40,242 Depreciation and amortization 49,834 General and administrative expenses 12,462 Merger related stock-based compensation 13,329 Merger and acquisition related expenses 25,237 Income from discontinued operations (3,634) NOI 148,398 Management adjustments: Straight-line rent adjustments (8,418) Above/below market lease intangibles amortization, net 655 Adjusted NOI $ 140,635


