Exhibit (c)(4)
GUGGENHEIM GUGGENHEIM Securities Project Atlas Presentation to the Special Committee of the Board of Directors February 25, 2024 Privileged and Confidential
Certain Disclosures and Other Considerations In connection with the engagement of Guggenheim Securities, LLC (“Guggenheim Securities,” “we” or “us”) by the client referred to herein (the “Company”), we have prepared this presentation (together with any related oral commentary and any supplemental materials or updates, this “Presentation”) solely to: Assist the Special Committee of the Board of Directors of the Company (the “Special Committee”) in considering the proposed transaction described herein (the “Transaction”); and ? Describe the financial analyses and certain related considerations underlying the written fairness opinion (the “Opinion”) that the Special Committee has asked us to render in connection with the Transaction. All advice (written or oral) provided by us in connection with our engagement is intended solely for the benefit and use of the Special Committee and the Company’s senior management, solely in their respective capacities as such. Neither the Opinion nor this Presentation constitutes (i) a recommendation to the Special Committee or the Company with respect to the Transaction or (ii) advice or a recommendation to any of the Company’s stockholders, creditors, employees or other constituents as to how to vote or act, or whether to purchase or sell any securities or other financial instruments, in connection with the Transaction or otherwise. We express no view or opinion as to the price or range of prices at which the shares of common stock or other securities or financial instruments of or relating to the Company or any third party may trade at any time, including subsequent to the announcement or consummation of the Transaction. Our advice, the Opinion and this Presentation do not address the Company’s underlying business or financial decision to pursue the Transaction, the relative merits of the Transaction as compared to any alternative business or financial strategies that might exist for the Company, any financing of the Transaction or the effects of any other transaction in which the Company might engage. The Special Committee shall be responsible for determining whether the Transaction is in the best interests of the Company and its stockholders and other relevant constituencies. Our advice, the Opinion and this Presentation are qualified in their entirety by the terms, conditions and disclosures contained in our engagement letter with the Company (including any amendments or supplements thereto), which sets forth various important assumptions, limitations and other considerations regarding: The nature and scope of our engagement; ? The activities and relationships of Guggenheim Securities and our affiliates and related entities, which include a wide range of financial services and in the ordinary course may involve clients and competitors of the Company as well as actual and potential transaction counterparties; and Our use of and reliance on various information (including, without limitation, financial estimates and projections, synergy estimates and other forward-looking information) that has been furnished by or discussed with the Company, any potential or actual transaction counterparty and their respective representatives (collectively, the “Transaction Principals”) or is available from public sources, data suppliers and other third parties. In providing this Presentation, we (i) do not assume any responsibility, obligation or liability for the accuracy, completeness, reasonableness, achievability or independent verification of, and have not independently verified, any such information; (ii) express no view, opinion, representation, guaranty or warranty (in each case, express or implied) regarding the reasonableness or achievability of any forward-looking information or the assumptions upon which any such forward-looking information is based; (iii) have relied upon the assurances of the Transaction Principals that they are unaware of any facts or circumstances that would make any such information incomplete, inaccurate or misleading; (iv) have been advised by each Transaction Principal, and have assumed, that all forward-looking information furnished by it has been reasonably prepared on bases reflecting the best currently available estimates and judgments of its senior management as to the expected future performance of the relevant legal entity, business or assets and the expected amounts and realization of any transactionrelated synergies; (v) have assumed that any such transaction-related synergies will be realized in the amounts and at the times projected; (vi) have assumed that any such forwardlooking information and any changes therein have been reviewed by the Special Committee with the understanding that we will use and rely upon such information for purposes of our engagement; and (vii) have assumed that any information obtained from public sources, data suppliers and other third parties is reasonable and reliable. We do not provide legal, regulatory, tax, accounting or actuarial advice. We understand that the Company and the Special Committee will consult their own legal, regulatory, tax, accounting, actuarial and other professional advisors in connection with the Transaction and otherwise. Except as otherwise indicated herein, this Presentation has been prepared and submitted as of the date on its cover page, reflects information made available to us as of or prior to such date and is based on economic, capital markets and other conditions as of such date. We assume no obligation or liability (express or implied) for updating or otherwise revising this Presentation. This Presentation supersedes any previous presentation, materials or oral commentary delivered by us in connection with the Transaction. Our advice, the Opinion and this Presentation are confidential and proprietary to Guggenheim Securities and, except as provided in our engagement letter with the Company (including any amendments or supplements thereto) and the Opinion, may not be reproduced, disseminated, quoted from or referred to, in whole or in part, at any time, in any manner or for any purpose. © 2024 Guggenheim Securities. All rights reserved. GUGGENHEIM 1
Guggenheim Securities Material Relationships Disclosure Investment Banking Relationships and Revenues With respect to Norway (the “Company”). Aside from our current engagement by the Company in connection with the potential transaction described herein (the “Transaction”), during the past two years Guggenheim Securities has not been engaged by the Company or any of its affiliates identified to us by FactSet to provide any investment banking or financial advisory services for which Guggenheim Securities has received compensation. With respect to Canada (the “Specified Party”). During the past two years, Guggenheim Securities has not been engaged by the Specified Party or any of its affiliates identified to us by FactSet to provide any investment banking or financial advisory services for which Guggenheim Securities has received compensation. Guggenheim Securities is currently engaged by certain entities in which the Specified Party is a significant shareholder to provide investment banking and financial advisory services in connection with various matters that are unrelated to the Transaction, and for which matters, if consummated, we would expect to receive an agreed upon fee. Guggenheim Securities may currently be seeking and may in the future seek opportunities to provide financial advisory and other investment banking services to the Company, the Specified Party, and their respective affiliates in connection with matters unrelated to the Transaction, for which services Guggenheim Securities would expect to receive customary compensation. Guggenheim Securities may have also provided and may in the future provide financial advisory and other investment banking services to third parties in connection with transactions in which the Company, the Specified Party, and their respective affiliates were or are potential counterparties. Sales and Trading Relationships and Revenues The Company, the Specified Party, and their respective affiliates may be clients of Guggenheim Securities’ sales and trading business and of our asset management affiliates and related entities. As separately disclosed, customary information barriers separate Guggenheim Securities’ investment banking business from the rest of our firm, enabling the investment banking team that is working with the Company on the Transaction (the “IB Team”) to advise the Company without regard to any activities, relationships, or business conducted outside of our investment banking department. Investments in Securities and Other Financial Interests Guggenheim Securities makes markets in securities and other financial instruments but does not ordinarily take proprietary positions except as an accommodation to clients and customers; accordingly, Guggenheim Securities does not have any significant proprietary trading positions with respect to the Company, any Specified Party, or any of their respective affiliates identified to us by FactSet. Guggenheim Securities’ investment management affiliates and related entities may have positions in securities and other financial instruments of or relating to the Company, the Specified Party, and their respective affiliates, some of which may be significant and not all of which may be publicly disclosed. In light of confidentiality obligations owed to third parties and the information barriers separating Guggenheim Securities’ investment banking business from its investment management affiliates and related entities, Guggenheim Securities is unable to disclose any such positions. For reference purposes only, Guggenheim Securities notes that, as of the date hereof, the latest reports filed by its parent company and certain affiliates under Section 13(f) of the Securities Exchange Act of 1934, as amended, and the rules promulgated thereunder, disclose no holdings in excess of 1% of the equity securities of any of the Company, any Specified Party, or any of their respective affiliates identified to us by FactSet. Guggenheim Securities notes that its affiliates and related entities may have positions in the indebtedness of, and other financial interests in, the Company, the Specified Party, and their respective affiliates that may be substantial and are not publicly disclosed. Personal Investments, Directorships and other Relationships As of the date hereof, Guggenheim Securities’ internal records indicate that no member of the IB Team, nor any of their spouses, domestic partners, dependent children, or other covered relatives or household members, has any significant personal investments in any securities or other financial instruments of or relating to the Company, any Specified Party, or any of their respective affiliates identified to us by FactSet. In addition, as of the date hereof, Guggenheim Securities’ internal records indicate that no officer of our firm nor member of the IB Team is a director of, or otherwise has a business interest in the Company, any Specified Party, or any of their respective affiliates identified to us by FactSet. GUGGENHEIM 2
Table of Contents Section 1 Situation Overview 2 Summary of The Norway Management Projections 3 Financial Analyses Appendices GUGGENHEIM
GUGGENHEIM 1 Situation Overview
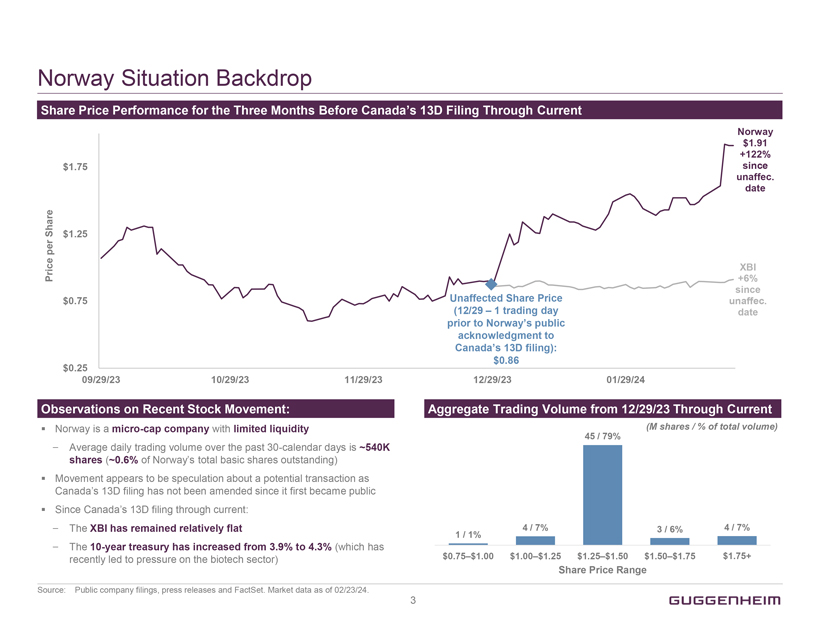
Norway Situation Backdrop Share Price Performance for the Three Months Before Canada’s 13D Filing Through Current Price per Share $1.75 $1.25 $0.75 $0.25 Unaffected Share Price (12/29 – 1 trading day prior to Norway’s public acknowledgment to Canada’s 13D filing): $0.86 Norway $1.91 +122% since unaffec. Date XBI +6% since unaffec. Date 09/29/23 10/29/23 11/29/23 12/29/23 01/29/24 Observations on Recent Stock Movement: Norway is a micro-cap company with limited liquidity – Average daily trading volume over the past 30-calendar days is ~540K shares (~0.6% of Norway’s total basic shares outstanding) – Movement appears to be speculation about a potential transaction as Canada’s 13D filing has not been amended since it first became public Since Canada’s 13D filing through current: – The XBI has remained relatively flat – The 10-year treasury has increased from 3.9% to 4.3% (which has recently led to pressure on the biotech sector) Aggregate Trading Volume from 12/29/23 Through Current (M shares / % of total volume) 1 / 1% 4 / 7% 45 / 79% 3 / 6% 4 / 7% $0.75–$1.00 $1.00–$1.25 $1.25–$1.50 $1.50–$1.75 $1.75+ Share Price Range Source: Public company filings, press releases and FactSet. Market data as of 02/23/24. GUGGENHEIM 3
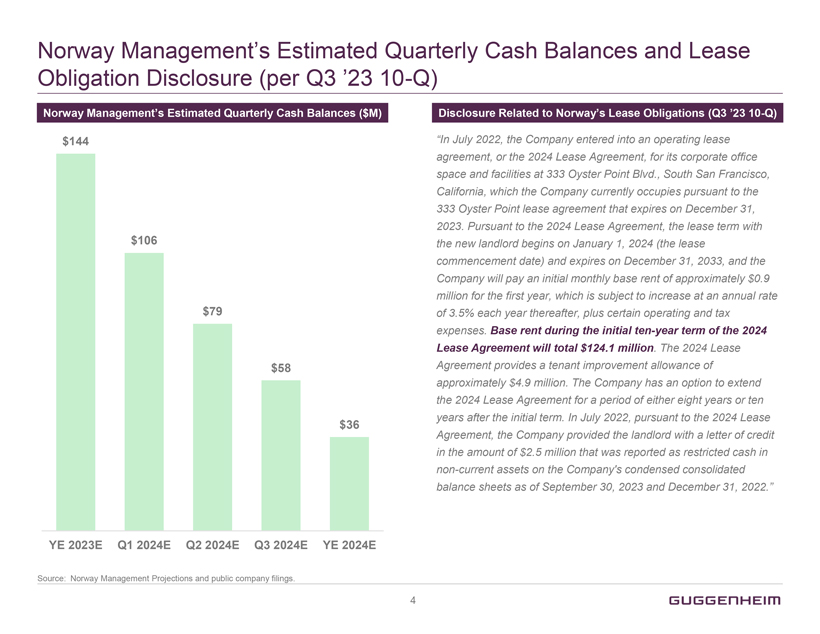
Norway Management’s Estimated Quarterly Cash Balances and Lease Obligation Disclosure (per Q3 ’23 10-Q) Norway Management’s Estimated Quarterly Cash Balances ($M) $144 $106 $79 $58 $36 YE 2023E Q1 2024E Q2 2024E Q3 2024E YE 2024E Disclosure Related to Norway’s Lease Obligations (Q3 ’23 10-Q) “In July 2022, the Company entered into an operating lease agreement, or the 2024 Lease Agreement, for its corporate office space and facilities at 333 Oyster Point Blvd., South San Francisco, California, which the Company currently occupies pursuant to the 333 Oyster Point lease agreement that expires on December 31, 2023. Pursuant to the 2024 Lease Agreement, the lease term with the new landlord begins on January 1, 2024 (the lease commencement date) and expires on December 31, 2033, and the Company will pay an initial monthly base rent of approximately $0.9 million for the first year, which is subject to increase at an annual rate of 3.5% each year thereafter, plus certain operating and tax expenses. Base rent during the initial ten-year term of the 2024 Lease Agreement will total $124.1 million. The 2024 Lease Agreement provides a tenant improvement allowance of approximately $4.9 million. The Company has an option to extend the 2024 Lease Agreement for a period of either eight years or ten years after the initial term. In July 2022, pursuant to the 2024 Lease Agreement, the Company provided the landlord with a letter of credit in the amount of $2.5 million that was reported as restricted cash in non-current assets on the Company’s condensed consolidated balance sheets as of September 30, 2023 and December 31, 2022.” Source: Norway Management Projections and public company filings. GUGGENHEIM 4
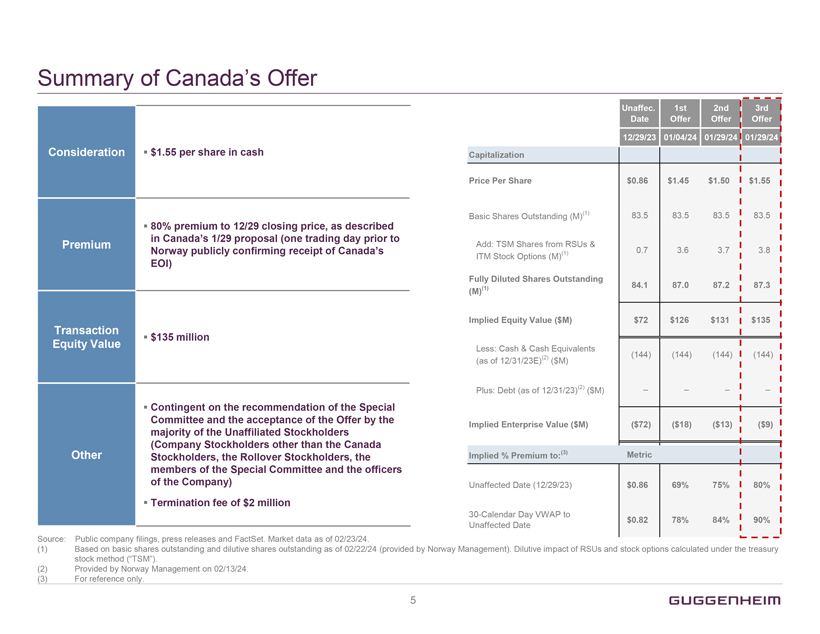
Summary of Canada’s Offer Consideration $1.55 per share in cash Premium 80% premium to 12/29 closing price, as described in Canada’s 1/29 proposal (one trading day prior to Norway publicly confirming receipt of Canada’s EOI) Transaction Equity Value $135 million Other Contingent on the recommendation of the Special Committee and the acceptance of the Offer by the majority of the Unaffiliated Stockholders (Company Stockholders other than the Canada Stockholders, the Rollover Stockholders, the members of the Special Committee and the officers of the Company) Termination fee of $2 million Unaffec. Date 1st Offer 2nd Offer 3rd Offer 12/29/23 01/04/24 01/29/24 01/29/24 Capitalization Price Per Share $0.86 $1.45 $1.50 $1.55 Basic Shares Outstanding (M)(1) 83.5 83.5 83.5 83.5 Add: TSM Shares from RSUs & amp; ITM Stock Options (M)(1) 0.7 3.6 3.7 3.8 Fully Diluted Shares Outstanding (M)(1) 84.1 87.0 87.2 87.3 Implied Equity Value ($M) $72 $126 $131 $135 Less: Cash & Cash Equivalents (as of 12/31/23E)(2) ($M) (144) (144) (144) (144) Plus: Debt (as of 12/31/23)(2) ($M) – – – – Implied Enterprise Value ($M) ($72) ($18) ($13) ($9) Implied % Premium to:(3) Metric Unaffected Date (12/29/23) $0.86 69% 75% 80% 30-Calendar Day VWAP to Unaffected Date $0.82 78% 84% 90% Source: Public company filings, press releases and FactSet. Market data as of 02/23/24. (1) Based on basic shares outstanding and dilutive shares outstanding as of 02/22/24 (provided by Norway Management). Dilutive impact of RSUs and stock options calculated under the treasury stock method (“TSM”). (2) Provided by Norway Management on 02/13/24. (3) For reference only. GUGGENHEIM 5
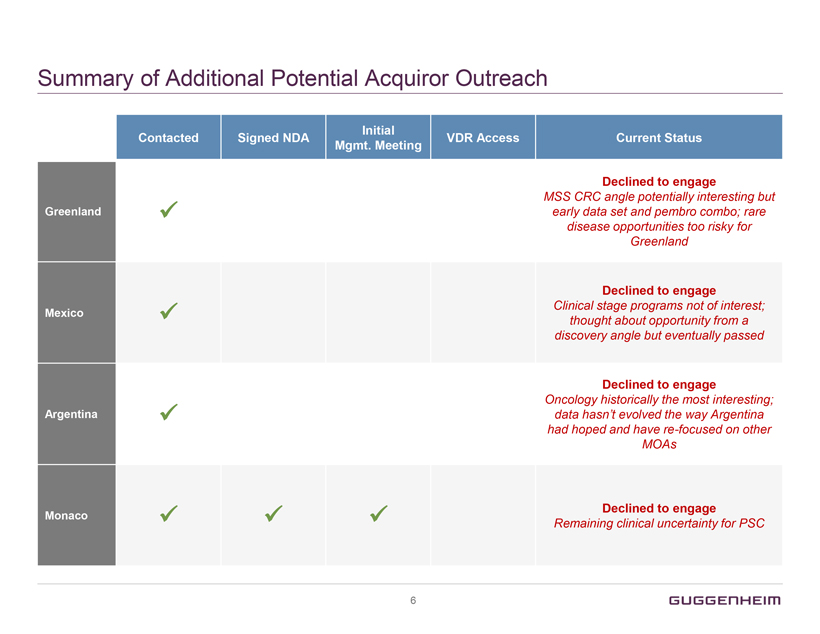
Summary of Additional Potential Acquiror Outreach Contacted Signed NDA Initial Mgmt. Meeting VDR Access Current Status Greenland ✓ Declined to engage MSS CRC angle potentially interesting but early data set and pembro combo; rare disease opportunities too risky for Greenland Mexico ✓ Declined to engage Clinical stage programs not of interest; thought about opportunity from a discovery angle but eventually passed Argentina ✓ Declined to engage Oncology historically the most interesting; data hasn’t evolved the way Argentina had hoped and have re-focused on other MOAs Monaco ✓ ✓ ✓ Declined to engage Remaining clinical uncertainty for PSC GUGGENHEIM 6
GUGGENHEIM 2 Summary of The Norway Management Projections
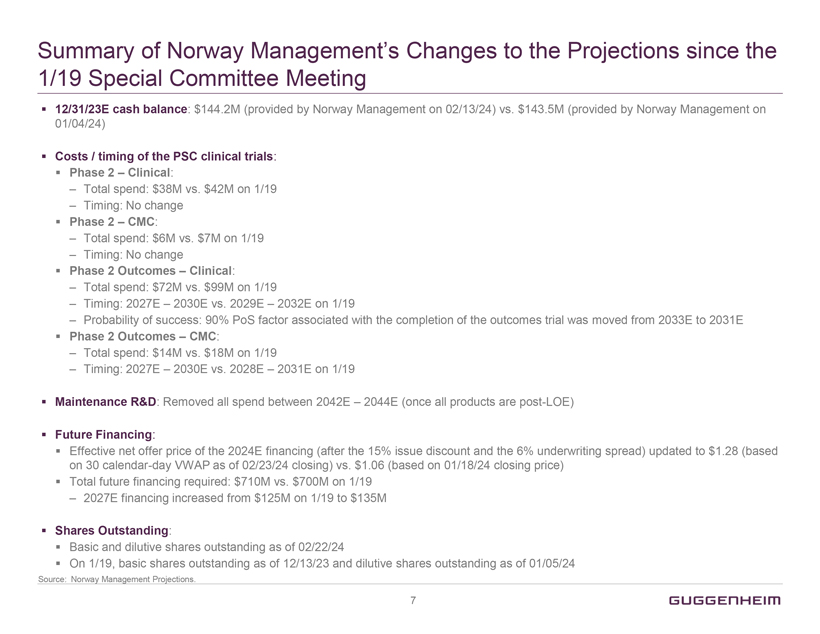
Summary of Norway Management’s Changes to the Projections since the 1/19 Special Committee Meeting 12/31/23E cash balance: $144.2M (provided by Norway Management on 02/13/24) vs. $143.5M (provided by Norway Management on 01/04/24) Costs / timing of the PSC clinical trials: Phase 2 – Clinical: – Total spend: $38M vs. $42M on 1/19 – Timing: No change Phase 2 – CMC: – Total spend: $6M vs. $7M on 1/19 – Timing: No change Phase 2 Outcomes – Clinical: – Total spend: $72M vs. $99M on 1/19 – Timing: 2027E – 2030E vs. 2029E – 2032E on 1/19 – Probability of success: 90% PoS factor associated with the completion of the outcomes trial was moved from 2033E to 2031E Phase 2 Outcomes – CMC: – Total spend: $14M vs. $18M on 1/19 – Timing: 2027E – 2030E vs. 2028E – 2031E on 1/19 Maintenance R&D: Removed all spend between 2042E – 2044E (once all products are post-LOE) Future Financing: Effective net offer price of the 2024E financing (after the 15% issue discount and the 6% underwriting spread) updated to $1.28 (based on 30 calendar-day VWAP as of 02/23/24 closing) vs. $1.06 (based on 01/18/24 closing price) Total future financing required: $710M vs. $700M on 1/19 – 2027E financing increased from $125M on 1/19 to $135M Shares Outstanding: Basic and dilutive shares outstanding as of 02/22/24 On 1/19, basic shares outstanding as of 12/13/23 and dilutive shares outstanding as of 01/05/24 Source: Norway Management Projections. GUGGENHEIM 7
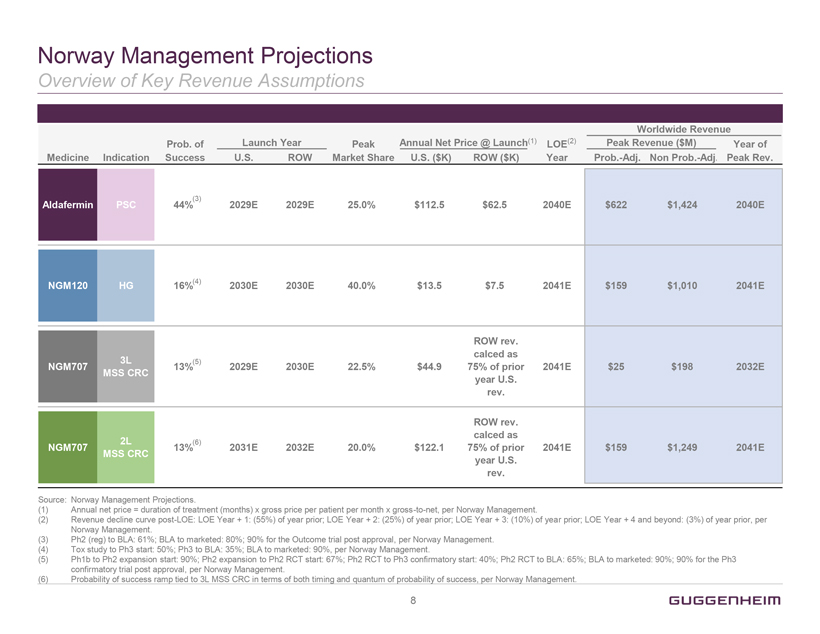
Norway Management Projections Overview of Key Revenue Assumptions Medicine Indication Prob. of Success Launch Year U.S. ROW Peak Market Share Annual Net Price @ Launch(1) U.S. ($K) ROW ($K) LOE(2) Year Worldwide Revenue Peak Revenue ($M) Prob.-Adj. Non Prob.-Adj. Year of Peak Rev. Aldafermin PSC 44%(3) 2029E 2029E 25.0% $112.5 $62.5 2040E $622 $1,424 2040E NGM120 HG 16%(4) 2030E 2030E 40.0% $13.5 $7.5 2041E $159 $1,010 2041E NGM707 3L MSS CRC 13%(5) 2029E 2030E 22.5% $44.9 ROW rev. calced as 75% of prior year U.S. rev. 2041E $25 $198 2032E NGM707 2L MSS CRC 13%(6) 2031E 2032E 20.0% $122.1 ROW rev. calced as 75% of prior year U.S. rev. 2041E $159 $1,249 2041E Source: Norway Management Projections. (1) Annual net price = duration of treatment (months) x gross price per patient per month x gross-to-net, per Norway Management. (2) Revenue decline curve post-LOE: LOE Year + 1: (55%) of year prior; LOE Year + 2: (25%) of year prior; LOE Year + 3: (10%) of year prior; LOE Year + 4 and beyond: (3%) of year prior, per Norway Management. (3) Ph2 (reg) to BLA: 61%; BLA to marketed: 80%; 90% for the Outcome trial post approval, per Norway Management. (4) Tox study to Ph3 start: 50%; Ph3 to BLA: 35%; BLA to marketed: 90%, per Norway Management. (5) Ph1b to Ph2 expansion start: 90%; Ph2 expansion to Ph2 RCT start: 67%; Ph2 RCT to Ph3 confirmatory start: 40%; Ph2 RCT to BLA: 65%; BLA to marketed: 90%; 90% for the Ph3 confirmatory trial post approval, per Norway Management. (6) Probability of success ramp tied to 3L MSS CRC in terms of both timing and quantum of probability of success, per Norway Management. 8 GUGGENHEIN
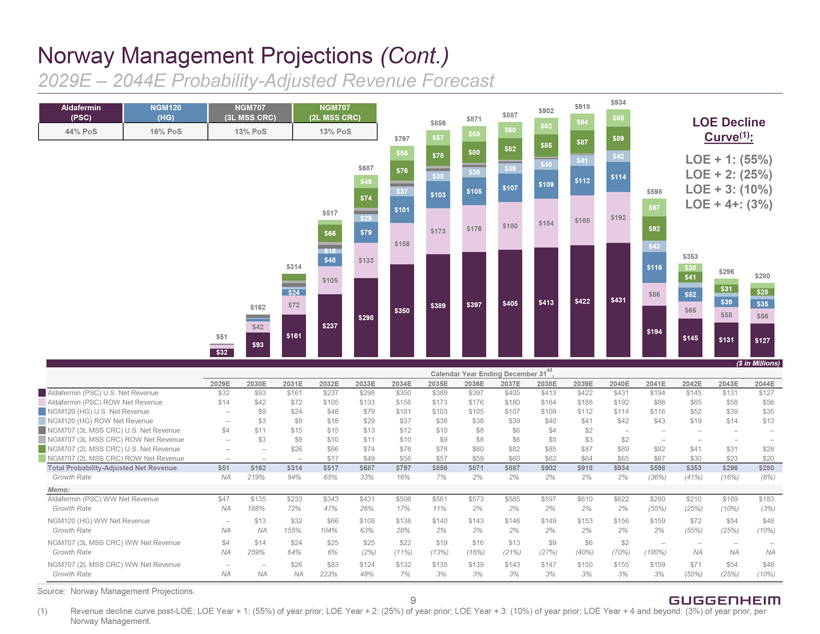
Norway Management Projections (Cont.) 2029E – 2044E Probability-Adjusted Revenue Forecast Aldafermin (PSC) 44% PoS NGM120 (HG) 16% PoS NGM707 (3L MSS CRC) 13% PoS NGM707 (2L MSS CRC) 13% PoS $32 $51 $162 $42 $93 $314 $24 $72 $161 $517 $66 $18 $48 $105 $237 $687 $49 $74 $29 $79 $133 $298 $797 $56 $76 $37 $101 $156 $350 $856 $57 $78 $38 $103 $173 $389 $871 $59 $80 $38 $105 $176 $397 $887 $60 $82 $39 $107 $180 $405 $902 $62 $85 $40 $109 $184 $413 $918 $64 $87 $41 $112 $188 $422 $934 $65 $89 $42 $114 $192 $431 $598 $67 $92 $43 $116 $86 $194 $353 $30 $41 $52 $65 $145 $296 $31 $39 $58 $131 $280 $28 $35 $56 $127 LOE Decline Curve(1): LOE + 1: (55%) LOE + 2: (25%) LOE + 3: (10%) LOE + 4+: (3%) ($ in Millions) Calendar Year Ending December 31st , 2029E 2030E 2031E 2032E 2033E 2034E 2035E 2036E 2037E 2038E 2039E 2040E 2041E 2042E 2043E 2044E Aldafermin (PSC) U.S. Net Revenue $32 $93 $161 $237 $298 $350 $389 $397 $405 $413 $422 $431 $194 $145 $131 $127 Aldafermin (PSC) ROW Net Revenue $14 $42 $72 $105 $133 $156 $173 $176 $180 $184 $188 $192 $86 $65 $58 $56 NGM120 (HG) U.S. Net Revenue – $9 $24 $48 $79 $101 $103 $105 $107 $109 $112 $114 $116 $52 $39 $35 NGM120 (HG) ROW Net Revenue – $3 $9 $18 $29 $37 $38 $38 $39 $40 $41 $42 $43 $19 $14 $13 NGM707 (3L MSS CRC) U.S. Net Revenue $4 $11 $15 $15 $13 $12 $10 $8 $6 $4 $2 – – – – – NGM707 (3L MSS CRC) ROW Net Revenue – $3 $9 $10 $11 $10 $9 $8 $6 $5 $3 $2 – – – – NGM707 (2L MSS CRC) U.S. Net Revenue – – $26 $66 $74 $76 $78 $80 $82 $85 $87 $89 $92 $41 $31 $28 NGM707 (2L MSS CRC) ROW Net Revenue – – – $17 $49 $56 $57 $59 $60 $62 $64 $65 $67 $30 $23 $20 Total Probability-Adjusted Net Revenue $51 $162 $314 $517 $687 $797 $856 $871 $887 $902 $918 $934 $598 $353 $296 $280 Growth Rate NA 219% 94% 65% 33% 16% 7% 2% 2% 2% 2% 2% (36%) (41%) (16%) (6%) Memo: Aldafermin (PSC) WW Net Revenue $47 $135 $233 $343 $431 $506 $561 $573 $585 $597 $610 $622 $280 $210 $189 $183 Growth Rate NA 188% 72% 47% 26% 17% 11% 2% 2% 2% 2% 2% (55%) (25%) (10%) (3%) NGM120 (HG) WW Net Revenue – $13 $32 $66 $108 $138 $140 $143 $146 $149 $153 $156 $159 $72 $54 $48 Growth Rate NA NA 155% 104% 63% 28% 2% 2% 2% 2% 2% 2% 2% (55%) (25%) (10%) NGM707 (3L MSS CRC) WW Net Revenue $4 $14 $24 $25 $25 $22 $19 $16 $13 $9 $6 $2 – – – – Growth Rate NA 259% 64% 6% (2%) (11%) (13%) (16%) (21%) (27%) (40%) (70%) (100%) NA NA NA NGM707 (2L MSS CRC) WW Net Revenue – – $26 $83 $124 $132 $135 $139 $143 $147 $150 $155 $159 $71 $54 $48 Growth Rate NA NA NA 223% 48% 7% 3% 3% 3% 3% 3% 3% 3% (55%) (25%) (10%) Source: Norway Management Projections. (1) Revenue decline curve post-LOE: LOE Year + 1: (55%) of year prior; LOE Year + 2: (25%) of year prior; LOE Year + 3: (10%) of year prior; LOE Year + 4 and beyond: (3%) of year prior, per Norway Management. 9 GUGGENHEIM
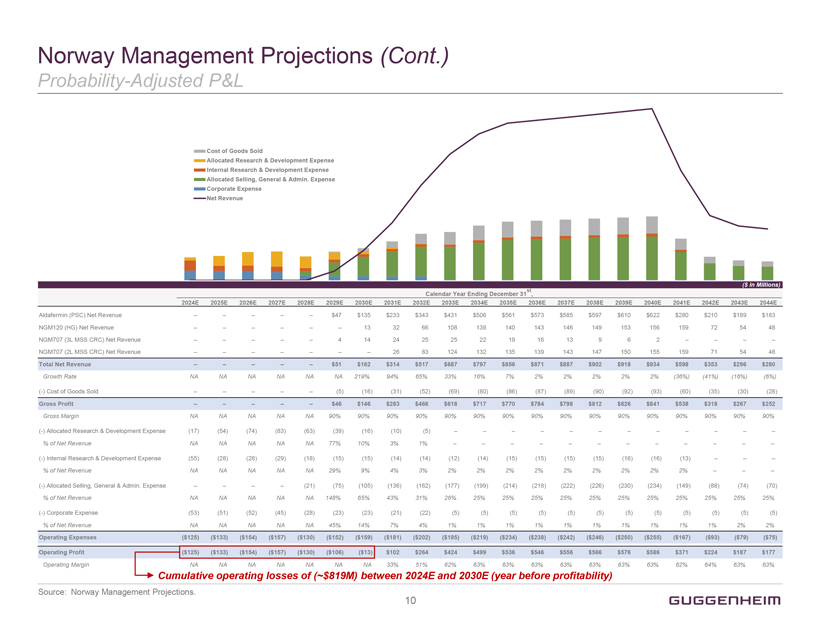
Norway Management Projections (Cont.) Probability-Adjusted P&L Cost of Goods Sold Allocated Research & Development Expense Internal Research & Development Expense Allocated Selling, General & Admin. Expense Corporate Expense Net Revenue ($ in Millions) Calendar Year Ending December 31st , 2024E 2025E 2026E 2027E 2028E 2029E 2030E 2031E 2032E 2033E 2034E 2035E 2036E 2037E 2038E 2039E 2040E 2041E 2042E 2043E 2044E Aldafermin (PSC) Net Revenue – – – – – $47 $135 $233 $343 $431 $506 $561 $573 $585 $597 $610 $622 $280 $210 $189 $183 NGM120 (HG) Net Revenue – – – – – – 13 32 66 108 138 140 143 146 149 153 156 159 72 54 48 NGM707 (3L MSS CRC) Net Revenue – – – – – 4 14 24 25 25 22 19 16 13 9 6 2 – – – – NGM707 (2L MSS CRC) Net Revenue – – – – – – – 26 83 124 132 135 139 143 147 150 155 159 71 54 48 Total Net Revenue – – – – – $51 $162 $314 $517 $687 $797 $856 $871 $887 $902 $918 $934 $598 $353 $296 $280 Growth Rate NA NA NA NA NA NA 219% 94% 65% 33% 16% 7% 2% 2% 2% 2% 2% (36%) (41%) (16%) (6%) (-) Cost of Goods Sold – – – – – (5) (16) (31) (52) (69) (80) (86) (87) (89) (90) (92) (93) (60) (35) (30) (28) Gross Profit – – – – – $46 $146 $283 $466 $618 $717 $770 $784 $798 $812 $826 $841 $538 $318 $267 $252 Gross Margin NA NA NA NA NA 90% 90% 90% 90% 90% 90% 90% 90% 90% 90% 90% 90% 90% 90% 90% 90% (-) Allocated Research & Development Expense (17) (54) (74) (83) (63) (39) (16) (10) (5) – – – – – – – – – – – – % of Net Revenue NA NA NA NA NA 77% 10% 3% 1% – – – – – – – – – – – – (-) Internal Research & Development Expense (55) (28) (28) (29) (18) (15) (15) (14) (14) (12) (14) (15) (15) (15) (15) (16) (16) (13) – – – % of Net Revenue NA NA NA NA NA 29% 9% 4% 3% 2% 2% 2% 2% 2% 2% 2% 2% 2% – – – (-) Allocated Selling, General & Admin. Expense – – – – (21) (75) (105) (136) (162) (177) (199) (214) (218) (222) (226) (230) (234) (149) (88) (74) (70) % of Net Revenue NA NA NA NA NA 148% 65% 43% 31% 26% 25% 25% 25% 25% 25% 25% 25% 25% 25% 25% 25% (-) Corporate Expense (53) (51) (52) (45) (28) (23) (23) (21) (22) (5) (5) (5) (5) (5) (5) (5) (5) (5) (5) (5) (5) % of Net Revenue NA NA NA NA NA 45% 14% 7% 4% 1% 1% 1% 1% 1% 1% 1% 1% 1% 1% 2% 2% Operating Expenses ($125) ($133) ($154) ($157) ($130) ($152) ($159) ($181) ($202) ($195) ($219) ($234) ($238) ($242) ($246) ($250) ($255) ($167) ($93) ($79) ($75) Operating Profit ($125) ($133) ($154) ($157) ($130) ($106) ($13) $102 $264 $424 $499 $536 $546 $556 $566 $576 $586 $371 $224 $187 $177 Operating Margin NA NA NA NA NA NA NA 33% 51% 62% 63% 63% 63% 63% 63% 63% 63% 62% 64% 63% 63% Cumulative operating losses of (~$819M) between 2024E and 2030E (year before profitability) Source: Norway Management Projections. 10 GUGGENHEIM
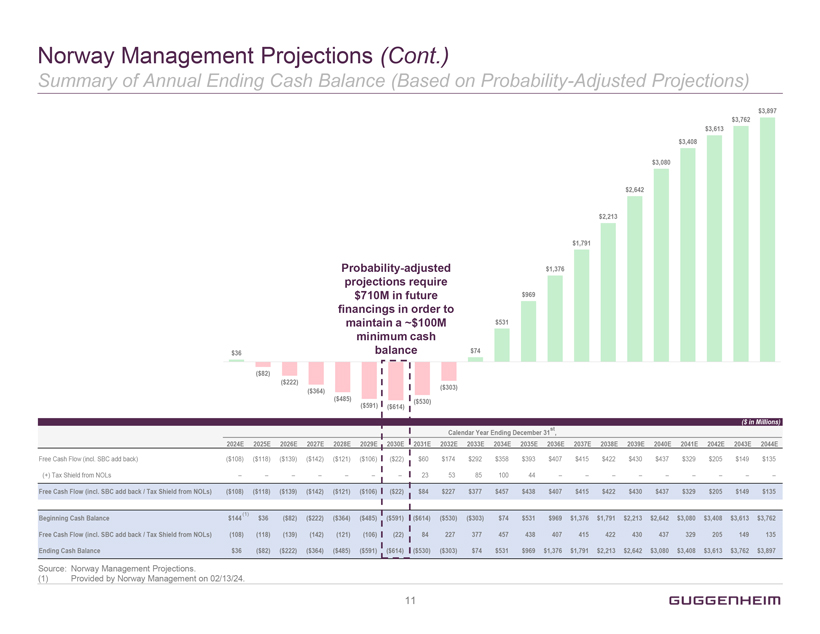
Norway Management Projections (Cont.) Summary of Annual Ending Cash Balance (Based on Probability-Adjusted Projections) Probability-adjusted projections require $710M in future financings in order to maintain a ~$100M minimum cash balance $36 ($82) ($222) ($364) ($485) ($591) ($614) ($530) ($303) $74 $531 $969 $1,376 $1,791 $2,213 $2,642 $3,080 $3,408 $3,613 $3,762 $3,897 ($ in Millions) Calendar Year Ending December 31st, 2024E 2025E 2026E 2027E 2028E 2029E 2030E 2031E 2032E 2033E 2034E 2035E 2036E 2037E 2038E 2039E 2040E 2041E 2042E 2043E 2044E Free Cash Flow (incl. SBC add back) ($108) ($118) ($139) ($142) ($121) ($106) ($22) $60 $174 $292 $358 $393 $407 $415 $422 $430 $437 $329 $205 $149 $135 (+) Tax Shield from NOLs – – – – – – – 23 53 85 100 44 – – – – – – – – – Free Cash Flow (incl. SBC add back / Tax Shield from NOLs) ($108) ($118) ($139) ($142) ($121) ($106) ($22) $84 $227 $377 $457 $438 $407 $415 $422 $430 $437 $329 $205 $149 $135 Beginning Cash Balance $144(1) $36 ($82) ($222) ($364) ($485) ($591) ($614) ($530) ($303) $74 $531 $969 $1,376 $1,791 $2,213 $2,642 $3,080 $3,408 $3,613 $3,762 Free Cash Flow (incl. SBC add back / Tax Shield from NOLs) (108) (118) (139) (142) (121) (106) (22) 84 227 377 457 438 407 415 422 430 437 329 205 149 135 Ending Cash Balance $36 ($82) ($222) ($364) ($485) ($591) ($614) ($530) ($303) $74 $531 $969 $1,376 $1,791 $2,213 $2,642 $3,080 $3,408 $3,613 $3,762 $3,897 Source: Norway Management Projections. (1) Provided by Norway Management on 02/13/24. 11 GUGGENHEIM
GUGGENHEIM 3 Financial Analyses
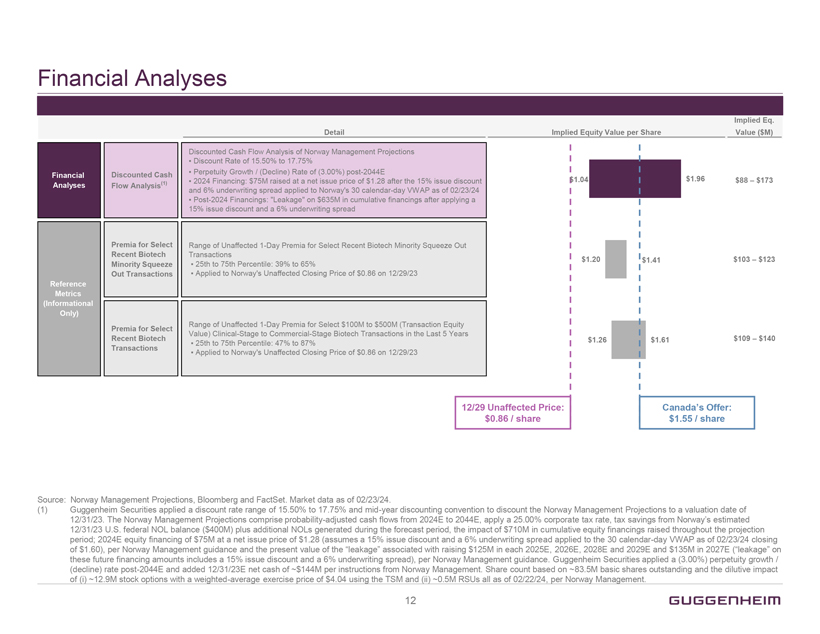
Financial Analyses Detail Financial Analyses Discounted Cash Flow Analysis(1) Discounted Cash Flow Analysis of Norway Management Projections Discount Rate of 15.50% to 17.75% Perpetuity Growth / (Decline) Rate of (3.00%) post-2044E 2024 Financing: $75M raised at a net issue price of $1.28 after the 15% issue discount and 6% underwriting spread applied to Norway’s 30 calendar-day VWAP as of 02/23/24 Post-2024 Financings: “Leakage” on $635M in cumulative financings after applying a 15% issue discount and a 6% underwriting spread Reference Metrics (Informational Only) Premia for Select Recent Biotech Minority Squeeze Out Transactions Range of Unaffected 1-Day Premia for Select Recent Biotech Minority Squeeze Out Transactions 25th to 75th Percentile: 39% to 65% Applied to Norway’s Unaffected Closing Price of $0.86 on 12/29/23 Premia for Select Recent Biotech Transactions Range of Unaffected 1-Day Premia for Select $100M to $500M (Transaction Equity Value) Clinical-Stage to Commercial-Stage Biotech Transactions in the Last 5 Years 25th to 75th Percentile: 47% to 87% Applied to Norway’s Unaffected Closing Price of $0.86 on 12/29/23 Implied Equity Value per Share 1.04 $1.20 $1.26 12/29 Unaffected Price: $0.86 / share $1.96 $1.41 $1.61 Canada’s Offer: $1.55 / share Implied Eq. Value ($M) $88 – $173 $103 – $123 $109 – $140 Canada’s Offer: $1.55 / share Source: Norway Management Projections, Bloomberg and FactSet. Market data as of 02/23/24. (1) Guggenheim Securities applied a discount rate range of 15.50% to 17.75% and mid-year discounting convention to discount the Norway Management Projections to a valuation date of 12/31/23. The Norway Management Projections comprise probability-adjusted cash flows from 2024E to 2044E, apply a 25.00% corporate tax rate, tax savings from Norway’s estimated 12/31/23 U.S. federal NOL balance ($400M) plus additional NOLs generated during the forecast period, the impact of $710M in cumulative equity financings raised throughout the projection period; 2024E equity financing of $75M at a net issue price of $1.28 (assumes a 15% issue discount and a 6% underwriting spread applied to the 30 calendar-day VWAP as of 02/23/24 closing of $1.60), per Norway Management guidance and the present value of the “leakage” associated with raising $125M in each 2025E,2026E, 2028E and 2029E and $135M in 2027E (“leakage” on these future financing amounts includes a 15% issue discount and a 6% underwriting spread), per Norway Management guidance. Guggenheim Securities applied a (3.00%) perpetuity growth / (decline) rate post-2044E and added 12/31/23E net cash of ~$144M per instructions from Norway Management. Share count based on ~83.5M basic shares outstanding and the dilutive impact of (i) ~12.9M stock options with a weighted-average exercise price of $4.04 using the TSM and (ii) ~0.5M RSUs all as of 02/22/24, per Norway Management. 12 GUGGENHEIM

Select Recent Biotech Minority Squeeze Out Transactions Reference Metrics (Informational Only) 25th to 75th percentile used as reference metric ($ in Millions) Target Acquiror Transaction Ann. Date Transaction Close Date Total Trans. Equity Value Pre-Deal Acquiror Ownership 1-Day Unaffected Premium FREELINE SYNCONA 11/22/23 02/20/24 $28 58% 51%(1) Liminal BioSciences Structured Alpha 07/12/23 09/26/23 28 64% 135%(1) MYOVANT SCIENCES Sumitovant Biopharma 10/23/22 03/10/23 2,908 52% 50%(1) Stealth BIOTHERAPEUTICS MORNINGSIDE VENTURES 08/01/22 11/16/22 28 72% 34%(1) ENTASIS THERAPEUTICS INNOVIVA 05/23/22 07/11/22 113 60% 50%(1) UROVANT SCIENCES Sumitovant Biopharma 11/12/20 03/29/21 584 72% 105% eidos bridgebio 10/05/20 01/26/21 2,934 63% 41% CBMS Cellular Biomedicine Group Investor Consortium 08/12/20 02/19/21 411 12%(1) Source: Public company filings, including publicly available board presentations, 14D-9s / DEFM14As / 13E-3 filings and press releases. Data as of 02/23/24. (1)1-day unaffected date for the first and final proposal both equal to the day before the public announcement of the first proposal. 13 GUGGENHEIM
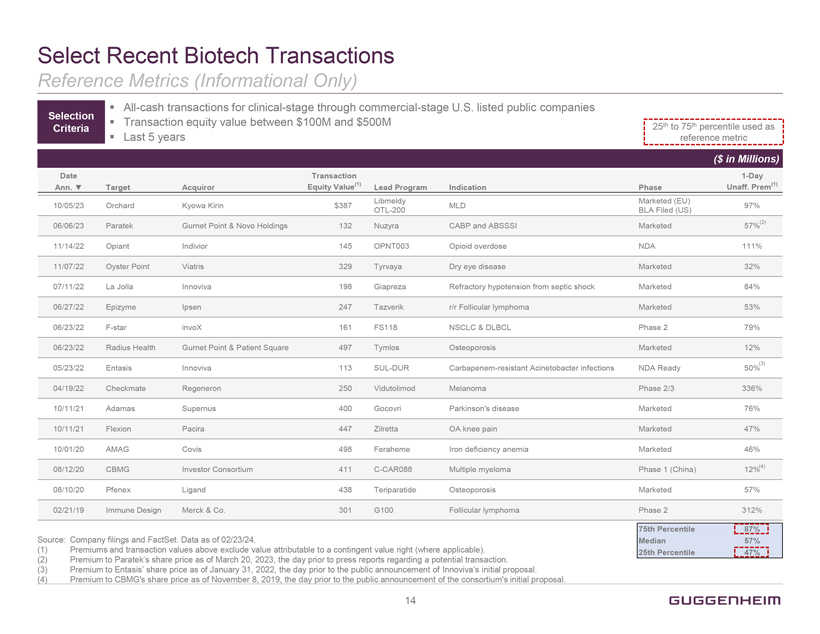
Select Recent Biotech Transactions Reference Metrics (Informational Only) Selection Criteria All-cash transactions for clinical-stage through commercial-stage U.S. listed public companies Transaction equity value between $100M and $500M Last 5 years 25th to 75th percentile used as reference metric ($ in Millions) Date Ann. Target Acquiror Transaction Equity Value(1) Lead Program Indication Phase 1-Day Unaff. Prem(1) Libmeldy Marketed (EU) 10/05/23 Orchard Kyowa Kirin $387 MLD 97% OTL-200 BLA Filed (US) 06/06/23 Paratek Gurnet Point & Novo Holdings 132 Nuzyra CABP and ABSSSI Marketed 57%(2) 11/14/22 Opiant Indivior 145 OPNT003 Opioid overdose NDA 111% 11/07/22 Oyster Point Viatris 329 Tyrvaya Dry eye disease Marketed 32% 07/11/22 La Jolla Innoviva 198 Giapreza Refractory hypotension from septic shock Marketed 84% 06/27/22 Epizyme Ipsen 247 Tazverik r/r Follicular lymphoma Marketed 53% 06/23/22 F-star invoX 161 FS118 NSCLC & DLBCL Phase 2 79% 06/23/22 Radius Health Gurnet Point & Patient Square 497 Tymlos Osteoporosis Marketed 12% 05/23/22 Entasis Innoviva 113 SUL-DUR Carbapenem-resistant Acinetobacter infections NDA Ready 50%(3) 04/19/22 Checkmate Regeneron 250 Vidutolimod Melanoma Phase 2/3 336% 10/11/21 Adamas Supernus 400 Gocovri Parkinson’s disease Marketed 76% 10/11/21 Flexion Pacira 447 Zilretta OA knee pain Marketed 47% 10/01/20 AMAG Covis 498 Feraheme Iron deficiency anemia Marketed 46% 08/12/20 CBMG Investor Consortium 411 C-CAR088 Multiple myeloma Phase 1 (China) 12%(4) 08/10/20 Pfenex Ligand 438 Teriparatide Osteoporosis Marketed 57% 02/21/19 Immune Design Merck & Co. 301 G100 Follicular lymphoma Phase 2 312% 75th Percentile 87% Median 57% 25th Percentile 47% Source: Company filings and FactSet. Data as of 02/23/24. (1) Premiums and transaction values above exclude value attributable to a contingent value right (where applicable). (2) Premium to Paratek’s share price as of March 20, 2023, the day prior to press reports regarding a potential transaction. (3) Premium to Entasis’ share price as of January 31, 2022, the day prior to the public announcement of Innoviva’s initial proposal. (4) Premium to CBMG’s share price as of November 8, 2019, the day prior to the public announcement of the consortium’s initial proposal. 14 GUGGENHEIM
GUGGENHEIM Appendices
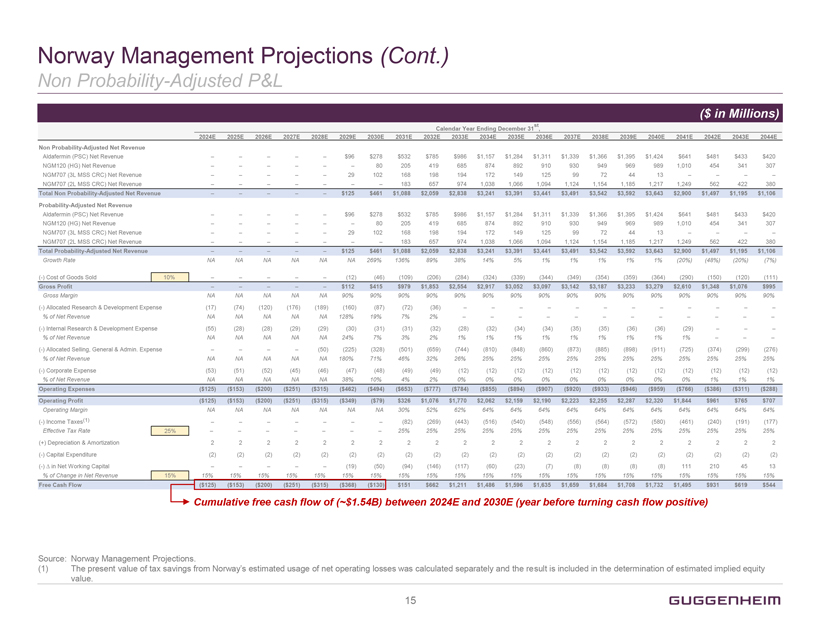
Norway Management Projections (Cont.) Non Probability-Adjusted P&L ($ in Millions) Calendar Year Ending December 31st , 2024E 2025E 2026E 2027E 2028E 2029E 2030E 2031E 2032E 2033E 2034E 2035E 2036E 2037E 2038E 2039E 2040E 2041E 2042E 2043E 2044E Non Probability-Adjusted Net Revenue Aldafermin (PSC) Net Revenue – – – – – $96 $278 $532 $785 $986 $1,157 $1,284 $1,311 $1,339 $1,366 $1,395 $1,424 $641 $481 $433 $420 NGM120 (HG) Net Revenue – – – – – – 80 205 419 685 874 892 910 930 949 969 989 1,010 454 341 307 NGM707 (3L MSS CRC) Net Revenue – – – – – 29 102 168 198 194 172 149 125 99 72 44 13 – – – – NGM707 (2L MSS CRC) Net Revenue – – – – – – – 183 657 974 1,038 1,066 1,094 1,124 1,154 1,185 1,217 1,249 562 422 380 Total Non Probability-Adjusted Net Revenue – – – – – $125 $461 $1,088 $2,059 $2,838 $3,241 $3,391 $3,441 $3,491 $3,542 $3,592 $3,643 $2,900 $1,497 $1,195 $1,106 Probability-Adjusted Net Revenue Aldafermin (PSC) Net Revenue – – – – – $96 $278 $532 $785 $986 $1,157 $1,284 $1,311 $1,339 $1,366 $1,395 $1,424 $641 $481 $433 $420 NGM120 (HG) Net Revenue – – – – – – 80 205 419 685 874 892 910 930 949 969 989 1,010 454 341 307 NGM707 (3L MSS CRC) Net Revenue – – – – – 29 102 168 198 194 172 149 125 99 72 44 13 – – – – NGM707 (2L MSS CRC) Net Revenue – – – – – – – 183 657 974 1,038 1,066 1,094 1,124 1,154 1,185 1,217 1,249 562 422 380 Total Probability-Adjusted Net Revenue – – – – – $125 $461 $1,088 $2,059 $2,838 $3,241 $3,391 $3,441 $3,491 $3,542 $3,592 $3,643 $2,900 $1,497 $1,195 $1,106 Growth Rate NA NA NA NA NA NA 269% 136% 89% 38% 14% 5% 1% 1% 1% 1% 1% (20%) (48%) (20%) (7%) (-) Cost of Goods Sold 10% – – – – – (12) (46) (109) (206) (284) (324) (339) (344) (349) (354) (359) (364) (290) (150) (120) (111) Gross Profit – – – – – $112 $415 $979 $1,853 $2,554 $2,917 $3,052 $3,097 $3,142 $3,187 $3,233 $3,279 $2,610 $1,348 $1,076 $995 Gross Margin NA NA NA NA NA 90% 90% 90% 90% 90% 90% 90% 90% 90% 90% 90% 90% 90% 90% 90% 90% (-) Allocated Research & Development Expense (17) (74) (120) (176) (189) (160) (87) (72) (36) – – – – – – – – – – – – % of Net Revenue NA NA NA NA NA 128% 19% 7% 2% – – – – – – – – – – – – (-) Internal Research & Development Expense (55) (28) (28) (29) (29) (30) (31) (31) (32) (28) (32) (34) (34) (35) (35) (36) (36) (29) – – – % of Net Revenue NA NA NA NA NA 24% 7% 3% 2% 1% 1% 1% 1% 1% 1% 1% 1% 1% – – – (-) Allocated Selling, General & Admin. Expense – – – – (50) (225) (328) (501) (659) (744) (810) (848) (860) (873) (885) (898) (911) (725) (374) (299) (276) % of Net Revenue NA NA NA NA NA 180% 71% 46% 32% 26% 25% 25% 25% 25% 25% 25% 25% 25% 25% 25% 25% (-) Corporate Expense (53) (51) (52) (45) (46) (47) (48) (49) (49) (12) (12) (12) (12) (12) (12) (12) (12) (12) (12) (12) (12) % of Net Revenue NA NA NA NA NA 38% 10% 4% 2% 0% 0% 0% 0% 0% 0% 0% 0% 0% 1% 1% 1% Operating Expenses ($125) ($153) ($200) ($251) ($315) ($462) ($494) ($653) ($777) ($784) ($855) ($894) ($907) ($920) ($933) ($946) ($959) ($766) ($386) ($311) ($288) Operating Profit ($125) ($153) ($200) ($251) ($315) ($349) ($79) $326 $1,076 $1,770 $2,062 $2,159 $2,190 $2,223 $2,255 $2,287 $2,320 $1,844 $961 $765 $707 Operating Margin NA NA NA NA NA NA NA 30% 52% 62% 64% 64% 64% 64% 64% 64% 64% 64% 64% 64% 64% (-) Income Taxes(1) – – – – – – – (82) (269) (443) (516) (540) (548) (556) (564) (572) (580) (461) (240) (191) (177) Effective Tax Rate 25% – – – – – – – 25% 25% 25% 25% 25% 25% 25% 25% 25% 25% 25% 25% 25% 25% (+) Depreciation & Amortization 2 2 2 2 2 2 2 2 2 2 2 2 2 2 2 2 2 2 2 2 2 (-) Capital Expenditure (2) (2) (2) (2) (2) (2) (2) (2) (2) (2) (2) (2) (2) (2) (2) (2) (2) (2) (2) (2) (2) (-) in Net Working Capital – – – – – (19) (50) (94) (146) (117) (60) (23) (7) (8) (8) (8) (8) 111 210 45 13 % of Change in Net Revenue 15% 15% 15% 15% 15% 15% 15% 15% 15% 15% 15% 15% 15% 15% 15% 15% 15% 15% 15% 15% 15% 15% Free Cash Flow ($125) ($153) ($200) ($251) ($315) ($368) ($130) $151 $662 $1,211 $1,486 $1,596 $1,635 $1,659 $1,684 $1,708 $1,732 $1,495 $931 $619 $544 Cumulative free cash flow of (~$1.54B) between 2024E and 2030E (year before turning cash flow positive) Source: Norway Management Projections. (1) The present value of tax savings from Norway’s estimated usage of net operating losses was calculated separately and the result is included in the determination of estimated implied equity value. 15 GUGGENHEIM
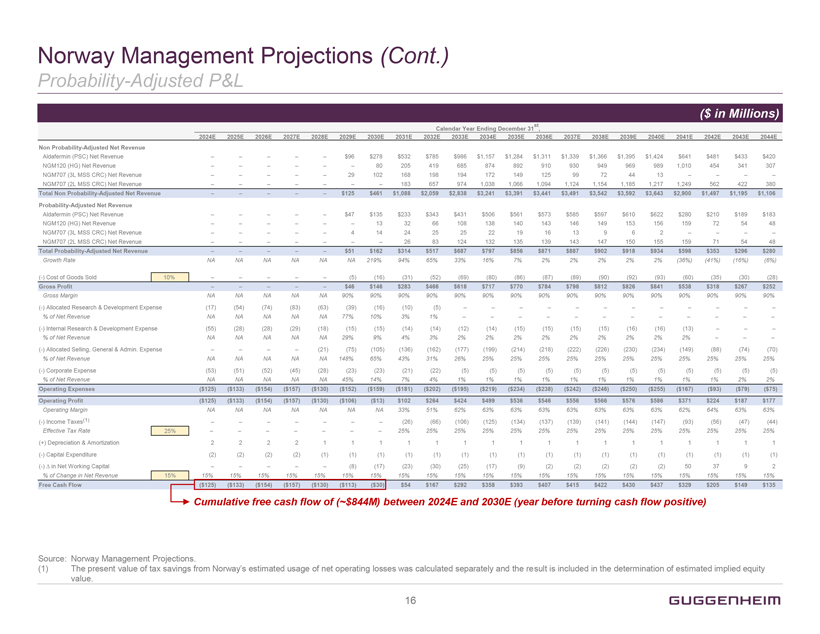
Norway Management Projections (Cont.) Probability-Adjusted P&L ($ in Millions) Calendar Year Ending December 31st , 2024E 2025E 2026E 2027E 2028E 2029E 2030E 2031E 2032E 2033E 2034E 2035E 2036E 2037E 2038E 2039E 2040E 2041E 2042E 2043E 2044E Non Probability-Adjusted Net Revenue Aldafermin (PSC) Net Revenue – – – – – $96 $278 $532 $785 $986 $1,157 $1,284 $1,311 $1,339 $1,366 $1,395 $1,424 $641 $481 $433 $420 NGM120 (HG) Net Revenue – – – – – – 80 205 419 685 874 892 910 930 949 969 989 1,010 454 341 307 NGM707 (3L MSS CRC) Net Revenue – – – – – 29 102 168 198 194 172 149 125 99 72 44 13 – – – – NGM707 (2L MSS CRC) Net Revenue – – – – – – – 183 657 974 1,038 1,066 1,094 1,124 1,154 1,185 1,217 1,249 562 422 380 Total Non Probability-Adjusted Net Revenue – – – – – $125 $461 $1,088 $2,059 $2,838 $3,241 $3,391 $3,441 $3,491 $3,542 $3,592 $3,643 $2,900 $1,497 $1,195 $1,106 Probability-Adjusted Net Revenue Aldafermin (PSC) Net Revenue – – – – – $47 $135 $233 $343 $431 $506 $561 $573 $585 $597 $610 $622 $280 $210 $189 $183 NGM120 (HG) Net Revenue – – – – – – 13 32 66 108 138 140 143 146 149 153 156 159 72 54 48 NGM707 (3L MSS CRC) Net Revenue – – – – – 4 14 24 25 25 22 19 16 13 9 6 2 – – – – NGM707 (2L MSS CRC) Net Revenue – – – – – – – 26 83 124 132 135 139 143 147 150 155 159 71 54 48 Total Probability-Adjusted Net Revenue – – – – – $51 $162 $314 $517 $687 $797 $856 $871 $887 $902 $918 $934 $598 $353 $296 $280 Growth Rate NA NA NA NA NA NA 219% 94% 65% 33% 16% 7% 2% 2% 2% 2% 2% (36%) (41%) (16%) (6%) (-) Cost of Goods Sold 10% – – – – – (5) (16) (31) (52) (69) (80) (86) (87) (89) (90) (92) (93) (60) (35) (30) (28) Gross Profit – – – – – $46 $146 $283 $466 $618 $717 $770 $784 $798 $812 $826 $841 $538 $318 $267 $252 Gross Margin NA NA NA NA NA 90% 90% 90% 90% 90% 90% 90% 90% 90% 90% 90% 90% 90% 90% 90% 90% (-) Allocated Research & Development Expense (17) (54) (74) (83) (63) (39) (16) (10) (5) – – – – – – – – – – – – % of Net Revenue NA NA NA NA NA 77% 10% 3% 1% – – – – – – – – – – – – (-) Internal Research & Development Expense (55) (28) (28) (29) (18) (15) (15) (14) (14) (12) (14) (15) (15) (15) (15) (16) (16) (13) – – – % of Net Revenue NA NA NA NA NA 29% 9% 4% 3% 2% 2% 2% 2% 2% 2% 2% 2% 2% – – – (-) Allocated Selling, General & Admin. Expense – – – – (21) (75) (105) (136) (162) (177) (199) (214) (218) (222) (226) (230) (234) (149) (88) (74) (70) % of Net Revenue NA NA NA NA NA 148% 65% 43% 31% 26% 25% 25% 25% 25% 25% 25% 25% 25% 25% 25% 25% (-) Corporate Expense (53) (51) (52) (45) (28) (23) (23) (21) (22) (5) (5) (5) (5) (5) (5) (5) (5) (5) (5) (5) (5) % of Net Revenue NA NA NA NA NA 45% 14% 7% 4% 1% 1% 1% 1% 1% 1% 1% 1% 1% 1% 2% 2% Operating Expenses ($125) ($133) ($154) ($157) ($130) ($152) ($159) ($181) ($202) ($195) ($219) ($234) ($238) ($242) ($246) ($250) ($255) ($167) ($93) ($79) ($75) Operating Profit ($125) ($133) ($154) ($157) ($130) ($106) ($13) $102 $264 $424 $499 $536 $546 $556 $566 $576 $586 $371 $224 $187 $177 Operating Margin NA NA NA NA NA NA NA 33% 51% 62% 63% 63% 63% 63% 63% 63% 63% 62% 64% 63% 63% (-) Income Taxes(1) – – – – – – – (26) (66) (106) (125) (134) (137) (139) (141) (144) (147) (93) (56) (47) (44) Effective Tax Rate 25% – – – – – – – 25% 25% 25% 25% 25% 25% 25% 25% 25% 25% 25% 25% 25% 25% (+) Depreciation & Amortization 2 2 2 2 1 1 1 1 1 1 1 1 1 1 1 1 1 1 1 1 1 (-) Capital Expenditure (2) (2) (2) (2) (1) (1) (1) (1) (1) (1) (1) (1) (1) (1) (1) (1) (1) (1) (1) (1) (1) (-) in Net Working Capital – – – – – (8) (17) (23) (30) (25) (17) (9) (2) (2) (2) (2) (2) 50 37 9 2 % of Change in Net Revenue 15% 15% 15% 15% 15% 15% 15% 15% 15% 15% 15% 15% 15% 15% 15% 15% 15% 15% 15% 15% 15% 15% Free Cash Flow ($125) ($133) ($154) ($157) ($130) ($113) ($30) $54 $167 $292 $358 $393 $407 $415 $422 $430 $437 $329 $205 $149 $135 Cumulative free cash flow of (~$844M) between 2024E and 2030E (year before turning cash flow positive) Source: Norway Management Projections. (1) The present value of tax savings from Norway’s estimated usage of net operating losses was calculated separately and the result is included in the determination of estimated implied equity value. 16 GUGGENHEIM
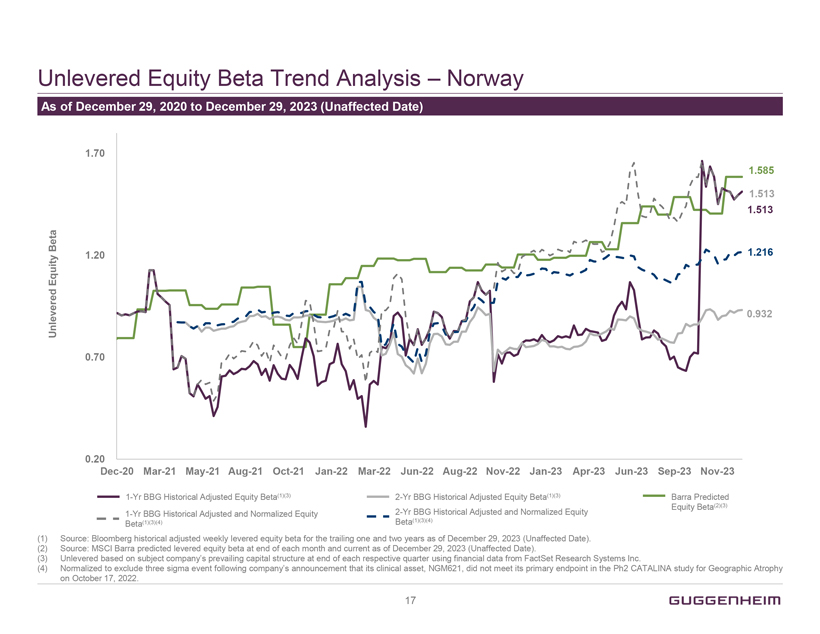
Unlevered Equity Beta Trend Analysis – Norway As of December 29, 2020 to December 29, 2023 (Unaffected Date) Dec-20 Mar-21 May-21 Aug-21 Oct-21 Jan-22 Mar-22 Jun-22 Aug-22 Nov-22 Jan-23 Apr-23 Jun-23 Sep-23 Nov-23 Unlevered Equity Beta 1.70 1.20 0.70 0.20 1.585 1.513 1.513 1.216 0.932 1-Yr BBG Historical Adjusted Equity Beta(1)(3) 2-Yr BBG Historical Adjusted Equity Beta(1)(3) Barra Predicted Beta(2)(3) 1-Yr BBG Historical Adjusted and Normalized Equity Beta(1)(3)(4) 2-Yr BBG Historical Adjusted and Normalized Equity Equity Beta(1)(3)(4) (1) Source: Bloomberg historical adjusted weekly levered equity beta for the trailing one and two years as of December 29, 2023 (Unaffected Date). (2) Source: MSCI Barra predicted levered equity beta at end of each month and current as of December 29, 2023 (Unaffected Date). (3) Unlevered based on subject company’s prevailing capital structure at end of each respective quarter using financial data from FactSet Research Systems Inc. (4) Normalized to exclude three sigma event following company’s announcement that its clinical asset, NGM621, did not meet its primary endpoint in the Ph2 CATALINA study for Geographic Atrophy on October 17, 2022. 17 GUGGENHEIM
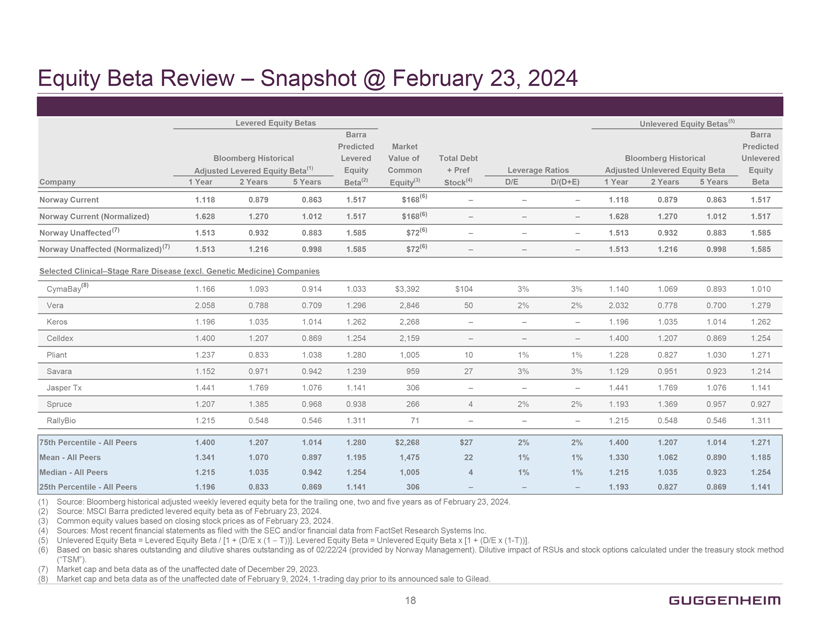
Equity Beta Review – Snapshot @ February 23, 2024 Levered Equity Betas Unlevered Equity Betas(5) Barra Barra Predicted Market Predicted Bloomberg Historical Levered Value of Total Debt Bloomberg Historical Unlevered Adjusted Levered Equity Beta(1) Equity Common + Pref Leverage Ratios Adjusted Unlevered Equity Beta Equity Company 1 Year 2 Years 5 Years Beta(2) Equity(3) Stock(4) D/E D/(D+E) 1 Year 2 Years 5 Years Beta Norway Current 1.118 0.879 0.863 1.517 $168(6) – – – 1.118 0.879 0.863 1.517 Norway Current (Normalized) 1.628 1.270 1.012 1.517 $168(6) – – – 1.628 1.270 1.012 1.517 Norway Unaffected (7) 1.513 0.932 0.883 1.585 $72(6) – – – 1.513 0.932 0.883 1.585 Norway Unaffected (Normalized)(7) 1.513 1.216 0.998 1.585 $72(6) – – – 1.513 1.216 0.998 1.585 Selected Clinical–Stage Rare Disease (excl. Genetic Medicine) Companies CymaBay(8) 1.166 1.093 0.914 1.033 $3,392 $104 3% 3% 1.140 1.069 0.893 1.010 Vera 2.058 0.788 0.709 1.296 2,846 50 2% 2% 2.032 0.778 0.700 1.279 Keros 1.196 1.035 1.014 1.262 2,268 – – – 1.196 1.035 1.014 1.262 Celldex 1.400 1.207 0.869 1.254 2,159 – – – 1.400 1.207 0.869 1.254 Pliant 1.237 0.833 1.038 1.280 1,005 10 1% 1% 1.228 0.827 1.030 1.271 Savara 1.152 0.971 0.942 1.239 959 27 3% 3% 1.129 0.951 0.923 1.214 Jasper Tx 1.441 1.769 1.076 1.141 306 – – – 1.441 1.769 1.076 1.141 Spruce 1.207 1.385 0.968 0.938 266 4 2% 2% 1.193 1.369 0.957 0.927 RallyBio 1.215 0.548 0.546 1.311 71 – – – 1.215 0.548 0.546 1.311 75th Percentile—All Peers 1.400 1.207 1.014 1.280 $2,268 $27 2% 2% 1.400 1.207 1.014 1.271 Mean—All Peers 1.341 1.070 0.897 1.195 1,475 22 1% 1% 1.330 1.062 0.890 1.185 Median—All Peers 1.215 1.035 0.942 1.254 1,005 4 1% 1% 1.215 1.035 0.923 1.254 25th Percentile—All Peers 1.196 0.833 0.869 1.141 306 – – – 1.193 0.827 0.869 1.141 (1) Source: Bloomberg historical adjusted weekly levered equity beta for the trailing one, two and five years as of February 23, 2024. (2) Source: MSCI Barra predicted levered equity beta as of February 23, 2024. (3) Common equity values based on closing stock prices as of February 23, 2024. (4) Sources: Most recent financial statements as filed with the SEC and/or financial data from FactSet Research Systems Inc. (5) Unlevered Equity Beta = Levered Equity Beta / [1 + (D/E x (1 - T))]. Levered Equity Beta = Unlevered Equity Beta x [1 + (D/E x (1-T))]. (6) Based on basic shares outstanding and dilutive shares outstanding as of 02/22/24 (provided by Norway Management). Dilutive impact of RSUs and stock options calculated under the treasury stock method (“TSM”). (7) Market cap and beta data as of the unaffected date of December 29, 2023. (8) Market cap and beta data as of the unaffected date of February 9, 2024, 1-trading day prior to its announced sale to Gilead. 18 GUGGENHEIM
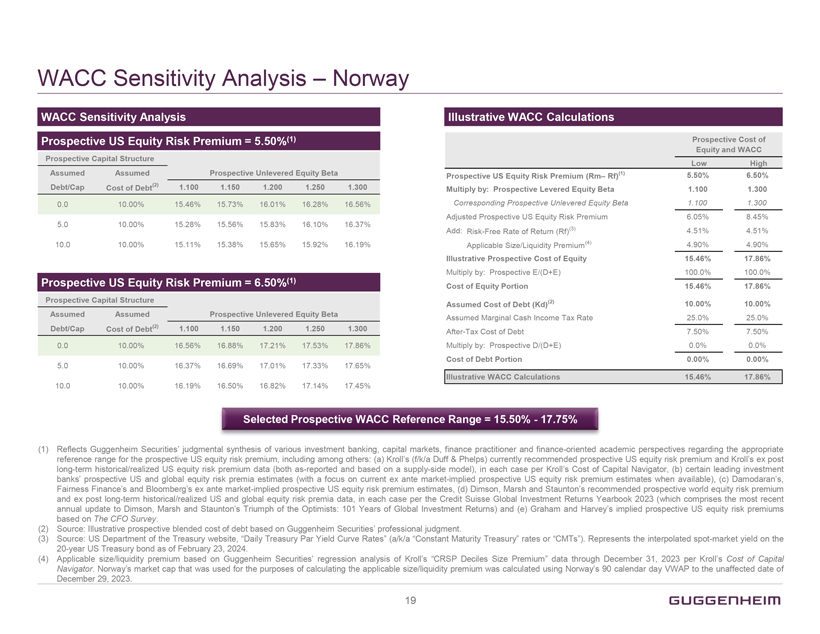
WACC Sensitivity Analysis – Norway WACC Sensitivity Analysis Prospective US Equity Risk Premium = 5.50%(1) Prospective Capital Structure Assumed Assumed Prospective Unlevered Equity Beta Debt/Cap Cost of Debt(2) 1.100 1.150 1.200 1.250 1.300 0.0 10.00% 15.46% 15.73% 16.01% 16.28% 16.56% 5.0 10.00% 15.28% 15.56% 15.83% 16.10% 16.37% 10.0 10.00% 15.11% 15.38% 15.65% 15.92% 16.19% Prospective US Equity Risk Premium = 6.50%(1) Prospective Capital Structure Assumed Assumed Prospective Unlevered Equity Beta Debt/Cap Cost of Debt(2) 1.100 1.150 1.200 1.250 1.300 0.0 10.00% 16.56% 16.88% 17.21% 17.53% 17.86% 5.0 10.00% 16.37% 16.69% 17.01% 17.33% 17.65% 10.0 10.00% 16.19% 16.50% 16.82% 17.14% 17.45% Illustrative WACC Calculations Prospective Cost of Equity and WACC Low High Prospective US Equity Risk Premium (Rm– Rf)(1) 5.50% 6.50% Multiply by: Prospective Levered Equity Beta 1.100 1.300 Corresponding Prospective Unlevered Equity Beta 1.100 1.300 Adjusted Prospective US Equity Risk Premium 6.05% 8.45% Add: Risk-Free Rate of Return (Rf)(3) 4.51% 4.51% Applicable Size/Liquidity Premium(4) 4.90% 4.90% Illustrative Prospective Cost of Equity 15.46% 17.86% Multiply by: Prospective E/(D+E) 100.0% 100.0% Cost of Equity Portion 15.46% 17.86% Assumed Cost of Debt (Kd)(2) 10.00% 10.00% Assumed Marginal Cash Income Tax Rate 25.0% 25.0% After-Tax Cost of Debt 7.50% 7.50% Multiply by: Prospective D/(D+E) 0.0% 0.0% Cost of Debt Portion 0.00% 0.00% Illustrative WACC Calculations 15.46% 17.86% Selected Prospective WACC Reference Range = 15.50%—17.75% (1) Reflects Guggenheim Securities’ judgmental synthesis of various investment banking, capital markets, finance practitioner and finance-oriented academic perspectives regarding the appropriate reference range for the prospective US equity risk premium, including among others: (a) Kroll’s (f/k/a Duff & Phelps) currently recommended prospective US equity risk premium and Kroll’s ex post long-term historical/realized US equity risk premium data (both as-reported and based on a supply-side model), in each case per Kroll’s Cost of Capital Navigator, (b) certain leading investment banks’ prospective US and global equity risk premia estimates (with a focus on current ex ante market-implied prospective US equity risk premium estimates when available), (c) Damodaran’s, Fairness Finance’s and Bloomberg’s ex ante market-implied prospective US equity risk premium estimates, (d) Dimson, Marsh and Staunton’s recommended prospective world equity risk premium and ex post long-term historical/realized US and global equity risk premia data, in each case per the Credit Suisse Global Investment Returns Yearbook 2023 (which comprises the most recent annual update to Dimson, Marsh and Staunton’s Triumph of the Optimists: 101 Years of Global Investment Returns) and (e) Graham and Harvey’s implied prospective US equity risk premiums based on The CFO Survey. (2) Source: Illustrative prospective blended cost of debt based on Guggenheim Securities’ professional judgment. (3) Source: US Department of the Treasury website, “Daily Treasury Par Yield Curve Rates” (a/k/a “Constant Maturity Treasury” rates or “CMTs”). Represents the interpolated spot-market yield on the 20-year US Treasury bond as of February 23, 2024. (4) Applicable size/liquidity premium based on Guggenheim Securities’ regression analysis of Kroll’s “CRSP Deciles Size Premium” data through December 31, 2023 per Kroll’s Cost of Capital Navigator. Norway’s market cap that was used for the purposes of calculating the applicable size/liquidity premium was calculated using Norway’s 90 calendar day VWAP to the unaffected date of December 29, 2023. 19 GUGGENHEIM