
NGM Biopharmaceuticals, Inc. CORPORATE OVERVIEW Novel Biology. Powerful Medicines. Transformative Impact. NASDAQ: NGM Exhibit 99.1
This presentation contains forward-looking statements, including, but not limited to, statements regarding potential indications for, and planned development of, product candidates in NGM’s pipeline; the planned timing of initiation, enrollment and results of NGM’s clinical trials, including the announcement of topline data from Cohort 4 of the Phase 2 clinical study of aldafermin (NGM282); NGM’s option to participate in the economic return of any programs licensed by Merck; the potential activity, complementarity, safety, tolerability and efficacy of NGM’s product candidates; NGM’s expectation of potential value-driving catalysts; and any other statements other than statements of historical facts. Because such statements deal with future events and are based on NGM’s current plans, objectives, estimates and expectations, they are subject to significant risks and uncertainties and actual results and achievements and the timing of events could differ materially from those described in or implied by the statements in this presentation. Such risks and uncertainties include, without limitation, those associated with costly and time-consuming pharmaceutical product development; the uncertainty of clinical success; failures or delays in initiating, enrolling or completing clinical trials; seeking and maintaining protection of intellectual property; and delays or problems in the manufacture of product candidates; as well as other risks and uncertainties affecting NGM, including those discussed in the section titled "Risk Factors" and elsewhere in NGM’s quarterly report on Form 10-Q for the quarter ended September 30, 2019 and future filings and reports of NGM with the Securities and Exchange Commission. Other risks and uncertainties of which NGM is not currently aware may also affect the forward-looking statements and may cause actual results and the timing of events to differ materially from those anticipated. The forward-looking statements contained herein are made only as of the date hereof or as of the dates indicated in the forward-looking statements, even if they are subsequently made available by NGM on its website or otherwise. NGM undertakes no obligation to update or supplement any forward-looking statements after the date of this presentation, or to update the reasons why actual results may differ or differ materially from those anticipated in the forward-looking statements. Safe Harbor Statement
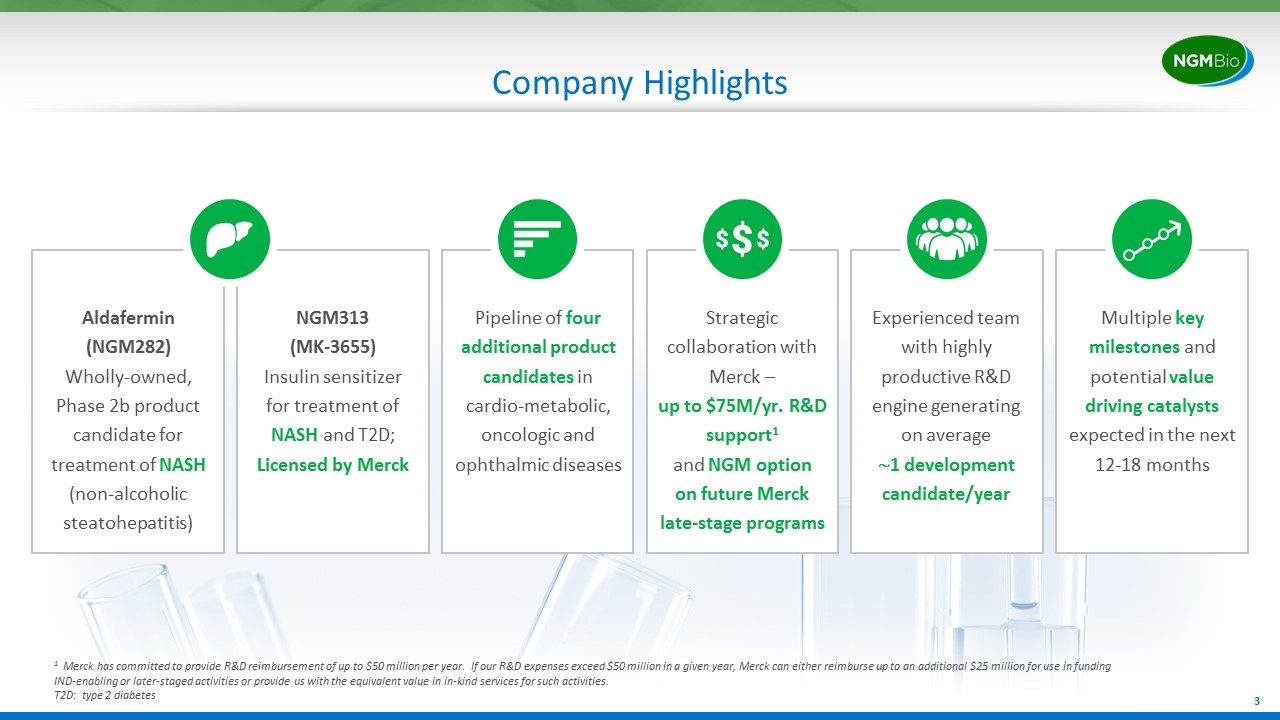
Company Highlights Experienced team with highly productive R&D engine generating on average ~1 development candidate/year Pipeline of four additional product candidates in cardio-metabolic, oncologic and ophthalmic diseases Strategic collaboration with Merck – up to $75M/yr. R&D support1 and NGM option on future Merck late-stage programs Multiple key milestones and potential value driving catalysts expected in the next 12-18 months Aldafermin (NGM282) Wholly-owned, Phase 2b product candidate for treatment of NASH (non-alcoholic steatohepatitis) NGM313 (MK-3655) Insulin sensitizer for treatment of NASH and T2D; Licensed by Merck 1 Merck has committed to provide R&D reimbursement of up to $50 million per year. If our R&D expenses exceed $50 million in a given year, Merck can either reimburse up to an additional $25 million for use in funding IND-enabling or later-staged activities or provide us with the equivalent value in in-kind services for such activities. T2D: type 2 diabetes
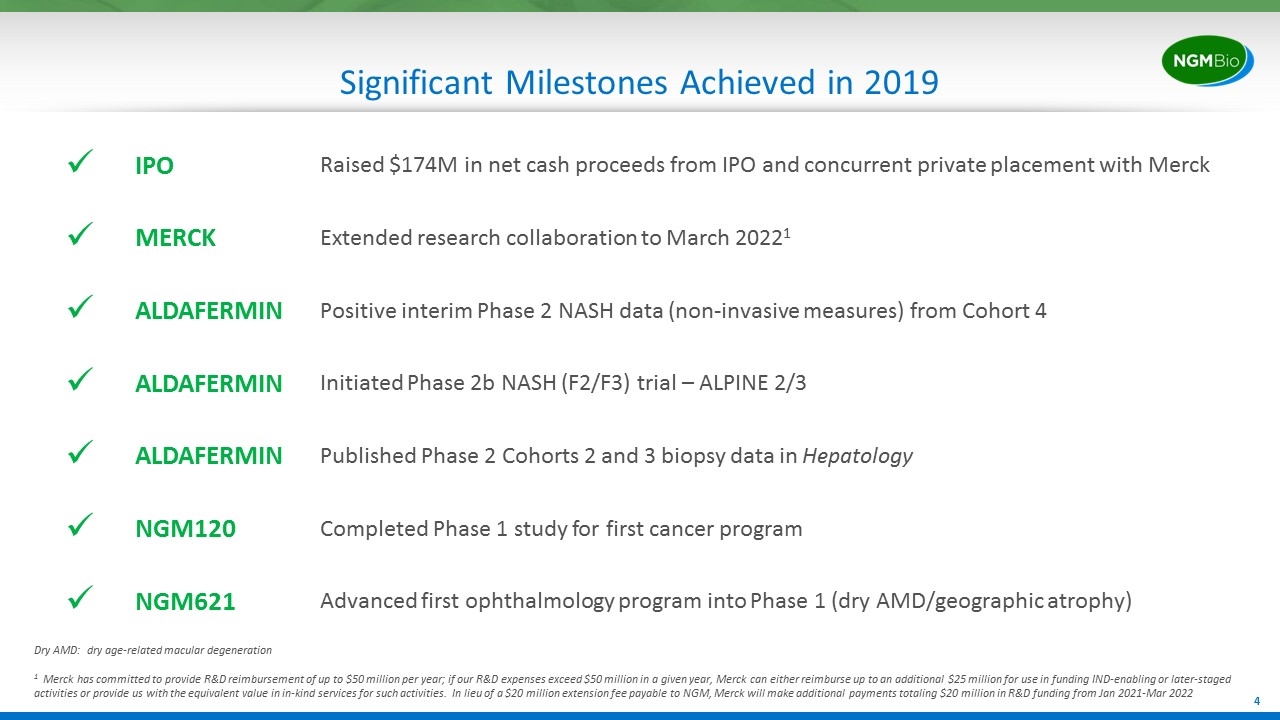
Significant Milestones Achieved in 2019 Dry AMD: dry age-related macular degeneration 1 Merck has committed to provide R&D reimbursement of up to $50 million per year; if our R&D expenses exceed $50 million in a given year, Merck can either reimburse up to an additional $25 million for use in funding IND-enabling or later-staged activities or provide us with the equivalent value in in-kind services for such activities. In lieu of a $20 million extension fee payable to NGM, Merck will make additional payments totaling $20 million in R&D funding from Jan 2021-Mar 2022 ü IPO Raised $174M in net cash proceeds from IPO and concurrent private placement with Merck ü MERCK Extended research collaboration to March 20221 ü ALDAFERMIN Positive interim Phase 2 NASH data (non-invasive measures) from Cohort 4 ü ALDAFERMIN Initiated Phase 2b NASH (F2/F3) trial – ALPINE 2/3 ü ALDAFERMIN Published Phase 2 Cohorts 2 and 3 biopsy data in Hepatology ü NGM120 Completed Phase 1 study for first cancer program ü NGM621 Advanced first ophthalmology program into Phase 1 (dry AMD/geographic atrophy)
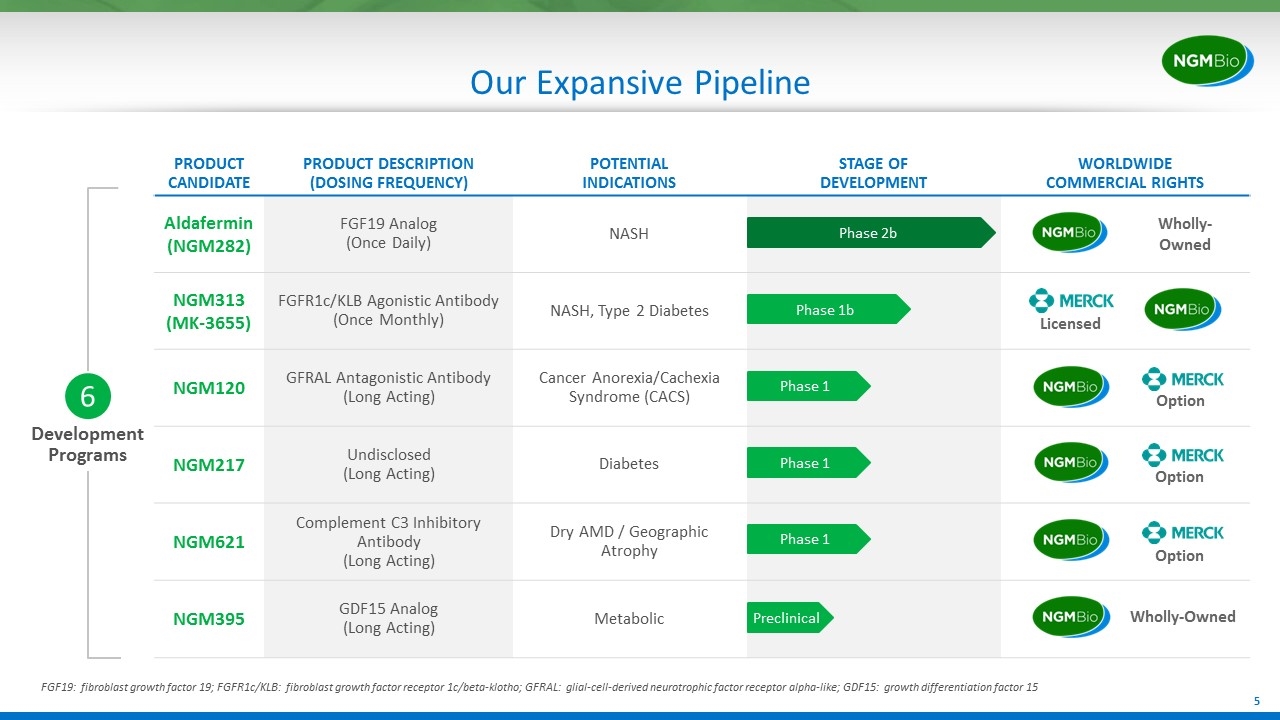
Development Programs 6 Our Expansive Pipeline PRODUCT CANDIDATE PRODUCT DESCRIPTION (DOSING FREQUENCY) POTENTIAL INDICATIONS STAGE OF DEVELOPMENT WORLDWIDE COMMERCIAL RIGHTS Aldafermin(NGM282) FGF19 Analog (Once Daily) NASH NGM313 (MK-3655) FGFR1c/KLB Agonistic Antibody (Once Monthly) NASH, Type 2 Diabetes NGM120 GFRAL Antagonistic Antibody (Long Acting) Cancer Anorexia/Cachexia Syndrome (CACS) NGM217 Undisclosed (Long Acting) Diabetes NGM621 Complement C3 Inhibitory Antibody (Long Acting) Dry AMD / Geographic Atrophy NGM395 GDF15 Analog (Long Acting) Metabolic Option Option Option Wholly-Owned Phase 2b Phase 1b Preclinical Phase 1 Phase 1 Phase 1 Licensed FGF19: fibroblast growth factor 19; FGFR1c/KLB: fibroblast growth factor receptor 1c/beta-klotho; GFRAL: glial-cell-derived neurotrophic factor receptor alpha-like; GDF15: growth differentiation factor 15 Wholly-Owned
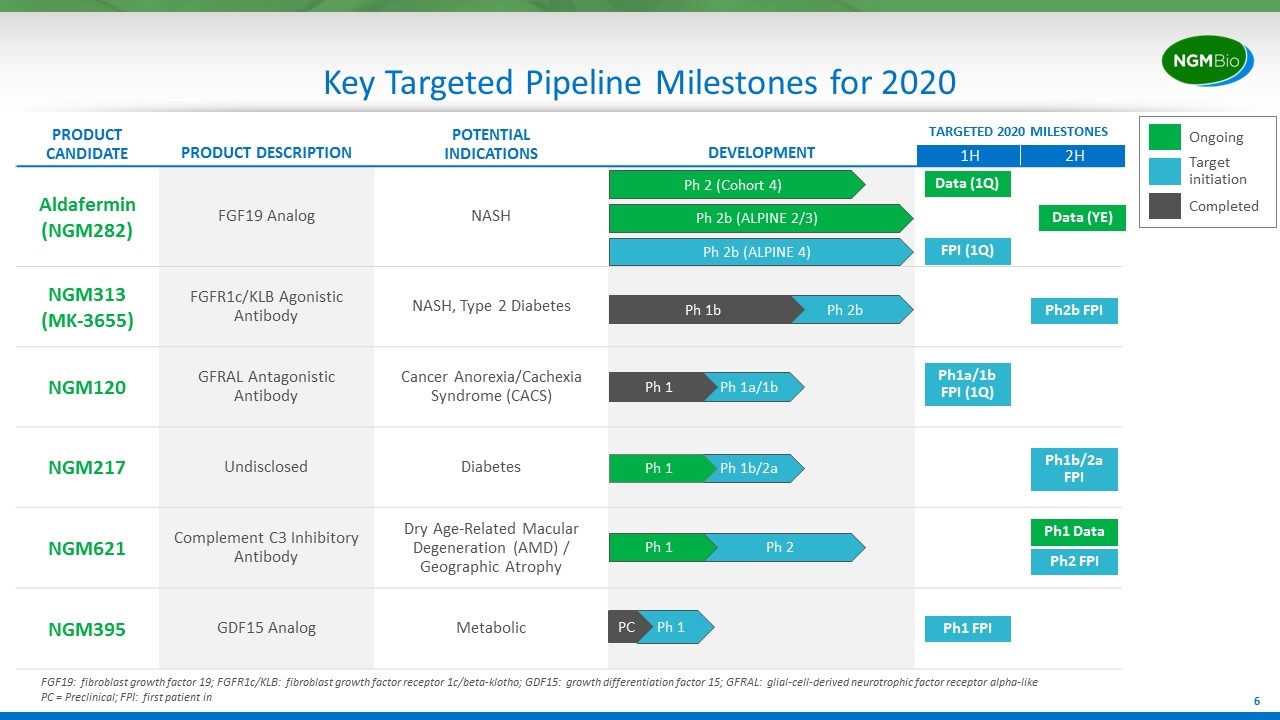
Key Targeted Pipeline Milestones for 2020 FGF19: fibroblast growth factor 19; FGFR1c/KLB: fibroblast growth factor receptor 1c/beta-klotho; GDF15: growth differentiation factor 15; GFRAL: glial-cell-derived neurotrophic factor receptor alpha-like PC = Preclinical; FPI: first patient in PRODUCT CANDIDATE PRODUCT DESCRIPTION POTENTIAL INDICATIONS DEVELOPMENT TARGETED 2020 MILESTONES Aldafermin (NGM282) FGF19 Analog NASH NGM313 (MK-3655) FGFR1c/KLB Agonistic Antibody NASH, Type 2 Diabetes NGM120 GFRAL Antagonistic Antibody Cancer Anorexia/Cachexia Syndrome (CACS) NGM217 Undisclosed Diabetes NGM621 Complement C3 Inhibitory Antibody Dry Age-Related Macular Degeneration (AMD) / Geographic Atrophy NGM395 GDF15 Analog Metabolic Ph 2b (ALPINE 2/3) Ph 2b Ph 1b FPI (1Q) 1H 2H Ph 2b (ALPINE 4) Ph 2 (Cohort 4) Ph 1a/1b Ph 1 Ph 1b/2a Ph 1 Ph 1 PC Data (1Q) Data (YE) Ph2b FPI Ph1a/1b FPI (1Q) Ph2 FPI Ph 2 Ph1 Data Ph1b/2a FPI Ph1 FPI Ph 1 Ongoing Target initiation Completed
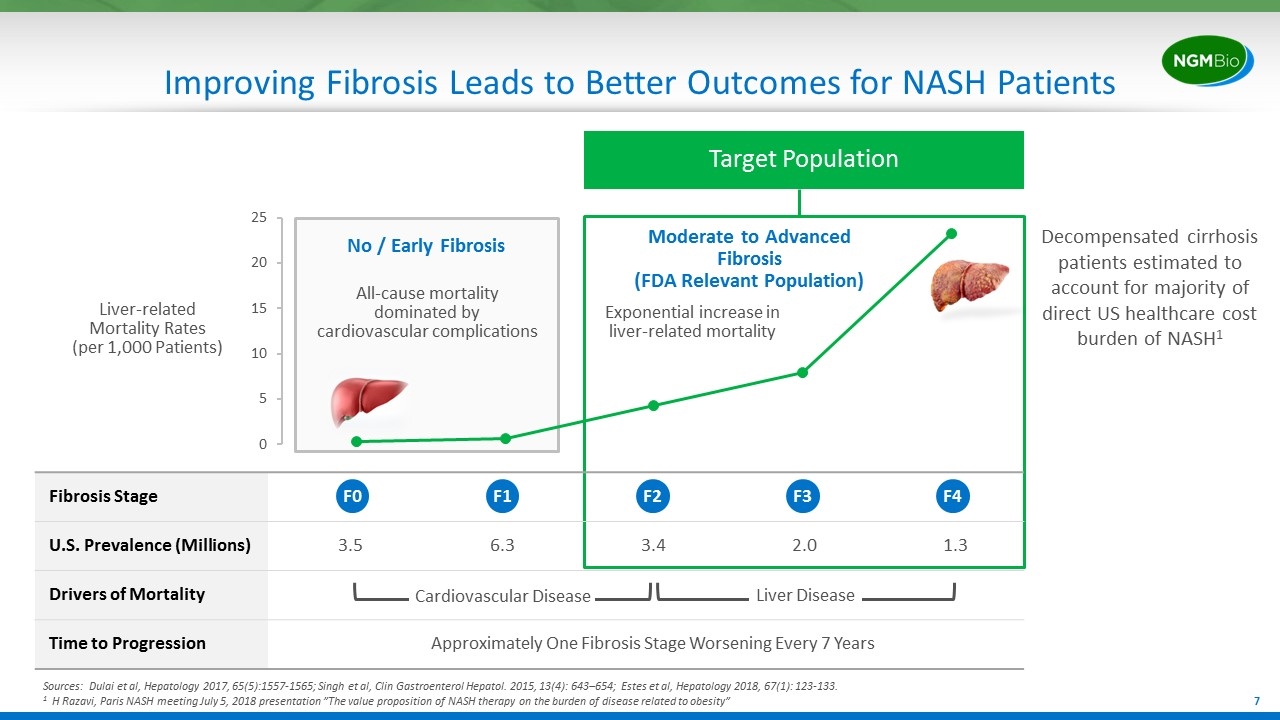
Target Population Fibrosis Stage U.S. Prevalence (Millions) 3.5 6.3 3.4 2.0 1.3 Drivers of Mortality Time to Progression Approximately One Fibrosis Stage Worsening Every 7 Years Improving Fibrosis Leads to Better Outcomes for NASH Patients Sources: Dulai et al, Hepatology 2017, 65(5):1557-1565; Singh et al, Clin Gastroenterol Hepatol. 2015, 13(4): 643–654; Estes et al, Hepatology 2018, 67(1): 123-133. 1 H Razavi, Paris NASH meeting July 5, 2018 presentation ”The value proposition of NASH therapy on the burden of disease related to obesity” Liver-related Mortality Rates (per 1,000 Patients) F0 F1 F2 F3 F4 Cardiovascular Disease Liver Disease No / Early Fibrosis Exponential increase in liver-related mortality All-cause mortality dominated by cardiovascular complications Decompensated cirrhosis patients estimated to account for majority of direct US healthcare cost burden of NASH1 Moderate to Advanced Fibrosis (FDA Relevant Population)
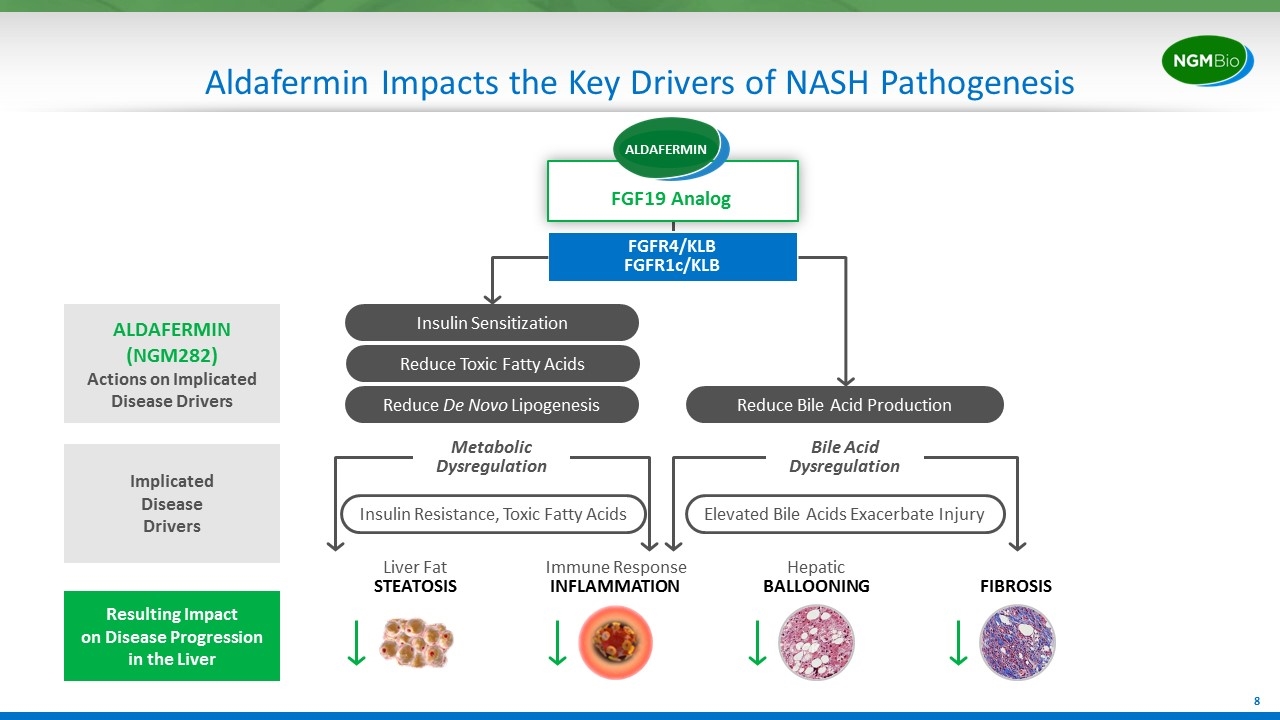
Aldafermin Impacts the Key Drivers of NASH Pathogenesis Liver Fat STEATOSIS Hepatic BALLOONING Immune Response INFLAMMATION FIBROSIS Resulting Impact on Disease Progression in the Liver Insulin Resistance, Toxic Fatty Acids Metabolic Dysregulation ALDAFERMIN (NGM282) Actions on Implicated Disease Drivers Elevated Bile Acids Exacerbate Injury Bile Acid Dysregulation Reduce De Novo Lipogenesis Reduce Bile Acid Production Reduce Toxic Fatty Acids Insulin Sensitization FGFR4/KLB FGFR1c/KLB FGF19 Analog Implicated Disease Drivers ALDAFERMIN
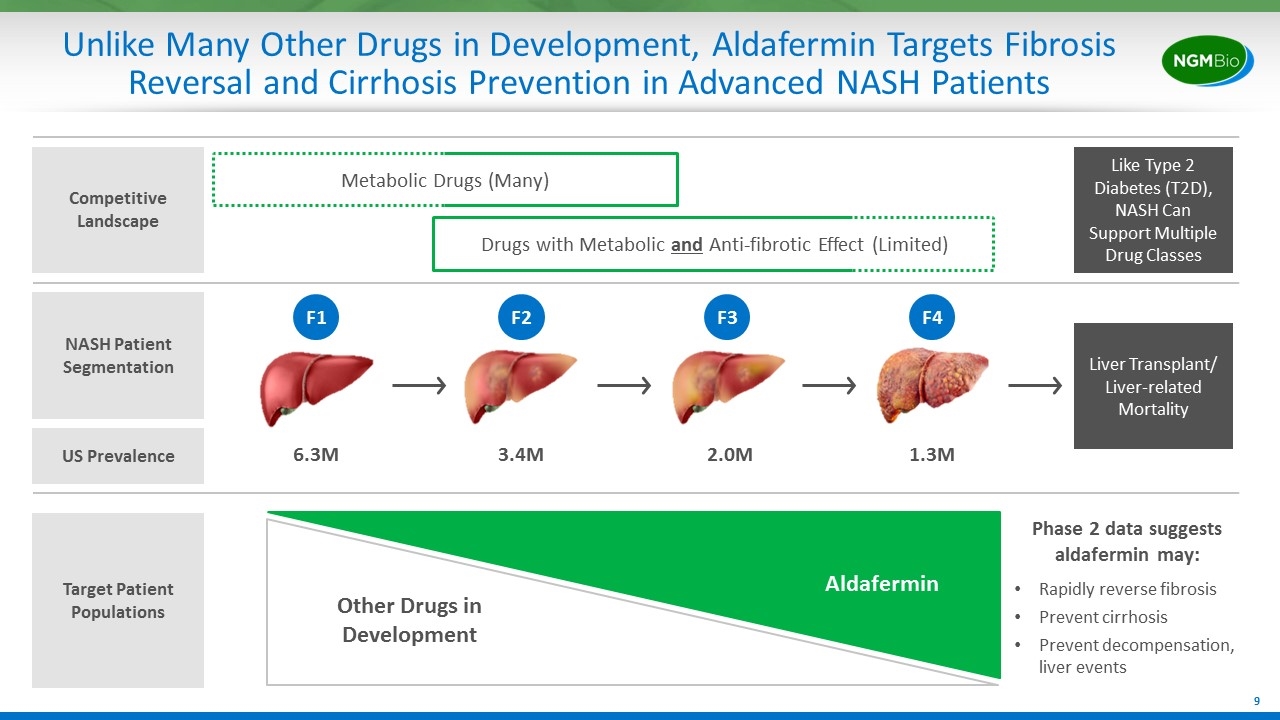
Unlike Many Other Drugs in Development, Aldafermin Targets Fibrosis Reversal and Cirrhosis Prevention in Advanced NASH Patients NASH Patient Segmentation Liver Transplant/ Liver-related Mortality 6.3M 3.4M 2.0M 1.3M F1 F2 F3 F4 Target Patient Populations Metabolic Drugs (Many) Competitive Landscape Drugs with Metabolic and Anti-fibrotic Effect (Limited) Like Type 2 Diabetes (T2D), NASH Can Support Multiple Drug Classes US Prevalence Aldafermin Rapidly reverse fibrosis Prevent cirrhosis Prevent decompensation, liver events Other Drugs in Development Phase 2 data suggests aldafermin may:
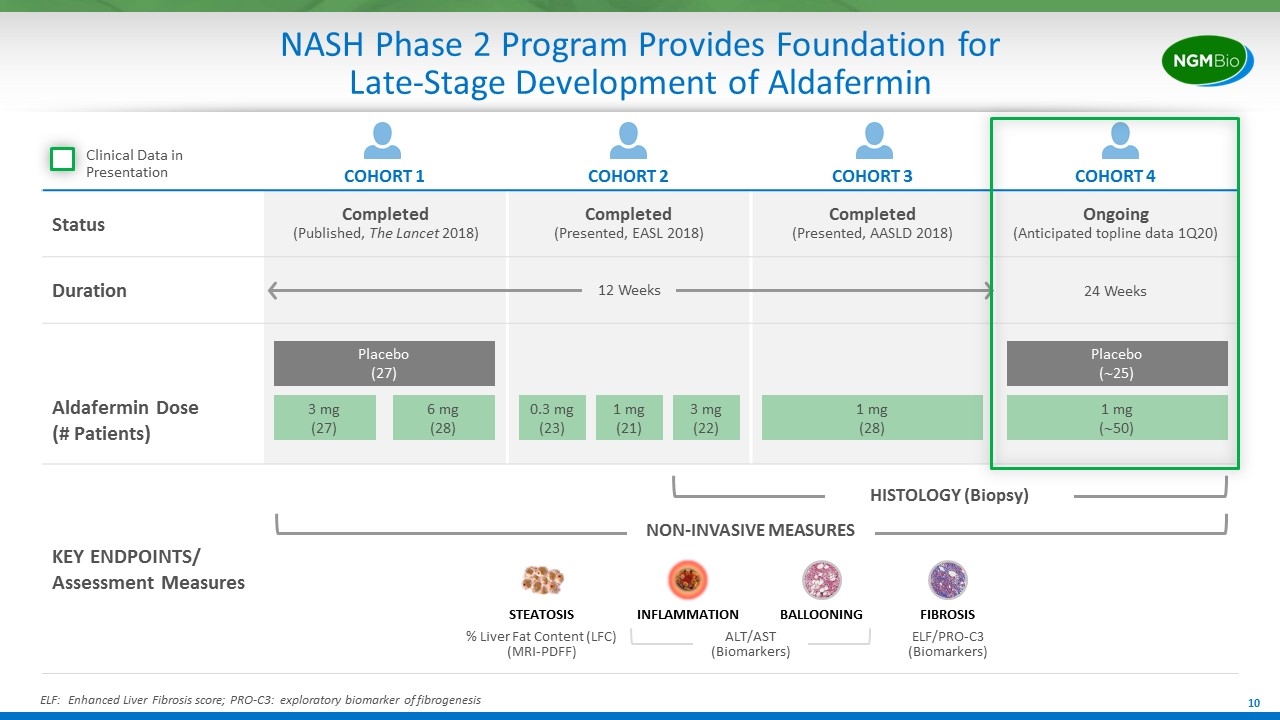
COHORT 1 COHORT 2 COHORT 3 COHORT 4 Status Completed (Published, The Lancet 2018) Completed (Presented, EASL 2018) Completed (Presented, AASLD 2018) Ongoing (Anticipated topline data 1Q20) Duration 24 Weeks Aldafermin Dose (# Patients) KEY ENDPOINTS/ Assessment Measures NASH Phase 2 Program Provides Foundation for Late-Stage Development of Aldafermin 12 Weeks NON-INVASIVE MEASURES 0.3 mg (23) 1 mg (21) 3 mg (22) 1 mg (28) 1 mg (~50) Placebo (~25) 3 mg (27) Placebo (27) 6 mg (28) HISTOLOGY (Biopsy) Clinical Data in Presentation ELF: Enhanced Liver Fibrosis score; PRO-C3: exploratory biomarker of fibrogenesis STEATOSIS INFLAMMATION BALLOONING FIBROSIS % Liver Fat Content (LFC) (MRI-PDFF) ELF/PRO-C3 (Biomarkers) ALT/AST (Biomarkers)
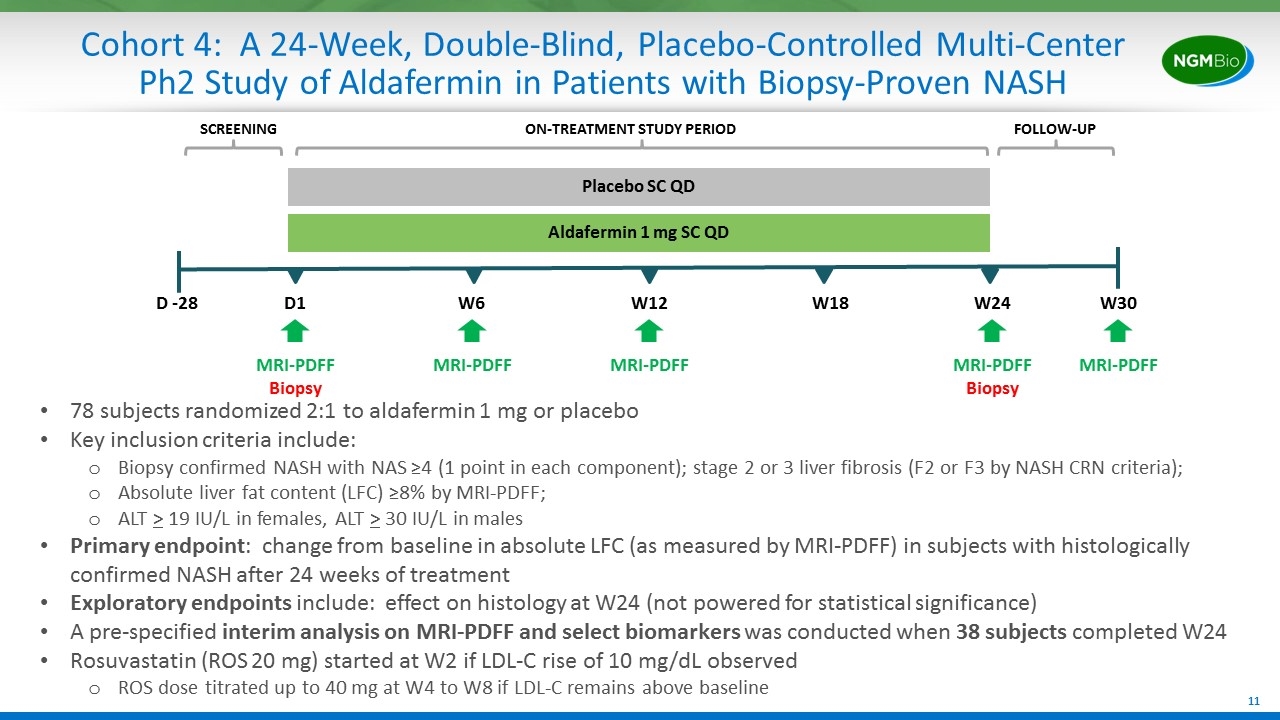
Cohort 4: A 24-Week, Double-Blind, Placebo-Controlled Multi-Center Ph2 Study of Aldafermin in Patients with Biopsy-Proven NASH D -28 D1 W24 Placebo SC QD Aldafermin 1 mg SC QD MRI-PDFF Biopsy W6 78 subjects randomized 2:1 to aldafermin 1 mg or placebo Key inclusion criteria include: Biopsy confirmed NASH with NAS ≥4 (1 point in each component); stage 2 or 3 liver fibrosis (F2 or F3 by NASH CRN criteria); Absolute liver fat content (LFC) ≥8% by MRI-PDFF; ALT > 19 IU/L in females, ALT > 30 IU/L in males Primary endpoint: change from baseline in absolute LFC (as measured by MRI-PDFF) in subjects with histologically confirmed NASH after 24 weeks of treatment Exploratory endpoints include: effect on histology at W24 (not powered for statistical significance) A pre-specified interim analysis on MRI-PDFF and select biomarkers was conducted when 38 subjects completed W24 Rosuvastatin (ROS 20 mg) started at W2 if LDL-C rise of 10 mg/dL observed ROS dose titrated up to 40 mg at W4 to W8 if LDL-C remains above baseline MRI-PDFF Biopsy SCREENING ON-TREATMENT STUDY PERIOD FOLLOW-UP W30 W18 W12 MRI-PDFF MRI-PDFF MRI-PDFF
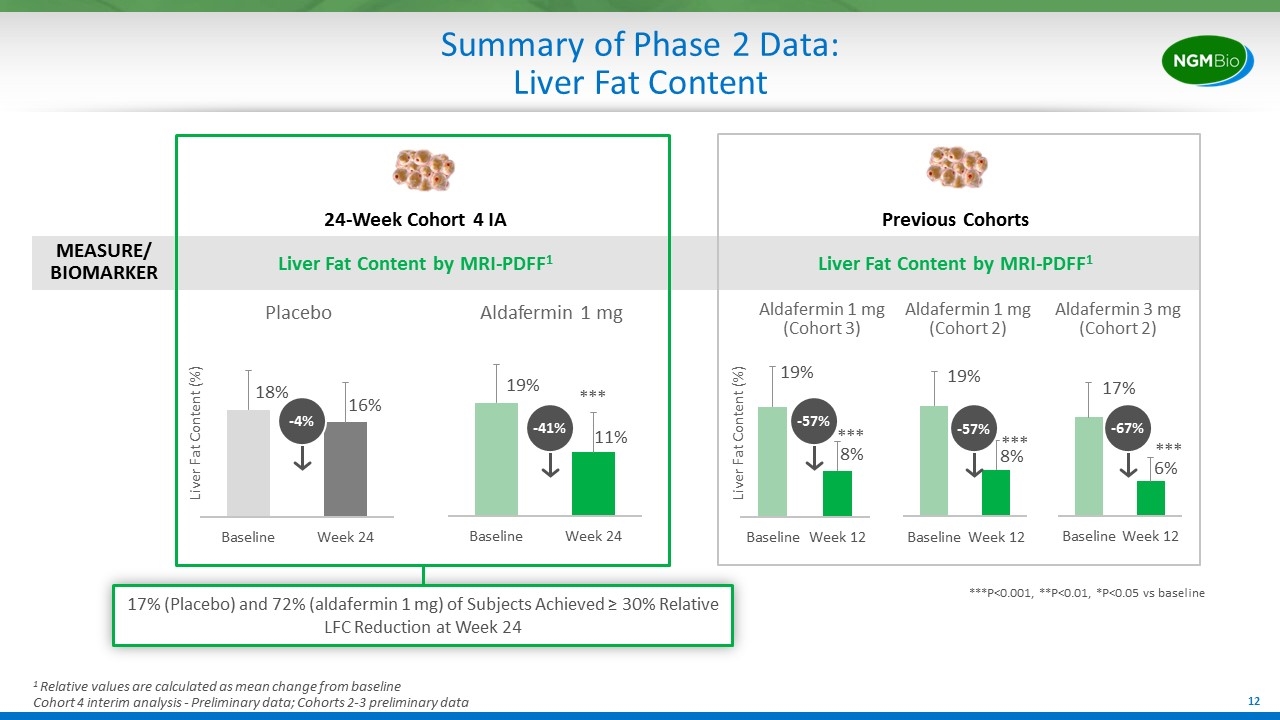
Summary of Phase 2 Data: Liver Fat Content 24-Week Cohort 4 IA Liver Fat Content by MRI-PDFF1 MEASURE/ BIOMARKER 17% (Placebo) and 72% (aldafermin 1 mg) of Subjects Achieved ≥ 30% Relative LFC Reduction at Week 24 1 Relative values are calculated as mean change from baseline Cohort 4 interim analysis - Preliminary data; Cohorts 2-3 preliminary data -4% Previous Cohorts Liver Fat Content by MRI-PDFF1 Placebo Aldafermin 1 mg Liver Fat Content (%) -41% ***P<0.001, **P<0.01, *P<0.05 vs baseline *** -57% Aldafermin 1 mg (Cohort 3) Aldafermin 3 mg (Cohort 2) -67% *** Liver Fat Content (%) *** Aldafermin 1 mg (Cohort 2) -57% ***
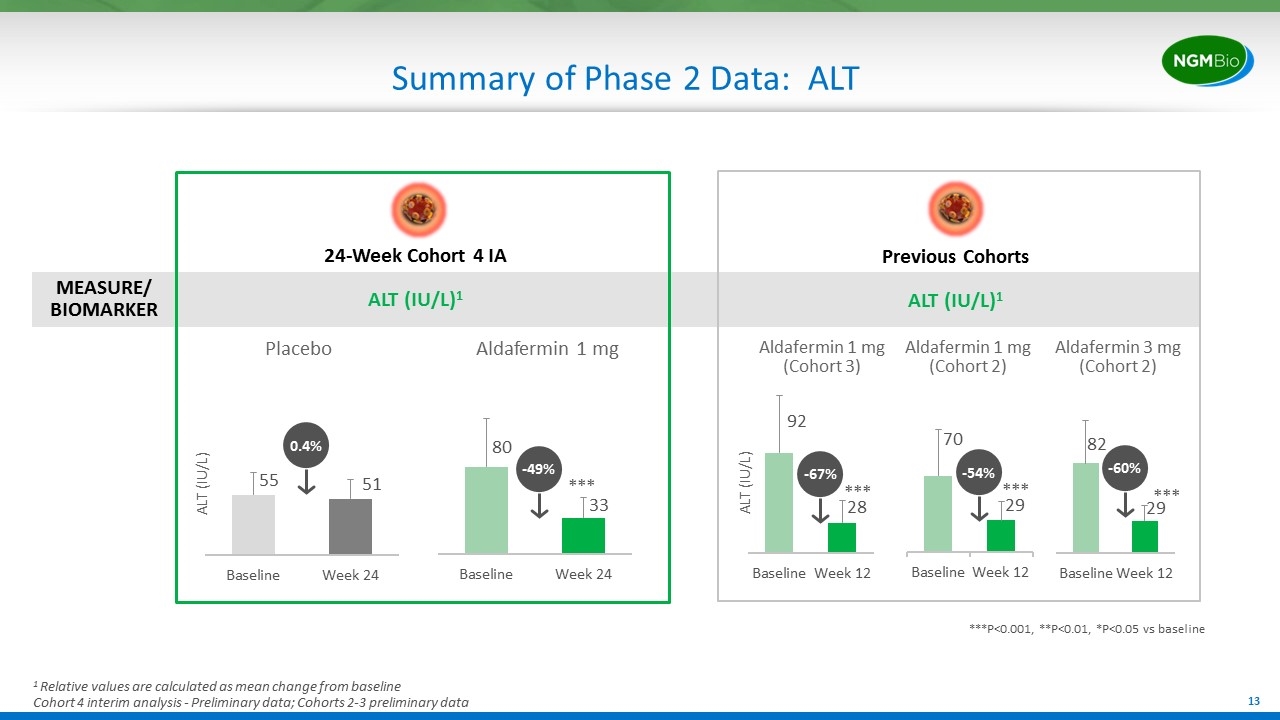
Summary of Phase 2 Data: ALT MEASURE/ BIOMARKER -67% -60% ALT (IU/L) ***P<0.001, **P<0.01, *P<0.05 vs baseline *** *** 0.4% -49% ALT (IU/L) Placebo Aldafermin 1 mg 24-Week Cohort 4 IA ALT (IU/L)1 Previous Cohorts ALT (IU/L)1 *** Aldafermin 1 mg (Cohort 3) Aldafermin 3 mg (Cohort 2) Aldafermin 1 mg (Cohort 2) -54% *** 1 Relative values are calculated as mean change from baseline Cohort 4 interim analysis - Preliminary data; Cohorts 2-3 preliminary data
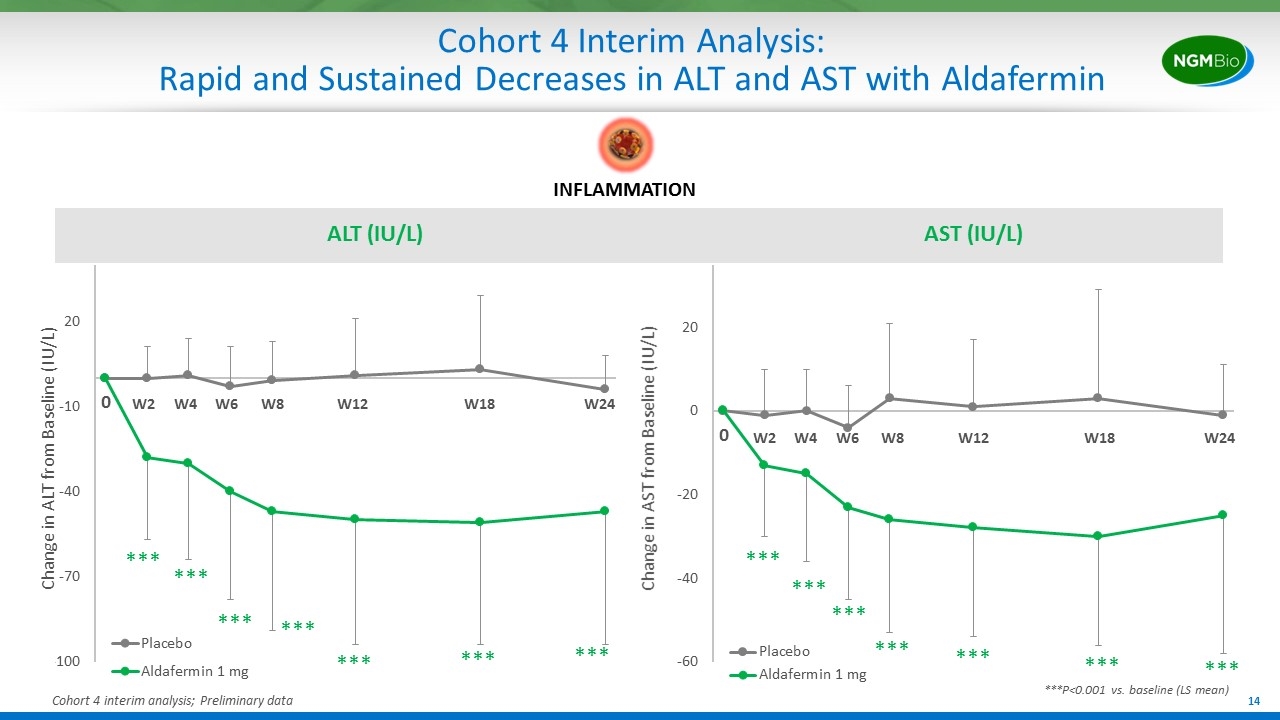
Cohort 4 Interim Analysis: Rapid and Sustained Decreases in ALT and AST with Aldafermin ALT (IU/L) AST (IU/L) Change in ALT from Baseline (IU/L) *** *** *** *** *** *** *** *** *** *** *** *** *** *** ***P<0.001 vs. baseline (LS mean) Change in AST from Baseline (IU/L) Cohort 4 interim analysis; Preliminary data INFLAMMATION W2 W4 W6 W12 W24 W18 W8 W2 W4 W6 W12 W24 W18 W8
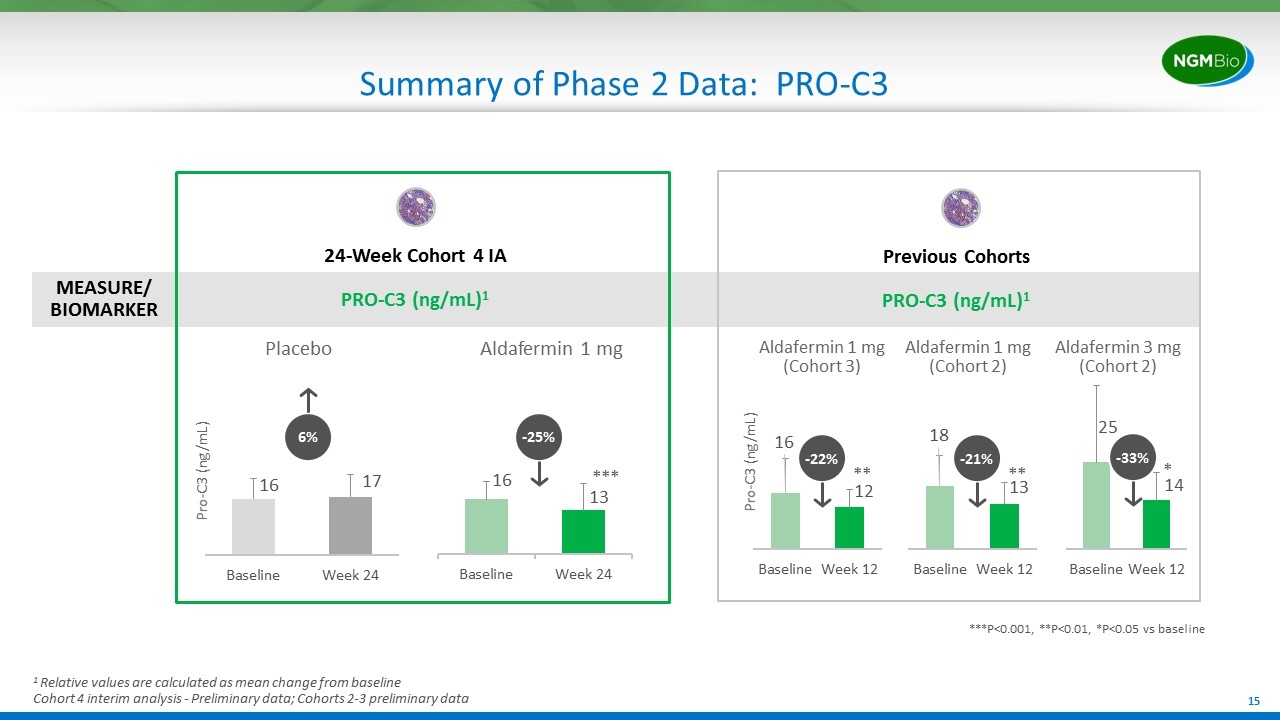
Summary of Phase 2 Data: PRO-C3 MEASURE/ BIOMARKER ***P<0.001, **P<0.01, *P<0.05 vs baseline 6% -25% Pro-C3 (ng/mL) Placebo Aldafermin 1 mg 24-Week Cohort 4 IA PRO-C3 (ng/mL)1 Previous Cohorts PRO-C3 (ng/mL)1 -22% -33% Pro-C3 (ng/mL) * ** *** Aldafermin 1 mg (Cohort 3) Aldafermin 3 mg (Cohort 2) Aldafermin 1 mg (Cohort 2) -21% ** 1 Relative values are calculated as mean change from baseline Cohort 4 interim analysis - Preliminary data; Cohorts 2-3 preliminary data
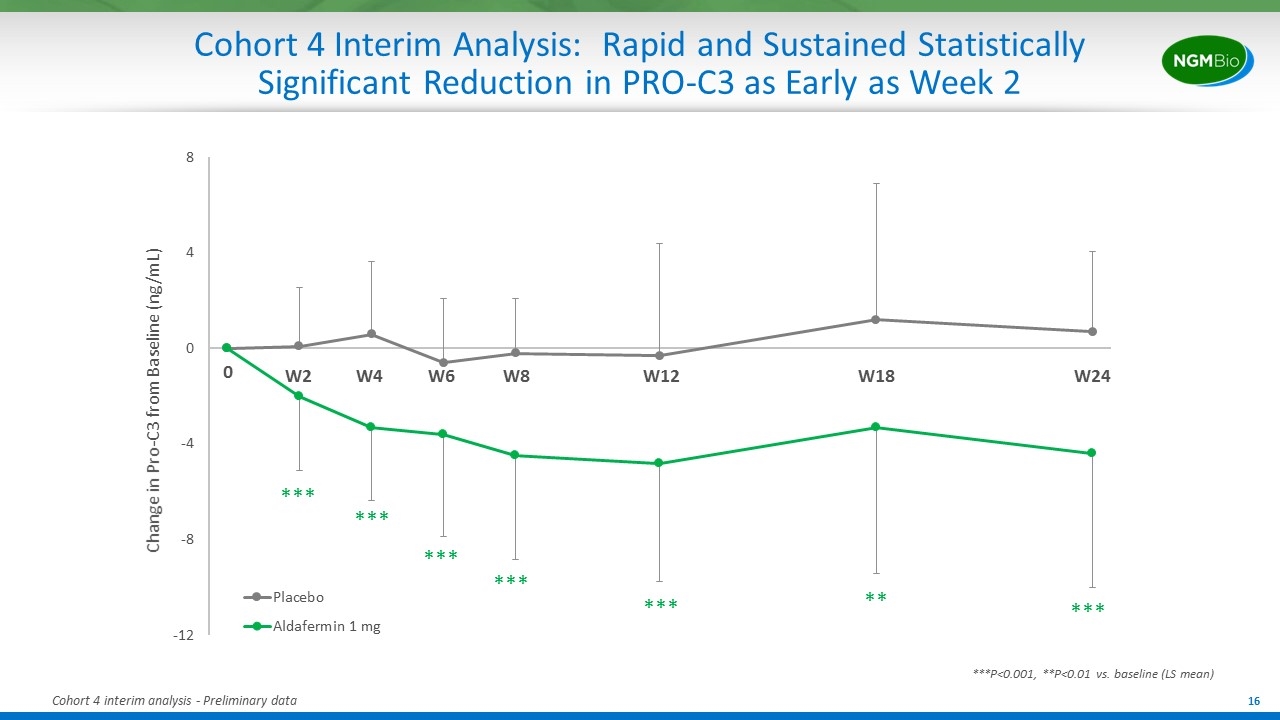
Cohort 4 Interim Analysis: Rapid and Sustained Statistically Significant Reduction in PRO-C3 as Early as Week 2 Change in Pro-C3 from Baseline (ng/mL) *** *** *** *** *** *** ** ***P<0.001, **P<0.01 vs. baseline (LS mean) Cohort 4 interim analysis - Preliminary data W2 W4 W6 W12 W24 W18 W8

Cohort 4 Interim Analysis: LDL-C Changes Effectively Managed with Statin Therapy LDL-C (mg/dl) Aldafermin Aldafermin + Rosuvastatin (If Needed, Titration at W2, W4, W8) Cholesterol FGFR4 C4 Bile Acids CYP7A1 Reduce LDL Receptors LDL cholesterol levels return to baseline and/or target of < 100 mg/dl with statin treatment LDL-C elevation is a direct effect of FGF19’s inhibition of the classical bile acid synthesis pathway W2 W4 W6 W12 W24 W18 W8 Cohort 4 interim analysis - Preliminary data; C4 = 7a-hydroxyl-4-cholesten-3-one; CYP7A1: cholesterol 7 alpha-hydroxylase
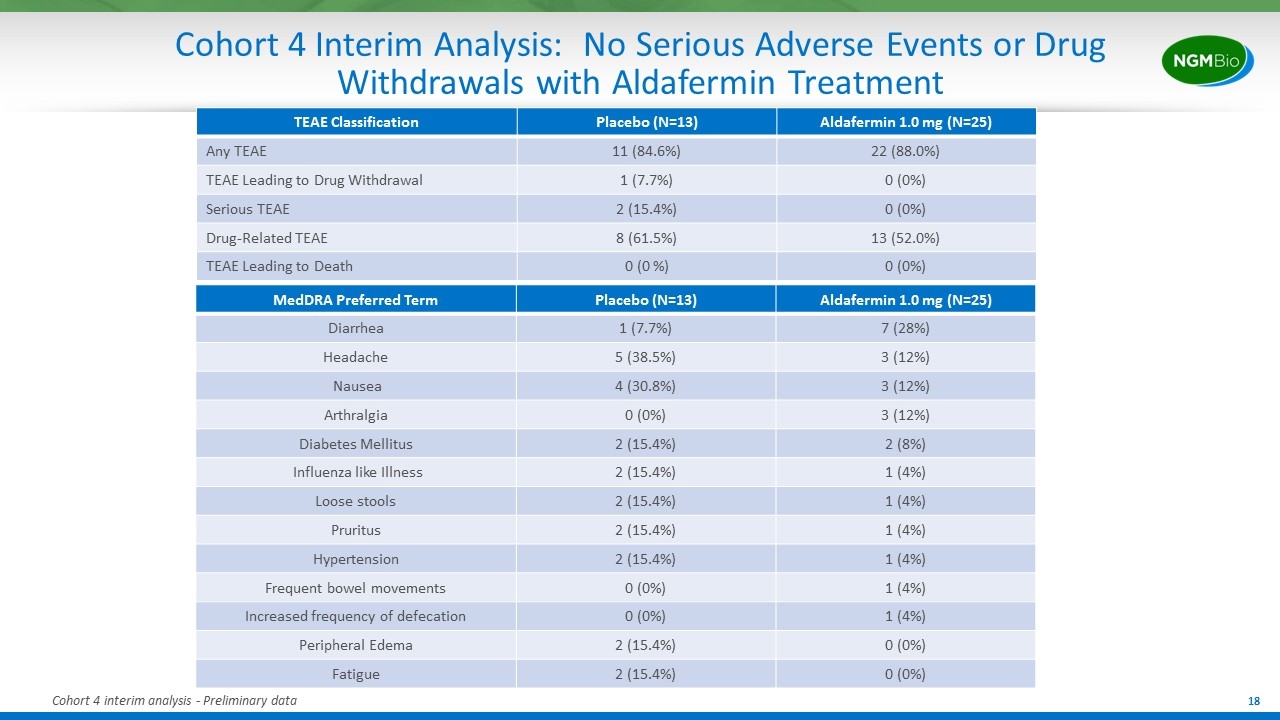
Cohort 4 Interim Analysis: No Serious Adverse Events or Drug Withdrawals with Aldafermin Treatment MedDRA Preferred Term Placebo (N=13) Aldafermin 1.0 mg (N=25) Diarrhea 1 (7.7%) 7 (28%) Headache 5 (38.5%) 3 (12%) Nausea 4 (30.8%) 3 (12%) Arthralgia 0 (0%) 3 (12%) Diabetes Mellitus 2 (15.4%) 2 (8%) Influenza like Illness 2 (15.4%) 1 (4%) Loose stools 2 (15.4%) 1 (4%) Pruritus 2 (15.4%) 1 (4%) Hypertension 2 (15.4%) 1 (4%) Frequent bowel movements 0 (0%) 1 (4%) Increased frequency of defecation 0 (0%) 1 (4%) Peripheral Edema 2 (15.4%) 0 (0%) Fatigue 2 (15.4%) 0 (0%) TEAE Classification Placebo (N=13) Aldafermin 1.0 mg (N=25) Any TEAE 11 (84.6%) 22 (88.0%) TEAE Leading to Drug Withdrawal 1 (7.7%) 0 (0%) Serious TEAE 2 (15.4%) 0 (0%) Drug-Related TEAE 8 (61.5%) 13 (52.0%) TEAE Leading to Death 0 (0 %) 0 (0%) Cohort 4 interim analysis - Preliminary data
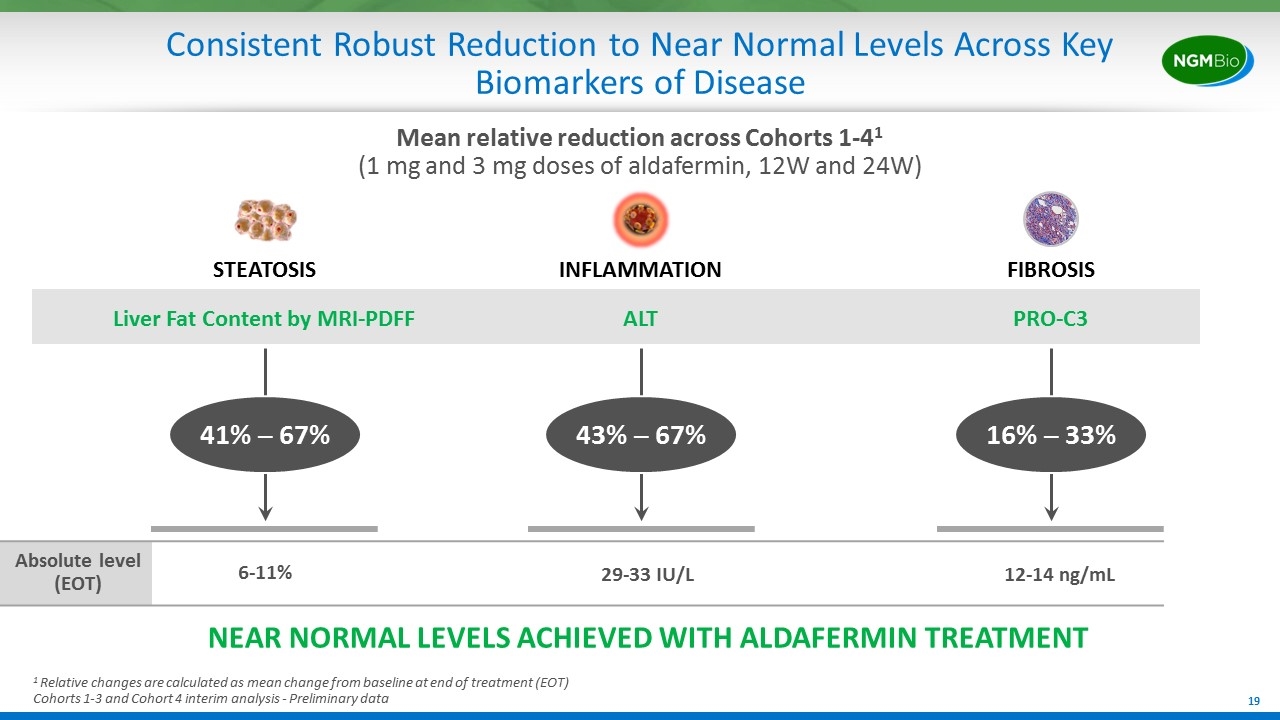
Consistent Robust Reduction to Near Normal Levels Across Key Biomarkers of Disease STEATOSIS Liver Fat Content by MRI-PDFF FIBROSIS PRO-C3 INFLAMMATION ALT 41% ─ 67% 1 Relative changes are calculated as mean change from baseline at end of treatment (EOT) Cohorts 1-3 and Cohort 4 interim analysis - Preliminary data 43% ─ 67% 16% ─ 33% Mean relative reduction across Cohorts 1-41 (1 mg and 3 mg doses of aldafermin, 12W and 24W) Absolute level (EOT) 6-11% 29-33 IU/L 12-14 ng/mL NEAR NORMAL LEVELS ACHIEVED WITH ALDAFERMIN TREATMENT
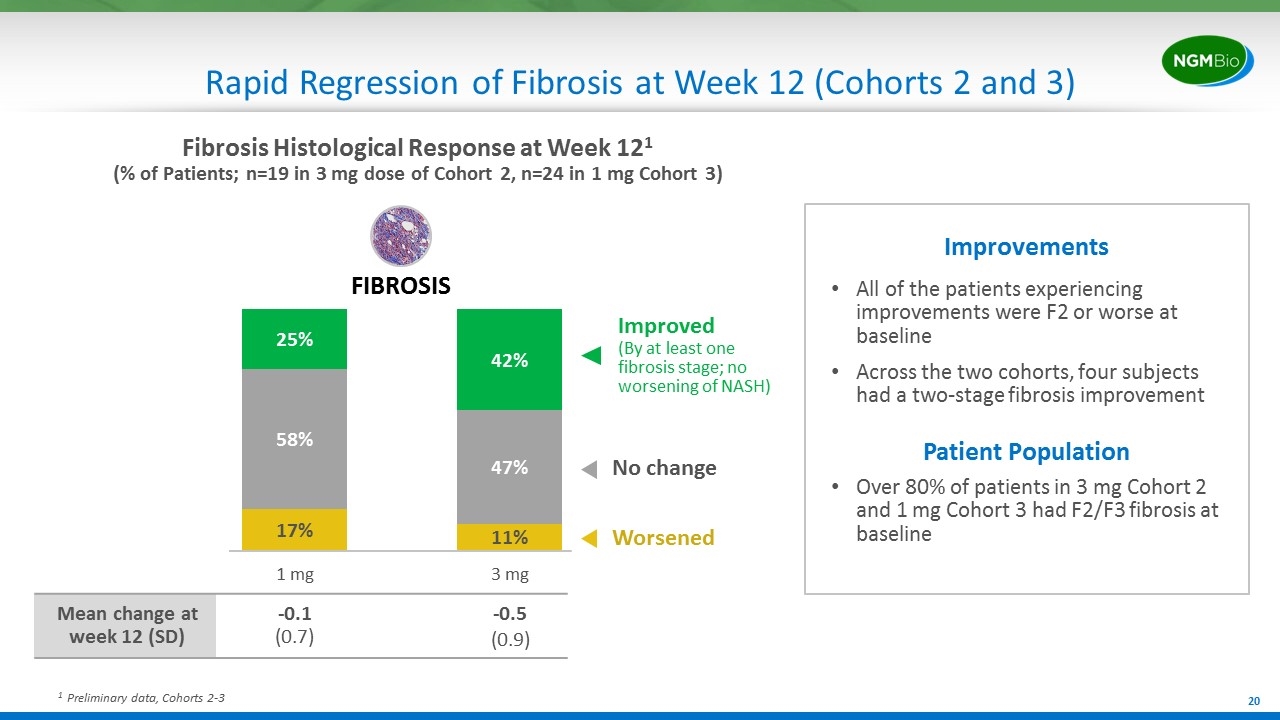
Rapid Regression of Fibrosis at Week 12 (Cohorts 2 and 3) 1 Preliminary data, Cohorts 2-3 All of the patients experiencing improvements were F2 or worse at baseline Across the two cohorts, four subjects had a two-stage fibrosis improvement Improvements Patient Population Over 80% of patients in 3 mg Cohort 2 and 1 mg Cohort 3 had F2/F3 fibrosis at baseline FIBROSIS Mean change at week 12 (SD) -0.1 (0.7) -0.5 (0.9) Fibrosis Histological Response at Week 121 (% of Patients; n=19 in 3 mg dose of Cohort 2, n=24 in 1 mg Cohort 3) Improved (By at least one fibrosis stage; no worsening of NASH) No change Worsened
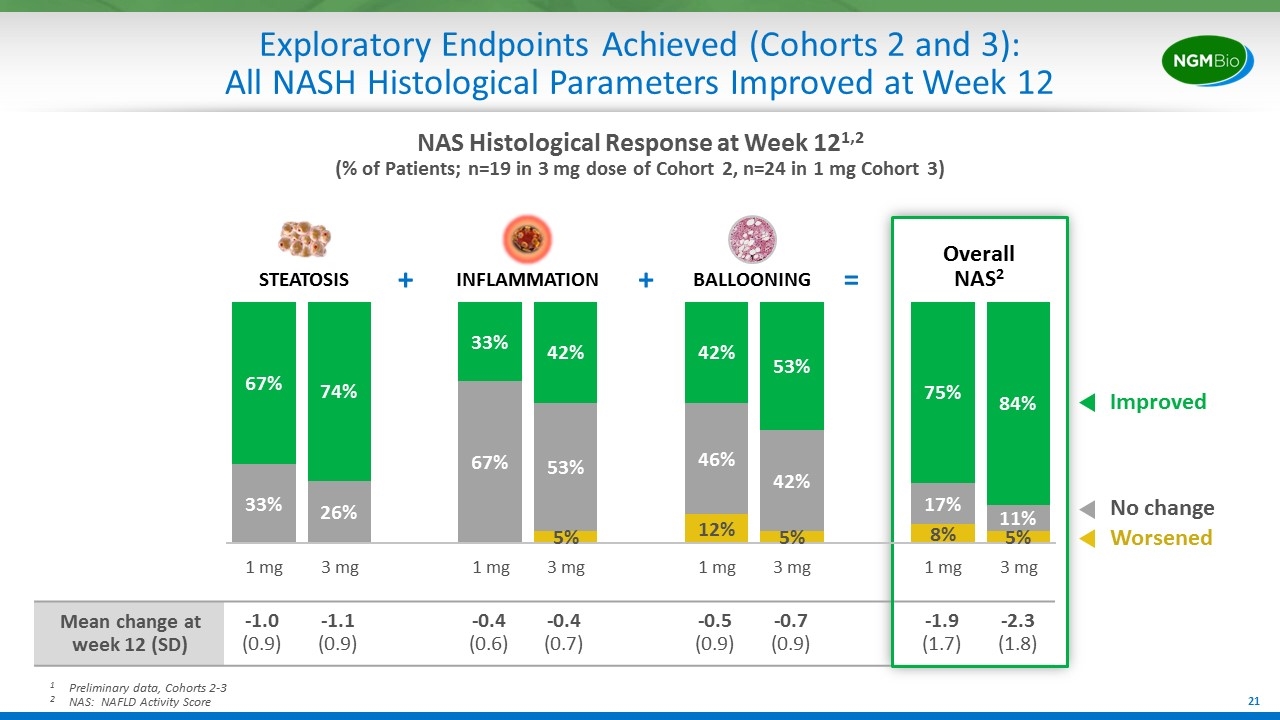
Exploratory Endpoints Achieved (Cohorts 2 and 3): All NASH Histological Parameters Improved at Week 12 Overall NAS2 1Preliminary data, Cohorts 2-3 2NAS: NAFLD Activity Score NAS Histological Response at Week 121,2 (% of Patients; n=19 in 3 mg dose of Cohort 2, n=24 in 1 mg Cohort 3) Mean change at week 12 (SD) -1.0 (0.9) -1.1 (0.9) -0.4 (0.6) -0.4 (0.7) -0.5 (0.9) -0.7 (0.9) -1.9 (1.7) -2.3 (1.8) Improved No change Worsened STEATOSIS INFLAMMATION BALLOONING + + =
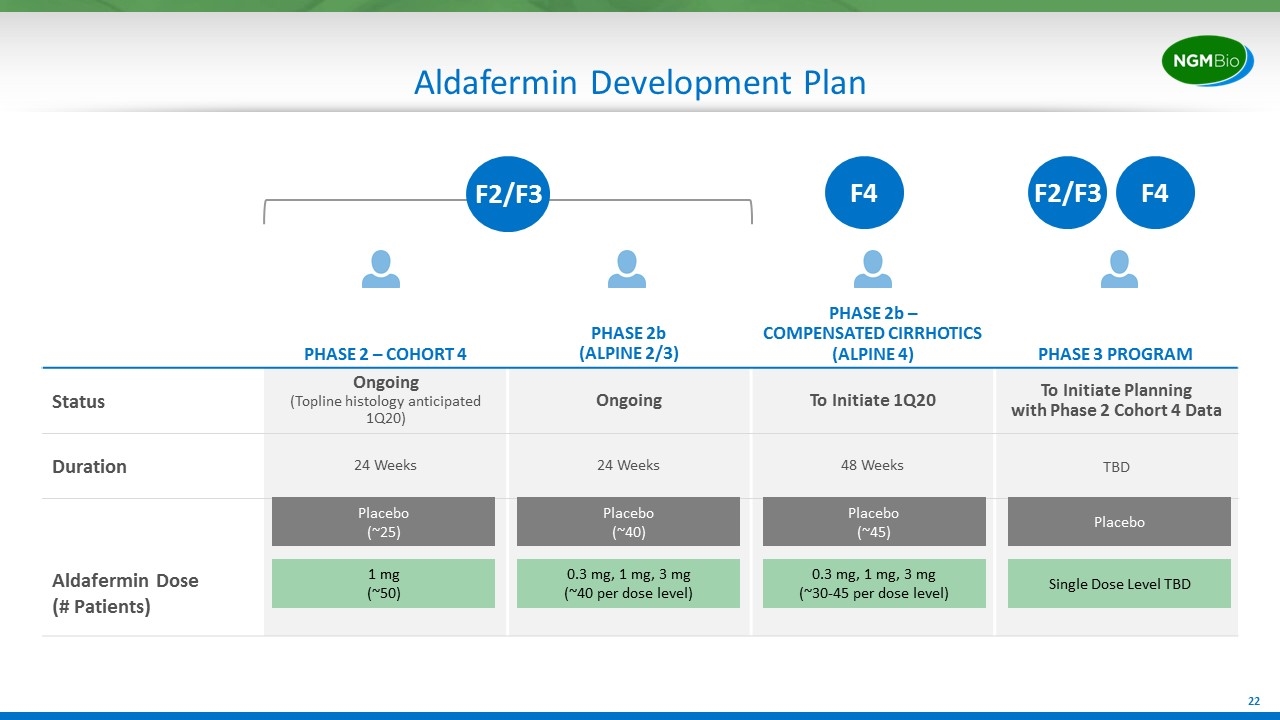
Aldafermin Development Plan PHASE 2 – COHORT 4 PHASE 2b (ALPINE 2/3) PHASE 2b – COMPENSATED CIRRHOTICS (ALPINE 4) PHASE 3 PROGRAM Status Ongoing (Topline histology anticipated 1Q20) Ongoing To Initiate 1Q20 To Initiate Planning with Phase 2 Cohort 4 Data Duration 24 Weeks 24 Weeks 48 Weeks TBD Aldafermin Dose (# Patients) 1 mg (~50) Placebo (~25) 0.3 mg, 1 mg, 3 mg (~40 per dose level) Placebo (~40) F4 0.3 mg, 1 mg, 3 mg (~30-45 per dose level) Placebo (~45) Single Dose Level TBD Placebo F2/F3 F4 F2/F3
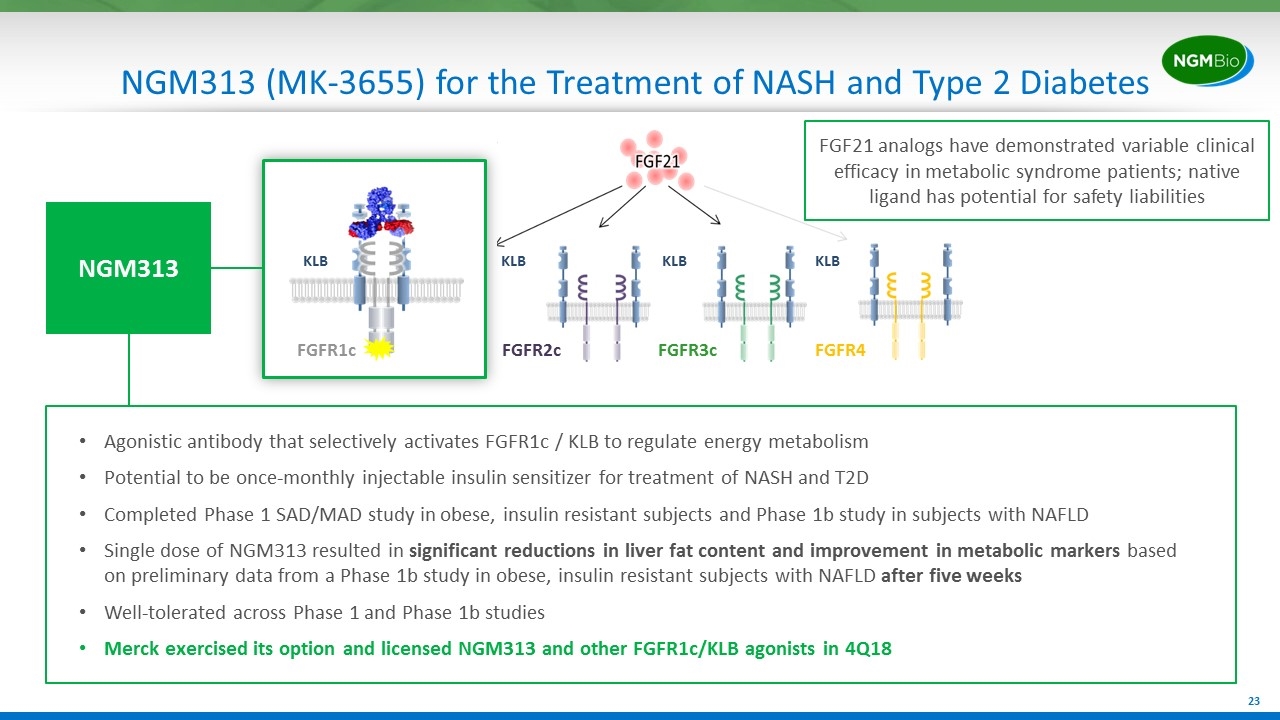
NGM313 (MK-3655) for the Treatment of NASH and Type 2 Diabetes Agonistic antibody that selectively activates FGFR1c / KLB to regulate energy metabolism Potential to be once-monthly injectable insulin sensitizer for treatment of NASH and T2D Completed Phase 1 SAD/MAD study in obese, insulin resistant subjects and Phase 1b study in subjects with NAFLD Single dose of NGM313 resulted in significant reductions in liver fat content and improvement in metabolic markers based on preliminary data from a Phase 1b study in obese, insulin resistant subjects with NAFLD after five weeks Well-tolerated across Phase 1 and Phase 1b studies Merck exercised its option and licensed NGM313 and other FGFR1c/KLB agonists in 4Q18 FGFR2c FGFR3c FGFR4 KLB KLB KLB FGFR1c KLB NGM313 FGF21 analogs have demonstrated variable clinical efficacy in metabolic syndrome patients; native ligand has potential for safety liabilities
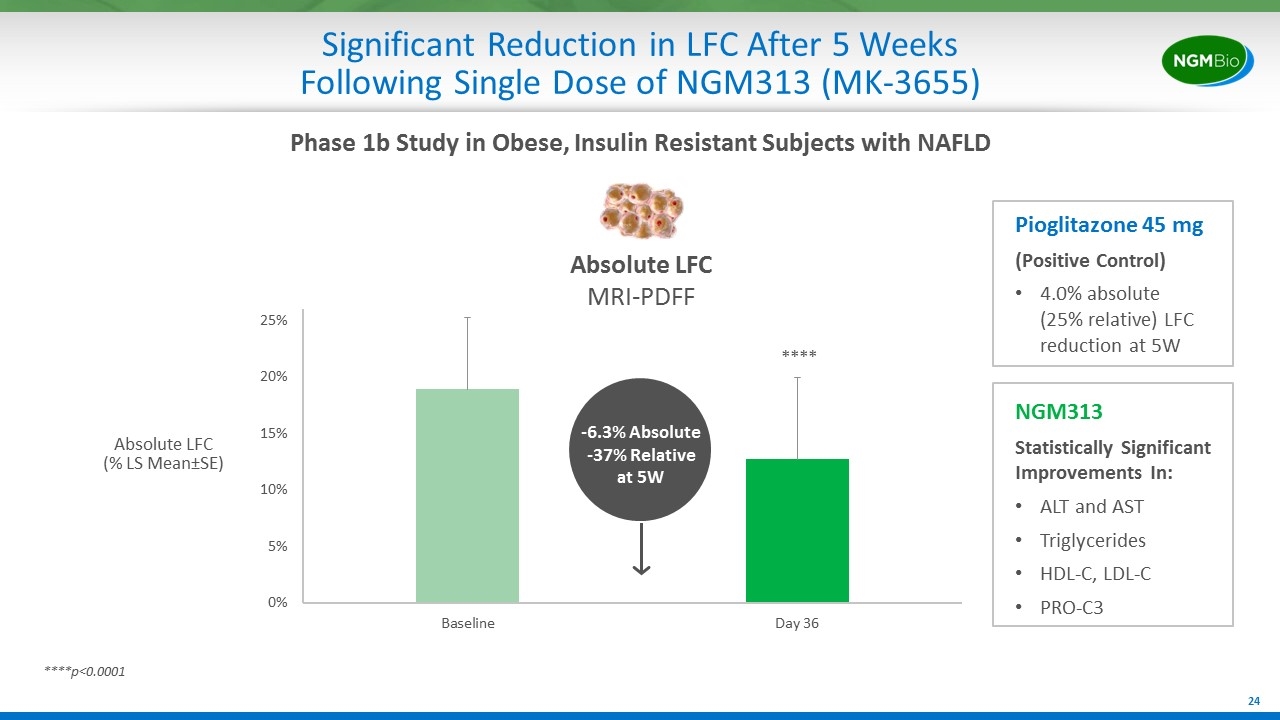
Significant Reduction in LFC After 5 Weeks Following Single Dose of NGM313 (MK-3655) Absolute LFC (% LS Mean±SE) Absolute LFC MRI-PDFF ****p<0.0001 **** NGM313 Statistically Significant Improvements In: ALT and AST Triglycerides HDL-C, LDL-C PRO-C3 Phase 1b Study in Obese, Insulin Resistant Subjects with NAFLD -6.3% Absolute -37% Relative at 5W Pioglitazone 45 mg (Positive Control) 4.0% absolute (25% relative) LFC reduction at 5W
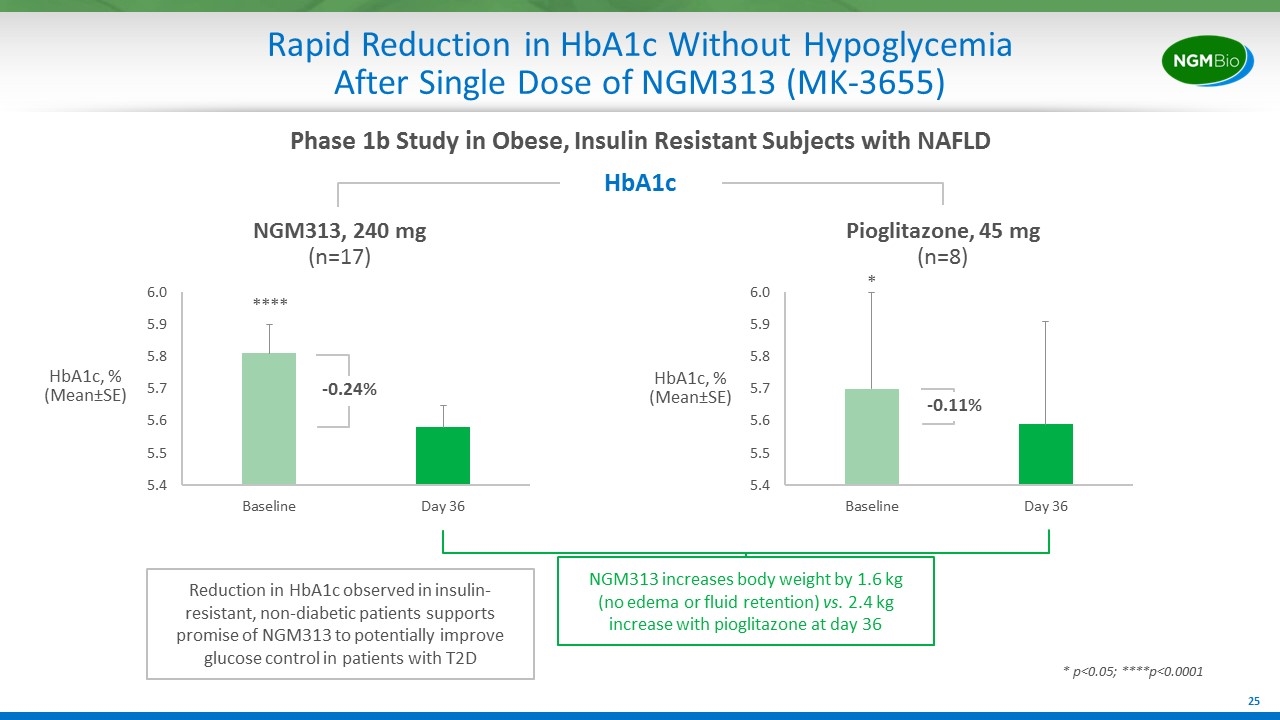
Rapid Reduction in HbA1c Without Hypoglycemia After Single Dose of NGM313 (MK-3655) HbA1c Reduction in HbA1c observed in insulin-resistant, non-diabetic patients supports promise of NGM313 to potentially improve glucose control in patients with T2D NGM313, 240 mg (n=17) HbA1c, % (Mean±SE) Pioglitazone, 45 mg (n=8) -0.24% -0.11% NGM313 increases body weight by 1.6 kg (no edema or fluid retention) vs. 2.4 kg increase with pioglitazone at day 36 HbA1c, % (Mean±SE) Phase 1b Study in Obese, Insulin Resistant Subjects with NAFLD **** * p<0.05; ****p<0.0001 *
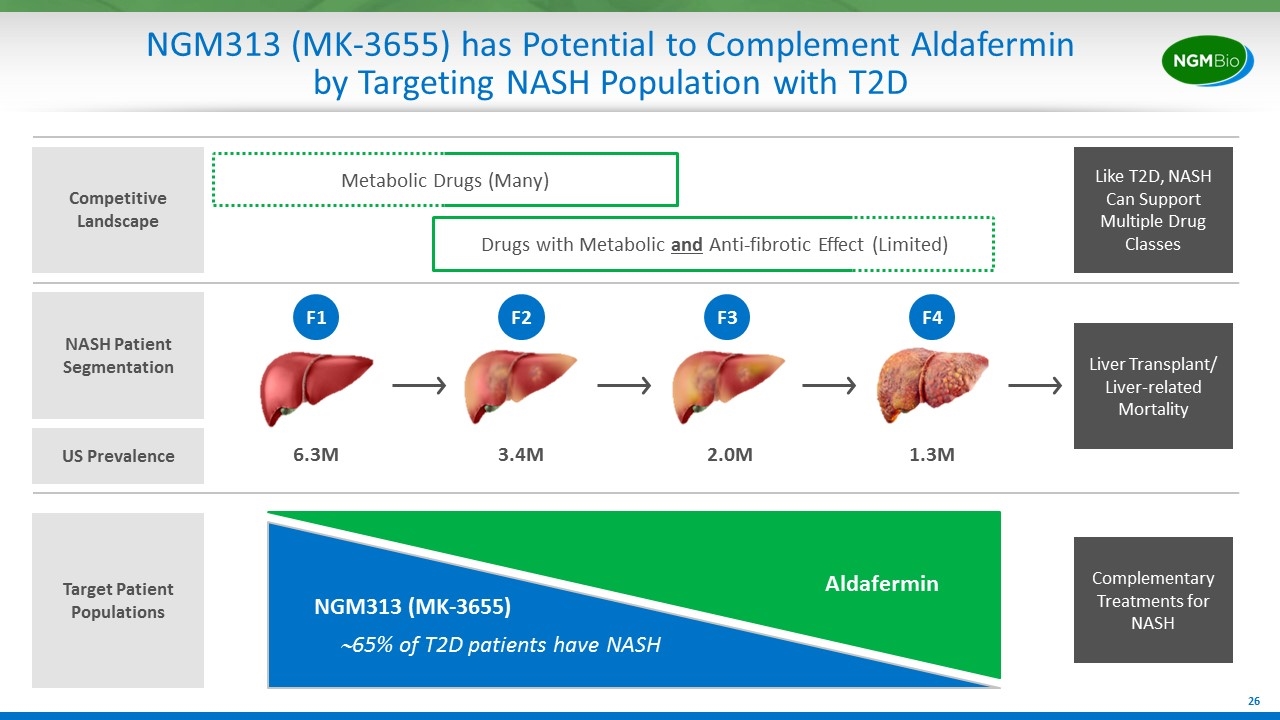
NGM313 (MK-3655) has Potential to Complement Aldafermin by Targeting NASH Population with T2D NASH Patient Segmentation Liver Transplant/ Liver-related Mortality 6.3M 3.4M 2.0M 1.3M F1 F2 F3 F4 Target Patient Populations Metabolic Drugs (Many) Competitive Landscape Drugs with Metabolic and Anti-fibrotic Effect (Limited) Like T2D, NASH Can Support Multiple Drug Classes US Prevalence ~65% of T2D patients have NASH Aldafermin NGM313 (MK-3655) Complementary Treatments for NASH
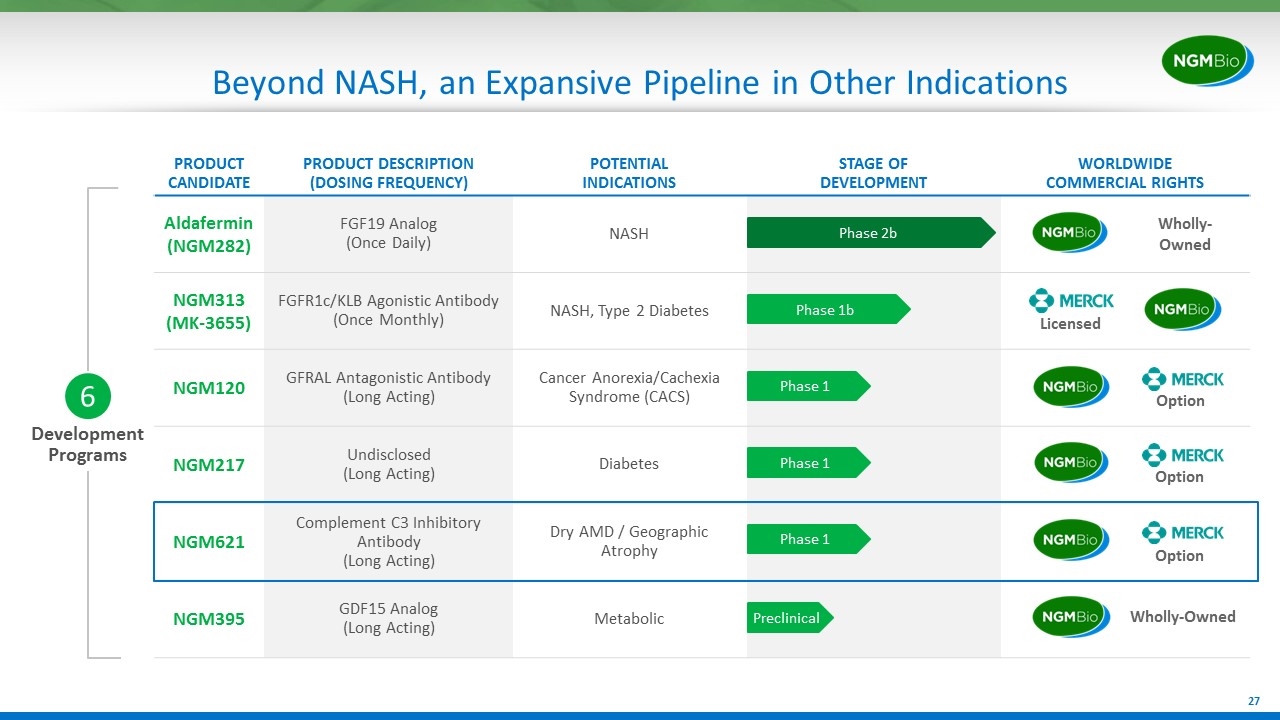
Development Programs 6 Beyond NASH, an Expansive Pipeline in Other Indications PRODUCT CANDIDATE PRODUCT DESCRIPTION (DOSING FREQUENCY) POTENTIAL INDICATIONS STAGE OF DEVELOPMENT WORLDWIDE COMMERCIAL RIGHTS Aldafermin(NGM282) FGF19 Analog (Once Daily) NASH NGM313 (MK-3655) FGFR1c/KLB Agonistic Antibody (Once Monthly) NASH, Type 2 Diabetes NGM120 GFRAL Antagonistic Antibody (Long Acting) Cancer Anorexia/Cachexia Syndrome (CACS) NGM217 Undisclosed (Long Acting) Diabetes NGM621 Complement C3 Inhibitory Antibody (Long Acting) Dry AMD / Geographic Atrophy NGM395 GDF15 Analog (Long Acting) Metabolic Option Option Option Wholly-Owned Phase 2b Phase 1b Preclinical Phase 1 Phase 1 Phase 1 Licensed Wholly-Owned
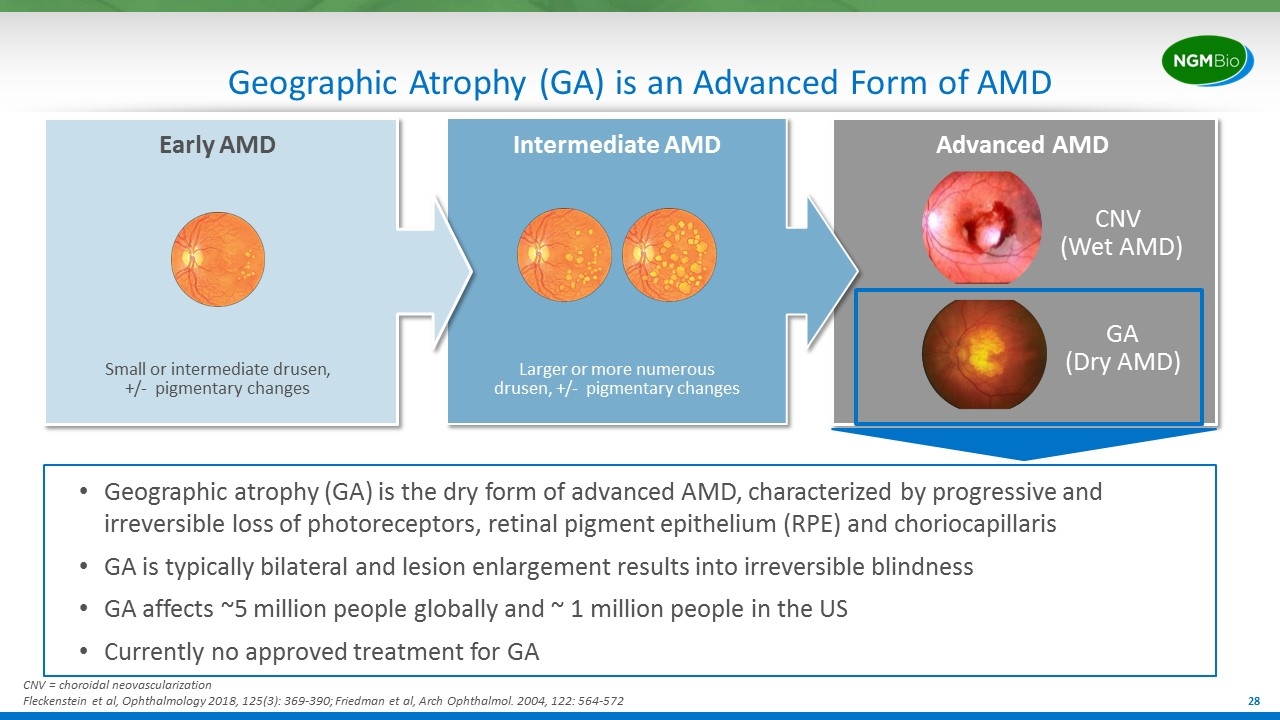
Geographic Atrophy (GA) is an Advanced Form of AMD CNV (Wet AMD) GA (Dry AMD) Advanced AMD Intermediate AMD Larger or more numerous drusen, +/- pigmentary changes Early AMD Small or intermediate drusen, +/- pigmentary changes Geographic atrophy (GA) is the dry form of advanced AMD, characterized by progressive and irreversible loss of photoreceptors, retinal pigment epithelium (RPE) and choriocapillaris GA is typically bilateral and lesion enlargement results into irreversible blindness GA affects ~5 million people globally and ~ 1 million people in the US Currently no approved treatment for GA CNV = choroidal neovascularization Fleckenstein et al, Ophthalmology 2018, 125(3): 369-390; Friedman et al, Arch Ophthalmol. 2004, 122: 564-572
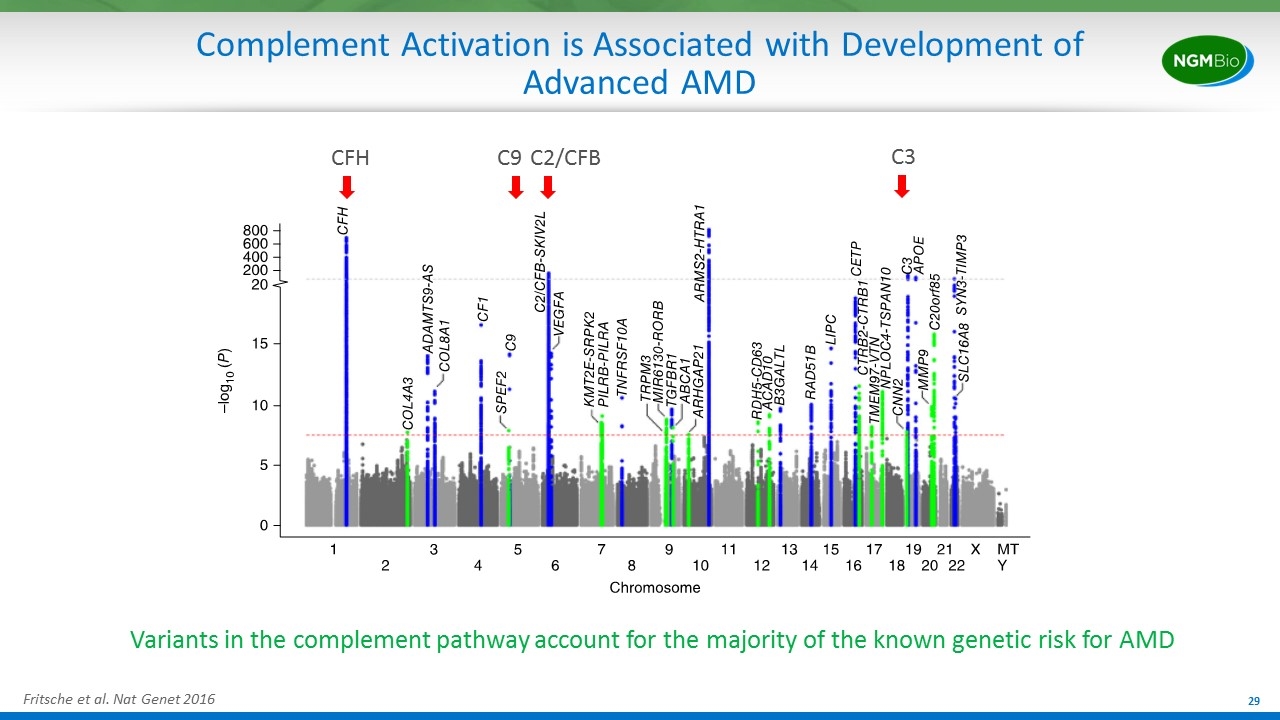
Complement Activation is Associated with Development of Advanced AMD Fritsche et al. Nat Genet 2016 Variants in the complement pathway account for the majority of the known genetic risk for AMD CFH C9 C2/CFB C3
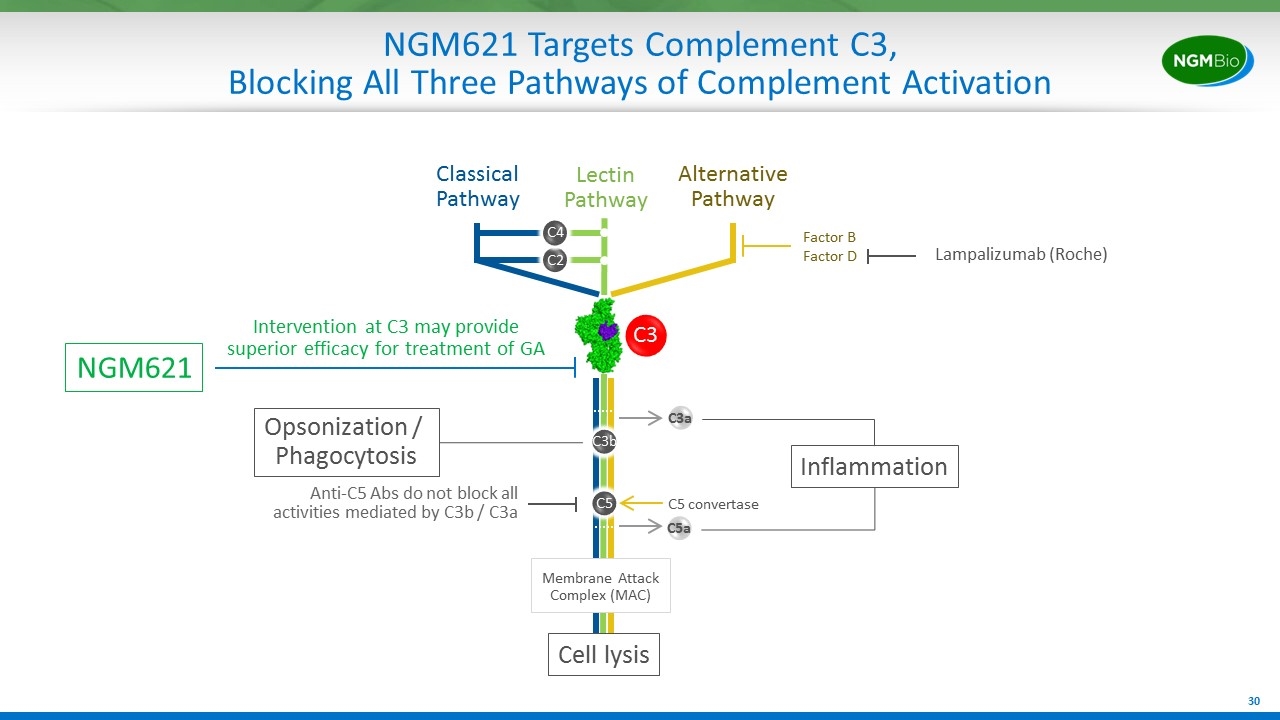
NGM621 Targets Complement C3, Blocking All Three Pathways of Complement Activation C2 C4 Classical Pathway Lectin Pathway Alternative Pathway Factor B Factor D Lampalizumab (Roche) C3b C5 C5 convertase NGM621 C3a C5a Inflammation Opsonization / Phagocytosis Cell lysis Membrane Attack Complex (MAC) Anti-C5 Abs do not block all activities mediated by C3b / C3a Intervention at C3 may provide superior efficacy for treatment of GA C3
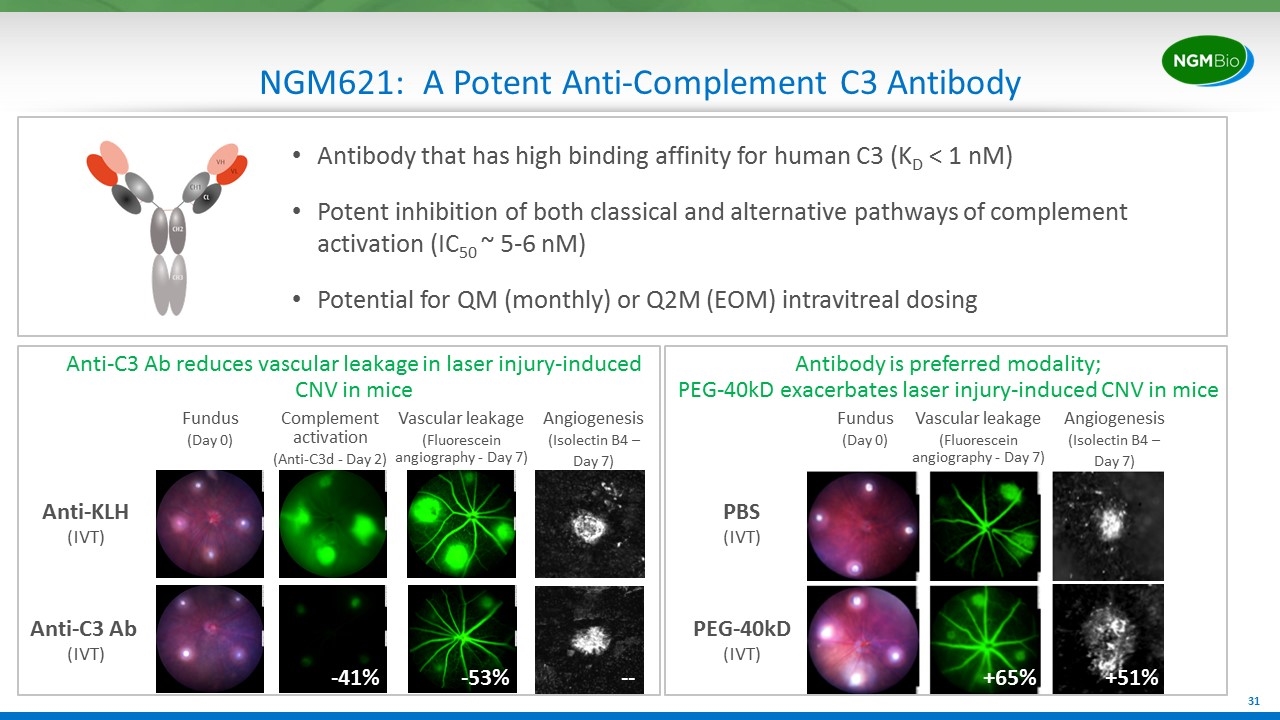
NGM621: A Potent Anti-Complement C3 Antibody Antibody that has high binding affinity for human C3 (KD < 1 nM) Potent inhibition of both classical and alternative pathways of complement activation (IC50 ~ 5-6 nM) Potential for QM (monthly) or Q2M (EOM) intravitreal dosing Anti-C3 Ab reduces vascular leakage in laser injury-induced CNV in mice Fundus (Day 0) Complement activation (Anti-C3d - Day 2) Vascular leakage (Fluorescein angiography - Day 7) Angiogenesis (Isolectin B4 – Day 7) Anti-KLH (IVT) Anti-C3 Ab (IVT) PBS (IVT) PEG-40kD (IVT) Antibody is preferred modality; PEG-40kD exacerbates laser injury-induced CNV in mice Fundus (Day 0) Vascular leakage (Fluorescein angiography - Day 7) Angiogenesis (Isolectin B4 – Day 7) +65% +51% -53% -- -41%
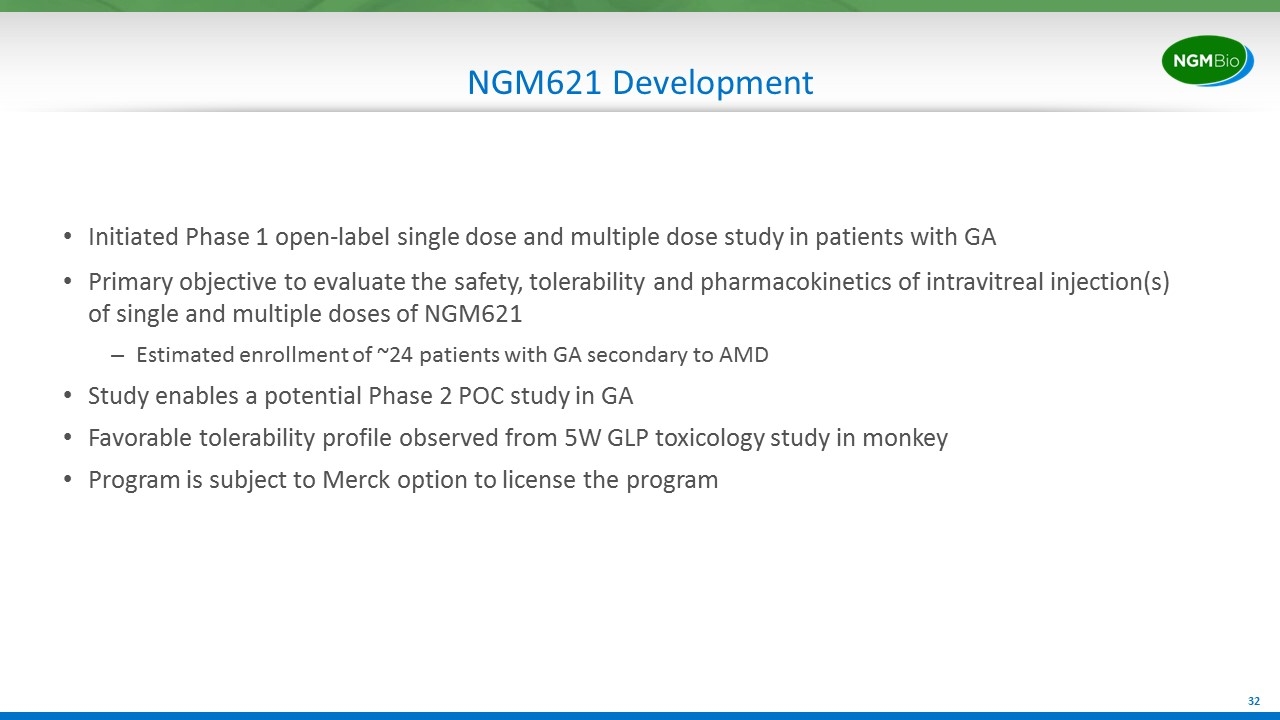
NGM621 Development Initiated Phase 1 open-label single dose and multiple dose study in patients with GA Primary objective to evaluate the safety, tolerability and pharmacokinetics of intravitreal injection(s) of single and multiple doses of NGM621 Estimated enrollment of ~24 patients with GA secondary to AMD Study enables a potential Phase 2 POC study in GA Favorable tolerability profile observed from 5W GLP toxicology study in monkey Program is subject to Merck option to license the program
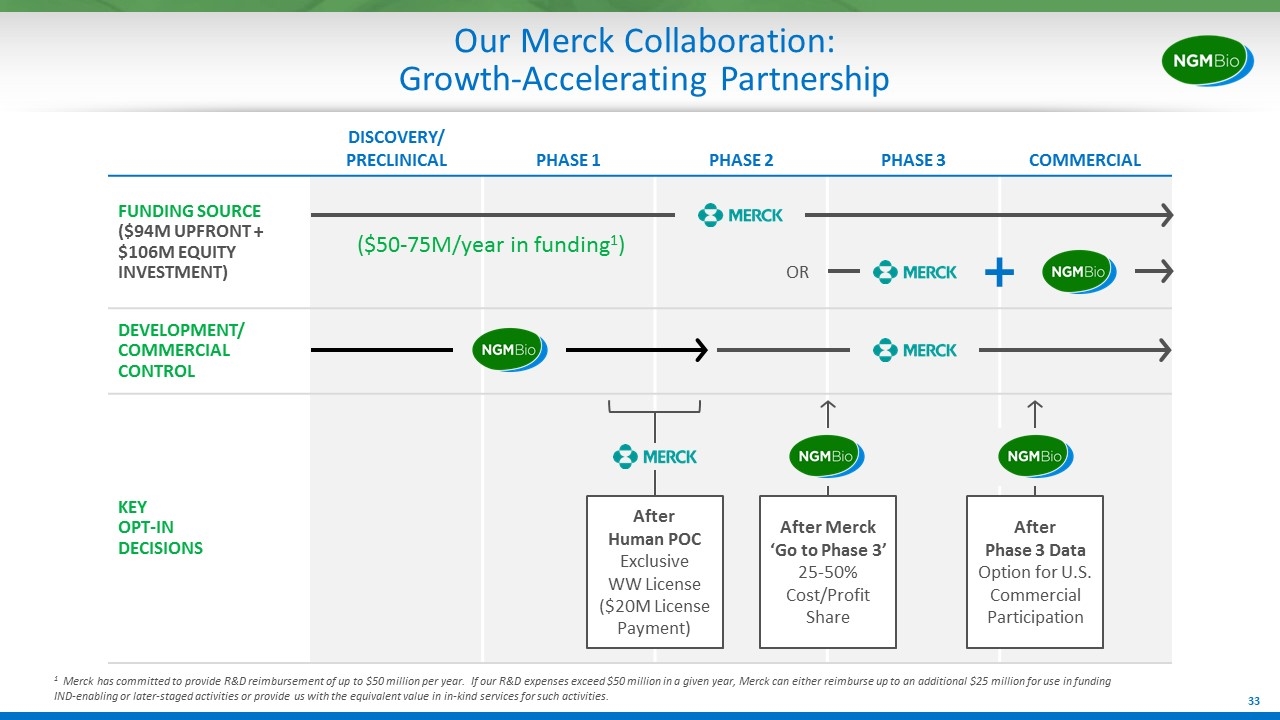
DISCOVERY/ PRECLINICAL PHASE 1 PHASE 2 PHASE 3 COMMERCIAL FUNDING SOURCE ($94M UPFRONT + $106M EQUITY INVESTMENT) DEVELOPMENT/ COMMERCIAL CONTROL KEY OPT-IN DECISIONS Our Merck Collaboration: Growth-Accelerating Partnership After Human POC Exclusive WW License ($20M License Payment) After Merck ‘Go to Phase 3’ 25-50% Cost/Profit Share After Phase 3 Data Option for U.S. Commercial Participation OR ($50-75M/year in funding1) 1 Merck has committed to provide R&D reimbursement of up to $50 million per year. If our R&D expenses exceed $50 million in a given year, Merck can either reimburse up to an additional $25 million for use in funding IND-enabling or later-staged activities or provide us with the equivalent value in in-kind services for such activities.
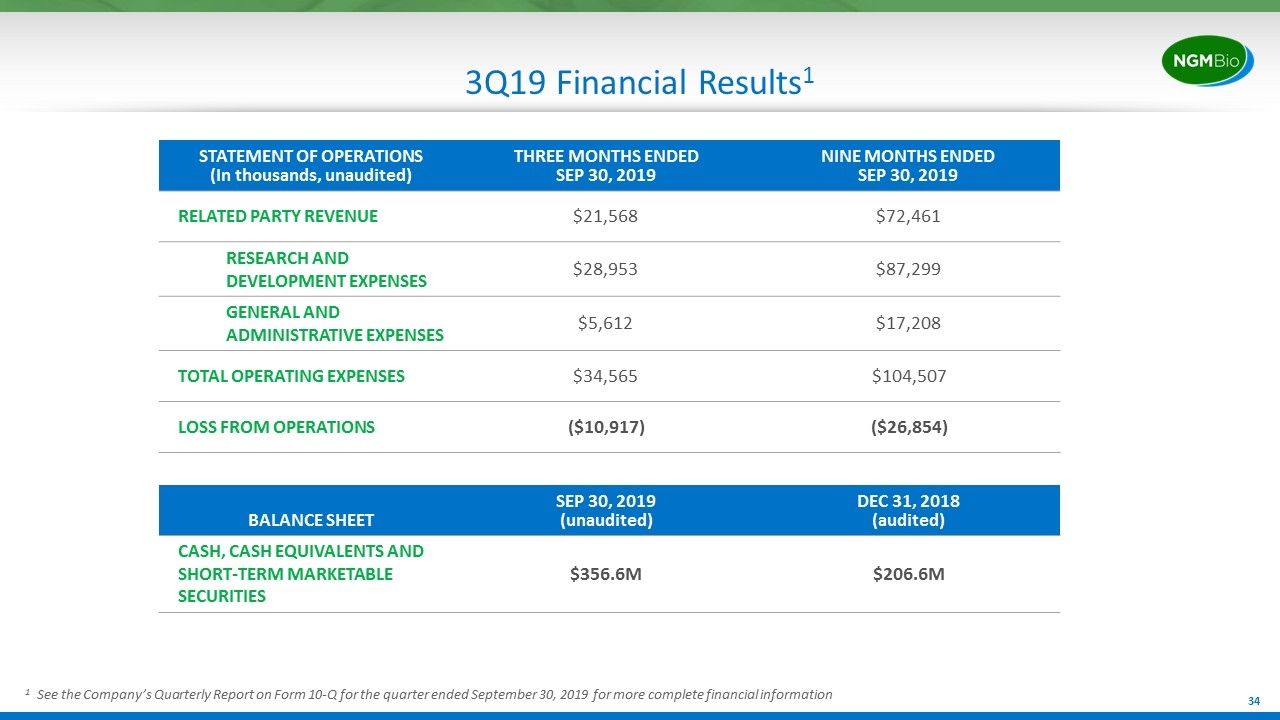
3Q19 Financial Results1 STATEMENT OF OPERATIONS (In thousands, unaudited) THREE MONTHS ENDED SEP 30, 2019 NINE MONTHS ENDED SEP 30, 2019 RELATED PARTY REVENUE $21,568 $72,461 RESEARCH AND DEVELOPMENT EXPENSES $28,953 $87,299 GENERAL AND ADMINISTRATIVE EXPENSES $5,612 $17,208 TOTAL OPERATING EXPENSES $34,565 $104,507 LOSS FROM OPERATIONS ($10,917) ($26,854) BALANCE SHEET SEP 30, 2019 (unaudited) DEC 31, 2018 (audited) CASH, CASH EQUIVALENTS AND SHORT-TERM MARKETABLE SECURITIES $356.6M $206.6M 1 See the Company’s Quarterly Report on Form 10-Q for the quarter ended September 30, 2019 for more complete financial information
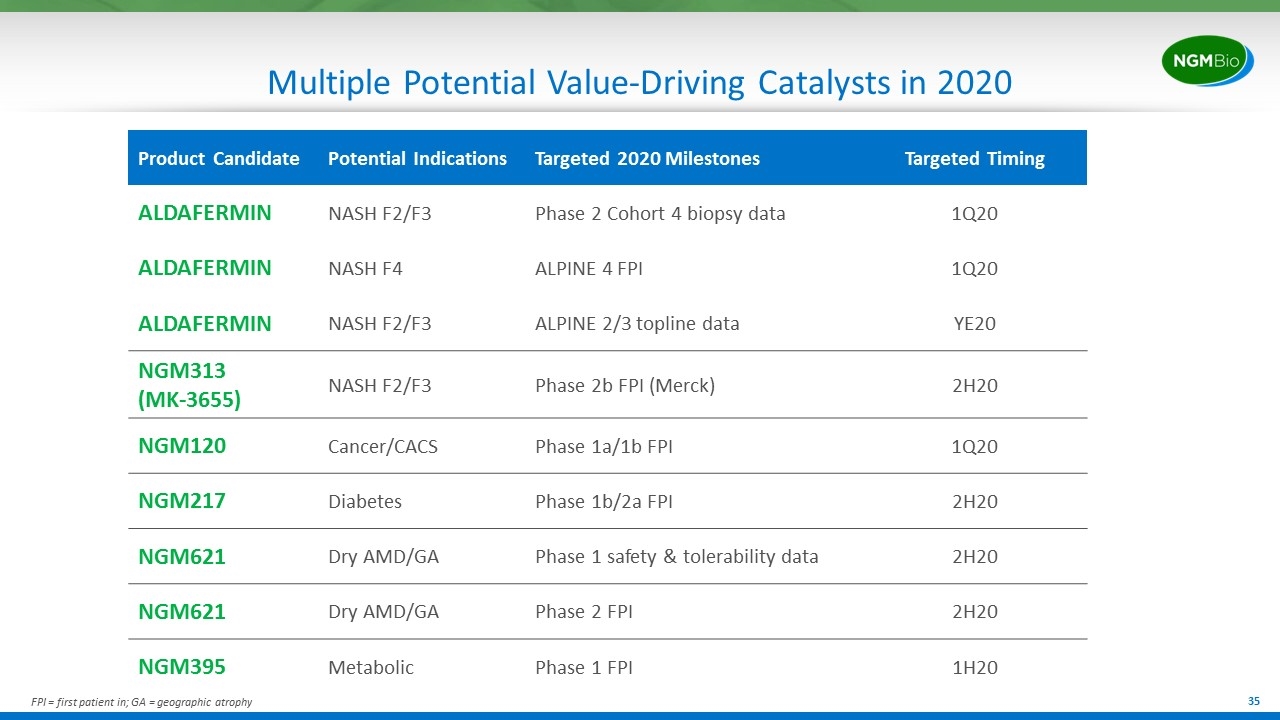
Multiple Potential Value-Driving Catalysts in 2020 Product Candidate Potential Indications Targeted 2020 Milestones Targeted Timing ALDAFERMIN NASH F2/F3 Phase 2 Cohort 4 biopsy data 1Q20 ALDAFERMIN NASH F4 ALPINE 4 FPI 1Q20 ALDAFERMIN NASH F2/F3 ALPINE 2/3 topline data YE20 NGM313 (MK-3655) NASH F2/F3 Phase 2b FPI (Merck) 2H20 NGM120 Cancer/CACS Phase 1a/1b FPI 1Q20 NGM217 Diabetes Phase 1b/2a FPI 2H20 NGM621 Dry AMD/GA Phase 1 safety & tolerability data 2H20 NGM621 Dry AMD/GA Phase 2 FPI 2H20 NGM395 Metabolic Phase 1 FPI 1H20 FPI = first patient in; GA = geographic atrophy

Novel Biology. Powerful Medicines. Transformative Impact. NASDAQ: NGM


