UNITED STATES
SECURITIES AND EXCHANGE COMMISSION
Washington, D.C. 20549
FORM N-CSR
CERTIFIED SHAREHOLDER REPORT OF REGISTERED MANAGEMENT INVESTMENT COMPANIES
Investment Company Act file number 811-22739
IndexIQ Active ETF Trust
(Exact name of registrant as specified in charter)
51 Madison Avenue
New York, NY 10010
(Address of principal executive offices) (Zip code)
Kirk C. Lehneis
IndexIQ Advisors LLC
51 Madison Avenue
New York, NY 10010
(Name and address of agent for service)
Registrant's telephone number, including area code: 1-888-474-7725
Date of fiscal year end:April 30
Date of reporting period:April 30, 2019
Form N-CSR is to be used by management investment companies to file reports with the Commission not later than 10 days after the transmission to stockholders of any report that is required to be transmitted to stockholders under Rule 30e-1 under the Investment Company Act of 1940 (17 CFR 270.30e-1). The Commission may use the information provided on Form N-CSR in its regulatory, disclosure review, inspection, and policymaking roles.
A registrant is required to disclose the information specified by Form N-CSR, and the Commission will make this information public. A registrant is not required to respond to the collection of information contained in Form N-CSR unless the Form displays a currently valid Office of Management and Budget ("OMB") control number. Please direct comments concerning the accuracy of the information collection burden estimate and any suggestions for reducing the burden to Secretary, Securities and Exchange Commission, 450 Fifth Street, NW, Washington, DC 20549-0609. The OMB has reviewed this collection of information under the clearance requirements of 44 U.S.C. § 3507.
Item 1. Reports to Stockholders.
The Report to Shareholders is attached herewith.
(formerly known as IQ MacKay Shields Municipal Insured ETF)
IQ MacKay Municipal Intermediate ETF (MMIT)
(formerly known as IQ MacKay Shields Municipal Intermediate ETF)


• | Receive email notifications when your most recent shareholder communications are available for review. |
• | Access prospectuses, annual reports and semi-annual reports online. |
1. | Visithttps://www.icsdelivery.com/live/ |
2. | Follow the simple enrollment instructions |

Table of Contents
| 5 | ||||||
| 6 | ||||||
| 10 | ||||||
| 11 | ||||||
Schedules of Investments | ||||||
| 12 | ||||||
| 17 | ||||||
| 21 | ||||||
| 22 | ||||||
| 23 | ||||||
| 24 | ||||||
| 26 | ||||||
| 35 | ||||||
| 36 | ||||||
| 37 | ||||||
| 40 |
Kirk C. Lehneis
President
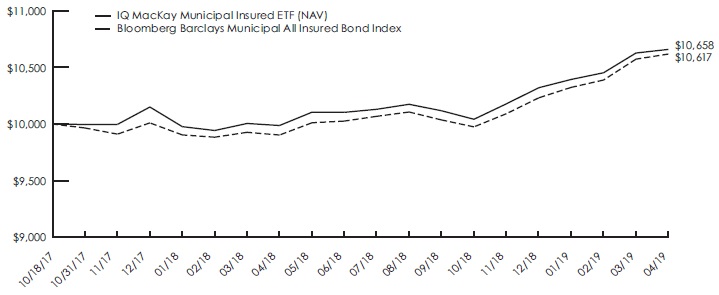
IQ MacKay Municipal Insured ETF
1 | The price used to calculate the market price returns is determined by using the closing price listed on the NYSE Arca and does not represent returns an investor would receive if shares were traded at other times. |
2 | See page 7 for more information on this index. |
3 | The yield curve is a line that plots the yields of various securities of similar quality—typically U.S. Treasury issues—across a range of maturities. The U.S. Treasury yield curve serves as a benchmark for other debt and is used in economic forecasting. |
4 | AGM (Assured Guaranty Municipal Corp.) is a company that provides financial guaranty insurance exclusively for U.S. municipal bonds and international infrastructure financings. |
Management’s Discussion of Fund Performance(unaudited)(continued)
(Since Inception through 4/30/19)
 |
(as of April 30, 2019)
| 1 Year | Since Inception1 | ||||||||||||||
| Average Annual | Average Annual | Cumulative | |||||||||||||
IQ MacKay Municipal Insured ETF Market Price2 | 6.02 | % | 4.31 | % | 6.69 | % | |||||||||
IQ MacKay Municipal Insured ETF NAV | 6.72 | % | 4.24 | % | 6.58 | % | |||||||||
Bloomberg Barclays Municipal All Insured Bond Index | 7.20 | % | 3.98 | % | 6.17 | % | |||||||||
1 | Fund Inception Date: 10/18/2017. |
2 | The price used to calculate the market price returns is the mean between the day’s last bid and ask prices. |
Management’s Discussion of Fund Performance(unaudited)(continued)
1 | The price used to calculate the market price returns is determined by using the closing price listed on the NYSE Arca and does not represent returns an investor would receive if shares were traded at other times. |
2 | See page 9 for more information on this index. |
3 | BAM (Build America Mutual) is a financial guaranty insurance company, acting as an industry utility providing efficient funding and savings for U.S. issuers who provide essential public infrastructure. |
Management’s Discussion of Fund Performance(unaudited)(continued)
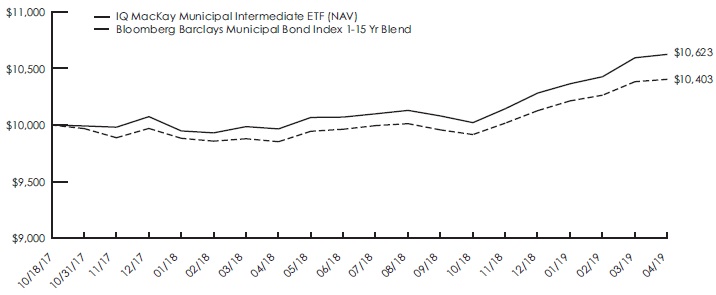
(Since Inception through 4/30/19)
 |
(as of April 30, 2019)
| 1 Year | Since Inception1 | ||||||||||||||
| Average Annual | Average Annual | Cumulative | |||||||||||||
IQ MacKay Municipal Intermediate ETF Market Price2 | 6.62 | % | 4.14 | % | 6.42 | % | |||||||||
IQ MacKay Municipal Intermediate ETF NAV | 6.59 | % | 4.02 | % | 6.23 | % | |||||||||
Bloomberg Barclays Municipal Bond Index 1-15 Yr Blend | 5.58 | % | 2.61 | % | 4.03 | % | |||||||||
1 | Fund Inception Date: 10/18/2017. |
2 | The price used to calculate the market price returns is the mean between the day’s last bid and ask prices. |
| Beginning Account Value 11/01/18 | Ending Account Value 04/30/19 | Expense Ratios for the Period 11/01/18 to 04/30/19 | Expenses Paid for Period 11/01/18 to 04/30/191 | |||||||||||||||
IQ MacKay Municipal Insured ETF | ||||||||||||||||||
Actual | $ | 1,000.00 | $ | 1,060.00 | 0.30 | % | $ | 1.53 | ||||||||||
Hypothetical (assuming a 5% return before expenses) | $ | 1,000.00 | $ | 1,023.31 | 0.30 | % | $ | 1.51 | ||||||||||
IQ MacKay Municipal Intermediate ETF | ||||||||||||||||||
Actual | $ | 1,000.00 | $ | 1,061.30 | 0.30 | % | $ | 1.53 | ||||||||||
Hypothetical (assuming a 5% return before expenses) | $ | 1,000.00 | $ | 1,023.31 | 0.30 | % | $ | 1.51 | ||||||||||
1 | Unless otherwise indicated, expenses are calculated using the Fund’s annualized expense ratio, multiplied by the average account value for the period, multiplied by 181/365. (to reflect the one-half year period). |
Net Assets ($ mil): $43.5
| Industry | % of Net Assets | |||||
General Obligation | 37.7 | % | ||||
School District | 21.5 | |||||
Water | 11.1 | |||||
Education | 6.2 | |||||
Medical | 3.8 | |||||
Higher Education | 3.6 | |||||
Transportation | 3.2 | |||||
Airport | 2.5 | |||||
Power | 1.5 | |||||
Community Facilities Districts | 1.4 | |||||
Development | 1.4 | |||||
Student Loan | 1.3 | |||||
Housing | 1.1 | |||||
Utilities | 0.6 | |||||
Money Market Fund | 1.6 | |||||
Total Investments | 98.5 | |||||
Other Assets and Liabilities, Net | 1.5 | |||||
Net Assets | 100.0 | % | ||||
* | Each Fund’s portfolio is subject to change. |
IQ MacKay Municipal Intermediate ETF
| Industry | % of Net Assets | |||||
General Obligation | 39.5 | % | ||||
School District | 11.2 | |||||
Education | 8.8 | |||||
Water | 6.4 | |||||
Higher Education | 5.3 | |||||
Medical | 4.3 | |||||
Transportation | 3.7 | |||||
Airport | 1.8 | |||||
Development | 1.7 | |||||
Power | 1.7 | |||||
Tobacco Settlement | 1.4 | |||||
Student Loan | 1.3 | |||||
Housing | 1.1 | |||||
Nursing Homes | 1.0 | |||||
Money Market Fund | 12.0 | |||||
Total Investments | 101.2 | |||||
Other Assets and Liabilities, Net | (1.2 | ) | ||||
Net Assets | 100.0 | % | ||||
See notes to financial statements.
| Principal Amount | Value | |||||||||
Municipal Bonds — 96.9% | ||||||||||
Arizona — 0.6% | ||||||||||
City of Mesa AZ, Revenue Bonds Insured: AGM | ||||||||||
5.000%, due 7/1/19 | $ | 250,000 | $ | 251,320 | ||||||
Arkansas — 1.5% | ||||||||||
University of Central Arkansas, Revenue Bonds Series A Insured: AGM | ||||||||||
5.000%, due 11/1/32 | 200,000 | 231,010 | ||||||||
5.000%, due 11/1/35 | 350,000 | 400,236 | ||||||||
| 631,246 | ||||||||||
California — 21.2% | ||||||||||
Alisal Union School District, General Obligation Bonds Series B Insured: AGC | ||||||||||
2.000%, due 8/1/24(a) | 600,000 | 540,276 | ||||||||
Calexico Unified School District, General Obligation Bonds Series B Insured: NATL | ||||||||||
2.800%, due 8/1/28(a) | 540,000 | 417,528 | ||||||||
California Municipal Finance Authority, Revenue Bonds Insured: BAM | ||||||||||
5.000%, due 5/15/43 | 250,000 | 291,030 | ||||||||
City of Lincoln CA, Special Tax Insured: AGM | ||||||||||
5.000%, due 9/1/34 | 525,000 | 626,635 | ||||||||
City of Oxnard CA Water System Revenue, Revenue Bonds Insured: BAM | ||||||||||
5.000%, due 6/1/35 | 600,000 | 719,322 | ||||||||
City of Tulare CA Water Revenue, Revenue Bonds Insured: BAM | ||||||||||
5.000%, due 12/1/30 | 165,000 | 199,833 | ||||||||
Clovis Unified School District, General Obligation Bonds Series A Insured: NATL | ||||||||||
2.290%, due 8/1/27(a) | 335,000 | 277,651 | ||||||||
El Camino Healthcare District, General Obligation Bonds Insured: NATL | ||||||||||
2.620%, due 8/1/29(a) | 700,000 | 535,731 | ||||||||
Hayward Unified School District, General Obligation Bonds Series A Insured: BAM | ||||||||||
5.000%, due 8/1/34 | 570,000 | 694,266 | ||||||||
Kelseyville Unified School District, General Obligation Bonds Series C Insured: AGM | ||||||||||
3.080%, due 8/1/31(a) | 155,000 | 104,408 | ||||||||
3.280%, due 8/1/33(a) | 215,000 | 130,776 | ||||||||
Menifee Union School District, General Obligation Bonds Series B Insured: BAM | ||||||||||
5.000%, due 8/1/30 | 250,000 | 306,145 | ||||||||
Murrieta Valley Unified School District, General Obligation Bonds Series A Insured: NATL | ||||||||||
1.940%, due 9/1/22(a) | 170,000 | 159,385 | ||||||||
| Principal Amount | Value | |||||||||
Municipal Bonds (continued) | ||||||||||
California (continued) | ||||||||||
Ontario Montclair School District, General Obligation Bonds Series B Insured: NATL | ||||||||||
2.550%, due 8/1/29(a) | $ | 390,000 | $ | 300,600 | ||||||
Palmdale Community Redevelopment Agency Successor Agency, Tax Allocation Series A Insured: NATL | ||||||||||
5.000%, due 9/1/34 | 570,000 | 673,062 | ||||||||
Paramount Unified School District, General Obligation Bonds Series B Insured: BAM | ||||||||||
3.310%, due 8/1/33(a) | 640,000 | 399,392 | ||||||||
Sacramento City Unified School District, General Obligation Bonds Insured: AGM | ||||||||||
2.360%, due 7/1/24(a) | 500,000 | 442,815 | ||||||||
Sacramento City Unified School District, General Obligation Bonds Series C-1 Insured: AGM | ||||||||||
5.000%, due 8/1/25 | 200,000 | 233,952 | ||||||||
Salinas Union High School District, General Obligation Bonds Series A Insured: NATL | ||||||||||
1.870%, due 10/1/23(a) | 225,000 | 207,216 | ||||||||
San Leandro Unified School District, General Obligation Bonds Series B Insured: BAM | ||||||||||
5.000%, due 8/1/34 | 525,000 | 635,570 | ||||||||
Santa Fe Springs Community Development Commission Successor Agency, Tax Allocation Series A Insured: NATL | ||||||||||
1.910%, due 9/1/20(a) | 275,000 | 268,103 | ||||||||
Vallejo City Unified School District, General Obligation Bonds Series A Insured: NATL | ||||||||||
5.900%, due 2/1/20 | 365,000 | 375,687 | ||||||||
West Sacramento Financing Authority, Revenue Bonds Insured: BAM | ||||||||||
4.000%, due 10/1/40 | 620,000 | 668,856 | ||||||||
| 9,208,239 | ||||||||||
Colorado — 7.0% | ||||||||||
BNC Metropolitan District No 1, General Obligation Bonds Series A Insured: BAM | ||||||||||
5.000%, due 12/1/37 | 545,000 | 624,003 | ||||||||
Grand Junction Regional Airport Authority, Revenue Bonds Series A Insured: NATL | ||||||||||
5.000%, due 12/1/26 | 500,000 | 596,875 | ||||||||
Grand River Hospital District, General Obligation Bonds Insured: AGM | ||||||||||
5.250%, due 12/1/37 | 500,000 | 588,705 | ||||||||
See notes to financial statements.
Schedules of Investments — IQ MacKay Municipal Insured ETF(continued)
April 30, 2019
| Principal Amount | Value | |||||||||
Municipal Bonds (continued) | ||||||||||
Colorado (continued) | ||||||||||
Rampart Range Metropolitan District No 1, Revenue Bonds Insured: AGM | ||||||||||
5.000%, due 12/1/42 | $ | 520,000 | $ | 600,564 | ||||||
Rio Blanco County School District No Re-1 Meeker, General Obligation Bonds Insured: BAM | ||||||||||
5.500%, due 12/1/35 | 500,000 | 628,240 | ||||||||
| 3,038,387 | ||||||||||
Connecticut — 5.4% | ||||||||||
City of Hartford CT, General Obligation Bonds Series A Insured: AGM | ||||||||||
4.000%, due 7/1/34 | 25,000 | 26,617 | ||||||||
5.000%, due 7/1/24 | 20,000 | 22,891 | ||||||||
5.000%, due 7/1/27 | 60,000 | 69,688 | ||||||||
5.000%, due 7/1/28 | 560,000 | 646,621 | ||||||||
City of Hartford CT, General Obligation Bonds Series B Insured: AGM | ||||||||||
5.000%, due 10/1/23 | 15,000 | 16,916 | ||||||||
City of Hartford CT, General Obligation Bonds Series C Insured: AGM | ||||||||||
5.000%, due 7/15/32 | 20,000 | 22,791 | ||||||||
City of New Britain CT, General Obligation Bonds Series B Insured: AGM | ||||||||||
5.250%, due 9/1/29 | 500,000 | 613,560 | ||||||||
5.250%, due 9/1/30 | 300,000 | 365,319 | ||||||||
Town of Hamden CT, General Obligation Bonds Series A Insured: BAM | ||||||||||
5.000%, due 8/15/30 | 500,000 | 587,945 | ||||||||
| 2,372,348 | ||||||||||
Georgia — 0.6% | ||||||||||
Main Street Natural Gas, Inc., Revenue Bonds Series A | ||||||||||
5.000%, due 5/15/21 | 250,000 | 263,227 | ||||||||
Illinois — 11.6% | ||||||||||
Adams County School District No 172, General Obligation Bonds Insured: BAM | ||||||||||
4.000%, due 2/1/20 | 105,000 | 106,469 | ||||||||
4.000%, due 2/1/21 | 235,000 | 242,123 | ||||||||
Chicago Board of Education, General Obligation Bonds Series A Insured: AGM | ||||||||||
5.000%, due 12/1/31 | 500,000 | 581,245 | ||||||||
City of Chicago IL Waterworks Revenue, Revenue Bonds Insured: AGM | ||||||||||
5.250%, due 11/1/34 | 225,000 | 262,519 | ||||||||
Cook County Community Unit School District No 401 Elmwood Park, General Obligation Bonds Series A Insured: AGM | ||||||||||
5.000%, due 12/1/20 | 250,000 | 262,327 | ||||||||
| Principal Amount | Value | |||||||||
Municipal Bonds (continued) | ||||||||||
Illinois (continued) | ||||||||||
Governors State University, Certificates of Participation Insured: BAM | ||||||||||
5.000%, due 7/1/23 | $ | 385,000 | $ | 421,756 | ||||||
Madison County Community Unit School District No 7 Edwardsville, General Obligation Bonds Insured: BAM | ||||||||||
5.000%, due 12/1/30 | 275,000 | 310,643 | ||||||||
Madison-Macoupin Etc Counties Community College District No 536, General Obligation Bonds Series A Insured: AGM | ||||||||||
5.000%, due 11/1/32 | 160,000 | 182,899 | ||||||||
Public Building Commission of Chicago, Revenue Bonds Insured: AMBAC | ||||||||||
5.250%, due 3/1/32 | 500,000 | 587,800 | ||||||||
State of Illinois, Revenue Bonds Insured: NATL | ||||||||||
5.750%, due 6/15/19 | 250,000 | 251,082 | ||||||||
State of Illinois, Revenue Bonds Series C | ||||||||||
4.000%, due 6/15/21 | 225,000 | 232,436 | ||||||||
Town of Cicero IL, General Obligation Bonds Insured: BAM | ||||||||||
5.000%, due 1/1/30 | 475,000 | 552,663 | ||||||||
Village of Rosemont IL, General Obligation Bonds Series A Insured: AGM | ||||||||||
5.000%, due 12/1/27 | 325,000 | 379,376 | ||||||||
Will County School District No 114 Manhattan, General Obligation Bonds Insured: MAC | ||||||||||
3.500%, due 1/1/27 | 360,000 | 375,826 | ||||||||
Woodford Lasalle Livingston Etc Counties Community Unit Sch Dist No 6 Fieldcrest, General Obligation Bonds Insured: MAC | ||||||||||
4.000%, due 12/1/21 | 280,000 | 291,581 | ||||||||
| 5,040,745 | ||||||||||
Iowa — 0.1% | ||||||||||
Clarke Community School District, General Obligation Bonds Insured: AGM | ||||||||||
4.000%, due 6/1/19 | 60,000 | 60,112 | ||||||||
Kentucky — 3.3% | ||||||||||
County of Knox KY, General Obligation Bonds Insured: BAM | ||||||||||
5.000%, due 10/1/35 | 500,000 | 578,740 | ||||||||
Kentucky Asset Liability Commission, Revenue Bonds Series B Insured: NATL | ||||||||||
2.278%, due 11/1/25(b) | 130,000 | 126,266 | ||||||||
Kentucky Economic Development Finance Authority, Revenue Bonds Series A Insured: AGM | ||||||||||
4.000%, due 6/1/37 | 500,000 | 522,930 | ||||||||
See notes to financial statements.
Schedules of Investments — IQ MacKay Municipal Insured ETF(continued)
April 30, 2019
| Principal Amount | Value | |||||||||
Municipal Bonds (continued) | ||||||||||
Kentucky (continued) | ||||||||||
Louisville & Jefferson County Visitors and Convention Commission, Revenue Bonds Insured: BAM | ||||||||||
4.000%, due 6/1/36 | $ | 200,000 | $ | 210,858 | ||||||
| 1,438,794 | ||||||||||
Louisiana — 4.6% | ||||||||||
City of Shreveport LA Water & Sewer Revenue, Revenue Bonds Series C Insured: BAM | ||||||||||
5.000%, due 12/1/31 | 600,000 | 717,894 | ||||||||
5.000%, due 12/1/32 | 150,000 | 178,829 | ||||||||
Louisiana Local Government Environmental Facilities & Community Development Authority, Revenue Bonds Insured: BAM | ||||||||||
5.000%, due 10/1/29 | 450,000 | 546,678 | ||||||||
Port New Orleans Board of Commissioners, Revenue Bonds Series B Insured: AGM | ||||||||||
5.000%, due 4/1/36 | 165,000 | 192,596 | ||||||||
St Landry Parish Road District No 1, Revenue Bonds Insured: BAM | ||||||||||
4.000%, due 3/1/20 | 350,000 | 356,342 | ||||||||
| 1,992,339 | ||||||||||
Maine — 1.3% | ||||||||||
Finance Authority of Maine, Revenue Bonds Series A-1 Insured: AGC | ||||||||||
5.000%, due 12/1/25 | 155,000 | 177,986 | ||||||||
5.000%, due 12/1/26 | 155,000 | 180,098 | ||||||||
5.000%, due 12/1/27 | 170,000 | 199,373 | ||||||||
| 557,457 | ||||||||||
Massachusetts — 0.6% | ||||||||||
Commonwealth of Massachusetts, General Obligation Bonds Series A Insured: NATL | ||||||||||
2.298%, due 5/1/37(b) | 250,000 | 244,265 | ||||||||
Michigan — 4.4% | ||||||||||
City of Detroit MI Sewage Disposal System Revenue, Revenue Bonds Series B Insured: NATL | ||||||||||
5.500%, due 7/1/22 | 1,000,000 | 1,107,620 | ||||||||
Dearborn School District, General Obligation Bonds Insured: BAM | ||||||||||
5.000%, due 5/1/31 | 655,000 | 802,906 | ||||||||
| 1,910,526 | ||||||||||
Mississippi — 2.5% | ||||||||||
Biloxi Public School District, Revenue Bonds Insured: BAM | ||||||||||
5.000%, due 4/1/28 | 220,000 | 256,916 | ||||||||
Mississippi Development Bank, Revenue Bonds Insured: BAM | ||||||||||
5.000%, due 10/1/30 | 250,000 | 298,132 | ||||||||
5.250%, due 10/1/38 | 460,000 | 544,530 | ||||||||
| 1,099,578 | ||||||||||
| Principal Amount | Value | |||||||||
Municipal Bonds (continued) | ||||||||||
Nevada — 1.5% | ||||||||||
City of Reno NV, Revenue Bonds Series A-1 Insured: AGM | ||||||||||
5.000%, due 6/1/32 | $ | 265,000 | $ | 307,365 | ||||||
Clark County Water Reclamation District, General Obligation Bonds Series A Insured: BHAC-CR | ||||||||||
5.250%, due 7/1/29 | 335,000 | 337,027 | ||||||||
| 644,392 | ||||||||||
New Jersey — 6.4% | ||||||||||
City of Atlantic City NJ, General Obligation Bonds Series B Insured: AGM | ||||||||||
4.000%, due 3/1/42 | 240,000 | 252,607 | ||||||||
City of Trenton NJ, General Obligation Bonds Insured: AGM | ||||||||||
3.000%, due 8/1/19 | 240,000 | 240,742 | ||||||||
5.000%, due 8/1/27 | 300,000 | 356,559 | ||||||||
Long Branch Board of Education, General Obligation Bonds Insured: AGM | ||||||||||
5.000%, due 7/15/29 | 265,000 | 322,484 | ||||||||
New Jersey Economic Development Authority, Revenue Bonds Series K Insured: AMBAC | ||||||||||
5.500%, due 12/15/19 | 600,000 | 613,410 | ||||||||
New Jersey Educational Facilities Authority, Revenue Bonds Series C Insured: AGM | ||||||||||
5.000%, due 7/1/25 | 255,000 | 299,566 | ||||||||
New Jersey Health Care Facilities Financing Authority, Revenue Bonds Series A Insured: AGM | ||||||||||
5.000%, due 7/1/46 | 505,000 | 558,899 | ||||||||
New Jersey Transportation Trust Fund Authority, Revenue Bonds Series B Insured: NATL | ||||||||||
5.500%, due 12/15/19 | 150,000 | 153,352 | ||||||||
| 2,797,619 | ||||||||||
New York — 2.7% | ||||||||||
City of Long Beach NY, General Obligation Bonds Insured: BAM | ||||||||||
5.000%, due 1/15/21 | 575,000 | 605,705 | ||||||||
County of Suffolk NY, General Obligation Bonds Series C Insured: BAM | ||||||||||
5.000%, due 2/1/23 | 350,000 | 389,735 | ||||||||
Niagara Falls Public Water Authority, Revenue Bonds Series A Insured: BAM | ||||||||||
5.000%, due 7/15/19 | 200,000 | 201,460 | ||||||||
| 1,196,900 | ||||||||||
North Carolina — 1.5% | ||||||||||
North Carolina Turnpike Authority, Revenue Bonds Insured: AGM | ||||||||||
5.000%, due 1/1/32 | 525,000 | 632,200 | ||||||||
See notes to financial statements.
Schedules of Investments — IQ MacKay Municipal Insured ETF(continued)
April 30, 2019
| Principal Amount | Value | |||||||||
Municipal Bonds (continued) | ||||||||||
Ohio — 3.3% | ||||||||||
City of Cleveland OH Airport System Revenue, Revenue Bonds Series A Insured: AMBAC | ||||||||||
5.250%, due 1/1/20 | $ | 500,000 | $ | 511,355 | ||||||
City of Toledo OH, General Obligation Bonds Insured: AGM | ||||||||||
5.000%, due 12/1/19 | 370,000 | 376,934 | ||||||||
County of Cuyahoga OH, Revenue Bonds | ||||||||||
5.000%, due 2/15/28 | 500,000 | 569,740 | ||||||||
| 1,458,029 | ||||||||||
Oregon — 1.1% | ||||||||||
City of Seaside OR Transient Lodging Tax Revenue, Revenue Bonds Insured: AGM | ||||||||||
5.000%, due 12/15/37 | 400,000 | 472,248 | ||||||||
Pennsylvania — 4.6% | ||||||||||
Coatesville Area School District Building Authority, Revenue Bonds Insured: BAM | ||||||||||
5.000%, due 12/1/22 | 400,000 | 438,532 | ||||||||
Erie Sewer Authority, Revenue Bonds Series B Insured: AGM | ||||||||||
5.000%, due 12/1/35 | 520,000 | 620,547 | ||||||||
Luzerne County Industrial Development Authority, Revenue Bonds Insured: AGM | ||||||||||
5.000%, due 12/15/26 | 525,000 | 599,356 | ||||||||
Pennsylvania Higher Educational Facilities Authority, Revenue Bonds Series A Insured: XLCA | ||||||||||
2.336%, due 7/1/27(b) | 230,000 | 223,636 | ||||||||
School District of Philadelphia (The), General Obligation Bonds Insured: BHAC-CR FGIC | ||||||||||
5.000%, due 6/1/34 | 100,000 | 124,132 | ||||||||
| 2,006,203 | ||||||||||
Puerto Rico — 3.9% | ||||||||||
Commonwealth of Puerto Rico, General Obligation Bonds Insured: NATL | ||||||||||
3.610%, due 7/1/19(a) | 215,000 | 213,680 | ||||||||
Commonwealth of Puerto Rico, General Obligation Bonds Insured: AGM | ||||||||||
5.250%, due 7/1/20 | 500,000 | 511,885 | ||||||||
Commonwealth of Puerto Rico, General Obligation Bonds Series A Insured: NATL | ||||||||||
5.500%, due 7/1/19 | 340,000 | 341,237 | ||||||||
Commonwealth of Puerto Rico, General Obligation Bonds Series A Insured: AGM | ||||||||||
5.000%, due 7/1/35 | 480,000 | 495,403 | ||||||||
| Principal Amount | Value | |||||||||
Municipal Bonds (continued) | ||||||||||
Puerto Rico (continued) | ||||||||||
Commonwealth of Puerto Rico, General Obligation Bonds Series A-4 Insured: AGM | ||||||||||
5.250%, due 7/1/30 | $ | 100,000 | $ | 102,231 | ||||||
Puerto Rico Electric Power Authority, Revenue Bonds Series PP Insured: NATL | ||||||||||
5.000%, due 7/1/24 | 25,000 | 25,287 | ||||||||
| 1,689,723 | ||||||||||
South Carolina — 1.4% | ||||||||||
South Carolina Public Service Authority, Revenue Bonds Series B | ||||||||||
5.000%, due 12/1/41 | 550,000 | 624,091 | ||||||||
Texas — 2.9% | ||||||||||
City of Houston TX Hotel Occupancy Tax & Special Revenue, Revenue Bonds Series B Insured: AMBAC | ||||||||||
1.790%, due 9/1/19(a) | 685,000 | 680,883 | ||||||||
Crosby Municipal Utility District, General Obligation Bonds Insured: AGM | ||||||||||
2.750%, due 8/15/19 | 275,000 | 275,806 | ||||||||
Gulf Coast Water Authority, Revenue Bonds Series A Insured: AGM | ||||||||||
5.000%, due 8/15/19 | 150,000 | 151,405 | ||||||||
New Hope Cultural Education Facilities Finance Corp., Revenue Bonds Series B-1 Insured: AGM | ||||||||||
4.000%, due 7/1/30 | 155,000 | 167,645 | ||||||||
| 1,275,739 | ||||||||||
Utah — 1.5% | ||||||||||
Grand County School District Local Building Authority, Revenue Bonds Insured: AGM | ||||||||||
5.000%, due 12/15/28 | 465,000 | 543,157 | ||||||||
West Valley City Municipal Building Authority, Revenue Bonds Insured: AGM | ||||||||||
5.000%, due 2/1/29 | 100,000 | 123,229 | ||||||||
| 666,386 | ||||||||||
Wisconsin — 1.4% | ||||||||||
City of Racine WI Waterworks System Revenue, Revenue Bonds Insured: AGM | ||||||||||
5.000%, due 9/1/30 | 500,000 | 596,540 | ||||||||
Total Municipal Bonds (Cost $41,352,546) | 42,168,653 | |||||||||
See notes to financial statements.
Schedules of Investments — IQ MacKay Municipal Insured ETF(continued)
April 30, 2019
| Shares | Value | |||||||||
Short-Term Investment — 1.6% | ||||||||||
Money Market Fund — 1.6% | ||||||||||
Fidelity Investments Money Market Treasury Only Class I, 2.27%(c) (Cost $691,436) | 691,436 | $ | 691,436 | |||||||
Total Investments — 98.5% (Cost $42,043,982) | 42,860,089 | |||||||||
Other Assets and Liabilities, Net — 1.5% | 678,539 | |||||||||
Net Assets — 100.0% | $ | 43,538,628 | ||||||||
(a) | The security was issued on a discount basis with no stated coupon rate. Rate shown reflects the effective yield. |
(b) | Variable rate securities that may be tendered back to the issuer at any time prior to maturity at par. Rate shown is the rate in effect as of April 30, 2019. |
(c) | Reflects the 7-day yield at April 30, 2019. |
| Description | Level 1 | Level 2 | Level 3 | Total | ||||||||||||||
Investments in Securities:(d) | ||||||||||||||||||
Municipal Bonds | $ | — | $ | 42,168,653 | $ | — | $ | 42,168,653 | ||||||||||
Short-Term Investment: | ||||||||||||||||||
Money Market Fund | 691,436 | — | — | 691,436 | ||||||||||||||
Total Investments in Securities | $ | 691,436 | $ | 42,168,653 | $ | — | $ | 42,860,089 | ||||||||||
(d) | For a complete listing of investments and their states, see the Schedules of Investments. |
See notes to financial statements.
| Principal Amount | Value | |||||||||
Municipal Bonds — 89.2% | ||||||||||
Alabama — 1.7% | ||||||||||
City of Gadsden AL, General Obligation Bonds Series B Insured: BAM | ||||||||||
5.000%, due 8/1/28 | $ | 600,000 | $ | 721,998 | ||||||
Alaska — 1.2% | ||||||||||
Alaska Industrial Development & Export Authority, Revenue Bonds | ||||||||||
3.500%, due 12/1/20 | 500,000 | 503,030 | ||||||||
Arizona — 2.1% | ||||||||||
City of Phoenix Civic Improvement Corp., Revenue Bonds Series A | ||||||||||
5.000%, due 7/1/34 | 500,000 | 584,605 | ||||||||
Maricopa County Industrial Development Authority, Revenue Bonds Series C | ||||||||||
5.000%, due 7/1/37 | 300,000 | 345,486 | ||||||||
| 930,091 | ||||||||||
Arkansas — 1.1% | ||||||||||
University of Central Arkansas, Revenue Bonds Insured: AGM | ||||||||||
5.000%, due 11/1/34 | 400,000 | 459,096 | ||||||||
California — 15.9% | ||||||||||
Benicia Unified School District, General Obligation Bonds Series C Insured: AGM | ||||||||||
2.000%, due 8/1/23(a) | 300,000 | 275,577 | ||||||||
California Municipal Finance Authority, Revenue Bonds | ||||||||||
5.000%, due 5/15/31 | 400,000 | 473,012 | ||||||||
City of Oxnard CA Water System Revenue, Revenue Bonds Insured: BAM | ||||||||||
5.000%, due 6/1/35 | 600,000 | 719,322 | ||||||||
El Camino Healthcare District, General Obligation Bonds Insured: NATL | ||||||||||
2.620%, due 8/1/29(a) | 700,000 | 535,731 | ||||||||
Hayward Unified School District, General Obligation Bonds Series A Insured: BAM | ||||||||||
5.000%, due 8/1/34 | 250,000 | 304,502 | ||||||||
Kelseyville Unified School District, General Obligation Bonds Series C Insured: AGM | ||||||||||
3.080%, due 8/1/31(a) | 150,000 | 101,040 | ||||||||
3.280%, due 8/1/33(a) | 220,000 | 133,817 | ||||||||
Lake Elsinore School Financing Authority, Special Tax Insured: BAM | ||||||||||
5.000%, due 10/1/33 | 250,000 | 308,845 | ||||||||
Menifee Union School District, General Obligation Bonds Series B Insured: BAM | ||||||||||
5.000%, due 8/1/30 | 250,000 | 306,145 | ||||||||
Murrieta Redevelopment Agency Successor Agency, Tax Allocation Series A | ||||||||||
3.000%, due 8/1/19 | 200,000 | 200,768 | ||||||||
| Principal Amount | Value | |||||||||
Municipal Bonds (continued) | ||||||||||
California (continued) | ||||||||||
Murrieta Valley Unified School District, General Obligation Bonds Series A Insured: NATL | ||||||||||
1.940%, due 9/1/22(a) | $ | 160,000 | $ | 150,010 | ||||||
Paramount Unified School District, General Obligation Bonds Series B Insured: BAM | ||||||||||
3.310%, due 8/1/33(a) | 640,000 | 399,392 | ||||||||
Pittsburg Successor Agency Redevelopment Agency, Tax Allocation Series A Insured: AGM | ||||||||||
5.000%, due 9/1/25 | 500,000 | 589,745 | ||||||||
Rocklin Unified School District, General Obligation Bonds Insured: NATL | ||||||||||
1.970%, due 8/1/23(a) | 135,000 | 124,166 | ||||||||
Roseville Natural Gas Financing Authority, Revenue Bonds | ||||||||||
5.000%, due 2/15/24 | 560,000 | 629,345 | ||||||||
Sacramento City Unified School District, General Obligation Bonds Insured: AGM | ||||||||||
2.360%, due 7/1/24(a) | 495,000 | 438,387 | ||||||||
State of California, General Obligation Bonds | ||||||||||
4.000%, due 9/1/32 | 500,000 | 551,770 | ||||||||
Vallejo City Unified School District, General Obligation Bonds Series A Insured: NATL | ||||||||||
5.900%, due 2/1/20 | 400,000 | 411,712 | ||||||||
West Sacramento Financing Authority, Revenue Bonds Insured: BAM | ||||||||||
4.000%, due 10/1/31 | 250,000 | 279,013 | ||||||||
| 6,932,299 | ||||||||||
Colorado — 1.7% | ||||||||||
Grand River Hospital District, General Obligation Bonds Insured: AGM | ||||||||||
5.250%, due 12/1/37 | 500,000 | 588,705 | ||||||||
Interlocken Metropolitan District, General Obligation Bonds Series A-1 Insured: AGM | ||||||||||
5.000%, due 12/1/19 | 150,000 | 152,811 | ||||||||
| 741,516 | ||||||||||
Connecticut — 7.3% | ||||||||||
City of Bridgeport CT, General Obligation Bonds Series A | ||||||||||
5.000%, due 11/1/33 | 600,000 | 681,270 | ||||||||
City of Hartford CT, General Obligation Bonds Series A Insured: AGM | ||||||||||
5.000%, due 7/1/28 | 560,000 | 646,621 | ||||||||
City of Hartford CT, General Obligation Bonds Series A Insured: BAM | ||||||||||
5.000%, due 4/1/30 | 100,000 | 109,228 | ||||||||
City of New Britain CT, General Obligation Bonds Series B Insured: AGM | ||||||||||
5.250%, due 9/1/30 | 600,000 | 730,638 | ||||||||
See notes to financial statements.
Schedules of Investments — IQ MacKay Municipal Intermediate ETF(continued)
April 30, 2019
| Principal Amount | Value | |||||||||
Municipal Bonds (continued) | ||||||||||
Connecticut (continued) | ||||||||||
Connecticut State Health & Educational Facilities Authority, Revenue Bonds Series I-1 | ||||||||||
5.000%, due 7/1/33 | $ | 350,000 | $ | 406,829 | ||||||
Town of Hamden CT, General Obligation Bonds Series A Insured: BAM | ||||||||||
5.000%, due 8/15/30 | 500,000 | 587,945 | ||||||||
| 3,162,531 | ||||||||||
Florida — 3.7% | ||||||||||
City of Tallahassee FL Utility System Revenue, Revenue Bonds | ||||||||||
5.000%, due 10/1/19 | 505,000 | 512,110 | ||||||||
County of Broward FL Airport System Revenue, Revenue Bonds | ||||||||||
5.000%, due 10/1/34 | 500,000 | 585,295 | ||||||||
State of Florida Lottery Revenue, Revenue Bonds Series C | ||||||||||
5.000%, due 7/1/19 | 530,000 | 532,915 | ||||||||
| 1,630,320 | ||||||||||
Georgia — 0.6% | ||||||||||
Main Street Natural Gas, Inc., Revenue Bonds Series A | ||||||||||
5.000%, due 5/15/21 | 250,000 | 263,228 | ||||||||
Illinois — 11.5% | ||||||||||
City of Chicago IL Waterworks Revenue, Revenue Bonds Insured: AGM | ||||||||||
5.250%, due 11/1/34 | 230,000 | 268,352 | ||||||||
Cook County Community Unit School District No 401 Elmwood Park, General Obligation Bonds Series A Insured: AGM | ||||||||||
5.000%, due 12/1/20 | 250,000 | 262,328 | ||||||||
Governors State University, Certificates of Participation Insured: BAM | ||||||||||
5.000%, due 7/1/20 | 250,000 | 257,350 | ||||||||
Illinois Finance Authority, Revenue Bonds | ||||||||||
5.000%, due 9/1/25 | 500,000 | 547,715 | ||||||||
Madison-Macoupin Etc Counties Community College District No 536, General Obligation Bonds Series A Insured: AGM | ||||||||||
5.000%, due 11/1/32 | 320,000 | 365,798 | ||||||||
Town of Cicero IL, General Obligation Bonds Insured: BAM | ||||||||||
5.000%, due 12/1/26 | 400,000 | 440,128 | ||||||||
5.000%, due 1/1/30 | 450,000 | 523,575 | ||||||||
Upper Illinois River Valley Development Authority, Revenue Bonds | ||||||||||
5.250%, due 12/1/38 | 425,000 | 479,519 | ||||||||
Village of Matteson IL, Revenue Bonds Insured: BAM | ||||||||||
5.000%, due 12/1/29 | 615,000 | 711,690 | ||||||||
| Principal Amount | Value | |||||||||
Municipal Bonds (continued) | ||||||||||
Illinois (continued) | ||||||||||
Will County School District No 114 Manhattan, General Obligation Bonds Insured: MAC | ||||||||||
3.500%, due 1/1/26 | $ | 840,000 | $ | 880,102 | ||||||
3.500%, due 1/1/27 | 260,000 | 271,430 | ||||||||
| 5,007,987 | ||||||||||
Iowa — 0.1% | ||||||||||
Clarke Community School District, General Obligation Bonds Insured: AGM | ||||||||||
4.000%, due 6/1/19 | 60,000 | 60,112 | ||||||||
Kentucky — 3.9% | ||||||||||
County of Knox KY, General Obligation Bonds Insured: BAM | ||||||||||
5.000%, due 10/1/35 | 500,000 | 578,740 | ||||||||
Kentucky Economic Development Finance Authority, Revenue Bonds Series A Insured: AGM | ||||||||||
4.000%, due 6/1/37 | 325,000 | 339,905 | ||||||||
Louisville & Jefferson County Visitors and Convention Commission, Revenue Bonds Insured: BAM | ||||||||||
4.000%, due 6/1/36 | 200,000 | 210,858 | ||||||||
Louisville/Jefferson County Metropolitan Government, Revenue Bonds | ||||||||||
5.000%, due 10/1/32 | 500,000 | 574,560 | ||||||||
| 1,704,063 | ||||||||||
Louisiana — 3.4% | ||||||||||
City of Monroe LA Water Revenue, Revenue Bonds Insured: BAM | ||||||||||
3.000%, due 11/1/19 | 310,000 | 312,018 | ||||||||
City of Shreveport LA Water & Sewer Revenue, Revenue Bonds Series C Insured: BAM | ||||||||||
5.000%, due 12/1/31 | 200,000 | 239,298 | ||||||||
5.000%, due 12/1/32 | 145,000 | 172,867 | ||||||||
Port New Orleans Board of Commissioners, Revenue Bonds Series B Insured: AGM | ||||||||||
5.000%, due 4/1/36 | 335,000 | 391,029 | ||||||||
St Landry Parish Road District No 1, Revenue Bonds Insured: BAM | ||||||||||
4.000%, due 3/1/20 | 350,000 | 356,342 | ||||||||
| 1,471,554 | ||||||||||
Maine — 1.3% | ||||||||||
Finance Authority of Maine, Revenue Bonds Series A-1 Insured: AGC | ||||||||||
5.000%, due 12/1/25 | 155,000 | 177,986 | ||||||||
5.000%, due 12/1/26 | 160,000 | 185,907 | ||||||||
5.000%, due 12/1/27 | 175,000 | 205,237 | ||||||||
| 569,130 | ||||||||||
Michigan — 0.3% | ||||||||||
Warren Consolidated Schools, General Obligation Bonds Series B Insured: BAM | ||||||||||
5.000%, due 5/1/19 | 115,000 | 115,000 | ||||||||
See notes to financial statements.
Schedules of Investments — IQ MacKay Municipal Intermediate ETF(continued)
April 30, 2019
| Principal Amount | Value | |||||||||
Municipal Bonds (continued) | ||||||||||
Minnesota — 0.9% | ||||||||||
Duluth Independent School District No 709, Certificates of Participation Series B | ||||||||||
5.000%, due 2/1/23 | $ | 350,000 | $ | 384,517 | ||||||
Mississippi — 1.2% | ||||||||||
State of Mississippi, Revenue Bonds Series A | ||||||||||
5.000%, due 10/15/33 | 430,000 | 511,734 | ||||||||
Montana — 1.0% | ||||||||||
Montana Facility Finance Authority, Revenue Bonds | ||||||||||
5.000%, due 6/1/24 | 375,000 | 428,235 | ||||||||
New Jersey — 9.4% | ||||||||||
City of Trenton NJ, General Obligation Bonds Insured: AGM | ||||||||||
3.000%, due 8/1/19 | 460,000 | 461,421 | ||||||||
5.000%, due 8/1/27 | 250,000 | 297,133 | ||||||||
Long Branch Board of Education, General Obligation Bonds Insured: AGM | ||||||||||
5.000%, due 7/15/28 | 75,000 | 92,566 | ||||||||
New Jersey Economic Development Authority, Revenue Bonds Series A Insured: NATL | ||||||||||
5.250%, due 7/1/26 | 500,000 | 588,105 | ||||||||
New Jersey Economic Development Authority, Revenue Bonds Series K Insured: AMBAC | ||||||||||
5.500%, due 12/15/19 | 600,000 | 613,410 | ||||||||
New Jersey Educational Facilities Authority, Revenue Bonds Series C Insured: AGM | ||||||||||
5.000%, due 7/1/25 | 515,000 | 605,007 | ||||||||
New Jersey Educational Facilities Authority, Revenue Bonds Series F | ||||||||||
5.000%, due 7/1/28 | 330,000 | 379,163 | ||||||||
New Jersey Transportation Trust Fund Authority, Revenue Bonds | ||||||||||
5.000%, due 6/15/27 | 430,000 | 497,785 | ||||||||
South Jersey Port Corp., Revenue Bonds Series B | ||||||||||
5.000%, due 1/1/31 | 500,000 | 570,680 | ||||||||
| 4,105,270 | ||||||||||
New York — 3.5% | ||||||||||
County of Suffolk NY, General Obligation Bonds Series C Insured: BAM | ||||||||||
5.000%, due 2/1/23 | 350,000 | 389,736 | ||||||||
New York City Transitional Finance Authority Future Tax Secured Revenue, Revenue Bonds Series E-1 | ||||||||||
5.000%, due 2/1/37 | 1,000,000 | 1,156,870 | ||||||||
| 1,546,606 | ||||||||||
North Carolina — 1.4% | ||||||||||
North Carolina Turnpike Authority, Revenue Bonds Insured: AGM | ||||||||||
5.000%, due 1/1/32 | 525,000 | 632,200 | ||||||||
| Principal Amount | Value | |||||||||
Municipal Bonds (continued) | ||||||||||
Ohio — 0.5% | ||||||||||
City of Cleveland OH Airport System Revenue, Revenue Bonds Series A Insured: AMBAC | ||||||||||
5.250%, due 1/1/20 | $ | 200,000 | $ | 204,542 | ||||||
Oklahoma — 2.5% | ||||||||||
Canadian County Educational Facilities Authority, Revenue Bonds | ||||||||||
4.000%, due 9/1/25 | 425,000 | 472,362 | ||||||||
Oklahoma County Finance Authority, Revenue Bonds | �� | |||||||||
5.000%, due 10/1/26 | 500,000 | 599,095 | ||||||||
| 1,071,457 | ||||||||||
Pennsylvania — 4.2% | ||||||||||
City of Erie PA, General Obligation Bonds Series B Insured: AGM | ||||||||||
3.480%, due 11/15/37(a) | 750,000 | 387,720 | ||||||||
Coatesville Area School District Building Authority, Revenue Bonds Insured: BAM | ||||||||||
5.000%, due 12/1/21 | 310,000 | 332,797 | ||||||||
Commonwealth Financing Authority, Revenue Bonds Insured: BAM | ||||||||||
5.000%, due 6/1/31 | 500,000 | 596,615 | ||||||||
Erie Sewer Authority, Revenue Bonds Series B Insured: AGM | ||||||||||
5.000%, due 12/1/35 | 250,000 | 298,340 | ||||||||
Pennsylvania Higher Educational Facilities Authority, Revenue Bonds Series A Insured: XLCA | ||||||||||
2.336%, due 7/1/27(b) | 230,000 | 223,636 | ||||||||
| 1,839,108 | ||||||||||
Puerto Rico — 2.0% | ||||||||||
Commonwealth of Puerto Rico, General Obligation Bonds Series A Insured: NATL | ||||||||||
5.500%, due 7/1/19 | 285,000 | 286,038 | ||||||||
Commonwealth of Puerto Rico, General Obligation Bonds Series A Insured: AGM | ||||||||||
5.000%, due 7/1/35 | 470,000 | 485,082 | ||||||||
Puerto Rico Convention Center District Authority, Revenue Bonds Series A Insured: AGC | ||||||||||
4.500%, due 7/1/36 | 60,000 | 60,076 | ||||||||
Puerto Rico Electric Power Authority, Revenue Bonds Series PP Insured: NATL | ||||||||||
5.000%, due 7/1/24 | 25,000 | 25,287 | ||||||||
| 856,483 | ||||||||||
South Carolina — 0.3% | ||||||||||
South Carolina Public Service Authority, Revenue Bonds Series B | ||||||||||
5.000%, due 12/1/36 | 100,000 | 114,611 | ||||||||
See notes to financial statements.
Schedules of Investments — IQ MacKay Municipal Intermediate ETF(continued)
April 30, 2019
| Principal Amount | Value | |||||||||
Municipal Bonds (continued) | ||||||||||
Texas — 1.8% | ||||||||||
Argyle Independent School District, General Obligation Bonds Insured: PSF-GTD | ||||||||||
5.000%, due 8/15/25 | $ | 200,000 | $ | 232,796 | ||||||
Uptown Development Authority, Tax Allocation Series A | ||||||||||
5.000%, due 9/1/35 | 500,000 | 556,465 | ||||||||
| 789,261 | ||||||||||
Utah — 2.7% | ||||||||||
Utah Associated Municipal Power Systems, Revenue Bonds Series A | ||||||||||
5.000%, due 9/1/31 | 500,000 | 594,560 | ||||||||
Utah Infrastructure Agency, Revenue Bonds Series A | ||||||||||
5.000%, due 10/15/20 | 580,000 | 600,468 | ||||||||
| 1,195,028 | ||||||||||
Washington — 1.4% | ||||||||||
Spokane Public Facilities District, Revenue Bonds | ||||||||||
5.000%, due 12/1/35 | 535,000 | 622,681 | ||||||||
Wisconsin — 0.6% | ||||||||||
City of Racine WI Waterworks System Revenue, Revenue Bonds Insured: AGM | ||||||||||
5.000%, due 9/1/30 | 230,000 | 274,408 | ||||||||
Total Municipal Bonds (Cost $38,039,420) | 38,848,096 | |||||||||
| Shares | Value | |||||||||
Short-Term Investment — 12.0% | ||||||||||
Money Market Fund — 12.0% | ||||||||||
Fidelity Investments Money Market Treasury Only Class I, 2.27%(c) (Cost $5,233,042) | 5,233,042 | $ | 5,233,042 | |||||||
Total Investments — 101.2% (Cost $43,272,462) | 44,081,138 | |||||||||
Other Assets and Liabilities, Net — (1.2)% | (539,983 | ) | ||||||||
Net Assets — 100.0% | $ | 43,541,155 | ||||||||
(a) | The security was issued on a discount basis with no stated coupon rate. Rate shown reflects the effective yield. |
(b) | Variable rate securities that may be tendered back to the issuer at any time prior to maturity at par. Rate shown is the rate in effect as of April 30, 2019. |
(c) | Reflects the 7-day yield at April 30, 2019. |
| Description | Level 1 | Level 2 | Level 3 | Total | ||||||||||||||
Investments in Securities:(d) | ||||||||||||||||||
Municipal Bonds | $ | — | $ | 38,848,096 | $ | — | $ | 38,848,096 | ||||||||||
Short-Term Investment: | ||||||||||||||||||
Money Market Fund | 5,233,042 | — | — | 5,233,042 | ||||||||||||||
Total Investments in Securities | $ | 5,233,042 | $ | 38,848,096 | $ | — | $ | 44,081,138 | ||||||||||
(d) | For a complete listing of investments and their states, see the Schedules of Investments. |
See notes to financial statements.
| | IQ MacKay Municipal Insured ETF | IQ MacKay Municipal Intermediate ETF | |||||||||
Assets | |||||||||||
Investments in securities, at value | �� | $ | 42,860,089 | $ | 44,081,138 | ||||||
Interest receivable | 479,939 | 439,277 | |||||||||
Receivable for investments sold | 227,655 | 119,891 | |||||||||
Dividend receivable | 1,157 | 2,273 | |||||||||
Due from advisor | 24,465 | 26,848 | |||||||||
Total assets | 43,593,305 | 44,669,427 | |||||||||
Liabilities | |||||||||||
Payable for investments purchased | — | 1,068,642 | |||||||||
Advisory fees payable | 14,253 | 14,256 | |||||||||
Trustee fees payable | 202 | 201 | |||||||||
Compliance fees payable | 17 | 12 | |||||||||
Accrued expenses and other liabilities | 40,205 | 45,161 | |||||||||
Total liabilities | 54,677 | 1,128,272 | |||||||||
Net assets | $ | 43,538,628 | $ | 43,541,155 | |||||||
Composition of Net Assets | |||||||||||
Paid-in capital | $ | 42,620,197 | $ | 42,563,712 | |||||||
Total distributable earnings(a) | 918,431 | 977,443 | |||||||||
Net assets | $ | 43,538,628 | $ | 43,541,155 | |||||||
NET ASSET VALUE PER SHARE | |||||||||||
Shares Outstanding (no par value, unlimited shares authorized) | 1,700,000 | 1,700,000 | |||||||||
Net Asset Value Per Share | $ | 25.61 | $ | 25.61 | |||||||
Investments, at cost | $ | 42,043,982 | $ | 43,272,462 | |||||||
(a) | Total distributable earnings has been aggregated to conform to the current presentation requirements per the adoption of the SEC’s Disclosure Update and Simplification. (See Note 9). |
See notes to financial statements.
| IQ MacKay Municipal Insured ETF | IQ MacKay Municipal Intermediate ETF | ||||||||||
Investment Income | |||||||||||
Interest income | $ | 682,621 | $ | 991,359 | |||||||
Dividend income | 27,792 | 25,958 | |||||||||
Total investment income | 710,413 | 1,017,317 | |||||||||
Expenses | |||||||||||
Advisory fees (see Note 3) | 89,135 | 132,850 | |||||||||
Audit fees | 20,718 | 20,718 | |||||||||
Administrative and accounting fees | 13,397 | 17,784 | |||||||||
Intraday pricing fees | 12,356 | 12,356 | |||||||||
Shareholder reporting fees | 9,659 | 16,662 | |||||||||
Listing fees | 8,750 | 8,750 | |||||||||
Legal fees | 8,263 | 13,832 | |||||||||
Custodian fees | 5,658 | 10,495 | |||||||||
Registration fees | 3,336 | 1,587 | |||||||||
Trustee fees | 1,237 | 1,815 | |||||||||
Compliance fees | 79 | 112 | |||||||||
Miscellaneous | 56 | 60 | |||||||||
Total expenses | 172,644 | 237,021 | |||||||||
Waivers (see Note 3) | (105,792 | ) | (137,384 | ) | |||||||
Net expenses | 66,852 | 99,637 | |||||||||
Net investment income | 643,561 | 917,680 | |||||||||
Realized and Unrealized Gain on Investments | |||||||||||
Net realized gain from: | |||||||||||
Investment securities | 16,810 | 106,208 | |||||||||
Net realized gain | 16,810 | 106,208 | |||||||||
Net change in net unrealized appreciation on: | |||||||||||
Investment securities | 1,046,473 | 1,233,618 | |||||||||
Net change in net unrealized appreciation | 1,046,473 | 1,233,618 | |||||||||
Net realized and unrealized gain | 1,063,283 | 1,339,826 | |||||||||
Net Increase (Decrease) in Net Assets Resulting From Operations | $ | 1,706,844 | $ | 2,257,506 | |||||||
See notes to financial statements.
| IQ MacKay Municipal Insured ETF | IQ MacKay Municipal Intermediate ETF | |||||||||||||||||
| For the Year Ended April 30, 2019 | For the Period October 18, 2017* to April 30, 2018 | For the Year Ended April 30, 2019 | For the Period October 18, 2017* to April 30, 2018 | |||||||||||||||
Increase (Decrease) in Net Assets from Operations | ||||||||||||||||||
Net investment income | $ | 643,561 | $ | 215,331 | $ | 917,680 | $ | 356,392 | ||||||||||
Net realized gain (loss) | 16,810 | (13,771 | ) | 106,208 | (44,053 | ) | ||||||||||||
Net change in net unrealized appreciation (depreciation) | 1,046,473 | (230,366 | ) | 1,233,618 | (424,942 | ) | ||||||||||||
Net increase (decrease) in net assets resulting from operations | 1,706,844 | (28,806 | ) | 2,257,506 | (112,603 | ) | ||||||||||||
Distributions to Shareholders | (580,120 | ) | (179,586 | )** | (874,540 | ) | (292,920 | )** | ||||||||||
Capital Share Transactions | ||||||||||||||||||
Proceeds from shares created | 27,610,800 | 15,009,521 | 12,552,062 | 30,011,675 | ||||||||||||||
Cost of shares redeemed | (25 | ) | — | (25 | ) | — | ||||||||||||
Increase from capital share transactions | 27,610,775 | 15,009,521 | 12,552,037 | 30,011,675 | ||||||||||||||
Total increase in net assets | 28,737,499 | 14,801,129 | 13,935,003 | 29,606,152 | ||||||||||||||
Net Assets | ||||||||||||||||||
Beginning of period | 14,801,129 | — | 29,606,152 | — | ||||||||||||||
End of period | $ | 43,538,628 | $ | 14,801,129 | ** | $ | 43,541,155 | $ | 29,606,152 | ** | ||||||||
Changes in Shares Outstanding | ||||||||||||||||||
Shares outstanding, beginning of period | 600,001 | — | 1,200,001 | — | ||||||||||||||
Shares created | 1,100,000 | 600,001 | 500,000 | 1,200,001 | ||||||||||||||
Shares redeemed | (1 | ) | — | (1 | ) | — | ||||||||||||
Shares outstanding, end of period | 1,700,000 | 600,001 | 1,700,000 | 1,200,001 | ||||||||||||||
* | Commencement of operations. |
** | For the year ended April 30, 2019, the requirement to disclose dividends and distributions paid to shareholders from net investment income and or net realized gain (loss) on investments was modified and now presented together as Distributions to Shareholders. End of period net assets included undistributed net investment income of $35,745 and $63,472 respectively at April 30, 2018. (See Note 9.) See Note 5 for tax basis of distributable earnings. |
See notes to financial statements.
Financial Highlights
Selected Data for a Share of Capital Stock Outstanding
| IQ MacKay Municipal Insured ETF | ||||||||||
| For the Year Ended April 30, 2019 | For the Period October 18, 2017(a) to April 30, 2018 | |||||||||
Net asset value, beginning of period | $ | 24.67 | $ | 25.00 | ||||||
Income from Investment Operations | ||||||||||
Net investment income(b) | 0.72 | 0.36 | ||||||||
Net realized and unrealized gain (loss) | 0.90 | (0.39 | ) | |||||||
Net increase (decrease) in net assets resulting from investment operations | 1.62 | (0.03 | ) | |||||||
Distributions from: | ||||||||||
Net investment income | (0.68 | ) | (0.30 | ) | ||||||
Net asset value, end of period | $ | 25.61 | $ | 24.67 | ||||||
Market price, end of period | $ | 25.64 | $ | 24.86 | ||||||
Total Return | ||||||||||
Total investment return based on net asset value(c) | 6.72 | % | (0.13 | )% | ||||||
Total investment return based on Market price(d) | 6.02 | % | 0.64 | %(e) | ||||||
Ratios/Supplemental Data | ||||||||||
Net assets, end of period (000’s omitted) | $ | 43,539 | $ | 14,801 | ||||||
Ratio to average net assets of: | ||||||||||
Expenses net of waivers | 0.30 | % | 0.30 | %(f) | ||||||
Expenses excluding waivers | 0.77 | % | 0.99 | %(f) | ||||||
Net investment income | 2.89 | % | 2.74 | %(f) | ||||||
Portfolio turnover rate(g) | 56 | % | 77 | % | ||||||
(a) | Commencement of operations. |
(b) | Based on average shares outstanding. |
(c) | Total investment return is calculated assuming an initial investment made at the net asset value at the beginning of the period, reinvestment of all dividends and distributions, if any, at net asset value during the period, and redemption on the last day of the period. Total return calculated for a period less than one year is not annualized. |
(d) | The market price returns are calculated using the mean between the last bid and ask prices. |
(e) | Since the Shares of the Funds did not trade in the secondary market until the day after the Fund’s inception, for the period from the inception to the first day of the secondary market trading, the NAV is used as a proxy for the secondary market trading price to calculate the market returns. |
(f) | Annualized. |
(g) | Portfolio turnover rate is not annualized and excludes the value of portfolio securities received or delivered as in-kind creations or redemptions in connection with the Fund’s capital share transactions. |
See notes to financial statements.
Financial Highlights(continued)
Selected Data for a Share of Capital Stock Outstanding
| IQ MacKay Municipal Intermediate ETF | ||||||||||
| For the Year Ended April 30, 2019 | For the Period October 18, 2017(a) to April 30, 2018 | |||||||||
Net asset value, beginning of period | $ | 24.67 | $ | 25.00 | ||||||
Income from Investment Operations | ||||||||||
Net investment income(b) | 0.69 | 0.30 | ||||||||
Net realized and unrealized gain (loss) | 0.91 | (0.39 | ) | |||||||
Net increase (decrease) in net assets resulting from investment operations | 1.60 | (0.09 | ) | |||||||
Distributions from: | ||||||||||
Net investment income | (0.66 | ) | (0.24 | ) | ||||||
Net asset value, end of period | $ | 25.61 | $ | 24.67 | ||||||
Market price, end of period | $ | 25.66 | $ | 24.71 | ||||||
Total Return | ||||||||||
Total investment return based on net asset value(c) | 6.59 | % | (0.34 | )% | ||||||
Total investment return based on Market price(d) | 6.62 | % | (0.18 | )%(e) | ||||||
Ratios/Supplemental Data | ||||||||||
Net assets, end of period (000’s omitted) | $ | 43,541 | $ | 29,606 | ||||||
Ratio to average net assets of: | ||||||||||
Expenses net of waivers | 0.30 | % | 0.30 | %(f) | ||||||
Expenses excluding waivers | 0.71 | % | 0.77 | %(f) | ||||||
Net investment income | 2.76 | % | 2.28 | %(f) | ||||||
Portfolio turnover rate(g) | 72 | % | 80 | % | ||||||
(a) | Commencement of operations. |
(b) | Based on average shares outstanding. |
(c) | Total investment return is calculated assuming an initial investment made at the net asset value at the beginning of the period, reinvestment of all dividends and distributions, if any, at net asset value during the period, and redemption on the last day of the period. Total return calculated for a period less than one year is not annualized. |
(d) | The market price returns are calculated using the mean between the last bid and ask prices. |
(e) | Since the Shares of the Funds did not trade in the secondary market until the day after the Fund’s inception, for the period from the inception to the first day of the secondary market trading, the NAV is used as a proxy for the secondary market trading price to calculate the market returns. |
(f) | Annualized. |
(g) | Portfolio turnover rate is not annualized and excludes the value of portfolio securities received or delivered as in-kind creations or redemptions in connection with the Fund’s capital share transactions. |
See notes to financial statements.
April 30, 2019
Notes to Financial Statements(continued)
April 30, 2019
• | Level 1 — Unadjusted quoted prices in active markets for identical assets or liabilities that the Funds have the ability to access. |
• | Level 2 — Observable inputs other than quoted prices included in Level 1 that are observable for the asset or liability, either directly or indirectly. These inputs may include quoted prices for the identical instrument on an inactive market, prices for similar securities, interest rates, prepayment speeds, credit risk, yield curves, default rates and similar data. |
• | Level 3 — Unobservable inputs for the asset or liability, to the extent relevant observable inputs are not available; representing the Funds’ own assumptions about the assumptions a market participant would use in valuing the asset or liability, and would be based on the best information available. |
Notes to Financial Statements(continued)
April 30, 2019
discuss the appropriateness of such fair values using more current information such as, recent security news, recent market transactions, updated corporate action information and/or other macro or security specific events.
Notes to Financial Statements(continued)
April 30, 2019
| Fund | Rate | |||
IQ MacKay Municipal Insured ETF | 0.40% | |||
IQ MacKay Municipal Intermediate ETF | 0.40% |
Notes to Financial Statements(continued)
April 30, 2019
accounting principles dividend, interest and brokerage expenses paid on short sales, acquired fund fees and expenses, extraordinary expenses, if any, and payments, if any, under the Rule 12b-1 Plan) to not more than 0.30% of the average daily net assets of the Fund.
Notes to Financial Statements(continued)
April 30, 2019
| Fund | Cost | Gross Unrealized Appreciation | Gross Unrealized Depreciation | Net Unrealized Appreciation/ (Depreciation) | ||||||||||||||
IQ MacKay Municipal Insured ETF | $ | 42,043,982 | $ | 821,001 | $ | (4,894 | ) | $ | 816,107 | |||||||||
IQ MacKay Municipal Intermediate ETF | 43,272,462 | 827,830 | (19,154 | ) | 808,676 | |||||||||||||
| Fund | Ordinary Income (Loss)1 | Tax-Exempt Income (Loss) | Net Capital Gain (Losses)2 | Net Unrealized Appreciation/ Depreciation | Total Earnings/ (Losses) | |||||||||||||||||
IQ MacKay Municipal Insured ETF | $ | 11,322 | $ | 91,002 | $ | — | $ | 816,107 | $ | 918,431 | ||||||||||||
IQ MacKay Municipal Intermediate ETF | 67,317 | 101,450 | — | 808,676 | 977,443 | |||||||||||||||||
1 | Includes late year ordinary loss, if any. |
2 | Amount includes the deferral of post October losses, if any. |
| Total distributable earnings/ (accumulated loss) | Paid-In Capital | |||||||||||||
IQ Mackay Municipal Insured ETF | $ | 99 | $ | (99 | ) | |||||||||
IQ Mackay Municipal Intermediate ETF | — | — | ||||||||||||
| 2019 | 2018 | ||||||||||||||||||||||||||||||||||
| Fund | Ordinary Income | Tax-Exempt Income | Long-Term Capital Gains | Tax Return of Capital | Ordinary Income | Tax-Exempt Income | Long-Term Capital Gains | Tax Return of Capital | |||||||||||||||||||||||||||
IQ MacKay Municipal Insured ETF | $ | 20,618 | $ | 559,502 | $ | — | $ | — | $ | 2,076 | $ | 177,510 | $ | — | $ | — | |||||||||||||||||||
IQ MacKay Municipal Intermediate ETF | 25,402 | 849,138 | — | — | 7,047 | 285,873 | — | — | |||||||||||||||||||||||||||
Notes to Financial Statements(continued)
April 30, 2019
| Fund | Utilized on Current Year | Short-Term With No Expiration | Long-Term With No Expiration | |||||||||||
IQ MacKay Municipal Insured ETF | $ | — | $ | — | $ | — | ||||||||
IQ MacKay Municipal Intermediate ETF | 44,053 | — | — | |||||||||||
| Fund | % Ownership | |||||
IQ MacKay Municipal Insured ETF | 93.7 | % | ||||
IQ MacKay Municipal Intermediate ETF | 93.9 | % | ||||
| Fund | Purchases | Sales | ||||||||
IQ MacKay Municipal Insured ETF | $ | 35,568,659 | $ | 11,417,306 | ||||||
IQ MacKay Municipal Intermediate ETF | 32,196,003 | 21,704,035 | ||||||||
Notes to Financial Statements(continued)
April 30, 2019
adversely impact municipal bond insurers, which could adversely impact the value of the insured municipal bond or the ability of the insurer to pay any claims due. Consolidation among municipal bond insurers could increase the Fund’s exposure to one or more individual municipal bond insurers and reduce the supply of municipal bonds.
Notes to Financial Statements(continued)
April 30, 2019
earnings on the Statements of Assets and Liabilities and also require presentation of the total, rather than the components, of distributions to shareholders, except for tax return of capital distributions, if any, on the Statements of Changes in Net Assets. The amendments also removed the requirement for parenthetical disclosure of undistributed net investment income on the Statements of Changes in Net Assets. These Regulation S-X amendments are reflected in the Portfolio’s financial statements for the year ended April 30, 2019.
New York, New York
June 27, 2019
IQ MacKay Municipal Insured ETF | 95.69% | |||||
IQ MacKay Municipal Intermediate ETF | 91.12% | |||||
1. | The nature, extent and quality of the facilities and services provided by the Advisor and MacKay. The Board reviewed the services that the Advisor and MacKay provide to the respective Funds, noting that they had continually reviewed and overseen such services throughout the past year. The Board noted the responsibilities that the Advisor and MacKay have as the Funds’ investment adviser and sub-advisor, respectively, including overall supervisory responsibility for the general management and investment of each Fund’s securities portfolio, monitoring Fund compliance with regulatory requirements and Fund objectives and policies, daily monitoring of the portfolio, overseeing Fund service providers, providing officers for the Funds, |
Board Review of Investment Advisory Agreement(unaudited)(continued)
April 30, 2019
ongoing reporting to the Board, and the implementation of Board directives as they relate to the Funds. For Funds that were not yet operational, the Board considered the services rendered in respect of the existing Funds in assessing services expected to be provided to non-operational Funds.
| The Board reviewed the Advisor’s and MacKay’s experience, resources, and strengths in managing mutual funds and ETFs, including the Advisor’s management of the Funds and the Funds of the IndexIQ ETF Trust. The Board also considered the experience of MacKay’s team in managing strategies and asset classes similar to the Funds. The Board also noted and discussed with the Advisor the resources and additional support and personnel from its parent, New York Life Investment Management (“NYLIM”), that enhance and support the work of the Advisor’s officers and staff. The Board also considered the tenure and experience of the personnel at the Advisor providing management and administrative services to the Funds. The Board also considered a presentation on marketing and distribution strategy that described the services engaged by the Advisor in seeking to market and grow assets in the Funds, and a discussion regarding the relocation of the Advisor’s team to NYLIM’s New York City offices. |
| Based on their consideration and review of the foregoing information, the Board concluded that each Fund was likely to continue to benefit from the nature, quality, and extent of these services, as well as the Advisor’s and MacKay’s ability to render such services based on its personnel, experience, operations, and resources. |
2. | Comparison of services provided and fees charged by the Advisor and MacKay and other investment advisers to similar clients, and the cost of the services provided and profits realized by the Advisor and MacKay from its relationship with the Funds. The Board then compared both the services rendered and the fees paid with respect to the Funds pursuant to the Advisory Agreement and Sub-Advisory Agreement to contracts of other registered investment advisers providing services to similar ETFs. |
| In particular, the Board compared each Fund’s advisory fee and expense ratio (including acquired fund fees and expenses, as applicable) to other investment companies considered to be in each such Fund’s peer group. The Advisor presented information on how peer groups were selected for the Funds, explaining that peer groups were selected using objective methodology by a NYLIM team. |
| The Board noted that certain Funds had peer groups of limited size and, in certain cases, with substantial differences in portfolio management and operational costs. The Board was presented with a dashboard view describing Fund performance and fees, with information relative to peer groups. The Board considered unique characteristics of certain Funds relative to peer groups, particularly where such Funds had fee or total expense ratios that diverged from the median levels of the applicable peer group. The Board also discussed price pressure in the general ETF marketplace and the impact of market pressures on the price levels for actively managed ETFs such as the Funds. The Board considered the level of each of the fees under the Advisory Agreement in the context of the services being provided. |
| Additionally, the Trustees considered that the Advisor had put in place expense limitation agreements whereby the Advisor reimburses expenses and/or waives fees to limit the impact above set thresholds of certain expenses on shareholders of the Funds. The Board noted that such expense limitation agreements were reflected in the peer group analysis provided by the Advisor and resulted in the operational Funds having a total net expense ratio lower than their peer group median. |
| After comparing each Fund’s fees with those of other investment companies in the Fund’s peer group, and in light of the nature, quality, and extent of services provided by the Advisor and MacKay and the costs incurred by the Advisor and MacKay in rendering those services, the Board concluded that the level of fees paid to the Advisor and Sub-Advisor with respect to each Fund is fair and reasonable. |
3. | The Advisor’s and MacKay’s profitability and the extent to which economies of scale would be realized as the Funds grow and whether fee levels would reflect such economies of scale. The Board discussed with the Advisor the costs and profitability of the Advisor in connection with its serving as investment adviser to each Fund, including operational costs. The Board also discussed additional resources that have been made available to the Advisor following its acquisition by NYLIM, including the investment of financial and human resources by NYLIM into the Advisor and additional support to market and distribute the Funds. |
Board Review of Investment Advisory Agreement(unaudited)(continued)
April 30, 2019
| The Board considered information regarding the strategy of the Advisor to grow assets in the Funds during the calendar year, including the marketing and distribution presentation. The Board reviewed the net asset levels of the Funds and the impact of both high and low asset levels on such Funds. The Advisor presented to the Board information on the operating profits on a year over year basis. The Board also considered the impact of future asset growth on the services required and fees paid to MacKay. The Board considered whether the continued operation of certain Funds that had not attracted significant assets under management would be profitable to the Advisor and determined to continue to review the asset levels of the Funds in relation to the Advisor’s profitability. The Board also noted the existence of the Expense Limitation Agreement, and its respective impact on costs to shareholders and profitability of the Advisor. |
| The Board concluded that the fees paid to each of the Advisor and MacKay were reasonable when considering the relative asset levels and profitability of the Funds to the Advisor. |
4. | Investment performance of the Funds. The Board considered the investment performance of the existing Funds. In particular, the Board considered the investment performance of the Funds relative to their stated objectives and the success of the Advisor and MacKay in reaching such objectives. The Board considered each Fund’s investment performance compared to its benchmark and peer group. |
| The Board concluded that the investment performance of the Funds supported the approval of the Advisory Agreement and Sub-Advisory Agreements. |
| Name and Year of Birth(1) | Position(s) Held with Trust | Term of Office and Length of Time Served(2) | Principal Occupation(s) During Past 5 Years | Number of Portfolios in Fund Complex Overseen by Trustee(3) | Other Directorships Held by Trustee During Past 5 Years | |||||||
Reena Aggarwal, 1957 | Trustee Chair | Since August 2008 January 2018 | Vice Provost of Faculty (2016 to present), Georgetown University, Robert E. McDonough Professor (2003 to present) and Professor of Finance, McDonough School of Business, Georgetown University (2000 to present); Director, Georgetown Center for Financial Markets and Policy (2010 to present); Co-Chair of Board, Social Innovations and Public Service Fund, Georgetown University (2012 to 2014). | 23 | Chair of Board, IndexIQ ETF Trust (2018 to present); Trustee, IndexIQ ETF Trust (2008 to present); Trustee, IndexIQ Trust (2008 to 2018); FBR & Co. (investment banking) (2011 to 2017); Cohen & Steers (asset management) (2017 to present); Director, Brightwood Capital Advisors, L.P. (private equity investment) (2013 to present). | |||||||
Michael A. Pignataro, 1959 | Trustee | Since April 2015 | Director, Credit Suisse Asset Management (2001 to 2012); and Chief Financial Officer, Credit Suisse Funds (1996 to 2013). | 23 | Trustee, IndexIQ ETF Trust (2015 to present); Trustee, IndexIQ Trust (2015 to 2018); The New Ireland Fund, Inc. (closed-end fund) (2015 to present). | |||||||
Paul D. Schaeffer, 1951 | Trustee | Since April 2015 | President, ASP (dba Aspiring Solution Partners) (financial services consulting) (2013 to present); Executive Advisor, Aquiline Capital Partners LLC (private equity investment) (2014 to present). | 23 | Trustee, IndexIQ ETF Trust (2015 to present); Management Board Member, RIA in a Box LLC (financial services consulting) (2018 to present); Trustee, IndexIQ Trust (2015 to 2018); Context Capital Funds (mutual fund trust) (2 Portfolios) (2014 to 2018); Management Board Member, Altegris Investments, LLC (registered broker- dealer) (2016 to 2018); Management Board Member, AssetMark Inc. (financial services consulting) (2016 to 2017); PopTech! (conference operator) (2012 to 2016). |
Kirk C. Lehneis, 1974(4) | Trustee, President and Principal Executive Officer | Since January 2018 | Chief Operating Officer and Senior Managing Director (2016 to present), New York Life Investment Management LLC; Chairman of the Board (2017 to present), NYLIFE Distributors LLC; Chairman of the Board, NYLIM Service Company LLC (2017 to present); President, MainStay MacKay DefinedTerm Municipal Opportunities Fund, The MainStay Funds, MainStay Funds Trust, and MainStay VP Funds Trust (2017 to present); Chief Executive Officer, IndexIQ Advisors LLC (2018 to present); Trustee, President and Principal Executive Officer, IndexIQ ETF Trust (2018 to present). | 30 | None |
Board of Trustees and Officers(unaudited)(continued)
April 30, 2019
| Name and Year of Birth(1) | Position(s) Held with Trust | Term of Office and Length of Time Served(2) | Principal Occupation(s) During Past 5 Years | |||||
Jonathan Zimmerman, 1982 | Executive Vice President | Since April 2018 | Chief Operating Officer, IndexIQ Advisors LLC (2018 to present); Managing Director, New York Life Investments LLC (2018 to present); Director, New York Life Investment Management LLC (2015 to 2018); Vice President, Morgan Stanley (2007 to 2015). | |||||
Adefolahan Oyefeso, 1974 | Treasurer, Principal Financial Officer and Principal Accounting Officer | Since April 2018 | Vice President of Operations & Finance, IndexIQ Advisors LLC (2015 to present); Director of the Fund Administration Client Service Department at The Bank of New York Mellon (2007 to 2015). | |||||
Matthew V. Curtin, 1982 | Secretary and Chief Legal Officer | Since June 2015 | Chief Legal Officer, IndexIQ Advisors (since June 2015), Chief Compliance Officer, IndexIQ Advisors LLC, IndexIQ ETF Trust and IndexIQ Active ETF Trust (2015 to 2017); Associate General Counsel, New York Life Insurance Company (since February 2015); Associate, Dechert LLP (2007 to 2015). | |||||
Kevin M. Bopp, 1969 | Chief Compliance Officer | Since January 2017 | Chief Compliance Officer, IndexIQ Advisors LLC and IndexIQ ETF Trust (2017 to present); Chief Compliance Officer, New York Life Investment Management LLC, The MainStay Funds, MainStay Funds Trust, MainStay VP Funds Trust and MainStay MacKay DefinedTerm Municipal Opportunities Fund (2014 to present); Director and Associate General Counsel and Assistant Secretary, The MainStay Funds, MainStay Funds Trust, MainStay VP Funds Trust and MainStay MacKay DefinedTerm Municipal Opportunities Fund (2011 to 2014) and Vice President and Assistant General Counsel, New York Life Investment Management LLC (2010 to 2011). |
1 | The address of each Trustee or officer is c/o IndexIQ, 51 Madison Avenue, New York, New York 10010. |
2 | Trustees and Officers serve until their successors are duly elected and qualified. |
3 | The Fund is part of a “fund complex”. The fund complex includes all open-end funds (including all of their portfolios) advised by the Advisor. As of the date of this SAI, the fund complex consists of the Trust’s funds and the Funds of IndexIQ ETF Trust. |
4 | Mr. Lehneis is an “interested person” of the Trust (as that term is defined in the 1940 Act) because of his affiliations with the Advisor. |
| 1780552 | ME11a-6/19 |
Item 2. Code of Ethics.
| (a) | The registrant, as of the end of the period covered by this report, has adopted a code of ethics that applies to the registrant’s principal executive officer, principal financial officer, principal accounting officer or controller, or persons performing similar functions, regardless of whether these individuals are employed by the registrant or a third party. |
| (c) | There have been no amendments, during the period covered by this report, to a provision of the code of ethics that applies to the registrant’s principal executive officer, principal financial officer, principal accounting officer or controller, or persons performing similar functions, regardless of whether these individuals are employed by the registrant or a third party, and that relates to any element of the code of ethics description. |
| (d) | The registrant has not granted any waivers, including an implicit waiver, from a provision of the code of ethics that applies to the registrant’s principal executive officer, principal financial officer, principal accounting officer or controller, or persons performing similar functions, regardless of whether these individuals are employed by the registrant or a third party, that relates to one or more of the items set forth in paragraph (b) of this item’s instructions. |
Item 3. Audit Committee Financial Expert.
The Registrant’s Board of Trustees has two audit committee financial experts serving on its Audit Committee, each an “independent” Trustee, Reena Aggarwal and Michael Pignataro. Under applicable securities laws, a person who is determined to be an audit committee financial expert will not be deemed an “expert” for any purpose, including without limitation for the purposes of Section 11 of the Securities Act of 1933, as a result of being designated or identified as an audit committee financial expert. The designation or identification of a person as an audit committee financial expert does not impose on such person any duties, obligations, or liabilities that are greater than the duties, obligations, and liabilities imposed on such person as a member of the Audit Committee and Board of Trustees in the absence of such designation or identification.
[Please verify, please provide further information if this statement is not correct.]
Item 4. Principal Accountant Fees and Services.
Audit Fees
| (a) | The aggregate fees billed for each of the last two fiscal years for professional services rendered by the principal accountant for the audit of the registrant's annual financial statements or services that are normally provided by the accountant in connection with statutory and regulatory filings or engagements for those fiscal years are $30,000 for 2019 and $26,000 for 2018. |
Audit-Related Fees
| (b) | The aggregate fees billed in each of the last two fiscal years for assurance and related services by the principal accountant that are reasonably related to the performance of the audit of the registrant's financial statements and are not reported under paragraph (a) of this Item are $0 for 2019 and $0 for 2018. |
Tax Fees
| (c) | The aggregate fees billed in each of the last two fiscal years for professional services rendered by the principal accountant for tax compliance, tax advice, and tax planning are $0 for 2019 and $0 for 2018. |
All Other Fees
| (d) | The aggregate fees billed in each of the last two fiscal years for products and services provided by the principal accountant, other than the services reported in paragraphs (a) through (c) of this Item are $0 for 2019 and $0 for 2018. |
| (e)(1) | Per Rule 2-01(c)(7)(A), the Audit Committee pre-approves all of the Audit, Audit-Related, Tax and Other Fees of the Registrant. |
| (e)(2) | With respect to the services described in each of Items 4(b) through (d), no amount was approved by the audit committee pursuant to paragraph (c)(7)(A) of Rule 2-01 of Regulation S-X. |
| (f) | The percentage of hours expended on the principal accountant's engagement to audit the registrant's financial statements for the most recent fiscal year that were attributed to work performed by persons other than the principal accountant's full-time, permanent employees was less than fifty percent. |
| (g) | The aggregate non-audit fees billed by the principal accountant for services rendered to the registrant’s investment adviser (not including any subadvisor whose role is primarily portfolio management and is subcontracted with or overseen by another investment adviser), and any entity controlling, controlled by, or under common control with the adviser that provides ongoing services to the registrant were (i) approximately $8,100,000 for the fiscal year ended April 30, 2019, and (ii) $6,800,000 for the fiscal year ended April 30, 2018. |
| (h) | The registrant’s Audit Committee has determined that the non-audit services rendered by the principal accountant for the fiscal year ended April 30, 2019 to the registrant’s investment adviser and any entity controlling, controlled by, or under common control with the registrant’s investment adviser that provides ongoing services to the registrant that were not required to be pre-approved by the Audit Committee because they did not relate directly to the operations and financial reporting of the registrant were compatible with maintaining the respective independence of the principal accountant during the relevant time period. |
Item 5. Audit Committee of Listed Registrants.
| (a) | The Fund has a designated Audit Committee in accordance with Section 3(a)(58)(A) of the Securities and Exchange Act of 1934 (the “Exchange Act”) and the members of such committee are Reena Aggarwal, Michael Pignataro and Paul Schaeffer. |
| (b) | Not applicable. |
Item 6. Investments.
| (a) | Schedule of Investments in securities of unaffiliated issuers as of the close of the reporting period is included as part of the report to shareholders filed under Item 1 of this form. |
| (b) | Not applicable. |
Item 7. Disclosure of Proxy Voting Policies and Procedures for Closed-End Management Investment Companies.
Not applicable.
Item 8. Portfolio Managers of Closed-End Management Investment Companies.
Not applicable.
Item 9. Purchases of Equity Securities by Closed-End Management Investment Company and Affiliated Purchasers.
Not applicable.
Item 10. Submission of Matters to a Vote of Security Holders.
There have been no material changes to the procedures by which the shareholders may recommend nominees to the registrant’s board of trustees, where those changes were implemented after the registrant last provided disclosure in response to the requirements of Item 407(c)(2)(iv) of Regulation S-K (17 CFR 229.407) (as required by Item 22(b)(15) of Schedule 14A (17 CFR 240.14a-101)), or this Item.
Item 11. Controls and Procedures.
| (a) | The registrant’s principal executive and principal financial officers, or persons performing similar functions, have concluded that the registrant’s disclosure controls and procedures (as defined in Rule 30a-3(c) under the Investment Company Act of 1940, as amended (the “1940 Act”) (17 CFR 270.30a-3(c))) are effective, as of a date within 90 days of the filing date of the report that includes the disclosure required by this paragraph, based on their evaluation of these controls and procedures required by Rule 30a-3(b) under the 1940 Act (17 CFR 270.30a-3(b)) and Rules 13a-15(b) or 15d-15(b) under the Securities Exchange Act of 1934, as amended (17 CFR 240.13a-15(b) or 240.15d-15(b)). |
| (b) | There were no changes in the registrant’s internal control over financial reporting (as defined in Rule 30a-3(d) under the 1940 Act (17 CFR 270.30a-3(d))) that occurred during the registrant’s last fiscal quarter that has materially affected, or is reasonably likely to materially affect, the registrant’s internal control over financial reporting. |
Item 12. Disclosure of Securities Lending Activities for Closed-End Management Investment Companies.
Not applicable.
Item 13. Exhibits.
| (a)(1) | Code of ethics that is the subject of disclosure required by Item 2 is attached hereto. |
| (a)(2) | Certifications pursuant to Rule 30a-2(a) under the 1940 Act and Section 302 of the Sarbanes-Oxley Act of 2002 are attached hereto. |
| (a)(3) | Not applicable. |
| (a)(4) | Not applicable. |
| (b) | Certifications pursuant to Rule 30a-2(b) under the 1940 Act and Section 906 of the Sarbanes-Oxley Act of 2002 are attached hereto. |
SIGNATURES
Pursuant to the requirements of the Securities Exchange Act of 1934 and the Investment Company Act of 1940, the registrant has duly caused this report to be signed on its behalf by the undersigned, thereunto duly authorized.
(Registrant) IndexIQ Active ETF Trust
By (Signature and Title)* /s/ Kirk C. Lehneis
Kirk C. Lehneis
(Principal Executive Officer)
Date July 8, 2019 ��
Pursuant to the requirements of the Securities Exchange Act of 1934 and the Investment Company Act of 1940, this report has been signed below by the following persons on behalf of the registrant and in the capacities and on the dates indicated.
By (Signature and Title)* /s/ Kirk C. Lehneis
Kirk C. Lehneis
(Principal Executive Officer)
Date July 8, 2019
By (Signature and Title)* /s/ Adefolahan O. Oyefeso
Adefolahan O. Oyefeso
(Principal Financial Officer)
Date July 8, 2019
* Print the name and title of each signing officer under his or her signature.