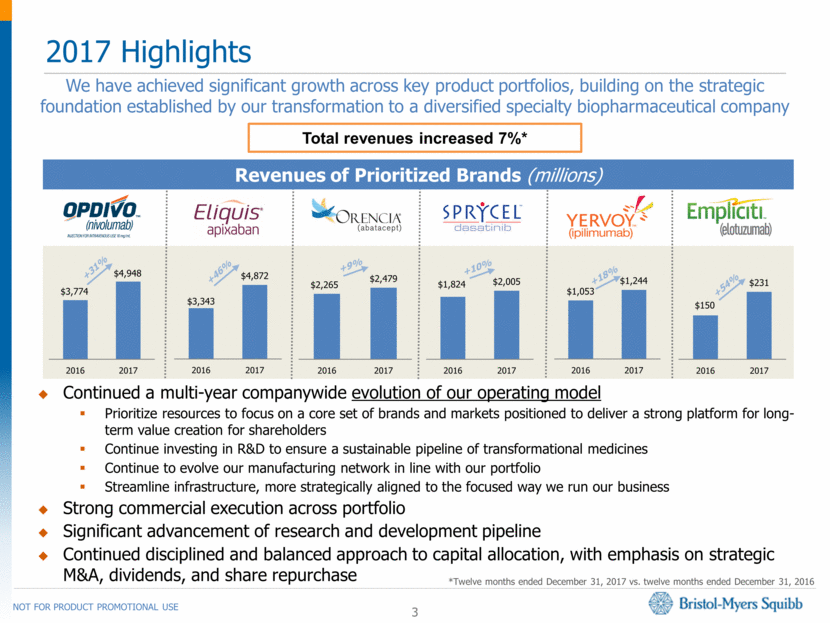
3 2017 Highlights 3 We have achieved significant growth across key product portfolios, building on the strategic foundation established by our transformation to a diversified specialty biopharmaceutical company Revenues of Prioritized Brands (millions) Total revenues increased 7%* +31% +9% Continued a multi-year companywide evolution of our operating model Prioritize resources to focus on a core set of brands and markets positioned to deliver a strong platform for long-term value creation for shareholders Continue investing in R&D to ensure a sustainable pipeline of transformational medicines Continue to evolve our manufacturing network in line with our portfolio Streamline infrastructure, more strategically aligned to the focused way we run our business Strong commercial execution across portfolio Significant advancement of research and development pipeline Continued disciplined and balanced approach to capital allocation, with emphasis on strategic M&A, dividends, and share repurchase *Twelve months ended December 31, 2017 vs. twelve months ended December 31, 2016 +46% +18% +54% +10% $3,774 $4,948 0 1000 2000 3000 4000 5000 6000 2016 2017 $3,343 $4,872 $0 $1,000 $2,000 $3,000 $4,000 $5,000 $6,000 2016 2017 $1,053 $1,244 $0 $200 $400 $600 $800 $1,000 $1,200 $1,400 $1,600 2016 2017 $2,265 $2,479 $0 $500 $1,000 $1,500 $2,000 $2,500 $3,000 2016 2017 $1,824 $2,005 $0 $500 $1,000 $1,500 $2,000 $2,500 2016 2017 $150 $231 $0 $50 $100 $150 $200 $250 $300 2016 2017