UNITED STATES
SECURITIES AND EXCHANGE COMMISSION
Washington, D.C. 20549
FORM N-CSR
CERTIFIED SHAREHOLDER REPORT OF REGISTERED MANAGEMENT
INVESTMENT COMPANIES
Investment Company Act file number 811-22185
IndexIQ Trust
(Exact name of registrant as specified in charter)
800 Westchester Ave, Suite N611
Rye Brook, NY 10573
(Address of principal executive offices) (Zip code)
Adam S. Patti
IndexIQ Advisors LLC
800 Westchester Ave, Suite N611
Rye Brook, NY 10573
(Name and address of agent for service)
Registrant's telephone number, including area code: 1-888-934-0777
Date of fiscal year end: April 30, 2009
Date of reporting period: June 30, 2008 – April 30, 2009
Form N-CSR is to be used by management investment companies to file reports with the Commission not later than 10 days after the transmission to stockholders of any report that is required to be transmitted to stockholders under Rule 30e-1 under the Investment Company Act of 1940 (17 CFR 270.30e -1). The Commission may use the information provided on Form N-CSR in its regulatory, disclosure review, inspection, and policymaking roles.
A registrant is required to disclose the information specified by Form N-CSR, and the Commission will make this information public. A registrant is not required to respond to the collection of information contained in Form N-CSR unless the Form displays a currently valid Office of Management and Budget (“OMB”) control number. Please direct comments concerning the accuracy of the information collection burden estimate and any suggestions for reducing the burden to Secretary, Securities and Exchange Commission, 450 Fifth Street, NW, Washington, DC 20549-0609. The OMB has reviewed this collection of information under the clearance requirements of 44 U.S.C. § 3507.
Item 1. Reports to Stockholders.
ANNUAL REPORT | APRIL 30, 2009
IndexIQ Trust
IQ ALPHA
Hedge Strategy Fund

The investment return and value of the Fund shares will fluctuate so that an investor’s shares, when sold, may be worth more or less than their original cost. Performance may be lower or higher than performance data quoted. Consider the Fund’s investment objectives, risks, charges and expenses carefully before investing. The prospectus and the statement of additional information include this and other relevant information about the Fund and are available by visiting www.indexiq.com or by calling 1-888-934-0777. Read the prospectus carefully before investing.
Fund performance current to the most recent month-end is available by visiting www.indexiq.com or by calling 1-888-934-0777.
This shareholder report must be preceded or accompanied by the Fund’s prospectus for individuals who are not current shareholders of the Fund. You may obtain a description of the Fund’s proxy voting policies and procedures, and information regarding how the Fund voted proxies relating to portfolio securities during the most recent 12-month period ended June 30, 2008, without charge. Please visit IndexIQ’s web site at www.indexiq.com, or go to the Securities and Exchange Commission’s (the “Commission”) web site at www.sec.gov, or call IndexIQ at 1-888-934-0777.
The Fund files its complete schedule of portfolio holdings with the Commission for the first and third quarters of each fiscal year on Form N-Q. The Fund’s Forms N-Q are available on the Commission’s web site at www.sec.gov. The Fund’s Forms N-Q also may be reviewed and copied at the Commission’s Public Reference Room in Washington, DC; information on the operation of the Public Reference Room may be obtained by calling 1-800-SEC-0330.
The Fund is distributed by PFPC Distributors, Inc., which is not affiliated with IndexIQ or the Fund’s investment advisor.
The Fund’s Statement of Additional Information (“SAI”) has additional information about the Fund’s Trustees and Officers and is available without charge upon request. Please visit IndexIQ’s web site at www.indexiq.com or call 1-888-934-0777.
IndexIQ® and IQ® are registered service marks of IndexIQ.
Shareholder Letter (unaudited)
Dear Shareholder:
The last twelve months ended April 30, 2009 marked a tumultuous period in the markets. As a result, investors have recognized that having a well-diversified portfolio is critical to long-term investment success. Alternative investments have historically provided investors with added diversification to their portfolios. We at IndexIQ call ourselves “The alternative to alternatives” because of our focus on bringing a different approach to the alternative investment segment of the marketplace.
Despite the market downturn, IndexIQ viewed this period as an opportune time to bring to market new investment products that meet investor needs. One such example is the introduction of the IQ ALPHA Hedge Strategy Fund in June 2008. By marrying the diversification benefits of alternative investments and the growth of ETFs (the Fund invests primarily in ETFs), IndexIQ is seeking to provide investors with innovative tools in a dynamic market environment.*
I want to personally thank you for your interest in IndexIQ and our investment products. I invite you to contact us at (888) 934-0777 or visit us at www.indexiq.com for more information on our company and our investment solutions.
Adam S. Patti
Chief Executive Officer
Registered Representative of ALPS Distributors, Inc.
| * | Diversification does not eliminate the risk of experiencing investment loss. |
3
Management’s Discussion and Analysis (unaudited)
IQ ALPHA Hedge Strategy Fund
The Fund’s investment objective is to seek to achieve investment results that correspond to the total return (aggregate price and yield performance) of the IQ ALPHA Hedge Index (the “Index”). The objective of the Index, in turn, is to provide superior returns (“alpha”) relative to the Standard & Poor’s 500® Composite Stock Price Index (the “S&P 500 Index”) with lower volatility than the S&P 500 Index and correlation to the S&P 500 Index that is similar to the correlation between hedge funds (as measured by broad-based hedge fund indexes) and the S&P 500 Index. The Fund implements its strategy by investing primarily in ETFs representing various asset classes.
For the 10-month period ended April 30, 2009, the Fund’s Institutional Class shares returned -5.71% versus -30.26% for the S&P 500 Index, with an annualized standard deviation of 14.26% versus 29.83% for the S&P 500 Index. The Fund also had a correlation of 74% to the S&P 500 Index. The Credit Suisse/Tremont Blue Chip Index had a correlation of 68% to the S&P 500 Index over the same time period.
The principle positive contributors to the Fund’s performance for the 10-month period, in aggregate, were the Fund’s short exposures to international equity markets and U.S. small cap equity, which were down 37.80% and 29.19%, respectively. Also contributing positively was an overweight position in aggregate bond market ETFs.
The primary drivers of negative performance were the overweight allocation to emerging equity market ETFs, which were down -37.57% for the 10-month period. This negative performance was mostly offset by the hedge provided to the portfolio from the short exposure to international and small cap equity markets. Despite having a relatively small exposure to the real estate market and the Euro, the Fund was nonetheless negatively impacted by these positions when the applicable ETFs declined significantly.
4
Management’s Discussion and Analysis (unaudited)(continued)
Hypothetical Growth of a $10,000 Investment Since Inception
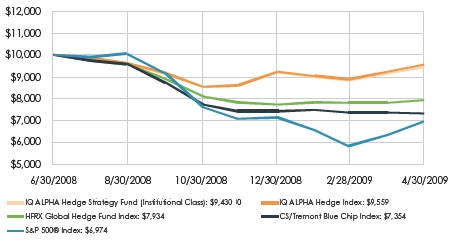
Fund Performance History
IQ ALPHA Hedge Strategy Fund
10-Month Period (6/30/2008 – 4/30/2009)
| | |
| | Since
Inception1
|
| IQ ALPHA Hedge Strategy Fund – Institutional Class Shares1 | -5.71 | % |
| IQ ALPHA Hedge Index | -4.41 | % |
| S&P 500 Index | -30.26 | % |
| Credit Suisse/Tremont Blue Chip Index | -26.46 | % |
| HFRX Global Hedge Fund Index | -20.66 | % |
| |
| 1 | Fund Inception Date: 6/30/2008 |
The performance data quoted represents past performance. Past performance does not guarantee future results. The investment return and principal value of an investment in the Fund will fluctuate so that an investor’s shares, when redeemed, may be worth more or less than their original cost. Current Fund performance may be lower or higher than the performance shown. Fund performance current to the most recent month-end is available by calling 1-888-934-0777 or by visiting www.indexiq.com. Returns shown include the reinvestment of all dividends and other distributions and do not reflect taxes that a shareholder would pay on the Fund’s distributions or redemptions of the Fund’s shares. The gross total annual operating expense ratio of the Fund, as stated in the current prospectus, is 1.70% for Institutional Class Shares and 1.95% for Investor Class Shares. The gross total annual operating expense ratio of the Institutional Class for the period June 30, 2008 (commencement of operations) to April 30, 2009 was 24.41% (annualized) and for the Investor Class Shares for the period July 23, 2008 (commencement
5
Management’s Discussion and Analysis (unaudited)(continued)
of operations) to April 30, 2009, was 44.26% (annualized). The Fund applies a 2.00% fee to the value of shares redeemed less than 7 days after purchase. The redemption fee is not reflected in the performance shown above. During this period, some of the Fund’s fees were waived and/or expenses reimbursed; otherwise, the Fund’s performance would have been lower.
Risk Discussion: Mutual fund investing involves risk, including loss of principal. There is no guarantee that the Fund will meet its objective. The Fund may not be suitable for all investors due to its use of leverage, short selling, and derivatives, or for other reasons. Funds that use leverage to seek to increase return are subject to greater risk in adverse market conditions. There are particular risks associated with funds that employ short sales, such as the fact that the potential loss from a short position theoretically is unlimited. The Fund's use of derivatives, such as swap agreements, may expose the Fund to additional risks that it would not be subject to if it invested directly in the securities underlying those derivatives. The Fund's investment performance, because it is a fund of funds, depends on the investment performance of the underlying ETFs in which it invests. There is no guarantee that the Fund itself, or each of the ETFs in the Fund's portfolio, will perform exactly as its underlying index. An investor in the Fund will bear, indirectly, the operating expenses of the underlying ETFs in which the Fund invests. The Fund is non-diversified and may be susceptible to greater losses if a single portfolio investment declines than would a diversified mutual fund.
IQ ALPHA Hedge Index (the “Index”) performance is for illustrative purposes only and does not represent actual Fund performance. One cannot invest directly in an index. Performance data for the Index assumes reinvestment of dividends and is net of the management fees for the Index’s components, as applicable, but it does not reflect management fees, transaction costs or other expenses that you would pay if you invested in the Fund directly.
The S&P 500 Index is a broad-based unmanaged index of 500 stocks, which is designed to represent the equity market in general (performance data assumes reinvestment of dividends, but it does not reflect management fees, transaction costs or other expenses).
The Credit Suisse/Tremont Blue Chip Index is comprised of hedge funds across 10 strategies and is designed to represent the hedge fund industry in general (performance data is net of underlying manager fees and calculation fees).
6
Management’s Discussion and Analysis (unaudited)(continued)
The HFRX Global Hedge Fund Index is designed to be representative of the overall composition of the hedge fund universe. It is comprised of all eligible hedge fund strategies (performance data is net of underlying manager fees).
Standard Deviation is a measure of the range of a portfolio’s performance, meaning the degree to which it rises above and falls below its average return.
Correlation is a measure of the relationship between two variables (e.g., portfolio returns and the S&P 500® Index).
7
Fund Expenses (unaudited)
As a shareholder of the Fund, you incur two types of costs: (1) transaction costs, including redemption fees or brokerage commissions on the purchase or redemption of Fund shares and (2) ongoing costs, including management fees; distribution (12b-1) fees; and other Fund expenses. This example is intended to help you understand your ongoing costs (in dollars) of investing in the Fund and to compare these costs with the ongoing costs of investing in other mutual funds. The Example is based on an investment of $1,000 invested at the beginning of the period and held for the entire period as indicated below.
Actual Expenses
The table below provides information about actual account values and actual expenses. You may use the information together with the amount you invested, to estimate the expenses that you paid over the period. Simply divide your account value by $1,000 (for example, an $8,600 account value divided by $1,000 = 8.6), then multiply the result by the number under the heading entitled “Expenses Paid During the Six Month Period 11/1/08 to 4/30/09” to estimate the expenses you paid on your account during this period. The Fund will indirectly bear its pro rata share of the expenses incurred by the underlying investments in which the Fund invests. These expenses are not included in the table.
Hypothetical Example for Comparison Purposes
The table below also provides information about hypothetical account values and hypothetical expenses based on the Fund’s actual expense ratio and an assumed annual rate of return of 5% before expenses, which is not the Fund’s actual return. The hypothetical account values and expenses may not be used to estimate the actual ending account balance or expenses you paid for the period. You may use this information to compare the ongoing costs of investing in the Fund and other funds by comparing this 5% hypothetical example with the 5% hypothetical examples that appear in the shareholder reports of other mutual funds. The Fund will indirectly bear its pro rata share of the expenses incurred by the underlying investments in which the Fund invests. These expenses are not included in the table.
8
Fund Expenses (unaudited)(continued)
Please note that the expenses shown in the table are meant to highlight your ongoing costs only and do not reflect any transactional costs such as sales charges or redemption fees. Therefore, the hypothetical example is useful in comparing ongoing costs only, and will not help you determine the relative total costs of owning different funds. In addition, if these transactional costs were included, your costs would have been higher.
| | | | | | | |
| | Beginning
Account
Value
11/1/08 | | Ending
Account
Value
4/30/09 | | Annualized
Expense
Ratios for
the Six
Month Period
11/1/08 to
4/30/09 | | Expenses
Paid During
the Six
Month Period
11/1/08 to
4/30/09† |
| |
| |
| |
| |
|
| Institutional Class | | | | | | | |
| Actual | $1,000.00 | | $1,102.80 | | 1.15% | | $6.00 |
| Hypothetical | | | | | | | |
| (5% return | | | | | | | |
| before expenses) | $1,000.00 | | $1,019.09 | | 1.15% | | $5.76 |
| Investor Class | | | | | | | |
| Actual | $1,000.00 | | $1,102.00 | | 1.40% | | $7.30 |
| Hypothetical | | | | | | | |
| (5% return | | | | | | | |
| before expenses) | $1,000.00 | | $1,017.85 | | 1.40% | | $7.00 |
| |
| † | Expenses are calculated using each share class’ annualized expense ratio, multiplied by the average account value for the period, multiplied by 181/365 (to reflect the one-half year period). |
9
Portfolio Summary (unaudited)
April 30, 2009
PORTFOLIO STATISTICS
Net Assets ($ mil): $3.7
SCHEDULE OF INVESTMENTS SUMMARY TABLE
| | | |
Investments
| | % of
Net Assets
|
| Debt Funds | | 48.8 | % |
| Equity Funds | | 15.8 | |
| Asset Allocation Fund | | 7.7 | |
| Commodity Funds | | 2.4 | |
| Money Market Fund | | 12.8 | |
| | |
| |
| Total Investments | | 87.5 | |
| Other Assets in Excess of Liabilities | | 12.5 | |
| | |
| |
| Net Assets | | 100.0 | % |
| | |
| |
10
Schedule of Investments
April 30, 2009
| | | |
Name of Issuer
| Shares
| | Value
|
| LONG-TERM INVESTMENTS — 74.7% | | | |
| Asset Allocation Fund — 7.7% | | | |
| PowerShares DB G10 | | | |
| Currency Harvest Fund* | 13,731 | | $ 281,211 |
| | | |
|
| Commodity Funds — 2.4% | | | |
| iPath Dow Jones-AIG Commodity | | | |
| Index Total Return ETN* | 993 | | 33,077 |
| PowerShares DB Commodity | | | |
| Index Tracking Fund* | 2,858 | | 57,103 |
| | | |
|
| Total Commodity Funds | | | 90,180 |
| | | |
|
| Debt Funds — 48.8% | | | |
| iShares Barclays Aggregate Bond Fund | 7,710 | | 783,644 |
| iShares Barclays US Treasury Inflation | | | |
| Protected Securities Fund | 582 | | 58,456 |
| iShares iBoxx $ High Yield | | | |
| Corporate Bond Fund | 3,298 | | 251,538 |
| iShares JPMorgan USD Emerging | | | |
| Markets Bond Fund | 51 | | 4,673 |
| PowerShares Emerging Market | | | |
| Sovereign Debt Portfolio | 169 | | 3,863 |
| SPDR Barclays Capital 1-3 Month T-Bill ETF | 1,965 | | 90,154 |
| SPDR Barclays Capital Aggregate Bond ETF | 272 | | 14,840 |
| SPDR Barclays Capital High Yield Bond ETF | 3,679 | | 121,812 |
| SPDR Barclays Capital International | | | |
| Treasury Bond ETF | 557 | | 28,747 |
| Vanguard Short-Term Bond ETF | 1,669 | | 131,851 |
| Vanguard Total Bond Market ETF | 3,805 | | 293,860 |
| | | |
|
| Total Debt Funds | | | 1,783,438 |
| | | |
|
See notes to financial statements.
11
Schedule of Investments (continued)
April 30, 2009
| | | |
Name of Issuer
| Shares
| | Value
|
| LONG-TERM INVESTMENTS — 74.7% (continued) | | | |
| Equity Funds — 15.8% | | | |
| iShares MSCI Emerging Markets Index Fund | 16,733 | | $479,400 |
| Vanguard Emerging Markets ETF | 3,501 | | 96,873 |
| | | |
|
| Total Equity Funds | | | 576,273 |
| | | |
|
| Total Long-Term Investments — 74.7% | | | |
| (Cost $2,636,511) | | | 2,731,102 |
| | | |
|
| Short-Term Investments — 12.8% | | | |
| Money Market Fund — 12.8% | | | |
| Dreyfus Treasury & Agency Cash | | | |
| Management — Institutional Class, 5.29%† | | | |
| (Cost $469,041) | | | 469,041 |
| | | |
|
| Total Investments — 87.5% (Cost $3,105,552) | | | $3,200,143 |
| Other Assets in Excess | | | |
| of Liabilities — 12.5% (a) | | | 456,244 |
| | | |
|
| |
| Net Assets — 100.0% | | | $3,656,387 |
| | | |
|
| |
| * | Non-income producing |
| | |
| † | Yield at 4/30/09 |
| | |
| (a) | Other assets in excess of liabilities includes net unrealized depreciation on swaps. |
ETN — Exchange Traded Notes
ETF — Exchange Traded Fund
See notes to financial statements.
12
Statement of Assets and Liabilities
April 30, 2009
| | |
| Assets | | |
| Investments, at value (cost $3,105,552) | $3,200,143 | |
| Cash collateral for swaps | 440,000 | |
| Cash | 22,293 | |
| Dividends and interest receivable | 1,821 | |
| Receivable for capital shares sold | 45,000 | |
| Due from Advisor | 100,086 | |
| Unrealized appreciation on swaps | 47,050 | |
| Prepaid expenses | 11,304 | |
| |
| |
| Total assets | 3,867,697 | |
| |
| |
| |
| Liabilities | | |
| Unrealized depreciation on swaps | 70,501 | |
| Payable for investments purchased | 17,502 | |
| Payable for capital shares repurchased | 37 | |
| Advisory fees payable | 5,199 | |
| Compliance fees payable | 3,498 | |
| Accrued expenses | 114,573 | |
| |
| |
| Total liabilities | 211,310 | |
| |
| |
| Net Assets | $3,656,387 | |
| |
| |
| |
| Composition of Net Assets | | |
| Paid-in capital | $3,436,725 | |
| Undistributed net investment income | 22,980 | |
| Accumulated net realized gain from | | |
| investments and swaps | 125,542 | |
| Net unrealized appreciation on investments | 94,591 | |
| Net unrealized depreciation on swaps | (23,451 | ) |
| |
| |
| Net Assets | $3,656,387 | |
| |
| |
NET ASSET VALUE PER SHARE
($0.001 par value common stock, unlimited authorized shares)
| | | |
Class
| Net Assets
| Shares
Outstanding
| Net Asset
Value
|
| Institutional | $3,019,435 | 323,275 | $9.34 |
| Investor | $ 636,952 | 68,405 | $9.31 |
See notes to financial statements.
13
Statement of Operations
For the Period June 30, 2008* to April 30, 2009
| | | | |
| Investment Income | | | | |
| Dividend income | | | $ 57,610 | |
| Interest income | | | 355 | |
| | | |
| |
| Total investment income | | | 57,965 | |
| | | |
| |
| |
| Expenses | | | | |
| Professional fees | $ 157,100 | | | |
| Transfer Agent fees | 53,789 | | | |
| Administrative and Accounting fees | 43,931 | | | |
| Insurance fees | 36,529 | | | |
| Blue sky fees | 32,002 | | | |
| Shareholder reporting fees | 32,000 | | | |
| Advisory fees | 14,269 | | | |
| Registration fees | 10,607 | | | |
| Trustee fees and expenses | 6,186 | | | |
| Compliance fees | 4,998 | | | |
| Custodian fees | 1,130 | | | |
| Distribution fee- Investor class | 337 | | | |
| Miscellaneous fees | 520 | | | |
| |
| | | |
| Total expenses before reimbursements | 393,398 | | | |
| Less: expenses reimbursed by Advisor | (375,762 | ) | | |
| |
| | | |
| Net expenses | | | 17,636 | |
| | | |
| |
| Net investment income | | | 40,329 | |
| | | |
| |
| |
| Realized and Unrealized Gain (Loss) on | | | | |
| Investments and Swaps | | | | |
| Net realized gain (loss) on: | | | | |
| Investments | | | 149,382 | |
| Swaps | | | (16,627 | ) |
| Distributions of realized gains by other | | | | |
| investment companies | | | 356 | |
| Net unrealized appreciation (depreciation) on: | | | | |
| Investments | | | 94,591 | |
| Swaps | | | (23,451 | ) |
| | | |
| |
| Net realized and unrealized gain from | | | | |
| investments and swaps | | | 204,251 | |
| | | |
| |
| Net Increase in Net Assets Resulting | | | | |
| from Operations | | | $244,580 | |
| | | |
| |
| |
| * | Commencement of operations |
See notes to financial statements.
14
Statement of Changes in Net Assets
For the Period June 30, 2008 (commencement of operations) to April 30, 2009
| | |
| Increase (Decrease) in Net Assets from Operations | | |
| Net investment income | $ 40,329 | |
| Net realized gain from investments and swaps | 132,755 | |
| Distributions of realized gains by other | | |
| investment companies | 356 | |
| Net unrealized appreciation on investments and swaps | 71,140 | |
| |
| |
| Net increase in net assets resulting from operations | 244,580 | |
| |
| |
| Dividends and Distributions to Shareholders from | | |
| Net investment income | | |
| Institutional Class | (23,704 | ) |
| Investor Class | (1,597 | ) |
| |
| |
| Total distributions to shareholders | (25,301 | ) |
| |
| |
| Capital Share Transactions | | |
| Institutional Class* | | |
| Proceeds from shares sold | 2,732,766 | |
| Cost of shares repurchased | (46,317 | ) |
| Proceeds from dividends reinvested | 23,704 | |
| |
| |
| Net increase from capital share transactions | 2,710,153 | |
| |
| |
| Investor Class* | | |
| Proceeds from shares sold | 625,395 | |
| Cost of shares repurchased | (37 | ) |
| Proceeds from dividends reinvested | 1,597 | |
| |
| |
| Net increase from capital share transactions | 626,955 | |
| |
| |
| Total increase in net assets | 3,556,387 | |
| |
| |
| Net Assets | | |
| Beginning of period | 100,000 | |
| |
| |
| End of period (including undistributed net | | |
| investment income of $22,980) | $3,656,387 | |
| |
| |
| Changes in Shares Outstanding | | |
| Institutional Class | | |
| Shares outstanding, beginning of period | 10,000 | |
| Shares sold | 315,719 | |
| Shares repurchased | (5,069 | ) |
| Shares issued for dividends reinvested | 2,625 | |
| |
| |
| Shares outstanding, end of period | 323,275 | |
| |
| |
| Investor Class | | |
| Shares outstanding, beginning of period | — | |
| Shares sold | 68,231 | |
| Shares repurchased | (4 | ) |
| Shares issued for dividends reinvested | 178 | |
| |
| |
| Shares outstanding, end of period | 68,405 | |
| |
| |
| * | Commencement of operations for the Institutional and Investor share classes was June 30, 2008 and July 23, 2008, respectively. |
See notes to financial statements.
15
Financial Highlights
Selected Data for a Share of Capital Stock Outstanding
INSTITUTIONAL CLASS
For the Period June 30, 20081 to April 30, 2009
| | |
| Net asset value, beginning of period | $10.00 | |
| |
| |
| |
| Income from Investment Operations | | |
| Net investment income2 | 0.20 | |
| Net realized and unrealized loss on investments | | |
| and swaps3 | (0.77 | ) |
| Distributions of realized gains by other | | |
| investment companies4 | — | |
| |
| |
| Net decrease in net assets resulting | | |
| from operations3 | (0.57 | ) |
| Less distributions to shareholders | (0.09 | ) |
| |
| |
| Net asset value, end of period | $ 9.34 | |
| |
| |
| |
| Total Return | | |
| Total investment return based on net | | |
| asset value5 | (5.71 | )% |
| |
| Ratios/Supplemental Data | | |
| Net assets, end of period (000’s omitted) | $3,019 | |
| Ratio to average net assets of: | | |
| Expenses net of reimbursements6 | 1.15 | % |
| Expenses before reimbursements6 | 24.41 | % |
| Net investment income6 | 2.77 | % |
| Portfolio turnover rate7 | 182 | % |
(footnotes on following page)
See notes to financial statements.
16
Financial Highlights (continued)
Selected Data for a Share of Capital Stock Outstanding
INVESTOR CLASS
For the Period July 23, 20081 to April 30, 2009
| | |
| Net asset value, beginning of period | $10.00 | |
| |
| |
| |
| Income from Investment Operations | | |
| Net investment income2 | 0.11 | |
| Net realized and unrealized loss on | | |
| investments and swaps3 | (0.70 | ) |
| Distributions of realized gains by other | | |
| investment companies4 | — | |
| |
| |
| Net decrease in net assets resulting | | |
| from operations3 | (0.59 | ) |
| Less distributions to shareholders | (0.10 | ) |
| |
| |
| Net asset value, end of period | $ 9.31 | |
| |
| |
| |
| Total Return | | |
| Total investment return based on | | |
| net asset value5 | (5.89 | )% |
| |
| Ratios/Supplemental Data | | |
| Net assets, end of period (000’s omitted) | $ 637 | |
| Ratio to average net assets of: | | |
| Expenses net of reimbursements6 | 1.40 | % |
| Expenses before reimbursements6 | 44.26 | % |
| Net investment income6 | 1.82 | % |
| Portfolio turnover rate7 | 182 | % |
| 1 | Commencement of operations |
| |
| 2 | Based on average shares outstanding |
| |
| 3 | Due to the timing of sales and repurchases of capital shares, the net realized and unrealized gain (loss) per share is not in accord with the Fund’s change in net realized and unrealized gain (loss) on investment transactions for the period. |
| |
| 4 | Represents less than $0.005 |
| |
| 5 | Total investment return is calculated assuming an initial investment made at the net asset value at the beginning of the period, reinvestment of all dividends and distributions at net asset value during the period and redemption on the last day of the period. The total return would have been lower if organizational and offering costs had not been paid by the Advisor (see Note 4). |
| |
| 6 | Annualized |
| |
| 7 | Portfolio turnover rate is not annualized. |
See notes to financial statements.
17
Notes to Financial Statements
April 30, 2009
1. ORGANIZATION
IQ ALPHA Hedge Strategy Fund (the “Fund”) is a series of the IndexIQ Trust (the “Trust”) which is a statutory trust organized under Delaware law on February 20, 2008. The Fund commenced operations on June 30, 2008. The Fund is a non-diversified, open-end, management investment company, as defined by the Investment Company Act of 1940, as amended (the “1940 Act”). The Fund offers two classes of shares: Institutional Class and Investor Class. Both classes have equal rights and voting privileges, except in matters affecting a single class. The Investor Class has a distribution plan in place. The Institutional Class and Investor Class commenced operations on June 30, 2008 and July 23, 2008, respectively.
The Fund’s investment objective is to seek to achieve investment results that correspond to the total return (aggregate price and yield performance) of the IQ ALPHA Hedge Index (the “Index”). The objective of the Index is to provide superior returns (“alpha”) relative to the Standard & Poor’s 500® Composite Stock Price Index (the “S&P 500 Index”) with lower volatility than the S&P 500 Index and correlation to the S&P 500 Index that is similar to the correlation between hedge funds (as measured by broad-based hedge fund indexes) and the S&P 500 Index.
2. SIGNIFICANT ACCOUNTING POLICIES
Use of Estimates
The preparation of financial statements in conformity with U.S. Generally Accepted Accounting Principles (“U.S. GAAP”) requires management to make certain estimates and assumptions that affect the reported amounts of assets and liabilities and disclosure of contingent assets and liabilities at the date of the financial statements and reported amounts of increases and decreases in the net assets from operations during the reporting period. Actual results could differ from those estimates. The following is a summary of significant accounting policies followed by the Fund:
Investment Valuation
The Net Asset Value (“NAV”) is determined as of the close of trading (generally, 4:00 PM Eastern Time) on each day the New York Stock Exchange (“NYSE”) is open for trading. NAV per share is calculated by dividing a Fund’s net assets by the number of Fund shares outstanding. Securities and investment funds traded on any recognized national or foreign stock exchange are valued at the last quoted sale price, or if no sale price is available, at the bid price. Securities not listed on a national or foreign stock exchange may be valued on the basis of prices furnished by
18
Notes to Financial Statements (continued)
April 30, 2009
approved pricing services or at the closing bid price on the over-the-counter market.
If market quotations are not readily available, or if IndexIQ Advisors LLC (the “Advisor”) determines that a quotation of a security does not represent a fair value, then the security is valued at a fair value as determined in good faith using procedures adopted by the Trust’s Board of Trustees (the “Board”). Market prices may not represent fair value, for example, if a security is thinly traded or if an event occurs between the market quotation and the time the security is to be valued and such event is expected to affect the value of the security. The circumstances in which the Board may fair value a security include, among others: the occurrence of events that are significant to a particular issuer, such as mergers, restructurings or defaults; the occurrence of events that are significant to an entire market, such as natural disasters in a particular region or government actions; trading restrictions on securities; thinly traded securities; and market events such as trading halts and early market closings. Short-term securities with 60 days or less remaining to maturity are valued using the amortized cost method, which approximates current market value.
In accordance with Financial Accounting Standards Board (“FASB”) Statement of Financial Accounting Standards No. 157, “Fair Value Measurements” (“FAS 157”), fair value is defined as the price that the portfolio would receive to sell an asset or pay to transfer a liability in an orderly transaction between market participants at the measurement date. FAS 157 also establishes a framework for measuring fair value, and a three-level hierarchy for fair value measurements based upon the transparency of inputs to the valuation of an asset or liability. Inputs may be observable or unobservable and refer broadly to the assumptions that market participants would use in pricing the asset or liability. Observable inputs reflect the assumptions market participants would use in pricing the asset or liability based on market data obtained from sources independent of the portfolio. Unobservable inputs reflect the Fund Management’s own assumptions about the assumptions that market participants would use in valuing the asset or liability based on the best information available in the circumstances. Each investment is assigned a level in the fair value heirarchy based upon the observability of the inputs which are significant to the overall valuation. The three-tier hierarchy of inputs is summarized below:
- Level 1 — quoted prices in active markets for identical investments.
19
Notes to Financial Statements (continued)
April 30, 2009
Level 2 — other significant observable inputs (including quoted prices for similar investments, interest rates, prepayment speeds, credit risk, etc.).
Level 3 — significant unobservable inputs (including the Fund’s own assumptions in determining the fair value of investments).
The following table summarizes the valuation of the Fund’s investments by the above fair value hierarchy levels as of April 30, 2009:
| | | | | | | | |
Investments
| Level 1
| | Level 2
| | Level 3
|
| Investments in Securities | $3,200,143 | | | $ — | | | $ — | |
| Unrealized appreciation on | | | | | | | | |
| total return swaps | — | | | 47,050 | | | — | |
| Unrealized depreciation on | | | | | | | | |
| total return swaps | — | | | (70,501 | ) | | — | |
| |
| | |
| | |
| |
| Total | $3,200,143 | | | $(23,451 | ) | | $ — | |
| |
| | |
| | |
| |
Tax Information and Dividends and Distributions to Shareholders
The Fund intends to qualify as a regulated investment company by complying with the requirements under Subchapter M of the Internal Revenue Code of 1986, as amended, by distributing substantially all of its net investment income and net realized gains to shareholders. Dividends and/or distributions, if any, are paid to shareholders invested in the Fund on the applicable record date. Dividends paid by the Fund with respect to all classes of shares are calculated in the same manner and at the same time, but dividends on Investor Class Shares may be lower than dividends on the Institutional Class Shares as a result of the service and/or distribution fees applicable to Investor Class Shares. Net realized long-term and short-term capital gains will be distributed by the Fund at least annually. The amount of dividends and distributions from net investment income and net realized capital gains are determined in accordance with Federal income tax regulations which may differ from U.S. GAAP. These “book/tax” differences are either considered temporary or permanent in nature. To the extent these differences are permanent in nature, such amounts are reclassified within the components of net assets based on their Federal tax basis treatment; temporary differences do not require reclassification. Dividends and distributions, which exceed earnings and profit for tax purposes are reported as a tax return of capital.
The Fund adopted the provisions of FASB Interpretation No. 48, “Accounting for Uncertainty in Income Taxes” (“FIN 48”). This interpretation prescribes a minimum threshold for financial statement recognition of the benefit of a tax position taken or expected to be taken in a tax return. Foreign taxes are provided for based on the Fund’s understanding of the tax rules and rates that exist in the foreign markets in which it invests. Taxes
20
Notes to Financial Statements (continued)
April 30, 2009
are accrued and applied to net investment income, net realized capital gains and net unrealized appreciation, as applicable, as the income is earned or capital gains are recorded. If applicable, the Fund will recognize interest expenses and penalties related to unrecognized tax benefits in “Other expenses” on the Statement of Operations. Management has evaluated the application of FIN 48 to the Fund and has determined that there is no impact resulting from the adoption of FIN 48 on the Fund’s financial statements. The Fund’s federal tax return is subject to examination by the Internal Revenue Service for a period of three years.
Cash and Cash Equivalents
Cash and cash equivalents consist of highly liquid investments, with maturities of three months or less when acquired.
Security Transactions
Security transactions are accounted for on the trade-date. Realized gains and losses on sales of investment securities are calculated using the identified cost method.
Investment Income
Dividend income is recognized on the ex-dividend date. Interest income is accrued daily. The Fund’s investment income, expenses and unrealized and realized gains and losses are allocated daily. The Fund distributes all or substantially all of its net investment income to shareholders in the form of dividends. Realized gains or losses are recorded whenever the Fund sells securities. Distributions of realized capital gains by underlying funds are recorded as realized capital gains on the ex-date.
Expenses
All of the routine operational, administrative and other ordinary expenses of the Fund are paid by the Fund. These expenses are allocated between the separate classes based on the weighted net asset value of each class. Class level expenses are allocated to each respective class as expenses are incurred.
Indemnification
In the normal course of business, the Fund may enter into contracts that contain a variety of representations which provide general indemnifications for certain liabilities. The Fund’s maximum exposure under these arrangements is unknown. However, since commencement of operations, the Fund has not had any claims or losses pursuant to these contracts and expects the risk of loss to be remote.
21
Notes to Financial Statements (continued)
April 30, 2009
3. INVESTMENT MANAGEMENT AND OTHER AGREEMENTS Advisory Agreement
Under the terms of the Investment Advisory Agreement (the “Advisory Agreement”) the Fund pays the Advisor an advisory fee at an annual rate of 0.95% of the Fund’s average daily net assets. Such fee is accrued daily and paid monthly. The Advisor has retained Mellon Capital Management Corporation (“MCM” and the “Sub-Advisor”), which is unaffiliated with the Advisor, to conduct the day-to-day portfolio management of the Fund. Pursuant to MCM’s sub-advisory agreement, the Advisor pays MCM an annual fee for their services, which is payable monthly.
The Fund and the Advisor have entered into an expense limitation agreement whereby the Advisor has agreed to waive its fee and/or reimburse the Fund to the extent that total annual fund operating expenses (excluding interest, taxes, brokerage fees and commissions, dividends paid on short sales, extraordinary expenses, and distribution and/or service fees, if any) exceed 1.15% of the average daily net assets for the Institutional and Investor Classes of Shares during the Fund’s initial fiscal year ending April 30, 2009. The expense limitation agreement will allow the Advisor to recover reimbursements made to the extent that the Fund’s expense ratios fall below the above indicated expense limitation. The amounts that can be recovered will be limited to the difference between the actual expense ratio and the amount of the expense limitation. Under the terms of the agreement, the Advisor can only recover such amounts for a period of up to three years after the reimbursement. This agreement can be extended year to year thereafter provided such continuance is specifically approved by a majority of the Independent Trustees. For the period ended April 30, 2009, the Advisor waived the fees and reimbursed expenses as follows:
| | | | |
Class
| Fees Waived
and Expense
Reimbursed
| | Year of Expiration
|
| Institutional Class | $317,898 | | | April 30, 2012 |
| Investor Class | 57,864 | | | April 30, 2012 |
| |
| | | |
| | $375,762 | | | |
| |
| | | |
Distribution Agreement (12b-1 Fees)
PFPC Distributors, Inc. (the “Distributor” or “PFPC”) serves as the Fund’s Distributor. The Fund has adopted a Distribution Service Agreement (“Distribution Agreement”) pursuant to Rule 12b-1 under the 1940 Act with respect to the Investor Class shares. The Plan allows for the payment of services related to the distribution and servicing of shares at a rate of up to 0.25% per annum of the average daily net asset value of the Investor Class shares of the Fund.
22
Notes to Financial Statements (continued)
April 30, 2009
Administrator, Custodian and Accounting Agent
The Bank of New York Mellon (in each capacity, the “Administrator,” “Custodian” or “Accounting Agent”) is an affiliate of the Sub-Advisor and serves as the Fund’s Administrator, Custodian and Accounting Agent pursuant to the Fund Administration and Accounting Agreement. The Bank of New York Mellon is a subsidiary of The Bank of New York Mellon Corporation, a financial holding company.
Transfer Agent
PNC Global Investment Servicing, Inc. is an affiliate of the Distributor and serves as the Fund’s Transfer Agent.
4. ORGANIZATIONAL AND OFFERING COSTS
Expenses incurred in connection with organizing and the offering of the Fund were paid by the Advisor. The Fund does not have an obligation to reimburse the Advisor or its affiliates for organizational and offering expenses paid on its behalf.
5. CAPITAL SHARE TRANSACTIONS
As of April 30, 2009, there was an unlimited number of common stock shares at $.001 par value authorized by the Fund. Investors may purchase Investor Class Shares and Institutional Class Shares of the Fund at their net asset value (“NAV”), based on the next calculation of NAV after the order is placed. Transactions in shares of the Fund for the period ended April 30, 2009 are disclosed in detail in the statement of changes in net assets. Neither the Fund nor the Distributor charges a sales charge or other transaction fee to purchase shares, although other institutions may impose transaction fees on shares purchased through them. Redemption requests are processed at the next NAV calculated after the Fund, its Transfer Agent, or your investment representative receives your sell order. If a redemption request is received on a business day prior to 4:00 pm (Eastern Time), proceeds will normally be wired to the shareholder within three business days, provided that the Fund’s Custodian is also open for business. To deter excessive shareholder trading, the Fund imposes a 2% redemption fee on redemptions made within seven calendar days of purchase.
6. FEDERAL INCOME TAX
At April 30, 2009, the cost of investment and net unrealized appreciation/(depreciation) for income tax purposes was as follows:
| | | | | | |
| Tax Cost | | Gross Unrealized
Appreciation | | Gross Unrealized
Depreciation | | Net Unrealized
Appreciation |
| |
| |
| |
|
| $3,115,589 | | $100,891 | | $(16,337) | | $84,554 |
23
Notes to Financial Statements (continued)
April 30, 2009
At April 30, 2009, the components of distributable earnings on a tax-basis were as follows:
| | | | | | |
Undistributed
Net Investment
Income | | Accumulated
Capital
and Other
Gains/(Losses) | | Net Unrealized
Appreciation | | Total
Distributable
Earnings |
| |
| |
| |
|
| $158,558 | | $1 | | $61,103 | | $219,662 |
The tax character of distributions paid from ordinary income during the period ended April 30, 2009 was $25,301.
Capital losses incurred after October 31 (“Post-October Losses”) within the taxable year can be deemed to arise on the first business day of the Funds’ next taxable year. At April 30, 2009, the Fund neither incurred, nor elected to defer, net capital losses.
In order to present undistributed net investment income and accumulated net realized gain from investments and swaps on the Statements of Assets and Liabilities that more closely represent their tax character, certain adjustments have been made to undistributed net investment income, net realized gain on investments and swaps and paid-in capital. These differences are primarily due to the tax treatment of income earned on swaps. These adjustments have no effect on net assets. For the period ended April 30, 2009, the adjustments were as follows:
| | | | |
Undistributed Net
Investment Income | | Accumulated Capital
and Other Gains/(Losses) | | Paid-in Capital |
| |
| |
|
| $7,952 | | $(7,569) | | $(383) |
7. INVESTMENT TRANSACTIONS
Purchases and sales of investments (excluding short-term investments) for the period ended April 30, 2009 were $5,272,972 and $2,764,304, respectively.
8. TOTAL RETURN SWAP AGREEMENTS
The Fund will use total return swaps to increase the exposure of the Fund to any component of the Index or other portfolio investment beyond 100% of the Fund’s net asset investment in such component of the Index or other portfolio investment. The exposure of the Fund will vary but in any event will be less than 200% of its net assets. The payment flows are usually netted against each other, with the difference being paid by one party to the other. In addition, collateral may be pledged or received by the Fund in accordance with the terms of the respective swap agreements to provide value and recourse to the Fund or its counterparty in the event of default or bankruptcy/insolvency. The Fund segregates liquid assets, which may
24
Notes to Financial Statements (continued)
April 30, 2009
include securities, cash or cash equivalents, to cover the Fund’s daily marked-to-market net obligations under outstanding swap agreements. At April 30, 2009, the Fund held cash of $440,000 as collateral for swaps.
Risks may arise as a result of the failure of the counterparty to the swap contract to comply with the terms of the swap contract. The loss incurred by the failure of the counterparty is generally limited to the net interim payment to be received by the Fund, and/or the termination value at the end of the contract. Therefore, the Fund considers the creditworthiness of the counterparty to a swap contract in evaluating potential credit risk. Additionally, risks may arise from unanticipated movements in the value of the underlying securities.
Morgan Stanley acts as the counterparty to all total return swaps listed below. When the notional amount is negative, the Fund pays the total return of the benchmark and receives the annual financing rate and conversely, when the notional amount is positive, the Fund receives the total return of the benchmark and pays the annual financing rate.
The Fund accrues for the interim payments on swaps on a daily basis, with the net amount recorded within unrealized appreciation on swaps and unrealized depreciation on swaps on the statement of assets and liabilities. Once the interim payments are settled in cash, the net amount is recorded as realized gain/loss on swaps on the statement of operations, in addition to any realized gain/loss recorded upon the termination of swaps. Fluctuations in the value of swaps are recorded as a component of net unrealized appreciation/depreciation of swaps on the Statement of Operations.
At April 30, 2009, the outstanding total return swaps were as follows:
| | | | | | | | | |
Total Return Benchmark
| Annual
Financing
Rate
| | Expiration
Date
| | Notional
Amount
| | Unrealized
Appreciation
(Depreciation)
|
| CurrencyShares Euro Trust | 2.64% | | 7/6/2010 | | 123,492 | | | $ 424 | |
| iPath Dow Jones-AIG | | | | | | | | | |
| Commodity Index Total | | | | | | | | | |
| Return ETN | 0.58% | | 7/6/2010 | | (16,422 | ) | | 397 | |
| iShares Barclays 1 - 3 Year | | | | | | | | | |
| Treasury Bond Fund | 0.58% | | 7/6/2010 | | (334,059 | ) | | 531 | |
| iShares Barclays Aggregate | | | | | | | | | |
| Bond Fund | 0.58% | | 7/6/2010 | | (389,180 | ) | | 4,167 | |
| iShares Barclays Credit | | | | | | | | | |
| Bond Fund | 4.74% | | 7/6/2010 | | 9,163 | | | (353 | ) |
| iShares Barclays Short | | | | | | | | | |
| Treasury Bond Fund | 0.58% | | 7/6/2010 | | (85,483 | ) | | (34 | ) |
25
Notes to Financial Statements (continued)
April 30, 2009
| | | | | | | | | |
Total Return Benchmark
| | Annual
Financing
Rate
| | Expiration
Date
| | Notional
Amount
| | Unrealized
Appreciation
(Depreciation)
|
| iShares Barclays US Treasury | | | | | | | | | | |
| Inflated Protected | | | | | | | | | | |
| Securities Fund | | 0.34% | | 7/6/2010 | | (29,027 | ) | | $(17,846 | ) |
| iShares Dow Jones US Real | | | | | | | | | | |
| Estate Index Fund | | 0.22% | | 7/6/2010 | | 61,846 | | | (6,854 | ) |
| iShares iBoxx $ High Yield | | | | | | | | | | |
| Corporate Bond Fund | | 0.58% | | 7/6/2010 | | (124,854 | ) | | 14,572 | |
| iShares iBoxx $ Invest Grade | | | | | | | | | | |
| Corporate Bond Fund | | 0.92% | | 7/6/2010 | | 365,853 | | | (11,989 | ) |
| iShares JPMorgan USD | | | | | | | | | | |
| Emerging Markets | | | | | | | | | | |
| Bond Fund | | 0.58% | | 7/6/2010 | | (2,382 | ) | | 122 | |
| iShares MSCI EAFE | | | | | | | | | | |
| Index Fund | | 0.58% | | 7/6/2010 | | 148,565 | | | (780 | ) |
| iShares MSCI Emerging | | | | | | | | | | |
| Markets Index | | 0.58% | | 7/6/2010 | | (253,182 | ) | | 10,720 | |
| iShares Russell 2000 Index | | | | | | | | | | |
| Fund | | 2.32% | | 7/6/2010 | | 66,375 | | | (9,071 | ) |
| PowerShares DB | | | | | | | | | | |
| Commodity Index | | | | | | | | | | |
| Tracking Fund | | 0.58% | | 7/6/2010 | | (28,372 | ) | | (1,435 | ) |
| PowerShares DB G10 | | | | | | | | | | |
| Currency Harvest Fund | | 0.58% | | 7/6/2010 | | (139,653 | ) | | 2,835 | |
| PowerShares Emerging | | | | | | | | | | |
| Markets Sovereign | | | | | | | | | | |
| Debt ETF | | 0.58% | | 7/6/2010 | | (1,920 | ) | | 119 | |
| SPDR Barclays Capital | | | | | | | | | | |
| 1-3 Month T-Bill Fund | | 0.58% | | 7/6/2010 | | (44,779 | ) | | (28 | ) |
| SPDR Barclays Capital | | | | | | | | | | |
| Aggregate Bond ETF | | 0.58% | | 7/6/2010 | | (7,366 | ) | | (3 | ) |
| SPDR Barclays Capital | | | | | | | | | | |
| High Yield Bond ETF | | 0.58% | | 7/6/2010 | | (60,492 | ) | | 5,064 | |
| SPDR Barclays Capital | | | | | | | | | | |
| International Treasury | | | | | | | | | | |
| Bond | | 0.58% | | 7/6/2010 | | (14,244 | ) | | 57 | |
| SPDR DJ Wilshire REIT | | 0.22% | | 7/6/2010 | | 32,690 | | | (3,819 | ) |
| Vanguard Emerging | | | | | | | | | | |
| Market ETF | | 0.58% | | 7/6/2010 | | 48,090 | | | 7,431 | |
| Vanguard Europe | | | | | | | | | | |
| Pacific ETF | | 0.22% | | 7/6/2010 | | 12,788 | | | (470 | ) |
| Vanguard REIT ETF | | 0.69% | | 7/6/2010 | | 64,508 | | | (17,819 | ) |
| Vanguard Short-Term | | | | | | | | | | |
| Bond ETF | | 0.58% | | 7/6/2010 | | (65,412 | ) | | 481 | |
| Vanguard Total Bond | | | | | | | | | | |
| Market ETF | | 0.58% | | 7/6/2010 | | (145,965 | ) | | 130 | |
| | | | | | | | | |
| |
| Net Unrealized | | | | | | | | | | |
| |
| Depreciation | | | | | | | | | $(23,451 | ) |
| | | | | | | | | |
| |
26
Notes to Financial Statements (continued)
April 30, 2009
9. NEW ACCOUNTING PRONOUNCEMENTS
On March 19, 2008, the FASB released Statement of Financial Accounting Standards No. 161, “Disclosures about Derivative Instruments and Hedging Activities” (“FAS 161”). FAS 161 requires qualitative disclosures about objectives and strategies for using derivatives, quantitative disclosures about fair value amounts of and gains and losses on derivative instruments, and disclosures about credit-risk-related contingent features in derivative agreements. The application of FAS 161 is required for fiscal years and interim periods beginning after November 15, 2008. At this time, management has evaluated the implications of FAS 161 and believes the adoption of FAS 161 will have no material impact on the Fund’s financial statements.
The FASB Staff Position No. FAS 157-4, “Determining Fair Value When the Volume and Level of Activity for the Asset or Liability Have Significantly Decreased and Identifying Transactions That Are Not Orderly” (“FSP 157-4”), provides additional guidance for estimating fair value in accordance with FASB Statement No. 157, Fair Value Measurements, when the volume and level of activity for the asset or liability have significantly decreased. FSP 157-4 also includes guidance on identifying circumstances that indicate a transaction is not orderly and outlines additional disclosure based on investment types. FSP 157-4 shall be effective for interim and annual reporting periods ending after June 15, 2009. Management is evaluating the implications of FSP 157-4 and its impact on the financial statements has not yet been determined.
10. INVESTMENT RISKS
The Fund is subject to the principal risks described below, some or all of these risks may adversely affect the Fund’s NAV, trading price, yield, total return and ability to meet its investment objective. As with any investment, an investment in the Fund could result in a loss or the performance of the Fund could be inferior to that of other investments.
Fund of Funds Risk
The Fund’s investment performance, because it is a fund of funds, depends on the investment performance of the underlying ETFs in which it invests. An investment in the Fund is subject to the risks associated with the underlying ETFs that comprise the Fund’s Underlying Index. The Fund will indirectly pay a proportional share of the asset-based fees, if any, of the underlying ETFs in which it invests.
27
Notes to Financial Statements (continued)
April 30, 2009
Exchange Traded Vehicle Risk
Unlike an investment in a mutual fund, the value of the Fund’s investment in ETFs, exchange-traded vehicles and exchange-traded notes is based on stock market prices and the Fund could lose money due to stock market developments, the failure of an active trading market to develop or exchange trading halts or de-listings. Federal law prohibits the Fund from acquiring investment company shares, including shares of ETFs, in excess of specific thresholds unless exempted by rule, regulation or exemptive order. These prohibitions may prevent the Fund from allocating its investments to ETFs in an optimal manner.
Index Risk
The Index is new and has limited historical performance data that is not predictive of future results. The Index may not be successful in replicating the performance of its target strategies. There is a risk that hedge fund return data provided by third party hedge fund data providers may be inaccurate or may not accurately reflect hedge fund returns due to survivorship bias, self-reporting bias or other biases. In constructing the underlying strategies of the Index, the Advisor may not be successful in replicating the returns of the Hedge Fund Indexes. In addition, the Index may not achieve its objective of producing superior returns to the S&P 500 Index with lower volatility than the S&P 500 Index and a correlation to the S&P 500 Index that is similar to the correlation between the performance of hedge funds (as measured by broad-based hedge fund indexes) and the S&P 500 Index.
Total Return Swaps Risk
Total return swaps give the Fund the right to receive the appreciation in the value of a specified security, index or other instrument in return for a fee paid to the counterparty, which will typically be an agreed upon interest rate. Total return swaps can also be used to replicate an exposure to a short position in an asset class where the Fund has the right to receive the depreciation in value of a specified security, index or other instrument (“inverse swaps”). If the underlying asset in a total return swap declines in value (or increases in value, if an inverse swap) over the term of the swap, the Fund may also be required to pay the dollar value of that decline (or increase, if an inverse swap) to the counterparty. The Fund intends to use total return swaps in several ways to replicate the performance of the Index. Consequently, the performance of the Fund’s total return swaps will be a significant component of the Fund’s performance. Risks may arise as a result of the failure of the counterparty to the swap contract to comply with the terms of the swap contract. Therefore the Fund considers the
28
Notes to Financial Statements (continued)
April 30, 2009
creditworthiness of each counterparty to a swap contract in evaluating potential credit risk. Additionally, risks may arise from unanticipated movements in interest rates or in the value of the underlying securities.
11. UNAUDITED TAX INFORMATION
Qualified Dividend Income - Certain dividends paid by the Fund may be subject to a maximum tax rate of 15%, as provided for by the Jobs and Growth Tax Relief Reconciliation Act of 2003. The percentage of ordinary income distributions for the fiscal year ended April 30, 2009, taxed at a maximum rate of 15% is 5%.
12. SUBSEQUENT EVENT
On June 18, 2009 the Board approved the termination of the distribution agreement with PFPC. Further, the Board approved a distribution agreement with ALPS Distributors, Inc. (“ALPS”) to serve as the Fund’s distributor. The anticipated effective date of the conversion of distributors from PFPC to ALPS is July 13, 2009.
29
Report of Independent Registered Public Accounting Firm
To the Board of Trustees of IndexIQ Trust and Shareholders
of IQ ALPHA Hedge Strategy Fund:
We have audited the accompanying statement of assets and liabilities, including the schedule of investments, of IQ ALPHA Hedge Strategy Fund (one of the funds constituting the IndexIQ Trust) (the “Fund”), as of April 30, 2009, and the related statements of operations and the statement of changes in net assets for the period from June 30, 2008 (commencement of operations) to April 30, 2009, and the financial highlights for each of the periods therein. These financial statements and financial highlights are the responsibility of the Fund’s management. Our responsibility is to express an opinion on these financial statements and financial highlights based on our audit.
We conducted our audit in accordance with the standards of the Public Company Accounting Oversight Board (United States). Those standards require that we plan and perform the audit to obtain reasonable assurance about whether the financial statements and financial highlights are free of material misstatement. We were not engaged to perform an audit of the Fund’s internal control over financial reporting. Our audit included consideration of internal control over financial reporting as a basis for designing audit procedures that are appropriate in the circumstances, but not for the purpose of expressing an opinion on the effectiveness of the Fund’s internal control over financial reporting. Accordingly, we express no such opinion. An audit also includes examining, on a test basis, evidence supporting the amounts and disclosures in the financial statements and financial highlights, assessing the accounting principles used and significant estimates made by management, and evaluating the overall financial statement presentation. Our procedures included confirmation of securities owned as of April 30, 2009, by correspondence with the custodian and brokers or by other appropriate auditing procedures where replies from brokers were not received. We believe that our audit provides a reasonable basis for our opinion.
In our opinion, the financial statements and financial highlights referred to above present fairly, in all material respects, the financial position of IQ ALPHA Hedge Strategy Fund of IndexIQ Trust at April 30, 2009 and the results of its operations and changes in its net assets for the period from June 30, 2008 (commencement of operations) to April 30, 2009, and the financial highlights for each of the indicated periods, in conformity with U.S. generally accepted accounting principles.
New York, New York
June 26, 2009
30
Board of Trustees and Officers (unaudited)
April 30, 2009
The business of the Trust is managed under the direction of the Trust’s Board of Trustees. The Board elects the officers of the Trust who are responsible for administering the Trust’s day-to-day operations. Each Trustee serves until his or her successor is duly elected or appointed and qualified.
The name, age, address and principal occupations during the past five years for each Trustee and officer of the Trust is set forth below, along with the other public directorships held by the Trustees.
| | | | |
Independent Trustees
|
Name and
Year of Birth1 | Position(s)
Held with
Trust | Term of
Office and
Length of
Time Served2 | Principal Occupation(s)
During Past 5 Years | Other
Directorships
Held by
Trustee |
|
| Reena | Trustee | Since | Deputy Dean, McDonough | FBR Funds |
| Aggarwal | | August | School of Business, | (10 portfolios) |
| 1958 | | 2008 | Georgetown University (2006 | |
| | | | to 2008); Visiting Professor of | |
| | | | Finance, Sloan School of | |
| | | | Management, MIT (2005- | |
| | | | 2006); Interim Dean, | |
| | | | McDonough School of | |
| | | | Business, Georgetown | |
| | | | University (2004- 2005); | |
| | | | Stallkamp Faculty Fellow and | |
| | | | Professor of Finance, | |
| | | | McDonough School of | |
| | | | Business, Georgetown | |
| | | | University (2003- Present) | |
| |
| Gene Chao | Trustee | Since | Vice President — Strategic | None |
| 1970 | | August | Services, Dimension Data, | |
| | | 2008 | Americas (2007 to present); | |
| | | | Senior Vice President — | |
| | | | Strategic Outsourcing, France | |
| | | | Telecom Americas (2004- | |
| | | | 2007); Managing Director — | |
| | | | Business Consulting, Xansa, | |
| | | | North America (2003-2004) | |
31
Board of Trustees and Officers (unaudited)(continued)
April 30, 2009
| | | |
Interested Trustee3
|
Name and
Age | Position(s)
Held with
Trust | Term of
Office and
Length of
Time Served | Principal Occupation(s)
During Past 5 Years |
|
| Adam S. | Chairman | Since | Chairman, Trustee, President and Principal |
| Patti | and | November | Executive, IndexIQ Trust (2008 to present); |
| 1970 | Trustee | 2008 | Chief Executive Officer, the Advisor (2007 to |
| | | | present); Chief Executive Officer, Index IQ |
| | President | Since | (2006 to present); Associate Publisher, Time |
| | and Principal | July | Inc. (2006); Executive Director, Time Inc. |
| | Executive | 2008 | (2005); Director, Time Inc. (2003 to 2004) |
| | | | |
Officers
The officers of the Trust not named above are:
|
Name and
Age | Position(s)
Held with
Trust | Term of
Office and
Length of
Time Served | Principal Occupation(s)
During Past 5 Years |
|
| Gregory D. | Secretary | Since | Chief Compliance Officer, the Advisor (2008 |
| Bassuk | | July | to present); Secretary, IndexIQ Trust (2008 to |
| 1972 | | 2008 | present); Chairman and Trustee, Index IQ |
| | | | ETF Trust (July 2008 to November 2008); |
| | | | Chairman and Trustee, IndexIQ Trust |
| | | | (February 2008 to November 2008); Chief |
| | | | Operating Officer, the Advisor (2007 to |
| | | | present); Chief Operating Officer, IndexIQ |
| | | | (2006 to present); Director, Time Inc. (2004 |
| | | | to 2006); Managing Director, McGovern |
| | | | Capital (2003 to 2004) |
| |
| David Fogel | Treasurer, | Since | Treasurer, Principal Financial Officer and |
| 1971 | Principal | October | Chief Compliance Officer, IndexIQ Trust |
| | Financial | 2008 | (2008 to present); Executive Vice President, |
| | Officer and | | Financial Development HoldCo LLC, d/b/a |
| | Chief | | “IndexIQ” (2006 to present); Vice President, |
| | Compliance | | Groton Partners LLC (2005 to 2006); |
| | Officer | | Principal, Circle Peak Capital LLC (2003 to |
| | | | 2005) |
| | | | |
| 1 | The address of each Trustee or officer is c/o IndexIQ, 800 Westchester Avenue, Suite N-611, Rye Brook, New York 10573. |
| |
| 2 | Trustees and Officers serve until their successors are duly elected and qualified. |
| |
| 3 | Mr. Patti is an “interested person” of the Trust (as that term is defined in the 1940 Act) because of his affiliations with the Advisor. |
32
Investment Advisor
IndexIQ Advisors LLC
800 Westchester Avenue, Suite N-611
Rye Brook, NY 10573
Sub-Adviser
Mellon Capital Management Corp.
50 Fremont Street, Suite 3900
San Francisco, CA 94105
Custodian/Fund Administrator
The Bank of New York Mellon
One Wall Street
New York, NY 10286
Legal Counsel
Katten Muchin Rosenman, LLP
575 Madison Avenue
New York, New York 10022
Independent Registered Public Accounting Firm
Ernst & Young LLP
5 Times Square
New York, NY 10036
Distributor
PFPC Distributors, Inc.
760 Moore Road
King of Prussia, PA 19406
Transfer Agent
PNC Global Investment Servicing, Inc.
301 Bellevue Parkway
Wilmington, DE 19809
33
(This page intentionally left blank.)
IQ ALPHA Hedge Strategy Fund
c/o IndexIQ
800 Westchester Avenue, Suite N-611
Rye Brook, NY 10573
1-888-934-0777
ANNUAL REPORT | APRIL 30, 2009
IndexIQ Trust
IQ ALPHA
Hedge Strategy Fund
Item 2. Code of Ethics.
a). The Registrant has adopted a code of ethics that applies to the Registrant’s Principal Executive Officer, Principal Financial Officer or persons performing similar functions.
b). There have not been any changes to the Code of Ethics.
c). Not Applicable
d). During the period, Registrant granted no waivers from the provisions of its code of ethics that applies to the Registrant's Principal Executive Officer, Principal Financial Officer or persons performing similar functions.
e). Not Applicable
f). Attached
Item 3. Audit Committee Financial Expert.
a). The Registrant’s Board of Trustees has one audit committee financial expert serving on its audit committee, an “independent” Trustee, Reena Aggarwal. Under applicable securities laws, a person who is determined to be an audit committee financial expert will not be deemed an “expert” for any purpose, including without limitation for the purposes of Section 11 of the Securities Act of 1933, as a result of being designated or identified as an audit committee financial expert. The designation or identification of a person as an audit committee financial expert does not impose on such person any duties, obligations, or liabilities that are greater than the duties, obligations, and liabilities imposed on such person as a member of the audit committee and Board of Trustees in the absence of such designation or identification.
Item 4. Principal Accountant Fees and Services.
a). Audit Fees: the aggregate fees billed in each of the last two fiscal years for professional services rendered by the principal accountant for the audit are as follows:
2009: $28,000
2008: N/A
b). Audit-Related Fees: the aggregate fees billed in each of the last two fiscal years for assurance and related services by the principal accountant that are reasonably related to the performance of the audit of the Registrant’s financial statements and are not reported under paragraph (a) of this item are as follows:
2009: $4,500
2008: N/A
c). Tax Fees, the aggregate fees billed in each of the previous last two fiscal years for professional services rendered by the principal accountant for tax compliance, tax advice, and tax planning are as follows:
2009: $0
2008: N/A
d). All Other Fees, the aggregate fees billed in each of the last two fiscal years for products and services provided by the principal accountant, other than the services reported in paragraphs (a) and (c) of this Item are as follows:
2009: $0
2008: N/A
e) Audit Committee Pre-Approval Policies and Procedures.
(i) Per Rule 2-01(c)(7)(A), the Audit Committee pre-approves all of the Audit, Audit-Related, Tax and Other Fees of the Registrant.
(ii) 100% of services described in each of Items 4(b) through (d) were approved by the audit committee pursuant to paragraph (c)(7)(A) of Rule 2-01 of Regulation S-X.
(f) No response required.
(g) The aggregate non-audit fees billed by the Registrant's accountant for services rendered to the Funds, the Advisor or any entity controlling, controlled by, or under common control with the Advisor that provides ongoing services to the Registrant (except for any sub-advisor whose role is primarily portfolio management and is subcontracted with or overseen by another investment advisor) that directly impacted the Funds for the period from June 30, 2008 to April 30, 2009 were $32,500.
(h) Not Applicable
Item 5. Audit Committee of Listed Registrants.
(a) The Fund has a designated Audit Committee in accordance with Section 3(a)(58)(A) of the Securities and Exchange Act of 1934 (the “Exchange Act”) and the members of such committee are Reena Aggarwal and Gene Chao.
(b) Not applicable.
Item 6. Schedule of Investments.
(a) Schedule is included as part of the report to shareholders filed under Item 1 of this Form.
(b) Not applicable.
Item 7. Disclosure of Proxy Voting Policies and Procedures for Closed-End Management Investment Companies.
Not applicable.
Item 8. Portfolio Managers of Closed-End Management Investment Companies.
Not applicable.
Item 9. Purchases of Equity Securities by Closed-End Management Investment Company & Affiliated Purchasers.
Not applicable.
Item 10. Submission of Matters to a Vote of Security Holders.
Not applicable.
Item 11. Controls and Procedures.
| |
| (a) | The Principal Executive Officer and Principal Financial Officer have evaluated the Registrant's disclosure controls and procedures within 90 days of the filing date of this report and have concluded that these controls and procedures are effective. |
| | |
| (b) | There were no significant changes in the Registrant's internal controls over financial reporting or in other factors that could significantly affect these controls subsequent to the date of their evaluation. |
Item 12. Exhibits.
(a) Any code of ethics, or amendment thereto, that is the subject of the disclosure required by Item 2, to the extent that the Registrant intends to satisfy the Item 2 requirements through filing of an exhibit: Attached
(b) Separate certifications for each Principal Executive Officer and Principal Financial Officer of the Registrant as required by Rule 30a-2(a) under the 1940 Act (17CFR 270.30a -(a)).
SIGNATURES
Pursuant to the requirements of the Securities Exchange Act of 1934 and the Investment Company Act of 1940, the Registrant has duly caused this report to be signed on its behalf by the undersigned, thereunto duly authorized.
Registrant: IndexIQ Trust
By: /s/ Adam S. Patti
Adam S. Patti, Principal Executive Officer
Date: June 26, 2009
Pursuant to the requirements of the Securities Exchange Act of 1934 and the Investment Company Act of 1940, this report has been signed below by the following persons on behalf of the Registrant and in the capacities and on the dates indicated.
Registrant: IndexIQ Trust
By: /s/ Adam S. Patti
Adam S. Patti, Principal Executive Officer
Date: June 26, 2009
By: /s/ David L. Fogel
David L. Fogel, Principal Financial Officer
Date: June 26, 2009