UNITED STATES
SECURITIES AND EXCHANGE COMMISSION
Washington, D.C. 20549
FORM N-CSR
CERTIFIED SHAREHOLDER REPORT OF REGISTERED MANAGEMENT INVESTMENT COMPANIES
Investment Company Act file number: 811-22185
IndexIQ Trust
(Exact name of registrant as specified in charter)
800 Westchester Ave., Suite N-611
Rye Brook, NY 10573
(Address of principal executive offices) (Zip code)
Adam S. Patti
IndexIQ Advisors LLC
800 Westchester Ave., Suite N-611
Rye Brook, NY 10573
(Name and address of agent for service)
Registrant's telephone number, including area code: 1-888-934-0777
Date of fiscal year end: April 30
Date of reporting period: April 30, 2013
Form N-CSR is to be used by management investment companies to file reports with the Commission not later than 10 days after the transmission to stockholders of any report that is required to be transmitted to stockholders under Rule 30e-1 under the Investment Company Act of 1940 (17 CFR 270.30e-1). The Commission may use the information provided on Form N-CSR in its regulatory, disclosure review, inspection, and policymaking roles.
A registrant is required to disclose the information specified by Form N-CSR, and the Commission will make this information public. A registrant is not required to respond to the collection of information contained in Form N-CSR unless the Form displays a currently valid Office of Management and Budget ("OMB") control number. Please direct comments concerning the accuracy of the information collection burden estimate and any suggestions for reducing the burden to Secretary, Securities and Exchange Commission, 100 F Street, NE, Washington, DC 20549. The OMB has reviewed this collection of information under the clearance requirements of 44 U.S.C. § 3507.
Item 1. Reports to Stockholders.
The Report to Shareholders is attached herewith.
ANNUAL REPORT | APRIL 30, 2013
IndexIQ Trust
IQ ALPHA
Hedge Strategy Fund


The investment return and value of the Fund shares will fluctuate so that an investor’s shares, when sold, may be worth more or less than their original cost. Performance may be lower or higher than performance data quoted. Consider the Fund’s investment objectives, risks, charges and expenses carefully before investing. The prospectus and the statement of additional information include this and other relevant information about the Fund and are available by visiting www.indexiq.com or by calling 1-888-934-0777. Read the prospectus carefully before investing.
Fund performance that is current to the most recent month-end is available by visiting www.indexiq.com or by calling 1-888-934-0777.
You may obtain a description of the Fund’s proxy voting policies and procedures, and information regarding how the Fund voted proxies relating to portfolio securities during the most recent 12-month period ended June 30, without charge. Please visit IndexIQ’s web site at www.indexiq.com, or go to the Securities and Exchange Commission’s (the “Commission”) web site at www.sec.gov, or call IndexIQ at 1-888-934-0777.
The Fund files its complete schedule of portfolio holdings with the Commission for the first and third quarters of each fiscal year on Form N-Q. The Fund’s Forms N-Q are available on the Commission’s web site at www.sec.gov. The Fund’s Forms N-Q also may be reviewed and copied at the Commission’s Public Reference Room in Washington, DC; information on the operation of the Public Reference Room may be obtained by calling 1-800-SEC-0330.
The Fund is distributed by ALPS Distributors, Inc., which is not affiliated with IndexIQ or the Fund’s investment advisor.
IndexIQ® and IQ® are registered service marks of IndexIQ.
Help Preserve the Environment — Go Green!
With e-Delivery, you can:
| • | | Receive email notifications when your most recent shareholder communications are available for review. |
| • | | Access prospectuses, annual reports and semiannual reports online. |
It’s easy to enroll:
1. Visit https://www.icsdelivery.com/live/
2. Follow the simple enrollment instructions
If you have questions about IndexIQ e-Delivery services, contact a representative at 888-934-0777.

|
| Shareholder Letter (unaudited) |
Dear Shareholder:
For the twelve months ended April 30, 2013, the key focus of the markets was on yield. The announcement by the Federal Reserve (the “Fed”) of the latest round of monetary stimulus (named Quantitative Easing 3 or “QE3”) in which the Fed committed to purchase $85 billion each month of mortgages and other assets contained an open-ended commitment to continue the program until the unemployment rate dropped. Additionally, investors grappled with the sovereign debt issues that continued to plague Europe, fiscal gridlock in the U.S., and sluggish global economic growth. The confluence of these events drove the yield on the U.S. 10 year Treasury bond to record lows. With interest rates at an all-time low, investors looked for yield wherever they could find it. Real estate and Real Estate Investment Trusts (“REITs”) were major beneficiaries in this economic climate, as they posted very strong returns. Corporate bonds, both investment grade and high yield, also moved sharply higher as investors assumed more risk to obtain higher yield.
Equity assets also benefitted from historic low yields. With low inflation and an accommodative monetary policy, U.S. large cap and small cap stocks had returns near 20%. Developed international large cap stocks also participated in the rally, although emerging market stocks were weighed down by concerns of slowing growth in China. Commodity returns were generally negative with precious metals falling sharply on reduced inflation fears. Oil also dropped, although natural gas had a sharp recovery after falling near record low prices in June.
Investors have recognized that having a well-diversified portfolio is critical to a better long-term investment strategy. Alternative investments have historically provided investors with added diversification to their portfolios. By marrying the diversification benefits of alternative investments and the growth of exchange-traded funds (ETFs), IndexIQ is seeking to provide investors with innovative tools in a dynamic market environment.*
We at IndexIQ call ourselves “The alternative to alternatives” because of our focus on bringing a different approach to the alternative investment segment of the marketplace. One leading example of this philosophy is the IQ ALPHA Hedge Strategy Fund, which was launched by IndexIQ in June 2008 and surpassed its four-year anniversary as of June 30, 2012. The Fund’s performance has demonstrated why a multi-asset class, hedged approach can be attractive during volatile market conditions.
I want to personally thank you for your interest in IndexIQ and our investment products. I invite you to visit us at www.indexiq.com or call us at (888) 934-0777 or for more information on our company and our investment solutions.
Adam S. Patti
Chief Executive Officer
Registered Representative of ALPS Distributors, Inc.
* Diversification does not eliminate the risk of experiencing investment loss.
Management’s Discussion of Fund Performance (unaudited)
IQ ALPHA Hedge Strategy Fund
The Fund’s investment objective is to seek to achieve investment results that correspond to the total return (aggregate price and yield performance) of the IQ ALPHA Hedge Index (the “Index”). The objective of the Index, in turn, is to provide superior returns (“alpha”) relative to the Standard & Poor’s 500® Composite Stock Price Index (the “S&P 500 Index”) with lower volatility than the S&P 500 Index and correlation to the S&P 500 Index that is similar to the correlation between hedge funds (as measured by broad-based hedge fund indexes) and the S&P 500 Index. The Fund implements its strategy by investing primarily in ETFs representing various asset classes.
For the 12-month period ended April 30, 2013, the Fund’s Institutional Shares returned 4.78% versus 16.89% for the S&P 500 Index, with an annualized standard deviation of 3.54% versus 10.23% for the S&P 500 Index. The Fund also had a correlation of 72% to the S&P 500 Index vs. a correlation to the S&P 500 Index of 78% for the HFRI Fund of Funds Composite Index over the same time period.
The principal positive contributors to Fund performance for the period, in aggregate, were the Fund’s exposures, through investments in ETFs, to the investment grade corporate bond market and the convertible bond market. The Fund also benefitted from positions in equities (U.S. large cap and small cap as well developed international).
The primary drivers of negative performance were the Fund’s long exposures to emerging equity markets and the Japanese Yen. Short exposure to real estate also detracted from performance. The short exposure to real estate was effected through a total return swap on an ETF that primarily invests in REITs.
Overall, during the fiscal year, the Fund used derivatives, specifically total return swaps, to affect short exposure to several asset classes and to affect leveraged exposure to all asset classes included in the Fund. The short exposure through swaps had a materially negative impact on performance, while the leveraged exposure through swaps had a materially positive impact on performance.
Hypothetical Growth of a $10,000 Investment (Since Inception Through 4/30/13)
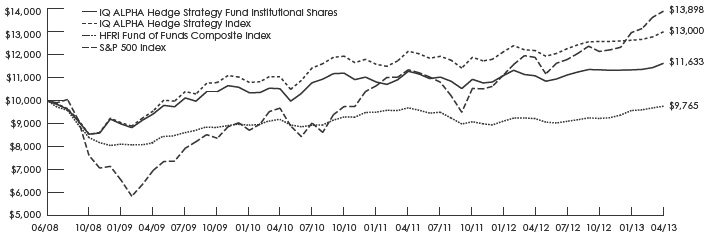
This chart illustrates the performance of a hypothetical $10,000 investment made on the Fund’s inception, and is not intended to imply any future performance.
Fund Performance History
IQ ALPHA Hedge Strategy Fund
(as of April 30, 2013)
| | | | | | | | |
| | 1 Year | | Since Inception |
| | Average
Annual | | Average
Annual | | Cumulative |
| IQ ALPHA Hedge Strategy Fund — Institutional Shares1 | 4.78 | % | | 3.18 | % | | 16.33 | % |
| IQ ALPHA Hedge Strategy Fund — Investor Shares1 | 4.42 | % | | 2.84 | % | | 14.30 | % |
| IQ ALPHA Hedge Index | 6.66 | % | | 5.58 | % | | 30.00 | % |
| HFRI Fund of Funds Composite Index | 5.80 | % | | –0.49 | % | | –2.35 | % |
| S&P 500 Index | 16.89 | % | | 7.05 | % | | 38.98 | % |
| 1 | | Fund Inception Date: 6/30/2008. For performance reporting purposes, the inception date for the Institutional Class and Investor Class shares is the Fund Inception Date. |
Management’s Discussion of Fund Performance (unaudited) (continued)
The performance data quoted represents past performance. Past performance does not guarantee future results. The investment return and principal value of an investment in the Fund will fluctuate so that an investor’s shares, when redeemed, may be worth more or less than their original cost. Current Fund performance may be lower or higher than the performance shown. Fund performance that is current to the most recent month-end is available by calling 1-888-934-0777 or by visiting www.indexiq.com. Returns shown include the reinvestment of all dividends and other distributions and do not reflect taxes that a shareholder would pay on the Fund’s distributions or redemptions of the Fund’s shares.
Index performance is for illustrative purposes only and does not represent actual Fund performance. One cannot invest directly in an index. Performance data for the Index assumes reinvestment of dividends and is net of the management fees for the Index’s components, as applicable, but it does not reflect management fees, transaction costs or other expenses that you would pay if you invested in the Fund directly.
The gross total annual operating expense ratio was 1.43% (including acquired fund fees and expenses of 0.27%) for Institutional Class Shares and 1.92% (including acquired fund fees and expenses of 0.27%) for Investor Class Shares. The net total annual operating expense ratio was 1.16% for Institutional Class Shares and 1.65% for Investor Class. This expense information is consistent with the current Fund prospectus, dated August 27, 2012. The Fund applies a 2.00% fee to the value of shares redeemed less than 7 days after purchase. The redemption fee is not reflected in the performance shown above.
The S&P 500 Index is a broad-based unmanaged index of 500 stocks, which is designed to represent the equity market in general (performance data assumes reinvestment of dividends, but it does not reflect management fees, transaction costs or other expenses).
The HFRI Fund of Funds Composite Index is an equally weighted hedge fund index including over 650 domestic and off-shore funds of funds.
Standard Deviation is a measure of the range of a portfolio’s performance, meaning the degree to which it rises above and falls below its average return.
Correlation is a measure of the relationship between two variables (in this case, portfolio returns and the S&P 500® Index).
Risk Discussion: Mutual fund investing involves risk, including loss of principal. There is no guarantee that the Fund will meet its objective. The Fund may not be suitable for all investors due to its use of leverage, short selling, and derivatives, or for other reasons. Funds that use leverage to seek to increase return are subject to greater risk in adverse market conditions. There are particular risks associated with funds that employ short sales, such as the fact that the potential loss from a short position theoretically is unlimited. The Fund’s use of derivatives, such as swap agreements, may expose the Fund to additional risks that it would not be subject to if it invested directly in the securities underlying those derivatives. The Fund’s investment performance, because it is a fund of funds, depends on the investment performance of the underlying ETFs in which it invests. There is no guarantee that the Fund itself, or each of the ETFs in the Fund’s portfolio, will perform exactly as its underlying index. An investor in the Fund will bear the operating expenses of the underlying ETFs in which the Fund invests. The Fund is non-diversified and may be susceptible to greater losses if a single portfolio investment declines than would a diversified mutual fund.
|
| Fund Expenses (unaudited) |
As a shareholder of the Fund, you incur two types of costs: (1) transaction costs and (2) ongoing costs, including management fees; distribution (12b-1) fees; and other Fund expenses. This example is intended to help you understand your ongoing costs (in dollars) of investing in the Fund and to compare these costs with the ongoing costs of investing in other mutual funds.
The Example is based on an investment of $1,000 invested at the beginning of the period and held for the entire period as indicated below.
Actual Expenses
The first line of the table below provides information about actual account values and actual expenses. You may use the information in this line, together with the amount you invested, to estimate the expenses that you paid over the period. Simply divide your account value by $1,000 (for example, an $8,600 account value divided by $1,000 = 8.6), then multiply the result by the number in the first line under the heading entitled “Expenses Paid During the Six Month Period 11/01/12 to 04/30/13” to estimate the expenses you paid on your account during this period. The Fund will indirectly bear its pro rata share of the expenses incurred by the underlying investments in which the Fund invests. These expenses are not included in the table.
Hypothetical Example for Comparison Purposes
The table below also provides information about hypothetical account values and hypothetical expenses based on the Fund’s actual expense ratio and an assumed annual rate of return of 5% before expenses, which is not the Fund’s actual return. The hypothetical account values and expenses may not be used to estimate the actual ending account balance or expenses you paid for the period. You may use this information to compare the ongoing costs of investing in the Fund and other funds by comparing this 5% hypothetical example with the 5% hypothetical examples that appear in the shareholder reports of other funds. The Fund will indirectly bear its pro rata share of the expenses incurred by the underlying investments in which the Fund invests. These expenses are not included in the table.
Please note that the expenses shown in the table are meant to highlight your ongoing costs only and do not reflect any transactional costs. Therefore, the hypothetical example is useful in comparing ongoing costs only, and will not help you determine the relative total costs of owning different funds. In addition, if these transactional costs were included, your costs would have been higher.
| | | | | | | | | | | | |
| | Beginning
Account
Value
11/01/12 | | Ending
Account
Value
04/30/13 | | Annualized
Expense
Ratios for
the Period
11/01/12 to
04/30/13 | | Expenses
Paid During
the Six
Month Period
11/01/12 to
4/30/13 † |
| Institutional Class | | | | | | | | | | | | |
| Actual | $ | 1,000.00 | | $ | 1,024.84 | | 1.21 | % | | $ | 6.07 | |
| Hypothetical (5% return before expenses) | $ | 1,000.00 | | $ | 1,018.79 | | 1.21 | % | | $ | 6.06 | |
| Investor Class | | | | | | | | | | | | |
| Actual | $ | 1,000.00 | | $ | 1,023.16 | | 1.62 | % | | $ | 8.13 | |
| Hypothetical (5% return before expenses) | $ | 1,000.00 | | $ | 1,016.76 | | 1.62 | % | | $ | 8.10 | |
| † | | Expenses are calculated using each Class’s annualized expense ratio, multiplied by the average account value for the period, multiplied by 181/365 (to reflect the one-half year period). |
|
| Portfolio Summary |
| April 30, 2013 |
PORTFOLIO STATISTICS
Net Assets ($ mil): $233.2
SCHEDULE OF INVESTMENTS SUMMARY TABLE
| Investment Companies | % of
Net Assets |
| Aggregate Bond Funds | | 27.2 | % |
| U.S. Short-Term Treasury Bond Funds | | 12.2 | |
| Corporate Bond Funds | | 11.9 | |
| U.S. Large Cap Equity Funds | | 11.5 | |
| Equity Funds | | 11.0 | |
| Convertible Bond Fund | | 7.9 | |
| U.S. Small Cap Equity Fund | | 5.2 | |
| Money Market Fund | | 5.1 | |
| Treasury Inflation-Protected Securities Bond Fund | | 4.0 | |
| Emerging Equity Funds | | 3.0 | |
| Commodity Funds | | 2.2 | |
| Debt Fund | | 1.8 | |
| International Bond Funds | | 1.8 | |
| Asset Allocation Fund | | 0.5 | |
| High Yield Corporate Bond Funds | | 0.3 | |
| Real Estate Fund | | 0.1 | |
| Total Investments | | 105.7 | |
| Liabilities in Excess of Other Assets | | (5.7 | ) |
| Net Assets | | 100.0 | % |
|
| Schedule of Investments |
| April 30, 2013 |
| | | |
| | Shares | | Value |
| Investment Companies — 100.6% | | | |
| |
| Aggregate Bond Funds — 27.2% | | | |
| iShares Core Total US Bond Market ETF(a) | 254,519 | | $ | 28,389,049 |
| SPDR Barclays Aggregate Bond ETF | 21,853 | | 1,286,705 |
| Vanguard Total Bond Market ETF(a) | 401,301 | | 33,781,518 |
| Total Aggregate Bond Funds | | | 63,457,272 |
| |
| Asset Allocation Fund — 0.5% | | | |
| Wisdomtree Emerging Currency | | | |
| Fund*(a) | 54,309 | | 1,157,868 |
| |
| Commodity Funds — 2.2% | | | |
| iPath Dow Jones-UBS Commodity Index | | | |
| Total Return ETN*(a) | 26,710 | | 1,054,244 |
| iShares Silver Trust*(a) | 8,008 | | 187,868 |
| PowerShares DB Commodity Index | | | |
| Tracking Fund*(a) | 144,386 | | 3,793,020 |
| Total Commodity Funds | | | 5,035,132 |
| |
| Convertible Bond Fund — 7.9% | | | |
| SPDR Barclays Convertible | | | |
| Securities ETF(a)(b) | 427,023 | | 18,366,259 |
| |
| Corporate Bond Funds — 11.9% | | | |
| iShares Barclays Credit Bond Fund(a) | 13,070 | | 1,494,816 |
| iShares iBoxx $ Investment Grade | | | |
| Corporate Bond Fund(a) | 215,846 | | 26,361,272 |
| Total Corporate Bond Funds | | | 27,856,088 |
| |
| Debt Fund — 1.8% | | | |
| PowerShares Senior Loan Portfolio | 169,577 | | 4,271,645 |
| |
| Emerging Equity Funds — 3.0% | | | |
| iShares MSCI Emerging Markets | | | |
| Index Fund(a) | 69,704 | | 3,017,486 |
| Vanguard FTSE Emerging Markets ETF(a) | 88,956 | | 3,892,715 |
| Total Emerging Equity Funds | | | 6,910,201 |
| |
| Equity Funds — 11.0% | | | |
| iShares MSCI EAFE Index Fund(a) | 317,016 | | 19,635,971 |
| Vanguard MSCI EAFE ETF(a) | 155,539 | | 5,961,810 |
| Total Equity Funds | | | 25,597,781 |
| |
| High Yield Corporate Bond Funds — 0.3% | | | |
| iShares iBoxx $ High Yield Corporate | | | |
| Bond Fund | 4,388 | | 420,590 |
| SPDR Barclays High Yield Bond ETF(a) | 7,850 | | 327,737 |
| Total High Yield Corporate Bond Funds | | | 748,327 |
| |
| International Bond Funds — 1.8% | | | |
| iShares JPMorgan USD Emerging Markets | | | |
| Bond Fund | 23,713 | | 2,878,758 |
| PowerShares Emerging Markets | | | |
| Sovereign Debt Portfolio(b) | 40,336 | | 1,250,416 |
| Total International Bond Funds | | | 4,129,174 |
| | | | |
| | Shares | | Value |
| |
| Investment Companies (continued) | | | | |
| |
| Real Estate Fund — 0.1% | | | | |
| SPDR Dow Jones International | | | | |
| Real Estate ETF | 2,961 | | $ | 136,532 |
| |
| Treasury Inflation — Protected Securities | | | | |
| Bond Fund — 4.0% | | | | |
| iShares Barclays TIPS Bond Fund(a) | 75,630 | | | 9,238,204 |
| |
| U.S. Large Cap Equity Funds — 11.5% | | | | |
| iShares Russell 1000 Growth | | | | |
| Index Fund(a) | 295,992 | | | 21,571,897 |
| SPDR S&P 500 ETF Trust(a) | 33,252 | | | 5,309,679 |
| Total U.S. Large Cap Equity Funds | | | | 26,881,576 |
| |
| U.S. Short-Term Treasury Bond Funds — 12.2% | | | |
| iShares Barclays 1-3 Year Treasury | | | | |
| Bond Fund(a) | 108,093 | | | 9,134,940 |
| iShares Barclays Short Treasury | | | | |
| Bond Fund | 35,141 | | | 3,874,295 |
| SPDR Barclays 1-3 Month T-Bill ETF*(a) | 30,873 | | | 1,413,983 |
| Vanguard Short-Term Bond ETF(a) | 173,134 | | | 14,039,436 |
| Total U.S. Short-Term Treasury Bond Funds | | | | 28,462,654 |
| |
| U.S. Small Cap Equity Fund — 5.2% | | | | |
| iShares Russell 2000 Index Fund(b) | 130,362 | | | 12,272,279 |
| Total Investment Companies — 100.6% | | | | |
| (Cost $223,325,913) | | | | 234,520,992 |
| |
| Investment of Cash Collateral For | | | | |
| Securities Loaned — 5.1% | | | | |
| |
| Money Market Fund — 5.1% | | | | |
| BNY Mellon Overnight | | | | |
| Government Fund, 0.17% | | | | |
| (Cost $11,827,811) | 11,827,811 | | | 11,827,811 |
| Total Investments — 105.7% | | | | |
| (Cost $235,153,724) | | | $ | 246,348,803 |
| Liabilities in Excess of Other Assets — (5.7)%(c) | | | (13,183,640) |
| Net Assets — 100.0% | | | $ | 233,165,163 |
| * | | Non-income producing securities. |
| (a) | | All or portion of these securities have been segregated as collateral for swap contracts. The total value of securities segregated amounted to $151,498,541. |
| (b) | | All or a portion of security is on loan. The aggregate market value of securities on loan is $11,658,172; cash collateral of $11,827,811 (included in liabilities) was received with which the Fund purchased highly liquid short-term investments. |
| (c) | | Liabilities in Excess of Other Assets includes net unrealized appreciation (depreciation) on swap contracts. |
| ETF | — Exchange Traded Fund |
| ETN | — Exchange Traded Note |
| TIPS | — Treasury Inflation Protected Security |
See notes to financial statements.
|
| Schedule of Investments (continued) |
| April 30, 2013 |
Total Return Swap contracts outstanding at April 30, 2013:
| | | | | | | | | | | | |
| Total Return Benchmark | | Annual
Financing
Rate
Received
(Paid) | | Expiration
Date | | Notional
Amount | | Unrealized
Appreciation
(Depreciation)1 |
| CurrencyShares Euro Trust | | (1.54 | )% | | 4/14/2014 | | $ | (9,109,689 | ) | | $ | — |
| CurrencyShares Japanese Yen Trust | | (2.04 | )% | | 4/14/2014 | | | (2,695,141 | ) | | | — |
| iPath Dow Jones-UBS Commodity Index | | | | | | | | | | | | |
| Total Return ETN | | 0.54 | % | | 4/14/2014 | | | 452,050 | | | | — |
| iPath S&P 500 VIX Mid-Term Futures ETN | | (2.77 | )% | | 4/14/2014 | | | (714,254 | ) | | | — |
| iShares Barclays 1-3 Year Treasury Bond Fund | | 0.54 | % | | 4/14/2014 | | | 3,917,039 | | | | — |
| iShares Barclays Credit Bond Fund | | 0.54 | % | | 4/14/2014 | | | 640,929 | | | | — |
| iShares Barclays Short Treasury Bond Fund | | 0.54 | % | | 4/14/2014 | | | 1,661,247 | | | | — |
| iShares Barclays TIPS Bond Fund | | 0.54 | % | | 4/14/2014 | | | 3,961,325 | | | | — |
| iShares Core Total US Bond Market ETF | | 0.54 | % | | 4/14/2014 | | | 12,173,029 | | | | — |
| iShares Dow Jones US Real Estate Index Fund | | (0.68 | )% | | 4/14/2014 | | | (3,734,853 | ) | | | — |
| iShares iBoxx $ High Yield Corporate Bond Fund | | 0.54 | % | | 4/14/2014 | | | 180,390 | | | | — |
| iShares iBoxx $ Investment Grade Corporate | | | | | | | | | | | | |
| Bond Fund | | 0.54 | % | | 4/14/2014 | | | 11,303,498 | | | | — |
| iShares JPMorgan USD Emerging Markets Bond Fund | | 0.54 | % | | 4/14/2014 | | | 1,234,395 | | | | — |
| iShares MSCI EAFE Index Fund | | 0.54 | % | | 4/14/2014 | | | 8,419,752 | | | | — |
| iShares MSCI Emerging Markets Index Fund | | 0.54 | % | | 4/14/2014 | | | 1,293,895 | | | | — |
| iShares Russell 1000 Growth Index Fund | | 0.54 | % | | 4/14/2014 | | | 9,249,930 | | | | — |
| iShares Russell 2000 Index Fund | | 0.54 | % | | 4/14/2014 | | | 5,262,238 | | | | — |
| iShares Silver Trust | | 0.54 | % | | 4/14/2014 | | | 80,562 | | | | — |
| PowerShares DB Commodity Index Tracking Fund | | 0.54 | % | | 4/14/2014 | | | 1,626,428 | | | | — |
| PowerShares DB G10 Currency Harvest Fund | | (0.52 | )% | | 4/14/2014 | | | (6,296,118 | ) | | | — |
| PowerShares DB Gold Fund | | (1.15 | )% | | 4/14/2014 | | | (5,526,719 | ) | | | — |
| PowerShares Emerging Markets Sovereign | | | | | | | | | | | | |
| Debit Portfolio | | 0.54 | % | | 4/14/2014 | | | 536,176 | | | | — |
| PowerShares Senior Loan Portfolio | | 0.54 | % | | 4/14/2014 | | | 1,831,640 | | | | — |
| ProShares VIX Mid-Term Futures ETF | | (4.52 | )% | | 4/14/2014 | | | (862,270 | ) | | | — |
| SPDR Barclays 1-3 Month T-Bill ETF | | 0.54 | % | | 4/14/2014 | | | 606,300 | | | | — |
| SPDR Barclays Aggregate Bond ETF | | 0.54 | % | | 4/14/2014 | | | 551,706 | | | | — |
| SPDR Barclays Convertible Securities ETF | | 0.54 | % | | 4/14/2014 | | | 7,875,346 | | | | — |
| SPDR Barclays High Yield Bond ETF | | 0.54 | % | | 4/14/2014 | | | 140,531 | | | | — |
| SPDR Dow Jones International Real Estate ETF | | 0.54 | % | | 4/14/2014 | | | 58,560 | | | | — |
| SPDR Dow Jones REIT ETF | | (0.65 | )% | | 4/14/2014 | | | (1,406,975 | ) | | | — |
| SPDR S&P 500 ETF Trust | | 0.54 | % | | 4/14/2014 | | | 2,276,717 | | | | — |
| Vanguard FTSE Emerging Markets ETF | | 0.54 | % | | 4/14/2014 | | | 1,669,181 | | | | — |
| Vanguard MSCI EAFE ETF | | 0.54 | % | | 4/14/2014 | | | 2,556,381 | | | | — |
| Vanguard REIT ETF | | (0.48 | )% | | 4/14/2014 | | | (12,036,594 | ) | | | — |
| Vanguard Short-Term Bond ETF | | 0.54 | % | | 4/14/2014 | | | 6,020,040 | | | | — |
| Vanguard Total Bond Market ETF | | 0.54 | % | | 4/14/2014 | | | 14,485,274 | | | | — |
| WisdomTree Emerging Currency Fund | | 0.54 | % | | 4/14/2014 | | | 496,479 | | | | — |
| Net Unrealized Appreciation (Depreciation) | | | | | | | | | | | $ | — |
A portion of the securities held by the Fund have been segregated as collateral for swap contracts. The net collateral posted for swap contracts was $151,498,541 at April 30, 2013.
Morgan Stanley acts as the counterparty to the total return swap contracts listed above. The Fund either receives fees from, or pays fees to, the counterparty, depending upon the total return of the benchmark, and the agreed-upon financing rate.
| 1 | | Reflects a Reset date of April 30, 2013. |
See notes to financial statements.
|
| Statement of Assets and Liabilities |
| April 30, 2013 |
| | | |
| Assets | | | |
| Investments, at value, (including securities loaned of $11,658,172) (cost $235,153,724) | $ | | 246,348,803 | |
| Due from broker | | 2,279,254 | |
| Receivable for capital shares sold | | 499,854 | |
| Prepaid expenses and other receivables | | 48,068 | |
| Total Assets | | 249,175,979 | |
| |
| Liabilities | | | |
| Collateral for securities on loan | | 11,827,811 | |
| Payable for capital shares redeemed | | 1,599,660 | |
| Due to broker | | 1,527,113 | |
| Due to custodian | | 705,453 | |
| Advisory fees payable | | 185,331 | |
| Distribution fees payable — Investor Class | | 5,066 | |
| Compliance fees payable | | 375 | |
| Trustees fees payable | | 101 | |
| Accrued expenses | | 159,906 | |
| Total Liabilities | | 16,010,816 | |
| Net Assets | $ | 233,165,163 | |
| |
| Composition of Net Assets | | | |
| Paid-in capital | $ | 226,657,921 | |
| Accumulated undistributed net investment loss | | (11,195 | ) |
| Accumulated net realized loss on investment securities and swap transactions | | (4,676,642 | ) |
| Net unrealized appreciation on investment securities and swap transactions | | 11,195,079 | |
| Net Assets | $ | 233,165,163 | |
NET ASSET VALUE PER SHARE
($0.001 par value common stock, unlimited authorized shares)
| | | | | | | | |
| Class | | Net Assets | | Shares
Outstanding | | Net Asset
Value |
| Institutional | | $ | 208,386,440 | | 19,752,436 | | $ | 10.55 |
| Investor | | $ | 24,778,723 | | 2,355,648 | | $ | 10.52 |
See notes to financial statements.
|
| Statement of Operations |
| For the Year Ended April 30, 2013 |
| | | | |
| Investment Income | | | | |
| Dividend income | | | | $ | 6,646,122 |
| Securities lending income, net of borrower rebates | | | | 66,110 |
| Total investment income | | | | 6,712,232 |
| |
| Expenses | | | | |
| Advisory fees | | $ | 2,473,177 | | |
| Administrative and accounting fees | | 135,097 | | |
| Transfer agent fees | | 131,538 | | |
| Professional fees | | 128,319 | | |
| Distribution fees — Investor Class | | 77,828 | | |
| Blue sky fees | | 60,781 | | |
| Shareholder reporting fees | | 47,249 | | |
| Insurance fees | | 43,911 | | |
| Recoupment | | 23,759 | | |
| Trustee fees and expenses | | 22,851 | | |
| Custodian fees | | 19,043 | | |
| Registration fees | | 14,364 | | |
| Compliance fees | | 4,500 | | |
| Miscellaneous fees | | 1,177 | | |
| Total expenses | | | | 3,183,594 |
| Net investment income | | | | 3,528,638 |
| |
| |
| Realized and Unrealized Gain on Investment Securities and Swap Transactions | | | | |
| Net realized gain on: | | | | |
| Investment securities | | | | 3,976,157 |
| Swap transactions | | | | 1,402,478 |
| Distributions from investments in other investment companies | | | | 247,909 |
| Net change in unrealized appreciation/depreciation on investment securities | | | | 2,564,599 |
| Net realized and unrealized gain on investment securities and | | | | |
| swap transactions | | | | 8,191,143 |
| Net Increase in Net Assets Resulting from Operations | | | | $ | 11,719,781 |
See notes to financial statements.
|
| Statement of Changes in Net Assets |
| | | | | | | |
| | For the
Year Ended
April 30, 2013 | | For the
Year Ended
April 30, 2012 |
| Increase (Decrease) in Net Assets from Operations | | | | | | | |
| Net investment income | $ | 3,528,638 | | | $ | 3,516,017 | |
| Net realized gain (loss) on investment securities, swap transactions | | | | | | | |
| and distributions from investment in other investment companies | | 5,626,544 | | | | (8,523,189 | ) |
| Net change in unrealized appreciation/depreciation on investment | | | | | | | |
| securities and swap transactions | | 2,564,599 | | | | 1,964,480 | |
| Net increase (decrease) in net assets resulting from operations | | 11,719,781 | | | | (3,042,692 | ) |
| Dividends and Distributions to Shareholders from: | | | | | | | |
| Net investment income | | | | | | | |
| Institutional Class | | (4,065,331 | ) | | | (3,142,868 | ) |
| Investor Class | | (462,973 | ) | | | (335,074 | ) |
| Total net investment income dividend distributions to shareholders | | (4,528,304 | ) | | | (3,477,942 | ) |
| Net realized gains | | | | | | | |
| Institutional Class | | — | | | | (1,347,721 | ) |
| Investor Class | | — | | | | (197,079 | ) |
| Total net realized gain distributions to shareholders | | — | | | | (1,544,800 | ) |
| Capital Share Transactions | | | | | | | |
| Institutional Class | | | | | | | |
| Proceeds from shares sold | | 99,693,872 | | | | 131,664,802 | |
| Cost of shares redeemed | | (138,989,335 | ) | | | (64,733,158 | ) |
| Proceeds from distributions reinvested | | 3,815,180 | | | | 2,453,143 | |
| Redemption fees | | 3,195 | | | | 1,454 | |
| Net Increase (decrease) from capital share transactions | | (35,477,088 | ) | | | 69,386,241 | |
| Investor Class | | | | | | | |
| Proceeds from shares sold | | 14,725,623 | | | | 17,449,565 | |
| Cost of shares redeemed | | (25,354,222 | ) | | | (14,298,281 | ) |
| Proceeds from distributions reinvested | | 402,710 | | | | 450,692 | |
| Redemption fees | | 561 | | | | 3,608 | |
| Net Increase (decrease) from capital share transactions | | (10,225,328 | ) | | | 3,605,584 | |
| Total increase (decrease) in net assets | | (38,510,939 | ) | | | 64,926,391 | |
| Net Assets | | | | | | | |
| Beginning of year | | 271,676,102 | | | | 206,749,711 | |
| End of year | $ | 233,165,163 | | | $ | 271,676,102 | |
| Accumulated undistributed net investment income (loss) included in | | | | | | | |
| net assets at end of year: | $ | (11,195 | ) | | $ | 924,672 | |
| Changes in Shares Outstanding | | | | | | | |
| Institutional Class | | | | | | | |
| Shares outstanding, beginning of year | | 23,152,406 | | | | 16,395,991 | |
| Shares sold | | 9,653,502 | | | | 12,807,567 | |
| Shares redeemed | | (13,424,597 | ) | | | (6,296,466 | ) |
| Shares issued for distributions reinvested | | 371,125 | | | | 245,314 | |
| Shares outstanding, end of year | | 19,752,436 | | | | 23,152,406 | |
| Investor Class | | | | | | | |
| Shares outstanding, beginning of year | | 3,344,801 | | | | 2,990,868 | |
| Shares sold | | 1,428,935 | | | | 1,707,401 | |
| Shares redeemed | | (2,457,338 | ) | | | (1,398,582 | ) |
| Shares issued for distributions reinvested | | 39,250 | | | | 45,114 | |
| Shares outstanding, end of year | | 2,355,648 | | | | 3,344,801 | |
See notes to financial statements.
|
| Financial Highlights |
| Selected Data for a Share of Capital Stock Outstanding |
| | INSTITUTIONAL CLASS |
| | For the
Year Ended
April 30, 2013 | | For the
Year Ended
April 30, 2012 | | For the
Year Ended
April 30, 2011 | | For the
Year Ended
April 30, 2010 | | For the Period
June 30, 20081 to
April 30, 2009 |
| Net asset value, beginning of period | $ | 10.26 | | | $ | 10.67 | | | $ | 10.14 | | | $ | 9.34 | | | $ | 10.00 | |
| Income from Investment Operations | | | | | | | | | | | | | | | | | | | |
| Net investment income2 | | 0.14 | | | | 0.17 | | | | 0.21 | | | | 0.10 | | | | 0.20 | |
| Net realized and unrealized gain (loss) | | | | | | | | | | | | | | | | | | | |
| on investment securities and swap | | | | | | | | | | | | | | | | | | | |
| transactions | | 0.33 | | | | (0.37 | ) | | | 0.51 | | | | 0.99 | | | | (0.77 | )3 |
| Distributions of net realized gains from | | | | | | | | | | | | | | | | | | | |
| investments in other investment | | | | | | | | | | | | | | | | | | | |
| companies | | 0.02 | | | | 0.02 | | | | 0.00 | 4 | | | — | | | | 0.00 | 4 |
| Net increase (decrease) resulting | | | | | | | | | | | | | | | | | | | |
| from operations | | 0.49 | | | | (0.18 | ) | | | 0.72 | | | | 1.09 | | | | (0.57 | ) |
| Less distributions from: | | | | | | | | | | | | | | | | | | | |
| Net investment income | | (0.20 | ) | | | (0.16 | ) | | | (0.18 | ) | | | (0.07 | ) | | | (0.09 | ) |
| Net realized gains | | — | | | | (0.07 | ) | | | (0.01 | ) | | | (0.22 | ) | | | — | |
| Total distributions to shareholders | | (0.20 | ) | | | (0.23 | ) | | | (0.19 | ) | | | (0.29 | ) | | | (0.09 | ) |
| Capital Share Transactions | | | | | | | | | | | | | | | | | | | |
| Redemption fees | | 0.00 | 4 | | | — | | | | — | | | | — | | | | — | |
| Net asset value, end of period | $ | 10.55 | | | $ | 10.26 | | | $ | 10.67 | | | $ | 10.14 | | | $ | 9.34 | |
| Total Return | | | | | | | | | | | | | | | | | | | |
| Total investment return based on | | | | | | | | | | | | | | | | | | | |
| net asset value5 | | 4.78 | % | | | (1.62 | )% | | | 7.19 | % | | | 11.65 | % | | | (5.71 | )% |
| Ratios/Supplemental Data | | | | | | | | | | | | | | | | | | | |
| Net assets, end of period | | | | | | | | | | | | | | | | | | | |
| (000's omitted) | $ | 208,386 | | | $ | 237,466 | | | $ | 174,916 | | | $ | 71,814 | | | $ | 3,019 | |
| Ratio to average net assets of:8 | | | | | | | | | | | | | | | | | | | |
| Expenses net of reimbursements | | 1.18 | % | | | 1.16 | % | | | 1.30 | % | | | 1.64 | % | | | 1.15 | %6 |
| Expenses before reimbursements | | 1.18 | % | | | 1.16 | % | | | 1.30 | % | | | 1.98 | % | | | 24.41 | %6 |
| Net investment Income | | 1.40 | % | | | 1.62 | % | | | 2.05 | % | | | 1.01 | % | | | 2.77 | %6 |
| Portfolio turnover rate | | 197 | % | | | 142 | % | | | 195 | % | | | 151 | % | | | 182 | %7 |
See footnotes on page 15.
See notes to financial statements.
|
| Financial Highlights (continued) |
| Selected Data for a Share of Capital Stock Outstanding |
| | INVESTOR CLASS |
| | For the
Year Ended
April 30, 2013 | | For the
Year Ended
April 30, 2012 | | For the
Year Ended
April 30, 2011 | | For the
Year Ended
April 30, 2010 | | For the Period
July 23, 20081 to
April 30, 2009 |
| Net asset value, beginning of period | $ | 10.23 | | | $ | 10.64 | | | $ | 10.12 | | | $ | 9.31 | | | $ | 10.00 | |
| Income from Investment Operations | | | | | | | | | | | | | | | | | | | |
| Net investment income2 | | 0.11 | | | | 0.12 | | | | 0.16 | | | | 0.08 | | | | 0.11 | |
| Net realized and unrealized gain (loss) | | | | | | | | | | | | | | | | | | | |
| on investment securities and swap | | | | | | | | | | | | | | | | | | | |
| transactions | | 0.33 | | | | (0.36 | ) | | | 0.50 | | | | 0.99 | | | | (0.70 | )3 |
| Distributions of net realized gains from | | | | | | | | | | | | | | | | | | | |
| investments in other investment | | | | | | | | | | | | | | | | | | | |
| companies | | 0.01 | | | | 0.02 | | | | 0.00 | 4 | | | — | | | | 0.00 | 4 |
| Net increase (decrease) resulting | | | | | | | | | | | | | | | | | | | |
| from operations | | 0.45 | | | | (0.22 | ) | | | 0.66 | | | | 1.07 | | | | (0.59 | ) |
| Less distributions from: | | | | | | | | | | | | | | | | | | | |
| Net investment income | | (0.16 | ) | | | (0.12 | ) | | | (0.13 | ) | | | (0.04 | ) | | | (0.10 | ) |
| Net realized gains | | — | | | | (0.07 | ) | | | (0.01 | ) | | | (0.22 | ) | | | — | |
| Total distributions to shareholders | | (0.16 | ) | | | (0.19 | ) | | | (0.14 | ) | | | (0.26 | ) | | | (0.10 | ) |
| Capital Share Transactions | | | | | | | | | | | | | | | | | | | |
| Redemption fees | | 0.00 | 4 | | | — | | | | — | | | | — | | | | — | |
| Net asset value, end of period | $ | 10.52 | | | $ | 10.23 | | | $ | 10.64 | | | $ | 10.12 | | | $ | 9.31 | |
| Total Return | | | | | | | | | | | | | | | | | | | |
| Total investment return based on | | | | | | | | | | | | | | | | | | | |
| net asset value5 | | 4.42 | % | | | (2.05 | )% | | | 6.57 | % | | | 11.44 | % | | | (5.89 | )% |
| Ratios/Supplemental Data | | | | | | | | | | | | | | | | | | | |
| Net assets, end of period | | | | | | | | | | | | | | | | | | | |
| (000's omitted) | $ | 24,779 | | | $ | 34,210 | | | $ | 31,834 | | | $ | 14,835 | | | $ | 637 | |
| Ratio to average net assets of:8 | | | | | | | | | | | | | | | | | | | |
| Expenses net of reimbursements | | 1.56 | % | | | 1.65 | % | | | 1.90 | % | | | 1.86 | % | | | 1.40 | %6 |
| Expenses before reimbursements | | 1.56 | % | | | 1.65 | % | | | 1.90 | % | | | 2.79 | % | | | 44.26 | %6 |
| Net investment Income | | 1.06 | % | | | 1.20 | % | | | 1.55 | % | | | 0.78 | % | | | 1.82 | %6 |
| Portfolio turnover rate | | 197 | % | | | 142 | % | | | 195 | % | | | 151 | % | | | 182 | %7 |
| 1 | | Commencement of offering shares. |
| 2 | | Based on average shares outstanding. |
| 3 | | Due to the timing of sales and repurchases of capital shares, the net realized and unrealized gain (loss) per share is not in accord with the Fund's change in net realized and unrealized gain (loss) on investment transactions for the period. |
| 4 | | Represents less than $0.005. |
| 5 | | Total investment return is calculated by assuming a purchase of shares on the first day, reinvestment of all dividends and distributions at net asset value during the period and a sale of shares on the last day of the period reported. Total return calculated for a period less than one year is not annualized. The total return would have been lower if certain expenses had not been reimbursed by the Advisor. Total returns may reflect adjustments to conform to generally accepted accounting principles. |
| 7 | | Portfolio turnover rate is not annualized. |
| 8 | | The ratios to average net assets do not include net investment income or expenses of other investment companies in which the Fund invests. |
See notes to financial statements.
|
| Notes to Financial Statements |
| April 30, 2013 |
1. ORGANIZATION
IQ ALPHA Hedge Strategy Fund (the “Fund”) is a series of the IndexIQ Trust (the “Trust”) which is a statutory trust organized under Delaware law. The Fund is a non-diversified, open-end, management investment company, as defined by the Investment Company Act of 1940, as amended (the “1940 Act”). The Fund offers two classes of shares, Institutional Class and Investor Class. Both classes have equal rights and voting privileges, except in matters affecting a single class.
The Fund’s investment objective is to seek to achieve investment results that correspond to the total return (aggregate price and yield performance) of the IQ Alpha Hedge Index (the “Index”). The objective of the Index is to provide superior returns (“alpha”) relative to the Standard & Poor’s 500® Composite Stock Price Index (the “S&P 500 Index”) with lower volatility than the S&P 500 Index and correlation to the S&P 500 Index that is similar to the correlation between hedge funds (as measured by broad-based hedge fund indexes) and the S&P 500 Index.
Investors may find the financial statements of any issuer whose securities represent a significant amount of the Fund’s assets on the Securities and Exchange Commission’s website (www.sec.gov).
2. SIGNIFICANT ACCOUNTING POLICIES
Use of Estimates
These financial statements are prepared in conformity with U.S. generally accepted accounting principles (“U.S. GAAP”), which require management to make certain estimates and assumptions that affect the reported amounts of assets and liabilities and disclosure of contingent assets and liabilities at the date of the financial statements and reported amounts of increases and decreases in the net assets from operations during the reporting period. Actual results could differ from those estimates. The following is a summary of significant accounting policies followed by the Fund:
Indemnification
In the normal course of business, the Fund may enter into contracts that contain a variety of representations which provide general indemnifications for certain liabilities. The Fund’s maximum exposure under these arrangements is unknown. However, the Fund has not had prior claims or losses pursuant to these contracts and expects the risk of loss to be remote.
Investment Valuation
The Net Asset Value (“NAV”) is determined as of the close of trading (generally, 4:00 PM Eastern Time) on each day the New York Stock Exchange (“NYSE”) is open for trading. NAV per share is calculated by dividing a fund’s net assets by the number of fund shares outstanding. Securities and investment funds traded on any recognized national or foreign stock exchange are valued at the last quoted sale price, or if no sale price is available, at the bid price. Events occurring after the close of trading in non-US exchanges may result in adjustments to the valuation of foreign securities to more accurately reflect their fair value as of the close of regular trading on the NYSE. Securities not listed on a national or foreign stock exchange may be valued on the basis of prices furnished by approved pricing services or at the closing bid price on the over-the-counter market.
If market quotations are not readily available, or if it is determined that a quotation of a security does not represent fair value, then the security is valued at fair value as determined in good faith using procedures adopted by the Trust’s Board of Trustees (the “Board”). Market prices may not represent fair value, for example, if a security is thinly traded or if an event occurs between the market quotation and the time the security is to be valued which is expected to affect the value of the security. The circumstances in which the Board may fair value a security include, among others: the occurrence of events that are significant to a particular issuer, such as mergers, restructurings or defaults; the occurrence of events that are significant to an entire market, such as natural disasters in a particular region or government actions; trading restrictions on securities; thinly traded securities; and market events such as trading halts and early market closings. Short-term securities with 60 days or less remaining to maturity are valued using the amortized cost method, which approximates current market value. Investments in open end regulated investment companies are valued at net asset value. Price information on ETFs is taken from the exchange where the security is primarily traded.
|
| Notes to Financial Statements (continued) |
| April 30, 2013 |
Under normal conditions, the Fund invests cash collateral from securities lending activities into BNY Mellon Overnight Government Fund (“BNY Mellon Overnight Government”). The BNY Mellon Overnight Government’s investment objective is the maximization of current income to the extent consistent with the preservation of capital and the maintenance of liquidity. BNY Mellon Overnight Government has no redemption restrictions and is valued at daily NAV.
Due to the inherent uncertainty of valuations, fair values may differ significantly from the values that would have been used had an active market existed. Fair valuation could result in a different NAV than a NAV determined by using market quotes.
Fair Value Measurement
Accounting Standards Codification, Fair Value Measurements and Disclosures (“ASC 820”) defines fair value, establishes a framework for measuring fair value in accordance with U.S. GAAP, and requires disclosure about fair value measurements. It also provides guidance on determining when there has been a significant decrease in the volume and level of activity for an asset or liability, when a transaction is not orderly, and how that information must be incorporated into fair value measurement. Under ASC 820, various inputs are used in determining the value of the Fund’s investments. These inputs are summarized in the following hierarchy:
| • | | Level 1 — Unadjusted quoted prices in active markets for identical assets or liabilities that the Fund has the ability to access. |
| • | | Level 2 — Observable inputs other than quoted prices included in Level 1 that are observable for the asset or liability, either directly or indirectly. These inputs may include quoted prices for the identical instrument on an inactive market, prices for similar securities, interest rates, prepayment speeds, credit risk, yield curves, default rates and similar data. |
| • | | Level 3 — Unobservable inputs for the asset or liability, to the extent relevant observable inputs are not available, representing the Fund’s own assumptions about the assumptions a market participant would use in valuing the asset or liability, and would be based on the best information available. |
The availability of observable inputs can vary from security to security and is affected by a wide variety of factors, including, for example, the type of security, whether the security is new and not yet established in the marketplace, the liquidity of markets, and other characteristics particular to the security. To the extent that valuation is based on models or inputs that are less observable or unobservable in the market, the determination of fair value requires more judgment. Accordingly, the degree of judgment exercised in determining fair value is greatest for instruments categorized in Level 3. With respect to the valuation of Level 3 securities, IndexIQ Advisors LLC (the “Advisor”) may employ a market-based valuation approach which may use related or comparable securities, recent transactions, market multiples, book values, and other relevant information to determine fair value. IndexIQ may also use an income-based valuation approach in which anticipated future cash flows of the financial instrument are discounted to calculate fair value. IndexIQ representatives meet regularly to review and discuss the appropriateness of such fair values using more current information such as, recent security news, recent market transactions, updated corporate action information and/or other macro or security specific events.
All other securities and investments for which market values are not readily available, including restricted securities, and those securities for which it is inappropriate to determine prices in accordance with the aforementioned procedures, are valued at fair value as determined in good faith under procedures adopted by the Board, although the actual calculations may be done by others. Factors considered in making this determination may include, but are not limited to, information obtained by contacting the issuer, analysts, or the appropriate stock exchange (for exchange-traded securities), analysis of the issuer’s financial statements or other available documents and, if necessary, available information concerning other securities in similar circumstances.
Transfers between levels, if any, are considered to have occurred at the beginning of the reporting period. There were no transfers into or out of any levels described above during the year ended April 30, 2013.
|
| Notes to Financial Statements (continued) |
| April 30, 2013 |
The inputs or methodology used for valuing securities are not necessarily an indication of the risk associated with investing in those securities. The following summarizes inputs used as of April 30, 2013 in valuing the Fund’s assets and liabilities carried at fair value:
| | | | | | | | |
| | Level 1 | | Level 2 | | Level 3 |
| Investment Companies* | $ | 234,520,992 | | $ | — | | $ | — |
| Other Financial Instruments** | | — | | | — | | | — |
| Money Market Fund | | 11,827,811 | | | — | | | — |
| Total | $ | 246,348,803 | | $ | — | | $ | — |
| * | | Please refer to the Schedule of Investments to view securities segregated by fund type. |
| ** | | Other financial instruments include swap contracts, which are valued at the unrealized appreciation (depreciation) on the instrument. |
Tax Information, Dividends and Distributions to Shareholders and Uncertain Tax Positions
The Fund intends to qualify as a regulated investment company by complying with the requirements under Subchapter M of the Internal Revenue Code of 1986, as amended, by distributing substantially all of its net investment income and net realized gains to shareholders. Dividends and/or distributions, if any, are paid to shareholders invested in the Fund on the applicable record date. Dividends paid by the Fund with respect to all classes of shares are calculated in the same manner and at the same time, but dividends on Investor Class Shares may be lower than dividends on the Institutional Class Shares as a result of the service and/or distribution fees applicable to Investor Class Shares. Net realized long-term and short-term capital gains, if any, will be distributed by the Fund at least annually. The amount of dividends and distributions from net investment income and net realized capital gains are determined in accordance with Federal income tax regulations which may differ from U.S. GAAP. These “book/tax” differences are either considered temporary or permanent in nature. To the extent these differences are permanent in nature, such amounts are reclassified within the components of net assets based on their Federal tax basis treatment; temporary differences do not require reclassification. Dividends and distributions, which exceed earnings and profit for tax purposes are reported as a tax return of capital.
Management evaluates tax positions taken or expected to be taken in the course of preparing the Fund’s tax returns to determine whether the tax positions are “more-likely-than-not” of being sustained by the applicable tax authority. Tax positions not deemed to meet the more-likely-than-not threshold would be recorded as an expense in the current year. If applicable, the Fund will recognize interest expense and penalties in “Miscellaneous” expenses on the Statement of Operations. The Fund is required to analyze all open tax years. Open tax years are those years that are open for examination by the relevant income taxing authority. The returns of the Fund for the period from April 30, 2010 through April 30, 2013 are open for examination.
The Fund has concluded that there is no tax liability resulting from uncertain income tax positions taken or expected to be taken.
Cash Equivalents
Cash equivalents are highly liquid investments, with maturities of three months or less when acquired, and are disclosed as Short-Term Investments in the Schedule of Investments.
Security Transactions
Security transactions are accounted for on the trade date. Realized gains and losses on sales of investment securities are calculated using the identified cost method.
Securities Lending
The Fund may lend portfolio securities to certain creditworthy borrowers, including the Fund’s securities lending agent. It is the Fund’s policy that, at origination, all loans are secured by collateral of at least 102% of the value of U.S. securities loaned and 105% of the value of foreign securities loaned. Collateral in the form of cash and /or high grade debt obligations, equivalent to at least 100% of the market value of securities loaned, is maintained at all times. Cash collateral can be invested in certain money market mutual funds which also have exposure to the fluctuations of the market. The Fund receives compensation for lending its securities from interest or dividends earned on the cash or U.S. government securities held as collateral, net of fee rebates paid to the borrower plus reasonable administrative and custody fees. The dividend and interest income earned on the securities loaned is accounted for in the same manner as other dividend and interest income. The borrower pays to the Fund an
|
| Notes to Financial Statements (continued) |
| April 30, 2013 |
amount equal to any dividends or interest received on loaned securities. Lending portfolio securities could result in a loss or delay in recovering the Fund’s securities if the borrower defaults.
The securities lending income earned by the Fund is disclosed on the Statement of Operations. The value of loaned securities and related collateral outstanding at April 30, 2013 are shown in the Schedule of Investments and Statement of Assets and Liabilities.
Investment Income and Expenses
Dividend income is recognized on the ex-dividend date. Interest income is accrued daily. Distributions of realized capital gains by underlying funds are recorded as realized capital gains on the ex-date. The Fund’s investment income, expenses and unrealized and realized gains and losses are allocated daily between share classes. The Fund distributes all or substantially all of its net investment income to shareholders in the form of dividends. General expenses are allocated between the separate classes based on the weighted net asset value of each class. Class level expenses are allocated to the respective class as incurred.
Recent Accounting Pronouncements
In December 2011, the Financial Accounting Standards Board (“FASB”) issued Accounting Standards Update No. 2011-11 “Disclosures about Offsetting Assets and Liabilities”(“ASU 2011-11”). These disclosures are intended to help investors and other financial statement users to better assess the effect or potential effect of offsetting arrangements on a company’s financial position. They also improve transparency in the reporting of how companies mitigate credit risk, including disclosure of related collateral pledged or received. In addition, ASU 2011-11 facilitates comparisons between those entities that prepare their financial statements on the basis of US GAAP and those entities that prepare their financial statements on the basis of international financial reporting standards. ASU 2011-11 requires entities to disclose (i) gross and net information about both instruments and transactions eligible for offset in the financial statements and (ii) instruments and transactions subject to an agreement similar to a master netting agreement. ASU 2011-11 is effective for fiscal years beginning on or after January 1, 2013, and interim periods within those annual periods.
On January 31, 2013, FASB issued Accounting Standards Update No. 2013-01 “Clarifying the Scope of Disclosures about Offsetting Assets and Liabilities” (“ASU 2013-01”). ASU 2013-01 limits the scope of the new balance sheet offsetting disclosures to the following financial instruments, to the extent they are offset in the financial statements or subject to an enforceable master netting arrangement or similar agreement: (i) recognized derivative instruments accounted for under ASC 815 (Derivatives and Hedging); (ii) repurchase agreements and reverse repurchase agreements; and (iii) securities borrowing and securities lending transactions. The disclosures are required irrespective of whether the transactions are offset in the statement of assets and liabilities. The effective date and transition of the disclosure requirements in ASU 2011-11 remain unchanged.
At this time, management is evaluating the implications of ASU 2011-11 and ASU 2013-01 and their impact on the Fund’s financial statements.
3. INVESTMENT MANAGEMENT AND OTHER AGREEMENTS
Advisory Agreement
Under the terms of the Investment Advisory Agreement (the “Advisory Agreement”) the Fund pays the Advisor an advisory fee at an annual rate of 0.95% of the Fund’s average daily net assets. Such fee is accrued daily and paid monthly. The Advisor assumes responsibility for management of the Fund.
The Fund and the Advisor have entered into an expense limitation agreement whereby the Advisor has agreed to waive its fee and/or reimburse the Fund to the extent that total annual fund operating expenses (excluding interest, taxes, brokerage fees and commissions, dividends paid on short sales, acquired fund fees and expenses, extraordinary expenses, and distribution and/or service fees, if any under the Rule 12b-1 Plan) exceed 1.65%. Prior to July 1, 2009, the agreement set this level at 1.15%. The expense limitation agreement allows the Advisor to recover reimbursements made to the extent that the Fund’s expense ratios fall below the above indicated expense limitation. The amounts that can be recovered are limited to the difference between the actual expense ratio and the amount of the expense limitation in place at that time. Under the terms of the agreement,
|
| Notes to Financial Statements (continued) |
| April 30, 2013 |
the Advisor can only recover such amounts for a period of up to three years after the reimbursement. This agreement can be extended year to year thereafter provided such continuance is specifically approved by a majority of the Independent Trustees.
For the year ended April 30, 2013, the Advisor recouped expenses as follows:
| | | |
| Fund Class | | Expenses
Recouped |
| Institutional Class | | $ | 23,759 |
| Investor Class | | | — |
| Total | | $ | 23,759 |
The amounts available for potential future recoupment by the Advisor and the expiration schedule at April 30, 2013 are as follows:
| Fund Class | | Total
Potential
Recoupment | | Potential
Recoupment
Amounts Expiring
April 30, 2013 |
| Institutional Class | | $ | 37,413 | | | $ | 13,654 | |
| Investor Class | | | 31,168 | | | | 31,168 | |
| Total | | $ | 68,581 | | | $ | 44,822 | |
At April 30, 2013, there was no recoupment payable included in accrued expenses on the Statement of Assets and Liabilities.
Distribution Agreement (12b-1 Fees)
ALPS Distributors, Inc. (the “Distributor”) serves as the Fund’s Distributor. The Fund has adopted a Distribution Service Agreement (“Distribution Agreement”) pursuant to Rule 12b-1 under the 1940 Act with respect to the Investor Class shares. The Distribution Agreement allows for the payment of services related to the distribution and servicing of shares at a rate of up to 0.25% per annum of the average daily net asset value of the Investor Class shares of the Fund.
Administrator, Custodian and Accounting Agent
The Bank of New York Mellon (in each capacity, the “Administrator,” “Custodian” or “Accounting Agent”) serves as the Fund’s Administrator, Custodian and Accounting Agent pursuant to the Fund Administration and Accounting Agreement. The Bank of New York Mellon is a subsidiary of The Bank of New York Mellon Corporation, a financial holding company.
Transfer Agent
BNY Mellon Investment Servicing (U.S.) Inc. serves as the Fund’s transfer agent.
4. CAPITAL SHARE TRANSACTIONS
As of April 30, 2013, there were an unlimited number of common stock shares at $.001 par value authorized by the Fund. Investors may purchase or redeem Investor Class Shares and Institutional Class Shares of the Fund at their NAV, based on the next calculation of NAV after the order is placed. Neither the Fund nor the Distributor charges a sales charge or other transaction fee to purchase shares, although other institutions may impose transaction fees on shares purchased through them. Redemption requests are processed at the next NAV calculated after the Fund, its transfer agent, or your investment representative receives your sell order. If a redemption request is received on a business day prior to 4:00 pm (Eastern Time), proceeds will normally be wired to the shareholder within three business days, provided that the Fund’s Custodian is also open for business. The Fund imposes a 2% redemption fee on redemptions made within seven calendar days of purchase subject to certain exceptions. The Fund has granted authority to the Advisor to waive the redemption fee at its sole discretion where the Advisor believes such waiver is in the best interests of the Fund.
|
| Notes to Financial Statements (continued) |
| April 30, 2013 |
5. FEDERAL INCOME TAX
At April 30, 2013, the cost of investments (including securities on loan) on a tax basis was as follows:
| Cost | | Gross
Unrealized
Appreciation | | Gross
Unrealized
Depreciation | | Net Unrealized
Appreciation |
| $236,962,026 | | $9,871,529 | | $(484,752) | | $9,386,777 |
The differences between book and tax basis cost of investments and net unrealized appreciation (depreciation) are primarily attributable to wash sale loss deferrals and pass through investments.
At April 30, 2013, the components of earnings/loss on a tax-basis were as follows:
Undistributed
Net Investment
Income/(Loss) | | Accumulated
Capital
and Other
Gains/(Losses) | | Net Unrealized
Appreciation | | Total
Earnings/(Loss) |
| $— | | $(2,879,535) | | $9,386,777 | | $6,507,242 |
The differences between book and tax basis components of net assets are primarily attributable to wash sale loss deferrals and other book and tax differences including swap contracts.
The tax character of distributions paid from ordinary income during the years ended April 30, 2013 and April 30, 2012 were $4,528,304 and $3,477,942, respectively. $0 and $1,544,800 were distributed from long term capital gains during the fiscal years ended April 30, 2013 and April 30, 2012, respectively.
On December 22, 2010, the Regulated Investment Company (“RIC”) Modernization Act of 2010 (the “Act”) was enacted. The Act modernizes several of the federal income and excise tax provisions related to RICs, and, with certain exceptions, is effective for taxable years beginning after December 22, 2010. Among the changes made are changes to the capital loss carryforward rules allowing for RICs to carry forward capital losses indefinitely and to retain the character of capital loss carryforwards as short-term or long-term. Rules in effect previously limited the carryforward period to eight years and all carryforwards were considered short-term in character. Capital loss carryforwards generated in taxable years beginning after the effective date of the Act must be fully used before capital loss carryforwards generated in taxable years prior to the effective date of the Act; therefore, under certain circumstances, capital loss carryforwards available as of the report date, if any, may expire unused. As of April 30, 2013, the Fund had a short-term post-effective capital loss carryforward with no expiration, available to offset future capital gains in the amount of $2,678,542.
Capital losses incurred after October 31 (“Post-October Losses”) within the taxable year can be deemed to arise on the first business day of the Fund’s next taxable year. At April 30, 2013, the Fund incurred and elected to defer to May 1, 2013 post-October losses of $152,411. In addition, the fund elected to defer late year ordinary losses in the amount of $48,582.
At April 30, 2013, the effect of permanent book/tax reclassifications resulted in increases (decreases) to the components of net assets as follows:
|
Undistributed
Net Investment
Income | | Accumulated
Capital
and Other
Gains/(Losses) | | Paid-in Capital |
| $63,799 | | $(63,243) | | $(556) |
For financial reporting purposes, capital accounts are adjusted to reflect the tax character of permanent book/tax differences. Reclassifications are primarily due to the tax treatment of swap contracts and pass-through investments.
6. INVESTMENT TRANSACTIONS
Purchases and sales of investments (excluding short-term investments) for the year ended April 30, 2013 were $508,278,741 and $549,753,499, respectively.
|
| Notes to Financial Statements (continued) |
| April 30, 2013 |
7. DERIVATIVE FINANCIAL INSTRUMENTS
Swaps: A swap agreement is an agreement between two parties pursuant to which the parties exchange payments at specified dates on the basis of a specified notional amount, with the payments calculated by reference to specified securities, indexes, reference rates or other instruments. Most swap agreements provide that when the period payment dates for both parties are the same, the payments are made on a net basis (i.e., the two payment streams are netted out, with only the net amount paid by one party to the other). The Fund’s obligations or rights under a swap agreement entered into on a net basis will generally be equal only to the net amount to be paid or received under the agreement, based on the relative values of the positions held by each counterparty. Swap agreements are not entered into or traded on exchanges and there is no central clearing or guaranty function for total return swaps. Therefore, swaps are subject to credit risk or the risk of default or non-performance by the counterparty. Swaps could result in losses if interest rate or credit quality changes are not correctly anticipated by the Fund or if the reference index, security or investments do not perform as expected.
When the Fund has an unrealized loss on a swap agreement, the Fund has instructed the custodian to pledge cash or liquid securities as collateral with a value at least equal to the amount of the unrealized loss. Collateral pledges are monitored and subsequently adjusted if and when the swap valuations fluctuate.
Total return swaps give the Fund the right to receive the appreciation in the value of a specified security, index or other instrument in return for a fee paid to the counterparty, which will typically be an agreed upon interest rate. Total return swaps can also be used to replicate an exposure to a short position in an asset class where the Fund has the right to receive the depreciation in value of a specified security, index or other instrument (“inverse swaps”). If the underlying asset in a total return swap declines in value (or increases in value, if an inverse swap) over the term of the swap, the Fund may also be required to pay the dollar value of that decline (or increase, if an inverse swap) to the counterparty.
During the year ended April 30, 2013, the Fund utilized swaps to affect long and short exposure to several asset classes, including, among others, real estate, international equity, investment grade corporate bonds, and U.S. short-term Treasury bonds. In addition, the Fund employed swaps to leverage the Fund’s portfolio by approximately 25%. Both types of exposures affected by the swaps were consistent with the exposures of the Fund’s underlying index. The Fund segregates liquid assets, which may include securities, cash or cash equivalents, to cover the Fund’s daily marked-to-market net obligations under outstanding swap agreements. At April 30, 2013, the Fund posted $151,498,541 as collateral for swaps.
Pursuant to documentation governing the Fund’s swap transactions between the Fund and Morgan Stanley Capital Services Inc. (“Morgan Stanley”), Morgan Stanley has the right to terminate the swaps early in the event that the net assets of the Fund decline below specific levels set forth in the documentation (“net asset contingent features”). In the event of early termination, Morgan Stanley may require the Fund to pay or receive a settlement amount in connection with the terminated swap transaction. As of April 30, 2013, the Fund has not triggered the conditions under such documentation that will give the counterparty the right to call for an early termination. As of such date, the settlement value of these contracts was approximately equal to the fair value of such contracts.
At April 30, 2013, the fair values of open total return swap contracts were zero and therefore no derivative instruments were reflected on the Statement of Assets and Liabilities. As a result of April 30, 2013 being a swap reset date, the swap values reset to zero and the net unrealized appreciation or depreciation settled through cash and is reflected in swap net realized gain on the statement of operations.
Transactions in derivative instruments reflected on the Statement of Operations during the year ended April 30, 2013, were as follows:
| | | Equity Risk | | | Total |
| Net Realized Gain | | | | | | |
| Swap transactions | | $ | 1,402,478 | | | $ | 1,402,478 |
| Net realized gain | | $ | 1,402,478 | | | $ | 1,402,478 |
For the year ended April 30, 2013, the monthly average notional value of the swap contracts held by the Fund was $64,330,970.
|
| Notes to Financial Statements (continued) |
| April 30, 2013 |
8. INVESTMENT RISKS
The Fund is subject to the principal risks described below, some or all of these risks may adversely affect the Fund’s NAV, yield, total return and ability to meet its investment objective. As with any investment, an investment in the Fund could result in a loss or the performance of the Fund could be inferior to that of other investments.
Fund of Funds Risk
The Fund’s investment performance, because it is a fund of funds, depends on the investment performance of the underlying ETFs in which it invests. An investment in the Fund is subject to the risks associated with the underlying ETFs that comprise the Fund’s underlying Index. The Fund will indirectly pay a proportional share of the asset-based fees, if any, of the underlying ETFs in which it invests.
Exchange Traded Vehicle Risk
Unlike an investment in a mutual fund, the value of the Fund’s investment in ETFs, exchange-traded vehicles (“ETVs”), and ETNs is based on stock market prices and the Fund could lose money due to stock market developments, the failure of an active trading market to develop or exchange trading halts or de-listings. Federal law prohibits the Fund from acquiring investment company shares, including shares of ETFs, in excess of specific thresholds unless exempted by rule, regulation or exemptive order. These prohibitions may prevent the Fund from allocating its investments to ETFs in an optimal manner.
Index Risk
The underlying Index may not be successful in replicating the performance of its target strategies. There is a risk that hedge fund return data provided by third party hedge fund data providers may be inaccurate or may not accurately reflect hedge fund returns due to survivorship bias, self-reporting bias or other biases. In constructing the underlying Strategies of the Index, IndexIQ may not be successful in replicating the returns of the hedge fund indexes. In addition, the Index may not achieve its objective of producing superior returns to the S&P 500 Index with lower volatility than the S&P 500 Index and a correlation to the S&P 500 Index that is similar to the correlation between the performance of hedge funds (as measured by broad-based hedge fund indexes) and the S&P 500 Index.
Industry Concentration Risk
The Fund will not invest 25% or more of the value of its total assets in the securities of one or more issuers conducting their principal business activities in the same industry or group of industries; except that, to the extent that the underlying Index is concentrated in a particular industry, the Fund also will be concentrated in that industry. The risk of concentrating Fund investments in a limited number of issuers conducting business in the same industry or group of industries will subject the Fund to a greater risk of loss as a result of adverse economic, business or other developments than if its investments were diversified across different industry sectors.
Total Return Swaps
The Fund intends to use total return swaps in several ways to replicate the performance of the Index. Consequently, the performance of the Fund’s total return swaps will be a significant component of the Fund’s performance. Risks may arise as a result of the failure of the counterparty to the swap contract to comply with the terms of the swap contract. Therefore the Fund considers the creditworthiness of the counterparty to a swap contract in evaluating potential credit risk. Additionally, risks may arise from unanticipated movements in interest rates or in the value of the underlying instruments.
9. SUBSEQUENT EVENTS
The Fund has evaluated subsequent events through the date of issuance of this report and has determined that there are no other material events that would require disclosure.
|
| Report of Independent Registered Public Accounting Firm |
To the Board of Trustees of IndexIQ Trust and Shareholders
of IQ ALPHA Hedge Strategy Fund:
We have audited the accompanying statement of assets and liabilities of IQ ALPHA Hedge Strategy Fund (the “Fund”), the fund constituting the IndexIQ Trust, including the schedule of investments, as of April 30, 2013, and the related statement of operations for the year then ended, the statement of changes in net assets for each of the two years in the period then ended, and the financial highlights for each of the periods indicated therein. These financial statements and financial highlights are the responsibility of the Fund’s management. Our responsibility is to express an opinion on these financial statements and financial highlights based on our audits.
We conducted our audits in accordance with the standards of the Public Company Accounting Oversight Board (United States). Those standards require that we plan and perform the audit to obtain reasonable assurance about whether the financial statements and financial highlights are free of material misstatement. We were not engaged to perform an audit of the Fund’s internal control over financial reporting. Our audits included consideration of internal control over financial reporting as a basis for designing audit procedures that are appropriate in the circumstances, but not for the purpose of expressing an opinion on the effectiveness of the Fund’s internal control over financial reporting. Accordingly, we express no such opinion. An audit also includes examining, on a test basis, evidence supporting the amounts and disclosures in the financial statements and financial highlights, assessing the accounting principles used and significant estimates made by management, and evaluating the overall financial statement presentation. Our procedures included confirmation of securities owned as of April 30, 2013, by correspondence with the custodian and others. We believe that our audits provide a reasonable basis for our opinion.
In our opinion, the financial statements and financial highlights referred to above present fairly, in all material respects, the financial position of IQ ALPHA Hedge Strategy Fund of the IndexIQ Trust at April 30, 2013, and the results of its operations for the year then ended, the changes in its net assets for each of the two years in the period then ended, and the financial highlights for each of the periods indicated therein, in conformity with U.S. generally accepted accounting principles.

New York, New York
June 28, 2013
|
| Supplemental Information (unaudited) |
Federal Tax Status of Dividends Declared During the Tax Year
Qualified Dividend Income — Certain dividends paid by the Fund may be subject to a maximum tax rate of 15%, as provided for by the Jobs and Growth Tax Relief Reconciliation Act of 2003. The percentage of ordinary income distributions for the fiscal year ended April 30, 2013, taxed at a maximum rate of 15% is 20.84%.
Dividend Received Deduction — For corporate shareholders, the percentage of ordinary income distributions for the year ended April 30, 2013 that qualifies for the dividends received deduction is 10.04%.
In January 2014, you will be advised on IRS Form 1099 DIV as to the Federal tax status of the distributions received by you in calendar year 2013.
|
| Board of Trustees and Officers (unaudited) |
The business of the Trust is managed under the direction of the Trust’s Board of Trustees. The Board elects the officers of the Trust who are responsible for administering the Trust’s day-to-day operations. Each Trustee serves until his or her successor is duly elected or appointed and qualified.
The name, year of birth, address and principal occupations during the past five years for each Trustee and Officer of the Trust is set forth below, along with the other public directorships held by the Trustees.
Name and
Year of Birth1 | | Position(s)
Held with
Trust | | Term of
Office and
Length of
Time Served2 | | Principal Occupation(s) During Past 5 Years3 | | Number of
Portfolios
in Fund
Complex
Overseen
by Trustee4 | | Other
Directorships
Held by
Trustee |
Reena Aggarwal
1957 | | Trustee | | Since
August
2008 | | Deputy Dean, McDonough School of Business, Georgetown University (2006 to 2008); Visiting Professor of Finance, Sloan School of Management, MIT (2005 to 2006); Robert E. McDonough Professor (2003-present) and Professor of Finance, McDonough School of Business, Georgetown University (2000-present). | | 12 | | FBR Funds
(2006-2011) |
| | | | | | | | | | |
Gene Chao
1970 | | Trustee | | Since
August
2008 | | Vice President, Global Industries Strategy & Solutions, Juniper Networks (2011 to present);Vice President and GM, Global Network, Hewlett-Packard (2010 to 2011); Vice President, Strategic Services, Dimension Data, Americas (2007 to 2010); Senior Vice President, Strategic Outsourcing, France Telecom Americas (2004 to 2007). | | 12 | | None |
| | | | | | | | | | | |
| Interested Trustee5 |
Adam S. Patti
1970 | | Chairman
and
Trustee
| | Since
November
2008
| | Chairman, Trustee, President and Principal Executive, IndexIQ Trust (2008 to present); Chief Executive Officer, the Advisor (2007 to present); Chief Executive Officer, IndexIQ (2006 to present); Associate Publisher, Time Inc. (2006). | | 12 | | None |
| | | President
and
Principal
Executive
Officer | | Since
July
2008 | | | | | |
| Officers of the Trust |
| | | | | | | |
Name and
Year of Birth1 | | Position(s)
Held with Trust | | Term of Office
and Length of
Time Served2 | | Principal Occupation(s) During Past 5 Years |
Gregory D. Bassuk
1972 | | Secretary | | Since
July 2008 | | Chief Compliance Officer, the Advisor (2008 to present); Secretary, IndexIQ Trust (2008 to present); Chairman and Trustee, IndexIQ ETF Trust (July 2008 to November 2008); Chairman and Trustee, IndexIQ Trust (February 2008 to November 2008); Chief Operating Officer, the Advisor (2007 to present); Chief Operating Officer, IndexIQ (2006 to present); Director, Time Inc. (2004 to 2006). |
| | | | | | | |
David Fogel
1971 | | Treasurer,
Principal
Financial
Officer and
Chief
Compliance
Officer | | Since
October 2008 | | Executive Vice President, IndexIQ Trust (2011 to present); Treasurer, Principal Financial Officer and Chief Compliance Officer, IndexIQ Trust (2008 to present); Executive Vice President, IndexIQ (2006 to present); Vice President, Groton Partners LLC (2005 to 2006). |
| | | | | | | |
| | | Executive Vice
President | | Since June
2011 | | |
| 1 | The address of each Trustee or Officer is c/o IndexIQ, 800 Westchester Avenue, Suite N-611, Rye Brook, New York 10573. |
| 2 | Trustees and Officers serve until their successors are duly elected and qualified. |
| 3 | Principal occupations(s) of the Trustees may cover more than the past five years. |
| 4 | The Funds are part of a “fund complex” as defined in the 1940 Act. The fund complex includes all open-end funds (including all of their portfolios) advised by the Advisor and any funds that have an investment advisor that is an affiliated person of the Advisor. |
| 5 | Mr. Patti is an “interested person” of the Trust (as that term is defined in the 1940 Act) because of his affiliations with the Advisor. |
|
| Board Review of Investment Advisory Agreement (unaudited) |
At the March 13, 2013 meeting of the Board of Trustees (the “Board”) of IndexIQ Trust (the “Trust”), the Board, including those Trustees who are not “interested persons” of the Trust (the “Independent Trustees”), as that term is defined in the Investment Company Act of 1940, as amended (“1940 Act”), approved IndexIQ Advisors LLC (“IndexIQ”) to continue to serve as investment adviser to the Fund and approved the continuation of the investment advisory agreement between IndexIQ and the Trust with respect to the Fund (the “Investment Advisory Agreement”), upon the same terms and conditions set forth therein, for the period May 12, 2013 until May 12, 2014. In connection with considering approval of the Investment Advisory Agreement, the Independent Trustees met in executive session with counsel to the Trust, who provided assistance and advice.
In considering the approval of the continuation of the Investment Advisory Agreement for an additional year, the Independent Trustees reviewed the materials provided for the Meeting by the IndexIQ, including: (i) a copy of the Investment Advisory Agreement with IndexIQ; (ii) information describing the nature, quality, and extent of the services that IndexIQ provides to the Fund, and the fees that IndexIQ receives from the Fund; (iii) information concerning business and operations, compliance program and portfolio management team of IndexIQ; (iv) a copy of the current Form ADV for IndexIQ; and (v) memoranda from Katten Muchin Rosenman LLP on the fiduciary responsibilities of trustees, including the Independent Trustees, in considering advisory arrangements under the 1940 Act. The independent Trustees also considered the information presented at Board meetings throughout the year. In addition, the Independent Trustees received data comparing the advisory fees, expenses and performance of the Fund with expenses and performance of other funds with similar investment objectives and policies.
During their review of this information, the Independent Trustees focused on and analyzed the factors they deemed relevant, including: (1) the nature, quality, and extent of the services provided to the Fund by IndexIQ; (2) the personnel and operations of IndexIQ; (3) the investment performance of the Fund; (4) IndexIQ’s financial condition and profitability; (5) potential “fall-out” benefits to IndexIQ and its affiliates (i.e., ancillary benefits that may be realized by IndexIQ and its affiliates from IndexIQ’s relationship with the Fund); and (6) possible conflicts of interest.
In particular, the Board considered and discussed the following with respect to the Fund:
| (a) | The nature, extent, and quality of services provided to the Funds by IndexIQ. The Board reviewed the services that IndexIQ provides to the Fund. The Board noted the responsibilities that IndexIQ has as the Fund’s investment adviser, including overall supervisory responsibility for the general management and investment of the Fund’s securities portfolio, daily monitoring of tracking error and quarterly reporting to the Board, and the implementation of Board directives as they relate to the Fund. |
The Board reviewed the experience, resources, and strengths of IndexIQ in the Fund and the IndexIQ ETF Trust’s ETFs, as well as separately managed accounts. Based on their consideration and review of the foregoing information, the Board determined that the Fund was likely to continue to benefit from the nature, quality, and extent of these services, as well as IndexIQ’s ability to render such services based on its experience, operations, and resources.
| (b) | Comparison of services provided and fees charged by IndexIQ and other investment advisers to similar clients, and the cost of the services provided and profits realized by IndexIQ from its relationship with the Fund. The Board then compared both the services rendered and the fees paid pursuant to the Investment Advisory Agreement to contracts of other registered investment advisers providing services to similar funds. In particular, the Board compared the Fund’s advisory fee and expense ratio to other investment companies considered to be in the Fund’s peer group. It was noted that IndexIQ has an expense limitation agreement whereby IndexIQ reimburses expenses and/or waives fees to keep the expenses of the Investor Class shares and Institutional Class shares of the Fund from exceeding 1.65% of average daily net assets. |
After comparing the Fund’s fees with those of other funds in the Fund’s peer group, and in light of the nature, quality, and extent of services provided by IndexIQ and the costs incurred by IndexIQ in rendering those services, the Board concluded that the level of fees paid to IndexIQ with respect to the Fund was fair and reasonable.
|
| Board Review of Investment Advisory Agreement (unaudited) (continued) |
| (c) | IndexIQ’s profitability and the extent to which economies of scale would be realized as the Fund grows and whether fee levels would reflect such economies of scale. The Board discussed with IndexIQ the costs and profitability of IndexIQ in connection with its serving as investment adviser to the Fund, including operational costs. |
| (d) | Investment performance of IndexIQ. The Board considered the investment performance of the Fund, including tracking error. In particular, the Board considered the investment performance of the Fund relative to its stated objectives and the success of IndexIQ in reaching such objectives. The Board considered the Fund’s investment performance compared to the benchmark index, the S&P 500® Index, that the Fund uses for comparison in its prospectus and shareholder reports. The Board also considered the Fund’s investment performance compared to the average of the Fund’s peer group. |
Conclusion. No single factor was determinative to the decision of the Board. Based on the foregoing and such other matters as were deemed relevant, the Board concluded that the advisory fee rate and total expense ratio was reasonable in relation to the services provided by IndexIQ to the Fund, as well as the costs incurred and benefits gained by IndexIQ in providing such services. The Board also found the investment advisory fee to be reasonable in comparison to the fees charged by investment advisers to other comparable Funds of similar size. As a result, the Board determined that the continuation of the Investment Advisory Agreement with IndexIQ and the Expense Limitation Agreement was in the best interests of the Fund and its shareholders.

ANNUAL REPORT | APRIL 30, 2013
IndexIQ Trust
IQ ALPHA
Hedge Strategy Fund

Investment Advisor
IndexIQ Advisors LLC
800 Westchester Avenue, Suite N-611
Rye Brook, NY 10573
Custodian/Fund Administrator
The Bank of New York Mellon
One Wall Street
New York, NY 10286
Legal Counsel
Katten Muchin Rosenman, LLP
575 Madison Avenue
New York, New York 10022
Independent Registered Public Accounting Firm
Ernst & Young LLP
5 Times Square
New York, NY 10036
Transfer Agent
BNY Mellon Investment Servicing (U.S.) Inc.
301 Bellevue Parkway
Wilmington, DE 19809
Distributor
ALPS Distributors, Inc.
1290 Broadway, Suite 1100
Denver, CO 80203
IQ ALPHA Hedge Strategy Fund
c/o IndexIQ
800 Westchester Avenue, Suite N-611
Rye Brook, NY 10573
1-888-934-0777
Item 2. Code of Ethics.
| (a) | The registrant, as of the end of the period covered by this report, has adopted a code of ethics that applies to the registrant’s principal executive officer, principal financial officer, principal accounting officer or controller, or persons performing similar functions, regardless of whether these individuals are employed by the registrant or a third party. |
| (c) | There have been no amendments, during the period covered by this report, to a provision of the code of ethics that applies to the registrant’s principal executive officer, principal financial officer, principal accounting officer or controller, or persons performing similar functions, regardless of whether these individuals are employed by the registrant or a third party, and that relates to any element of the code of ethics description. |
| (d) | The registrant has not granted any waivers, including an implicit waiver, from a provision of the code of ethics that applies to the registrant’s principal executive officer, principal financial officer, principal accounting officer or controller, or persons performing similar functions, regardless of whether these individuals are employed by the registrant or a third party, that relates to one or more of the items set forth in paragraph (b) of this item’s instructions. |
Item 3. Audit Committee Financial Expert.
The Registrant’s Board of Trustees has one audit committee financial expert serving on its audit committee, an “independent” Trustee, Reena Aggarwal. Under applicable securities laws, a person who is determined to be an audit committee financial expert will not be deemed an “expert” for any purpose, including without limitation for the purposes of Section 11 of the Securities Act of 1933, as a result of being designated or identified as an audit committee financial expert. The designation or identification of a person as an audit committee financial expert does not impose on such person any duties, obligations, or liabilities that are greater than the duties, obligations, and liabilities imposed on such person as a member of the audit committee and Board of Trustees in the absence of such designation or identification.
Item 4. Principal Accountant Fees and Services.
Audit Fees
| (a) | The aggregate fees billed for each of the last two fiscal years for professional services rendered by the principal accountant for the audit of the registrant's annual financial statements or services |
that are normally provided by the accountant in connection with statutory and regulatory filings or engagements for those fiscal years are $48,000 for 2013 and $35,000 for 2012.
Audit-Related Fees
| (b) | The aggregate fees billed in each of the last two fiscal years for assurance and related services by the principal accountant that are reasonably related to the performance of the audit of the registrant's financial statements and are not reported under paragraph (a) of this Item are $0 for 2013 and $0 for 2012. |
Tax Fees
| (c) | The aggregate fees billed in each of the last two fiscal years for professional services rendered by the principal accountant for tax compliance, tax advice, and tax planning are $7,600 for 2013 and $5,600 for 2012. |
All Other Fees
| (d) | The aggregate fees billed in each of the last two fiscal years for products and services provided by the principal accountant, other than the services reported in paragraphs (a) through (c) of this Item are $0 for 2013 and $0 for 2012. |
| (e)(1) | Per Rule 2-01(c)(7)(A), the Audit Committee pre-approves all of the Audit, Audit-Related, Tax and Other Fees of the Registrant. |
| (e)(2) | 100% of services described in each of Items 4(b) through (d) were approved by the audit committee pursuant to paragraph (c)(7)(A) of Rule 2-01 of Regulation S-X. |
| (g) | The aggregate non-audit fees billed by the registrant's accountant for services rendered to the registrant, and rendered to the registrant's investment adviser (not including any sub-adviser whose role is primarily portfolio management and is subcontracted with or overseen by another investment adviser), and any entity controlling, controlled by, or under common control with the adviser that provides ongoing services to the registrant for each of the last two fiscal years of the registrant was $7,600 for 2013 and $5,600 for 2012. |
Item 5. Audit Committee of Listed registrants.
| (a) | The Fund has a designated Audit Committee in accordance with Section 3(a)(58)(A) of the Securities and Exchange Act of 1934 (the “Exchange Act”) and the members of such committee are Reena Aggarwal and Gene Chao. |
Item 6. Investments.
| (a) | Schedule of Investments in securities of unaffiliated issuers as of the close of the reporting period is included as part of the report to shareholders filed under Item 1 of this form. |
| Item 7. | Disclosure of Proxy Voting Policies and Procedures for Closed-End Management Investment Companies. |
Not applicable.
| Item 8. | Portfolio Managers of Closed-End Management Investment Companies. |
Not applicable.
| Item 9. | Purchases of Equity Securities by Closed-End Management Investment Company and Affiliated Purchasers. |
Not applicable.
| Item 10. | Submission of Matters to a Vote of Security Holders. |
There have been no material changes to the procedures by which the shareholders may recommend nominees to the registrant’s board of directors, where those changes were implemented after the registrant last provided disclosure in response to the requirements of Item 407(c)(2)(iv) of Regulation S-K (17 CFR 229.407) (as required by Item 22(b)(15) of Schedule 14A (17 CFR 240.14a-101)), or this Item.
| Item 11. | Controls and Procedures. |
| (a) | The registrant’s principal executive and principal financial officers, or persons performing similar functions, have concluded that the registrant’s disclosure controls and procedures (as defined in Rule 30a-3(c) under the Investment Company Act of 1940, as amended (the “1940 Act”) (17 CFR 270.30a-3(c))) are effective, as of a date within 90 days of the filing date of the report that includes the disclosure required by this paragraph, based on their evaluation of these controls and procedures required by Rule 30a-3(b) under the 1940 Act (17 CFR 270.30a-3(b)) and Rules 13a-15(b) or 15d-15(b) under the Securities Exchange Act of 1934, as amended (17 CFR 240.13a-15(b) or 240.15d-15(b)). |
| (b) | There were no changes in the registrant’s internal control over financial reporting (as defined in Rule 30a-3(d) under the 1940 Act (17 CFR 270.30a-3(d)) that occurred during the registrant’s second fiscal quarter of the period covered by this report that has materially affected, or is reasonably likely to materially affect, the registrant’s internal control over financial reporting. |
| (a)(1) | Code of ethics, or any amendment thereto, that is the subject of disclosure required by Item 2 is attached hereto. |
| (a)(2) | Certifications pursuant to Rule 30a-2(a) under the 1940 Act and Section 302 of the Sarbanes-Oxley Act of 2002 are attached hereto. |
| (b) | Certifications pursuant to Rule 30a-2(b) under the 1940 Act and Section 906 of the Sarbanes-Oxley Act of 2002 are attached hereto. |
(12.other) Not applicable.
SIGNATURES
Pursuant to the requirements of the Securities Exchange Act of 1934 and the Investment Company Act of 1940, the registrant has duly caused this report to be signed on its behalf by the undersigned, thereunto duly authorized.
| (Registrant) | IndexIQ Trust |
| By (Signature and Title)* | /s/ Adam S. Patti |
| | Adam S. Patti, Principal Executive Officer |
Pursuant to the requirements of the Securities Exchange Act of 1934 and the Investment Company Act of 1940, this report has been signed below by the following persons on behalf of the registrant and in the capacities and on the dates indicated.
| By (Signature and Title)* | /s/ Adam S. Patti |
| | Adam S. Patti, Principal Executive Officer |
| By (Signature and Title)* | /s/ David L. Fogel |
| | David L. Fogel, Principal Financial Officer |
* Print the name and title of each signing officer under his or her signature.