| | | | | |
| Fellow Shareholders, | July 28, 2022 |
In Q2, there was a significant slowdown in TV advertising spend due to the macro-economic environment, which pressured our platform revenue growth. Consumers began to moderate discretionary spend, and advertisers significantly curtailed spend in the ad scatter market (TV ads bought during the quarter). We expect these challenges to continue in the near term as economic concerns pressure markets worldwide. In response, we took steps in Q2 to significantly slow both operating expense and headcount growth. While our revenue and gross profit growth have slowed, we continue to win advertising share and grow active accounts. We remain confident in our industry leadership in TV streaming, the size of the opportunity in front of us, and our unique assets, including the Roku TV OS, The Roku Channel, and our ad platform
Q2 2022 Key Results
•Total net revenue grew 18% year over year (YoY) to $764 million
•Platform revenue increased 26% YoY to $673 million
•Gross profit was up 5% YoY to $355 million
•Roku added 1.8 million incremental active accounts to reach 63.1 million
•Streaming hours were 20.7 billion hours, a decrease of 0.2 billion hours from last quarter
•Average Revenue Per User (ARPU) grew to $44.10 (trailing 12-month basis), up 21% YoY
•We surpassed a milestone with $1 billion in Upfront commitments1
| | | | | | | | | | | | | | | | | | | | | | | | | | | | | | | | | | | |
| Key Operating Metrics | Q2 21 | | Q3 21 | | Q4 21 | | Q1 22 | | Q2 22 | | YoY % |
| Active Accounts (millions) | 55.1 | | | 56.4 | | | 60.1 | | | 61.3 | | | 63.1 | | | 14 | % |
| Streaming Hours (billions) | 17.4 | | | 18.0 | | | 19.5 | | | 20.9 | | | 20.7 | | | 19 | % |
| ARPU ($) | $ | 36.46 | | | $ | 40.10 | | | $ | 41.03 | | | $ | 42.91 | | | $ | 44.10 | | | 21 | % |
| | | | | | | | | | | |
| Summary Financials ($ in millions) | Q2 21 | | Q3 21 | | Q4 21 | | Q1 22 | | Q2 22 | | YoY % |
| Platform revenue | $ | 532.3 | | $ | 582.5 | | $ | 703.6 | | $ | 646.9 | | $ | 673.2 | | 26 | % |
| Player revenue | 112.8 | | 97.4 | | 161.7 | | 86.8 | | 91.2 | | (19) | % |
| Total net revenue | 645.1 | | 680.0 | | 865.3 | | 733.7 | | 764.4 | | 18 | % |
| Platform gross profit | 345.0 | | 378.5 | | 425.6 | | 379.9 | | 377.1 | | 9 | % |
| Player gross profit (loss) | (6.7) | | (14.6) | | (45.9) | | (15.1) | | (22.0) | | nm |
| Total gross profit | 338.3 | | 363.9 | | 379.6 | | 364.8 | | 355.1 | | 5 | % |
| Platform gross margin % | 64.8 | % | | 65.0 | % | | 60.5 | % | | 58.7 | % | | 56.0 | % | | (8.8)pts |
| Player gross margin % | (5.9) | % | | (15.0) | % | | (28.4) | % | | (17.4) | % | | (24.1) | % | | (18.1)pts |
| Total gross margin % | 52.4 | % | | 53.5 | % | | 43.9 | % | | 49.7 | % | | 46.5 | % | | (6.0)pts |
| Research and development | 113.3 | | 120.3 | | 126.4 | | 164.0 | | 196.6 | | 74 | % |
| Sales and marketing | 93.7 | | 109.7 | | 163.4 | | 146.5 | | 185.0 | | 97 | % |
| General and administrative | 62.2 | | 65.1 | | 68.5 | | 77.8 | | 84.1 | | 35 | % |
| Total operating expenses | 269.2 | | 295.1 | | 358.3 | | 388.3 | | 465.7 | | 73 | % |
| Income (loss) from operations | 69.1 | | 68.8 | | 21.4 | | (23.5) | | (110.5) | | (260) | % |
Adjusted EBITDA A | 122.4 | | 130.1 | | 86.7 | | 57.6 | | (12.1) | | (110) | % |
| Adjusted EBITDA margin % | 19.0 | % | | 19.1 | % | | 10.0 | % | | 7.8 | % | | (1.6) | % | | (20.6)pts |
| | | | | | | | | | | |
| Outlook ($ in millions) | Q3 2022E | | | | A Refer to the reconciliation of net income (loss) to adjusted EBITDA in the non-GAAP information in an appendix to this letter. |
| Total net revenue | $700 | | | |
| Total gross profit | $325 | | | | B Q3 2022E reconciling items between net income (loss) and non-GAAP adjusted EBITDA consist of stock-based compensation of approximately $100 million, depreciation and amortization and other net adjustments of approximately $15 million. |
| Net income (loss) | $(190) | | | |
Adjusted EBITDA B | $(75) | | | |
1 The Upfront process began in Q2 and concluded in Q3.
| | |
| Roku Q2 2022 Shareholder Letter |
1
Account Acquisition
In Q2, we added 1.8 million incremental Active Accounts to reach 63.1 million. Reduced consumer discretionary spend is pressuring many verticals including TV and player sales. Retailers managed through elevated U.S. TV inventory and temporarily lowered TV prices in Q2, which helped soften the decline in TV unit sales in the quarter. Overall U.S. TV and player industry sales, as well as Roku TV and player unit sales, were lower than Q2 2021. With our growing ARPU, we continued to absorb higher costs in our player business to insulate consumers from price increases. This resulted in player gross margin being down 18 points year over year.
In Q2, the Roku operating system (OS) remained the No. 1 selling smart TV OS in the U.S. The Roku OS was the No. 2 selling smart TV OS (and the No. 1 licensed smart TV OS) in Mexico, where nearly 1 in 4 smart TVs sold was a Roku TV model. With our partner Elektra in Mexico, we recently introduced a new line-up of HKPRO Roku TV models in screen sizes ranging from 32 to 55 inches. In Canada, we extended our partnership with Walmart with the launch of onn. Roku TV models. This follows the launch of the CTV channel on the Roku platform, giving viewers in Canada access to live and on demand programming from the country’s most-watched television network. And in the U.S., we announced our first outdoor Roku TV model, the Outdoor Element Roku TV.
Our streaming devices continue to be recognized for their value and the outstanding experience they provide our customers. Tom’s Guide recently named the Roku® Streaming Stick® 4K the "Best streaming device.” Forbes named the Roku Streaming Stick 4K the “Best Budget-Friendly 4K Streaming Device” and the Roku Ultra the “Best Full-Featured 4K Streaming Device Overall.” And Popular Science named the Roku Streambar the “Best Soundbar Under $100”and the Roku Streambar Pro the “Best Soundbar Under $200.”
Engagement
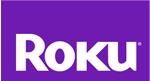
Globally, our users streamed 20.7 billion hours in Q2, an increase of 19% year over year. In Q2, our Streaming Hours per Active Account per day was 3.7 hours globally vs. 7.5 hours of legacy pay TV per day consumed by the average U.S. household (Nielsen). We believe there is room to grow our engagement and closing this gap represents a significant opportunity.
Content Distribution
With the growing availability of live programming such as sports and news on TV streaming, the last foothold of legacy pay TV in the U.S. is diminishing. Hugely popular sports leagues, including the NFL, MLB, NBA, and MLS are all shifting their presence to streaming. NFL Thursday night games and a selection of Friday night MLB games are now both exclusively on streaming. For the NBA Finals, reach on the Roku platform2 increased 34% year over year vs 10% on legacy pay TV. And in a historic first, fans around the world will be able to stream every MLS match, without any local blackouts/restrictions or the need for a legacy pay TV bundle. By next year, less than half of U.S. households are expected to have legacy pay TV (according to eMarketer).
2 Streaming viewership accounts for livestream on channels that were airing the game live and excludes vMVPDs.
| | |
| Roku Q2 2022 Shareholder Letter |
2
As consumers’ wages and savings are eroded by inflation, consumers can be expected to seek even more value with their discretionary spend, which TV streaming provides. To provide a variety of pricing tier choices, many popular subscription services are launching discounted, ad-supported options. We believe that free, ad-supported services like The Roku Channel are well positioned to benefit as consumers seek to lower their expenses.
The Roku Channel
Roku continues to be a leader in free, ad-supported TV streaming. In Q2, The Roku Channel was, once again, a top 5 channel on our platform in the U.S. by Active Account reach and by Streaming Hour engagement. With more than 300 free channels across news, sports, music, and entertainment, The Roku Channel’s linear offering was the #1 FAST3 service by Active Account reach and Streaming Hour engagement on the Roku platform in the U.S.
As more TV viewing shifts to streaming, users are seeking easy access to the content they are used to from legacy pay TV. In June, we partnered with NBCUniversal Local to launch local news channels on The Roku Channel in major markets around the U.S., providing local weather, news and other programming, including upcoming mid-term elections coverage. Also in June, we launched Espacio Latino in the U.S., a new destination that offers thousands of hours of Spanish-language programming, powered by a variety of new and existing partners.
Roku Originals continue to build momentum with both users and advertisers. In June, we premiered the second season of “Chrissy’s Court," which was our top-rated unscripted Roku Originals launch ever by reach and delivered four times the unique views of the first season premiere. We also launched “Idea House: Mountain Modern,” an all-new 10-episode series from “This Old House,” with Best Buy serving as presenting sponsor. Advertisers have been excited about the unique opportunities to engage with Roku Originals and popular talent, including our upcoming feature film “WEIRD: The Al Yankovic Story,” which will debut on November 4.
3 FAST: free ad supported linear streaming TV does not include on-demand content.
| | |
| Roku Q2 2022 Shareholder Letter |
3
The “WEIRD: The Al Yankovic Story” teaser trailer (https://www.roku.com/investor)
amassed 500 million impressions on social media within the first 48 hours of its release.
The Roku Channel's expanding breadth of content enables us to appeal to more users, drive increased interest from advertisers, and attract more content partners who want to capitalize on the growing opportunities in streaming. While we will grow our investments in Roku Originals in order to provide new exclusive content for users and advertisers, the foundation of our content spend will continue to be revenue share and fixed licensing agreements, including output deals. Spend will be commensurate not only with the scale and growth of The Roku Channel, but also with the broader macro environment.
Monetization
In Q2, Platform revenue increased 26% year over year to $673 million. This growth was lower than expected as many marketers abruptly curtailed or paused advertising spend in the ad scatter market during the latter half of Q2. According to a survey by Advertiser Perceptions, 47% of advertisers in the U.S. say they made in-quarter pauses on ad spending on TV streaming, 44% on digital video, and 42% on legacy pay TV. We believe this pullback mirrors the start of the pandemic in 2020, when marketers prepared for macro uncertainties by quickly reducing ad spend across all platforms.
Despite a challenging ad environment, we closed Upfront deals for the 2022-2023 TV season with all seven major agency holding companies and surpassed a milestone of $1 billion in total commitments. We continue to take ad dollar share away from traditional TV. Our negotiations with brand advertisers occurred at the same time as the broadcast networks, signaling a strategic shift to TV streaming, and 25% of all advertisers who committed to Roku during the Upfronts were new commitments (did not participate last year).
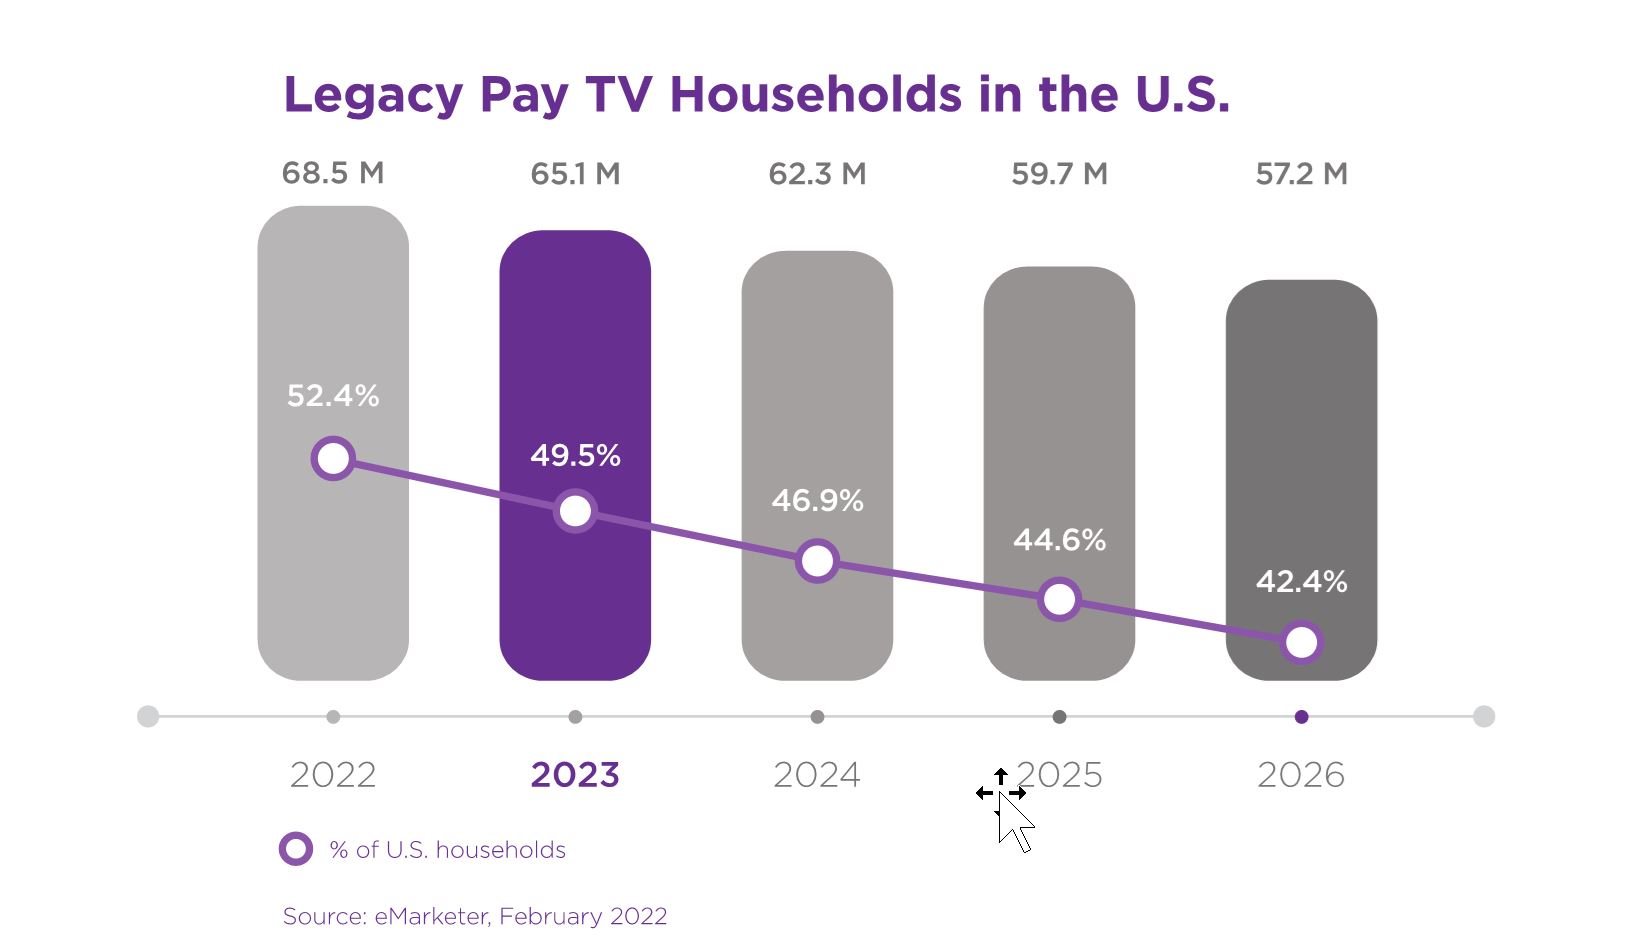
We continue to invest in our ad platform for future growth. We recently announced a new product called Shoppable Ads, which make shopping on TV streaming as easy as it is on social media. Viewers simply press “OK” with their Roku remote on a shoppable ad and proceed to checkout with their shipping and payment details pre-populated from Roku Pay, our proprietary payments platform. Walmart will be the exclusive retailer for the launch, a first-of-its-kind partnership. We also announced an industry-first collaboration with Microsoft that will quantify how TV advertising on both legacy pay TV and TV streaming impacts online searches to help marketers measure performance.
| | |
| Roku Q2 2022 Shareholder Letter |
4
Shoppable Ads make shopping on TV streaming as easy as it is on social media.
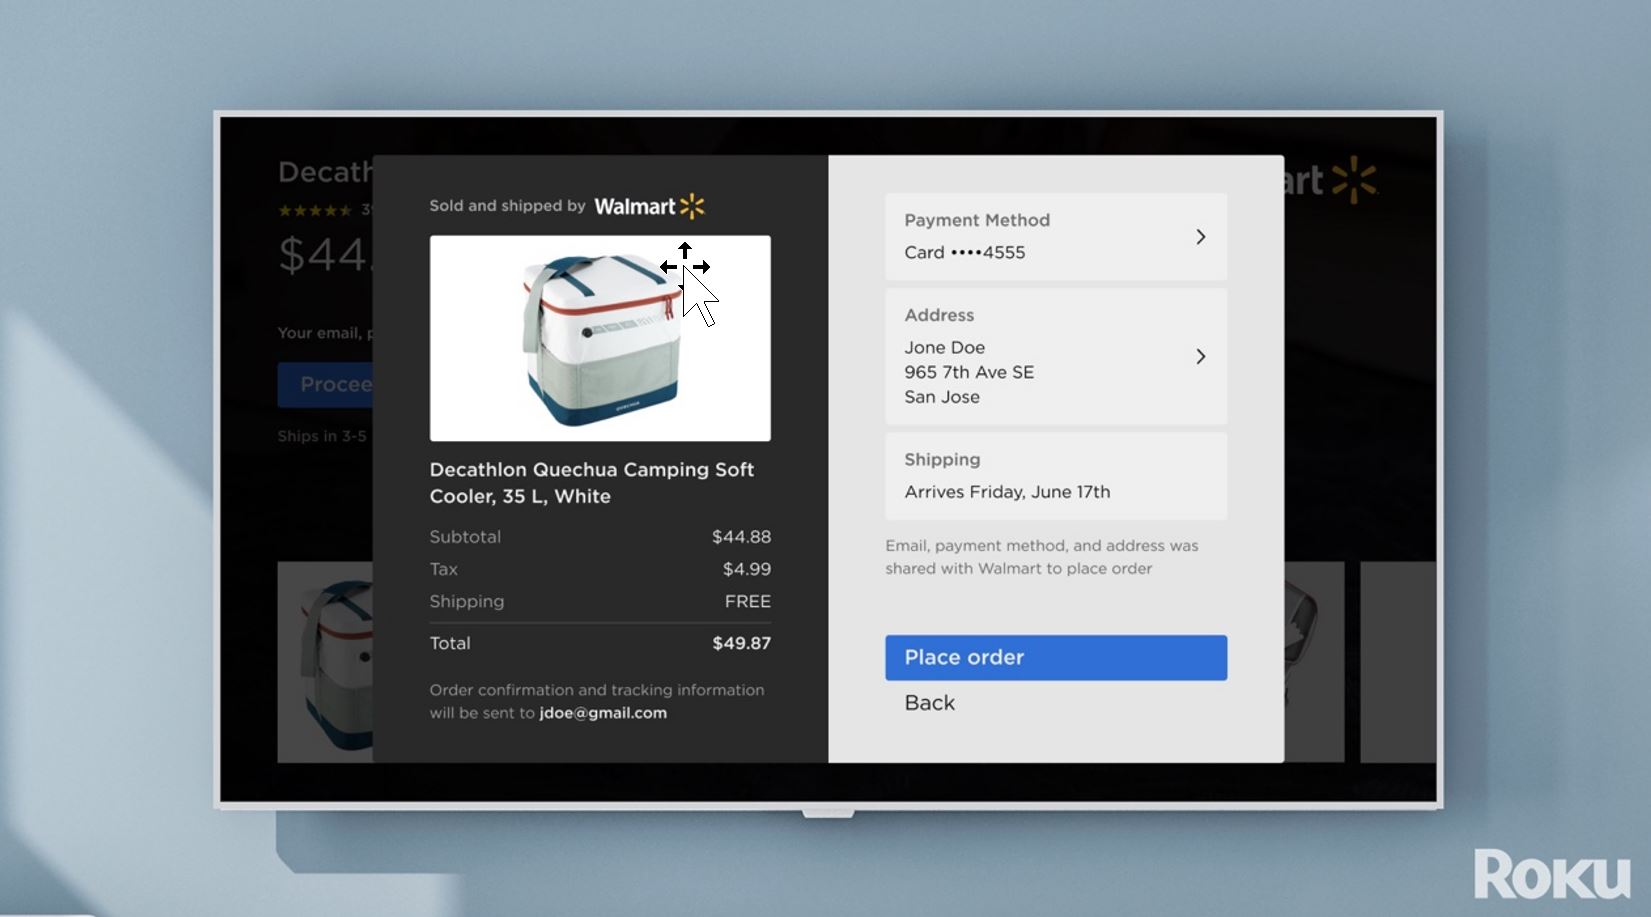
The significant and long-term opportunity in TV streaming is not changed by the current economic cycle. At the start of the pandemic, ad spend slowed but ultimately rebounded as advertisers reset, and in many cases accelerated, budgets into higher ROI mediums like TV streaming. Furthermore, a significant gap remains between TV streaming viewership and ad spend. In Q2, U.S. consumers aged 18-49 spent more than half of their TV time streaming while advertisers are expected to spend just 22% of U.S. TV ad budgets on streaming in 2022. Over time, we expect this gap to close as advertising dollars continue to follow audiences to TV streaming.
| | |
| Roku Q2 2022 Shareholder Letter |
5
Case Study
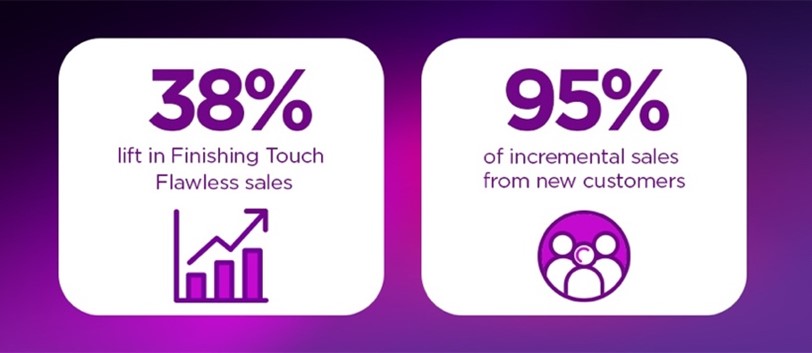
Finishing Touch Flawless wanted to find new customers in the beauty category. The DTC (direct to consumer) brand launched a campaign on Roku’s OneView Ad Platform and used our proprietary ACR (automatic content recognition) data to exclude streamers exposed to its traditional TV ads to drive incremental reach. The campaign drove a 38% lift in sales (for those exposed to campaign vs. those not exposed) with 95% of those incremental sales from customers new to the brand.4
Outlook
We are in an economic environment defined by recessionary fears, inflationary pressures, rising interest rates, and ongoing supply chain disruptions. For the second half of the year, we are forecasting that advertising spend, particularly in the scatter market, will continue to be negatively impacted. We also believe that consumer discretionary spend will continue to moderate, pressuring both Roku TV and Roku player sales.
Taking these factors into consideration, our Q3 outlook is for total net revenue to increase approximately 3% year over year to $700 million. We anticipate total gross profit of roughly $325 million, and adjusted EBITDA of negative $75 million. Finally, given the uncertainties and volatility in the macro environment, we are withdrawing our full-year revenue growth rate estimate. We will remain focused on growing our market leadership by further advancing our technology and brand, and continuing to execute our strategy.
Conclusion
Looking ahead, both our competitive positioning and balance sheet are strong, and we remain focused on the significant and long-term opportunity in TV streaming. We believe Roku’s value proposition for viewers, content partners, and advertisers is unmatched, and we are confident in our strategy and growth potential. During downturns, both consumers and advertisers seek even more value for every dollar spent. We offer consumers low-cost devices and access to thousands of hours of free on-demand entertainment and hundreds of free linear channels on The Roku Channel alone. And with our innovative ad platform built for TV streaming, we offer advertisers measurable and superior ROI. We are focused on and continue to invest in a future where all TV and all TV ads are streamed.
Thank you for your support and Happy Streaming™!
Anthony Wood, Founder and CEO; and Steve Louden, CFO
4 As measured by third party provider. Sales lift compared to the control group. Campaign date: Q4 2021 in the U.S.
| | |
| Roku Q2 2022 Shareholder Letter |
6
Conference Call Webcast – 2 p.m. PT July 28, 2022
The Company will host a webcast of its conference call to discuss Q2 2022 results at 2 p.m. Pacific Time / 5 p.m. Eastern Time on July 28, 2022. Participants may access the live webcast in listen-only mode on the Roku investor relations website at www.roku.com/investor, and an archived webcast of the conference call will also be available after the call.
About Roku, Inc.
Roku pioneered streaming to the TV. We connect users to the streaming content they love, enable content publishers to build and monetize large audiences, and provide advertisers with unique capabilities to engage consumers. Roku streaming players and TV-related audio devices are available in the U.S. and in select countries through direct retail sales and licensing arrangements with service operators. Roku TV models are available in the U.S. and in select countries through licensing arrangements with TV brands. Roku is headquartered in San Jose, Calif. U.S.A.
Roku, the Roku logo and other trade names, trademarks or service marks of Roku appearing in this shareholder letter are the property of Roku, Inc. and its affiliates. Trade names, trademarks and service marks of other companies appearing in this shareholder letter are the property of their respective holders.
| | | | | |
Investor Relations Conrad Grodd cgrodd@roku.com | Media Kim Sampson ksampson@roku.com |
Use of Non-GAAP Measures
In addition to financial information prepared in accordance with generally accepted accounting principles in the United States (GAAP), this shareholder letter includes certain non-GAAP financial measures. These non-GAAP measures include Adjusted EBITDA. In order for our investors to be better able to compare our current results with those of previous periods, we have included a reconciliation of GAAP to non-GAAP financial measures in the tables at the end of this letter. The Adjusted EBITDA reconciliation adjusts the related GAAP financial measures to exclude other income (expense), net, stock-based compensation expense, depreciation and amortization, and income tax (benefit)/expense where applicable. We believe these non-GAAP financial measures are useful as a supplement in evaluating our ongoing operational performance and enhancing an overall understanding of our past financial performance. However, these non-GAAP financial measures have limitations, and should not be considered in isolation or as a substitute for our GAAP financial information.
Forward-Looking Statements
This shareholder letter contains “forward-looking” statements that are based on our beliefs and assumptions and on information currently available to us. Forward-looking statements include all statements that are not historical facts and can be identified by terms such as “anticipate,” “believe,” “continue,” “could,” “design,” “estimate,” “expect,” “may,” “seek,” “should,” “will,” “would” or similar expressions and the negatives of those terms. Forward-looking statements involve known and unknown risks, uncertainties and other factors that may cause our actual results, performance or achievements to be materially different from any future results, performance or achievements expressed or implied by the forward-looking statements. Forward-looking statements represent our beliefs and assumptions only as of the date of this letter. These statements include those related to the shift of TV and TV advertising to streaming and our leadership position in that shift; market conditions affecting TV costs; our ability to insulate customers from elevated costs in the player business; the benefits, features and availability of our streaming players, our audio devices and our partners’ Roku TV models; our room for growth in engagement; availability of live programming on streaming; the success of our new product launches in international markets; supply chain disruptions; the strength, features and value of the Roku OS; advertising opportunities on our platform; The Roku Channel’s expanding reach, engagement and content offering; the growth and monetization of and investment in The Roku Channel; the benefits of The Roku Channel to viewers, content partners and advertisers; the benefits of our integrated ad platform; player gross margin; our ability to navigate through macroeconomic headwinds; pressure on Roku TV and Roku player sales; changes in consumer discretionary spend and ad spend; the amount and foundation of our content spend; our financial outlook for the third quarter of 2022 as well as our qualitative color on our business in 2022 and beyond; our investments; and our overall business trajectory. Except as required by law, we assume no obligation to update these forward-looking statements publicly, or to update the reasons actual results could differ materially from those anticipated in the forward-looking statements, even if new information becomes available in the future. Further information on factors that could cause actual results to differ materially from the results anticipated by our forward-looking statements is included in the reports we have filed with the Securities and Exchange Commission, including our Annual Report on Form 10-K for the year ended December 31, 2021. Additional information also will be available in our Quarterly Report on Form 10-Q for the quarter ended June 30, 2022. All information provided in this shareholder letter and in the tables attached hereto is as of July 28, 2022, and we undertake no duty to update this information unless required by law.
| | |
| Roku Q2 2022 Shareholder Letter |
7
ROKU, INC.
CONDENSED CONSOLIDATED STATEMENTS OF OPERATIONS (in thousands, except per share data)
(unaudited)
| | | | | | | | | | | | | | | | | | | | | | | |
| Three Months Ended | | Six Months Ended |
| June 30, 2022 | | June 30, 2021 | | June 30, 2022 | | June 30, 2021 |
| Net Revenue: | | | | | | | |
| Platform | $ | 673,163 | | | $ | 532,303 | | | $ | 1,320,067 | | | $ | 998,829 | |
| Player | 91,243 | | | 112,816 | | | 178,038 | | | 220,473 | |
| Total net revenue | 764,406 | | | 645,119 | | | 1,498,105 | | | 1,219,302 | |
| Cost of Revenue: | | | | | | | |
| Platform (1) | 296,054 | | | 187,328 | | | 563,039 | | | 341,918 | |
| Player (1) | 113,203 | | | 119,525 | | | 215,110 | | | 212,347 | |
| Total cost of revenue | 409,257 | | | 306,853 | | | 778,149 | | | 554,265 | |
| Gross Profit (Loss): | | | | | | | |
| Platform | 377,109 | | | 344,975 | | | 757,028 | | | 656,911 | |
| Player | (21,960) | | | (6,709) | | | (37,072) | | | 8,126 | |
| Total gross profit | 355,149 | | | 338,266 | | | 719,956 | | | 665,037 | |
| Operating Expenses: | | | | | | | |
| Research and development (1) | 196,637 | | | 113,276 | | | 360,635 | | | 214,857 | |
| Sales and marketing (1) | 184,971 | | | 93,678 | | | 331,493 | | | 182,551 | |
| General and administrative (1) | 84,054 | | | 62,228 | | | 161,831 | | | 122,739 | |
| Total operating expenses | 465,662 | | | 269,182 | | | 853,959 | | | 520,147 | |
| Income (Loss) from Operations | (110,513) | | | 69,084 | | | (134,003) | | | 144,890 | |
| Other Income (Expense), Net: | | | | | | | |
| Interest expense | (1,059) | | | (746) | | | (2,116) | | | (1,488) | |
| Other income (expense), net | 1,829 | | | 1,520 | | | 2,238 | | | 1,961 | |
| Total other income (expense), net | 770 | | | 774 | | | 122 | | | 473 | |
| Income (Loss) Before Income Taxes | (109,743) | | | 69,858 | | | (133,881) | | | 145,363 | |
| Income tax expense (benefit) | 2,578 | | | (3,609) | | | 4,746 | | | (4,400) | |
| Net Income (Loss) | $ | (112,321) | | | $ | 73,467 | | | $ | (138,627) | | | $ | 149,763 | |
| | | | | | | |
| Net income (loss) per share — basic | $ | (0.82) | | | $ | 0.55 | | | $ | (1.02) | | | $ | 1.14 | |
| Net income (loss) per share — diluted | $ | (0.82) | | | $ | 0.52 | | | $ | (1.02) | | | $ | 1.06 | |
| | | | | | | |
| Weighted-average common shares outstanding — basic | 136,849 | | | 132,705 | | | 136,198 | | | 131,198 | |
| Weighted-average common shares outstanding — diluted | 136,849 | | | 142,122 | | | 136,198 | | | 141,234 | |
(1) Stock-based compensation was allocated as follows:
| | | | | | | | | | | | | | | | | | | | | | | |
| Cost of revenue, platform | $ | 366 | | | $ | 167 | | | $ | 602 | | | $ | 365 | |
| Cost of revenue, player | 435 | | | 315 | | | 1,004 | | | 730 | |
| Research and development | 38,229 | | | 18,577 | | | 66,619 | | | 35,131 | |
| Sales and marketing | 27,917 | | | 14,275 | | | 51,828 | | | 27,638 | |
| General and administrative | 20,077 | | | 9,212 | | | 36,551 | | | 19,219 | |
| Total stock-based compensation | $ | 87,024 | | | $ | 42,546 | | | $ | 156,604 | | | $ | 83,083 | |
| | |
| Roku Q2 2022 Shareholder Letter |
8
ROKU, INC.
CONDENSED CONSOLIDATED BALANCE SHEETS (in thousands, except share data)
(unaudited)
| | | | | | | | | | | |
| As of |
| June 30, 2022 | | December 31, 2021 |
| Assets | | | |
| Current Assets: | | | |
| Cash and cash equivalents | $ | 2,050,412 | | | $ | 2,146,043 | |
| Accounts receivable, net of allowances of $32,052 and $56,827 as of | 714,606 | | | 752,393 | |
| June 30, 2022 and December 31, 2021, respectively | | | |
| Inventories | 76,077 | | | 50,276 | |
| Prepaid expenses and other current assets | 121,720 | | | 105,795 | |
| Total current assets | 2,962,815 | | | 3,054,507 | |
| Property and equipment, net | 217,558 | | | 177,567 | |
| Operating lease right-of-use assets | 544,414 | | | 345,660 | |
| Intangible assets, net | 75,193 | | | 84,126 | |
| Goodwill | 161,519 | | | 161,519 | |
| Other non-current assets | 352,035 | | | 258,766 | |
| Total Assets | $ | 4,313,534 | | | $ | 4,082,145 | |
| Liabilities and Stockholders’ Equity | | | |
| Current Liabilities: | | | |
| Accounts payable | $ | 113,768 | | | $ | 124,921 | |
| Accrued liabilities | 575,277 | | | 549,055 | |
| Current portion of long-term debt | 84,928 | | | 9,883 | |
| Deferred revenue, current portion | 50,641 | | | 45,760 | |
| Total current liabilities | 824,614 | | | 729,619 | |
| Long-term debt, non-current portion | — | | | 79,985 | |
| Deferred revenue, non-current portion | 27,452 | | | 28,726 | |
| Operating lease liability, non-current portion | 587,981 | | | 394,724 | |
| Other long-term liabilities | 77,595 | | | 82,485 | |
| Total Liabilities | 1,517,642 | | | 1,315,539 | |
| Stockholders’ Equity: | | | |
| Common stock, $0.0001 par value | 14 | | | 14 | |
| Additional paid-in capital | 3,024,897 | | | 2,856,572 | |
| Accumulated other comprehensive income (loss) | (371) | | | 41 | |
| Accumulated deficit | (228,648) | | | (90,021) | |
| Total stockholders’ equity | 2,795,892 | | | 2,766,606 | |
| Total Liabilities and Stockholders’ Equity | $ | 4,313,534 | | | $ | 4,082,145 | |
| | |
| Roku Q2 2022 Shareholder Letter |
9
ROKU, INC.
CONDENSED CONSOLIDATED STATEMENTS OF CASH FLOWS (in thousands)
(unaudited)
| | | | | | | | | | | |
| Six Months Ended |
| June 30, 2022 | | June 30, 2021 |
| Cash flows from operating activities: | | | |
| Net income (loss) | $ | (138,627) | | | $ | 149,763 | |
| Adjustments to reconcile net income (loss) to net cash provided by (used in) operating activities: | | | |
| Depreciation and amortization | 22,902 | | | 20,412 | |
| Stock-based compensation expense | 156,604 | | | 83,083 | |
| Amortization of right-of-use assets | 25,235 | | | 13,979 | |
| Amortization of content assets | 100,497 | | | 28,093 | |
| Provision for (recoveries of) doubtful accounts | 467 | | | (1,099) | |
| Other items, net | (335) | | | (8) | |
| Changes in operating assets and liabilities: | | | |
| Accounts receivable | 37,320 | | | (56,661) | |
| Inventories | (25,801) | | | 5,899 | |
| Prepaid expenses and other current assets | (19,743) | | | (30,235) | |
| Other non-current assets | (45,564) | | | (72,195) | |
| Accounts payable | (11,871) | | | 16,433 | |
| Accrued liabilities | (98,661) | | | 16,543 | |
| Operating lease liabilities | (16,125) | | | (18,394) | |
| Other long-term liabilities | 148 | | | (527) | |
| Deferred revenue | 3,607 | | | (10,326) | |
| Net cash provided by (used in) operating activities | (9,947) | | | 144,760 | |
| Cash flows from investing activities: | | | |
| Purchases of property and equipment | (52,209) | | | (13,898) | |
| Acquisition of businesses, net of cash acquired | — | | | (136,778) | |
| Purchase of strategic investment | (40,000) | | | — | |
| Net cash used in investing activities | (92,209) | | | (150,676) | |
| Cash flows from financing activities: | | | |
| Proceeds from equity issued under at-the-market offering, net of issuance costs | — | | | 989,615 | |
| Repayments of borrowings | (5,000) | | | (2,500) | |
| Proceeds from equity issued under incentive plans | 11,693 | | | 10,285 | |
| Net cash provided by financing activities | 6,693 | | | 997,400 | |
| Net increase (decrease) in cash, cash equivalents and restricted cash | (95,463) | | | 991,484 | |
| Effect of exchange rate changes on cash, cash equivalents and restricted cash | (67) | | | — | |
| Cash, cash equivalents and restricted cash —beginning of period | 2,147,670 | | | 1,093,249 | |
| Cash, cash equivalents and restricted cash —end of period | $ | 2,052,140 | | | $ | 2,084,733 | |
| | |
| Roku Q2 2022 Shareholder Letter |
10
| | | | | | | | | | | |
| Six Months Ended |
| June 30, 2022 | | June 30, 2021 |
| Cash, cash equivalents and restricted cash at end of period: | | | |
| Cash and cash equivalents | $ | 2,050,412 | | | $ | 2,083,273 | |
| Restricted cash, non-current | 1,728 | | | 1,460 | |
| Cash, cash equivalents and restricted cash —end of period | $ | 2,052,140 | | | $ | 2,084,733 | |
| | | |
| Supplemental disclosures of cash flow information: | | | |
| Cash paid for interest | $ | 1,444 | | | $ | 1,290 | |
| Cash paid for income taxes | $ | 4,752 | | | $ | 487 | |
| Supplemental disclosures of non-cash investing and financing activities: | | | |
| Non-cash consideration for business combination | $ | — | | | $ | 15,200 | |
| Services to be received as part of a business combination | $ | — | | | $ | 6,300 | |
| Unpaid portion of property and equipment purchases | $ | 3,551 | | | $ | 3,709 | |
| Unpaid portion of acquisition-related expenses | $ | — | | | $ | 271 | |
NON-GAAP INFORMATION (in thousands)
(unaudited)
| | | | | | | | | | | | | | | | | | | | | | | |
| Three Months Ended | | Six Months Ended |
| June 30, 2022 | | June 30, 2021 | | June 30, 2022 | | June 30, 2021 |
| Reconciliation of Net Income (Loss) to Adjusted EBITDA: | | | | |
| Net income (loss) | $ | (112,321) | | | $ | 73,467 | | | $ | (138,627) | | | $ | 149,763 | |
| Other (income) expense, net | (770) | | | (774) | | | (122) | | | (473) | |
| Stock-based compensation | 87,024 | | | 42,546 | | | 156,604 | | | 83,083 | |
| Depreciation and amortization | 11,416 | | | 10,807 | | | 22,902 | | | 20,412 | |
| Income tax expense (benefit) | 2,578 | | | (3,609) | | | 4,746 | | | (4,400) | |
| Adjusted EBITDA | $ | (12,073) | | | $ | 122,437 | | | $ | 45,503 | | | $ | 248,385 | |
Quarterly streaming hours published vs. revised streaming hours (billions) 0b 2b 4b 6b 8b 10b 12b 14b 2017 q1 2017 q2 2017 q3 2017 q4 2018 q1 2018 q2 2018 q3 2018 q4 2019 q1 2019 q2 2019 q3 2019 q4 2020 q1 published streaming hours revised streaming ho
| | |
| Roku Q2 2022 Shareholder Letter |
11