| | | | | |
| Fellow Shareholders, | November 2, 2022 |
In Q3, we delivered meaningful growth in scale and engagement. We added 2.3 million incremental Active Accounts, and The Roku Channel’s Streaming Hours increased more than 90% year over year. Platform revenue grew 15% year over year, which was lower than our historical growth rates but positive given the difficult macro environment. Advertising spend on our platform continues to grow more slowly than our beginning-of-year forecast due to current weakness in the overall TV ad market and the ad scatter market in particular. However, the long-term opportunity in TV streaming remains intact, and we continue to innovate and execute. We believe the strong growth in the scale and engagement of our platform, combined with the continued consumer shift to TV streaming, positions us well for when the ad market improves.
Q3 2022 Key Results
•Total net revenue grew 12% YoY (year over year) to $761 million
•Platform revenue increased 15% YoY to $670 million
•Gross profit was down 2% YoY to $357 million
•Roku added 2.3 million incremental Active Accounts in Q3 2022 to reach 65.4 million
•Streaming Hours were 21.9 billion hours, an increase of 1.1 billion hours from last quarter
•Average Revenue Per User (ARPU) grew to $44.25 (trailing 12-month basis), up 10% YoY
•Streaming Hours on The Roku Channel grew more than 90% YoY
| | | | | | | | | | | | | | | | | | | | | | | | | | | | | | | | | | | |
| Key Operating Metrics | Q3 21 | | Q4 21 | | Q1 22 | | Q2 22 | | Q3 22 | | YoY % |
| Active Accounts (millions) | 56.4 | | | 60.1 | | | 61.3 | | | 63.1 | | | 65.4 | | | 16 | % |
| Streaming Hours (billions) | 18.0 | | | 19.5 | | | 20.9 | | | 20.7 | | | 21.9 | | | 21 | % |
| ARPU ($) | $ | 40.10 | | | $ | 41.03 | | | $ | 42.91 | | | $ | 33.87 | | | $ | 44.25 | | | 10 | % |
| | | | | | | | | | | |
| Summary Financials ($ in millions) | Q3 21 | | Q4 21 | | Q1 22 | | Q2 22 | | Q3 22 | | YoY % |
| Platform revenue | $ | 582.5 | | $ | 703.6 | | $ | 646.9 | | $ | 673.2 | | $ | 670.4 | | 15 | % |
| Player revenue | 97.4 | | 161.7 | | 86.8 | | 91.2 | | 91.0 | | (7) | % |
| Total net revenue | 680.0 | | 865.3 | | 733.7 | | 764.4 | | 761.4 | | 12 | % |
| Platform gross profit | 378.5 | | 425.6 | | 379.9 | | 377.1 | | 374.2 | | (1) | % |
| Player gross profit (loss) | (14.6) | | (45.9) | | (15.1) | | (22.0) | | (17.5) | | 20 | % |
| Total gross profit | 363.9 | | 379.6 | | 364.8 | | 355.1 | | 356.8 | | (2) | % |
| Platform gross margin % | 65.0 | % | | 60.5 | % | | 58.7 | % | | 56.0 | % | | 55.8 | % | | (9.2)pts |
| Player gross margin % | (15.0) | % | | (28.4) | % | | (17.4) | % | | (24.1) | % | | (19.2) | % | | (4.2)pts |
| Total gross margin % | 53.5 | % | | 43.9 | % | | 49.7 | % | | 46.5 | % | | 46.9 | % | | (6.7)pts |
| Research and development | 120.3 | | 126.4 | | 164.0 | | 196.6 | | 207.6 | | 73 | % |
| Sales and marketing | 109.7 | | 163.4 | | 146.5 | | 185.0 | | 209.4 | | 91 | % |
| General and administrative | 65.1 | | 68.5 | | 77.8 | | 84.1 | | 86.8 | | 33 | % |
| Total operating expenses | 295.1 | | 358.3 | | 388.3 | | 465.7 | | 503.8 | | 71 | % |
| Income (loss) from operations | 68.8 | | 21.4 | | (23.5) | | (110.5) | | (147.0) | | (314) | % |
Adjusted EBITDA A | 130.1 | | 86.7 | | 57.6 | | (12.1) | | (34.4) | | (126) | % |
| Adjusted EBITDA margin % | 19.1 | % | | 10.0 | % | | 7.8 | % | | (1.6) | % | | (4.5) | % | | (23.7)pts |
| | | | | | | | | | | |
| Outlook ($ in millions) | Q4 2022E | | A Refer to the reconciliation of net income (loss) to adjusted EBITDA in the non-GAAP information in an appendix to this letter. |
| Total net revenue | $800 | |
| Total gross profit | $325 | | B Q4 2022E reconciling items between net income (loss) and non-GAAP adjusted EBITDA consist of stock-based compensation of approximately $105 million, depreciation and amortization and other net adjustments of approximately $5 million. |
| Net income (loss) | $(245) | |
Adjusted EBITDA B | $(135) | |
| | |
| Roku Q3 2022 Shareholder Letter |
1
Executive Talent Update
We’re pleased to officially welcome Charlie Collier to Roku as President, Roku Media, which is focused on ad monetization, content licensing, and production. An industry veteran, Charlie brings over 25 years of advertising and media leadership experience. He most recently served as the CEO of FOX Entertainment where he was responsible for driving the overall vision and business as he will for Roku Media. Beginning his career in advertising sales, Charlie successfully ran ad sales organizations before moving up to lead entire media businesses, including programming, operations, strategy, and digital. Charlie has been a part of Upfront1 discussions with the largest advertisers and agency holding companies for decades, on behalf of networks and programming at A&E, The History Channel, AMC, FOX Entertainment and others.
We also recently named Mustafa Ozgen as President, Devices, which is focused on increasing Active Accounts through the sale of first- and third-party TV streaming devices. And we named Gidon Katz as President, Consumer Experiences, which is focused on building an exceptional TV streaming experience that grows engagement and long-term customer value.
Separately, Steve Louden, our Chief Financial Officer, plans to leave Roku sometime in 2023 after helping recruit and transition his role to a successor. Steve joined Roku in 2015 and led Roku’s successful Initial Public Offering process in 2017. We previously announced that Steve was planning to leave his position in late 2019, but he later decided to remain at Roku. Throughout his tenure, Steve has kept a consistent focus on building a strong team and robust systems to support Roku’s expanding business objectives and operational complexity.
Account Acquisition
In Q3 we reached 65.4 million Active Accounts globally. Active Account net adds were 2.3 million on a sequential basis, which was above both 2019 and 2021 levels. This growth was driven primarily by TV sales in both U.S. and international markets, along with improved Active Account retention. We continued to absorb higher costs in our player business to insulate consumers from price increases. As a result, Player gross margin was down 4 percentage points year over year as supply chain costs remain elevated above pre-COVID levels.
We are a leader in building innovative products that provide value, choice, and ease of use to create an exceptional TV streaming experience for our customers. In September we announced two new products in the U.S., the Roku Express player and the Roku Wireless Bass. The Roku Express has dual-band Wi-Fi® and increased storage, making it more powerful than ever. The newly designed Roku Wireless Bass provides high-powered sound for a theater-like experience right at home. We also made updates to the Roku Operating System (OS) to further enhance our devices, such as expanding Bluetooth Private Listening to be compatible with our newest Roku Ultra, Roku Streambar, and Roku Streambar Pro.
In Q3 the Roku OS was the #1 selling smart TV OS in the U.S., and we continue to build scale in our markets outside the U.S. We are expanding our global Roku TV program to Germany with TCL and Metz, and to Australia with TCL.
Our results in Mexico demonstrate that our three-phased business model works outside the U.S.: (1) scale, (2) engage, and (3) monetize. Since our full-scale launch in 2019, with early Roku TV partners Hisense and TCL, our Mexico product lineup has grown to offer streaming players and Roku TV models through 12 partners. Our customers in Mexico can access a broad range of content on thousands of channels from popular services such as ViX, TV Azteca, Blim, Netflix, and HBO Max. We are the #2 selling smart TV OS in Mexico, and with this scale and meaningful engagement we launched our advertising business earlier this year. Most recently, in October we launched The Roku Channel in Mexico — a milestone for our business that is the result of the scale we have achieved in the past three years.
1 The process through which TV ads are bought several months before the TV season begins.
| | |
| Roku Q3 2022 Shareholder Letter |
2
We launched The Roku Channel in Mexico,
marking a milestone for our scale.
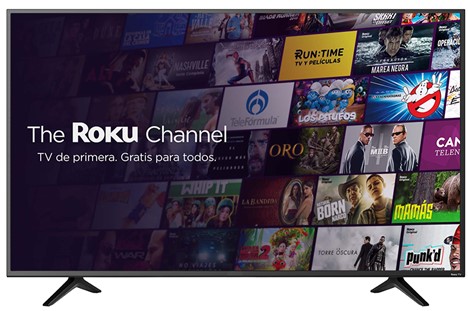
Roku Smart Home
Last month, we launched new smart home products to build new service revenue streams. This product offering includes cameras and video doorbells with subscription plans that offer users the ability to view cloud recordings of the videos, along with AI-based alerts (e.g., person, package, vehicle, pet). Similar to our TV streaming model, we plan to build scale with our devices and then monetize through smart home services, which we expect to become a very large market.
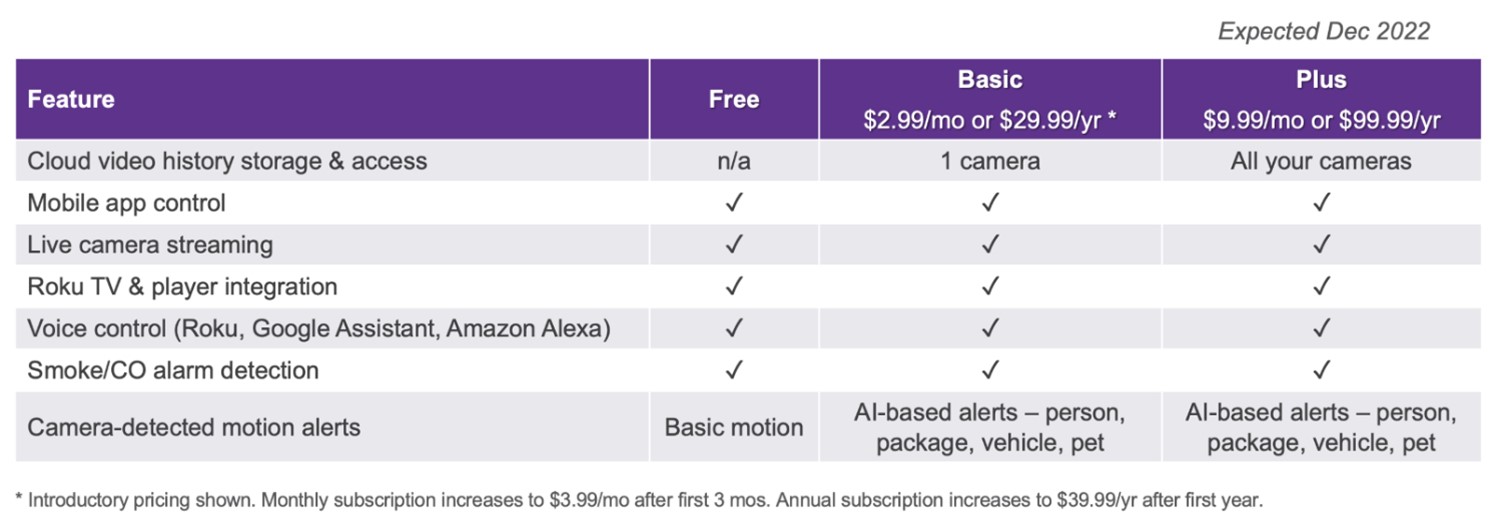
Our smart home launch included cameras, video doorbells, plugs, and lighting, along with a Roku Smart Home mobile app for iOS and Android. One of our smart home priorities is interoperability, and Roku Smart Home is compatible with Google Home, Alexa, and Roku Voice. The Roku video doorbell and cameras also integrate with the Roku OS, allowing users to view live video streams and receive real-time notifications directly on their TV. The products are available in-store exclusively at Walmart, America’s #1 retailer, in nearly 3,500 locations where Roku is the #1 smart home brand by shelf space.
We believe every device in the home will be smart, but it is still early days as approximately 20% of U.S. households have cameras (Statista, March 2022). We are well-positioned to be the leading smart home platform
| | |
| Roku Q3 2022 Shareholder Letter |
3
as we have strong brand affinity and deliver seamless experiences at consumer-friendly price points. As the #1 selling smart TV OS in the U.S., we have the necessary technology and expertise in hardware, software, and connectivity to deliver a smart home ecosystem that is simple, powerful, and delightful.
| | | | | |
| |
| With our subscription plans, users can view cloud recordings of their camera/doorbell videos in the Roku Smart Home app. | Users can view live video streams
and receive real-time doorbell notifications
directly on their TV (powered by the Roku OS). |
Engagement
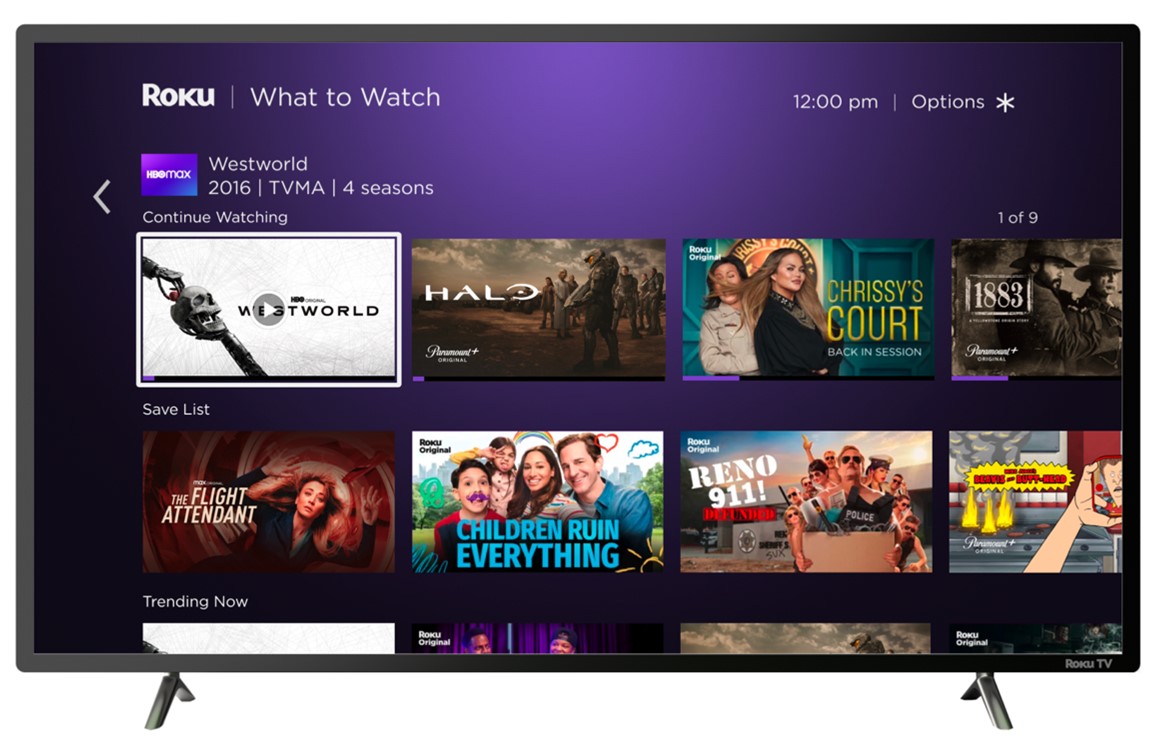
Globally our users streamed 21.9 billion hours in Q3, an increase of 1.1 billion hours from Q2. With the huge increase in streaming content and services, along with the frequent changes to where a specific show/movie/event can be watched, the consumer experience has become fragmented and confusing. TV audiences are spending longer and longer amounts of time staring at the TV screen trying to figure out what to watch and where to find it. Of streamers we recently surveyed, more than half say they find new content by scrolling through recommendations from their streaming platform, and nearly a third say they try to “save” recommendations by simply remembering them2.
With the Roku Home Screen, we are uniquely positioned to help our users discover and find shows, movies, and sports. This year we added Live TV and What to Watch into our left-hand navigation on the Roku Home Screen Menu, and with our most recent Roku OS update we continued to enhance these experiences. In Q3 we added a Continue Watching feature to What to Watch, aggregating in a single destination shows/movies that the user was previously watching and can easily jump back into. We are complementing this with a cross-platform Save List to help users easily save in a single location a list of movies and shows that they want to watch later. Save List is available on all Roku devices and on the Roku mobile app, which has been launched over 5 billion times in the last 12 months. These improvements are resonating with our customers, with Streaming Hours originating from within our left-hand navigation more than tripling year over year.
2 Survey of 2,000 people who stream, commissioned by Roku and conducted by market research company OnePoll in Oct 2022.
| | |
| Roku Q3 2022 Shareholder Letter |
4
With new features like Continue Watching and Save List,
we make it easy for our users to discover, find, and watch content they love.
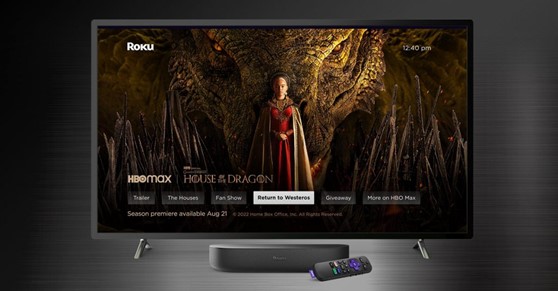
With the Roku Home Screen, we also have significant monetization opportunities to help streaming services build audiences for their valuable content. To support the premiere of the highly anticipated Game of Thrones prequel series, we launched the first-ever House of the Dragon Exclusive Fan Experience on our platform, which featured a show trailer, behind-the-scenes segments, and a device giveaway. It also featured “The Roku Rundown,” a new Roku Brand Studio special to help fans catch up before the House of the Dragon premiere. The exclusive fan experience drove incremental sign-ups and viewership for HBO Max on our platform. Roku users who watched “The Roku Rundown” were 3.5X more likely to sign up for HBO Max and 17% more likely to watch House of the Dragon (vs. users who did not watch “The Roku Rundown”).
House of the Dragon Exclusive Fan Experience
| | |
| Roku Q3 2022 Shareholder Letter |
5
The Roku Channel
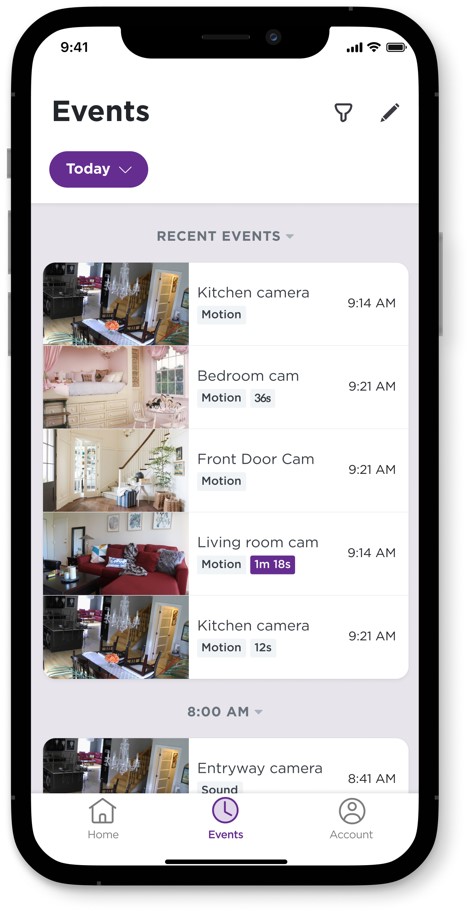
The Roku Channel continues to be a unique and valuable asset. For the third consecutive quarter, the Roku Channel was a top 5 channel by both Active Account reach and Streaming Hour engagement on the Roku platform in the U.S. The Roku Channel also ranked first in reach amongst AVOD/FAST services in the U.S. and Canada according to TiVo’s most recent quarterly Video Trends Report.
We have built a broad portfolio of compelling content, and in Q3 we drove particular success in several specific categories. Our news offering reached significantly more unique viewers than the largest stand-alone news apps on the Roku platform, and Espacio Latino, our Spanish-language offering launched in June, reached more unique viewers than any Spanish language app on the Roku platform in the U.S.
In addition, we offer compelling entertainment exclusive to The Roku Channel, providing value to both our audience and advertisers. In September The Roku Channel became the exclusive home of Emmy-nominated sports and entertainment talk show The Rich Eisen Show, enabling us to reach the sports consumer on Roku. Roku Original Emeril Tailgates recently premiered on The Roku Channel with sponsorship from Coca-Cola, a first-time Roku Originals advertiser. Excitement and anticipation for WEIRD: The Al Yankovic Story (premiering exclusively on The Roku Channel on November 4) continues to build with the film winning the Toronto International Film Festival People’s Choice Award after its premiere in the festival’s Midnight Madness program.
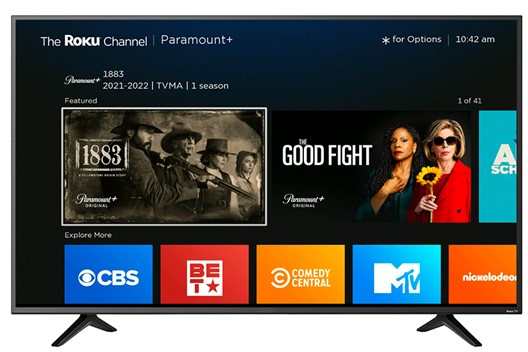
We further expanded our offering of leading third-party subscription services in The Roku Channel with the launch of Paramount+ as a Premium Subscription in August. Our partners benefit from direct integration into Roku’s user experience, marketing tools, and machine learning recommendations, while enhancing the channel’s content portfolio. In addition to high quality entertainment options like the hit original series 1883 and popular family films like Sonic the Hedgehog 2, Paramount+ brings live programming from marquee sports, representing the first time that live football has been offered within The Roku Channel. The further integration into Roku’s platform drove sign ups for Paramount+ in Q3, creating value for both Paramount Streaming and Roku.
Content partners like Paramount+ benefit from direct integration with The Roku Channel.
We have built a broad portfolio of compelling content through a combination of revenue share, fixed licensing agreements, and investment in originals. We serve a wide range of audiences, drive data-informed recommendations, and have built content discovery experiences that expand and deepen engagement. As a
| | |
| Roku Q3 2022 Shareholder Letter |
6
result — with Q3 Streaming Hours on The Roku Channel up more than 90% year over year — our engagement is growing at a faster rate than our content investment. We expect to continue growing The Roku Channel effectively through this combination of content, user experience, and advertiser appeal.
Monetization
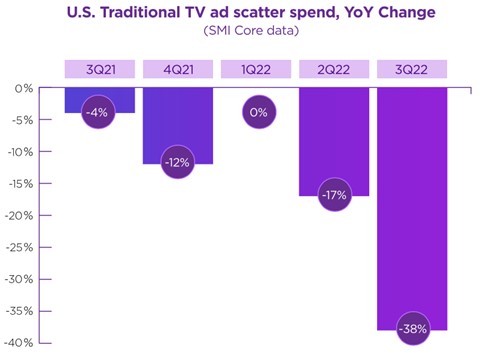
We continue to increase our share of advertising spend as traditional TV audiences decline. Our Q3 Platform revenue increased 15% year over year to $670 million, in an environment that saw significant pressure in the traditional TV ad scatter market3, which was down 38% year over year in the U.S. (aggregated using SMI Core data). With continued economic uncertainty, we expect ongoing ad scatter declines for both traditional TV and CTV (connected TV) to continue until at least next year.
The macro environment continues to pressure the U.S. traditional TV ad scatter market.4
Economic cycles do not change our significant, long-term opportunity in TV streaming. We continue to innovate and launch new products and partnerships, which further differentiate our ad platform and strongly position us for future growth.
In Q2, in partnership with Walmart, we announced a new product called Shoppable Ads that enables viewers to simply press “OK” with their Roku remote and proceed to checkout with their shipping and payment details pre-populated. Our expansion of the product in Q3 enables thousands of brands in the Walmart Connect Partner Program to purchase Shoppable Ads through OneView.
Viewers continue to move to TV streaming more quickly than ad dollars, and many advertisers cite cross-platform measurement as a key need to also make the move to TV streaming. We recently announced the launch of Nielsen Total Ad Ratings, which provides media measurement across TV streaming, traditional TV, desktop, and mobile. OneView, our ad platform built for TV streaming, is the first Demand Side Platform to directly integrate with Nielsen’s measurement solution. Nielsen Total Ad Ratings will provide audience reach
3 TV ads bought during the quarter.
4 Aggregated using SMI Core data.
| | |
| Roku Q3 2022 Shareholder Letter |
7
and frequency measurement across all four major screens in the home for the first time — making it easier for brands to shift dollars to Roku with confidence.
Outlook
As we enter the holiday season, we expect the macro environment to further pressure consumer discretionary spend and degrade advertising budgets, especially in the TV scatter market. We expect these conditions to be temporary, but it is difficult to predict when they will stabilize or rebound. We therefore anticipate Q4 Player revenue and Platform revenue to be lower year over year.
Our significant Q3 OpEx (operating expense) YoY growth was largely the result of robust hiring in late 2021 and early 2022 when we believed that the economy was emerging out of pandemic-related disruptions, and we were accelerating investments that we had previously deferred. We started taking steps to significantly slow the rate of hiring and other OpEx growth in late Q2, however, it will take a few more quarters for this YoY OpEx growth rate to normalize. We will continue to slow headcount and OpEx growth in response to the macro environment, while continuing to make disciplined investments in our most strategic projects that will increase both the market penetration of our platform and long-term customer value. Taking these factors into consideration, our Q4 outlook is for total net revenue of roughly $800 million, total gross profit of roughly $325 million, and adjusted EBITDA of negative $135 million.
Conclusion
The broad, secular shift to streaming remains fully intact, and it is for this reason that we continue to invest and innovate. We have significant scale, a direct relationship with tens of millions of consumers, and an ad proposition that delivers measurable ROI to marketers. We also provide an exceptional user experience, and through The Roku Channel we offer a broad array of free entertainment. While the current environment is difficult, we believe it is also temporary, and as consumers and businesses regain their footing, we expect Roku to be in a stronger position than ever. We have spent years building a business designed to benefit everyone in the TV streaming ecosystem, and as we look ahead, we remain confident that our strategy and our business model are the best way to maximize the opportunity to deliver both growth and profit to our investors over the long term.
Happy Streaming™!
Anthony Wood, Founder and CEO, and Steve Louden, CFO
| | |
| Roku Q3 2022 Shareholder Letter |
8
Conference Call Webcast – 2 p.m. PT November 2, 2022
The Company will host a webcast of its conference call to discuss Q3 2022 results at 2 p.m. Pacific Time / 5 p.m. Eastern Time on November 2, 2022. Participants may access the live webcast in listen-only mode on the Roku investor relations website at www.roku.com/investor, and an archived webcast of the conference call will also be available after the call.
About Roku, Inc.
Roku pioneered streaming to the TV. We connect users to the streaming content they love, enable content publishers to build and monetize large audiences, and provide advertisers with unique capabilities to engage consumers. Roku streaming players and TV-related audio devices are available in the U.S. and in select countries through direct retail sales and licensing arrangements with service operators. Roku TV™ models are available in the U.S. and in select countries through licensing arrangements with TV OEM brands. Roku Smart Home products, including cameras, video doorbells, lighting, plugs, and more, are available in the U.S. Roku is headquartered in San Jose, Calif. U.S.A.
Roku, the Roku logo and other trade names, trademarks or service marks of Roku appearing in this shareholder letter are the property of Roku, Inc. and its affiliates. Trade names, trademarks and service marks of other companies appearing in this shareholder letter are the property of their respective holders.
| | | | | |
| Investor Relations | Media |
| Conrad Grodd | Kim Sampson |
| cgrodd@roku.com | ksampson@roku.com |
Use of Non-GAAP Measures
In addition to financial information prepared in accordance with generally accepted accounting principles in the United States (GAAP), this shareholder letter includes certain non-GAAP financial measures. These non-GAAP measures include Adjusted EBITDA. In order for our investors to be better able to compare our current results with those of previous periods, we have included a reconciliation of GAAP to non-GAAP financial measures in the tables at the end of this letter. The Adjusted EBITDA reconciliation adjusts the related GAAP financial measures to exclude other income (expense), net, stock-based compensation expense, depreciation and amortization, and income tax (benefit)/expense where applicable. We believe these non-GAAP financial measures are useful as a supplement in evaluating our ongoing operational performance and enhancing an overall understanding of our past financial performance. However, these non-GAAP financial measures have limitations, and should not be considered in isolation or as a substitute for our GAAP financial information.
Forward-Looking Statements
This shareholder letter contains “forward-looking” statements that are based on our beliefs and assumptions and on information currently available to us. Forward-looking statements include all statements that are not historical facts and can be identified by terms such as “anticipate,” “believe,” “continue,” “could,” “design,” “estimate,” “expect,” “may,” “seek,” “should,” “will,” “would” or similar expressions and the negatives of those terms. Forward-looking statements involve known and unknown risks, uncertainties and other factors that may cause our actual results, performance or achievements to be materially different from any future results, performance or achievements expressed or implied by the forward-looking statements. Forward-looking statements represent our beliefs and assumptions only as of the date of this letter. These statements include those related to our ability to innovate, build and launch new products and services, including the Roku Express player, the Roku Wireless Bass, Shoppable Ads and smart home products; changes in the ad market, in particular the ad scatter market; our belief that current conditions in the ad market, including the ad scatter market, are temporary; our international expansion; the shift of TV and TV advertising to streaming and our leadership position in that shift; our room for growth in engagement; the strength, features and value of the Roku OS; advertising opportunities on our platform; the increase in our share of advertising spend; The Roku Channel’s expanding reach, engagement and content offering; the growth and monetization of and investment in The Roku Channel; the benefits of The Roku Channel to viewers, content partners and advertisers; the benefits of our integrated ad platform; changes to our executive leadership team; our ability to navigate through macroeconomic headwinds; our belief that the current macro environment is temporary; steps we are taking to lower OpEx growth; our financial outlook for Q4 2022 as well as our qualitative color on our business in 2022 and beyond; our investments; and our overall business trajectory. Except as required by law, we assume no obligation to update these forward-looking statements publicly, or to update the reasons actual results could differ materially from those anticipated in the forward-looking statements, even if new information becomes available in the future. Further information on factors that could cause actual results to differ materially from the results anticipated by our forward-looking statements is included in the reports we have filed with the Securities and Exchange Commission, including our Annual Report on Form 10-K for the year ended December 31, 2021. Additional information also will be available in our Quarterly Report on Form 10-Q for the quarter ended September 30, 2022. All information provided in this shareholder letter and the tables attached hereto is as of November 2, 2022, and we undertake no duty to update this information unless required by law.
| | |
| Roku Q3 2022 Shareholder Letter |
9
ROKU, INC.
CONDENSED CONSOLIDATED STATEMENTS OF OPERATIONS (in thousands, except per share data)
(unaudited)
| | | | | | | | | | | | | | | | | | | | | | | |
| Three Months Ended | | Nine Months Ended |
| September 30, 2022 | | September 30, 2021 | | September 30, 2022 | | September 30, 2021 |
| Net Revenue: | | | | | | | |
| Platform | $ | 670,401 | | | $ | 582,514 | | | $ | 1,990,468 | | | $ | 1,581,343 | |
| Player | 90,972 | | | 97,439 | | | 269,010 | | | 317,912 | |
| Total net revenue | 761,373 | | | 679,953 | | | 2,259,478 | | | 1,899,255 | |
| Cost of Revenue: | | | | | | | |
| Platform (1) | 296,158 | | | 203,989 | | | 859,197 | | | 545,907 | |
| Player (1) | 108,428 | | | 112,045 | | | 323,538 | | | 324,392 | |
| Total cost of revenue | 404,586 | | | 316,034 | | | 1,182,735 | | | 870,299 | |
| Gross Profit (Loss): | | | | | | | |
| Platform | 374,243 | | | 378,525 | | | 1,131,271 | | | 1,035,436 | |
| Player | (17,456) | | | (14,606) | | | (54,528) | | | (6,480) | |
| Total gross profit | 356,787 | | | 363,919 | | | 1,076,743 | | | 1,028,956 | |
| Operating Expenses: | | | | | | | |
| Research and development (1) | 207,608 | | | 120,307 | | | 568,243 | | | 335,164 | |
| Sales and marketing (1) | 209,364 | | | 109,700 | | | 540,857 | | | 292,251 | |
| General and administrative (1) | 86,804 | | | 65,066 | | | 248,635 | | | 187,805 | |
| Total operating expenses | 503,776 | | | 295,073 | | | 1,357,735 | | | 815,220 | |
| Income (Loss) from Operations | (146,989) | | | 68,846 | | | (280,992) | | | 213,736 | |
| Other Income (Expense), Net: | | | | | | | |
| Interest expense | (1,157) | | | (743) | | | (3,273) | | | (2,231) | |
| Other income (expense), net | 27,914 | | | 500 | | | 30,152 | | | 2,461 | |
| Total other income (expense), net | 26,757 | | | (243) | | | 26,879 | | | 230 | |
| Income (Loss) Before Income Taxes | (120,232) | | | 68,603 | | | (254,113) | | | 213,966 | |
| Income tax expense (benefit) | 1,951 | | | (332) | | | 6,697 | | | (4,732) | |
| Net Income (Loss) | $ | (122,183) | | | $ | 68,935 | | | $ | (260,810) | | | $ | 218,698 | |
| | | | | | | |
| Net income (loss) per share — basic | $ | (0.88) | | | $ | 0.52 | | | $ | (1.90) | | | $ | 1.66 | |
| Net income (loss) per share — diluted | $ | (0.88) | | | $ | 0.48 | | | $ | (1.90) | | | $ | 1.54 | |
| | | | | | | |
| Weighted-average common shares outstanding — basic | 138,571 | | | 133,685 | | | 136,997 | | | 132,036 | |
| Weighted-average common shares outstanding — diluted | 138,571 | | | 142,286 | | | 136,997 | | | 141,593 | |
(1) Stock-based compensation was allocated as follows:
| | | | | | | | | | | | | | | | | | | | | | | |
| Cost of revenue, platform | $ | 280 | | | $ | 199 | | | $ | 882 | | | $ | 564 | |
| Cost of revenue, player | 815 | | | 618 | | | 1,819 | | | 1,348 | |
| Research and development | 40,511 | | | 20,893 | | | 107,130 | | | 56,024 | |
| Sales and marketing | 34,480 | | | 16,591 | | | 86,308 | | | 44,229 | |
| General and administrative | 22,964 | | | 12,095 | | | 59,515 | | | 31,314 | |
| Total stock-based compensation | $ | 99,050 | | | $ | 50,396 | | | $ | 255,654 | | | $ | 133,479 | |
| | |
| Roku Q3 2022 Shareholder Letter |
10
ROKU, INC.
CONDENSED CONSOLIDATED BALANCE SHEETS (in thousands, except share data)
(unaudited)
| | | | | | | | | | | |
| As of |
| September 30, 2022 | | December 31, 2021 |
| Assets | | | |
| Current Assets: | | | |
| Cash and cash equivalents | $ | 2,018,616 | | | $ | 2,146,043 | |
| Accounts receivable, net of allowances of $25,633 and $56,827 as of | 719,187 | | | 752,393 | |
| September 30, 2022 and December 31, 2021, respectively | | | |
| Inventories | 119,252 | | | 50,276 | |
| Prepaid expenses and other current assets | 113,889 | | | 105,795 | |
| Total current assets | 2,970,944 | | | 3,054,507 | |
| Property and equipment, net | 272,193 | | | 177,567 | |
| Operating lease right-of-use assets | 535,031 | | | 345,660 | |
| Intangible assets, net | 70,787 | | | 84,126 | |
| Goodwill | 161,519 | | | 161,519 | |
| Other non-current assets | 381,730 | | | 258,766 | |
| Total Assets | $ | 4,392,204 | | | $ | 4,082,145 | |
| Liabilities and Stockholders’ Equity | | | |
| Current Liabilities: | | | |
| Accounts payable | $ | 175,026 | | | $ | 124,921 | |
| Accrued liabilities | 625,836 | | | 549,055 | |
| Current portion of long-term debt | 82,457 | | | 9,883 | |
| Deferred revenue, current portion | 60,101 | | | 45,760 | |
| Total current liabilities | 943,420 | | | 729,619 | |
| Long-term debt, non-current portion | — | | | 79,985 | |
| Deferred revenue, non-current portion | 26,269 | | | 28,726 | |
| Operating lease liability, non-current portion | 568,193 | | | 394,724 | |
| Other long-term liabilities | 76,395 | | | 82,485 | |
| Total Liabilities | 1,614,277 | | | 1,315,539 | |
| Stockholders’ Equity: | | | |
| Common stock, $0.0001 par value | 14 | | | 14 | |
| Additional paid-in capital | 3,129,818 | | | 2,856,572 | |
| Accumulated other comprehensive income (loss) | (1,074) | | | 41 | |
| Accumulated deficit | (350,831) | | | (90,021) | |
| Total stockholders’ equity | 2,777,927 | | | 2,766,606 | |
| Total Liabilities and Stockholders’ Equity | $ | 4,392,204 | | | $ | 4,082,145 | |
| | |
| Roku Q3 2022 Shareholder Letter |
11
ROKU, INC.
CONDENSED CONSOLIDATED STATEMENTS OF CASH FLOWS (in thousands)
(unaudited)
| | | | | | | | | | | |
| Nine Months Ended |
| September 30, 2022 | | September 30, 2021 |
| Cash flows from operating activities: | | | |
| Net income (loss) | $ | (260,810) | | | $ | 218,698 | |
| Adjustments to reconcile net income (loss) to net cash provided by operating activities: | | | |
| Depreciation and amortization | 36,415 | | | 31,304 | |
| Stock-based compensation expense | 255,654 | | | 133,479 | |
| Amortization of right-of-use assets | 40,354 | | | 21,588 | |
| Amortization of content assets | 163,121 | | | 56,580 | |
| Foreign currency remeasurement (gains) losses | (12,152) | | | — | |
| Change in fair value of strategic investment | (3,556) | | | — | |
| Provision for (recoveries of) doubtful accounts | 469 | | | (1,480) | |
| Other items, net | (258) | | | (298) | |
| Changes in operating assets and liabilities: | | | |
| Accounts receivable | 32,186 | | | (64,710) | |
| Inventories | (68,976) | | | (22,050) | |
| Prepaid expenses and other current assets | (15,177) | | | (63,402) | |
| Other non-current assets | (79,962) | | | (78,549) | |
| Accounts payable | 29,550 | | | 15,139 | |
| Accrued liabilities | (104,249) | | | 34,204 | |
| Operating lease liabilities | (20,516) | | | (14,465) | |
| Other long-term liabilities | 465 | | | 201 | |
| Deferred revenue | 11,884 | | | (12,731) | |
| Net cash provided by operating activities | 4,442 | | | 253,508 | |
| Cash flows from investing activities: | | | |
| Purchases of property and equipment | (96,318) | | | (28,020) | |
| Acquisition of businesses, net of cash acquired | — | | | (136,778) | |
| Purchase of strategic investment | (40,000) | | | — | |
| Net cash used in investing activities | (136,318) | | | (164,798) | |
| Cash flows from financing activities: | | | |
| Proceeds from equity issued under at-the-market offering, net of issuance costs | — | | | 989,615 | |
| Repayments of borrowings | (7,500) | | | (3,750) | |
| Proceeds from equity issued under incentive plans | 17,592 | | | 13,433 | |
| Net cash provided by financing activities | 10,092 | | | 999,298 | |
| Net increase (decrease) in cash, cash equivalents and restricted cash | (121,784) | | | 1,088,008 | |
| Effect of exchange rate changes on cash, cash equivalents and restricted cash | (5,535) | | | — | |
| Cash, cash equivalents and restricted cash —beginning of period | 2,147,670 | | | 1,093,249 | |
| Cash, cash equivalents and restricted cash —end of period | $ | 2,020,351 | | | $ | 2,181,257 | |
| | |
| Roku Q3 2022 Shareholder Letter |
12
| | | | | | | | | | | |
| Nine Months Ended |
| September 30, 2022 | | September 30, 2021 |
| Cash, cash equivalents and restricted cash at end of period: | | | |
| Cash and cash equivalents | $ | 2,018,616 | | | $ | 2,179,745 | |
| Restricted cash, non-current | 1,735 | | | 1,512 | |
| Cash, cash equivalents and restricted cash —end of period | $ | 2,020,351 | | | $ | 2,181,257 | |
| | | |
| Supplemental disclosures of cash flow information: | | | |
| Cash paid for interest | $ | 2,537 | | | $ | 1,932 | |
| Cash paid for income taxes | $ | 6,644 | | | $ | 956 | |
| Supplemental disclosures of non-cash investing and financing activities: | | | |
| Non-cash consideration for business combination | $ | — | | | $ | 15,200 | |
| Services to be received as part of a business combination | $ | — | | | $ | 6,300 | |
| Unpaid portion of property and equipment purchases | $ | 23,410 | | | $ | 3,310 | |
| Unpaid portion of acquisition-related expenses | $ | — | | | $ | 43 | |
NON-GAAP INFORMATION (in thousands)
(unaudited)
| | | | | | | | | | | | | | | | | | | | | | | |
| Three Months Ended | | Nine Months Ended |
| September 30, 2022 | | September 30, 2021 | | September 30, 2022 | | September 30, 2021 |
| Reconciliation of Net Income (Loss) to Adjusted EBITDA: | | | | |
| Net income (loss) | $ | (122,183) | | | $ | 68,935 | | | $ | (260,810) | | | $ | 218,698 | |
| Other (income) expense, net | (26,757) | | | 243 | | | (26,879) | | | (230) | |
| Stock-based compensation | 99,050 | | | 50,396 | | | 255,654 | | | 133,479 | |
| Depreciation and amortization | 13,495 | | | 10,892 | | | 36,396 | | | 31,304 | |
| Income tax expense (benefit) | 1,951 | | | (332) | | | 6,697 | | | (4,732) | |
| Adjusted EBITDA | $ | (34,444) | | | $ | 130,134 | | | $ | 11,058 | | | $ | 378,519 | |
Quarterly streaming hours published vs. revised streaming hours (billions) 0b 2b 4b 6b 8b 10b 12b 14b 2017 q1 2017 q2 2017 q3 2017 q4 2018 q1 2018 q2 2018 q3 2018 q4 2019 q1 2019 q2 2019 q3 2019 q4 2020 q1 published streaming hours revised streaming ho
| | |
| Roku Q3 2022 Shareholder Letter |
13