| | | | | |
| Fellow Shareholders, | July 27, 2023 |
We delivered solid results in Q2, growing scale, engagement, and monetization. The operating environment remains largely unchanged from Q1, with strong consumer demand for Roku TV models while TV advertising remains muted industry-wide. We have begun to see some ad verticals improve, which resulted in modest YoY Platform revenue growth in Q2, and we are well positioned to re-accelerate growth as the ad market recovers. We continue to moderate the YoY growth rate of operating expenses and remain committed to our plan to deliver positive Adjusted EBITDA for the full year 2024.
Q2 2023 Key Results
•Total net revenue was $847 million, up 11% year over year (YoY)
•Platform revenue was $744 million, up 11% YoY
•Gross profit was $378 million, up 7% YoY
•Active Accounts were 73.5 million, a net increase of 1.9 million Active Accounts from Q1 2023
•Streaming Hours were 25.1 billion, up 4.4 billion hours YoY
•Average Revenue Per User (ARPU) was $40.67 (trailing 12-month basis), down 7% YoY
•For the first time, The Roku Channel was 1.1% of total U.S. TV viewing in May (Nielsen)
| | | | | | | | | | | | | | | | | | | | | | | | | | | | | | | | | | | | | | |
| Key Operating Metrics | | Q2 22 | | Q3 22 | | Q4 22 | | Q1 23 | | Q2 23 | | YoY % |
| Active Accounts (millions) | | 63.1 | | | 65.4 | | | 70.0 | | | 71.6 | | | 73.5 | | | 16 | % |
| Streaming Hours (billions) | | 20.7 | | | 21.9 | | | 23.9 | | | 25.1 | | | 25.1 | | | 21 | % |
| ARPU ($) | | $ | 43.81 | | | $ | 44.01 | | | $ | 41.68 | | | $ | 40.67 | | | $ | 40.67 | | | (7) | % |
| | | | | | | | | | | | |
| Summary Financials ($ in millions) | | Q2 22 | | Q3 22 | | Q4 22 | | Q1 23 | | Q2 23 | | YoY % |
| Platform revenue | | $ | 669.3 | | $ | 667.2 | | $ | 731.3 | | $ | 634.6 | | $ | 743.8 | | 11% |
| Devices revenue | | 95.2 | | 94.2 | | 135.8 | | 106.4 | | 103.4 | | 9% |
| Total net revenue | | 764.4 | | 761.4 | | 867.1 | | 741.0 | | 847.2 | | 11% |
| Platform gross profit | | 374.2 | | 371.7 | | 408.0 | | 334.0 | | 395.8 | | 6% |
| Devices gross profit (loss) | | (19.0) | | (14.9) | | (43.6) | | 3.6 | | (17.6) | | (8)% |
| Total gross profit | | 355.2 | | 356.8 | | 364.4 | | 337.6 | | 378.3 | | 7% |
| Platform gross margin % | | 55.9 | % | | 55.7 | % | | 55.8 | % | | 52.6 | % | | 53.2 | % | | (270) | pts |
| Devices gross margin % | | (20.0) | % | | (15.8) | % | | (32.1) | % | | 3.4 | % | | (17.0) | % | | 300 | pts |
| Total gross margin % | | 46.5 | % | | 46.9 | % | | 42.0 | % | | 45.6 | % | | 44.7 | % | | (180) | pts |
| Research and development | | 196.6 | | 207.6 | | 220.7 | | 220.1 | | 192.4 | | (2)% |
| Sales and marketing | | 185.0 | | 209.4 | | 297.6 | | 233.9 | | 227.2 | | 23% |
| General and administrative | | 84.1 | | 86.8 | | 96.0 | | 96.1 | | 84.7 | | 1% |
| Total operating expenses | | 465.7 | | 503.8 | | 614.3 | | 550.1 | | 504.2 | | 8% |
| Loss from operations | | (110.5) | | (147.0) | | (249.9) | | (212.5) | | (126.0) | | 14% |
Adjusted EBITDA A | | (12.1) | | (34.4) | | (95.2) | | (69.1) | | (17.8) | | 47% |
| Adjusted EBITDA margin % | | (1.6) | % | | (4.5) | % | | (11.0) | % | | (9.3) | % | | (2.1) | % | | (50) | pts |
| | | | | | | | | | | | |
| Outlook ($ in millions) | | Q3 2023E | | A Refer to the reconciliation of net loss to adjusted EBITDA in the non-GAAP information in an appendix to this letter. |
| Total net revenue | | $815 | |
| Total gross profit | | $355 | | B Q3 2023E reconciling items between net loss and non-GAAP adjusted EBITDA consist of stock-based compensation of approximately $103 million, depreciation and amortization of approximately $19 million and other net adjustments such as interest income of approximately $19 million. |
| Net income (loss) | | $(155) | |
Adjusted EBITDA B | | $(50) | |
| | |
| Roku Q2 2023 Shareholder Letter |
1
Market-Leading Scale
In Q2, Roku grew Active Accounts to 73.5 million globally. Sequential net adds of 1.9 million were slightly above net adds a year ago (Q2 2022), driven primarily by the Roku TV licensing program in the U.S. and international markets. By the end of 2023, the number of U.S. households with cable TV packages is forecasted to be down 40% from a decade earlier (according to Statista).
Overall, smart TV unit sales in the U.S. were resilient in Q2, despite slight increases in TV panel and freight costs, which benefited Roku, along with a consumer focus on value. In Q2, the Roku operating system (OS) was once again the #1 selling TV OS in the U.S., and year to date our TV unit share was larger than the next three largest TV operating systems combined (according to Circana). We continued to achieve YoY share gains across the full range of TV screen sizes, particularly in the larger-screen segment which increased more than 70% YoY.
Internationally, we grew our footprint and deepened our presence with the successful Roku TV licensing program. In Mexico, the Roku OS was the #1 selling smart TV OS for the third quarter in a row, and we announced an 8K Roku TV model with TCL. We expanded our Roku TV licensing program to Central America with the launch of RCA Roku TV models in Costa Rica, El Salvador, Guatemala, Honduras, and Nicaragua.
We launched Roku-branded TVs (the first TVs designed and made by Roku) in March to offer consumers even more choice and enable more innovation across the Roku TV program. Best Buy is our exclusive retailer for Roku-branded TVs, and all 11 TV models have received customer ratings of 4.5 (out of 5) stars or higher. The TVs are also receiving strong industry reviews. The Roku Plus Series won the Tom’s Guide award for “Best Value TV,” and AOL stated, “If you’re shopping for a mid-tier TV, there’s no question the Plus Series belongs on your short list.”
Driving Engagement
Globally, our users streamed 25.1 billion hours in Q2, representing 3.8 Streaming Hours per Active Account per day. We grew engagement while viewing hours on traditional TV continued to decline. Global Streaming Hours on the Roku platform grew 21% YoY, while viewing hours on traditional TV in the U.S. fell 13% (Nielsen).
Consumer Experience
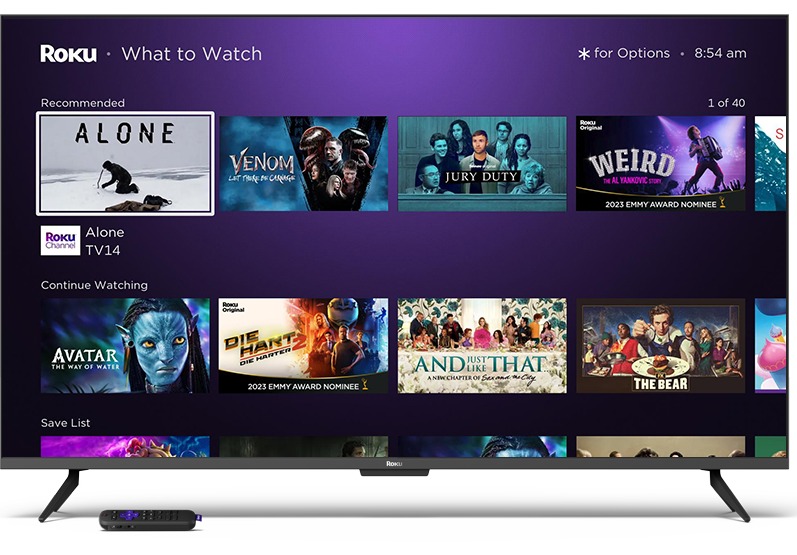
Our Home Screen Menu (left navigation bar) provides links to features such as Sports and What to Watch that aggregate relevant content in a single location so viewers don’t have to search individual apps. Leveraging our scale and technology, we enhance these features with machine learning to create personalized experiences that help users find and discover great content platform-wide.
In Q2, we added to the Sports experience a Women’s Sports Zone, which aggregates women’s sporting events and related documentaries and movies from across the platform. Also in Q2, we added Disney+ and Hulu to the Continue Watching feature (within What to Watch), expanding coverage to 15 of the top 20 apps on our platform. We are bringing What to Watch to more markets and just launched in Canada and Mexico. These content discovery features surface a variety of streaming services to provide awareness of options for viewers, grow visibility for our content partners, and create upsell opportunities for Roku. In Q2, Streaming Hours originating from the Home Screen Menu grew 90% YoY. As we grow engagement, we create more monetization opportunities, all while benefiting our viewers, content partners, and advertisers.
| | |
| Roku Q2 2023 Shareholder Letter |
2
The What to Watch experience helps users track, find, and discover content from across the Roku platform.
The Roku Channel
The Roku Channel aggregates three distinct types of content into a unified viewing experience.
•AVOD1: Viewers can play 80,000+ movies and TV shows, including Roku Originals, for free (supported by advertisements).
•Live TV: Viewers have access to 350+ FAST2 (linear) channels. In Q2, our Live TV offering was the #1 FAST service by Active Account reach on the Roku platform.
•Premium Subscriptions: Viewers can easily sign up, view, and manage subscriptions to services such as Paramount+ and AMC+.
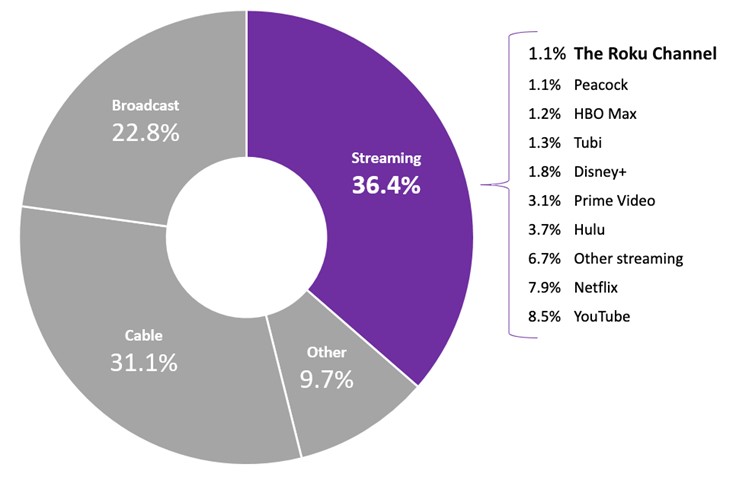
We have driven significant user growth by integrating these three content experiences — AVOD, Live TV, and Premium Subscriptions — throughout our platform in experiences such as What to Watch, Featured Free, the Streaming Store, Search, and more. The Roku Channel remains a top-five channel on the platform by both Active Account reach and Streaming Hour engagement. In Q2, Streaming Hours on The Roku Channel grew more than 50% YoY. For the first time, Nielsen reported that The Roku Channel was 1.1% of total U.S. TV viewing in May, which represents 3% of streaming hours, in line with Peacock and close to HBO Max3. Additionally, a significant portion of streaming of other services ranked by Nielsen occurs on the Roku platform.
1 Ad-supported video on demand
2 FAST: free ad-supported linear streaming TV does not include on-demand content
3 May 2023 report of The Gauge™. In the U.S., Max replaced HBO Max on May 23.
| | |
| Roku Q2 2023 Shareholder Letter |
3
Total U.S. TV viewing in May 2023
(Source: Nielsen’s report of The Gauge™)
A significant portion of streaming of the above services occurs on the Roku platform.
We continue to grow great entertainment within The Roku Channel. In Q1, we added The NFL Channel, a FAST channel with hundreds of hours of programming from NFL Media, including NFL Films, that features classic game replays, documentaries, and originals. Additionally, we are partnering with Skydance Sports, a newly created venture between Skydance Media and NFL Films, to create a Roku Original that will be the first-ever documentary feature film to go behind the scenes of the NFL draft. In June, we entered our first live sports rights package with Formula E, the world’s first all-electric FIA World Championship motorsports series.
We also announced new Roku Originals such as “Charlie Makes a Record” starring Charlie Puth and renewed seasons of popular titles like “The Great American Baking Show.” Roku Originals received 12 nominations for the 2023 Emmys, including eight for "WEIRD: The Al Yankovic Story” and four for “Die Hart 2: Die Harter.” Roku’s exclusive and original programming continued to attract premier advertising sponsors looking to align themselves with content that demonstrates their core brand values. This quarter, financial services provider USAA sponsored Roku Original “Team Rubicon,” a docuseries about the veteran-led organization of the same name. While we will invest in Roku Originals, the foundation of our content spend will continue to be third-party licensed content.
Monetization
Platform revenue was $744 million in Q2, up 11% YoY. We generate Platform revenue primarily from the sale of digital advertising (including media and entertainment promotional spending, the demand-side platform, and related services), as well as content distribution services (such as subscription and transaction revenue shares, and the sale of Premium Subscriptions). ARPU was $40.67 (on a trailing 12-month basis), down 7% YoY. This decline was due to strong global Active Account growth outpacing Platform revenue growth.
While Q2 Platform revenue exceeded our expectations, the macro environment continued to create uncertainty with the total U.S. advertising market flat YoY in Q2. Ad spend on traditional TV declined 9.4% YoY, and traditional TV ad scatter was down 17.2% YoY (according to SMI). Consistent with Q2 industry trends, brand advertising on the Roku platform remained pressured YoY in verticals like technology and M&E (media and entertainment), which was offset by increasing spend from important categories like CPG (consumer packaged
| | |
| Roku Q2 2023 Shareholder Letter |
4
goods) and health and wellness. Also, the macro uncertainty has impacted the timing of Upfront negotiations, with commitments proceeding at a slower pace across the industry.
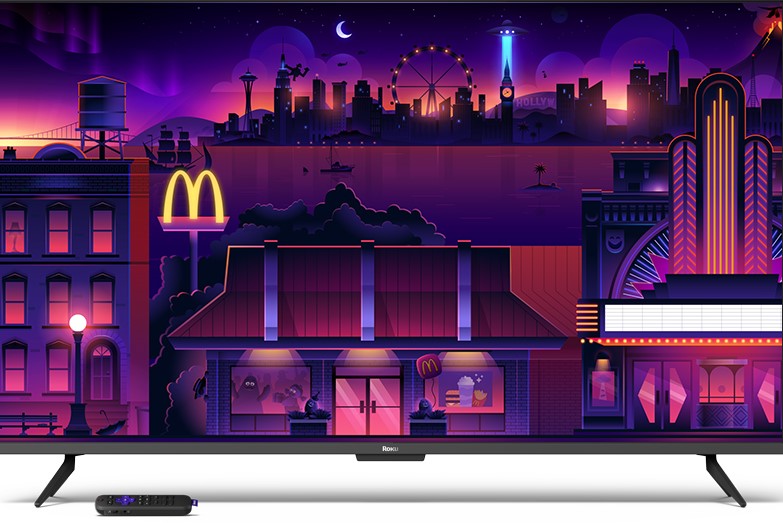
In May, we hosted our second in-person NewFront event in New York showcasing Roku’s scale, technology, and differentiation, as well as introducing clients to Roku programming talent including Sofia Vergara, Weird Al Yankovic, Rich Eisen, and Charlie Puth. With our Primetime Reach Guarantee, advertisers can reach more TV households in primetime on Roku than the average program airing on a top-five cable network4. For the first time, Roku City was opened for major brand advertisers, such as McDonald’s and Mattel, which have integrated brand-specific visuals into our iconic screen saver, allowing them to reach consumers in a way that only Roku delivers. We have partnered with a few key advertisers in verticals beyond M&E to place ads on Roku’s home screen, all while maintaining an outstanding streaming experience for viewers.
Roku City Experience: McDonald’s
Building on the Shoppable Ad technology that we launched with Walmart last year, we partnered with Shopify to enable consumers to purchase products from Shopify merchants directly from Roku-powered TVs. Upon seeing an ad for a Shopify merchant, viewers simply press “OK” on a Roku remote to learn more about the product, to check out using their card on file with Roku Pay, and to return to streaming once they have completed a purchase. This brings Roku’s ad platform capabilities to Shopify-powered businesses of all sizes in the U.S.
We are ramping up our work with third-party DSPs (demand-side platforms) to capture incremental demand while being careful not to cannibalize existing revenue streams. Our first-party and ACR5 data, along with Roku’s specialized ad products, are accessible only on the Roku advertising platform, allowing us to increase demand and maintain platform distinction. Initial results, while off a small base, have been encouraging at capturing additiona
4 Average program household reach across top-five cable networks during primetime in Q4 2022
5 ACR: Automatic Content Recognition
| | |
| Roku Q2 2023 Shareholder Letter |
5
l budgets. We expect it will take time to scale. We remain focused on diversifying our revenue streams and building an array of strategic third-party relationships that we will grow over time.
Outlook
Overall, trends that we observed in Q1 played out in Q2, and we expect them to continue throughout the year. While consumer spend is showing some modest growth, macro concerns and uncertainty remain. We see some recovery signals within certain advertising verticals such as CPG and health and wellness. However, M&E spend, which was already challenged industry-wide, is expected to be further pressured by limited fall release schedules.
For Q3, we expect total net revenue of roughly $815 million, total gross profit of roughly $355 million, and Adjusted EBITDA of negative $50 million. We will continue to moderate YoY OpEx growth rates, with Q3 likely to be lower than Q2. And, we remain committed to our plan to deliver positive Adjusted EBITDA for the full year 2024 with continued improvements after that.
Conclusion
Roku is growing viewers and hours, while traditional pay TV continues to erode. Our unrelenting focus to build a best-in-class consumer experience that is simple and delightful is driving engagement. Our platform’s promotional tools, and seamless payments enable our content partners to attract, engage, and retain audiences. Our scale, direct relationship with consumers, and innovative ad technology enable advertisers and brands to improve their ROI. The secular shift to TV streaming and our ongoing innovation, along with the eventual ad market recovery, position us to re-accelerate our revenue growth.
Thank you for your support, and Happy Streaming™!
Anthony Wood, Founder and CEO, and Dan Jedda, CFO
Conference Call Webcast – July 27, 2023, at 2 p.m. PT
Roku will host a webcast of its conference call to discuss the Q2 2023 results at 2 p.m. Pacific Time / 5 p.m. Eastern Time on July 27, 2023. Participants may access the live webcast in listen-only mode on the Roku investor relations website at www.roku.com/investor. An archived webcast of the conference call will also be available at www.roku.com/investor after the call.
Segment Reporting Change
Effective as of the fourth quarter of fiscal 2022, we reorganized reportable segments to better align with management’s reporting of information reviewed by our Chief Operating Decision Maker, our CEO, for each segment. Our segment and related financial information is recast to reflect the following changes; we renamed the Player segment to the Devices segment, which now includes licensing arrangements with service operators and TV brands in addition to sales of streaming players, audio products, smart home products and services, and starting in 2023, Roku-branded TV sales. All financial information, current and historical, is recast based on the reorganized segments.
About Roku, Inc.
Roku pioneered streaming on TV. We connect users to the content they love, enable content publishers to build and monetize large audiences, and provide advertisers with unique capabilities to engage consumers. Roku TV™ models, Roku streaming players and TV-related audio devices, are available in various countries around the world through direct retail sales and/or licensing arrangements with TV OEM brands. Roku-branded TVs and Roku Smart Home products are sold exclusively in the United States. Roku also operates The Roku Channel, the home of free and premium entertainment with exclusive access to Roku Originals. The Roku Channel is available in the United States, Canada, Mexico, and the United Kingdom. Roku is headquartered in San Jose, Calif., U.S.A.
Roku, Roku TV, the Roku logo and other trade names, trademarks or service marks of Roku appearing in this shareholder letter are trademarks or registered trademarks of Roku, Inc. Trade names, trademarks and service marks of other companies appearing in this shareholder letter are the property of their respective holders.
| | |
| Roku Q2 2023 Shareholder Letter |
6
Investor Relations Media
Conrad Grodd Stephanie Tackach
cgrodd@roku.com tackach@roku.com
Use of Non-GAAP Measures
In addition to financial information prepared in accordance with generally accepted accounting principles in the United States (GAAP), this shareholder letter includes certain non-GAAP financial measures. These non-GAAP measures include Adjusted EBITDA. In order for our investors to be better able to compare our current results with those of previous periods, we have included a reconciliation of GAAP to non-GAAP financial measures in the tables at the end of this letter. The Adjusted EBITDA reconciliation adjusts the related GAAP financial measure to exclude other income (expense), net, stock-based compensation expense, depreciation and amortization, restructuring charges, and income tax (benefit)/expense where applicable. We believe these non-GAAP financial measures are useful as a supplement in evaluating our ongoing operational performance and enhancing an overall understanding of our past financial performance. However, these non-GAAP financial measures have limitations, and should not be considered in isolation or as a substitute for our GAAP financial information.
Forward-Looking Statements
This shareholder letter contains “forward-looking” statements that are based on our beliefs and assumptions and on information currently available to us. Forward-looking statements include all statements that are not historical facts and can be identified by terms such as “anticipate,” “believe,” “continue,” “could,” “design,” “estimate,” “expect,” “may,” “plan,” “seek,” “should,” “will,” “would” or similar expressions and the negatives of those terms. Forward-looking statements involve known and unknown risks, uncertainties and other factors that may cause our actual results, performance or achievements to be materially different from any future results, performance or achievements expressed or implied by the forward-looking statements. Forward-looking statements represent our beliefs and assumptions only as of the date of this letter. These statements include those related to our ability to create and grow engagement and monetization opportunities; the continued success of our Roku TV program; our ability to innovate; dynamics in the ad market; our ability to grow as the ad market recovers; trends in consumer demand; the shift of TV and TV advertising to streaming; our scale and ability to grow; the functionality and benefits of ongoing enhancements to our platform functionality, including by using machine learning; the growth, advantages and content slate The Roku Channel; our content investments; Upfront commitment negotiations; the value of Roku Originals; the benefits and reception of Roku-branded TVs; the benefits and capabilities of our advertising platform, such as our Primetime Reach Guarantee and relationship with Shopify; our ability to scale our advertising products and platform; our ability to diversify our revenue streams; our relationships with third-party advertising platforms; macro uncertainties and pressure on consumers; signs of recovery in the ad market; pressures on M&E spend in the second half of the year; our financial outlook for the third quarter of 2023; our commitment to positive Adjusted EBITDA for full year 2024 and continued improvements thereafter; our qualitative color on our business in 2023 and beyond; and our overall business trajectory. Except as required by law, we assume no obligation to update these forward-looking statements publicly, or to update the reasons actual results could differ materially from those anticipated in the forward-looking statements, even if new information becomes available in the future. Further information on factors that could cause actual results to differ materially from the results anticipated by our forward-looking statements is included in the reports we have filed with the Securities and Exchange Commission, including our Annual Report on Form 10-K for the year ended December 31, 2022. Additional information also will be available in our Quarterly Report on Form 10-Q for the quarter ended June 30, 2023. All information provided in this shareholder letter and in the tables attached hereto is as of July 27, 2023, and we undertake no duty to update this information unless required by law.
| | |
| Roku Q2 2023 Shareholder Letter |
7
ROKU, INC.
CONDENSED CONSOLIDATED STATEMENTS OF OPERATIONS
(in thousands, except per share data)
(unaudited)
| | | | | | | | | | | | | | | | | | | | | | | |
| Three Months Ended | | Six Months Ended |
| June 30, 2023 | | June 30, 2022 | | June 30, 2023 | | June 30, 2022 |
| Net Revenue: | | | | | | | |
| Platform | $ | 743,835 | | | $ | 669,256 | | | $ | 1,378,453 | | | $ | 1,312,963 | |
| Devices | 103,351 | | | 95,150 | | | 209,723 | | | 185,142 | |
| Total net revenue | 847,186 | | | 764,406 | | | 1,588,176 | | | 1,498,105 | |
| Cost of Revenue: | | | | | | | |
| Platform (1) | 348,010 | | | 295,058 | | | 648,597 | | | 560,846 | |
| Devices (1) | 120,905 | | | 114,199 | | | 223,711 | | | 217,303 | |
| Total cost of revenue | 468,915 | | | 409,257 | | | 872,308 | | | 778,149 | |
| Gross Profit (Loss): | | | | | | | |
| Platform | 395,825 | | | 374,198 | | | 729,856 | | | 752,117 | |
| Devices | (17,554) | | | (19,049) | | | (13,988) | | | (32,161) | |
| Total gross profit | 378,271 | | | 355,149 | | | 715,868 | | | 719,956 | |
| Operating Expenses: | | | | | | | |
| Research and development (1) | 192,387 | | | 196,637 | | | 412,472 | | | 360,635 | |
| Sales and marketing (1) | 227,192 | | | 184,971 | | | 461,111 | | | 331,493 | |
| General and administrative (1) | 84,652 | | | 84,054 | | | 180,705 | | | 161,831 | |
| Total operating expenses | 504,231 | | | 465,662 | | | 1,054,288 | | | 853,959 | |
| Loss from Operations | (125,960) | | | (110,513) | | | (338,420) | | | (134,003) | |
| Other Income (Expense), Net: | | | | | | | |
| Interest expense | (4) | | | (1,059) | | | (685) | | | (2,116) | |
| Other income, net | 19,999 | | | 1,829 | | | 43,100 | | | 2,238 | |
| Total other income, net | 19,995 | | | 770 | | | 42,415 | | | 122 | |
| Loss Before Income Taxes | (105,965) | | | (109,743) | | | (296,005) | | | (133,881) | |
| Income tax expense | 1,630 | | | 2,578 | | | 5,194 | | | 4,746 | |
| Net Loss | $ | (107,595) | | | $ | (112,321) | | | $ | (301,199) | | | $ | (138,627) | |
| | | | | | | |
| Net loss per share — basic and diluted | $ | (0.76) | | | $ | (0.82) | | | $ | (2.14) | | | $ | (1.02) | |
| | | | | | | |
| | | | | | | |
| Weighted-average common shares outstanding — basic and diluted | 141,033 | | | 136,849 | | | 140,685 | | | 136,198 | |
| | | | | | | |
(1) Stock-based compensation was allocated as follows:
| | | | | | | | | | | | | | | | | | | | | | | |
| Cost of revenue, platform | $ | 349 | | | $ | 366 | | | $ | 688 | | | $ | 602 | |
| Cost of revenue, devices | 812 | | | 435 | | | 1,616 | | | 1,004 | |
| Research and development | 34,824 | | | 38,229 | | | 73,487 | | | 66,619 | |
| Sales and marketing | 31,225 | | | 27,917 | | | 65,364 | | | 51,828 | |
| General and administrative | 22,369 | | | 20,077 | | | 44,896 | | | 36,551 | |
| Total stock-based compensation | $ | 89,579 | | | $ | 87,024 | | | $ | 186,051 | | | $ | 156,604 | |
| | |
| Roku Q2 2023 Shareholder Letter |
8
ROKU, INC.
CONDENSED CONSOLIDATED BALANCE SHEETS
(in thousands, except par value data)
(unaudited)
| | | | | | | | | | | |
| As of |
| June 30, 2023 | | December 31, 2022 |
| Assets | | | |
| Current Assets: | | | |
| Cash and cash equivalents | $ | 1,755,261 | | | $ | 1,961,956 | |
| Restricted cash | 40,713 | | — | |
| Accounts receivable, net of allowances of $31,515 and $40,191 as of | 707,684 | | | 760,793 | |
| June 30, 2023 and December 31, 2022, respectively | | | |
| Inventories | 93,214 | | | 106,747 | |
| Prepaid expenses and other current assets | 104,622 | | | 135,383 | |
| Total current assets | 2,701,494 | | | 2,964,879 | |
| Property and equipment, net | 357,603 | | | 335,031 | |
| Operating lease right-of-use assets | 499,308 | | | 521,695 | |
| Content assets, net | 300,419 | | | 292,766 | |
| Intangible assets, net | 50,068 | | | 58,881 | |
| Goodwill | 161,519 | | | 161,519 | |
| Other non-current assets | 86,341 | | | 77,830 | |
| Total Assets | $ | 4,156,752 | | | $ | 4,412,601 | |
| Liabilities and Stockholders’ Equity | | | |
| Current Liabilities: | | | |
| Accounts payable | $ | 212,915 | | | $ | 164,800 | |
| Accrued liabilities | 638,480 | | | 750,810 | |
| Current portion of long-term debt | — | | | 79,985 | |
| Deferred revenue, current portion | 104,109 | | | 87,678 | |
| Total current liabilities | 955,504 | | | 1,083,273 | |
| Deferred revenue, non-current portion | 23,065 | | | 28,210 | |
| Operating lease liability, non-current portion | 589,476 | | | 584,651 | |
| Other long-term liabilities | 55,432 | | | 69,911 | |
| Total Liabilities | 1,623,477 | | | 1,766,045 | |
| Stockholders’ Equity: | | | |
| Common stock, $0.0001 par value | 14 | | | 14 | |
| Additional paid-in capital | 3,422,415 | | | 3,234,860 | |
| Accumulated other comprehensive income (loss) | 71 | | | (292) | |
| Accumulated deficit | (889,225) | | | (588,026) | |
| Total stockholders’ equity | 2,533,275 | | | 2,646,556 | |
| Total Liabilities and Stockholders’ Equity | $ | 4,156,752 | | | $ | 4,412,601 | |
| | |
| Roku Q2 2023 Shareholder Letter |
9
ROKU, INC.
CONDENSED CONSOLIDATED STATEMENTS OF CASH FLOWS
(in thousands)
(unaudited)
| | | | | | | | | | | |
| Six Months Ended |
| June 30, 2023 | | June 30, 2022 |
| Cash flows from operating activities: | | | |
| Net Loss | $ | (301,199) | | | $ | (138,627) | |
| Adjustments to reconcile net loss to net cash from operating activities: | | | |
| Depreciation and amortization | 34,181 | | | 22,902 | |
| Stock-based compensation expense | 186,051 | | | 156,604 | |
| Amortization of right-of-use assets | 30,532 | | | 25,235 | |
| Amortization of content assets | 102,314 | | | 100,497 | |
| Foreign currency remeasurement (gains) losses | 1,760 | | | — | |
| Change in fair value of the Strategic Investment | (3,090) | | | — | |
| Impairment of assets | 4,338 | | | — | |
| Provision for doubtful accounts | 2,962 | | | 467 | |
| Other items, net | (224) | | | (335) | |
| Changes in operating assets and liabilities: | | | |
| Accounts receivable | 50,430 | | | 37,320 | |
| Inventories | 13,533 | | | (25,801) | |
| Prepaid expenses and other current assets | 3,736 | | | (11,146) | |
| Content assets and liabilities, net | (120,522) | | | (150,513) | |
| Other non-current assets | 4,379 | | | (1,830) | |
| Accounts payable | 72,291 | | | (11,871) | |
| Accrued liabilities | (92,289) | | | (479) | |
| Operating lease liabilities | (5,754) | | | (16,125) | |
| Other long-term liabilities | (1,074) | | | 148 | |
| Deferred revenue | 11,286 | | | 3,607 | |
| Net cash used in operating activities | (6,359) | | | (9,947) | |
| Cash flows from investing activities: | | | |
| Purchases of property and equipment | (72,316) | | | (52,209) | |
| Purchase of Strategic Investment | (10,000) | | | (40,000) | |
| Net cash used in investing activities | (82,316) | | | (92,209) | |
| Cash flows from financing activities: | | | |
| Repayments of borrowings | (80,000) | | | (5,000) | |
| Proceeds from equity issued under incentive plans | 1,504 | | | 11,693 | |
| Net cash provided by (used in) financing activities | (78,496) | | | 6,693 | |
| Net decrease in cash, cash equivalents and restricted cash | (167,171) | | | (95,463) | |
| Effect of exchange rate changes on cash, cash equivalents and restricted cash | 1,189 | | | (67) | |
| Cash, cash equivalents and restricted cash —beginning of period | 1,961,956 | | | 2,147,670 | |
| Cash, cash equivalents and restricted cash —end of period | $ | 1,795,974 | | | $ | 2,052,140 | |
| | |
| Roku Q2 2023 Shareholder Letter |
10
| | | | | | | | | | | |
| Six Months Ended |
| June 30, 2023 | | June 30, 2022 |
| Cash, cash equivalents and restricted cash at end of period: | | | |
| Cash and cash equivalents | $ | 1,755,261 | | | $ | 2,050,412 | |
| Restricted cash, current | 40,713 | | | — | |
| Restricted cash, non-current | — | | | 1,728 | |
| Cash, cash equivalents and restricted cash —end of period | $ | 1,795,974 | | | $ | 2,052,140 | |
| Supplemental disclosures of cash flow information: | | | |
| Cash paid for interest | $ | 871 | | | $ | 1,444 | |
| Cash paid for income taxes | $ | 3,955 | | | $ | 4,752 | |
| Supplemental disclosures of non-cash investing and financing activities: | | | |
| Unpaid portion of property and equipment purchases | $ | 4,094 | | | $ | 3,551 | |
NON-GAAP INFORMATION (in thousands)
(unaudited)
| | | | | | | | | | | | | | | | | | | | | | | |
| Three Months Ended | | Six Months Ended |
| June 30, 2023 | | June 30, 2022 | | June 30, 2023 | | June 30, 2022 |
| Reconciliation of Net Loss to Adjusted EBITDA: | | | | |
| Net Loss | $ | (107,595) | | | $ | (112,321) | | | $ | (301,199) | | | $ | (138,627) | |
| Other income, net | (19,995) | | | (770) | | | (42,415) | | | (122) | |
| Stock-based compensation | 89,579 | | | 87,024 | | | 186,051 | | | 156,604 | |
| Depreciation and amortization | 18,545 | | | 11,416 | | | 34,181 | | | 22,902 | |
Restructuring charges (1) | 46 | | | — | | | 31,316 | | | — | |
| Income tax expense | 1,630 | | | 2,578 | | | 5,194 | | | 4,746 | |
| Adjusted EBITDA | $ | (17,790) | | | $ | (12,073) | | | $ | (86,872) | | | $ | 45,503 | |
(1) Restructuring charges for the three months ended June 30, 2023 include severance and related charges of $0.1 million offset by a reduction to the previously estimated facilities exit costs of $0.1 million.
Restructuring charges of $31.3 million for the six months ended June 30, 2023 include severance and related charges of $25.4 million, assets impairment charge of $4.3 millions, and facilities exit costs $1.6 million.
Quarterly streaming hours published vs. revised streaming hours (billions) 0b 2b 4b 6b 8b 10b 12b 14b 2017 q1 2017 q2 2017 q3 2017 q4 2018 q1 2018 q2 2018 q3 2018 q4 2019 q1 2019 q2 2019 q3 2019 q4 2020 q1 published streaming hours revised streaming ho
| | |
| Roku Q2 2023 Shareholder Letter |
11