| Exhibit 99.1 | |||||||||||||||||||||||||||||
| Fellow Shareholders, | April 25, 2024 | ||||||||||||||||||||||||||||
We delivered solid results in Q1, growing Streaming Households (previously “Active Accounts”)1 14% YoY, Streaming Hours 23% YoY, and Platform Revenue 19% YoY. Roku remains the #1 selling TV OS in the U.S. and Mexico, and we continue to expand our retail distribution. The Roku Channel’s ongoing growth made it the #3 app on our platform by both reach and engagement. This strong performance demonstrates the impact of surfacing relevant content throughout our platform. We also achieved positive Adjusted EBITDA and Free Cash Flow for the third consecutive quarter, demonstrating our ongoing focus on operational efficiencies.
Q1 2024 Key Results
•Total net revenue was $882 million, up 19% year over year (YoY)
•Platform revenue was $755 million, up 19% YoY
•Gross profit was $388 million, up 15% YoY
•Streaming Households were 81.6 million, a net increase of 1.6 million from Q4 2023
•Streaming Hours were 30.8 billion, up 5.7 billion hours YoY
•Average Revenue Per User (ARPU) was $40.65 on a trailing 12-month basis (TTM), flat YoY
•Third consecutive quarter of positive Adjusted EBITDA and Free Cash Flow
| Key Operating Metrics | Q1 23 | Q2 23 | Q3 23 | Q4 23 | Q1 24 | YoY % | |||||||||||||||||||||||||||||
| Active Accounts (millions) | 71.6 | 73.5 | 75.8 | 80.0 | 81.6 | 14 | % | ||||||||||||||||||||||||||||
| Streaming Hours (billions) | 25.1 | 25.1 | 26.7 | 29.1 | 30.8 | 23 | % | ||||||||||||||||||||||||||||
| ARPU (TTM) | $ | 40.67 | $ | 40.67 | $ | 41.03 | $ | 39.92 | $ | 40.65 | — | % | |||||||||||||||||||||||
| Summary Financials ($ in millions) | Q1 23 | Q2 23 | Q1 23 | Q2 23 | Q1 24 | YoY % | |||||||||||||||||||||||||||||
| Platform revenue | $ | 634.6 | $ | 743.8 | $ | 786.8 | $ | 828.9 | $ | 754.9 | 19 | % | |||||||||||||||||||||||
| Devices revenue | 106.4 | 103.4 | 125.2 | 155.6 | 126.5 | 19 | % | ||||||||||||||||||||||||||||
| Total net revenue | 741.0 | 847.2 | 912.0 | 984.4 | 881.5 | 19 | % | ||||||||||||||||||||||||||||
| Platform gross profit | 334.0 | 395.8 | 378.2 | 458.5 | 394.4 | 18 | % | ||||||||||||||||||||||||||||
| Devices gross profit (loss) | 3.6 | (17.6) | (9.4) | (20.5) | (6.1) | nm | |||||||||||||||||||||||||||||
| Total gross profit | 337.6 | 378.3 | 368.8 | 437.9 | 388.3 | 15 | % | ||||||||||||||||||||||||||||
| Platform gross margin % | 52.6 | % | 53.2 | % | 48.1 | % | 55.3 | % | 52.2 | % | (0.4) | pts | |||||||||||||||||||||||
| Devices gross margin % | 3.4 | % | (17.0) | % | (7.5) | % | (13.2) | % | (4.8) | % | (8.2) | pts | |||||||||||||||||||||||
| Total gross margin % | 45.6 | % | 44.7 | % | 40.4 | % | 44.5 | % | 44.1 | % | (1.5) | pts | |||||||||||||||||||||||
| Research and development | 220.1 | 192.4 | 282.2 | 183.8 | 180.5 | (18) | % | ||||||||||||||||||||||||||||
| Sales and marketing | 233.9 | 227.2 | 307.7 | 264.6 | 202.1 | (14) | % | ||||||||||||||||||||||||||||
| General and administrative | 96.1 | 84.7 | 128.7 | 93.7 | 77.7 | (19) | % | ||||||||||||||||||||||||||||
| Total operating expenses | 550.1 | 504.2 | 718.6 | 542.1 | 460.3 | (16) | % | ||||||||||||||||||||||||||||
| Loss from operations | (212.5) | (126.0) | (349.8) | (104.2) | (72.0) | (66) | % | ||||||||||||||||||||||||||||
Adjusted EBITDA A | (69.1) | (17.8) | 43.4 | 47.7 | 40.9 | nm | |||||||||||||||||||||||||||||
| Adjusted EBITDA margin % | (9.3) | % | (2.1) | % | 4.8 | % | 4.8 | % | 4.6 | % | 14.0 | pts | |||||||||||||||||||||||
| Cash flow from operations (TTM) | (243.4) | 15.4 | 246.9 | 255.9 | 456.0 | nm | |||||||||||||||||||||||||||||
Free cash flow (TTM) A | (448.1) | (169.3) | 100.8 | 175.9 | 426.8 | nm | |||||||||||||||||||||||||||||
| Outlook ($ in millions) | Q2 2024E | A - Refer to the reconciliation of Net loss to Adjusted EBITDA and Cash flow from operations to Free cash flow in the non-GAAP information at the end of this letter. | |||||||||||||||||||||||||||||||||
| Total net revenue | $935 | ||||||||||||||||||||||||||||||||||
| Total gross profit | $410 | B - Q2 2024E reconciling items between net loss and non-GAAP Adjusted EBITDA consist of stock-based compensation of approx. $100 million, depreciation and amortization of approx. $15 million, and other income of approx. $20 million. | |||||||||||||||||||||||||||||||||
| Net income (loss) | $(65) | ||||||||||||||||||||||||||||||||||
Adjusted EBITDA B | $30 | ||||||||||||||||||||||||||||||||||
1 ”Streaming Households” are the number of distinct user accounts that have streamed content on our platform within the last 30 days of the period. Prior to this shareholder letter, we referred to “Streaming Households” as “Active Accounts.” While we have changed this term to better reflect the nature of our business, we calculate “Streaming Households” using the same methodology that we used to calculate “Active Accounts,” and this change in terminology does not change any metrics we have reported in prior periods.
| Roku Q1 2024 Shareholder Letter | ||
Market-Leading Scale
In Q1, Roku grew Streaming Households to 81.6 million globally. Sequential net adds of 1.6 million were in line with Q1 2023 and driven by both TVs and streaming players. Roku continued to benefit from consumers’ focus on value. The Roku operating system (OS) was again the #1 selling TV OS in the U.S. and Mexico, representing approximately 40% of TVs sold in each country in Q12.
In January, we announced the Roku Pro Series, expanding our award-winning lineup of Roku-branded TVs (designed, made, and sold by Roku). Our new higher-performing TVs come with advanced features, including: Roku Smart Picture Max, which uses AI to automatically optimize brightness and colors and select the best picture mode for the viewer; Roku Soundstage Audio, which projects sound out and around the viewer through new side-firing speakers; Backdrops, which displays artwork or photos and transforms the TV into a work of art; and a new Voice Remote Pro with touch-activated backlit buttons. The Roku Pro Series is now available in 55”, 65”, and 75” models at Best Buy in store and online, Amazon.com, and Walmart.com. These innovative new features and more are also available in our latest software update to all supported Roku streaming devices in the U.S.

With Backdrops, users can select their favorite artwork or upload their own image
to transform their Roku OS-enabled TV into a work of art
Driving Engagement
Globally, our users streamed 30.8 billion hours in Q1. Streaming Hours grew 23% YoY as viewers continue to shift to TV streaming. During the same period, hours on traditional TV in the U.S. fell 13% YoY (Nielsen). We also grew engagement per household globally, with Streaming Hours per Streaming Household per day of 4.2 hours in Q1 2024, up from 3.9 hours in Q1 2023.
2 Source: Circana, Retail Tracking Service, Unit Sales, Jan-Mar 2024 combined
| Roku Q1 2024 Shareholder Letter | ||
Viewer Experience
As the programmer of our Home Screen, we continue to introduce innovative ways for our viewers to find great entertainment, while also growing monetization opportunities.
Sports remains one of the most important content categories for audiences and advertisers, and Roku is well positioned to benefit from its shift to streaming. To make Super Bowl LVIII easily accessible for viewers, we promoted it in the NFL Zone and throughout our platform. The NFL Zone (within the Roku Sports experience) offers football fans a centralized location to find live and upcoming games, weekly previews, and League highlights. Super Bowl LVIII was also promoted through Roku City, Roku-sold sponsorships, and Roku Pay subscription sign-ups. According to Nielsen, Super Bowl LVIII attracted the largest U.S. TV audience on record, and more than a fifth of all TV viewers streamed on the Roku platform (based on internal Roku data)3.

The NFL Zone, sponsored by TurboTax; Super Bowl LVIII integration in Roku City
In April we launched the NBA Zone, a one-stop destination for NBA games, highlights, documentaries, original series, league news, and more. The NBA Zone includes the NBA App, and NBA League Pass, the NBA’s premium live out-of-market game subscription service, which is available to purchase with Roku Pay. Roku has also partnered with the NBA to launch the first-ever NBA FAST channel exclusively on The Roku Channel. The NBA FAST channel features classic games, highlights, recaps, documentaries, original series, studio shows, interviews, and more. This new channel expands our current lineup of more than 35 sports-focused FAST channels.
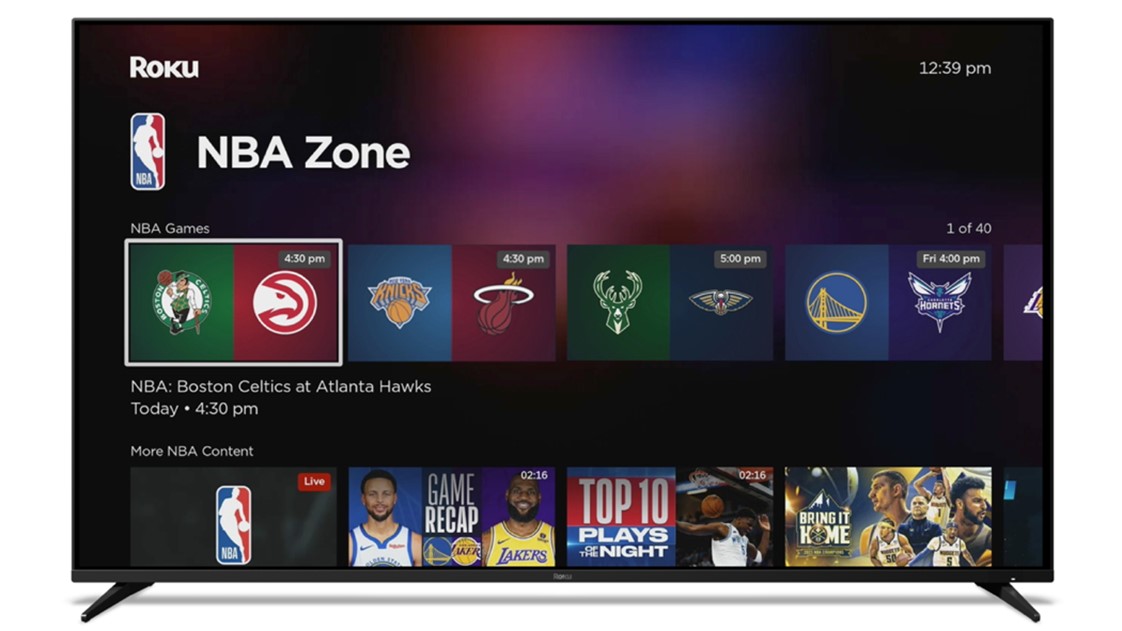
The NBA Zone, within the Roku Sports experience
3 All TV viewers includes streaming, cable, broadcast, satellite, and over-the-air. Roku viewers based on internal Roku data.
| Roku Q1 2024 Shareholder Letter | ||
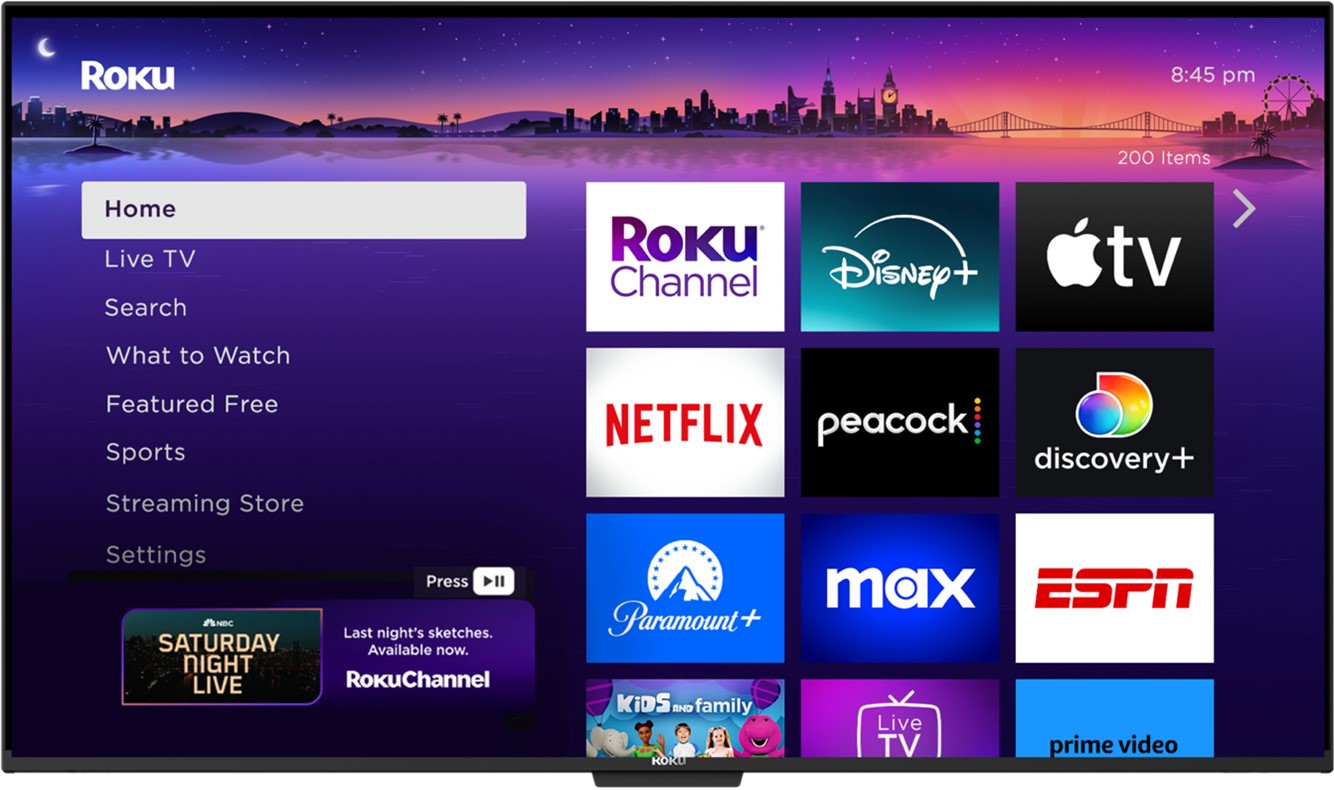
On our Home Screen, we surface content to our viewers at the start of their streaming journey. Recent Home Screen experiences include our New Year’s Eve hub in late December, the Emmys Collection in January, the Valentine’s Day Zone in February, and the Oscars Collection in March. With insights and learnings from these destinations, we are creating more Home Screen experiences that we can scale for the benefit of viewers and marketers — particularly those who want to sponsor tentpole content and events.
We also help viewers find great entertainment through recommendations integrated across the Roku platform. For example, at the top of our Home Screen grid, we recently added a new personalized content row powered by AI. We also offer “You May Also Like” suggestions on content details pages. Unlike suggestions from streaming services, which are restricted to their libraries, Roku’s recommendations include content from streaming apps across our platform. Our ongoing enhancements to our Home Screen are helping to drive engagement, with Streaming Hours originating from the Home Screen Menu (left-hand navigation) more than doubling YoY in Q1. This growing engagement creates more monetization opportunities.
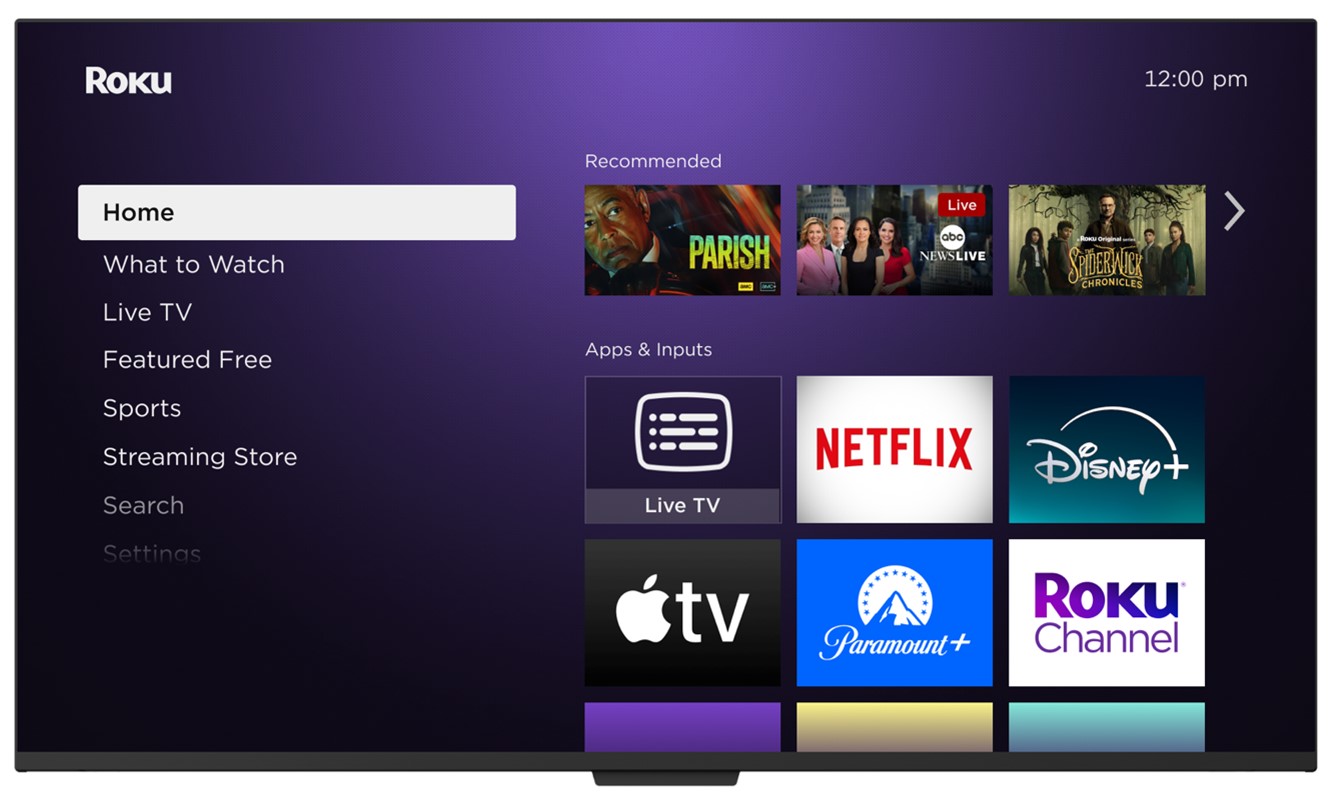
Personalized content row to help guide viewers to great entertainment
The Roku Channel
We continue to drive strong growth of The Roku Channel, which became the #3 app on our platform in Q1 by both reach and engagement, with Streaming Hours up 66% YoY.
Providing a broad array of content for our viewers, The Roku Channel offers AVOD, Live TV (FAST4), and Premium Subscriptions through viewing experiences across our platform. We use our genre-specific viewer experiences, like Sports, to elevate related programming. As part of Super Bowl LVIII, for example, we once again brought Roku Original “The Rich Eisen Show” to audiences live, selling out sponsorships to brands including Subway and BMW of North America. BMW’s campaign also included creative on our Home Screen, interactive video overlays promoting BMW’s website, and content in support of BMW’s Big Game spot.
4 FAST: free ad-supported linear streaming TV, does not include on-demand content
| Roku Q1 2024 Shareholder Letter | ||
Automaker BMW sponsored segments of “The Rich Eisen Show”
Short-form content is another popular category with viewers. Recently, we launched short-form video clips from NBCUniversal on The Roku Channel. Highlights from NBC Sports and late-night programming, such as “Saturday Night Live” and “The Tonight Show Starring Jimmy Fallon,” appear throughout our platform shortly after they air live. This generates additional reach and engagement, which we are able to monetize.
“Saturday Night Live” clips highlighted on the Roku Home Screen
| Roku Q1 2024 Shareholder Letter | ||
Growing Monetization
We generate Platform revenue primarily from the sale of advertising (including direct and programmatic video advertising, M&E promotional spending, sponsorships, and related ad products and services), as well as streaming services distribution (including subscription and transactional revenue, the sale of Premium Subscriptions, and the sale of branded app buttons on remote controls).
Platform revenue was $755 million in Q1, up 19% YoY, reflecting contributions from streaming services distribution and advertising activities. In Q1, Platform Gross Margin was 52%, flat YoY. ARPU was $40.65 in Q1 (on a trailing 12-month basis), relatively flat YoY. This reflects an increasing share of Streaming Households in international markets where we are currently focused on growing scale and engagement.
Streaming Services Distribution Activities
With more than 81 million Streaming Households globally and the #1 TV streaming platform by hours streamed in the U.S.5, Roku helps streaming services acquire, engage, and retain subscribers. In Q1, streaming services distribution activities grew faster than Platform revenue overall, benefiting in part from price increases for subscription-based apps on our platform. Live sports are still accelerating the shift of viewers from traditional TV to streaming and were a driver for SVOD6 sign-ups on our platform in Q1. For this year’s Super Bowl, we drove sign-ups for Paramount+ through both a Premium Subscription in The Roku Channel and the Paramount+ DTC app. Roku Pay, our payments and billing service, makes it easy for both our viewers and content partners to transact subscriptions. We are focused on the large opportunity to grow the share of subscriptions on our platform that are billed through Roku Pay.
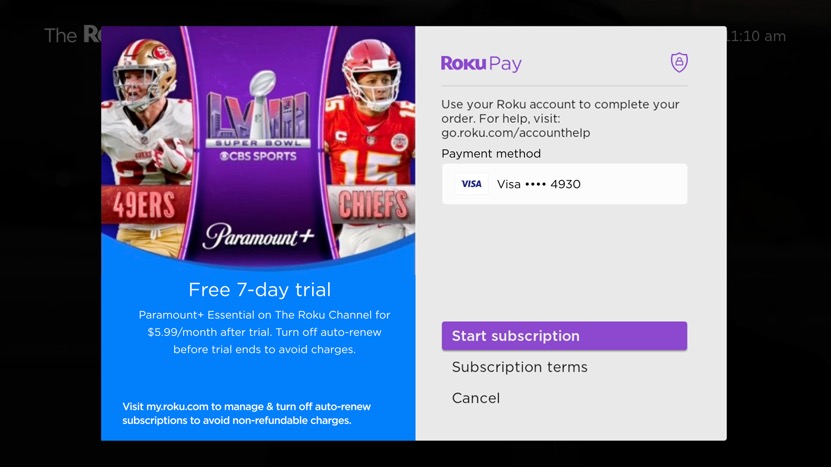
Roku Pay enables quick and easy subscription sign-up
Advertising Activities
The YoY growth of video advertising across the Roku platform outperformed both the overall ad market and the traditional linear TV ad market in the U.S. The Consumer Packaged Goods, Retail, and Auto verticals grew, while Insurance remained challenged.
5 Hypothesis Group, Dec 2023
6 Subscription video on demand
| Roku Q1 2024 Shareholder Letter | ||
Home Screen and video ads on the Roku platform reached U.S. households with nearly 120 million people on a daily basis in Q1. Our broad array of ad products connects advertisers with viewers throughout the streaming journey, from the Home Screen to Roku Originals to Roku City, and more. In Q1, we launched a new, virtual "showroom" that allows viewers to explore product options on the Roku platform. Advertisers can drive viewers to the showroom via ads on our Home Screen. These products help advertisers achieve results from top-of-funnel broad reach awareness to bottom-of-funnel results.
Additionally, we are making it easier for advertisers to execute campaigns programmatically by expanding and deepening our relationships with third-party platforms, including retail media networks, DSPs (demand side platforms), and other strategic partners. In Q1, we continued to grow programmatic ad spend as a percentage of total video ad spend on the Roku platform. We are focused on growing both the number of advertisers we serve and the size of advertising budget, while building partnerships that expand the targeting, attribution, and measurement capabilities we offer.
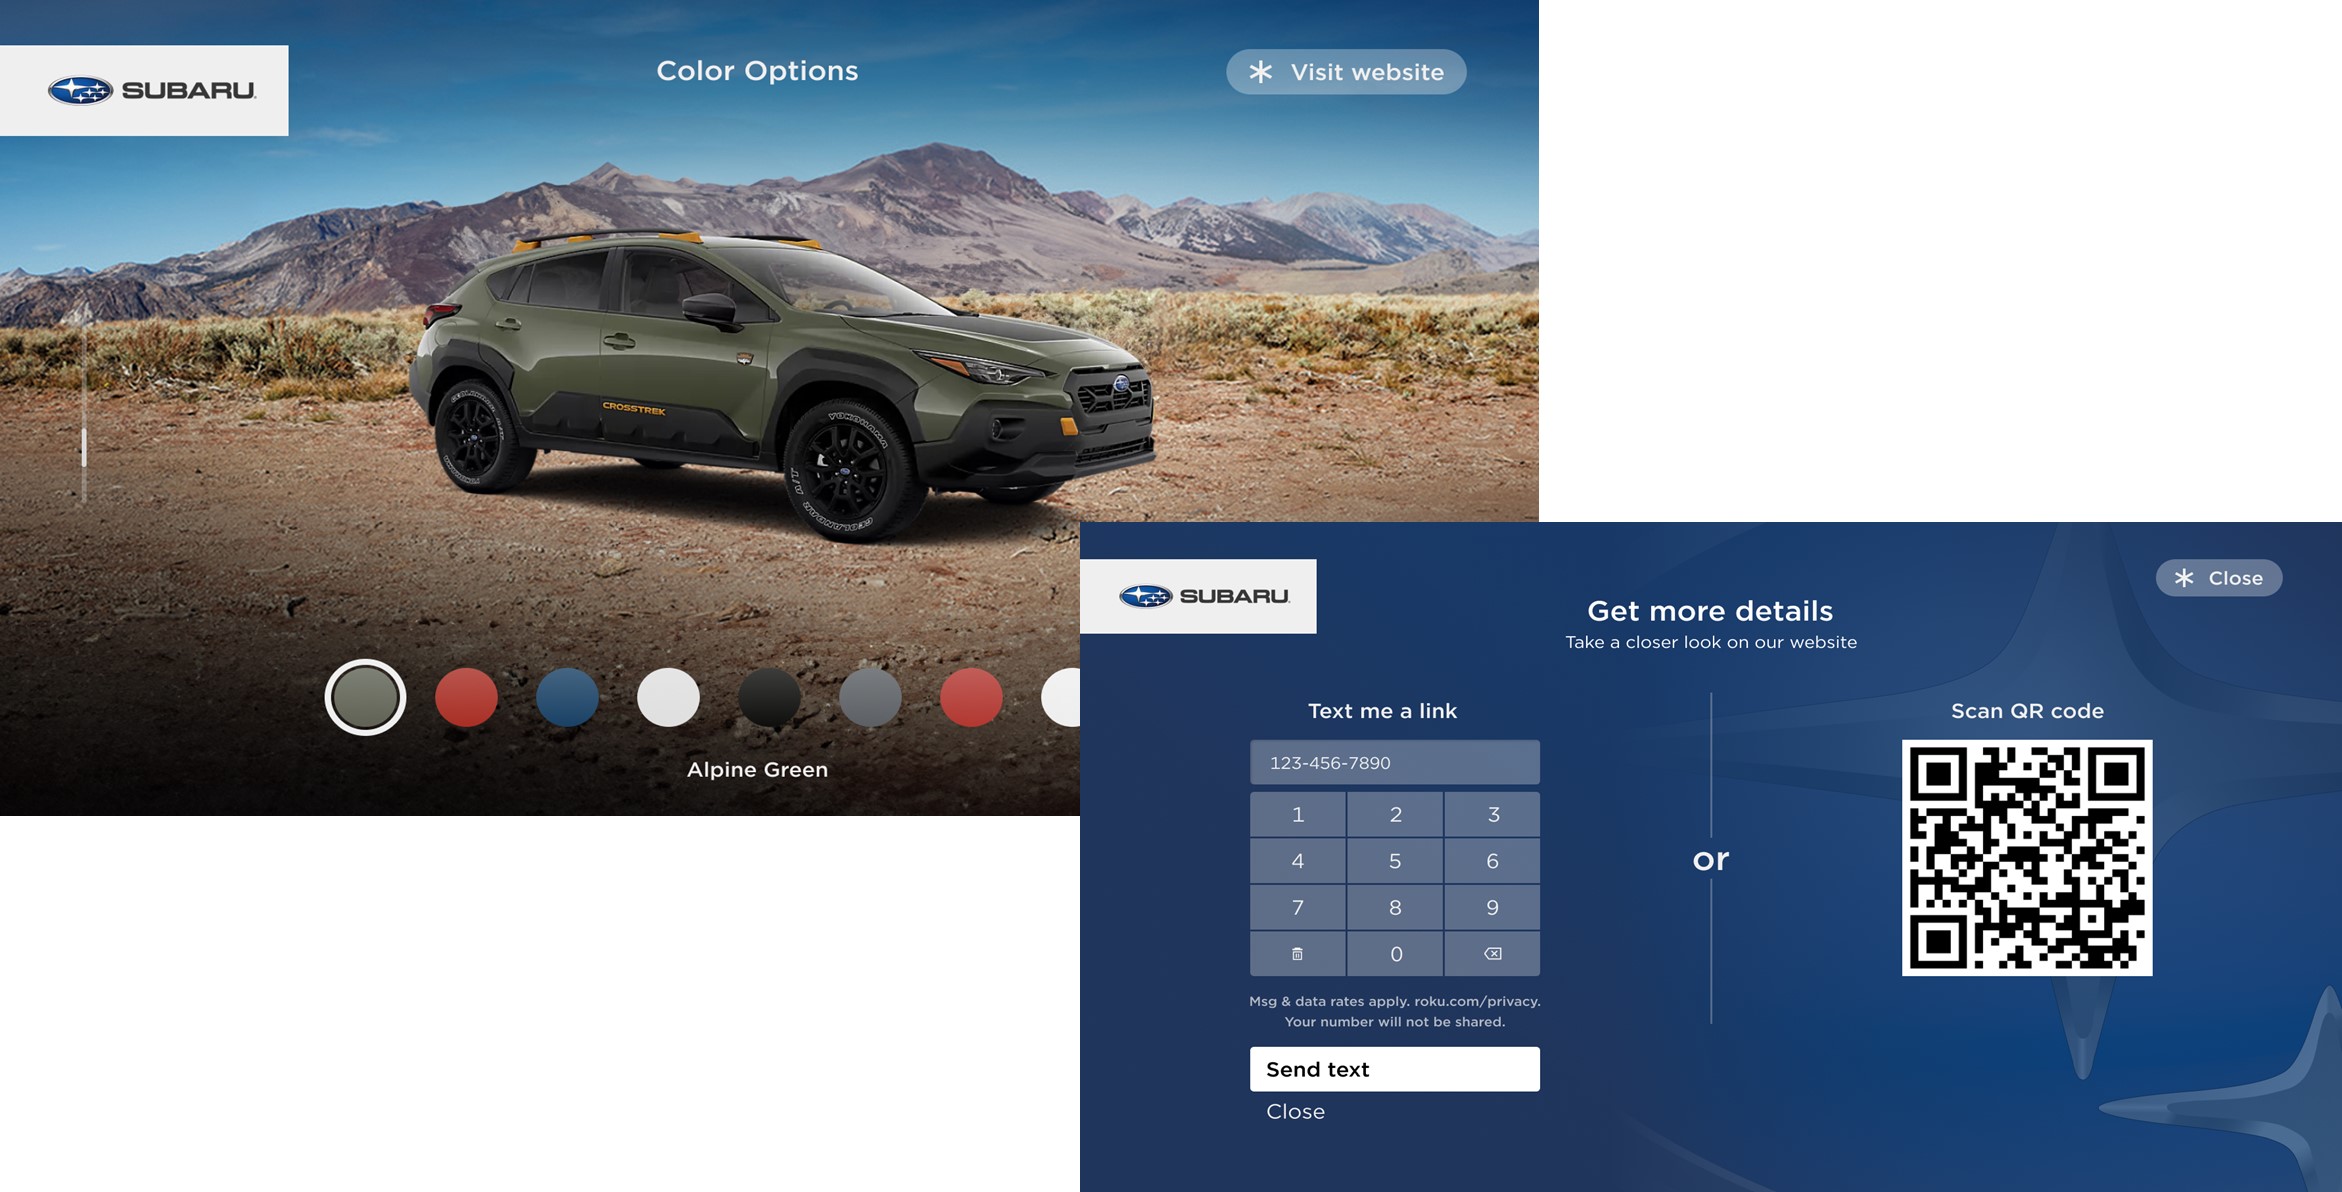
A new virtual “showroom” on the Roku platform
Outlook
We are pleased with our Q1 results, particularly the third consecutive quarter of positive Adjusted EBITDA and Free Cash Flow. We believe this demonstrates our operating discipline and leverage. Looking ahead, we face difficult year-over-year growth rate comparisons within streaming service distribution activities. This headwind is due to past price increases and a higher mix shift toward ad-supported offerings. In Q2, we estimate Total net revenue of $935 million, Total gross profit of $410 million, and Adjusted EBITDA of $30 million. Looking into the second half of the year, we anticipate normal seasonal spend in Sales & Marketing for Devices, which will cause Adjusted EBITDA to slightly moderate relative to the first half of the year.
We remain confident in our ability to accelerate the growth of Platform revenue and continue to grow Adjusted EBITDA, and Free Cash Flow in 2025 and beyond. We are focused on expanding monetization of the Roku Home Screen, bolstering programmatic ad capabilities, and growing Roku-billed subscriptions. Advertisers seeking to maximize ROI need ad solutions with significant reach and innovative ad technology. Roku has a direct relationship with more than 81 million Streaming Households, and we are deepening relationships with third-party platforms including DSPs, retail media networks, and measurement partners. Our business remains well positioned to capture the billions of dollars in traditional TV ad budgets that will shift to streaming.
Thank you for your support, and Happy Streaming™!
Anthony Wood, Founder and CEO, and Dan Jedda, CFO
| Roku Q1 2024 Shareholder Letter | ||
Conference Call Webcast – April 25, 2024 at 2 p.m. PT
The Company will host a webcast of its conference call to discuss the Q1 2024 results at 2 p.m. Pacific Time / 5 p.m. Eastern Time on April 25, 2024. Participants may access the live webcast in listen-only mode on the Roku investor relations website at www.roku.com/investor. An archived webcast of the conference call will also be available at www.roku.com/investor after the call.
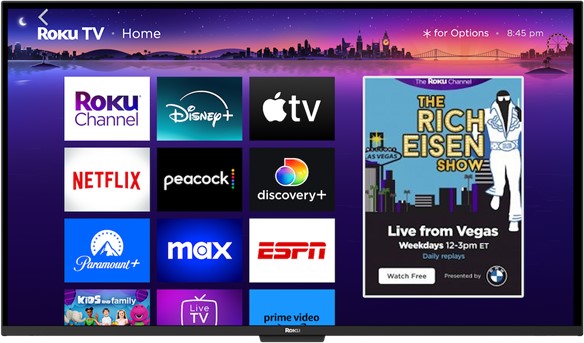
About Roku, Inc.
Roku pioneered streaming to the TV. We connect viewers to the streaming content they love, enable content publishers to build and monetize large audiences, and provide advertisers with unique capabilities to engage consumers. Roku streaming players and TV-related audio devices are available in the U.S. and in select countries through direct retail sales and licensing arrangements with service operators. Roku TV™ models are available in the U.S. and in select countries through licensing arrangements with TV OEM brands. Roku Smart Home products, including cameras, video doorbells, lighting, plugs, and more are available in the U.S. Roku is headquartered in San Jose, Calif. U.S.A.
Roku, Roku TV, Roku City, the Roku logo and other trade names, trademarks or service marks of Roku appearing in this shareholder letter are the property of Roku. Trade names, trademarks and service marks of other companies appearing in this shareholder letter are the property of their respective holders.
Investor Relations Conrad Grodd cgrodd@roku.com | Media Stephanie Tackach stackach@roku.com | ||||
| Roku Q1 2024 Shareholder Letter | ||
Use of Non-GAAP Measures
In addition to financial information prepared in accordance with generally accepted accounting principles in the United States (GAAP), this shareholder letter includes certain non-GAAP financial measures. These non-GAAP measures include Adjusted EBITDA and Free Cash Flow (FCF). In order for our investors to be better able to compare our current results with those of previous periods, we have included a reconciliation of GAAP to non-GAAP financial measures in the tables at the end of this letter. The Adjusted EBITDA reconciliation excludes other income (expense), net, stock-based compensation expense, depreciation and amortization, restructuring charges, and income tax (benefit)/expense from net income (loss), and the FCF reconciliation excludes purchases of property and equipment and effects of exchange rates on cash from the cash flows from operating activities, in each case where applicable. We believe these non-GAAP financial measures are useful as a supplement in evaluating our ongoing operational performance and enhancing an overall understanding of our past financial performance. However, these non-GAAP financial measures have limitations, and should not be considered in isolation or as a substitute for our GAAP financial information, such as GAAP net income (loss) and cash flows from operating activities. In addition, these non-GAAP financial measures may not be comparable to similarly titled metrics of other companies due to differences in methods of calculation.
Forward-Looking Statements
This shareholder letter contains “forward-looking” statements that are based on our beliefs and assumptions and on information currently available to us. Forward-looking statements include all statements that are not historical facts and can be identified by terms such as “anticipate,” “believe,” “continue,” “could,” “design,” “estimate,” “expect,” “may,” "plan,” “seek,” “should,” “will,” “would” or similar expressions and the negatives of those terms. Forward-looking statements involve known and unknown risks, uncertainties and other factors that may cause our actual results, performance or achievements to be materially different from any future results, performance or achievements expressed or implied by the forward-looking statements. Forward-looking statements represent our beliefs and assumptions only as of the date of this letter. These statements include those related to the expansion of our retail distribution; our ability to innovate with new products and services; the availability and functionality of our Roku-branded TVs and our Roku TV models; our ability to benefit from the accelerating shift of sports to streaming; the shift of TV and TV advertising to streaming; our ability to help streaming services acquire, engage and retain subscribers; our ability to grow subscriptions billed through Roku Pay; our ability to grow our Streaming Households; our room for growth in engagement; our ability to drive engagement; The Roku Channel’s growth; our international expansion; our ability to improve the viewer experience, including by innovations on the Roku home screen that benefit viewers and marketers; our ability to grow monetization opportunities; our ability to deliver a variety of attractive ad products; our ability to grow the number of advertisers and their ad spend on our platform; our ability to innovate our ad tech; our relationships with third-party advertising platforms, retail media networks, and measurement partners; our operational discipline and leverage; our financial outlook for the second quarter of 2024; our ability to capture traditional TV advertising budgets shifting to streaming; our ability to accelerate growth of Platform revenue and to continue to grow Adjusted EBITDA, and Free Cash Flow in 2025 and beyond; Adjusted EBITDA moderating in the second half of 2024; our additional qualitative color on our business for the rest of 2024 and beyond; and our overall business trajectory. Except as required by law, we assume no obligation to update these forward-looking statements publicly, or to update the reasons actual results could differ materially from those anticipated in the forward-looking statements, even if new information becomes available in the future. Further information on factors that could cause actual results to differ materially from the results anticipated by our forward-looking statements is included in the reports we have filed with the Securities and Exchange Commission, including our Annual Report on Form 10-K for the year ended December 31, 2023. Additional information also will be available in our Quarterly Report on Form 10-Q for the quarter ended March 31, 2024. All information provided in this shareholder letter and in the tables attached hereto is as of April 25, 2024, and we undertake no duty to update this information unless required by law.
| Roku Q1 2024 Shareholder Letter | ||
ROKU, INC.
CONDENSED CONSOLIDATED STATEMENTS OF OPERATIONS
(in thousands, except per share data)
(unaudited)
| Three Months Ended | |||||||||||||||||||||||
| March 31, 2024 | March 31, 2023 | ||||||||||||||||||||||
| Net Revenue: | |||||||||||||||||||||||
| Platform | $ | 754,935 | $ | 634,618 | |||||||||||||||||||
| Devices | 126,534 | 106,372 | |||||||||||||||||||||
| Total net revenue | 881,469 | 740,990 | |||||||||||||||||||||
| Cost of Revenue: | |||||||||||||||||||||||
| Platform (1) | 360,566 | 300,587 | |||||||||||||||||||||
| Devices (1) | 132,612 | 102,806 | |||||||||||||||||||||
| Total cost of revenue | 493,178 | 403,393 | |||||||||||||||||||||
| Gross Profit (Loss): | |||||||||||||||||||||||
| Platform | 394,369 | 334,031 | |||||||||||||||||||||
| Devices | (6,078) | 3,566 | |||||||||||||||||||||
| Total gross profit | 388,291 | 337,597 | |||||||||||||||||||||
| Operating Expenses: | |||||||||||||||||||||||
| Research and development (1) | 180,459 | 220,085 | |||||||||||||||||||||
| Sales and marketing (1) | 202,124 | 233,919 | |||||||||||||||||||||
| General and administrative (1) | 77,744 | 96,053 | |||||||||||||||||||||
| Total operating expenses | 460,327 | 550,057 | |||||||||||||||||||||
| Loss from Operations | (72,036) | (212,460) | |||||||||||||||||||||
| Other Income (Expense), Net: | |||||||||||||||||||||||
| Interest expense | (10) | (681) | |||||||||||||||||||||
| Other income, net | 25,956 | 23,101 | |||||||||||||||||||||
| Total other income, net | 25,946 | 22,420 | |||||||||||||||||||||
| Loss Before Income Taxes | (46,090) | (190,040) | |||||||||||||||||||||
| Income tax expense | 4,765 | 3,564 | |||||||||||||||||||||
| Net Loss | $ | (50,855) | $ | (193,604) | |||||||||||||||||||
| Net loss per share — basic and diluted | $ | (0.35) | $ | (1.38) | |||||||||||||||||||
| Weighted-average common shares outstanding — basic and diluted | 143,751 | 140,333 | |||||||||||||||||||||
(1) Stock-based compensation was allocated as follows:
| Cost of revenue, platform | $ | 414 | $ | 339 | |||||||||||||||||||
| Cost of revenue, devices | 899 | 804 | |||||||||||||||||||||
| Research and development | 37,590 | 38,663 | |||||||||||||||||||||
| Sales and marketing | 32,521 | 34,139 | |||||||||||||||||||||
| General and administrative | 23,208 | 22,527 | |||||||||||||||||||||
| Total stock-based compensation | $ | 94,632 | $ | 96,472 | |||||||||||||||||||
| Roku Q1 2024 Shareholder Letter | ||
ROKU, INC.
CONDENSED CONSOLIDATED BALANCE SHEETS
(in thousands, except par value data)
(unaudited)
| As of | |||||||||||
| March 31, 2024 | December 31, 2023 | ||||||||||
| Assets | |||||||||||
| Current Assets: | |||||||||||
| Cash and cash equivalents | $ | 2,055,728 | $ | 2,025,891 | |||||||
| Accounts receivable, net of allowances of $26,161 and $34,127 as of | 716,727 | 816,337 | |||||||||
| March 31, 2024 and December 31, 2023, respectively | |||||||||||
| Inventories | 94,531 | 92,129 | |||||||||
| Prepaid expenses and other current assets | 129,144 | 138,585 | |||||||||
| Total current assets | 2,996,130 | 3,072,942 | |||||||||
| Property and equipment, net | 251,487 | 264,556 | |||||||||
| Operating lease right-of-use assets | 358,105 | 371,444 | |||||||||
| Content assets, net | 249,526 | 257,395 | |||||||||
| Intangible assets, net | 38,076 | 41,753 | |||||||||
| Goodwill | 161,519 | 161,519 | |||||||||
| Other non-current assets | 96,912 | 92,183 | |||||||||
| Total Assets | $ | 4,151,755 | $ | 4,261,792 | |||||||
| Liabilities and Stockholders’ Equity | |||||||||||
| Current Liabilities: | |||||||||||
| Accounts payable | $ | 385,656 | $ | 385,330 | |||||||
| Accrued liabilities | 672,440 | 788,040 | |||||||||
| Deferred revenue, current portion | 101,650 | 102,157 | |||||||||
| Total current liabilities | 1,159,746 | 1,275,527 | |||||||||
| Deferred revenue, non-current portion | 23,491 | 24,572 | |||||||||
| Operating lease liability, non-current portion | 568,627 | 586,174 | |||||||||
| Other long-term liabilities | 44,062 | 49,186 | |||||||||
| Total Liabilities | 1,795,926 | 1,935,459 | |||||||||
| Stockholders’ Equity: | |||||||||||
| Common stock, $0.0001 par value | 14 | 14 | |||||||||
| Additional paid-in capital | 3,704,435 | 3,623,747 | |||||||||
| Accumulated other comprehensive income (loss) | (178) | 159 | |||||||||
| Accumulated deficit | (1,348,442) | (1,297,587) | |||||||||
| Total stockholders’ equity | 2,355,829 | 2,326,333 | |||||||||
| Total Liabilities and Stockholders’ Equity | $ | 4,151,755 | $ | 4,261,792 | |||||||
| Roku Q1 2024 Shareholder Letter | ||
ROKU, INC.
CONDENSED CONSOLIDATED STATEMENTS OF CASH FLOWS
(in thousands)
(unaudited)
| Three Months Ended | |||||||||||
| March 31, 2024 | March 31, 2023 | ||||||||||
| Cash flows from operating activities: | |||||||||||
| Net Loss | $ | (50,855) | $ | (193,604) | |||||||
| Adjustments to reconcile net loss to net cash from operating activities: | |||||||||||
| Depreciation and amortization | 16,473 | 15,636 | |||||||||
| Stock-based compensation expense | 94,632 | 96,472 | |||||||||
| Amortization of right-of-use assets | 11,876 | 15,301 | |||||||||
| Amortization of content assets | 47,891 | 49,402 | |||||||||
| Foreign currency remeasurement (gains) losses | 997 | 1,395 | |||||||||
| Change in fair value of the Strategic Investment | (574) | (3,210) | |||||||||
| Impairment of assets | 851 | 4,338 | |||||||||
| Provision for (recoveries of) doubtful accounts | (7) | 1,890 | |||||||||
| Other items, net | (748) | (24) | |||||||||
| Changes in operating assets and liabilities: | |||||||||||
| Accounts receivable | 99,500 | 55,608 | |||||||||
| Inventories | (2,402) | (2,491) | |||||||||
| Prepaid expenses and other current assets | 6,665 | 4,964 | |||||||||
| Content assets and liabilities, net | (50,059) | (55,539) | |||||||||
| Other non-current assets | (4,763) | 4,008 | |||||||||
| Accounts payable | 919 | (60,055) | |||||||||
| Accrued liabilities | (109,591) | (92,504) | |||||||||
| Operating lease liabilities | (12,704) | (1,597) | |||||||||
| Other long-term liabilities | 170 | (91) | |||||||||
| Deferred revenue | (1,588) | 6,689 | |||||||||
| Net cash provided by (used in) operating activities | 46,683 | (153,412) | |||||||||
| Cash flows from investing activities: | |||||||||||
| Purchases of property and equipment | (672) | (54,243) | |||||||||
| Purchase of Strategic Investment | — | (5,000) | |||||||||
| Net cash used in investing activities | (672) | (59,243) | |||||||||
| Cash flows from financing activities: | |||||||||||
| Repayments of borrowings | — | (80,000) | |||||||||
| Proceeds from equity issued under incentive plans | 8,262 | 891 | |||||||||
| Taxes paid related to net share settlement of equity awards | (22,206) | — | |||||||||
| Net cash used in financing activities | (13,944) | (79,109) | |||||||||
| Net increase (decrease) in cash, cash equivalents and restricted cash | 32,067 | (291,764) | |||||||||
| Effect of exchange rate changes on cash, cash equivalents and restricted cash | (2,230) | 573 | |||||||||
| Cash, cash equivalents and restricted cash —beginning of period | 2,066,604 | 1,961,956 | |||||||||
| Cash, cash equivalents and restricted cash —end of period | $ | 2,096,441 | $ | 1,670,765 | |||||||
| Roku Q1 2024 Shareholder Letter | ||
| Three Months Ended | |||||||||||
| March 31, 2024 | March 31, 2023 | ||||||||||
| Cash, cash equivalents and restricted cash at end of period: | |||||||||||
| Cash and cash equivalents | $ | 2,055,728 | $ | 1,630,052 | |||||||
| Restricted cash, current | 40,713 | 40,713 | |||||||||
| Cash, cash equivalents and restricted cash —end of period | $ | 2,096,441 | $ | 1,670,765 | |||||||
| Supplemental disclosures of cash flow information: | |||||||||||
| Cash paid for interest | $ | 29 | $ | 867 | |||||||
| Cash paid for income taxes | $ | 2,144 | $ | 1,452 | |||||||
| Supplemental disclosures of non-cash investing and financing activities: | |||||||||||
| Unpaid portion of property and equipment purchases | $ | 86 | $ | 10,492 | |||||||
| Roku Q1 2024 Shareholder Letter | ||
NON-GAAP INFORMATION
(in thousands)
(unaudited)
Reconciliation of Net loss to Adjusted EBITDA:
| Three Months Ended | |||||||||||||||||||||||
| March 31, 2024 | March 31, 2023 | ||||||||||||||||||||||
| Net Loss | $ | (50,855) | $ | (193,604) | |||||||||||||||||||
| Other income, net | (25,946) | (22,420) | |||||||||||||||||||||
| Stock-based compensation | 94,632 | 96,472 | |||||||||||||||||||||
| Depreciation and amortization | 16,473 | 15,636 | |||||||||||||||||||||
Restructuring charges (1) | 1,796 | 31,270 | |||||||||||||||||||||
| Income tax expense | 4,765 | 3,564 | |||||||||||||||||||||
| Adjusted EBITDA | $ | 40,865 | $ | (69,082) | |||||||||||||||||||
(1) Restructuring charges for the three months ended March 31, 2024 include severance and related charges of $0.9 million, asset impairment charges of $0.9 million, and facilities exit costs of less than $0.1 million.
Restructuring charges for the three months ended March 31, 2023 include severance and related charges of $25.2 million, asset impairment charges of $4.3 million, and facilities exit costs of $1.7 million.
Free cash flow (TTM):
| Q1 23 | Q2 23 | Q3 23 | Q4 23 | Q1 24 | |||||||||||||||||||||||||
| Net cash provided by (used in) operating activities | $ | (243,415) | $ | 15,383 | $ | 246,882 | $ | 255,856 | $ | 455,951 | |||||||||||||||||||
| Less: Purchases of property and equipment | (201,175) | (181,803) | (144,477) | (82,619) | (29,048) | ||||||||||||||||||||||||
| Add/(Less): Effect of exchange rate changes on cash, cash equivalents and restricted cash | (3,515) | (2,914) | (1,599) | 2,654 | (149) | ||||||||||||||||||||||||
| Free cash flow (TTM) | $ | (448,105) | $ | (169,334) | $ | 100,806 | $ | 175,891 | $ | 426,754 | |||||||||||||||||||
| Roku Q1 2024 Shareholder Letter | ||