| Exhibit 99.1 |
November 6, 2019
Fellow Shareholders,
We continue to execute well against our long-term strategic plan as the TV market shifts to streaming. In Q3, we beat our outlook for revenue, gross profit, and adjusted EBITDA. Our business momentum and competitive differentiation make Roku an essential partner for content publishers and advertisers. This is evident in the launch of major new streaming services on our platform and by the growth in the number of advertisers who work with Roku. We believe the dataxu acquisition will accelerate our platform’s advertising technology roadmap, strengthen our already industry-leading TV streaming platform and give us the opportunity to create an even more appealing offering for advertisers.
Q3 Highlights
| • | Total net revenue of $260.9 million, up 50% Year-over-Year (YoY); |
| • | Platform revenue of $179.3 million, up 79% YoY; |
| • | Active Accounts of 32.3 million, a net addition of 1.7 million over last quarter; |
| • | Streaming Hours increased 0.9 billion hours over last quarter, to 10.3 billion; |
| • | Average Revenue Per User (ARPU) of $22.58 (Trailing Twelve Months), up 30% YoY; |
| • | Gross Profit of $118.5 million, up 50% YoY; and |
| • | Roku monetized video ad impressions again more than doubled YoY. |
Key Operating Metrics | Q3 18 | | | Q4 18 | | | Q1 19 | | | Q2 19 | | | Q3 19 | | | YoY % | |
Active Accounts (millions) | | 23.8 | | | | 27.1 | | | | 29.1 | | | | 30.5 | | | | 32.3 | | | | 36 | % |
Streaming Hours (billions) | | 6.2 | | | | 7.3 | | | | 8.9 | | | | 9.4 | | | | 10.3 | | | | 68 | % |
ARPU ($) | $ | 17.34 | | | $ | 17.95 | | | $ | 19.06 | | | $ | 21.06 | | | $ | 22.58 | | | | 30 | % |
| | | | | | | | | | | | | | | | | | | | | | | |
Summary Financials ($ in millions) | Q3 18 | | | Q4 18 | | | Q1 19 | | | Q2 19 | | | Q3 19 | | | YoY % | |
Platform revenue | $ | 100.1 | | | $ | 151.4 | | | $ | 134.2 | | | $ | 167.7 | | | $ | 179.3 | | | | 79 | % |
Player revenue | | 73.3 | | | | 124.3 | | | | 72.5 | | | | 82.4 | | | | 81.6 | | | | 11 | % |
Total net revenue | | 173.4 | | | | 275.7 | | | | 206.7 | | | | 250.1 | | | | 260.9 | | | | 50 | % |
Platform gross profit | | 70.5 | | | | 109.4 | | | | 93.8 | | | | 109.7 | | | | 112.2 | | | | 59 | % |
Player gross profit | | 8.4 | | | | 2.9 | | | | 7.1 | | | | 4.5 | | | | 6.2 | | | | -26 | % |
Total gross profit | | 79.0 | | | | 112.3 | | | | 100.9 | | | | 114.2 | | | | 118.5 | | | | 50 | % |
Platform gross margin % | | 70.5 | % | | | 72.2 | % | | | 69.9 | % | | | 65.4 | % | | | 62.6 | % | | | -791 | bps |
Player gross margin % | | 11.5 | % | | | 2.4 | % | | | 9.8 | % | | | 5.5 | % | | | 7.6 | % | | | -388 | bps |
Total gross margin % | | 45.6 | % | | | 40.7 | % | | | 48.8 | % | | | 45.7 | % | | | 45.4 | % | | | -15 | bps |
R&D | | 45.4 | | | | 51.0 | | | | 55.7 | | | | 62.0 | | | | 68.5 | | | | 51 | % |
Sales and marketing | | 25.6 | | | | 34.6 | | | | 33.8 | | | | 36.6 | | | | 46.7 | | | | 82 | % |
G&A | | 19.8 | | | | 21.2 | | | | 22.1 | | | | 26.0 | | | | 29.9 | | | | 51 | % |
Total operating expenses | | 90.7 | | | | 106.8 | | | | 111.6 | | | | 124.6 | | | | 145.0 | | | | 60 | % |
Income (loss) from operations | | (11.7 | ) | | | 5.5 | | | | (10.7 | ) | | | (10.4 | ) | | | (26.5 | ) | | nm | |
Adjusted EBITDA 1 | | 2.0 | | | | 24.5 | | | | 10.0 | | | | 11.1 | | | | (0.4 | ) | | nm | |
Adjusted EBITDA margin % | | 1.1 | % | | | 8.9 | % | | | 4.8 | % | | | 4.4 | % | | | -0.2 | % | | | -130 | bps |
| | | | | | | | | | | | | | | | | | | | | | | |
Outlook ($ in millions) | Q4 2019E | | | Full Year 2019E | |
Total net revenue | $380 - $396 | | | $1,098 - $1,113 | |
Total gross profit | $156 - $161 | | | $489 - $494 | |
Net income (loss) | ($22)-($17) | | | ($66) - ($61) | |
Adjusted EBITDA 2, 3 | $7 - $12 | | | $28 - $33 | |
1 Refer to the reconciliation of net loss to adjusted EBITDA in the non-GAAP information in the tables accompanying this letter. | |
2 Full Year 2019E reconciling items between net loss and non-GAAP adjusted EBITDA consist of stock-based compensation of $84 million, and depreciation and amortization and other income of $10 million. | |
3 Q4 2019E reconciling items between net loss and non-GAAP adjusted EBITDA consist of stock-based compensation of approximately $25 million, and depreciation and amortization and other income of $4 million. | |

INDUSTRY TRENDS
An essential partner for reaching a highly engaged TV streaming audience
According to eMarketer, around 56 million households in total will have canceled cable or satellite TV subscriptions by 2023. Approximately 1.7 million consumers cut the cord in Q3 alone. Our own research indicates that roughly 50% of U.S. cord cutters are Roku customers, and cord cutters who choose Roku products are highly satisfied with the decision and extremely unlikely to consider returning to a traditional pay TV subscription.
The growing number of major streaming services, increasing investment in original programming and related high-profile marketing campaigns are likely to reinforce consumer interest in moving from traditional pay TV to streaming – and to the Roku platform. Just last week Apple TV+ launched on our platform adding a desirable option for millions of Apple and Roku customers around the world. Disney+ and several new free ad-supported video on demand (AVOD) services coming to market are also expected to launch soon on our platform. Such new services will generate revenue for Roku when we promote their content to our customers, when customers sign up on our platform and when our customers view ads.
GROWING ACTIVE ACCOUNTS
Refreshed Roku player lineup. Soundbars with players built-in.
During Q3, we saw strong unit sales for both Roku TV and players. We continue to lead in smart TV operating system (OS) licensing as the #1 licensed TV OS in North America. We believe that Roku TV represented more than one in three smart TVs sold in the U.S. during the first nine months of the year.
In September, we introduced a new line up of streaming players for North America, Latin America and markets in Europe. These new players make streaming affordable with an entry price point of $29.99 MSRP for the redesigned Roku Express. Our goal is to drive scale and reach of the platform and we will do so by offering consumers exceptional devices and appealing prices rather than optimizing for hardware gross profit. We are pleased that our popular Roku Streaming Stick+ recently won the CNET Editor’s Choice Award for the third consecutive year and was once again deemed their favorite streamer overall.
| |
In the U.S. we launched new audio devices – a smart soundbar and a wireless subwoofer under the Roku brand at Best Buy and exclusive models under the onn. • Roku brand at Walmart. The smart soundbar makes it easy to add both premium sound and powerful streaming to a TV. The wireless subwoofer seamlessly expands the premium audio of the smart soundbar or Roku TV™ Wireless Speakers with even deeper, richer bass. With a streaming player built inside, these smart soundbars are another way for us to drive account growth and increase engagement on the Roku platform. This fall our TV OEM partners began shipping a range of new Roku TV models across North America. Of note is the new TCL Roku TV 8 Series which just began shipping in the U.S. This advanced, high-end TV combines stunning 4K HDR and QLED technology plus features HDR 10 and Dolby Vision support along with Dolby Atmos. And it's the first Roku TV to use mini-LED technology, which promises even better contrast. Lastly during the quarter, we began to roll out Roku OS 9.2. Among other updates, this release brings new search and discovery features and enhanced Roku Voice functionality to Roku devices. | 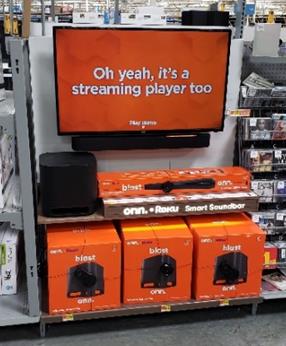
onn. • Roku brand audio devices at Walmart |
2
Roku Q3 2019 Shareholder Letter
Our competitive advantages support our international expansion
As we continue to lay the foundation for further international expansion, the key advantages that set us apart in the U.S. are expected to play an important role in new markets. Our purpose-built OS, engineering expertise, OEM partnerships, and free TV capabilities are among the many factors that we expect to contribute to our ability to attract content providers and consumers, and quickly build scale in new markets.
At IFA, the European consumer electronics show held in Germany, we announced plans to bring Roku TV to Europe beginning with the UK market. Our Roku TV launch partner Hisense is expected to ship the first Roku TV models in the UK before the end of this year. Roku TVs in the UK will include FreeView Play as well as a strong lineup of local streaming content publishers and global brands.
We look forward to bringing Roku TV to more international markets as well as deepening our selection in the UK. We plan to share more of our plans in early 2020.
THE POWER OF THE ROKU PLATFORM
A leap forward for our industry-leading advertising capabilities
Q3 was another quarter of strong progress for the Platform segment led by advertising. According to eMarketer, in the U.S., advertisers today spend more than $70 billion dollars on traditional linear TV and these dollars are still in the early stages of shifting to streaming. According to Magna Global, OTT accounts for 29 percent of U.S. TV viewing, but so far has only captured three percent of TV ad budgets. That gap is starting to close. For example, Magna Global forecasted $5 billion OTT ad spend for 2020. We believe that we are well positioned to benefit from this trend.
Roku monetized video ad impressions more than doubled again year-over-year. The Roku Channel contributed to this growth as impressions within the channel are growing faster than our impressions within the overall platform. While we continue to work with the majority of the Ad Age 200, our ad clientele continues to diversify and now also includes a wider range of small- and medium-sized businesses as well as local, direct-to-consumer, mid-market, performance, programmatic and direct-response advertisers. Average annual advertiser spend is increasing on our platform and we are bringing in new advertisers. This includes strong interest in increasing ad effectiveness with anonymized first-party data and audience guarantees. Our sponsorships business – an ad product within the consumer user experience, such as a home screen takeover – is also growing faster than the overall business.
We recently announced our agreement to acquire dataxu – a demand-side platform (DSP) that enables marketers to plan and buy video ad campaigns. This acquisition is expected to reinforce our leadership in several ways. dataxu’s advanced DSP, device graph, and data science will enhance our existing advanced advertising platform whose advantages include first-party consumer relationship, technology, data, publisher relationships and scale. We are committed to being an open platform and continuing our work with leading DSPs and ad tech providers across the ecosystem. At the same time, the acquisition of dataxu will help accelerate our advertising product roadmap and our strategy of providing marketers with an integrated, data-driven solution to plan, buy, and optimize their ad spend across TV and OTT. Automated media buying solutions like Roku’s new DSP are expected to unlock more advertising investment into OTT. In addition to a step forward in our ad stack roadmap, dataxu will accelerate our ability to place advanced tools in the hands of buyers. We will gain an experienced team that complements our industry leading OTT ad tech talent. This includes expertise in DSP software engineering, data science and analytics. We will work with new and existing advertisers as the TV advertising community moves to streaming.
Experts in Free TV
We were early to recognize the appeal that streaming free content has for consumers. AVOD is growing in quality and usage. It delivers value to consumers, especially to “cord-cutters.” Consumers are willing to watch ads in exchange for free TV content. In a survey we conducted, 73% of respondents said they watch AVOD, while 45% watch AVOD the most out of all streaming video options.
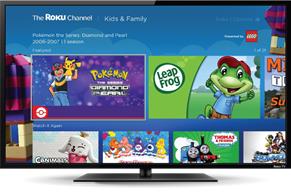
In August, we launched Kids & Family within The Roku Channel making it easy for families to find a wide selection of free and Premium Subscription content in one, easy-to-access destination. The Roku Channel’s Parental Control features give parents control
3
Roku Q3 2019 Shareholder Letter
over what their kids can playback within the channel. At launch we partnered with LEGO SYSTEMS as a sponsor on The Roku Channel Kids & Family home screen allowing the iconic kids brand to gain visibility while offering our viewers free access to a collection of movies. We believe these sponsorships are successful in driving engagement with our viewers.
Lego Systems sponsorship of Kids & Family home screen
OUTLOOK
We are increasing our revenue and gross profit outlook for 2019 reflecting our strong Q3 performance and the inclusion of dataxu for part of Q4. Our raised revenue outlook midpoint of $1.106 billion represents roughly 49% year-over-year growth, up from 46% year-over-year in our prior outlook. We expect Platform revenue to represent roughly two-thirds of total revenue including approximately $13 million in revenue from dataxu. We are raising our total gross profit outlook for 2019 to roughly $492 million at the midpoint, up from roughly $485 million previously. We have updated our 2019 adjusted EBITDA outlook midpoint to $30 million from $35 million previously reflecting continued investment in the business as well as an approximately $5 million headwind to adjusted EBITDA in Q4 related to dataxu operations and dataxu acquisition related expenses.
CONCLUSION
Consumers are reaping the benefits as the biggest and best names in TV programming embrace the transition to streaming. Investment in content is soaring and free options are proliferating. Just as advertisers are hungry to reach consumers who no longer watch linear TV, they want to measure campaigns and have access to tools that automate them. Roku is well positioned as a neutral party that helps the whole ecosystem build value in OTT. We make it easy for our large and highly engaged TV audience to find the content they love. We are taking the strengths that have made us the leading TV streaming platform in the U.S. and laying the groundwork for enlarging our international footprint.
Happy Streaming!
Sincerely,
Anthony Wood, Founder and CEO; and Steve Louden, CFO
4
Roku Q3 2019 Shareholder Letter
| Exhibit 99.1 |
Conference Call Webcast – 2 p.m. PST November 6, 2019
The Company will host a webcast of its conference call to discuss the Q3 2019 results at 2 p.m. Pacific Time / 5 p.m. Eastern Time on November 6, 2019. Participants may access the live webcast in listen-only mode on the Roku investor relations website at ir.roku.com. An archived webcast of the conference call will also be available at ir.roku.com following the call.
About Roku, Inc.
Roku pioneered streaming to the TV. We connect users to the streaming content they love, enable content publishers to build and monetize large audiences, and provide advertisers with unique capabilities to engage consumers. Roku streaming players and Roku TVTM models are available around the world through direct retail sales and licensing arrangements with TV OEMs and service operators. Roku audio products are available through direct retails sales in the U.S.A. Roku is headquartered in Los Gatos, Calif. U.S.A.
Roku, the Roku logo and other trade names, trademarks or service marks of Roku appearing in this shareholder letter are the property of Roku. Trade names, trademarks and service marks of other companies appearing in this shareholder letter are the property of their respective holders.
Investor Relations ir@roku.com | Media Tricia Mifsud tmifsud@roku.com Diane Carlini dcarlini@roku.com |
Use of Non-GAAP Measures
In addition to financial information prepared in accordance with generally accepted accounting principles in the United States (GAAP), this shareholder letter includes certain non-GAAP financial measures. These non-GAAP measures include Adjusted EBITDA. In order for our investors to be better able to compare its current results with those of previous periods, we have included a reconciliation of GAAP to non-GAAP financial measures in the tables at the end of this letter. The Adjusted EBITDA reconciliation adjusts the related GAAP financial measures to exclude other income (expense), net, stock-based compensation expense, depreciation and amortization, and income tax (benefit)/expense where applicable. We believe these non-GAAP financial measures are useful as a supplement in evaluating our ongoing operational performance and enhancing an overall understanding of our past financial performance. However, these non-GAAP financial measures have limitations, and should not be considered in isolation or as a substitute for our GAAP financial information.
Forward-Looking Statements
This shareholder letter contains “forward-looking” statements that are based on our beliefs and assumptions and on information currently available to us. Forward-looking statements include all statements that are not historical facts and can be identified by terms such as “anticipate,” “believe,” “continue,” “could,” “design,” “estimate,” “expect,” “may,” “seek,” “should,” “will,” “would” or similar expressions and the negatives of those terms. Forward-looking statements involve known and unknown risks, uncertainties and other factors that may cause our actual results, performance or achievements to be materially different from any future results, performance or achievements expressed or implied by the forward-looking
| |
Roku Q3 2019 Shareholder Letter | 5 |
statements. Forward-looking statements represent our beliefs and assumptions only as of the date of this letter. These statements include the benefits of the acquisition of dataxu, including the acceleration of our ad platform, gaining an experienced ad tech workforce, and the benefits and features of future product or service offerings of the combined entity, such as unlocking more advertising investment into OTT, the benefits, impact, features and availability of streaming services launching on our platform, the benefits, impact, features and availability of our new line of streaming players, our new audio devices and the new Roku TV models, our international expansion, the capabilities expected to help us build scale and contribute to our international expansion, the timing, benefits and features of the Roku TV models launching in the UK, the shift of advertising spend from linear TV to OTT, diversification of our ad clientele, increases in advertiser spend per campaign, our strategic plan, the strength of the Roku brand, OS and platform, the growth and monetization of The Roku Channel, the importance of our direct customer relationship and data, the importance of our partners and sponsorships, our financial outlook for the fourth quarter of 2019 and for the full 2019 fiscal year, our investments, and our overall business trajectory. Except as required by law, we assume no obligation to update these forward-looking statements publicly, or to update the reasons actual results could differ materially from those anticipated in the forward-looking statements, even if new information becomes available in the future. Further information on factors that could cause actual results to differ materially from the results anticipated by our forward-looking statements is included in the reports we have filed with the Securities and Exchange Commission, including our Annual Report on Form 10-K for the year ended December 31, 2018 and our Quarterly Report on Form 10-Q for the quarter ended June 30, 2019. Additional information will also be available in our Quarterly Report on Form 10-Q for the quarter ended September 30, 2019. All information provided in this shareholder letter and in the tables attached hereto is as of November 6, 2019, and we undertake no duty to update this information unless required by law.
| |
Roku Q3 2019 Shareholder Letter | 6 |
ROKU, INC.
CONDENSED CONSOLIDATED STATEMENTS OF OPERATIONS (in thousands, except per share data)
(unaudited)
| | Three Months Ended | | | Nine Months Ended | |
| | September 30, 2019 | | | September 30, 2018 | | | September 30, 2019 | | | September 30, 2018 | |
Net Revenue: | | | | | | | | | | | | | | | | |
Platform | | $ | 179,322 | | | $ | 100,050 | | | $ | 481,157 | | | $ | 265,468 | |
Player | | | 81,606 | | | | 73,331 | | | | 236,534 | | | | 201,299 | |
Total net revenue | | | 260,928 | | | | 173,381 | | | | 717,691 | | | | 466,767 | |
Cost of Revenue: | | | | | | | | | | | | | | | | |
Platform (1) | | | 67,075 | | | | 29,504 | | | | 165,419 | | | | 78,498 | |
Player (1) | | | 75,376 | | | | 64,884 | | | | 218,695 | | | | 168,412 | |
Total cost of revenue | | | 142,451 | | | | 94,388 | | | | 384,114 | | | | 246,910 | |
Gross Profit: | | | | | | | | | | | | | | | | |
Platform | | | 112,247 | | | | 70,546 | | | | 315,738 | | | | 186,970 | |
Player | | | 6,230 | | | | 8,447 | | | | 17,839 | | | | 32,887 | |
Total gross profit | | | 118,477 | | | | 78,993 | | | | 333,577 | | | | 219,857 | |
Operating Expenses: | | | | | | | | | | | | | | | | |
Research and development (1) | | | 68,487 | | | | 45,370 | | | | 186,219 | | | | 119,692 | |
Sales and marketing (1) | | | 46,666 | | | | 25,603 | | | | 117,041 | | | | 68,180 | |
General and administrative (1) | | | 29,873 | | | | 19,769 | | | | 77,992 | | | | 50,768 | |
Total operating expenses | | | 145,026 | | | | 90,742 | | | | 381,252 | | | | 238,640 | |
Loss from Operations | | | (26,549 | ) | | | (11,749 | ) | | | (47,675 | ) | | | (18,783 | ) |
Other Income, Net: | | | | | | | | | | | | | | | | |
Interest expense | | | (767 | ) | | | (112 | ) | | | (1,436 | ) | | | (220 | ) |
Other income, net | | | 2,065 | | | | 2,162 | | | | 4,272 | | | | 2,971 | |
Total other income, net | | | 1,298 | | | | 2,050 | | | | 2,836 | | | | 2,751 | |
Loss Before Income Taxes | | | (25,251 | ) | | | (9,699 | ) | | | (44,839 | ) | | | (16,032 | ) |
Income tax benefit | | | (96 | ) | | | (172 | ) | | | (619 | ) | | | (397 | ) |
Net Loss | | $ | (25,155 | ) | | $ | (9,527 | ) | | $ | (44,220 | ) | | $ | (15,635 | ) |
Net loss per share —basic and diluted | | $ | (0.22 | ) | | $ | (0.09 | ) | | $ | (0.39 | ) | | $ | (0.15 | ) |
Weighted-average shares used in computing net loss per share —basic and diluted | | | 116,681 | | | | 106,884 | | | | 114,064 | | | | 103,035 | |
| (1) | Stock-based compensation was allocated as follows: |
| | Three Months Ended | | | Nine Months Ended | |
| | September 30, 2019 | | | September 30, 2018 | | | September 30, 2019 | | | September 30, 2018 | |
Cost of platform revenue | | $ | 120 | | | $ | 29 | | | $ | 238 | | | $ | 67 | |
Cost of player revenue | | | 287 | | | | 136 | | | | 776 | | | | 247 | |
Research and development | | | 10,230 | | | | 5,561 | | | | 28,020 | | | | 10,658 | |
Sales and marketing | | | 6,415 | | | | 3,277 | | | | 16,555 | | | | 5,673 | |
General and administrative | | | 5,566 | | | | 2,496 | | | | 13,564 | | | | 4,592 | |
Total stock-based compensation | | $ | 22,618 | | | $ | 11,499 | | | $ | 59,153 | | | $ | 21,237 | |
| |
Roku Q3 2019 Shareholder Letter | 7 |
��
ROKU, INC.
CONDENSED CONSOLIDATED BALANCE SHEETS (in thousands, except share data)
(unaudited)
| | As of | |
| | September 30, 2019 | | | December 31, 2018 | |
Assets | | | | | | | | |
Current Assets: | | | | | | | | |
Cash and cash equivalents | | $ | 385,999 | | | $ | 155,564 | |
Short-term investments | | | 1,496 | | | | 42,146 | |
Restricted cash | | | 868 | | | | — | |
Accounts receivable, net of allowances | | | 196,044 | | | | 183,078 | |
Inventories | | | 73,531 | | | | 35,585 | |
Prepaid expenses and other current assets | | | 28,908 | | | | 15,374 | |
Deferred cost of revenue, current | | | 45 | | | | 1,188 | |
Total current assets | | | 686,891 | | | | 432,935 | |
Property and equipment, net | | | 61,878 | | | | 25,264 | |
Operating lease right-of-use assets | | | 142,110 | | | | — | |
Intangible assets, net | | | 1,061 | | | | 1,477 | |
Goodwill | | | 1,382 | | | | 1,382 | |
Other non-current assets | | | 3,983 | | | | 3,939 | |
Total Assets | | $ | 897,305 | | | $ | 464,997 | |
Liabilities and Stockholders’ Equity | | | | | | | | |
Current Liabilities: | | | | | | | | |
Accounts payable and accrued liabilities | | $ | 241,519 | | | $ | 148,562 | |
Deferred revenue, current | | | 35,912 | | | | 45,442 | |
Total current liabilities | | | 277,431 | | | | 194,004 | |
Deferred revenue, non-current | | | 12,932 | | | | 19,594 | |
Operating lease liability, non-current | | | 142,134 | | | | — | |
Other long-term liabilities | | | 1,031 | | | | 6,748 | |
Total Liabilities | | | 433,528 | | | | 220,346 | |
Stockholders’ Equity: | | | | | | | | |
Common stock, $0.0001 par value | | | 12 | | | | 11 | |
Additional paid-in capital | | | 761,883 | | | | 498,553 | |
Accumulated other comprehensive loss | | | (2 | ) | | | (17 | ) |
Accumulated deficit | | | (298,116 | ) | | | (253,896 | ) |
Total stockholders’ equity | | | 463,777 | | | | 244,651 | |
Total Liabilities and Stockholders’ Equity | | $ | 897,305 | | | $ | 464,997 | |
| |
Roku Q3 2019 Shareholder Letter | 8 |
ROKU, INC.
CONDENSED CONSOLIDATED STATEMENTS OF CASH FLOWS (in thousands)
(unaudited)
| | Nine Months Ended | |
| | September 30, 2019 | | | September 30, 2018 | |
Cash flows from operating activities: | | | | | | | | |
Net loss | | $ | (44,220 | ) | | $ | (15,635 | ) |
Adjustments to reconcile net loss to net cash provided by (used in) operating activities: | | | | | | | | |
Depreciation and amortization | | | 9,170 | | | | 5,824 | |
Stock-based compensation expense | | | 59,153 | | | | 21,237 | |
Provision for doubtful accounts | | | 114 | | | | 755 | |
Non-cash interest expense | | | 471 | | | | 216 | |
Loss from exit of facilities | | | — | | | | 450 | |
Loss on disposals of property and equipment | | | — | | | | 8 | |
Amortization of premiums on short-term investments | | | (280 | ) | | | (164 | ) |
Changes in operating assets and liabilities: | | | | | | | | |
Accounts receivable | | | (13,080 | ) | | | (1,369 | ) |
Inventories | | | (37,946 | ) | | | (36,171 | ) |
Prepaid expenses and other current assets | | | (15,270 | ) | | | 1,357 | |
Operating lease right-of-use assets | | | 13,603 | | | | — | |
Deferred cost of revenue | | | 1,143 | | | | 1,945 | |
Other noncurrent assets | | | (44 | ) | | | (1,098 | ) |
Accounts payable and accrued liabilities | | | 69,448 | | | | 16,943 | |
Operating lease liabilities | | | 856 | | | | — | |
Other long-term liabilities | | | (2,639 | ) | | | (541 | ) |
Deferred revenue | | | (16,192 | ) | | | (3,054 | ) |
Net cash provided by (used in) operating activities | | | 24,287 | | | | (9,297 | ) |
Cash flows from investing activities: | | | | | | | | |
Purchase of property and equipment | | | (38,054 | ) | | | (13,363 | ) |
Purchases of short-term investments | | | (12,365 | ) | | | (44,900 | ) |
Sales/maturities of short-term investments | | | 53,310 | | | | 3,000 | |
Net cash provided by (used in) investing activities | | | 2,891 | | | | (55,263 | ) |
Cash flows from financing activities: | | | | | | | | |
Proceeds from equity issued under at-the-market program, net of offering costs | | | 179,360 | | | | — | |
Proceeds from equity issued under incentive plans | | | 24,765 | | | | 25,480 | |
Holdback payment for a prior business acquisition | | | — | | | | (500 | ) |
Net cash provided by financing activities | | | 204,125 | | | | 24,980 | |
Net Increase (Decrease) in cash, cash equivalents and restricted cash | | | 231,303 | | | | (39,580 | ) |
Cash, cash equivalents and restricted cash—Beginning of period | | | 155,564 | | | | 177,250 | |
Cash, cash equivalents and restricted cash—End of period | | $ | 386,867 | | | $ | 137,670 | |
Cash, cash equivalents and restricted cash at end of period: | | | | | | | | |
Cash and cash equivalents | | | 385,999 | | | | 137,670 | |
Restricted cash | | | 868 | | | | — | |
Cash, cash equivalents and restricted cash—End of period | | $ | 386,867 | | | $ | 137,670 | |
Supplemental disclosures of cash flow information: | | | | | | | | |
Cash paid for interest | | $ | 2,215 | | | | 455 | |
Cash paid for income taxes | | $ | 683 | | | $ | 404 | |
Supplemental disclosures of non-cash investing and financing activities: | | | | | | | | |
Unpaid portion of property and equipment purchases | | $ | 8,931 | | | $ | 1,828 | |
| |
Roku Q3 2019 Shareholder Letter | 9 |
ROKU, INC.
NON-GAAP INFORMATION (in thousands, except per share data)
(unaudited)
| | Three Months Ended | | | Nine Months Ended | |
| | September 30, 2019 | | | September 30, 2018 | | | September 30, 2019 | | | September 30, 2018 | |
Reconciliation of Net Loss to Adjusted EBITDA: | | | | | | | | | | | | | | | | |
Net loss | | $ | (25,155 | ) | | $ | (9,527 | ) | | $ | (44,220 | ) | | $ | (15,635 | ) |
Other income, net | | | (1,298 | ) | | | (2,050 | ) | | | (2,836 | ) | | | (2,751 | ) |
Stock-based compensation | | | 22,618 | | | | 11,499 | | | | 59,153 | | | | 21,237 | |
Depreciation and amortization | | | 3,493 | | | | 2,218 | | | | 9,170 | | | | 5,824 | |
Income tax benefit | | | (96 | ) | | | (172 | ) | | | (619 | ) | | | (397 | ) |
Adjusted EBITDA | | $ | (438 | ) | | $ | 1,968 | | | $ | 20,648 | | | $ | 8,278 | |
| | | | | | | | | | | | | | | | |
| | | | | | | | | | | | | | | | |
| |
Roku Q3 2019 Shareholder Letter | 10 |