| |

| Exhibit 99.1 |
November 5, 2020
Fellow Shareholders,
In Q3, Roku delivered outstanding financial and operational results led by robust demand for TV streaming products, strong growth in advertising and the expansion of content distribution partnerships. As the ongoing COVID-19 pandemic continued to accelerate the shift of viewing away from traditional linear and pay TV, we continued to invest in competitive differentiation and execute well against our strategic plan. During the quarter, we achieved a 43% year-over-year active account growth rate and doubled the active account reach of The Roku Channel. Despite continued uncertainties caused by the pandemic, we are pleased with the trajectory of our business and believe that Roku remains well positioned to help shape the future of television – including TV advertising – around the world.
Q3 2020 Highlights
| • | Total net revenue grew 73% year-over-year (YoY) to $452 million; |
| • | Platform revenue increased 78% YoY to $319 million; |
| • | Gross profit was up 81% YoY to $215 million; |
| • | Roku added 2.9 million incremental active accounts in Q3 2020 to reach 46 million; |
| • | Streaming hours* increased by 0.2 billion hours over last quarter to 14.8 billion; |
| • | Average Revenue Per User (ARPU) grew to $27.00 (trailing 12-month basis), up 20% YoY; |
| • | The Roku Channel reached U.S. households with an estimated 54 million people. |
Key Operating Metrics | | Q3 19 | | | Q4 19 | | | Q1 20 | | | Q2 20 | | | Q3 20 | | | YoY % | |
Active Accounts (millions) | | | 32.3 | | | | 36.9 | | | | 39.8 | | | | 43.0 | | | | 46.0 | | | | 43 | % |
Streaming Hours (billions)* | | | 9.6 | | | | 10.9 | | | | 12.3 | | | | 14.6 | | | | 14.8 | | | | 54 | % |
ARPU ($) | | $ | 22.58 | | | $ | 23.14 | | | $ | 24.35 | | | $ | 24.92 | | | $ | 27.00 | | | | 20 | % |
| | | | | | | | | | | | | | | | | | | | | | | | |
Summary Financials ($ in millions) | | Q3 19 | | | Q4 19 | | | Q1 20 | | | Q2 20 | | | Q3 20 | | | YoY % | |
Platform revenue | | $ | 179.3 | | | $ | 259.6 | | | $ | 232.6 | | | $ | 244.8 | | | $ | 319.2 | | | | 78 | % |
Player revenue | | | 81.6 | | | | 151.6 | | | | 88.2 | | | | 111.3 | | | | 132.4 | | | | 62 | % |
Total net revenue | | | 260.9 | | | | 411.2 | | | | 320.8 | | | | 356.1 | | | | 451.7 | | | | 73 | % |
Platform gross profit | | | 112.2 | | | | 162.4 | | | | 130.6 | | | | 138.5 | | | | 194.7 | | | | 73 | % |
Player gross profit | | | 6.2 | | | | (0.7 | ) | | | 10.5 | | | | 8.4 | | | | 20.2 | | | | 224 | % |
Total gross profit | | | 118.5 | | | | 161.6 | | | | 141.1 | | | | 146.8 | | | | 214.8 | | | | 81 | % |
Platform gross margin % | | | 62.6 | % | | | 62.5 | % | | | 56.2 | % | | | 56.6 | % | | | 61.0 | % | | | -161 | bps |
Player gross margin % | | | 7.6 | % | | | -0.5 | % | | | 11.9 | % | | | 7.5 | % | | | 15.2 | % | | | 759 | bps |
Total gross margin % | | | 45.4 | % | | | 39.3 | % | | | 44.0 | % | | | 41.2 | % | | | 47.6 | % | | | 216 | bps |
Research and development | | | 68.5 | | | | 78.8 | | | | 88.3 | | | | 84.4 | | | | 88.4 | | | | 29 | % |
Sales and marketing | | | 46.7 | | | | 61.8 | | | | 68.2 | | | | 64.2 | | | | 71.0 | | | | 52 | % |
General and administration | | | 29.9 | | | | 38.4 | | | | 39.7 | | | | 40.5 | | | | 43.5 | | | | 46 | % |
Total operating expenses | | | 145.0 | | | | 179.0 | | | | 196.3 | | | | 189.0 | | | | 202.9 | | | | 40 | % |
Income (loss) from operations | | | (26.5 | ) | | | (17.4 | ) | | | (55.2 | ) | | | (42.2 | ) | | | 12.0 | | | nm | |
Adjusted EBITDA 1 | | | (0.4 | ) | | | 15.1 | | | | (16.3 | ) | | | (3.4 | ) | | | 56.2 | | | nm | |
Adjusted EBITDA margin % | | | -0.2 | % | | | 3.7 | % | | | -5.1 | % | | | -1.0 | % | | | 12.4 | % | | | 1260 | bps |
| | | | | | | | | | | | | | | | | | | | | | | | |
1 Refer to the reconciliation of net loss to adjusted EBITDA in the non-GAAP information in the tables accompanying this letter. | |
___________________________
* Reported streaming hours data reflects adjustments to our streaming hours calculations for current and prior periods. In August 2020, we reported adjustments to our previously reported streaming hours data for periods from Q1 2017 thru Q1 2020, which had inadvertently included some pause time in the streaming hours data due to logging errors in a central database. During August 2020, we deployed a software update to address the root cause of the pause time logging errors.
| |
Roku Q3 2020 Shareholder Letter | 1 |

Growing Active Accounts
Year-over-year active account growth continued to accelerate in Q3. Active accounts rose 43% and reached 46 million thanks to strong sales of players and Roku TVTM models in both the U.S. and international markets.
Player unit sales grew 57% year-over-year, resulting in our strongest year-over-year player revenue growth in over seven years. Player unit sales more than doubled year-over-year in both Canada and the UK. Strong demand led to tight inventory levels for certain products which enabled us to run fewer promotions than normal which in turn lifted player gross margins. Schools largely stayed closed to in-person education which resulted in a weaker than expected Back-to-School selling season.
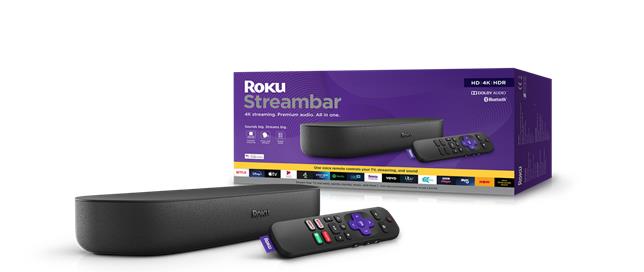
In Q3, we introduced several innovative streaming devices. We recently announced the new Roku Ultra, our top-of-the-line, 4K HDR streaming player that supports Dolby Vision and Dolby Atmos. We also introduced a new category of streaming devices, the Roku® Streambar™ in the U.S., UK, Canada, and Mexico. Combining 4K HDR streaming and soundbar capabilities into a compact form factor, the Roku Streambar is an exceptionally easy and affordable two-in-one upgrade of streaming and sound for any TV with HDMI. The Roku Streaming Stick®+ also recently received CNET’s prestigious Editor’s Choice award for “best streamer overall” which marked the 9th year in a row a Roku product earned a CNET Editor’s Choice award.
In October, we expanded our presence in Brazil with the launch of the Roku Express player. We believe that offering Roku players and Roku TV models strengthens our position and will enable us to build scale in Brazil more quickly.
Our OEM partners had very strong sales of Roku TV models in Q3. This included some of our newer OEM partners who achieved substantial year-over-year unit share gains in the U.S. The Roku OS is the No. 1 smart TV OS in the U.S and in Canada, and powered more than one in three smart TVs sold in the U.S. during the first nine months of 2020 according to NPD.
On the software side, we recently began to roll out Roku OS 9.4. Among other updates, this release will bring our live TV channel guide for Streaming Channels to Roku TV models, provide surround level control for multi-channel audio on audio products and will enable Apple Airplay2 and Homekit support later this year. The addition of support for Airplay2 wireless content streaming along with the Apple TV+ channel is expected to make the Roku platform more beneficial to consumers who also use Apple iPhone, iPad, or Mac computers.
|
|
The compact Roku® Streambar™ adds powerful 4K HDR streaming and premium audio to any TV |
| |
Roku Q3 2020 Shareholder Letter | 2 |
Platform Monetization
Q3 was the strongest quarter in the Platform segment’s history driven by strong growth in advertising as brands embraced connected TV platforms like Roku, we expanded the reach of The Roku Channel, and saw a significant increase in content distribution activities.
Ad Business Strength
In Q3, we saw clear evidence that marketers accelerated their shift out of traditional TV and into TV streaming, precipitated by a 17% year-over-year drop in linear TV viewing among adults 18-49. When released from their annual TV upfront commitments, marketers took the opportunity to reallocate advertising spend more aggressively toward TV streaming.
This advertising spend reallocation benefitted Roku. Q3 monetized video ad impressions grew almost 90% year-over-year, versus roughly 50% year-over-year in Q2. First-time advertiser clients more than doubled year-over-year, driven by performance marketers using our OneView ad platform, as well as TV advertisers focused on new products like incremental reach guarantees. For instance, DraftKings aimed to reach sports fans who had shifted TV viewing to streaming. DraftKings tripled its ad spend year-over-year with Roku, trusting OneView to engage consumers not only on the Roku platform, but also across desktop, mobile and other TV streaming platforms. Product innovation in solutions like the Shopper Data Program with Kroger also continued to drive growth. For instance, Campbell Snacks’ Snyder’s of Hanover found that Roku users who saw their advertising spent five times more on the brand’s products than the average Kroger shopper, leading to a 250% return on advertising spend.
We have also seen that when TV advertisers shift spending to Roku, they tend to become return customers. Ninety-seven percent of TV advertisers that spent $1 million or more with Roku in Q3 2019 continued to invest in Q3 2020. We have also closed 2021 upfront deals with all six major agency holding companies at significantly increased levels of commitments.
The Roku Channel Growth
During the quarter, The Roku Channel reached U.S. households with an estimated 54 million people and grew streaming hours faster than any other top 10 channel on the Roku platform on a year-over-year growth basis. The Roku Channel grew more than twice as fast as the Roku platform overall, on both a streaming hours and active account reach basis. Our new live TV channel guide, which now includes over 115 channels supported this rapid growth and demonstrates our ability to roll out popular content-discovery features. As we continue to offer users more content and features in The Roku Channel, we believe our viewers will stream more content from within it and it will become an even more important source of economics to our content partners. For example, A&E recently highlighted its success reaching an extensive audience across The Roku Channel saying that Roku helped create “tremendous value for A+E’s content through their incredible ad monetization.”
Expanding Content Distribution Partnerships
The pandemic continued to accelerate the shift to streaming and Roku’s content distribution business benefited as a result. Not only did major content producers continue to re-organize around streaming, but also our rapid rate of active accounts growth was accompanied by strong consumer demand for ad-supported viewing, subscription services and premium movie rentals. These factors led to significant increases in the content distribution business and in our estimates of lifetime deal values with an outsized portion of that deal value increase being recognized in Q3.
An important investment area for Roku is building valuable endemic content marketing and payment capabilities that help content publishers build and monetize large streaming audiences. Services that adopt a growth-marketing mindset and lean into these capabilities are winning. For example, Roku Pay enables our partners to generate subscriptions and transactions more effectively on the Roku platform. In fact, the number of transactions and partner payouts on Roku Pay increased over 130% in Q3 2020 year-over-year. During the quarter, we also reached a mutually beneficial agreement with NBCUniversal to distribute Peacock that includes collaboration around marketing, advertising, and content for The Roku Channel. Building on that partnership, we launched NBC News in The Roku Channel in time for the final presidential debate, expanding the overall reach and monetization for NBC News alongside its standalone NBC News app on the Roku platform. Increasing scale, building effective capabilities that drive partner growth, and reaching mutually beneficial distribution agreements with partners allow Roku to fund continued innovation and provide consumers with a great experience.
| |
Roku Q3 2020 Shareholder Letter | 3 |
|
|

|
NBC News now streams live content, like the Final Presidential Debate and Election coverage, in the Roku Channel |
Looking Forward
Coming out of Q3, we are pleased with the resilience of our business and cautiously optimistic about the holiday season. However, we are also aware of the potential for COVID-19 or economic-related disruptions, as well as the potential impact to historical consumer spending levels or shopping patterns as we enter the holiday season.
The short-term macro environment remains both variable and uncertain. Therefore, rather than providing a formal outlook we are providing perspective on how we believe the quarter could develop. We anticipate that the overall Q4 year-over-year revenue growth will likely be in the mid-40% range, similar to the growth rate in the last few holiday seasons, and we expect platform revenue to account for roughly two-thirds of total revenue. In line with our typical promotional approach to the holiday season, we plan to keep Q4 player gross margins close to breakeven, while we expect Q4 platform gross margins to be in the mid-50% to 60% range which is between the Q2 and Q3 levels.
Given the size of the streaming opportunity we remain committed to our strategic investment areas. We anticipate the sequential expense growth rate from Q3 to Q4 to be in line with last year driven primarily by headcount and sales and marketing expense growth.
Conclusion
Roku pioneered streaming to the TV and continues to innovate and lead the industry as consumers, content publishers and advertisers seize the benefits of TV streaming. Our purpose-built TV OS, deep industry expertise and strong TV OEM partnerships have made Roku’s smart TV OS No. 1 in the U.S. and Canada. We are becoming a pre-eminent programmer of AVOD, live, and SVOD content via The Roku Channel. We created a superior set of advertising solutions that enable brands to reach consumers who no longer watch traditional linear TV. We are bringing these advantages to key international markets in pursuit of global scale. And, as the content publisher landscape continues to adapt and re-organize around direct-to-consumer models, Roku is a principal partner helping them succeed. Forging mutually beneficial partnerships allows us to reinvest in innovation, scale and capabilities that help the whole ecosystem move forward into the Streaming Decade at an even faster pace.
Thank you for your support and Happy Streaming!
Sincerely,
Anthony Wood, Founder & CEO; Steve Louden, CFO
| |
Roku Q3 2020 Shareholder Letter | 4 |
Conference Call Webcast – 2 p.m. Pacific Time November 5, 2020
The Company will host a webcast of its conference call to discuss Q3 2020 results at 2 p.m. Pacific Time / 5 p.m. Eastern Time on November 5, 2020. Participants may access the live webcast in listen-only mode on the Roku investor relations website at ir.roku.com. An archived webcast of the conference call will also be available at ir.roku.com following the call.
About Roku, Inc.
Roku pioneered streaming to the TV. We connect users to the streaming content they love, enable content publishers to build and monetize large audiences, and provide advertisers with unique capabilities to engage consumers. Roku streaming players and TV-related audio devices are available in the U.S. and in select countries through direct retail sales and licensing arrangements with service operators. Roku TV models are available in the U.S. and in select countries through licensing arrangements with TV brands. Roku is headquartered in San Jose, Calif. U.S.
Roku, the Roku logo, Roku TV, Streambar, Streaming Stick and other trade names, trademarks or service marks of Roku appearing in this shareholder letter are the property of Roku. Trade names, trademarks and service marks of other companies appearing in this shareholder letter are the property of their respective holders.
| |
IR - Conrad Grodd cgrodd@roku.com | Media - Tricia Mifsud tmifsud@roku.com |
Use of Non-GAAP Measures
In addition to financial information prepared in accordance with generally accepted accounting principles in the United States (GAAP), this shareholder letter includes certain non-GAAP financial measures. These non-GAAP measures include Adjusted EBITDA. In order for our investors to be better able to compare its current results with those of previous periods, we have included a reconciliation of GAAP to non-GAAP financial measures in the tables at the end of this letter. The Adjusted EBITDA reconciliation adjusts the related GAAP financial measures to exclude other income (expense), net, stock-based compensation expense, depreciation and amortization, and income tax (benefit)/expense where applicable. We believe these non-GAAP financial measures are useful as a supplement in evaluating our ongoing operational performance and enhancing an overall understanding of our past financial performance. However, these non-GAAP financial measures have limitations, and should not be considered in isolation or as a substitute for our GAAP financial information.
Forward-Looking Statements
This shareholder letter contains “forward-looking” statements that are based on our beliefs and assumptions and on information currently available to us. Forward-looking statements include all statements that are not historical facts and can be identified by terms such as “anticipate,” “believe,” “continue,” “could,” “design,” “estimate,” “expect,” “may,” “seek,” “should,” “will,” “would” or similar expressions and the negatives of those terms. Forward-looking statements involve known and unknown risks, uncertainties and other factors that may cause our actual results, performance or achievements to be materially different from any future results, performance or achievements expressed or implied by the forward-looking statements. Forward-looking statements represent our beliefs and assumptions only as of the date of this letter. These statements include those related to our ability to help shape the future of television and TV advertising globally; the benefits, impact, features, and availability of the new Roku streaming lineup and Roku OS 9.4; our ability to innovate our products and services to drive growth; our ability to have return customers, including with TV advertisers; the commitment levels in our deals with ad agencies; the growth and adoption of TV streaming and the global trend towards streaming; our progress on building global scale in key markets, including in Brazil, and the timing thereof; the impact of the COVID-19 pandemic on the shift to TV streaming and the re-organizing of content producers around streaming; the ability of Roku Pay to enable our partners to more effectively generate subscriptions and transactions on the Roku platform; the impact of the COVID-19 pandemic on U.S. advertising expenditures and our ability to drive growth in our ad business in spite of such impacts; the impact of the COVID-19 pandemic on our results of operations, including net revenues, earnings and cash flows, and on our operating expenses and capital expenditures; our prospects for financial performance and growth following the COVID-19 pandemic; the addition of content to our platform; our strategic investments; the strength of the Roku brand, OS and platform; the importance, growth and monetization of The Roku Channel, including the impact of the live TV channel guide and its economic importance to our partners; our financial prospective for the fourth fiscal quarter of 2020 and for the full 2020 fiscal year; and our overall business trajectory. Except as required by law, we assume no obligation to update these forward-looking statements publicly, or to update the reasons actual results could differ materially from those anticipated in the forward-looking statements, even if new information becomes available in the future. Further information on factors that could cause actual results to differ materially from the results anticipated by our forward-looking statements is included in the reports we have filed with the Securities and Exchange Commission, including our Annual Report on Form 10-K and Quarterly Reports on Form 10-Q. All information provided in this shareholder letter and in the tables attached hereto is as of November 5, 2020, and we undertake no duty to update this information unless required by law.
| |
Roku Q3 2020 Shareholder Letter | 5 |
ROKU, INC.
CONDENSED CONSOLIDATED STATEMENTS OF OPERATIONS (in thousands, except per share data)
(unaudited)
| | Three Months Ended | | | Nine Months Ended | |
| | September 30, 2020 | | | September 30, 2019 | | | September 30, 2020 | | | September 30, 2019 | |
Net Revenue: | | | | | | | | | | | | | | | | |
Platform | | $ | 319,231 | | | $ | 179,322 | | | $ | 796,565 | | | $ | 481,157 | |
Player | | | 132,432 | | | | 81,606 | | | | 331,937 | | | | 236,534 | |
Total net revenue | | | 451,663 | | | | 260,928 | | | | 1,128,502 | | | | 717,691 | |
Cost of Revenue: | | | | | | | | | | | | | | | | |
Platform (1) | | | 124,568 | | | | 67,075 | | | | 332,828 | | | | 165,419 | |
Player (1) | | | 112,271 | | | | 75,376 | | | | 292,913 | | | | 218,695 | |
Total cost of revenue | | | 236,839 | | | | 142,451 | | | | 625,741 | | | | 384,114 | |
Gross Profit: | | | | | | | | | | | | | | | | |
Platform | | | 194,663 | | | | 112,247 | | | | 463,737 | | | | 315,738 | |
Player | | | 20,161 | | | | 6,230 | | | | 39,024 | | | | 17,839 | |
Total gross profit | | | 214,824 | | | | 118,477 | | | | 502,761 | | | | 333,577 | |
Operating Expenses: | | | | | | | | | | | | | | | | |
Research and development (1) | | | 88,388 | | | | 68,487 | | | | 261,053 | | | | 186,219 | |
Sales and marketing (1) | | | 70,956 | | | | 46,666 | | | | 203,368 | | | | 117,041 | |
General and administrative (1) | | | 43,510 | | | | 29,873 | | | | 123,744 | | | | 77,992 | |
Total operating expenses | | | 202,854 | | | | 145,026 | | | | 588,165 | | | | 381,252 | |
Income (Loss) from Operations | | | 11,970 | | | | (26,549 | ) | | | (85,404 | ) | | | (47,675 | ) |
Other Income, Net: | | | | | | | | | | | | | | | | |
Interest expense | | | (773 | ) | | | (767 | ) | | | (2,670 | ) | | | (1,436 | ) |
Other income, net | | | 1,202 | | | | 2,065 | | | | 3,020 | | | | 4,272 | |
Total other income (expense), net | | | 429 | | | | 1,298 | | | | 350 | | | | 2,836 | |
Income (Loss) Before Income Taxes | | | 12,399 | | | | (25,251 | ) | | | (85,054 | ) | | | (44,839 | ) |
Income tax (benefit) expense | | | (548 | ) | | | (96 | ) | | | (241 | ) | | | (619 | ) |
Net Income (Loss) | | $ | 12,947 | | | $ | (25,155 | ) | | $ | (84,813 | ) | | $ | (44,220 | ) |
Net income (loss) per share —basic | | $ | 0.10 | | | $ | (0.22 | ) | | $ | (0.69 | ) | | $ | (0.39 | ) |
Net income (loss) per share —diluted | | $ | 0.09 | | | $ | (0.22 | ) | | $ | (0.69 | ) | | $ | (0.39 | ) |
Weighted-average shares used in computing net income (loss) per share —basic | | | 125,687 | | | | 116,681 | | | | 122,837 | | | | 114,064 | |
Weighted-average shares used in computing net income (loss) per share —diluted | | | 136,669 | | | | 116,681 | | | | 122,837 | | | | 114,064 | |
| | | | | | | | | | | | | | | | |
(1) Stock-based compensation was allocated as follows: | | | | | | | | | | | | | | | | |
Cost of platform revenue | | $ | 206 | | | $ | 120 | | | $ | 649 | | | $ | 238 | |
Cost of player revenue | | | 362 | | | | 287 | | | | 1,010 | | | | 776 | |
Research and development | | | 14,873 | | | | 10,230 | | | | 41,476 | | | | 28,020 | |
Sales and marketing | | | 11,572 | | | | 6,415 | | | | 31,244 | | | | 16,555 | |
General and administrative | | | 7,894 | | | | 5,566 | | | | 20,969 | | | | 13,564 | |
Total stock-based compensation | | $ | 34,907 | | | $ | 22,618 | | | $ | 95,348 | | | $ | 59,153 | |
| |
Roku Q3 2020 Shareholder Letter | 6 |
ROKU, INC.
CONDENSED CONSOLIDATED BALANCE SHEETS (in thousands, except share data)
(unaudited)
| | As of | |
| | September 30, 2020 | | | December 31, 2019 | |
Assets | | | | | | | | |
Current Assets: | | | | | | | | |
Cash and cash equivalents | | $ | 1,047,478 | | | $ | 515,479 | |
Restricted cash | | | 746 | | | | 1,854 | |
Accounts receivable, net of allowances | | | 391,277 | | | | 332,673 | |
Inventories | | | 62,609 | | | | 49,714 | |
Prepaid expenses and other current assets | | | 30,985 | | | | 25,943 | |
Total current assets | | | 1,533,095 | | | | 925,663 | |
Property and equipment, net | | | 158,634 | | | | 103,262 | |
Operating lease right-of-use assets | | | 267,094 | | | | 283,291 | |
Intangible assets, net | | | 65,737 | | | | 76,668 | |
Goodwill | | | 73,058 | | | | 74,116 | |
Other non-current assets | | | 6,392 | | | | 7,234 | |
Total Assets | | $ | 2,104,010 | | | $ | 1,470,234 | |
Liabilities and Stockholders’ Equity | | | | | | | | |
Current Liabilities: | | | | | | | | |
Accounts payable and accrued liabilities | | $ | 412,798 | | | $ | 313,574 | |
Current portion of long-term debt | | | 4,872 | | | | 4,866 | |
Deferred revenue, current | | | 48,004 | | | | 39,861 | |
Total current liabilities | | | 465,674 | | | | 358,301 | |
Long-term debt, non-current | | | 91,087 | | | | 94,742 | |
Deferred revenue, non-current | | | 18,134 | | | | 15,370 | |
Operating lease liability, non-current | | | 311,072 | | | | 301,694 | |
Other long-term liabilities | | | 1,668 | | | | 1,701 | |
Total Liabilities | | | 887,635 | | | | 771,808 | |
Stockholders’ Equity: | | | | | | | | |
Common stock, $0.0001 par value | | | 13 | | | | 12 | |
Additional paid-in capital | | | 1,616,045 | | | | 1,012,218 | |
Accumulated other comprehensive income | | | 29 | | | | 29 | |
Accumulated deficit | | | (399,712 | ) | | | (313,833 | ) |
Total stockholders’ equity | | | 1,216,375 | | | | 698,426 | |
Total Liabilities and Stockholders’ Equity | | $ | 2,104,010 | | | $ | 1,470,234 | |
| |
Roku Q3 2020 Shareholder Letter | 7 |
ROKU, INC.
CONDENSED CONSOLIDATED STATEMENTS OF CASH FLOWS (in thousands)
(unaudited)
| | Nine Months Ended | |
| | September 30, 2020 | | | September 30, 2019 | |
Cash flows from operating activities: | | | | | | | | |
Net loss | | $ | (84,813 | ) | | $ | (44,220 | ) |
Adjustments to reconcile net loss to net cash provided by (used in) operating activities: | | | | | | | | |
Depreciation and amortization | | | 26,567 | | | | 9,170 | |
Stock-based compensation expense | | | 95,348 | | | | 59,153 | |
Amortization of operating lease right-of-use assets | | | 22,422 | | | | 13,603 | |
Amortization of content license assets | | | 17,131 | | | | 1,344 | |
Provision for doubtful accounts | | | 3,097 | | | | 114 | |
Other items, net | | | 345 | | | | 191 | |
Changes in operating assets and liabilities: | | | | | | | | |
Accounts receivable | | | (62,767 | ) | | | (13,080 | ) |
Inventories | | | (12,895 | ) | | | (37,946 | ) |
Prepaid expenses and other current assets | | | (3,595 | ) | | | (15,216 | ) |
Deferred cost of revenue | | | — | | | | 1,143 | |
Other noncurrent assets | | | 842 | | | | (44 | ) |
Accounts payable and accrued liabilities | | | 71,275 | | | | 68,050 | |
Operating lease liabilities | | | 18,116 | | | | 856 | |
Other long-term liabilities | | | (833 | ) | | | (2,639 | ) |
Deferred revenue | | | 10,907 | | | | (16,192 | ) |
Net cash provided by operating activities | | | 101,147 | | | | 24,287 | |
Cash flows from investing activities: | | | | | | | | |
Purchase of property and equipment | | | (76,012 | ) | | | (38,054 | ) |
Purchases of short-term investments | | | — | | | | (12,365 | ) |
Sales/maturities of short-term investments | | | — | | | | 53,310 | |
Proceeds from escrows associated with acquisition | | | 1,058 | | | | — | |
Net cash provided by (used in) investing activities | | | (74,954 | ) | | | 2,891 | |
Cash flows from financing activities: | | | | | | | | |
Proceeds from borrowing, net of issuance costs | | | 69,325 | | | | — | |
Repayments made on borrowings | | | (73,075 | ) | | | — | |
Proceeds from equity issued under at-the-market program, net of issuance costs | | | 497,242 | | | | 179,360 | |
Proceeds from equity issued under incentive plans | | | 11,206 | | | | 24,765 | |
Net cash provided by financing activities | | | 504,698 | | | | 204,125 | |
Net increase in cash, cash equivalents and restricted cash | | | 530,891 | | | | 231,303 | |
Cash, cash equivalents and restricted cash—Beginning of period | | | 517,333 | | | | 155,564 | |
Cash, cash equivalents and restricted cash—End of period | | $ | 1,048,224 | | | $ | 386,867 | |
Cash, cash equivalents and restricted cash at end of period: | | | | | | | | |
Cash and cash equivalents | | | 1,047,478 | | | | 385,999 | |
Restricted cash | | | 746 | | | | 868 | |
Cash, cash equivalents and restricted cash—End of period | | $ | 1,048,224 | | | $ | 386,867 | |
Supplemental disclosures of cash flow information: | | | | | | | | |
Cash paid for interest | | $ | 2,798 | | | $ | 2,215 | |
Cash paid for income taxes | | $ | 624 | | | $ | 683 | |
Supplemental disclosures of non-cash investing and financing activities: | | | | | | | | |
Unpaid portion of property and equipment purchases | | $ | 4,966 | | | $ | 8,931 | |
Unpaid portion of at-the-market offering costs | | $ | 11 | | | $ | — | |
| |
Roku Q3 2020 Shareholder Letter | 8 |
ROKU, INC.
NON-GAAP INFORMATION (in thousands, except per share data)
(unaudited)
| | Three Months Ended | | | Nine Months Ended | |
| | September 30, 2020 | | | September 30, 2019 | | | September 30, 2020 | | | September 30, 2019 | |
Reconciliation of Net Loss to Adjusted EBITDA: | | | | | | | | | | | | | | | | |
Net income (loss) | | $ | 12,947 | | | $ | (25,155 | ) | | $ | (84,813 | ) | | $ | (44,220 | ) |
Other income (expense), net | | | (429 | ) | | | (1,298 | ) | | | (350 | ) | | | (2,836 | ) |
Stock-based compensation | | | 34,907 | | | | 22,618 | | | | 95,348 | | | | 59,153 | |
Depreciation and amortization | | | 9,319 | | | | 3,493 | | | | 26,567 | | | | 9,170 | |
Income tax (benefit) expense | | | (548 | ) | | | (96 | ) | | | (241 | ) | | | (619 | ) |
Adjusted EBITDA | | $ | 56,196 | | | $ | (438 | ) | | $ | 36,511 | | | $ | 20,648 | |
| | | | | | | | | | | | | | | | |
| | | | | | | | | | | | | | | | |
Quarterly streaming hours published vs. revised streaming hours (billions) 0b 2b 4b 6b 8b 10b 12b 14b 2017 q1 2017 q2 2017 q3 2017 q4 2018 q1 2018 q2 2018 q3 2018 q4 2019 q1 2019 q2 2019 q3 2019 q4 2020 q1 published streaming hours revised streaming hours
| |
Roku Q3 2020 Shareholder Letter | 9 |