| |
| Exhibit 99.1 |
February 18, 2021
Fellow Shareholders,
Roku had both a strong Q4 and 2020. For both periods we achieved record revenue, gross profit and adjusted EBITDA, as consumers and the TV industry continued to shift to streaming. We surpassed 50 million active accounts, driven by the popularity of Roku® streaming players and Roku TV™ models. In 2020, the Roku OS was the No. 1 smart TV operating system in the U.S. with 38% unit share of smart TVs sold. Despite a pandemic-related advertising slowdown in the U.S., our advertising business proved resilient with Q4 Roku monetized video advertising impressions more than doubling year-over-year, as advertisers increasingly followed users from traditional pay TV to streaming. 2020 also saw prominent content publishers reorient toward TV streaming, further expanding the content selection for our users.
2020 Highlights
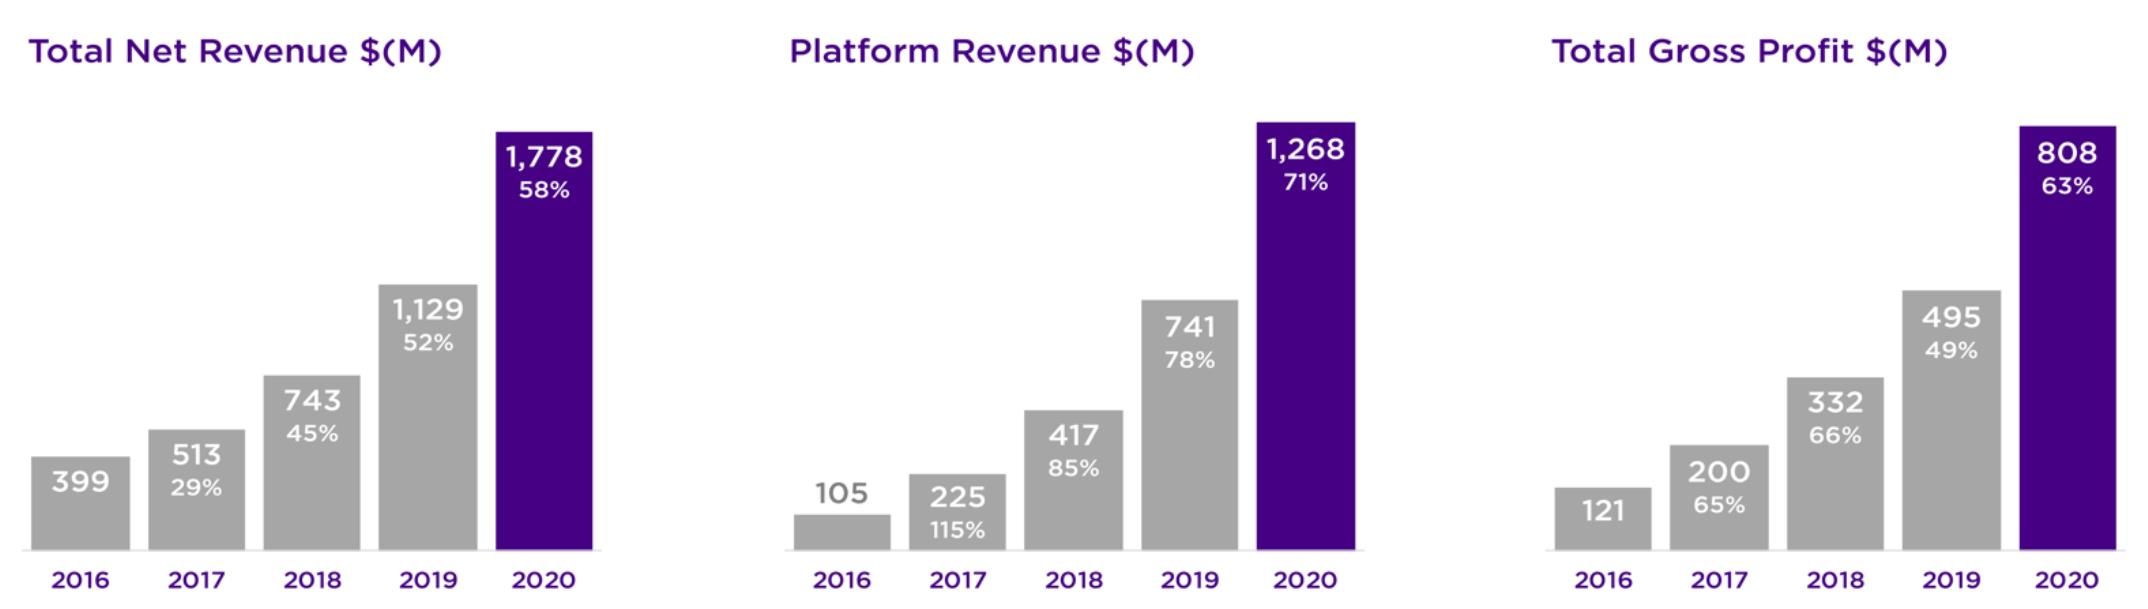
| • | Total net revenue grew 58% YoY to $1,778 million; | |
| • | Platform revenue increased 71% YoY to $1,268 million; | |
| • | Gross profit was up 63% YoY to $808 million; | |
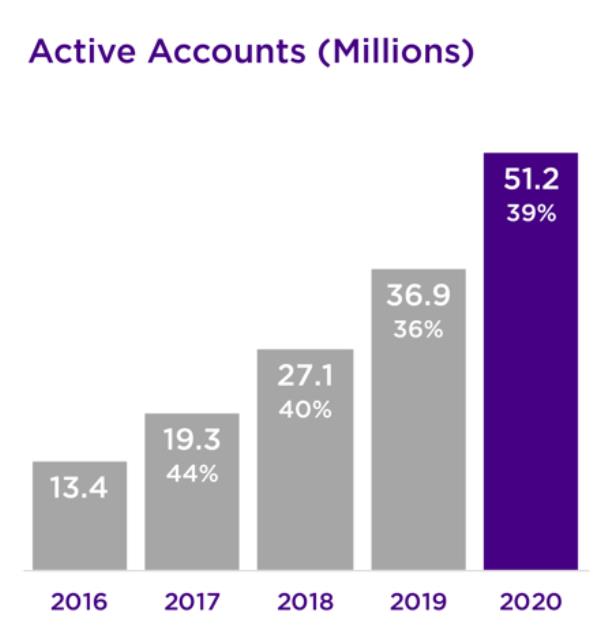
| • | Roku added 14.3 million incremental active accounts in 2020 to reach 51.2 million at year end; | |
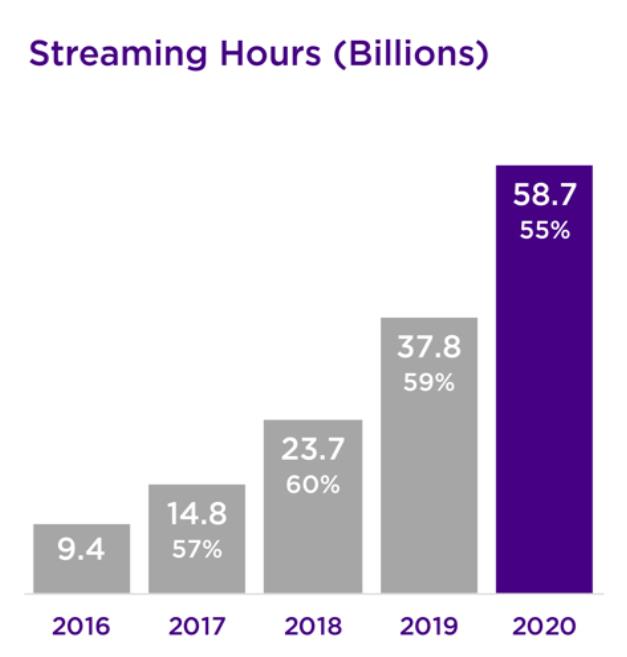
| • | Streaming hours increased by 20.9 billion hours YoY to a record 58.7 billion; | |
| • | Average Revenue Per User (ARPU) increased $5.62 YoY to $28.76 (trailing 12-month basis); | |
| • | In 2020, 38% of all smart TVs sold in the U.S. were Roku TV models | |
Key Operating Metrics | Q4 19 | | | Q1 20 | | | Q2 20 | | | Q3 20 | | | Q4 20 | | | YoY % | |
Active Accounts (millions) | | 36.9 | | | | 39.8 | | | | 43.0 | | | | 46.0 | | | | 51.2 | | | | 39 | % |
Streaming Hours (billions)* | | 10.9 | | | | 12.3 | | | | 14.6 | | | | 14.8 | | | | 17.0 | | | | 55 | % |
ARPU ($) | $ | 23.14 | | | $ | 24.35 | | | $ | 24.92 | | | $ | 27.00 | | | $ | 28.76 | | | | 24 | % |
| | | | | | | | | | | | | | | | | | | | | | | |
Summary Financials ($ in millions) | Q4 19 | | | Q1 20 | | | Q2 20 | | | Q3 20 | | | Q4 20 | | | YoY % | |
Platform revenue | $ | 259.6 | | | $ | 232.6 | | | $ | 244.8 | | | $ | 319.2 | | | $ | 471.2 | | | | 81 | % |
Player revenue | | 151.6 | | | | 88.2 | | | | 111.3 | | | | 132.4 | | | | 178.7 | | | | 18 | % |
Total net revenue | | 411.2 | | | | 320.8 | | | | 356.1 | | | | 451.7 | | | | 649.9 | | | | 58 | % |
Platform gross profit | | 162.4 | | | | 130.6 | | | | 138.5 | | | | 194.7 | | | | 300.8 | | | | 85 | % |
Player gross profit | | (0.7 | ) | | | 10.5 | | | | 8.4 | | | | 20.2 | | | | 4.6 | | | nm | |
Total gross profit | | 161.6 | | | | 141.1 | | | | 146.8 | | | | 214.8 | | | | 305.5 | | | | 89 | % |
Platform gross margin % | | 62.5 | % | | | 56.2 | % | | | 56.6 | % | | | 61.0 | % | | | 63.8 | % | | | 130 | bps |
Player gross margin % | | -0.5 | % | | | 11.9 | % | | | 7.5 | % | | | 15.2 | % | | | 2.6 | % | | | 310 | bps |
Total gross margin % | | 39.3 | % | | | 44.0 | % | | | 41.2 | % | | | 47.6 | % | | | 47.0 | % | | | 770 | bps |
Research and development | | 78.8 | | | | 88.3 | | | | 84.4 | | | | 88.4 | | | | 94.7 | | | | 20 | % |
Sales and marketing | | 61.8 | | | | 68.2 | | | | 64.2 | | | | 71.0 | | | | 96.1 | | | | 55 | % |
General and administrative | | 38.4 | | | | 39.7 | | | | 40.5 | | | | 43.5 | | | | 49.5 | | | | 29 | % |
Total operating expenses | | 179.0 | | | | 196.3 | | | | 189.0 | | | | 202.9 | | | | 240.3 | | | | 34 | % |
Income (loss) from operations | | (17.4 | ) | | | (55.2 | ) | | | (42.2 | ) | | | 12.0 | | | | 65.2 | | | nm | |
Adjusted EBITDA 1 | | 15.1 | | | | (16.3 | ) | | | (3.4 | ) | | | 56.2 | | | | 113.5 | | | | 650 | % |
Adjusted EBITDA margin % | | 3.7 | % | | | -5.1 | % | | | -1.0 | % | | | 12.4 | % | | | 17.5 | % | | | 1380 | bps |
Outlook ($ in millions) | Q1 2021E | | | | | | | | | | | | | | | | | |
Total net revenue | $478 - $493 | | | | | | | | | | | | | | | | | |
Total gross profit | $234 - $241 | | | | | | | | | | | | | | | | | |
Net Income (loss) | ($23) – ($16) | | | | | | | | | | | | | | | | | |
Adjusted EBITDA 2 | $27 - $34 | | | | | | | | | | | | | | | | | |
1 Refer to the reconciliation of net loss to adjusted EBITDA in the non-GAAP information in an appendix to this letter. | |
2 Q1 2021E reconciling items between net loss and non-GAAP adjusted EBITDA consist of stock-based compensation of approximately $40 million, depreciation and amortization and other net adjustments of approximately $10 million. | |
___________________________
* Reported streaming hours data reflects previously disclosed adjustments to our streaming hours calculations for periods prior to Q4 2020.
| |
Roku Q4 and Full Year 2020 Shareholder Letter | 1 |
Our Business Model
We believe that all TV will be streamed. Our mission as the leading TV streaming platform is to connect the TV ecosystem of viewers, content publishers, and advertisers, thus creating a virtuous cycle that benefits all participants. At the core of our strategy is providing consumers with an excellent streaming experience via an easy user interface, broad content selection, and great value. We seek to grow the scale of our user base, increase engagement by our users, and then monetize the activity on our platform, which we can then reinvest in our platform.
Building Scale
 In 2020, consumers spent more time at home due to the COVID-19 pandemic, and streaming continued to gain momentum. These factors contributed to strong active account growth, especially in Q2 and Q3. In 2020, we added over 14 million active accounts, ending the year with 51.2 million active accounts.
 To put our scale in perspective, Roku’s U.S. active account base is now more than twice the number of the U.S. video subscribers of the biggest cable company.

Roku OS
Central to our platform is the Roku operating system (OS), our purpose-built, best in class OS for TV streaming. The Roku OS, which powers Roku TV models and our streaming players, is loved by consumers for its simplicity and ease of use. It is continuously updated to enhance our users’ experience and to grow our monetization capabilities. In September 2020, we rolled out Roku OS 9.4, which brought our live TV channel guide for streaming channels to Roku TV models, provided surround level control for multi-channel audio on audio products, and enabled Apple Airplay2 and Homekit for seamless integration with Apple products. The Roku OS contributes to Roku streaming players, Roku TV models, and our TV audio products receiving prestigious awards. These include CNET Editors’ Choice award for Roku Streaming Stick®+ and What-Hifi 5 Star review for Hisense Roku TV in the UK. Roku OS is an important strategic advantage for us, and therefore will continue to be a key investment area.
| |
Roku Q4 and Full Year 2020 Shareholder Letter | 2 |
Roku TV
2020 was another strong year for the Roku TV program. Not only did the number of Roku TV manufacturers and brands continue to grow across multiple countries, but also several partners achieved substantial year-over-year unit share gains in the U.S. The Roku TV program offers outstanding value to TV OEMs. In addition to the Roku brand recognition, lower Bill of Materials (BOM) cost and reference design, the Roku OS enables OEMs to offer Roku TV models at a wide range of price points and performance options. We broadened the Roku TV ecosystem with the launch of the Roku TV Ready™ program, and a new wireless surround sound 4.1 system. Roku TV Ready certification enables third-party soundbars to easily connect to a Roku TV and be controlled by the single Roku TV remote control. We believe the Roku TV program will continue to drive scale for Roku as increasing numbers of devices powered by our OS are brought into consumers’ homes.
Streaming Players
For the full year 2020, streaming player unit sales grew 28%, resulting in Player revenue increasing 32% year over year. Player sales were especially strong in Q2 and Q3 due in part to consumers spending more time at home due to the COVID-19 pandemic. Q4 Player revenue growth rate was more aligned with the period before the COVID-19 pandemic.
Our streaming players deliver an outstanding user experience, and we offer a variety of models at various price points allowing consumers to select the device that best suits their needs. We introduced our latest innovation in the player category, the Roku Streambar™, which combines video streaming and soundbar functionalities into one low-cost and compact device. The Roku Streambar received multiple awards including CNET’s Best Soundbar-streaming combo, and Top Gadget of 2020 by Unocero in Mexico and Tech Advisor Recommended in the UK.
Driving Engagement
In 2020, we made excellent progress increasing engagement driven by investments in user experience and expanding content options for viewers. Our users streamed 17 billion hours in Q4, and over 58 billion hours in 2020 overall. Both periods grew 55% year-over-year. Roku active accounts streamed an average of 3.8 hours per day in Q4, up 10% year-over-year. Launches of compelling third-party streaming channels, as well as our continued investments in The Roku Channel, contributed to engagement growth. We believe this momentum will continue. Recent research published by Parks Associates shows that 43% of all broadband households in the U.S. that currently pay for traditional TV are likely to switch to streaming within the next 12 months. The Big Game, which aired on February 7th, was the most live-streamed American football contest ever. And Conviva reported that the Roku platform was the most popular streaming platform with a 41% share of streams, which is nearly equivalent to the next three platforms combined.
| |
Roku Q4 and Full Year 2020 Shareholder Letter | 3 |

TurboTax’s branded sponsorship experience, which shows Roku users where they can stream the Big Game live.
Content Promotion
Roku connects content publishers to users at scale, and provides a deep array of promotion tools to help drive engagement and reach. In 2020, we saw the continued strong growth of Disney+ (launched in late 2019), as well as the launch of NBCU’s Peacock and HBO Max. This was followed by the recent launch of Discovery+ in Q1 2021. These services have done well on the Roku platform owing to our large base of engaged users and our promotional capabilities, as described below. The combination of users and content drives a virtuous cycle on the Roku platform.

Peacock’s purchase of the PrimeTime ad, a unit that enabled one-click play of The Office from the Roku home screen.
| |
Roku Q4 and Full Year 2020 Shareholder Letter | 4 |
In 2020, we continued to enhance our promotional capabilities, including our use of machine learning to drive the outcomes content partners value most. Our biggest content partners now typically buy promotions from us on a cost-per-action (CPA) basis, and optimize on metrics like installs, subscriptions, views and retention. Machine-driven content marketing benefits not only our content partners, who benefit from more efficient advertising, but also our users who see more relevant ads. Bassil El-Khatib, CEO of Frndly TV noted: “For every dollar we spent on Roku versus a large social media platform in July 2020, we had a 65% better return on investment with Roku as their promotional capabilities attract the right customers in the right mindset to build long-lasting relationships.”
The Roku Channel
In 2020, users continued to increase their streaming of content through The Roku Channel. We believe that increased engagement with The Roku Channel was driven by improvements in the quality and quantity of programming options offered to users, as well as our use of our platform's promotional capabilities. Similar to Q3, in Q4 usage of The Roku Channel grew nearly twice as fast as our overall platform and reached U.S. households with an estimated 63 million people, up more than 100% year-over-year.
We continue to add great content to The Roku Channel and enhance its user experience. We added more than 50 linear channels in Q4, and in June launched our Live TV Streaming Channel Guide to help users more easily discover content across more than 175 linear streaming channels. Coverage of the Presidential Inauguration and Election Day on The Roku Channel drew record audiences, demonstrating that linear live channels resonate with The Roku Channel users.
The Roku Channel drives a virtuous cycle of viewers, advertisers, and content which in turn drives continued growth in viewing hours, reach, advertising revenue, and content options. In January, we acquired Quibi’s global content distribution rights, which we will use to add compelling original programming to our viewers on a free, ad-supported basis. We secured rights to over 75 series and hundreds of hours of programming produced by some of the greatest talent in Hollywood. We will begin launching Quibi content later this year. More broadly, the continued growing scale of The Roku Channel enables us to be more creative and expansive in sourcing cost-effective content that is well-suited to an AVOD business model.
Monetization 
Our ability to monetize the Roku platform continues to grow as we increase scale and engagement and add new capabilities. One way we measure our success in monetizing our platform is via the metric Average Revenue Per User (ARPU). In 2020, we grew ARPU by $5.62 year-over-year to $28.76 (trailing 12-month basis). ARPU growth was driven by increased per-user engagement, as well as our continued investments in our channel distribution, content promotions, billing and advertising capabilities.

| |
Roku Q4 and Full Year 2020 Shareholder Letter | 5 |
Content Distribution
Our content distribution business demonstrated remarkable growth in 2020 across all dimensions (SVOD, TVOD, buttons, content promotions), owing in part to a surge in pandemic-related device purchases and user engagement. Larger-than-expected device sales led to significant increases in button demand by our content partners, while the launch of major new streaming services and their associated launch marketing campaigns helped drive significant increases in SVOD revenue shares and content marketing revenues. Roku Pay, a key platform capability that simplifies consumer subscription signups and drives purchase and retention for partners, is growing more than twice as fast as overall SVOD users on the platform. 2020 demonstrated the power of the Roku platform to drive user engagement for the benefit of Roku, its content partners, and users.

Disney+ promoted the debut of Soul with a customized sponsorable theme across the entire Roku home screen.
Advertising
In 2020, Roku continued to deliver strong advertising growth, as evidenced by a more than doubling in Q4 of Roku monetized video advertising impressions on a year-over-year basis. Important factors contributing to this growth include the continued growing interest in streaming by traditional TV advertisers, as well as our ongoing investment in our OneView ad platform and overall ad tech capabilities. Our robust growth in Q4 and 2020 is particularly notable in light of the pandemic’s impact on marketing spending overall, especially the significant declines in traditional TV.
In 2020, traditional TV upfronts were disrupted by the loss of live event programming due to the pandemic, continued significant declines in linear viewership, and aging demographics of the traditional linear TV audience. The median viewing age for the three major broadcast networks is now over 60 years old, driven in part by the flight of younger viewers to streaming. Even as broadcast primetime household ratings dropped 21% year over year, upfront ad costs actually increased by 13%. These changes accelerated a trend already underway: marketers fundamentally reevaluating their TV investment
| |
Roku Q4 and Full Year 2020 Shareholder Letter | 6 |
strategy. In Q4, the six largest agency holding companies more than doubled their investment with Roku on a year-over-year basis, while also committing to significantly larger 2021 upfronts with Roku.
We are seeing robust growth in a number of advertiser segments. One example is retail. While retailers spent 7% less on traditional TV advertising year-over-year during Q4, retail advertising spend on the Roku platform more than doubled year-over-year in Q4. For example, to engage shoppers aged 18-34 during the holiday season, Walmart ran targeted video ads and launched an interactive Roku TV sweepstakes from the Roku home screen. Among viewers who saw a Roku ad for Walmart, 80% had not seen a Walmart ad on traditional TV, and brand favorability increased 65% for adults 18-34.
We continue to invest in capabilities to help marketers use the scale and insights of Roku’s platform to be successful. In 2020, we rebranded our DSP as the “OneView Ad Platform” and integrated it with Roku-native identity, data and attribution tools. These unique capabilities are driving significant year-over-year growth in the usage of OneView®: spending on OTT impressions through OneView more than doubled in 2020, while spending on impressions delivered on the Roku platform in OneView more than quadrupled.
Global Expansion
TV streaming is a global phenomenon and in 2020 Roku continued to successfully expand beyond our domestic market using the same business model, capabilities and products that have worked so well for us in the U.S. We are seeing strong early evidence that our strengths and differentiators translate internationally. In 2020, Roku TV was the top-selling smart TV OS in Canada, where Roku had 31% market share. We also added CBC and Crave, top local SVOD channels in Canada. In Brazil, we recently celebrated the first anniversary of our successful entry with the launch of our second TV OEM partner for that market, Philco (in addition to AOC). In Mexico, we continue to see good progress in growing scale and engagement, more than doubling the number of Roku TV brands (from 3 to 7) in 2020. In the UK, we launched The Roku Channel and welcomed BT Sport to our platform, which allows us to offer our users the full suite of channels carrying Premier League games. And in Ireland, we signed a deal with the country’s largest broadcaster, RTE.
We are pleased with the progress we’ve made in our existing markets, but there is more we want to achieve, and we intend to continue increasing our investments in international expansion. We will approach new markets with the same three-phased approach that has proven so effective in the U.S.: build scale, increase engagement, and monetize user activity.
Outlook
We are pleased with our 2020 results and the resilience of our business, and are optimistic about the year ahead. We believe we have sufficient visibility in the short-term to provide formal outlook for Q1. However, as we look farther ahead, the level of uncertainty compounds when trying to assess the net impact of a variety of factors such as the timing of the vaccine rollouts, emergence of new COVID-19 variants as well as the lasting economic impacts of the pandemic. Consequently, instead of providing a formal outlook for the full year, we will provide some directional perspective.
Historically, Q1 is our seasonally softest quarter from a revenue perspective (typically revenue has been roughly 25% lower sequentially than our seasonally strong Q4). Our Q1 outlook calls for similar seasonality with the midpoint of total net revenue of $485 million (up 51% year-over-year). We anticipate total gross profit of roughly $238 million at the midpoint. Strong gross profit growth outpacing OPEX growth is expected to result in adjusted EBITDA of $31 million at the midpoint.
We are mindful that in 2021 year-over-year comparisons will be quite volatile. In the first half of the year, we expect strong financial comparisons as compared to the first half of 2020 which includes early impacts from COVID-19 and the resulting economic lockdown. While in the second half of the year, we anticipate much tougher comparisons thanks to our exceptional performance in 2H20, and Q3 in particular, as consumer interest in streaming surged and our monetization efforts rebounded from slower Q2 growth levels. Thus, for the full year, our overall year-over-year revenue growth will fall below levels we expect to see in the first and second quarters of 2021. We expect our overall 2021 gross margin to be in the mid-40% range as platform margins remain fairly stable and we operate the Player segment at a gross margin close to zero to continue driving device sales and growing active accounts. Given the size of our opportunity and progress to date, we will continue investing in our business to enhance our competitive differentiation and seed future growth. In particular, these investments will include: R&D initiatives to bring new features, technology, and content to our platform; growing our Sales & Marketing efforts
| |
Roku Q4 and Full Year 2020 Shareholder Letter | 7 |
to drive increased scale and engagement of our user base and building out our G&A infrastructure to support a global scale business. As such, we anticipate returning to robust year over year OPEX organic growth rates similar to 2019 (vs. most of 2020 where we constrained headcount growth).
Conclusion
2020 was a pivotal year to start the streaming decade as pandemic related disruptions served as a catalyst in the fundamental shift to TV streaming and demonstrated the power of our strategy, technology, and execution. Our strategy and execution are working well, and we are seeing the results in our financial performance, our continued position as America’s No. 1 TV streaming platform by streaming hours, and our early international successes. Our purpose-built platform for TV streaming offers superior outcomes for the entire ecosystem – including users, content publishers, and advertisers. We will continue to invest in innovation and growth, and are looking forward to a successful 2021.
Thank you for your support and Happy Streaming™!
Anthony Wood, Founder and CEO; and Steve Louden, CFO
| |
Roku Q4 and Full Year 2020 Shareholder Letter | 8 |
Conference Call Webcast – 2 p.m. PT February 18, 2021
The Company will host a webcast of its conference call to discuss the Q4 and fiscal year 2020 results at 2 p.m. Pacific Time / 5 p.m. Eastern Time on February 18, 2021. Participants may access the live webcast in listen-only mode on the Roku investor relations website at ir.roku.com. An archived webcast of the conference call will also be available at ir.roku.com after the call.
About Roku, Inc.
Roku pioneered streaming to the TV. We connect users to the streaming content they love, enable content publishers to build and monetize large audiences, and provide advertisers with unique capabilities to engage consumers. Roku streaming players and TV-related audio devices are available in the U.S. and in select countries through direct retail sales and licensing arrangements with service operators. Roku TV™ models are available in the U.S. and in select countries through licensing arrangements with TV brands. Roku is headquartered in San Jose, Calif. U.S.A.
Roku, the Roku logo and other trade names, trademarks or service marks of Roku appearing in this shareholder letter are the property of Roku. Trade names, trademarks and service marks of other companies appearing in this shareholder letter are the property of their respective holders.
Investor Relations Conrad Grodd cgrodd@roku.com | Media Kim Sampson ksampson@roku.com |
Use of Non-GAAP Measures
In addition to financial information prepared in accordance with generally accepted accounting principles in the United States (GAAP), this shareholder letter includes certain non-GAAP financial measures. These non-GAAP measures include Adjusted EBITDA. In order for our investors to be better able to compare its current results with those of previous periods, we have included a reconciliation of GAAP to non-GAAP financial measures in the tables at the end of this letter. The Adjusted EBITDA reconciliation adjusts the related GAAP financial measures to exclude other income (expense), net, stock-based compensation expense, depreciation and amortization, and income tax (benefit)/expense where applicable. We believe these non-GAAP financial measures are useful as a supplement in evaluating our ongoing operational performance and enhancing an overall understanding of our past financial performance. However, these non-GAAP financial measures have limitations, and should not be considered in isolation or as a substitute for our GAAP financial information.
Forward-Looking Statements
This shareholder letter contains “forward-looking” statements that are based on our beliefs and assumptions and on information currently available to us. Forward-looking statements include all statements that are not historical facts and can be identified by terms such as “anticipate,” “believe,” “continue,” “could,” “design,” “estimate,” “expect,” “may,” “seek,” “should,” “will,” “would” or similar expressions and the negatives of those terms. Forward-looking statements involve known and unknown risks, uncertainties and other factors that may cause our actual results, performance or achievements to be materially different from any future results, performance or achievements expressed or implied by the forward-looking statements. Forward-looking statements represent our beliefs and assumptions only as of the date of this letter. These statements include the growth of TV streaming and increased competition in the OTT space; the benefits, impact, features and availability of our streaming players, our audio devices and our partners’ Roku TV models; our international expansion; the impact of the COVID-19 pandemic on the shift to TV streaming and the re-organizing of content producers around streaming; the impact of the COVID-19 pandemic on U.S. advertising expenditures and our ability to drive growth in our ad business in spite of such impacts; the impact of the COVID-19 pandemic on our results of operations, including net revenues, earnings and
| |
Roku Q4 and Full Year 2020 Shareholder Letter | 9 |
cash flows, and on our operating expenses and capital expenditures; our prospects for financial performance and growth following the COVID-19 pandemic; our strategic plan; the strength of the Roku brand, OS and platform; the growth and monetization of The Roku Channel; our users’ continued engagement with The Roku Channel; the launch of Quibi content and its performance with our users; the importance of our direct customer relationship and data; the benefits, impact, and importance of our partners and sponsorships; our plans to hire additional employees; our financial outlook for the first quarter of 2021; our investments; and our overall business trajectory. Except as required by law, we assume no obligation to update these forward-looking statements publicly, or to update the reasons actual results could differ materially from those anticipated in the forward-looking statements, even if new information becomes available in the future. Further information on factors that could cause actual results to differ materially from the results anticipated by our forward-looking statements is included in the reports we have filed with the Securities and Exchange Commission, including our Annual Report on Form 10-K for the year ended December 31, 2019 and our Quarterly Report on Form 10-Q for the quarter ended September 30, 2020. Additional information also will be available in our Annual Report on Form 10-K for the year ended December 31, 2020. All information provided in this shareholder letter and in the tables attached hereto is as of February 18, 2021, and we undertake no duty to update this information unless required by law.
| |
Roku Q4 and Full Year 2020 Shareholder Letter | 10 |
ROKU, INC.
CONDENSED CONSOLIDATED STATEMENTS OF OPERATIONS (in thousands, except per share data) (unaudited)
| | Three Months Ended | | | Year Ended | |
| | December 31, 2020 | | | December 31, 2019 | | | December 31, 2020 | | | December 31, 2019 | |
Net Revenue: | | | | | | | | | | | | | | | | |
Platform | | $ | 471,179 | | | $ | 259,619 | | | $ | 1,267,744 | | | $ | 740,776 | |
Player | | | 178,707 | | | | 151,611 | | | | 510,644 | | | | 388,145 | |
Total net revenue | | | 649,886 | | | | 411,230 | | | | 1,778,388 | | | | 1,128,921 | |
Cost of Revenue: | | | | | | | | | | | | | | | | |
Platform (1) | | | 170,349 | | | | 97,236 | | | | 503,177 | | | | 262,655 | |
Player (1) | | | 174,079 | | | | 152,347 | | | | 466,992 | | | | 371,042 | |
Total cost of revenue | | | 344,428 | | | | 249,583 | | | | 970,169 | | | | 633,697 | |
Gross Profit: | | | | | | | | | | | | | | | | |
Platform | | | 300,830 | | | | 162,383 | | | | 764,567 | | | | 478,121 | |
Player | | | 4,628 | | | | (736 | ) | | | 43,652 | | | | 17,103 | |
Total gross profit | | | 305,458 | | | | 161,647 | | | | 808,219 | | | | 495,224 | |
Operating Expenses: | | | | | | | | | | | | | | | | |
Research and development (1) | | | 94,731 | | | | 78,792 | | | | 355,784 | | | | 265,011 | |
Sales and marketing (1) | | | 96,089 | | | | 61,814 | | | | 299,457 | | | | 178,855 | |
General and administrative (1) | | | 49,487 | | | | 38,425 | | | | 173,231 | | | | 116,417 | |
Total operating expenses | | | 240,307 | | | | 179,031 | | | | 828,472 | | | | 560,283 | |
Income (Loss) from Operations | | | 65,151 | | | | (17,384 | ) | | | (20,253 | ) | | | (65,059 | ) |
Other Income (Expense), Net: | | | | | | | | | | | | | | | | |
Interest expense | | | (762 | ) | | | (930 | ) | | | (3,432 | ) | | | (2,366 | ) |
Other income (expense), net | | | 2,213 | | | | 2,234 | | | | 5,233 | | | | 6,506 | |
Total other income, net | | | 1,451 | | | | 1,304 | | | | 1,801 | | | | 4,140 | |
Income (Loss) Before Income Taxes | | | 66,602 | | | | (16,080 | ) | | | (18,452 | ) | | | (60,919 | ) |
Income tax (benefit) expense | | | (704 | ) | | | (363 | ) | | | (945 | ) | | | (982 | ) |
Net Income (Loss) Attributable to Common Stockholders | | $ | 67,306 | | | $ | (15,717 | ) | | $ | (17,507 | ) | | $ | (59,937 | ) |
Net Income (Loss) per share attributable to common stockholders—basic | | $ | 0.53 | | | $ | (0.13 | ) | | $ | (0.14 | ) | | $ | (0.52 | ) |
Net Income (Loss) per share attributable to common stockholders—diluted | | $ | 0.49 | | | $ | (0.13 | ) | | $ | (0.14 | ) | | $ | (0.52 | ) |
Weighted-average shares used in computing net income (loss) per share attributable to common stockholders—basic | | | 127,375 | | | | 118,644 | | | | 123,978 | | | | 115,218 | |
Weighted-average shares used in computing net income (loss) per share attributable to common stockholders—diluted | | | 138,763 | | | | 118,644 | | | | 123,978 | | | | 115,218 | |
| | | | | | | | | | | | | | | | |
(1) Stock-based compensation was allocated as follows: | | | | | | | | | | | | | | | | |
Cost of platform revenue | | $ | 198 | | | $ | 104 | | | $ | 847 | | | $ | 342 | |
Cost of player revenue | | | 397 | | | | 296 | | | | 1,407 | | | | 1,072 | |
Research and development | | | 16,936 | | | | 12,016 | | | | 58,412 | | | | 40,036 | |
Sales and marketing | | | 11,602 | | | | 7,624 | | | | 42,846 | | | | 24,179 | |
General and administrative | | | 9,595 | | | | 5,982 | | | | 30,564 | | | | 19,546 | |
Total stock-based compensation | | $ | 38,728 | | | $ | 26,022 | | | $ | 134,076 | | | $ | 85,175 | |
| |
Roku Q4 and Full Year 2020 Shareholder Letter | 11 |
ROKU, INC.
CONDENSED CONSOLIDATED BALANCE SHEETS (in thousands, except share data)
(unaudited)
| | As of | |
| | December 31, 2020 | | | December 31, 2019 | |
Assets | | | | | | | | |
Current Assets: | | | | | | | | |
Cash and cash equivalents | | $ | 1,092,815 | | | $ | 515,479 | |
Restricted cash | | | 434 | | | | 1,854 | |
Accounts receivable, net of allowances of $41,236 and $27,521 as of | | | 523,852 | | | | 332,673 | |
December 31, 2020 and 2019, respectively | | | | | | | | |
Inventories | | | 53,895 | | | | 49,714 | |
Prepaid expenses and other current assets | | | 26,644 | | | | 25,943 | |
Total current assets | | | 1,697,640 | | | | 925,663 | |
Property and equipment, net | | | 155,197 | | | | 103,262 | |
Operating lease right-of-use assets | | | 266,197 | | | | 283,291 | |
Intangible assets, net | | | 62,181 | | | | 76,668 | |
Goodwill | | | 73,058 | | | | 74,116 | |
Other non-current assets | | | 16,269 | | | | 7,234 | |
Total Assets | | $ | 2,270,542 | | | $ | 1,470,234 | |
Liabilities and Stockholders’ Equity | | | | | | | | |
Current Liabilities: | | | | | | | | |
Accounts payable | | $ | 112,314 | | | $ | 115,227 | |
Accrued liabilities | | | 347,668 | | | | 198,347 | |
Current portion of long-term debt | | | 4,874 | | | | 4,866 | |
Deferred revenue, current portion | | | 55,465 | | | | 39,861 | |
Total current liabilities | | | 520,321 | | | | 358,301 | |
Long-term debt, non-current portion | | | 89,868 | | | | 94,742 | |
Deferred revenue, non-current portion | | | 21,283 | | | | 15,370 | |
Operating lease liability, non-current portion | | | 307,936 | | | | 301,694 | |
Other long-term liabilities | | | 3,119 | | | | 1,701 | |
Total Liabilities | | | 942,527 | | | | 771,808 | |
Stockholders’ Equity: | | | | | | | | |
Common stock, $0.0001 par value; | | | 13 | | | | 12 | |
Additional paid-in capital | | | 1,660,379 | | | | 1,012,218 | |
Accumulated other comprehensive income | | | 29 | | | | 29 | |
Accumulated deficit | | | (332,406 | ) | | | (313,833 | ) |
Total stockholders’ equity | | | 1,328,015 | | | | 698,426 | |
Total Liabilities and Stockholders’ Equity | | $ | 2,270,542 | | | $ | 1,470,234 | |
| |
Roku Q4 and Full Year 2020 Shareholder Letter | 12 |
ROKU, INC.
CONDENSED CONSOLIDATED STATEMENTS OF CASH FLOWS (in thousands)
(unaudited)
| | Years Ended December 31, | |
| | 2020 | | | 2019 | |
Cash flows from operating activities: | | | | | | | | |
Net loss | | $ | (17,507 | ) | | $ | (59,937 | ) |
Adjustments to reconcile net loss to net cash provided by operating activities: | | | | | | | | |
Depreciation and amortization | | | 36,206 | | | | 15,669 | |
Stock-based compensation expense | | | 134,076 | | | | 85,175 | |
Amortization of right-of-use assets | | | 28,743 | | | | 22,328 | |
Amortization of content assets | | | 22,392 | | | | 2,914 | |
Provision for doubtful accounts | | | 3,801 | | | | 704 | |
Other items net | | | 524 | | | | 1,101 | |
Changes in operating assets and liabilities: | | | | | | | | |
Accounts receivable | | | (196,046 | ) | | | (110,225 | ) |
Inventories | | | (4,181 | ) | | | (14,129 | ) |
Prepaid expenses and other current assets | | | (3,450 | ) | | | (9,934 | ) |
Deferred cost of revenue | | | — | | | | 1,143 | |
Other noncurrent assets | | | (1,128 | ) | | | (3,060 | ) |
Accounts payable | | | 6,410 | | | | 9,409 | |
Accrued liabilities | | | 103,218 | | | | 74,512 | |
Operating lease liabilities | | | 12,999 | | | | 11,658 | |
Other long-term liabilities | | | 618 | | | | (3,024 | ) |
Deferred revenue | | | 21,517 | | | | (10,597 | ) |
Net cash provided by operating activities | | | 148,192 | | | | 13,707 | |
Cash flows from investing activities: | | | | | | | | |
Purchase of property and equipment | | | (82,382 | ) | | | (77,180 | ) |
Purchase of business, net of cash acquired | | | — | | | | (68,132 | ) |
Proceeds from escrows associated with acquisition | | | 1,058 | | | | — | |
Purchase of intangible assets | | | — | | | | (7,428 | ) |
Purchases of short-term investments | | | — | | | | (12,365 | ) |
Sales/maturities of short-term investments | | | — | | | | 54,810 | |
Net cash used in investing activities | | | (81,324 | ) | | | (110,295 | ) |
Cash flows from financing activities: | | | | | | | | |
Proceeds from borrowings, net of issuance costs | | | 69,325 | | | | 99,608 | |
Repayments of borrowings | | | (74,325 | ) | | | — | |
Proceeds from equity issued under incentive plans, net of repurchases | | | 16,806 | | | | 28,181 | |
Proceeds from equity issued under at-the-market offerings, net of offering costs | | | 497,242 | | | | 330,539 | |
Net cash provided by financing activities | | | 509,048 | | | | 458,328 | |
Net increase (decrease) in cash, cash equivalents and restricted cash | | | 575,916 | | | | 361,740 | |
Effect of exchange rate changes on cash, cash equivalents and restricted cash | | | — | | | | 29 | |
Cash, cash equivalents and restricted cash —Beginning of period | | | 517,333 | | | | 155,564 | |
Cash, cash equivalents and restricted cash —End of period | | $ | 1,093,249 | | | $ | 517,333 | |
Cash, cash equivalents and restricted cash at end of period: | | | | | | | | |
Cash and cash equivalents | | | 1,092,815 | | | | 515,479 | |
Restricted cash | | | 434 | | | | 1,854 | |
Cash, cash equivalents and restricted cash —End of period | | $ | 1,093,249 | | | $ | 517,333 | |
| |
Roku Q4 and Full Year 2020 Shareholder Letter | 13 |
| | Years Ended December 31, | |
| | 2020 | | | 2019 | |
Supplemental disclosures of cash flow information: | | | | | | | | |
Cash paid for interest | | $ | 3,470 | | | $ | 3,095 | |
Cash paid for income taxes | | $ | 1,014 | | | $ | 759 | |
Supplemental disclosures of noncash investing and financing activities: | | | | | | | | |
Issuance of common stock for business combinations | | $ | - | | | $ | 69,684 | |
Unpaid portion of property and equipment purchases | | $ | 1,242 | | | $ | 10,762 | |
Unpaid portion of acquisition related expenses | | $ | - | | | $ | 2,190 | |
Unpaid portion of purchased intangibles | | $ | - | | | $ | 400 | |
Unpaid portion of at-the-market offering costs | | $ | - | | | $ | 144 | |
| | | | | | | | |
NON-GAAP INFORMATION (in thousands, except per share data)
(unaudited)
| | Three Months Ended | | | Year Ended | |
| | December 31, 2020 | | | December 31, 2019 | | | December 31, 2020 | | | December 31, 2019 | |
Reconciliation of Net Income (Loss) to Adjusted EBITDA: | | | | | | | | | | | | | | | | |
Net income (loss) | | $ | 67,306 | | | $ | (15,717 | ) | | $ | (17,507 | ) | | $ | (59,937 | ) |
Other income (expense), net | | | (1,451 | ) | | | (1,304 | ) | | | (1,801 | ) | | | (4,140 | ) |
Stock-based compensation | | | 38,728 | | | | 26,022 | | | | 134,076 | | | | 85,175 | |
Depreciation and amortization | | | 9,639 | | | | 6,499 | | | | 36,206 | | | | 15,669 | |
Income tax (benefit) expense | | | (704 | ) | | | (363 | ) | | | (945 | ) | | | (982 | ) |
Adjusted EBITDA | | $ | 113,518 | | | $ | 15,137 | | | $ | 150,029 | | | $ | 35,785 | |
| | | | | | | | | | | | | | | | |
| | | | | | | | | | | | | | | | |
Quarterly streaming hours published vs. revised streaming hours (billions) 0b 2b 4b 6b 8b 10b 12b 14b 2017 q1 2017 q2 2017 q3 2017 q4 2018 q1 2018 q2 2018 q3 2018 q4 2019 q1 2019 q2 2019 q3 2019 q4 2020 q1 published streaming hours revised streaming hours
| |
Roku Q4 and Full Year 2020 Shareholder Letter | 14 |