EXHIBIT 99.1
Feldman Financial Advisors, Inc.
1001 Connecticut Avenue NW, Suite 840
; Washington, DC 20036
202-467-6862
(Fax) 202-467-6963
Sunshine Financial, Inc. Tallahassee, Florida Conversion Valuation Appraisal Report Valued as of June 16, 2008 Prepared By Feldman Financial Advisors, Inc. Washington, D.C. |
Feldman Financial Advisors, Inc.
1001 Connecticut Avenue, NW, Suite 840
; Washington, DC 20036
202-467-6862
(Fax) 202-467-6963
June 16, 2008
Board of Directors
Sunshine Financial, Inc.
1400 East Park Avenue
Tallahassee, FL 32301-2816
Members of the Board:
At your request, we have completed and hereby provide an independent appraisal (the “Appraisal”) of the estimated pro forma market value of Sunshine Financial, Inc. (the “Company”) on a fully converted basis, as of June 16, 2008, in conjunction with the offer for sale of a minority interest of the Company’s common stock (the “Stock Offering”). The Company is the mid-tier holding company of Sunshine Savings Bank (the “Bank”). The Company will offer 45% of its outstanding shares of common stock for sale in subscription and community offerings to eligible depositors, the employee stock ownership plan, directors, officers and employees of the Company and the Bank, and then to the general public. The remainder of Sunshine Financial, Inc.’s outstanding common stock upon completion of this offering will be held by Sunshine Savings MHC, its federally chartered mutual holding company parent. The Appraisal is furnished pursuant to the filing by the Company of the Application for Approval of a Minority Stock Issuance by a Holding Company Subsidiary of a Mutual Holding Company (the “Application”) with the Office of Thrift Supervision (“OTS”).
Feldman Financial Advisors, Inc. (“Feldman Financial”) is a financial consulting and economic research firm that specializes in financial valuations and analyses of business enterprises and securities in the thrift, banking, and mortgage industries. The background of Feldman Financial is presented in Exhibit I. In preparing the Appraisal, we conducted an analysis of the Company that included discussions with the Company’s management, the Company’s legal counsel, Silver, Freedman & Taff, L.L.P., and the Company’s independent auditor, Hacker, Johnson & Smith PA. In addition, where appropriate, we considered information based on other available published sources that we believe are reliable; however, we cannot guarantee the accuracy and completeness of such information.
Board of Directors
Sunshine Financial, Inc.
June 16, 2008
Page Two
We also reviewed, among other factors, the economy in the Company’s primary market area and compared the Company’s financial condition and operating performance with that of selected publicly traded thrift institutions. We reviewed conditions in the securities markets in general and in the market for thrift institution common stocks in particular.
The Appraisal is based on the Company’s representation that the information contained in the Application and additional evidence furnished to us by the Company and its independent auditor are truthful, accurate, and complete. We did not independently verify the financial statements and other information provided by the Company and its independent auditor, nor did we independently value the assets or liabilities of the Company. The Appraisal considers the Company only as a going concern and should not be considered as an indication of the liquidation value of the Company.
It is our opinion that, as of June 16, 2008, the estimated pro forma market value of the Company on a fully converted basis was within a range (the “Valuation Range”) of $15,300,000 to $20,700,000 with a midpoint of $18,000,000. The Valuation Range was based upon a 15% decrease from the midpoint to determine the minimum and a 15% increase from the midpoint to establish the maximum. Assuming an additional 15% increase above the maximum value would result in an adjusted maximum of $23,805,000. As part of the Stock Offering, the Company will offer common stock equal to 45% of the aggregate pro forma market value for sale in a subscription and community offering. Thus, assuming an offering price of $10.00 per share of common stock, the Company will offer a minimum of 688,500 shares, a midpoint of 810,000 shares, a maximum of 931,500 shares, and an adjusted maximum of 1,071,225 shares. The aggregate pro forma market value of the common stock sold in the Stock Offering will range from $6,885,000 at the minimum and $8,100,000 at the midpoint to $9,315,000 at the maximum and $10,712,250 at the adjusted maximum.
Our Appraisal is not intended, and must not be construed, to be a recommendation of any kind as to the advisability of purchasing shares of common stock in the Stock Offering. Moreover, because the Appraisal is necessarily based upon estimates and projections of a number of matters, all of which are subject to change from time to time, no assurance can be given that persons who purchase shares of stock in the Stock Offering will thereafter be able to sell such shares at prices related to the foregoing estimate of the Company’s pro forma market value. Feldman Financial is not a seller of securities within the meaning of any federal or state securities laws and any report prepared by Feldman Financial shall not be used as an offer or solicitation with respect to the purchase or sale of any securities.
Board of Directors
Sunshine Financial, Inc.
June 16, 2008
Page Three
The valuation reported herein will be updated as appropriate. These updates will consider, among other factors, any developments or changes in the Company’s operating performance, financial condition, or management policies, and current conditions in the securities markets for thrift institution common stocks. Should any such new developments or changes be material, in our opinion, to the valuation of the Company, appropriate adjustments to the estimated pro forma market value will be made. The reasons for any such adjustments will be explained in detail at that time.
| Respectfully submitted, | ||
| Feldman Financial Advisors, Inc | ||
Trent R. Feldman President | ||
Greg Izydorczyk Senior Vice President |
Feldman Financial Advisors, Inc.
TABLE OF CONTENTS
| TAB | PAGE | ||
| INTRODUCTION | 1 | ||
| I. | Chapter One – BUSINESS OF SUNSHINE SAVINGS BANK | ||
| General Overview | 4 | ||
| Financial Condition | 8 | ||
| Income and Expense Trends | 27 | ||
| Interest Rate Risk Management | 38 | ||
| Asset Quality | 42 | ||
| Market Area | 47 | ||
| Summary Outlook | 51 | ||
| II. | Chapter Two – COMPARISONS WITH PUBLICLY HELD THRIFTS | ||
| General Overview | 52 | ||
| Selection Criteria | 53 | ||
| Recent Financial Comparisons | 57 | ||
| III. | Chapter Three – MARKET VALUE ADJUSTMENTS | ||
| General Overview | 69 | ||
| Earnings Prospects | 70 | ||
| Financial Condition | 72 | ||
| Market Area | 73 | ||
| Management | 74 | ||
| Dividend Policy | 74 | ||
| Liquidity of the Issue | 75 | ||
| Subscription Interest | 75 | ||
| Stock Market Conditions | 77 | ||
| Recent Acquisition Activity | 78 | ||
| New Issue Discount | 79 | ||
| Adjustments Conclusion | 83 | ||
| Valuation Approach | 83 | ||
| Valuation Conclusion | 86 | ||
| IV. | Appendix – EXHIBITS | ||
| I | Background of Feldman Financial Advisors, Inc. | I-1 | |
| II-1 | Statement of Financial Condition | II-1 | |
| II-2 | Statement of Operations | II-2 | |
| II-3 | Loan Portfolio Composition | II-3 | |
| II-4 | Deposit Account Distribution | II-4 | |
| III | Financial and Market Data for All Public Thrifts | III-1 | |
| IV-1 | Pro Forma Assumptions for Full Conversion Valuation | IV-1 | |
| IV-2 | Pro Forma Full Conversion Valuation Range | IV-2 | |
| IV-3 | Pro Forma Full Conversion Analysis at Maximum | IV-3 | |
| IV-4 | Comparative Discount and Premium Analysis | IV-4 | |
| V-1 | Pro Forma Assumptions for MHC Stock Offering | V-1 | |
| V-2 | Pro Forma MHC Stock Offering Range | V-2 | |
i
Feldman Financial Advisors, Inc.
LIST OF TABLES
| TAB | PAGE | ||
| I. | Chapter One – BUSINESS OF SUNSHINE FINANCIAL, INC. | ||
| Table 1 | Selected Financial Condition and Performance Data | 8 | |
| Table 2 | Selected Financial and Performance Ratios | 9 | |
| Table 3 | Loan Portfolio | 13 | |
| Table 4 | Deposit Portfolio | 23 | |
| Table 5 | Certificates of Deposit by Interest Rate | 25 | |
| Table 6 | Borrowings | 26 | |
| Table 7 | Summary Income Statement Data | 27 | |
| Table 8 | Average Balances and Yields | 28 | |
| Table 9 | Rate/Volume Analysis | 29 | |
| Table 10 | Present Value Equity Analysis | 41 | |
| Table 11 | Non-performing Asset Summary | 43 | |
| Table 12 | Allowance for Loan Loss Summary | 44 | |
| Table 13 | Allocation of Allowance for Loan Losses | 45 | |
| Table 14 | Selected Demographic Data | 48 | |
| Table 15 | Largest Employers Leon County | 49 | |
| Table 16 | Deposit Market Share for Leon County | 50 | |
| II. | Chapter Two – COMPARISONS WITH PUBLICLY HELD THRIFTS | ||
| Table 17 | Comparative Group Operating Summary | 56 | |
| Table 18 | Key Financial Comparisons | 59 | |
| Table 19 | General Financial Performance Ratios | 64 | |
| Table 20 | Income and Expense Analysis | 65 | |
| Table 21 | Yield-Cost Structure and Growth Rates | 66 | |
| Table 22 | Balance Sheet Composition | 67 | |
| Table 23 | Regulatory Capital, Credit Risk, and Loan Composition | 68 | |
| III. | Chapter Three – MARKET VALUE ADJUSTMENTS | ||
| Table 24 | Comparative Stock Index Performance | 80 | |
| Table 25 | Summary of Recent Florida Acquisition Activity | 82 | |
| Table 26 | Summary of Recent First-Stage MHC Stock Offerings | 83 | |
| Table 27 | Fully Converted Market Valuation Analysis | 87 | |
| Table 28 | Comparative Fully Converted Market Valuation Analysis | 88 | |
| Table 29 | Pro Forma Comparative MHC Valuation Analysis | 89 | |
ii
Feldman Financial Advisors, Inc.
INTRODUCTION
As requested, Feldman Financial Advisors, Inc. (“Feldman Financial”) has prepared an independent appraisal (the “Appraisal”) of the estimated pro forma market value of Sunshine Financial, Inc. (“Sunshine Financial” or the “Company”) on a fully converted basis, as of June 16, 2008, in conjunction with the offer for sale of a minority interest of the Company’s common stock (the “Stock Offering”). The Company is the mid-tier holding company of Sunshine Savings Bank (the “Bank”). The Company will offer 45% of its outstanding shares of common stock for sale in subscription and community offerings to eligible depositors, the employee stock ownership plan, directors, officers and employees of the Company and the Bank, and then to the general public. The remainder of Sunshine Financial, Inc.’s outstanding common stock upon completion of this offering will be held by Sunshine Savings MHC, its federally chartered mutual holding company parent. The Appraisal is furnished pursuant to the filing by the Company of the Application for Approval of a Minority Stock Issuance by a Holding Company Subsidiary of a Mutual Holding Company (the “Application”) with the Office of Thrift Supervision (“OTS”).
In the course of preparing the Appraisal, we reviewed and discussed with the Company’s management and the Company’s independent accountants, Hacker, Johnson & Smith PA, the audited financial statements of the Company’s operations for the years ended December 31, 2006 and 2007 and the unaudited financial statements for the quarter ended March 31, 2007 and 2008. We also discussed with management other financial matters of the Bank.
Where appropriate, we considered information based upon other available public sources, which we believe to be reliable; however, we cannot guarantee the accuracy or completeness of such information. We visited the Company’s primary market area and examined the prevailing
1
Feldman Financial Advisors, Inc.
economic conditions. We also examined the competitive environment within which the Company operates and assessed the Company’s relative strengths and weaknesses.
We examined and compared the Company’s financial performance with selected segments of the thrift industry and selected publicly traded thrift institutions. We reviewed conditions in the securities markets in general and the market for thrift institution common stocks in particular. We included in our analysis an examination of the potential effects of the Stock Offering on the Company’s operating characteristics and financial performance as they relate to the estimated pro forma market value of the Company.
In preparing the Appraisal, we have relied upon and assumed the accuracy and completeness of financial and statistical information provided by the Company and its independent accountants. We did not independently verify the financial statements and other information provided by the Company and its independent accountants, nor did we independently value the assets or liabilities of the Company. The Appraisal considers the Company only as a going concern and should not be considered as an indication of the liquidation value of the Company.
Our Appraisal is not intended, and must not be construed, to be a recommendation of any kind as to the advisability of purchasing shares of common stock in the Stock Offering. Moreover, because such the Appraisal is necessarily based on estimates and projections of a number of matters, all of which are subject to change from time to time, no assurance can be given that persons who purchase shares of common stock in the Stock Offering will thereafter be able to sell such shares at prices related to the foregoing
2
Feldman Financial Advisors, Inc.
estimate of the Company’s pro forma market value. Feldman Financial is not a seller of securities within the meaning of any federal and state securities laws and any report prepared by Feldman Financial shall not be used as an offer or solicitation with respect to the purchase or sale of any securities.
The valuation reported herein will be updated as appropriate. These updates will consider, among other factors, any developments or changes in the Company’s financial performance or management policies, and current conditions in the securities market for thrift institution common stocks. Should any such developments or changes be material, in our opinion, to the Stock Offering valuation of the Company, appropriate adjustments to the estimated pro forma market value will be made. The reasons for any such adjustments will be explained in detail at that time.
3
Feldman Financial Advisors, Inc.
I. BUSINESS OF SUNSHINE SAVINGS BANK
General Overview
Sunshine Savings Bank was originally chartered as a credit union in 1952 as Sunshine State Credit Union to serve employees of the State of Florida. The Bank expanded over the years to serve city, county, state and federal government employees as well as the employees of commercial and industrial companies, associations, contract employees serving these groups, and family members. This expansion resulted in the evolution toward a community financial institution with a growing focus trending more toward real estate lending than the traditional credit union products.
On July 1, 2007, the credit union converted to a federal mutual savings bank to expand available loan products and to access capital. The charter conversion also enabled the institution to offer loans to the general public, rather than solely to individuals who qualified for membership at the credit union. As part of that charter conversion, deposits are now insured by the FDIC and the Bank is regulated by the Office of Thrift Supervision. The new bank was named Sunshine Savings Bank to reflect its historical community roots and continued commitment to the local community in providing banking services and in community contributions and activities.
The Bank’s principal business consists of attracting retail deposits from the general public and investing those funds, along with borrowed funds, in loans secured by first and second mortgages on one- to four-family residences (including residential construction loans) and consumer loans. The Bank also offers a wide variety of secured and unsecured consumer loan products, including home equity, direct automobile loans, and credit card loans as well as a
4
Feldman Financial Advisors, Inc.
variety of deposit accounts having a wide range of interest rates and terms, including savings accounts, money market deposit and term certificate accounts and demand accounts. The primary sources of funds are deposits and payments on loans. As of March 31, 2008, Sunshine Savings Bank had total consolidated assets of $167.4 million, total deposits of $148.9 million and equity of $17.5 million.
The Bank operates four full service branch offices serving the Tallahassee, Florida metropolitan area and one full service branch office located in Pembroke Pines, Florida serving Broward County, Florida. Unless indicated otherwise, references to Sunshine Savings Bank prior to July 1, 2007 shall include Sunshine State Credit Union. Executive offices are located at 1400 East Park Drive, Tallahassee, Florida 32301.
Sunshine Financial will be the mid-tier holding company for Sunshine Savings Bank when the change in structure is complete. Sunshine Financial is not currently an operating company and has not engaged in any business to date. Sunshine Financial will be chartered under federal law and will own 100% of the stock of Sunshine Savings Bank. After completion of the reorganization, Sunshine Financial will direct Sunshine Savings Bank's business activities and may, in the future, acquire or organize other operating subsidiaries, including other financial institutions or other financial services companies, although it currently has no specific plans or agreements to do so.
Upon completion of the change in structure and the stock offering, Sunshine Savings MHC will own 55.0% of the outstanding shares of Sunshine Financial. Persons who had membership rights in Sunshine Savings Bank as of the date of the change in structure will have these rights automatically exchanged for identical rights in Sunshine Savings MHC after the
5
Feldman Financial Advisors, Inc.
change in structure. All depositors of Sunshine Savings Bank will be members of Sunshine Savings MHC after the reorganization. So long as Sunshine Savings MHC exists, it is required by the OTS regulations to own a majority of the voting stock of Sunshine Financial. As a result, Sunshine Savings MHC, through its board of directors, will be able to exercise voting control over most matters put to a vote of shareholders of Sunshine Financial. Sunshine Savings MHC is not expected to engage in any business activity other than holding more than half of the shares of Sunshine Financial and investing any funds retained by it.
The Bank faces strong competition in its market and faces substantial competition in attracting deposits and in originating loans. The Bank’s market area has a high concentration of financial institutions, many of which are branches of large money center and regional banks that have resulted from the consolidation of the banking industry in Florida and other eastern states and many of these institutions have greater resources than the Bank does and offers services that the Bank does not provide.
Competition in originating real estate loans comes primarily from other savings institutions, commercial banks, credit unions, life insurance companies and mortgage bankers. Other savings institutions, commercial banks, credit unions and finance companies provide vigorous competition in consumer lending. Commercial business competition is primarily from local commercial banks. The Bank competes by consistently delivering high quality, personal service to its customers that result in a high level of customer satisfaction.
The Bank attracts its deposits through its branch office system. Competition for those deposits is principally from other savings institutions, commercial banks and credit unions located in the same community, as well as mutual funds and other alternative investments. The
6
Feldman Financial Advisors, Inc.
Bank competes for these deposits by offering superior service and a variety of deposit accounts at competitive rates.
In order to facilitate its growth objectives and maintain appropriate capital levels, the Company plans to raise additional capital through the Stock Offering. The net proceeds from the Stock Offering may also be used to support increased lending activities, repay borrowings, or other general corporate purposes. In addition, the Stock Offering will afford the opportunity to implement stock-based compensation and benefit plans for management and employees, thereby improving the Company’s capacity to attract and retain qualified personnel. The Stock Offering also provides the occasion for the Company to strengthen its ties to the local community by allowing customers the opportunity to become equity owners of the Company and participate in possible stock price appreciation and cash dividends.
The remainder of Chapter I examines in more detail the trends addressed in this section, including the impact of changes in the Company’s economic and competitive environment, and recent management initiatives. The discussion is supplemented by the exhibits in the Appendix. Exhibit II-1 summarizes the Bank’s consolidated balance sheets as of the years ended December 31, 2006 and 2007 and for the quarter ended March 31, 2008. Exhibit II-2 presents the Bank’s consolidated income statements for the years ended December 31, 2006 and 2007 and for the quarters ended March 31, 2008 and 2007.
7
Feldman Financial Advisors, Inc.
Financial Condition
Table 1 presents selected data concerning the Bank’s financial position as of December 31, 2005 to 2007 and at March 31, 2008. Table 2 displays relative financial and performance ratios for the Bank for the fiscal years ended December 31, 2005 through 2007 and for the three months ended March 31, 2007 and 2008.
Table 1
Selected Financial Condition and Performance Data
As of or For the Years Ended December 31, 2005 to 2007
and the Three Months Ended March 31, 2007 and 2008
At March 31, | At December 31, | |||||||||||||||
| 2008 | 2007 | 2006 | 2005 | |||||||||||||
Selected Financial Condition Data: | (In thousands) | |||||||||||||||
| Total assets | $ | 167,447 | $ | 156,925 | $ | 136,562 | $ | 145,449 | ||||||||
| Loans receivable net | 126,284 | 125,602 | 118,021 | 116,097 | ||||||||||||
| Securities held to maturity, at amortized cost: | 0 | |||||||||||||||
| U.S. government and federal agency | 0 | - | - | 3,995 | ||||||||||||
| Federal Home Loan Bank stock | 283 | 246 | 291 | 341 | ||||||||||||
| Deposits | 148,860 | 137,568 | 118,077 | 127,938 | ||||||||||||
| Other borrowings | 0 | 500 | - | - | ||||||||||||
| Equity | 17,524 | 17,785 | 17,478 | 16,557 | ||||||||||||
For the Three Months Ended March 31, | For the Year Ended December 31, | |||||||||||||||||||
| 2008 | 2007 | 2007 | 2006 | 2005 | ||||||||||||||||
| (In thousands) | ||||||||||||||||||||
| Total interest income | $ | 2,232 | $ | 2,210 | $ | 9,019 | $ | 9,382 | $ | 9,917 | ||||||||||
| Total interest expense | 1,052 | 645 | 3,227 | 2,209 | 1,885 | |||||||||||||||
| Net interest income | 1,180 | 1,565 | 5,792 | 7,173 | 8,032 | |||||||||||||||
| Provision for loan losses | 225 | 225 | 898 | 897 | 1,432 | |||||||||||||||
| Net interest income after provision for loan losses | 955 | 1,340 | 4,894 | 6,276 | 6,600 | |||||||||||||||
| Fees and service charges | 470 | 527 | 2,438 | 2,584 | 2,714 | |||||||||||||||
| Other non-interest income | 54 | 104 | 9 | (13 | ) | (4 | ) | |||||||||||||
| Total non-interest income | 524 | 631 | 2,447 | 2,571 | 2,710 | |||||||||||||||
| Total non-interest expense | 1,897 | 1,846 | 7,604 | 7,926 | 7,945 | |||||||||||||||
| Income (loss) before income tax expense (benefit) | (418 | ) | 125 | (263 | ) | 921 | 1,365 | |||||||||||||
Income tax expense (benefit)(1) | (157 | ) | - | (570 | ) | - | - | |||||||||||||
Net income (loss)(1) | $ | (261 | ) | $ | 125 | $ | 307 | $ | 921 | $ | 1,365 | |||||||||
| (1) | Until its conversion to a federally chartered mutual savings bank on July 1, 2007, Sunshine Savings Bank was a credit union, generally exempt from federal income taxes. As a result of the change in tax status on July 1, 2007, Sunshine Savings Bank recorded a deferred tax asset in the amount of $407,670, as well as a related tax benefit in the income statement of $407,670. The following table provides a reconciliation to pro forma net income for all periods presented, had Sunshine Savings Bank been subject to federal and state income taxes: |
8
Feldman Financial Advisors, Inc.
| March 31, | December 31, | ||||||||
| 2008 | 2007 | 2007 | 2006 | 2005 | |||||
| (In Thousands) | |||||||||
| Historical net earnings | ($261) | $125 | $307 | $921 | $1,365 | ||||
| Less: pro forma income tax | 157 | 47 | (100) | 347 | 514 | ||||
| Less: tax benefit | 157 | n/a | 570 | n/a | n/a | ||||
| Pro forma net earnings | ($261) | $78 | ($163) | $574 | $851 | ||||
Source: Sunshine Savings Bank, preliminary prospectus.
Table 2
Selected Financial and Performance Ratios
As of or For the Years Ended December 31, 2005 to 2007
and the Three Months Ended March 31, 2007 and 2008
At or For the Three Months Ended March 31, | At or For the Year December 31, | |||||||||||||||||||
| 2008 | 2007 | 2007 | 2006 | 2005 | ||||||||||||||||
Selected Financial Ratios and Other Data: | ||||||||||||||||||||
| Performance ratios: | ||||||||||||||||||||
| Return on assets (ratio of net income to | (0.67 | ) | 0.37 | % | 0.21 | % | 0.66 | % | 0.92 | % | ||||||||||
| average total assets) | ||||||||||||||||||||
| Return on equity (ratio of net income to | (5.91 | ) | 2.86 | 1.73 | 5.36 | 8.51 | ||||||||||||||
| average equity) | ||||||||||||||||||||
| Interest rate spread information: | ||||||||||||||||||||
| Average during period | 2.55 | 4.40 | 3.69 | 5.18 | 5.47 | |||||||||||||||
| End of period | 2.69 | 4.41 | 2.73 | 4.67 | 5.94 | |||||||||||||||
Net interest margin(1) | 3.20 | 5.01 | 4.37 | 5.67 | 5.76 | |||||||||||||||
| Noninterest income to operating revenue | 19.01 | 22.21 | 21.34 | 21.51 | 21.46 | |||||||||||||||
| Operating expense to average total assets | 4.85 | 5.53 | 4.85 | 5.89 | 5.33 | |||||||||||||||
| Average interest-earning assets to average | 122.54 | 129.50 | 127.99 | 128.02 | 121.56 | |||||||||||||||
| interest-bearing liabilities | ||||||||||||||||||||
Efficiency ratio(2) | 111.33 | 84.06 | 92.29 | 81.34 | 73.96 | |||||||||||||||
| Asset quality ratios: | ||||||||||||||||||||
| Nonperforming assets to total assets at end of period | 1.00 | 0.39 | 1.05 | 0.53 | 0.52 | |||||||||||||||
| Nonperforming loans to total loans | 1.20 | 0.30 | 1.10 | 0.38 | 0.18 | |||||||||||||||
| Allowance for loan losses to non-performing loans | 94.47 | 414.36 | 101.64 | 337.61 | 766.67 | |||||||||||||||
| Allowance for loan losses to loans receivable, net | 1.14 | 1.25 | 1.12 | 1.28 | 1.41 | |||||||||||||||
| Net charge-offs to average loans outstanding | 0.63 | 0.85 | 0.82 | 0.87 | 1.35 | |||||||||||||||
| Capital Ratios: | ||||||||||||||||||||
| Equity to total assets at end of period | 10.47 | 12.21 | 11.33 | 12.80 | 11.38 | |||||||||||||||
| Average equity to average assets | 11.31 | 13.12 | 12.68 | 12.73 | 10.75 | |||||||||||||||
| Other data: | ||||||||||||||||||||
| Number of full service offices | 5 | 4 | 5 | 4 | 4 | |||||||||||||||
| (1) | Net interest income divided by average interest earning assets. |
| (2) | Total other operating expense, excluding real estate owned and repossessed property expense, as a percentage of net interest income and total other operating income, excluding net securities transactions. |
Source: Sunshine Savings Bank, preliminary prospectus.
9
Feldman Financial Advisors, Inc.
Balance Sheet Composition
Total assets increased by $30.9 million, or 22.6%, to $167.4 million at March 31, 2008 from $136.6 million at December 31, 2006. The increase in total assets was due primarily to increases in cash and cash equivalents and in the loan portfolio. Cash and cash equivalents increased to $34.2 million at March 31, 2008 from $10.7 million at December 31, 2006, while our loan portfolio increased $8.3 million, or 7.0%, since December 31, 2006. The increase in total assets was funded by an increase in deposits.
Loans. The loan portfolio had an increase of $0.7 million, to $126.3 million at March 31, 2008 from $125.6 million at December 31, 2007. One-to-four family real estate mortgage loans increased $1.8 million and other secured consumer loans increased $1.3 million. These increases were partially offset by a decrease in automobile loans of $1.5 million, and a decrease in unsecured loans of $0.8 million. The decrease in automobile and unsecured loans was primarily due to a combination of more stringent underwriting policies and a greater emphasis on providing mortgage lending to our customer base.
The loan portfolio had an increase of $7.6 million, or 6.4%, to $125.6 million at December 31, 2007 from $118.0 million at December 31, 2006. One-to-four family real estate mortgage loans increased $10.9 million or 16.6%, and home equity loans increased $3.5 million, or 22.4%. These increases were partially offset by a decrease in automobile loans of $4.7 million or 22.5%, and a decrease in unsecured loans of $1.8 million or 13.0%. The decrease in automobile and unsecured loans was primarily due to a combination of more stringent underwriting policies, a greater emphasis on providing mortgage lending to the customer base and competition.
10
Feldman Financial Advisors, Inc.
Allowance for Loan Losses. The allowance for loan losses at March 31, 2008 was $1.45 million or 1.15% of net loans receivable, compared to $1.4 million or 1.12% of net loans receivable at December 31, 2007. Non-performing loans increased to $1.5 million at March 31, 2008 from $1.4 million at December 31, 2007, primarily as a result of one non-performing first mortgage loan. Non-performing loans to total loans increased to 1.20% at March 31, 2008 from 1.10% at December 31, 2007.
The allowance for loan losses at December 31, 2007 was $1.4 million or 1.12% of net loans receivable, compared to $1.5 million or 1.28% of net loans receivable at December 31, 2006. The decline in the allowance for loan losses was due primarily to charge-offs of non-performing loans. Non-performing loans increased to $1.4 million at December 31, 2007 from $452,000 at December 31, 2006, primarily as a result of seven non-performing first mortgage loans. Non-performing loans to total loans increased to 1.10% at December 31, 2007 from 0.38% at December 31, 2006.
Deposits. Total deposits increased $11.3 million to $148.9 million at March 31, 2008 from $137.6 million at December 31, 2007. This increase was due primarily to a $9.2 million increase in certificate of deposit accounts. The increase in certificate accounts was the result of paying more competitive interest rates and the Bank’s recent access to the general public for deposits as the Bank no longer had field of membership limitation since the conversion to a bank charter.
Total deposits increased $19.5 million, or 16.5%, to $137.6 million at December 31, 2007 from $118.1 million at December 31, 2006. This increase was due primarily to a $28.3 million, or 72.1%, increase in certificate of deposit accounts.
11
Feldman Financial Advisors, Inc.
Equity. Total equity decreased $261,000 to $17.5 million at March 31, 2008 or 10.47% of total assets, from $17.8 million at December 31, 2007. This decrease was solely due to the net loss for the three months ended March 31, 2008.
Total equity increased $307,000 to $17.8 million at December 31, 2007 or 11.33% of total assets, from $17.5 million at December 31, 2006. This increase was solely due to the retention of net income.
Lending Operations
Table 3 and Exhibit II-3 presents information concerning the composition of the Bank’s loan portfolio in dollar amounts and in percentages (before deductions for loans in process, deferred fees and discounts and allowances for losses) at the dates indicated.
Loan Approval Procedures and Authority. The Bank’s lending policies and loan approval limits are recommended by senior management and approved by the Board of Directors. Unsecured loans of $50,000 and secured loans of $100,000 and below meeting underwriting guidelines can be approved by individual loan officers, although secured loans up to $750,000 may be approved by the Chief Executive Officer. The loan committee, consisting of the President and Chief Executive Officer, Executive Vice President and Chief Operating Officer, Chief Lending Officer, and the Senior Vice President and Chief Financial Officer, reviews all other loans and all loan modifications. Loan committee meetings require a quorum of three members of the committee. Loans submitted to the loan committee require approval of a majority of the members voting and approval of all members present if only three members are present. Loans exceeding $1.0 million must be approved by the board of directors. All closed loans are presented to the Board for ratification on a monthly basis.
12
Feldman Financial Advisors, Inc.
Table 3
Loan Portfolio
As of December 31, 2006 and 2007 and March 31, 2008
(Dollars in Thousands)
| March 31, | December 31, | |||||||||||||||||||||||
| 2008 | 2007 | 2006 | ||||||||||||||||||||||
| Amount | Percent | Amount | Percent | Amount | Percent | |||||||||||||||||||
| Real estate loans: | (Dollars in thousands) | |||||||||||||||||||||||
| One- to four-family | $ | 77,537 | 60.76 | % | 75834 | 59.68 | % | 65547 | 54.88 | % | ||||||||||||||
| Construction or development | 708 | 0.56 | 592 | 0.47 | 0 | 0 | ||||||||||||||||||
| Total real estate loans | 78,245 | 61.32 | 76426 | 60.15 | 65547 | 54.88 | ||||||||||||||||||
| Consumer loans: | ||||||||||||||||||||||||
| Home equity | 19,026 | 14.91 | 19,032 | 14.99 | 15,547 | 13.02 | ||||||||||||||||||
| Automobile | 14,723 | 11.54 | 16,236 | 12.78 | 20,936 | 17.53 | ||||||||||||||||||
| Credit cards and unsecured | 11,874 | 9.3 | 12,653 | 9.96 | 14,537 | 12.17 | ||||||||||||||||||
| Deposit account | 1,520 | 1.19 | 1,816 | 1.42 | 1,979 | 1.66 | ||||||||||||||||||
| Other | 2216 | 1.74 | 905 | 0.7 | 881 | 0.74 | ||||||||||||||||||
| Total consumer loans | 49,359 | 38.68 | 50,642 | 39.85 | 53,880 | 45.12 | ||||||||||||||||||
| Total loans | $ | 127,604 | 100.00 | % | $ | 127,068 | 100.00 | % | $ | 119,427 | 100.00 | % | ||||||||||||
| Less: | ||||||||||||||||||||||||
| Loans in process | (175 | ) | (7 | ) | (215 | ) | ||||||||||||||||||
| Deferred fees and discounts | 42 | 50 | 95 | |||||||||||||||||||||
| Allowance for losses | 1,453 | 1,423 | 1,526 | |||||||||||||||||||||
| Total loans, net | $ | 126,284 | $ | 125,602 | $ | 118,021 | ||||||||||||||||||
Source: Sunshine Savings Bank, preliminary prospectus
One- to Four-Family Real Estate Lending. Sunshine Savings Bank originates loans secured by first mortgages on one- to four-family residences primarily in its market area. The Bank originates one- to four-family residential mortgage loans primarily through referrals from real estate agents, builders and from existing customers. Walk-in customers are also important sources of loan originations. Since converting from a credit union to a federal mutual savings bank in 2007, the Bank has expanded its target residential mortgage market to include individuals who are not members, with an emphasis on increasing residential real estate loan originations.
13
Feldman Financial Advisors, Inc.
Sunshine Savings Bank generally originates mortgage loans in amounts up to 80% of the lesser of the appraised value or purchase price of a mortgaged property, but will also permit loan-to-value ratios of up to 95%. For loans exceeding an 80% loan-to-value ratio, Sunshine Savings Bank generally requires the borrower to obtain private mortgage insurance covering the Bank for any loss on the amount of the loan in excess of 80% in the event of foreclosure. The majority of one- to four-family residential loans are originated with fixed rates and have terms of ten to 30 years. The Bank also originates adjustable-rate mortgage, or ARM, loans, which have interest rates that adjust annually to the yield on U.S. Treasury securities adjusted to a constant one-year maturity plus a margin. Most ARM loans are hybrid loans, which after an initial fixed rate period of five or seven years will convert to an adjustable interest rate for the remaining term of the loan. The pricing strategy for mortgage loans includes setting interest rates that are competitive with other local financial institutions and consistent with the Bank’s asset/liability management objectives. ARM loans have terms of up to 30 years with an initial fixed-rate period of one year according to the terms of the loan. ARM loans generally have a cap of two percentage points on rate adjustments during any one-year and six percentage points over the life of the loan. As a consequence of using caps, the interest rates on these loans may not be as rate sensitive as the Bank’s cost of funds. During the quarter ended March 31, 2008, the Bank originated $$4.6 million of one- to four-family fixed rate mortgage loans and no one- to four-family ARM loans. During the year ended December 31, 2007, the Bank originated $18.2 million of one- to four-family fixed rate mortgage loans and $153,000 one- to four-family ARM loans.
14
Feldman Financial Advisors, Inc.
ARM loans generally pose different credit risks than fixed-rate loans, primarily because as interest rates rise, the borrower’s payment rises, increasing the potential for default. The Bank has not experienced significant delinquencies in its one- to four-family loan portfolio, including ARM loans. However, the majority of these loans have been originated within the past several years, when rates were historically low. The Bank has offered some teaser rates for the initial loan rate on its ARM loans but not at significant discounts from prevailing rates.
Most of the loans are written using generally accepted underwriting guidelines, and are readily saleable to Freddie Mac, Fannie Mae, or other private investors. Real estate loans generally contain a “due on sale” clause allowing he Bank to declare the unpaid principal balance due and payable upon the sale of the security property.
Property appraisals on real estate securing the one- to four-family residential loans are made by state certified independent appraisers approved by the board of directors. Appraisals are performed in accordance with applicable regulations and policies. The Bank generally requires title insurance policies on all first mortgage real estate loans originated, but may also originate loans that will be retained for portfolio with an attorney’s opinion in lieu of title insurance. Homeowners, liability, fire and, if required, flood insurance policies are also required.
Residential Construction Lending. Sunshine Savings Bank originates construction loans for single-family houses to individuals for construction of their primary residence in its market areas. The Bank will generally originate construction loans in an amount up to 80% for a one- to four-family residential construction loan. Construction loans generally have terms up to 12 months and provide for monthly payments of interest only until maturity. The Bank typically
15
Feldman Financial Advisors, Inc.
converts construction loans to individuals to permanent loans on completion of construction but does not require take-out financing prior to origination.
Construction lending is generally considered to involve a higher degree of credit risk than long-term permanent financing of residential properties. If the estimate of construction cost proves to be inaccurate, the Bank may be compelled to advance additional funds to complete the construction with repayment dependent, in part, on the success of the ultimate project rather than the ability of a borrower or guarantor to repay the loan. If the Bank is forced to foreclose on a project prior to completion, there is no assurance that the Bank will be able to recover the entire unpaid portion of the loan. In addition, the Bank may be required to fund additional amounts to complete a project and may have to hold the property for an indeterminate period of time.
Consumer Lending. Sunshine Savings Bank offers a variety of secured consumer loans, including home equity, new and used automobile, boat and other recreational vehicle loans, and loans secured by savings deposits. The Bank also offer unsecured consumer loans including a credit card product. The Bank originates its consumer loans primarily in its market areas.
Home equity loans, consisting of fixed-rate loans and variable-rate lines of credit, have been increasing in amount and as a percentage of the total loan portfolio consistently over the past several years. At March 31, 2008, home equity lines of credit totaled $13.14 million and home equity loans totaled $5.96 million, or collectively 37.6% of the consumer loan portfolio and 14.98% of the gross loan portfolio. The lines of credit may be originated in amounts, together with the amount of the existing first mortgage, of up to 95% of the value of the property securing the loan (less any prior mortgage loans) provided that the borrower obtain private mortgage insurance covering the Bank for any loss on the amount of the loan in excess of 80% in
16
Feldman Financial Advisors, Inc.
the event of foreclosure. Home equity lines of credit are originated with an adjustable rate of interest, based on Treasury bill securities adjusted to a constant one-year maturity rate plus a margin. Home equity lines of credit generally have up to a ten-year draw period and amounts may be drawn upon again after payment at any time during the draw period. At March 31, 2008, unfunded commitments on these lines of credit totaled $3.6 million.
Fixed-rate home equity loans are originated in amounts, together with the amount of the existing first mortgage, of up to 100% of the appraised value of the subject property for home equity loans (less any prior mortgage loans) provided that the borrower obtain private mortgage insurance covering the Bank for any loss on the amount of the loan in excess of 80% in the event of foreclosure. These loans may have terms for up to 20 years and are fully amortizing.
Collateral value is determined through existing appraisals, new appraisals or evaluations by the loan department. On second mortgages, the Bank does not require title insurance but does require homeowner, liability, fire and, if required, flood insurance policies.
Sunshine Savings Bank makes loans on new and used automobiles. The Bank currently originates automobile loans only on a direct basis although the board recently approved a policy to originate up to $5.0 million of indirect automobile loans using the same underwriting guidelines as direct automobile loans. The automobile loan portfolio totaled $14.7 million at March 31, 2008, or 29.8% of the consumer loan portfolio and 11.5% of the gross loan portfolio.
Automobile loans may be written for a term of up to six years for new cars and five years for used cars and have fixed or adjustable rates of interest. Loan-to-value ratios are up to 100% of the lesser of the purchase price or the National Automobile Dealers Association value for auto
17
Feldman Financial Advisors, Inc.
loans, plus up to $1,500 for extended warranty insurance. The Bank follows its internal underwriting guidelines in evaluating automobile loans, including credit scoring.
Consumer loans also include loans secured by new and used boats and recreational vehicles, deposits and unsecured credit card and other consumer loans, all of which, at March 31, 2008, totaled $15.6 million, or 12.2% of the gross loan portfolio. Loans secured by boats and recreational vehicles typically have terms up to twenty years, and loan-to-value ratios up to 90%. They are made with fixed and adjustable rates. Although the Bank currently originates boat and recreational vehicle loans on a direct basis, the board recently adopted a policy to originate up to $10.0 million in boat loans and $5.0 million in recreational vehicle loans using the same underwriting guidelines as comparable direct loans. Unsecured consumer loans either have a fixed rate of interest generally for a maximum term of 60 months, or are revolving lines of credit of generally up to $50,000. At March 31, 2008, unfunded commitments on unsecured lines of credit totaled $13.2 million, and the average outstanding balance on these lines was approximately $5,700.
Consumer loans generally have shorter terms to maturity, which reduces exposure to changes in interest rates. In addition, management believes that offering consumer loan products helps to expand and create stronger ties to the existing customer base by increasing the number of customer relationships and providing cross-marketing opportunities.
Underwriting standards for consumer loans include a determination of the applicant’s credit history and an assessment of the applicant’s ability to meet existing obligations and payments on the proposed loan. The stability of the applicant’s monthly income may be
18
Feldman Financial Advisors, Inc.
determined by verification of gross monthly income from primary employment, and additionally from any verifiable secondary income.
Consumer and other loans generally entail greater risk than do one- to four-family residential mortgage loans, particularly in the case of consumer loans that are secured by rapidly depreciable assets, such as manufactured homes, automobiles, boats and other recreational vehicles. In these cases, any repossessed collateral for a defaulted loan may not provide an adequate source of repayment of the outstanding loan balance. As a result, consumer loan collections are dependent on the borrower’s continuing financial stability and, thus, are more likely to be adversely affected by job loss, divorce, illness or personal bankruptcy.
Subprime Lending. Prior to 2006, Sunshine Savings Bank made a significant amount of loans to borrowers that are considered “subprime” as defined by banking regulators. These loans are considered subprime typically because the borrowers have weakened credit histories that include payment delinquencies and possibly more severe problems such as charge-offs, judgments, and bankruptcies. These subprime loans may also display reduced repayment capacity as measured by the borrowers’ credit scores, debt-to-income ratios, or other criteria such as limited credit histories. In exchange for the additional lender risk associated with subprime loans, the Bank generally receives a higher interest rate on the loan, and depending on the severity of the credit history, a lower loan-to-value ratio may have been required as well, compared to that required for a borrower of a loan meeting conforming secondary market standards.
As of March 31, 2008, the Bank held in its subprime loan portfolio approximately $18.9 million in one-to four-family mortgage loans (of which $4.8 million were adjustable rate), $4.9
19
Feldman Financial Advisors, Inc.
million of automobile loans (of which $4.1 million were adjustable rate) and $7.6 million in other types of consumer loans (of which $4.9 million were adjustable rate). These subprime loans represent in the aggregate approximately 25% of the gross loan portfolio at March 31, 2008.
Loans originated prior to 2006 (the year in which the Bank changed its lending focus and implemented more stringent underwriting standards) were subject to $1.4 million in charge-offs, specific loss and valuation allowances and provisions for loan losses on foreclosed assets from January 1, 2006 through March 31, 2008. In comparison, the $64.8 million in loans originated after December 31, 2005 were subject to only $0.5 million in charge-offs, specific loss and valuation allowances and provisions for loan losses on foreclosed assets during this same time period. Of the $1.5 million in non-performing loans and $135,000 in foreclosed assets as of March 31, 2008, $1.7 million were originated prior to 2006, $300,000 were originated after December 31, 2005 and $1.6 million relate to subprime borrowers. There can be no assurance, however, that the level of delinquencies experienced with respect to subprime loans or loans originated after December 31, 2005 loans will not increase as this pool continues to age, particularly if the local economy weakens.
Loans to One Borrower. At March 31, 2008, the maximum amount under federal law that Sunshine Savings Bank could lend to any one borrower and the borrower’s related entities was approximately $2.8 million. The Bank’s largest lending relationship consists of a $680,000 loan secured by a principal residence. The next four largest were also secured by a principal residence and ranged in total from $413,000 to $554,000. All five loans were current as of March 31, 2008.
20
Feldman Financial Advisors, Inc.
Investment Portfolio
Sunshine Savings Bank’s investment portfolio has historically been a small portion of its assets as the Bank attempt to be fully invested in loans. The Bank does intend, however, to utilize its borrowing capacity at the Federal Home Loan Bank (“FHLB”) of Atlanta to purchase investment grade securities to leverage the balance sheet and increase net interest income. In addition, Sunshine Savings Bank expects its net proceeds initially will be used to invest in short-term liquid assets such as U.S. Government and federal agency securities of various maturities, mortgage-backed or other marketable securities, deposits in other financial institutions, or a combination thereof, until they can be deployed in an orderly fashion. The general objectives of the investment portfolio will be to provide liquidity when loan demand is high, to assist in maintaining earnings when loan demand is low and to maximize earnings while satisfactorily managing risk, including credit risk, reinvestment risk, liquidity risk and interest rate risk. Investment quality will emphasize safer investments with the yield on those investments secondary to not taking unnecessary risk with the available funds of Sunshine Savings Bank.
The Bank does not currently participate in hedging programs, interest rate caps, floors or swaps, or other activities involving the use of off-balance sheet derivative financial instruments. Further, it does not invest in securities which are not rated investment grade.
At March 31, 2008 and December 31, 2007 and 2006, the Bank did not have any investment securities. As a member of the FHLB, the Bank had $283,000 in stock of the Federal Home Loan Bank of Atlanta at March 31, 2008. The Bank also had $29.7 million of fed funds and $3.1 million of interest-bearing deposits as of March 31, 2008.
21
Feldman Financial Advisors, Inc.
Deposit Portfolio
Deposits are The Bank’s major source of funds for lending and other investment purposes. Exhibit II-4 and Table 4 presents a summary of the Company’s deposit composition as of March 31, 2008 and December 31, 2006 to 2007. Total deposits amounted to $148.9 million at March 31, 2008.
Current deposit products include checking, savings, money market, savings accounts, and certificates of deposit accounts ranging in terms from seven months to sixty months, and individual retirement accounts with terms starting at eighteen months. Deposit account terms vary, primarily as to the required minimum balance amount, the amount of time that the funds must remain on deposit and the applicable interest rate. The Bank solicits deposits primarily in its market areas. At March 31, 2008, the Bank had no brokered, Internet or wholesale deposits. Sunshine Savings Bank primarily relies on competitive pricing policies, marketing and customer service to attract and retain these deposits. As of March 31, 2008, core deposits, which are define as non-certificate or non-time deposit accounts, represented approximately 48.4% of total deposits.
22
Feldman Financial Advisors, Inc.
Table 4
Deposit Portfolio Distribution
As of December 31, 2006 to 2007 and March 31, 2008
(Dollars in Thousands)
| March 31, | December 31, | |||||||||||||||||||||||
| 2008 | 2007 | 2006 | ||||||||||||||||||||||
| Amount | Percent | Amount | Percent | Amount | Percent | |||||||||||||||||||
| Real estate loans: | (Dollars in thousands) | |||||||||||||||||||||||
| One- to four-family | $ | 77,537 | 60.76 | % | 75834 | 59.68 | % | 65547 | 54.88 | % | ||||||||||||||
| Construction or development | 708 | 0.56 | 592 | 0.47 | 0 | 0 | ||||||||||||||||||
| Total real estate loans | 78,245 | 61.32 | 76426 | 60.15 | 65547 | 54.88 | ||||||||||||||||||
| Consumer loans: | ||||||||||||||||||||||||
| Home equity | 19,026 | 14.91 | 19,032 | 14.99 | 15,547 | 13.02 | ||||||||||||||||||
| Automobile | 14,723 | 11.54 | 16,236 | 12.78 | 20,936 | 17.53 | ||||||||||||||||||
| Credit cards and unsecured | 11,874 | 9.3 | 12,653 | 9.96 | 14,537 | 12.17 | ||||||||||||||||||
| Deposit account | 1,520 | 1.19 | 1,816 | 1.42 | 1,979 | 1.66 | ||||||||||||||||||
| Other | 2216 | 1.74 | 905 | 0.7 | 881 | 0.74 | ||||||||||||||||||
| Total consumer loans | 49,359 | 38.68 | 50,642 | 39.85 | 53,880 | 45.12 | ||||||||||||||||||
| Total loans | $ | 127,604 | 100.00 | % | $ | 127,068 | 100.00 | % | $ | 119,427 | 100.00 | % | ||||||||||||
| Less: | ||||||||||||||||||||||||
| Loans in process | (175 | ) | (7 | ) | (215 | ) | ||||||||||||||||||
| Deferred fees and discounts | 42 | 50 | 95 | |||||||||||||||||||||
| Allowance for losses | 1,453 | 1,423 | 1,526 | |||||||||||||||||||||
| Total loans, net | $ | 126,284 | $ | 125,602 | $ | 118,021 | ||||||||||||||||||
Source: Sunshine Savings Bank; preliminary prospectus.
The flow of deposits is influenced significantly by general economic conditions, changes in money market and prevailing interest rates and competition. The variety of deposit accounts we offer has allowed us to be competitive in obtaining funds and to respond with flexibility to changes in consumer demand. The Bank has become more susceptible to short-term fluctuations in deposit flows as customers have become more interest rate conscious. Sunshine Savings Bank tries to manage the pricing of deposits in keeping with the asset/liability management, liquidity and profitability objectives, subject to competitive factors. Based on experience, the Bank believe that its deposit portfolio is a relatively stable source of funds. Despite this stability, the ability to attract and maintain these deposits and the rates paid on them has been and will continue to be significantly affected by market conditions.
23
Feldman Financial Advisors, Inc.
A large percentage of deposits are in certificates of deposit. Liquidity could be reduced if a significant amount of certificates of deposit, maturing within a short period of time, were not renewed. Historically, a significant portion of the certificates of deposit remain after they mature and management believes that this will continue. However, the need to retain these time deposits could result in an increase in the cost of funds.
Table 5 sets forth certificates of deposit classified by interest rate as of the date indicated.
Borrowings
To supplement deposits as a source of funds for lending or investment, the Bank may borrow funds in the form of advances from the FHLB. The Bank has a credit agreement with the FHLB and this credit arrangement is subject to annual renewal and incurs no service charges. FHLB advances are typically secured by the FHLB stock and a portion of residential mortgage loans and by other assets, mainly securities which are obligations of or guaranteed by the U.S. government.
24
Feldman Financial Advisors, Inc.
Table 5
Certificates of Deposit by Interest Rate
At March 31, 2008
(Dollars in Thousands)
| 2.00- | 4.00- | 6.00- | Percent | |||||||||||||||||
| 3.99% | 5.99% | 7.99% | Total | of Total | ||||||||||||||||
Certificate accounts maturing in quarter ending: | (Dollars in Thousands) | |||||||||||||||||||
| June 30, 2008 | $ | 1,055 | $ | 15,126 | $ | - | $ | 16,181 | 21.06 | % | ||||||||||
| September 30, 2008 | 754 | 13,297 | - | 14,051 | 18.29 | |||||||||||||||
| December 31, 2008 | 3,562 | 12,953 | - | 16,515 | 21.49 | |||||||||||||||
| March 31, 2009 | 1,108 | 9,410 | 122 | 10,640 | 13.85 | |||||||||||||||
| June 30, 2009 | 272 | 14,883 | - | 15,155 | 19.72 | |||||||||||||||
| September 30, 2009 | 406 | 675 | - | 1,081 | 1.41 | |||||||||||||||
| December 31, 2009 | 232 | 544 | - | 776 | 1.01 | |||||||||||||||
| March 31, 2010 | 206 | 199 | - | 405 | 0.53 | |||||||||||||||
| June 30, 2010 | 92 | 100 | - | 192 | 0.25 | |||||||||||||||
| September 30, 2010 | 53 | 171 | - | 224 | 0.29 | |||||||||||||||
| December 31, 2010 | 19 | 39 | - | 58 | 0.08 | |||||||||||||||
| March 31, 2011 | 63 | 99 | - | 162 | 0.21 | |||||||||||||||
| Thereafter | 103 | 1,291 | 0 | 1,394 | 1.81 | |||||||||||||||
| Total | $ | 7,925 | $ | 68,787 | $ | 122 | $ | 76,834 | 100.0 | % | ||||||||||
| Percent of total | 10.3 | % | 89.5 | % | 0.2 | % | 100.0 | % | 100.0 | % | ||||||||||
Source: Sunshine Savings Bank; preliminary prospectus.
At March 31, 2008, the Bank had no FHLB advances outstanding. The Bank plans on relying, in part, on long-term FHLB advances to fund asset and loan growth. The Bank is required to own stock in the Federal Home Loan Bank of Atlanta based on the amount of advances. At March 31, 2008, the Bank had $283,000 in FHLB stock.
Table 6 sets forth the actual and maximum month-end balances and average balance of borrowings for the periods indicated.
25
Feldman Financial Advisors, Inc.
Table 6
Borrowings
Years Ended December 31, 2006 and 2007 and the Quarters Ended March 31, 2007 and 2008
(Dollars in Thousands)
Three Months Ended March 31, | Year Ended December 31, | |||||||||||||||
| 2008 | 2007 | 2007 | 2006 | |||||||||||||
| Maximum balance: | (Dollars in thousands) | |||||||||||||||
| Other borrowings | $ | 500 | $ | 0 | $ | 500 | $ | 0 | ||||||||
| Average balances and rates | ||||||||||||||||
| Other borrowings | 250 | 0 | 17 | 63 | ||||||||||||
| Weighted average interest rate of | ||||||||||||||||
| Other borrowings | 4.80 | % | 0.00 | % | 8.50 | % | 5.00 | % | ||||||||
| Period end balances: | ||||||||||||||||
| Federal Home Loan Bank advances | $ | 0 | $ | 0 | $ | 0 | $ | 0 | ||||||||
| Other borrowings | $ | 0 | $ | 0 | $ | 0 | $ | 0 | ||||||||
| Weighted average interest rate of | ||||||||||||||||
| Other borrowings | 0.00 | % | 0.00 | % | 0.00 | % | 0.00 | % | ||||||||
Source: Sunshine Savings Bank, preliminary prospectus.
Equity Capital
At March 31, 2008, total equity was $17.5 million. The decrease from 2007 year-end reflected the net loss incurred during the quarter. As of March 31, 2008, the Bank exceeded all applicable regulatory capital requirements and was well capitalized. Total equity was $17.8 million at December 31, 2007 and $17.5 million at December 31, 2006. The increase during 2007 reflected net income of $307,000 for the year.
The Bank’s core capital amounted to $16.6 million or 9.94% of adjusted total assets at March 31, 2008. The Bank’s regulatory capital ratios of Tier 1 risk-based capital, and total risk-based capital were 15.54%, and 16.79%, respectively, as of March 31, 2008. In comparison, the minimum regulatory requirements were 3.00%, 4.00%, and 8.00%, and the threshold requirements for regulatory “well-capitalized” levels were 5.00%, 6.00%, and 10.00%, respectively.
26
Feldman Financial Advisors, Inc.
Income and Expense Trends
Table 7 displays the main components of the Company’s earnings performance over the quarters ended March 31, 2007 and 2008 and the fiscal years ended December 31, 2005 to 2007. Table 8 displays sets forth certain information relating yields and costs at and for the periods indicated. The average yields and costs are derived by dividing income or expense by the daily average balance of assets or liabilities, respectively, for the periods presented. Table 9 reflects the sensitivity of Sunshine Savings Bank’s interest income and interest expense to changes in volume and in prevailing interest rates during the periods indicated.
Table 7
Summary Income Statement Data
For Years Ended December 31, 2005 to 2007
And the Quarter Ended March 31, 2007 and 2008
For the Three Months Ended March 31, | For the Year Ended December 31, | |||||||||||||||||||
| 2008 | 2007 | 2007 | 2006 | 2005 | ||||||||||||||||
| (In thousands) | ||||||||||||||||||||
| Total interest income | $ | 2,232 | $ | 2,210 | $ | 9,019 | $ | 9,382 | $ | 9,917 | ||||||||||
| Total interest expense | 1,052 | 645 | 3,227 | 2,209 | 1,885 | |||||||||||||||
| Net interest income | 1,180 | 1,565 | 5,792 | 7,173 | 8,032 | |||||||||||||||
| Provision for loan losses | 225 | 225 | 898 | 897 | 1,432 | |||||||||||||||
| Net interest income after provision for loan losses | 955 | 1,340 | 4,894 | 6,276 | 6,600 | |||||||||||||||
| Fees and service charges | 470 | 527 | 2,438 | 2,584 | 2,714 | |||||||||||||||
| Other non-interest income | 54 | 104 | 9 | (13 | ) | (4 | ) | |||||||||||||
| Total non-interest income | 524 | 631 | 2,447 | 2,571 | 2,710 | |||||||||||||||
| Total non-interest expense | 1,897 | 1,846 | 7,604 | 7,926 | 7,945 | |||||||||||||||
| Income (loss) before income tax expense (benefit) | (418 | ) | 125 | (263 | ) | 921 | 1,365 | |||||||||||||
Income tax expense (benefit)(1) | (157 | ) | - | (570 | ) | - | - | |||||||||||||
Net income (loss)(1) | $ | (261 | ) | $ | 125 | $ | 307 | $ | 921 | $ | 1,365 | |||||||||
Source: Sunshine Savings Bank, preliminary prospectus.
27
Feldman Financial Advisors, Inc.
Table 8
Average Balances and Yields
For the Years Ended December 31, 2006 and 2007
and the Quarters Ended March 31, 2007 and 2006
| At March 31, | Three Months ended March 31, | Year Ended December 31, | ||||||||||||||||
| 2008 | 2008 | 2007 | 2007 | 2006 | ||||||||||||||
Yield/ Rate | Average Outstanding Balance | Interest Earned/ Paid | Yield/ Rate | Average Outstanding Balance | Interest Earned/ Paid | Yield/ Rate | Average Outstanding Balance | Interest Earned/ Paid | Yield/ Rate | Average Outstanding Balance | Interest Earned/ Paid | Yield/ Rate | ||||||
| (Dollars in thousands) | ||||||||||||||||||
Interest-Earning Assets: | ||||||||||||||||||
Loans receivable(1) | 6.66 | % | $124,680 | $2,036 | 6.53 | % | $118,728 | $2,120 | 7.14 | % | $122,071 | $8,560 | 7.01 | % | $115,351 | $8,805 | 7.63 | % |
| Investments | -- | -- | -- | -- | -- | -- | -- | -- | -- | 2,316 | 73 | 3.17 | ||||||
| FHLB stock | 5.85 | 248 | 4 | 5.96 | 288 | 3 | 4.17 | 257 | 15 | 5.85 | 303 | 17 | 5.61 | |||||
| Other interest-earning assets | 4.12 | 22,829 | 192 | 3.36 | 5,780 | 86 | 6.02 | 10,087 | 444 | 4.40 | 8,004 | 487 | 6.08 | |||||
Total interest-earning assets(1) | 6.22 | 147,757 | 2,232 | 6.04 | 124,796 | 2,209 | 7.08 | 132,415 | 9,019 | 6.81 | 125,974 | 9,382 | 7.45 | |||||
Interest-Bearing Liabilities: | ||||||||||||||||||
| MMDA and savings | 1.33 | 49,222 | 166 | 1.35 | 54,598 | 184 | 1.35 | 51,627 | 705 | 1.37 | 59,373 | 724 | 1.22 | |||||
| Time deposits | 4.94 | 71,109 | 882 | 4.96 | 41,729 | 460 | 4.41 | 51,812 | 2,521 | 4.87 | 38,982 | 1,482 | 3.80 | |||||
| Notes payable | 250 | 3 | 4.80 | 42 | 1 | 5.68 | 17 | 1 | 5.91 | 49 | 3 | 4.75 | ||||||
| Total interest-bearing liabilities | 3.53 | % | $120,581 | $1,051 | 3.49 | % | $96,369 | $645 | 2.68 | % | $103,456 | $3,227 | 3.12 | % | $98,404 | $2,209 | 2.24 | % |
| Net interest income | $1,181 | $1,564 | $5,792 | $7,173 | ||||||||||||||
| Interest rate spread | 2.69 | % | 2.56 | % | 4.40 | % | 3.69 | % | 5.21 | % | ||||||||
| Net earning assets | $27,176 | $28,427 | $28,959 | $27,570 | ||||||||||||||
Net interest margin(2) | 3.12 | % | 3.20 | % | 5.02 | % | 4.37 | % | 5.69 | % | ||||||||
Ratio of average interest-earning assets to average interest-bearing liabilities | 127.99 | % | 128.02 | % | ||||||||||||||
(1) Calculated net of deferred loan fees, loan discounts, loans in process and loss reserves. | ||||||||||||||||||
(2) Net interest margin represents net interest income as a percentage of average interest-bearing assets. | ||||||||||||||||||
Source: Sunshine Savings Bank, preliminary prospectus.
28
Feldman Financial Advisors, Inc.
Table 9
Rate/Volume Analysis
| Quarter Ended March 31, | Year Ended December 31, | |||||||||||||||||||||||
| 2008 vs. 2007 | 2007 vs. 2006 | |||||||||||||||||||||||
| Increase | Total | Increase | Total | |||||||||||||||||||||
| (decrease) due to | increase | (decrease) due to | increase | |||||||||||||||||||||
| Volume | Rate | (decrease) | Volume | Rate | (decrease) | |||||||||||||||||||
Interest-earning assets: | (In thousands) | |||||||||||||||||||||||
| Loans receivable | $ | 106 | $ | (190 | ) | $ | (84 | ) | $ | 513 | $ | (758 | ) | $ | (245 | ) | ||||||||
| Investments | - | - | - | (73 | ) | - | (73 | ) | ||||||||||||||||
| FHLB Stock | - | 1 | 1 | (3 | ) | 1 | (2 | ) | ||||||||||||||||
| Other interest-earning assets | 254 | (148 | ) | 106 | 127 | (170 | ) | (43 | ) | |||||||||||||||
| Total interest-earning assets | $ | 360 | $ | (337 | ) | $ | 23 | $ | 564 | $ | (927 | ) | $ | (363 | ) | |||||||||
Interest-bearing liabilities: | ||||||||||||||||||||||||
| NOW, DDA, savings | $ | (18 | ) | $ | 0 | $ | (18 | ) | $ | (94 | ) | $ | 75 | $ | (19 | ) | ||||||||
| Time deposits | 324 | 98 | 422 | 488 | 551 | 1,039 | ||||||||||||||||||
| Notes Payable | 3 | (1 | ) | 2 | (2 | ) | - | (2 | ) | |||||||||||||||
| Total interest-bearing liabilities | $ | 309 | $ | 97 | $ | 406 | $ | 392 | $ | 626 | $ | 1,018 | ||||||||||||
| Net interest income | $ | 51 | $ | (434 | ) | $ | (383 | ) | $ | 172 | $ | (1,553 | ) | $ | (1,381 | ) | ||||||||
Source: Sunshine Savings Bank, preliminary prospectus.
As noted in the tables above, earnings have deteriorated over the past few years. Net income declined from $1.4 million for the year ended December 31, 2005 to $307,000 for the year ended December 31, 2007. Removing the tax benefit that the Bank received when it converted from a credit union to a federally chartered mutual savings bank, the Bank would have reported a loss of $263,000 for the year ended December 31, 2007. For the three months ended March 31, 2008, the Bank reported a loss of $261,000 compared to net income of $125,000 for the same period in 2007.
Management believes the primary factor in the declining earnings has been the deterioration in its interest rate spread and margin as he Bank shifts its focus to mortgage lending. The interest rate spread, which is the difference between the average yield earned on
29
Feldman Financial Advisors, Inc.
interest-earning assets and the average rate paid on interest-bearing liabilities, declined steadily from 5.47% in fiscal 2005 to 3.69% in fiscal 2007 and then to 2.56% during the three months ended March 31, 2008. As such, the Bank has become even more reliant on non-interest income in order to generate net income. Management does not expect that there will be sufficient net interest income to absorb the projected growth in non-interest expenses arising from the Bank’s programmed expansion, repositioning and organizational restructuring. Management also expects that non-interest expenses will be higher for 2008 as a result of the accounting, legal and various other additional non-interest expenses usually associated with operating as a public company, particularly as a result of the requirements of the Sarbanes-Oxley Act of 2002. Additional annual employee compensation and benefit expenses stemming from the shares granted to employees, officers and directors under new benefit plans will also increase non-interest expenses.
Comparison of Operating Results for the Three Months Ended March 31, 2008 and 2007
Net income for the three months ended March 31, 2008 was a loss of $261,000 compared to net income of $125,000 for the three months ended March 31, 2007. The earnings represent a return on average assets for the period of (0.67)% for 2008 and 0.37% for 2007.
The decrease in net income was due primarily to a decrease in the interest rate spread. The average yield on assets decreased to 6.53% for the three months ended March 31, 2008 from 7.14% for the three months ended March 31, 2007. This decline was expected due to a change in emphasis from higher risk and higher rate consumer automobile and unsecured lending to lower risk and lower yielding single-family mortgage lending. In addition, the average cost of
30
Feldman Financial Advisors, Inc.
liabilities increased to 3.49% for the three months ended March 31, 2008 from 2.68% for the three months ended March 31, 2007, primarily due to the higher cost of certificate of deposit accounts.
Net Interest Income. Net interest income decreased $383,000, or 24.5%, to $1.2 million for the three months ended March 31, 2008 from $1.6 million for the same period in 2007 as the increase in the average balance of the loan portfolio was not enough to offset the lower rates earned on loans and the increased costs of deposits. The interest spread decreased to 2.56% for the three months ended March 31, 2008 from 4.40% for the same period in 2007, while the average net interest margin declined to 3.12% at March 31, 2008 from 5.01% at March 31, 2007. The ratio of average interest earning assets to average interest bearing liabilities decreased to 122.5% at March 31, 2008, from 129.5% as of March 31, 2007.
Interest Income. Interest income for the three months ended March 31, 2008 and March 31, 2007 was $2.2 million. While the total interest income remained stable, the yield on loans decreased to 6.53% for the three months ended March 31, 2008 from 7.14% for the three months ended March 31, 2007, primarily the result of emphasizing lower yielding and lower risk mortgage loan products. In addition, the overall yield on average earning assets decreased to 6.04% from 7.08% for the same period due to lower yielding loans and lower yielding federal funds sold.
Interest Expense. Interest expense for the three months ended March 31, 2008 was $1.0 million compared to $0.6 million for the same period in 2007, an increase of $0.4 million. The increase was primarily the result of an increase in both the average balance and average rate of certificate accounts. Average certificate accounts increased to $71.1 million for the three-month
31
Feldman Financial Advisors, Inc.
period ended March 31, 2008 from $41.7 million for the same period in 2007 and the average rate paid on certificates increased to 4.96% from 4.41%. It is noteworthy that the Bank has $46.7 million, or 61% of total certificates, that will mature from April 1, 2008 through December 31, 2008, which are costing an average rate of 5.08%. It is expected, but not certain, that these certificates would most likely be renegotiated at significantly lower rates, thus reducing the banks overall cost of funds and increasing its net interest margin.
Provision for Loan Losses. The Bank establishes an allowance for loan losses by charging amounts to the loan provision at a level required to reflect estimated credit losses in the loan portfolio. In evaluating the level of the allowance for loan losses, management considers, among other factors, historical loss experience, the types of loans and the amount of loans in the loan portfolio, adverse situations that may affect borrowers’ ability to repay, estimated value of any underlying collateral, prevailing economic conditions, and current factors.
Based on management’s evaluation of these factors, the provision for loan losses was $225,000 for the three months ended March 31, 2008 and 2007. Net charge-offs for the three months ended March 31, 2008 were $195,000 compared to $250,000 for the three month period ended March 31, 2007. For 2008, net charge-offs consisted of $85,000 for automobile loans, $94,000 for unsecured loans, and $16,000 for home equity loans. For the same period in 2007, net charge-offs consisted of $141,000 for automobile loans, and $109,000 for unsecured loans. Non-performing loans to total loans at March 31, 2008 were 1.20% compared to 0.30% at March 31, 2007. The allowance for loan losses to net loans receivable was 1.14% at March 31, 2008 compared to 1.25% at March 31, 2007.
32
Feldman Financial Advisors, Inc.
Non-interest Income. Non-interest income for the three months ended March 31, 2008 declined $107,000 to $524,000 compared to $631,000 for the same period in 2007. Loan fees and service charges on deposit accounts decreased by $39,000 and $57,000, respectively, for the three months ended March 31, 2008, compared to the three months ended March 31, 2007 due to a reduction in our fee schedule and the number of demand accounts.
Non-interest Expense. Non-interest expense for the three months ended March 31, 2008 was $1.9 million, compared to $1.8 million for the same period in 2007. The largest increase occurred in salaries and employee benefits, which was attributable to an increase in employees, normal merit pay increases as well as increased insurance costs. The number of full-time equivalent employees at March 31, 2008 was 81.
Income Taxes. For the three months ended March 31, 2008, the Bank recorded an income tax benefit of $157,000 on a before tax loss of $418,000. Due to credit unions being not-for-profit organizations, it was not subject to federal or state income taxes for the three months ended March 31, 2007. As a result of the charter conversion to a mutual savings bank on July 1, 2007, the Bank became a for-profit, taxable organization. Beginning July 1, 2007, earnings as a savings bank were subject to federal and state income taxes at a combined rate of 37.6%. Had earnings in 2007 been subject to income taxes, the Bank would have recorded tax expense of $47,000 and net earnings after income taxes would have been $78,000.
Comparison of Operating Results for the Years Ended December 31, 2007 and December 31, 2006
Net income for the year ended December 31, 2007 was $307,000 compared to net income of $921,000 for the year ended December 31, 2006. Absent a one-time $408,000 income tax
33
Feldman Financial Advisors, Inc.
benefit recorded upon conversion to a savings bank, the Bank would have recorded a loss for the year ended December 31, 2007 of $101,000. The earnings represent a return on average assets of 0.22% for fiscal year 2007 and 0.68% for fiscal year 2006.
The decrease in net income was due primarily to a decrease in the interest rate spread. The average yield on assets decreased to 6.81% for the year ended December 31, 2007 from 7.45% for the year ended December 31, 2006. This decline was expected due to a change in emphasis from higher risk and higher rate consumer automobile and unsecured lending to lower risk and lower yielding single-family mortgage lending. In addition, the average cost of liabilities increased to 3.12% for the year ended December 31, 2007 from 2.24% for the year ended December 31, 2006, primarily due to the higher cost of certificate of deposit accounts.
Net Interest Income. Net interest income decreased $1.4 million, or 19.4%, to $5.8 million in 2007 from $7.2 million in 2006 as the increase in the average balance of the loan portfolio was not enough to offset the lower rates earned on loans and the increased costs of deposits. The interest spread decreased to 3.69% for 2007 from 5.21% for 2006, while the average net interest margin declined to 4.37% at December 31, 2007 from 5.69% for 2006. The ratio of average interest earning assets to average interest bearing liabilities remained relatively stable at approximately 128% during 2007 and 2006.
Interest Income. Interest income for the year ended December 31, 2007 was $9.0 million compared to $9.4 million for the year ended December 31, 2006, a decrease of $363,000 or 3.9%. The decrease was primarily the result of lower average loan yields during 2007 partially offset by
34
Feldman Financial Advisors, Inc.
an increase in the average balance of loans. The yield on loans decreased to 7.01% for 2007 from 7.63% for 2006 primarily the result of emphasizing lower yielding and lower risk mortgage loan products.
Interest Expense. Interest expense for 2007 was $3.2 million compared to $2.2 million for 2006, an increase of $1.0 million or 46.1%. The increase was primarily the result of an increase in both the average balance and average rate of certificate accounts. Average certificate accounts increased to $51.8 million for 2007 from $39.0 million for 2006 and the average rate paid on certificates increased to 4.87% for 2007 from 3.80% for 2006.
Provision for Loan Losses. The provision for loan losses was $898,000 for 2007 and $897,000 for 2006. Net charge-offs in 2007 and 2006 remained relatively unchanged at $1.0 million. For 2007, net charge-offs consisted of $452,000 for automobile loans, $464,000 for unsecured loans, and $85,000 for home equity loans. For 2006, net charge-offs consisted of $536,000 for automobile loans, $382,000 for unsecured loans, $72,000 for one-to-four family mortgage loans, and $14,000 for other secured loans. Non-performing loans to total loans at December 31, 2007 were 1.10% compared to 0.38% at December 31, 2006. The allowance for loan losses to net loans receivable was 1.12% at December 31, 2007 compared to 1.28% at December 31, 2006.
Significant changes occurred in the composition of the loan portfolio during 2007 that permitted the provision for loan losses to remain relatively unchanged despite the increase in nonperforming loans and the size of the total loan portfolio. The more notable increases occurred in real estate mortgage loans which increased to 60.2% of total loans as of December 31, 2007 from 54.9% of total loans as of December 31, 2006. Conversely, automobile loans
35
Feldman Financial Advisors, Inc.
decreased to 12.8% from 17.5% of total loans at December 31, 2007 and 2006, respectively. In addition, unsecured loans decreased to 10.0% from 12.2% of total loans at December 31, 2007 and 2006, respectively. These changes in the composition of the loan portfolio were the result of stricter underwriting guidelines for automobile and unsecured lending due to the loss history and the emphasis on conforming mortgage lending. The changes in the composition of the loan portfolio as well as changes in underwriting standards were both considered in the analysis of the allowance for loan losses.
Non-interest Income. Non-interest income for 2007 declined $124,000, or 4.8%, to $2.4 million. Part of the decrease in non-interest income for 2007 was due to the elimination of the membership fee imposed on credit union members which was approximately $39,000 in 2006. In addition, loan fees and service charges on deposit accounts decreased by $38,000 and $108,000, respectively, for the year ended December 31, 2007, compared to the year ended December 31, 2006 due to a reduction in our fee schedule and the number of demand accounts.
Non-interest Expense. Non-interest expense for 2007 was $7.6 million, $322,000 or 4.1% less than the $7.9 million for 2006. The largest decreases occurred in professional fees and data processing services. The lower professional fees were primarily due to lower attorney and consultant fees associated with the conversion from a credit union to a savings bank. The lower cost of data processing services was due to the equipment and software being fully depreciated. The largest category of increase was in salaries and employee benefits which increased by $186,000 or 4.45%. This increase was attributable to an increase in employees, normal merit pay increases as well as increased insurance costs. The number of full-time equivalent employees at December 31, 2007 was 80, compared to 74 at December 31, 2006.
36
Feldman Financial Advisors, Inc.
Income Taxes. Due to credit unions being not-for-profit organizations, the Bank was not subject to federal or state income taxes for the year ended December 31, 2006 and the first six months of 2007. As a result of the charter conversion to a mutual savings bank on July 1, 2007, the Bank became a for-profit, taxable organization. On July 1, 2007, a deferred tax asset was recorded in the amount of $408,000 as a result of timing differences associated with depreciation of premises and equipment and the net operating loss carryforward. Beginning July 1, 2007, earnings as a savings bank were subject to federal and state income taxes at a combined rate of 37.6%. Had earnings in 2006 been subject to income taxes, the Bank would have recorded tax expense of $347,000 and net earnings after income taxes would have been $574,000.
37
Feldman Financial Advisors, Inc.
Interest Rate Risk Management
The rates of interest earned on assets and paid on liabilities generally are established contractually for a period of time. Market interest rates change over time. Loans generally have longer maturities than deposits. Accordingly, the results of operations, like those of other financial institutions, are impacted by changes in interest rates and the interest rate sensitivity of our assets and liabilities. The risk associated with changes in interest rates and the ability to adapt to these changes is known as interest rate risk and is the Bank’s most significant market risk. As of December 31, 2007, the Bank’s one-year cumulative interest rate sensitivity gap as a percentage of total assets was a negative 7.30%, which generally means if interest rates rise, net interest income could be reduced because interest paid on interest-bearing liabilities, including deposits and borrowings, could increase more quickly than interest received on interest-earning assets, including loans and other investments. In addition, rising interest rates may hurt income because they may reduce the demand for loans. In the alternative, if interest rates decrease, net interest income could increase.
As part of the Bank’s attempt to manage its exposure to changes in interest rates and comply with applicable regulations, the Bank monitors its interest rate risk. In monitoring interest rate risk, it continually analyzes and manages assets and liabilities based on their payment streams and interest rates, the timing of their maturities, and their sensitivity to actual or potential changes in market interest rates.
In order to minimize the potential for adverse effects of material and prolonged increases in interest rates on the results of operations, the Bank has adopted an asset and liability
38
Feldman Financial Advisors, Inc.
management policy to better match the maturities and repricing terms of interest-earning assets and interest-bearing liabilities. The board of directors sets the asset and liability policy of Sunshine Savings Bank, which is implemented by management. The asset and liability policy also establishes an ALCO committee which meets quarterly.
The purpose of this committee is to communicate, coordinate and control asset/liability management consistent with the business plan and board approved policies. The committee establishes and monitors the volume and mix of assets and funding sources taking into account relative costs and spreads, interest rate sensitivity and liquidity needs. The objectives are to manage assets and funding sources to produce results that are consistent with liquidity, capital adequacy, growth, risk, and profitability goals.
The committee generally meets on a quarterly basis to review, among other things, economic conditions and interest rate outlook, current and projected liquidity needs and capital position, anticipated changes in the volume and mix of assets and liabilities and interest rate risk exposure limits versus current projections pursuant to net present value of portfolio equity analysis and income simulations. The committee recommends appropriate strategy changes based on this review. The committee is responsible for reviewing and reporting on the effects of the policy implementations and strategies to the board of directors at least quarterly.
In order to manage assets and liabilities and achieve the desired liquidity, credit quality, interest rate risk, profitability and capital targets, the Bank has focused its strategies on:
| • | Originating adjustable rate home equity loans, |
| • | Originating a reasonable volume of short- and intermediate-term fixed rate loans, |
| • | Managing deposits to establish stable deposit relationships. |
39
Feldman Financial Advisors, Inc.
Depending on the level of general interest rates, the relationship between long- and short-term interest rates, market conditions and competitive factors, the committee may in the future determine to increase the interest rate risk position somewhat in order to maintain or increase the net interest margin. The Bank intends to continue its existing strategy of originating a mix of single-family fixed-rate mortgage loans, quarterly adjustable home equity lines of credit, and relatively short-term secured consumer loans.
The committee regularly reviews interest rate risk by forecasting the impact of alternative interest rate environments on net interest income and present value equity, which is defined as the net present value of an institution's existing assets and liabilities. The committee also valuates these impacts against the potential changes in net interest income and market value of portfolio equity that are monitored by the board of directors of Sunshine Savings Bank on a quarterly basis.
The Bank’s asset/liability management strategy sets limits on the change in present value equity (“PVE”) given certain changes in interest rates. Table 10 presents (as of December 31, 2007, the most current table available) forward-looking information about sensitivity to changes in interest rates. The table incorporates data from the interest rate risk model, Risk Analytics, as it relates to maturity repricing and repayment/withdrawal of interest-earning assets and interest-bearing liabilities. Interest rate risk is measured by changes in PVE for instantaneous parallel shifts in the yield curve in 100 basis point increments up and down 300 basis points. As illustrated in Table 10, Sunshine Savings Bank would benefit more from a decrease in market rates of interest than an increase. An increase in rates would negatively impact PVE as a result of deposit accounts more rapidly than loans due to the fixed rate nature of a large portion of our loan portfolio. As rates rise, the market value of fixed rate assets declines due to both the rate increases and slowing prepayments.
40
Feldman Financial Advisors, Inc.
As shown in Table 10, a rising interest rate scenario of 100 basis points would have a negative effect on the PVE. Under this scenario, PVE would decrease by 8.5% with a resulting PVE ratio of 12.87% of assets. In the event of a 200 basis point increase in interest rates, PVE would experience a 17.2% decrease with a resulting NPV ratio of 11.94%. A downward movement in market rates by 100 basis points would result in a positive impact on PVE of 2.5% as the PVE ratio measures 13.85% under this declining rate scenario.
Table 10
Present Value Equity Analysis
| December 31, 2007 | ||||||||||||||||||
Change in Interest Rates in | Present Value Equity | PVE | ||||||||||||||||
| Basis Points | Amount | $ Change | % Change | Ratio % | ||||||||||||||
| (Dollars in Thousands) | ||||||||||||||||||
| +300 | $ | 16,185 | $ | (5,425 | ) | (25.11 | ) | 11.07 | ||||||||||
| +200 | 17,888 | (3,722 | ) | (17.22 | ) | 11.94 | ||||||||||||
| +100 | 19,778 | (1,832 | ) | (8.48 | ) | 12.87 | ||||||||||||
| Base | 21,610 | - | - | 13.72 | ||||||||||||||
| -100 | 22,156 | 546 | 2.53 | 13.85 | ||||||||||||||
| -200 | 21,736 | 126 | 0.58 | 13.52 | ||||||||||||||
| -300 | 21,419 | (191 | ) | (0.88 | ) | 13.25 | ||||||||||||
Source: Sunshine Savings Bank, preliminary prospectus.
41
Feldman Financial Advisors, Inc.
Asset Quality
Table 11 provides information regarding the Bank’s non-performing loans and other non-performing assets. Tables 12 and 13 detail the Bank’s allowance for loan loss reserves and the allocation of the reserve among loan types for the periods ending March 31, 2008 and December 31, 2006 to 2007. At March 31, 2008, the allowance for loan losses totaled $1.5 million, non-performing loans totaled $1.7 million, and the ratio of allowance for loan losses to non-performing loans was 94.5%.
The Bank’s overall asset quality has begun to deteriorate slightly due to problems in the subprime portfolio. As of March 31, 2008, non-performing loans (“NPLs”) measured $1.5 million or 1.20% of total loans and 0.52% of total assets. The Bank had $135,000 of foreclosed assets at March 31, 2008. In comparison, non-performing loans totaled $452,000 or 0.80% of total assets at year-end 2006.
The Bank’s allowance for loan losses totaled $1.5 million at March 31, 2007, measuring 1.14% of total loans. The loan loss allowance was allocated as follows: $296,000 for residential mortgages, $122,000 for home equity loans, $365,000 for automobile loans, $570,000 for credit cards and $100,000 for other consumer loans.
42
Feldman Financial Advisors, Inc.
Table 11
Non-performing Asset Summary
As of December 31, 2006 to 2007 and March 31, 2008
| March 31, | December 31, | |||||||||||
| 2008 | 2007 | 2006 | ||||||||||
| Nonaccruing loans | (Dollars in thousands) | |||||||||||
| One- to four-family | $ | 1,214 | $ | 1,182 | $ | - | ||||||
| Home equity | 90 | 56 | 95 | |||||||||
| Automobile | 186 | 128 | 331 | |||||||||
| Credit cards and unsecured | 38 | 23 | 25 | |||||||||
| Deposit accounts | - | - | - | |||||||||
| Other | 10 | 10 | - | |||||||||
| Total | 1,538 | 1,399 | 452 | |||||||||
Foreclosed assets: | ||||||||||||
| One- to four-family | - | - | - | |||||||||
| Consumer | 135 | 243 | 266 | |||||||||
| Total | 135 | 243 | 266 | |||||||||
| Total nonperforming assets | $ | 1,673 | $ | 1,642 | $ | 718 | ||||||
| Total as a percentage of total assets | 1.00 | % | 1.05 | % | 0.53 | % | ||||||
Source: Sunshine Savings Bank, preliminary prospectus.
43
Feldman Financial Advisors, Inc.
Table 12
Allowance for Loan Loss Summary
As of December 31, 2006 to 2007 and March 31, 2008
Three Months Ended March 31, | Year Ended December 31, | |||||||||||||||
| 2008 | 2007 | 2007 | 2006 | |||||||||||||
| (Dollars in thousands) | ||||||||||||||||
| Balance at beginning of period | $ | 1,423 | $ | 1,526 | $ | 1,526 | $ | 1,633 | ||||||||
| Charge-offs: | ||||||||||||||||
| One- to- four-family | - | - | - | 72 | ||||||||||||
| Home equity | 16 | - | 85 | - | ||||||||||||
| Automobile | 104 | 168 | 538 | 778 | ||||||||||||
| Credit cards and unsecured | 113 | 133 | 543 | 553 | ||||||||||||
| Deposit accounts | - | - | - | - | ||||||||||||
| Other | - | - | - | 27 | ||||||||||||
| Total | 233 | 301 | 1,166 | 1,430 | ||||||||||||
Recoveries: | ||||||||||||||||
| One- to- four-family | - | - | - | - | ||||||||||||
| Home equity | - | - | - | - | ||||||||||||
| Automobile | 19 | 27 | 86 | 242 | ||||||||||||
| Credit cards and unsecured | 19 | 24 | 79 | 171 | ||||||||||||
| Deposit accounts | - | - | - | - | ||||||||||||
| Other | - | - | - | 13 | ||||||||||||
| Total | 38 | 51 | 165 | 426 | ||||||||||||
| Net charge-offs | 195 | 251 | 1,001 | 1,004 | ||||||||||||
| Additions charged to operations | 225 | 225 | 898 | 897 | ||||||||||||
| Balance at end of period | $ | 1,453 | $ | 1,500 | $ | 1,423 | $ | 1,526 | ||||||||
| Ratio of net charge-offs during the period to | 0.16 | % | 0.21 | % | % | % | ||||||||||
| average loans outstanding during the period | 0.82 | 0.87 | ||||||||||||||
| Ratio of net charge-offs during the period to | 13.28 | % | 62.34 | % | % | % | ||||||||||
| average nonperforming assets | 212.53 | 135.13 | ||||||||||||||
| Allowance as a percentage of nonperforming | 94.47 | % | 414.36 | % | % | % | ||||||||||
| loans | 101.64 | 337.61 | ||||||||||||||
| Allowance as a percentage of total loans | 1.14 | % | 1.25 | % | % | % | ||||||||||
| (end of period) | 1.12 | 1.28 | ||||||||||||||
Source: Sunshine Savings Bank, preliminary prospectus.
44
Feldman Financial Advisors, Inc.
Table 13
Allocation of Allowance for Loan Losses
As of December 31, 2006 to 2007 and March 31, 2008
| December 31, | ||||||||||||||||||||||||
| March 31, 2008 | 2007 | 2006 | ||||||||||||||||||||||
| Amount | Percent of loans in each category to total loans | Amount | Percent of loans in each category to total loans | Amount | Percent of loans in each category to total loans | |||||||||||||||||||
| One- to four-family | $ | 296 | 61.32 | % | $ | 298 | 60.15 | % | $ | 114 | 54.88 | % | ||||||||||||
| Home equity | 122 | 14.91 | 84 | 14.98 | 44 | 13.02 | ||||||||||||||||||
| Automobile | 365 | 11.54 | 412 | 12.78 | 645 | 17.53 | ||||||||||||||||||
| Credit cards and unsecured | 570 | 9.30 | 512 | 9.96 | 586 | 12.17 | ||||||||||||||||||
| Deposit accounts | - | 1.19 | - | 1.42 | - | 1.66 | ||||||||||||||||||
| Other consumer | 100 | 1.74 | 117 | 0.71 | 136 | 0.74 | ||||||||||||||||||
| $ | 1,453 | 100.00 | % | $ | 1,423 | 100.00 | % | $ | 1,525 | 100.00 | % | |||||||||||||
Source: Sunshine Savings Bank, preliminary prospectus.
Management, in compliance with federal guidelines, has instituted an internal loan review program, whereby non-performing loans are classified as special mention, substandard, doubtful or loss. It is our policy to review the loan portfolio, in accordance with regulatory classification procedures, on at least a quarterly basis. When a loan is classified as substandard or doubtful, management is required to evaluate the loan for impairment. When management classifies a portion of a loan as loss, a reserve equal to 100% of the loss amount is required to be established or the loan is to be charged-off.
An asset that does not currently expose the Bank to a sufficient degree of risk to warrant an adverse classification, but which possesses credit deficiencies or potential weaknesses that deserve management’s close attention is classified as “special mention.”
An asset classified as “substandard” is inadequately protected by the current net worth and paying capacity of the obligor or the collateral pledged, if any. Assets so classified have
45
Feldman Financial Advisors, Inc.
well-defined weaknesses and are characterized by the distinct possibility that the Bank will sustain some loss if the deficiencies are not corrected.
An asset classified as “doubtful” has all the weaknesses inherent in a “substandard” asset with the added characteristic that the weaknesses make collection or liquidation in full, on the basis of currently existing facts, conditions, and values, highly questionable and improbable. The possibility of a loss on a doubtful asset is high.
That portion of an asset classified as “loss” is considered uncollectible and of such little value that it’s continuance as an asset, without establishment of a specific valuation or charge-off, is not warranted. This classification does not necessarily mean that an asset has absolutely no recovery or salvage value; but rather, it is not practical or desirable to defer writing off a basically worthless asset even though partial recovery may be effected in the future.
The Bank regularly reviews the problem assets in portfolio to determine whether any assets require classification in accordance with applicable regulations. On the basis of management's review of assets, at March 31, 2008, the Bank had classified $2.0 million of loans as substandard or doubtful, of which $1.7 million was included in non-performing assets and of which $1.8 million were to subprime borrowers. This total amount of classified assets represented 10.9% of equity capital and 1.1% of assets at March 31, 2008.
46
Feldman Financial Advisors, Inc.
Market Area
The Company and the Bank are headquartered in Tallahassee, Florida, and operate four retail banking offices in Leon County and one retail office in Broward County. The Bank’s considers its principal lending and savings market area to be the metropolitan Tallahassee region. Leon County is in located in north Florida and is bordered by the state of Georgia to the north.
Tallahassee is located in Leon County and is the capital city for the state of Florida. As the Bank’s primary market area encompasses the state capital, the economy and business environment is heavily influenced by government services. Tallahassee is also the home to several universities, including Florida State University, Florida A&M University and the Tallahassee Community College.
The primary business of the Bank of attracting deposits and making loans is primarily conducted within its market area. A downturn in the local economy could reduce the amount of funds available for deposit and the ability of borrowers to repay their loans.
The Company operates in a market area with a high concentration of banking and financial institutions, and we face substantial competition in attracting deposits and in originating loans. A number of competitors are significantly larger institutions with greater financial and managerial resources and lending limits. The Company’s ability to compete successfully is a significant factor affecting growth potential and profitability.
Table 14 displays selected demographic data for the United States, the state of Florida, Leon County and the city of Tallahassee.
47
Feldman Financial Advisors, Inc.
Table 14
Selected Demographic Data
United States, Florida, Leon County and City of Tallahassee
United States | State of Florida | Leon County | City of Tallahassee | |||||||||||||
| Total Population | ||||||||||||||||
| 2007 - Current | 306,438,230 | 18,893,813 | 268,888 | 165,158 | ||||||||||||
| % Change 2000-07 | 8.9 | % | 18.1 | % | 12.3 | % | 9.7 | % | ||||||||
| % Change 2007-12 | 6.3 | % | 12.8 | % | 7.8 | % | 6.8 | % | ||||||||
| Age Distribution, 2007 | ||||||||||||||||
| 0 - 14 Age Group | 21.4 | % | 17.7 | % | 16.2 | % | 13.7 | % | ||||||||
| 15 -34 Age Group | 28.1 | % | 24.5 | % | 39.1 | % | 47.6 | % | ||||||||
| 35 -54 Age Group | 29.4 | % | 28.1 | % | 26.0 | % | 21.9 | % | ||||||||
| 55+ Age Group | 21.1 | % | 29.7 | % | 18.8 | % | 16.9 | % | ||||||||
| Median Age (years) | 36.7 | 41.0 | 30.6 | 27.4 | ||||||||||||
| Total Households | ||||||||||||||||
| 2007 - Current | 115,337,039 | 7,510,601 | 112,082 | 72,019 | ||||||||||||
| % Change 2000-07 | 9.3 | % | 18.5 | % | 16.1 | % | 13.9 | % | ||||||||
| % Change 2007-12 | 6.5 | % | 13.2 | % | 8.9 | % | 8.1 | % | ||||||||
| Median Household Net Worth | $ | 105,518 | $ | 103,411 | $ | 59,705 | $ | 29,344 | ||||||||
| Average Household Income | ||||||||||||||||
| 2007 - Current | $ | 73,126 | $ | 67,857 | $ | 64,522 | $ | 56,140 | ||||||||
| % Change 2000-07 | 29.1 | % | 26.8 | % | 26.5 | % | 28.2 | % | ||||||||
| % Change 2007-12 | 21.3 | % | 20.7 | % | 19.8 | % | 19.9 | % | ||||||||
| Median Household Income | ||||||||||||||||
| 2007 - Current | $ | 53,154 | $ | 48,591 | $ | 46,739 | $ | 37,958 | ||||||||
| % Change 2000-07 | 26.1 | % | 25.1 | % | 24.3 | % | 24.1 | % | ||||||||
| % Change 2007-12 | 17.6 | % | 17.1 | % | 17.0 | % | 15.2 | % | ||||||||
| Per Capita Income | ||||||||||||||||
| 2007 - Current | $ | 27,916 | $ | 27,311 | $ | 27,618 | $ | 25,541 | ||||||||
| % Change 2000-07 | 29.3 | % | 26.7 | % | 31.4 | % | 34.6 | % | ||||||||
| % Change 2007-12 | 21.3 | % | 20.8 | % | 20.7 | % | 20.8 | % | ||||||||
Source: SNL Financial and ESRI.
48
Feldman Financial Advisors, Inc.
The median household income level for Leon County was just below comparable demographic data for Florida and the United States. The median household income for Leon County was estimated at $46,739 in 2007, as compared to the state median household income level of $48,591 and the national median household income level of $53,154. The median household income for Tallahassee was well below these figures at $37,958, due in part to the large numbers of college students living within the city. With a median age of 30.6 years, Leon County has a much younger population than either the state at 41.0 years or the United States at 36.7 years.
Table 15 details the largest private employers in the county. As indicated by the tables, the economy of Leon County is primarily government and educational services based.
Table 15
Largest Employers - Leon County
| Employer | Employees | |||||||
| State of Florida | 25,000 | |||||||
| Florida State University | 8,800 | |||||||
| Leon County schools | 4,400 | |||||||
| City of Tallahassee | 3,300 | |||||||
| Tallahassee Memorial Healthcare | 2,850 | |||||||
| Florida A&M University | 2,700 | |||||||
| Publix Supermarket | 2,000 | |||||||
| Leon County | 1,500 | |||||||
| Tallahasee Community College | 1,100 | |||||||
| Tallahassee Leon County Civic Center | 670 | |||||||
Source: Leon County Economic Development Council.
Table 16 summarizes deposit market data for all commercial banks and thrift institutions with offices in Leon County, Florida. Based on deposit data as of June 30, 2007 and adjusted for any subsequent merger transactions, the Bank ranked twelfth in deposit market share among the financial institutions operating in the County. As of such date, the Bank had total deposits of
49
Feldman Financial Advisors, Inc.
$125.7 million in the county, which reflected a 3.0% market share based on the area’s total deposits of $4.3 billion. Three large regional commercial banks occupied three of the top four in market share rankings of deposits in Leon County. Bank of America Corp., Wachovia Corp., and SunTrust Banks, Inc. held market shares of 13.1%, 13.0%, and 12.7%, respectively. Capital City Bank Group, Inc. had the largest deposit market share at 15.7%. Capital City Bank Group, Inc. is headquartered in Tallahassee.
Table 16
Deposit Market Share
Data as of June 30, 2006 and 2007
(adjusted for completed and announced mergers)
| Leon, FL | |||||||||||
| 2007 | 2006 | ||||||||||
| Rank | Total Branches | Total Deposits | Market Share | Total Deposits | Market Share | ||||||
| 2007 | 2006 | Institution (ST) | Type | ||||||||
| 1 | 1 | Capital City Bank Group Inc. (FL) | Bank | 17 | 669,839 | 15.72 | 718,947 | 17.50 | |||
| 2 | 2 | Bank of America Corp. (NC) | Bank | 7 | 557,780 | 13.09 | 603,295 | 14.68 | |||
| 3 | 4 | Wachovia Corp. (NC) | Bank | 8 | 554,238 | 13.01 | 499,943 | 12.17 | |||
| 4 | 3 | SunTrust Banks Inc. (GA) | Bank | 9 | 539,054 | 12.65 | 562,120 | 13.68 | |||
| 5 | 5 | Synovus Financial Corp. (GA) | Bank | 4 | 312,252 | 7.33 | 290,207 | 7.06 | |||
| 6 | 6 | Regions Financial Corp. (AL) | Bank | 5 | 297,537 | 6.98 | 289,291 | 7.04 | |||
| 7 | 7 | Premier Bank Holding Co. (FL) | Bank | 6 | 291,745 | 6.85 | 250,712 | 6.10 | |||
| 8 | 12 | BB&T Corp. (NC) | Bank | 1 | 207,784 | 4.88 | 115,048 | 2.80 | |||
| 9 | 8 | Wakulla Bancorp (FL) | Bank | 9 | 204,343 | 4.80 | 195,778 | 4.76 | |||
| 10 | 9 | FMB Banking Corp. (FL) | Bank | 6 | 177,431 | 4.16 | 161,762 | 3.94 | |||
| 12 | 11 | Sunshine Savings Bank (FL) | Thrift | 4 | 125,669 | 2.95 | 119,987 | 2.92 | |||
| All Other Institutions | 18 | 322,995 | 7.58 | 301,746 | 7.35 | ||||||
| Total For Institutions In Market | 94 | 4,260,667 | 100.00 | 4,108,836 | 100.00 | ||||||
Source: SNL Financial.
50
Feldman Financial Advisors, Inc.
Summary Outlook
The overall earnings outlook of the Company (without the benefit of the conversion proceeds) remains slightly unfavorable due to high levels of non-interest income and problems related to the subprime loan portfolio, coupled with a declining net interest margin. Earnings have been constrained since the conversion from a credit union due to the deteriorating net interest margin.
Management of the Company intends that the offering proceeds will provide capital to enable growth and improve profitability. Attention will be paid to building the core banking business through internal growth and de novo branching, and the Company will also actively consider expansion opportunities such as the acquisition of other financial institutions or financial services companies.
51
Feldman Financial Advisors, Inc.
II. COMPARISONS WITH PUBLICLY HELD THRIFTS
General Overview
The comparative market approach provides a sound basis for determining estimates of going-concern valuations where a regular and active market exists for the stocks of peer institutions. The comparative market approach was utilized in determining the estimated pro forma market value of the Company because: (i) reliable market and financial data are readily available for comparable institutions; (ii) the comparative market method is required by the applicable regulatory guidelines; and (iii) other alternative valuation methods (such as income capitalization, liquidation analysis, or discounted cash flow) are unlikely to produce a valuation relevant to the future trading patterns of the related equity interest. The generally employed valuation method in initial public offerings, where possible, is the comparative market approach, which also can be relied upon to determine pro forma market value in a thrift stock conversion.
The comparative market approach derives valuation benchmarks from the trading patterns of selected peer institutions which, due to certain factors such as financial performance and operating strategies, enable the appraiser to estimate the potential value of the subject institution in a stock conversion offering. The pricing and trading history of recent initial public offerings of thrifts are also examined to provide evidence of the “new issue discount” that must be considered. In Chapter II, our valuation analysis focuses on the selection and comparison of the Company with a comparable group of publicly traded thrift institutions (the “Comparative Group”). Chapter III will detail any additional discounts or premiums that we believe are appropriate to the Company’s pro forma market value.
52
Feldman Financial Advisors, Inc.
Selection Criteria
Selected market price and financial performance data for thrifts listed on the New York and American Stock Exchanges and those thrifts traded on the NASDAQ over-the-counter (“OTC”) markets are shown in Exhibit III. Several criteria, discussed below, were used to select the individual members of the Comparative Group from the overall universe of publicly held thrifts.
| · | Operating characteristics – An institution's operating characteristics are the most important factors because they affect investors’ expected rates of return on a company’s stock under various business/economic scenarios, and they influence the market’s general perception of the quality and attractiveness of a given company. Operating characteristics, which may vary in importance during the business cycle, include financial variables such as profitability, balance sheet growth, capitalization, asset quality, and other factors such as lines of business and management strategies. |
| · | Degree of marketability and liquidity – Marketability of a stock reflects the relative ease and promptness with which a security may be sold when desired, at a representative current price, without material concession in price merely because of the necessity of sale. Marketability also connotes the existence of buying interest as well as selling interest and is usually indicated by trading volumes and the spread between the bid and asked price for a security. Liquidity of the stock issue refers to the organized market exchange process whereby the security can be converted into cash. We attempted to limit our selection to companies that have access to a regular trading market or price quotations. We eliminated from the comparative group companies with market prices that were materially influenced by publicly announced or widely rumored acquisitions. However, the expectation of continued industry consolidation is currently embedded in thrift equity valuations. |
| · | Geographic Location – The region of the country where a company operates is also of importance in selecting the comparative group. The operating environment for thrift institutions varies from region to region with respect to business and economic environments, real estate market conditions, speculative takeover activity, and investment climates. Economic and investor climates can also vary greatly within a region, particularly due to takeover activity. |
53
Feldman Financial Advisors, Inc.
The operations of the Company fit the general profile of a thrift institution, concentrated on retail banking in its local market and simultaneously expanding its market presence in the commercial arena. Residential mortgages remain the core product in the Company’s loan portfolio.
In determining the Comparative Group composition, we focused on the Company’s corporate structure, location, asset size, profitability, and equity level. As with any composition of a group of comparable companies, the selection criteria were broadened sufficiently to assemble a meaningful number of members for inclusion. Specifically, we first applied the following selection criteria:
| · | Publicly traded thrift – stock-form thrift whose shares are traded on a major stock exchange, listed on NASDAQ or traded over the counter. |
| · | Non-acquisition target – company is not subject to a pending acquisition. |
| · | Mutual holding company – company’s stock ownership interest is held in whole or in part by a mutual holding company, and is not currently undertaking a “second-step” conversion offering. |
| · | Current financial data – publicly reported financial data available for the most recent last twelve months (“LTM”) ending March 31, 2008. |
| · | Asset size – total assets of between $100 million and $300 million. |
| · | Geographic location – emphasis on institutions located in the Southeast and Mid-Atlantic. |
| · | Capitalization – equity to assets ratio greater than or equal to 10.0%. |
| · | Profitability measure – net income less than 0.70% relative to average assets for the LTM period ending March 31, 2008. |
54
Feldman Financial Advisors, Inc.
As a result of applying the above criteria, the screening process produced a group of eight publicly traded thrifts with operations comparable to those of the Company, with five of the eight located in the Mid-Atlantic region and the other three located in the Midwest. In order to include institutions in the Southeast, we expanded are criteria to allow for the inclusion of Heritage Financial Group, which is larger than our original search criteria, and Wake Forest Bancshares, which earns a higher level of returns. A general operating summary of these ten members selected for the Comparative Group is presented in Table 22.
In focusing on mutual holding companies with limited or lacking profitability, we identified a sufficient number of companies meeting the overall selection criteria. The companies in the Comparative Group were selected from the Mid-Atlantic region (including two in New York, two in Maryland and one in Pennsylvania), three in the Midwest (one from Illinois, one from Kentucky, and one from Indiana) and two from the Southeast (one from Georgia and one from North Carolina). The asset sizes of the selected companies range from $108.6 at Wake Forest Bancshares, Inc. (MHC) to $484.4 million at Heritage Financial Group (MHC). The median asset size of the Comparative Group was $184.7 million, slightly larger than the Company’s asset size of $167.41 million.
In comparison to recent performance trends of the aggregate public thrift industry, the Comparative Group companies generally exhibited below-average profitability ratios, lower net interest margins, slightly higher capital ratios, and lower levels of problem assets. While some differences inevitably may exist between the Company and the individual companies, we believe that the chosen Comparative Group on the whole provides a meaningful basis of financial comparison for valuation purposes.
55
Feldman Financial Advisors, Inc.
| Table 17 | |||||||
| Comparative Group Operating Summary | |||||||
| As of March 31, 2008 | |||||||
| Company | City | State | No. of Offices | Initial Conversion Date | Total Assets ($000s) | Equity/ Assets (%) | |
| Sunshine Savings Bank | Tallahassee | FL | 4 | NA | 167,447 | 10.47 | |
| BV Financial, Inc. (MHC) | Baltimore | MD | 5 | 01/14/05 | 164,189 | 10.26 | |
| FSB Community Bankshares, Inc. (MHC) | Fairport | NY | 3 | 08/15/07 | 193,034 | 10.38 | |
| Heritage Financial Group (MHC) | Albany | GA | 8 | 06/30/05 | 484,407 | 13.48 | |
| Kentucky First Federal Bancorp (MHC) | Hazard | KY | 4 | 03/03/05 | 253,513 | 23.79 | |
| Mid-Southern Savings Bank, FSB (MHC) | Salem | IN | 3 | 04/09/98 | 176,427 | 10.20 | |
| Ottawa Savings Bancorp, Inc. (MHC) | Ottawa | IL | 1 | 07/15/05 | 209,660 | 10.44 | |
| Polonia Bancorp (MHC) | Huntingdon Valley | PA | 5 | 01/16/07 | 200,744 | 12.07 | |
| Seneca-Cayuga Bancorp, Inc. (MHC) | Seneca Falls | NY | 4 | 07/11/06 | 151,338 | 12.27 | |
| SFSB, Inc. (MHC) | Bel Air | MD | 2 | 12/31/04 | 175,198 | 12.44 | |
| Wake Forest Bancshares, Inc. (MHC) | Wake Forest | NC | 1 | 04/03/96 | 108,625 | 18.86 | |
| Source: Sunshine Savings Bank; SNL Financial; Feldman Financial. | |||||||
56
Feldman Financial Advisors, Inc.
Recent Financial Comparisons
Table 18 summarizes certain key financial comparisons between the Company and the Comparative Group. Tables 19 through 23 contain the detailed financial comparisons of the Company with the individual Comparative Group companies based on measures of profitability, income and expense components, yield-cost structure, capital levels, credit risk, balance sheet composition, and growth rates. Financial data for the Company, the Comparative Group, and All Public Thrift aggregate were utilized as of or for the most recent available LTM period ending March 31, 2008.
The Company’s LTM return on average assets was a negative 0.05%, reflecting a profitability measure below the Comparative Group median of 0.21% and well below the All Public Thrift median of 0.49%. The Company’s earnings were aided by a tax benefit related to the conversion from a credit union. Eliminating the tax benefit, the Company earned a return on assets of (0.36)%. The Company’s comparatively weaker earnings level was attributable mainly to its considerably higher levels of non-interest expense and provision for loan losses. Those offset the Company’s advantage gained through it’s higher than average level of net interest income and non-interest income. The Company’s LTM return on average equity at (0.45%) was also below the Comparative Group median of 1.06% and the All Public Thrift median of 4.01%.
The Company’s net interest income level of 3.39% relative to average assets was positioned above the Comparative Group median of 2.46% and the All Public Thrift median of 2.75%. The Company’s higher level of net interest income production was attributable to its lower level of interest expense during the period as compared to the Comparative Group and All Public Thrift Group medians.
57
Feldman Financial Advisors, Inc.
The Company’s earning asset yield measured 6.54% and exceeded the Comparative Group median of 5.69% and the All Public Thrift median of 6.38%. The Company’s higher asset yield resulted from having a larger concentration of non-mortgage loans, which carry a higher yield than residential mortgage loans, as a percentage of total loans as compared to the Comparative Group and the All Public Thrift Group. The Company’s ratio of non-mortgage loans to total loans measured 38.7% compared to the Comparative Group median of 9.4% and the All Public Thrift Group median of 8.8%. The Company’s ratio of residential mortgages to total loans measured 60.8% as compared to medians of 71.1% for the Comparative Group and 47.3% for the All Public Thrift Group. In addition to the Company’s yield on earning assets being higher than both the Comparative Group and the All Public Thrift Group, its cost of interest-bearing liabilities at 3.32% was below the Comparative Group median of 3.75% and the All Public Thrift median of 3.92%. The Company’s liability costs reflect its significant level of deposits as a source of funds as opposed to the Comparative Group and All Public Thrifts higher reliance upon borrowings as deposits generally bear lower rates than higher-costing borrowings. In addition, the Company benefits from a significant portion of the deposit portfolio being noninterest bearing deposits. The Company’s level of borrowed funds was well below the Comparative Group and All Public Group’s median debt utilization. Borrowings measured 0.0% of the Company’s assets and 7.6% for the Comparative Group median and 20.1% for the All Public Thrift median.
58
Feldman Financial Advisors, Inc.
| Table 18 | ||||||||||||||
| Key Financial Comparisons | ||||||||||||||
| Sunshine Savings Bank and the Comparative Group | ||||||||||||||
| As of or for the Last Twelve Months Ended March 31, 2008 | ||||||||||||||
| Sunshine | Comp. | All Public | ||||||||||||
| Savings | Group | Thrift | ||||||||||||
| Bank | Median | Median | ||||||||||||
| Profitability | ||||||||||||||
| LTM Return on Average Assets | (0.05) | % | 0.21 | % | 0.49 | % | ||||||||
| LTM Return on Average Equity | (0.45) | 1.06 | 4.01 | |||||||||||
| Core Return on Average Assets | (0.36) | 0.09 | 0.48 | |||||||||||
| Core Return on Average Equity | (3.12) | 0.70 | 3.81 | |||||||||||
Income and Expense (% of avg. assets) | ||||||||||||||
| Total Interest Income | 5.67 | 5.55 | 5.92 | |||||||||||
| Total Interest Expense | 2.28 | 3.22 | 3.26 | |||||||||||
| Net Interest Income | 3.39 | 2.46 | 2.75 | |||||||||||
| Provision for Loan Losses | 0.56 | 0.04 | 0.13 | |||||||||||
| Other Operating Income | 1.47 | 0.19 | 0.54 | |||||||||||
| Net Gains and Nonrecurring Income | 0.00 | 0.00 | 0.05 | |||||||||||
| General and Administrative Expense | 4.80 | 2.22 | 2.65 | |||||||||||
| Intangibles Amortization Expense | 0.00 | 0.00 | 0.00 | |||||||||||
| Nonrecurring Expense | 0.00 | 0.00 | 0.00 | |||||||||||
| Pre-tax Core Earnings | (0.51) | 0.15 | 0.72 | |||||||||||
| Efficiency Ratio | 99.24 | 85.54 | 70.15 | |||||||||||
| Yield-Cost Data | ||||||||||||||
| Yield on Interest-earning Assets | 6.54 | 5.69 | 6.38 | |||||||||||
| Cost of Interest-bearing Liabilities | 3.32 | 3.75 | 3.92 | |||||||||||
| Net Interest Spread | 3.23 | 3.05 | 2.57 | |||||||||||
Asset Utilization (% of avg. total assets) | ||||||||||||||
| Avg. Interest-earning Assets | 91.75 | 92.63 | 90.90 | |||||||||||
| Avg. Interest-bearing Liabilities | 72.67 | 75.55 | 80.72 | |||||||||||
| Avg. Net Interest-earning Assets | 19.08 | 10.88 | 9.46 | |||||||||||
59
Feldman Financial Advisors, Inc.
| Table 18 (continued) | ||||||||||
| Key Financial Comparisons | ||||||||||
| Sunshine Savings Bank and the Comparative Group | ||||||||||
| As of or for the Last Twelve Months Ended March 31, 2008 | ||||||||||
| Sunshine | Comp. | All Public | ||||||||
| Savings | Group | Thrift | ||||||||
| Bank | Median | Median | ||||||||
Balance Sheet Composition (% of total assets) | ||||||||||
| Cash and Securities | 20.44 | % | 21.82 | % | 20.48 | % | ||||
| Loans Receivable, net | 75.42 | 72.50 | 72.76 | |||||||
| Real Estate | 0.00 | 0.03 | 0.06 | |||||||
| Intangible Assets | 0.00 | 0.00 | 0.34 | |||||||
| Other Assets | 4.15 | 3.67 | 4.18 | |||||||
| Total Deposits | 88.90 | 78.55 | 67.02 | |||||||
| Borrowed Funds | 0.00 | 7.59 | 20.09 | |||||||
| Other Liabilities | 0.63 | 1.06 | 1.02 | |||||||
| Total Equity | 10.47 | 12.17 | 9.13 | |||||||
Loan Portfolio (% of total loans) | ||||||||||
| Residential Mortgage Loans | 60.76 | 71.05 | 47.28 | |||||||
| Other Real Estate Mortgage Loans | 15.47 | 18.29 | 43.96 | |||||||
| Non-mortgage Loans | 23.77 | 9.40 | 8.76 | |||||||
| Growth Rates | ||||||||||
| Total Assets | 25.35 | 1.89 | 5.39 | |||||||
| Total Loans | 3.14 | 8.26 | 7.38 | |||||||
| Total Deposits | 29.04 | 1.63 | 2.43 | |||||||
| Regulatory Capital Ratios | ||||||||||
| Tier 1 Leverage Ratio | 9.94 | 10.06 | 8.49 | |||||||
| Tier 1 Risk-based Capital | 15.54 | 16.67 | 12.50 | |||||||
| Total Risk-based Capital | 16.79 | 17.36 | 13.20 | |||||||
| Credit Risk Ratios | ||||||||||
| Non-performing Loans / Total Loans | 1.20 | 0.55 | 0.76 | |||||||
| Non-performing Assets / Total Assets | 1.00 | 0.92 | 0.62 | |||||||
| Reserves / Total Loans | 1.14 | 0.44 | 0.97 | |||||||
| Reserves / Non-performing Assets | 86.85 | 79.47 | 85.28 | |||||||
Source: Sunshine Savings Bank; SNL Financial; Feldman Financial.
60
Feldman Financial Advisors, Inc.
The Company’s non-interest operating income totaled 1.47% of average assets, outperforming the Comparative Group and All Public Thrift medians of 0.19% and 0.54%, respectively. Fees and service charges on deposit accounts were the largest contributor to the Company’s non-interest revenue.
The Company’s provision for loan losses measured 0.56% of average assets, as compared to the Comparative Group median of 0.04% and the All Public Thrift median of 0.13%. The Company’s non-performing asset ratio measured 1.00% of total assets versus the Comparative Group median of 0.92% and All Public Thrift median of 0.62%. In keeping with the Company’s higher non-performing asset ratio relative to total assets, its non-performing loan ratio as a percent of total loans was 1.20% and was above the corresponding Comparative Group median of 0.55% and All Public Thrift median of 0.76%. The Company is experiencing problems related to its portfolio of subprime loans. The Company maintained a slightly higher level of loan loss reserves at 1.14% of total loans versus the Comparative Group median of 0.44% and the All Public Thrift median of 0.97% and a comparable level of reserves as a percentage of non-performing assets of 86.9% compared to the Comparative group median of 79.5% and the All Public Thrift Group median of 85.3%.
The Company’s operating expense ratio was higher than the Comparative Group and All Public Thrift Group medians. The Company’s general and administrative expense ratio measured 4.80% compared to the Comparative Group median of 2.22% and the All Public Thrift median of 2.65%.
61
Feldman Financial Advisors, Inc.
The Company’s balance sheet composition was similar to both the Comparative and All Public Thrift Groups. Net loans amounted to 75.4% of assets at the Company as of March 31, 2008, versus 72.5% for the Comparative Group median and 72.8% for the All Public Thrift Group median. Cash and securities aggregated 20.4% of assets at the Company, compared to a median of 21.8% for the Comparative Group and 20.5% for the All Public Thrift Group. The Company had intangible assets totaling 0.00% of total assets compared to the Comparative Group median of 0.00% and the All Public Group median of 0.34%. Other assets, excluding intangibles and foreclosed real estate, composed 4.2% of the Company’s assets versus the Comparative Group median of 3.7% and the All Public Thrift Group median of 4.2%. The Company’s other assets primarily comprised of $3.6 million of premises and equipment (2.1% of total assets) and $728,000 in deferred tax assets (0.4% of total assets).
The Company had no outstanding borrowings at March 31, 2008. The Comparative Group is characterized by companies with borrowing activity slightly below to the overall thrift industry as demonstrated by the median debt level of 7.6% of total assets versus the All Public Thrift median of 20.1%. The Company’s equity level before the Stock Offering was 10.5% relative to assets, which was below the Comparative Group median of 12.2%. The Company’s risk-based capital ratios were also positioned below the corresponding medians of the Comparative Group, reflecting the Company’s lower capital level.
The Company has experienced a growth in its deposit portfolio and this growth is reflected in the growth of the balance sheet. The Company’s deposit portfolio increased by 29.0% during the period while the Comparative Group experienced a median deposit portfolio growth rate of 2.8% and the All Public Thrift Group experienced growth of 2.2%. The overall
62
Feldman Financial Advisors, Inc.
asset growth rate for the Company was 25.4% and exceeded the Comparative Group median of 0.50% and the All Public Thrift Group median of 4.3%. Loan growth at the Company was trailed deposit and asset growth and totaled 3.1%, compared to the Comparative Group median of 8.1% and the Al Public Thrift Group median of 6.1%. We note that the Company’s growth rates are for the six month period ended March 31, 2008 annualized while the Comparative Group and the All Public Thrift Group is measured over the trailing twelve months.
In summary, the Company’s recent earnings performance trailed the results attained by the Comparative Group and All Public Thrift aggregate when based on returns on assets and equity, due to the Company’s lower level of profitability. The Company’s profitability was hampered by a higher level of non-interest expense and loan loss provisions. The Company’s net interest income and higher level of operating income were not sufficient to offset the higher operating expense ratio. Management believes that the competition in the banking and financial services industry in Florida is intense and that many of its competitors have substantially greater resources and lending limits than the Company do and offer services that it does not or cannot provide. Price competition for loans might result in the Company originating fewer loans, or earning a lower rate of return the loan portfolio, while price competition for deposits might result in a decrease in total deposits or higher rates paid on customer’s deposits, impacting the profitability of the Company in the future.
63
Feldman Financial Advisors, Inc.
| Table 19 | ||||||||||
| General Financial Performance Ratios | ||||||||||
| As of or for the Latest Twelve Months Ended March 31, 2008 |
Total Assets ($000s) | Total Deposits ($000s) | Total Equity/ Assets (%) | Tang. Equity/ Assets (%) | Net Interest Margin (%) | Effcy. Ratio (%) | LTM ROA (%) | LTM ROE (%) | Core ROA (%) | Core ROE (%) | |||||||||||||||||||||||||||||||
| Sunshine Savings Bank | 167,447 | 148,860 | 10.47 | 10.47 | 3.91 | 99.24 | (0.05 | ) | (0.45 | ) | (0.36 | ) | (3.12 | ) | ||||||||||||||||||||||||||
| Comparative Group Average | 211,714 | 154,373 | 13.42 | 13.19 | 2.59 | 83.70 | 0.33 | 2.29 | 0.29 | 1.76 | ||||||||||||||||||||||||||||||
| Comparative Group Median | 184,731 | 137,197 | 12.17 | 12.07 | 2.35 | 85.54 | 0.21 | 1.06 | 0.09 | 0.70 | ||||||||||||||||||||||||||||||
| All Public Thrift Average | 6,522,039 | 3,812,569 | 11.16 | 10.08 | 2.91 | 74.90 | 0.28 | 2.25 | 0.29 | 2.46 | ||||||||||||||||||||||||||||||
| All Public Thrift Median | 886,849 | 634,120 | 9.13 | 7.97 | 2.96 | 70.15 | 0.49 | 4.01 | 0.48 | 3.81 | ||||||||||||||||||||||||||||||
| Comparative Group | ||||||||||||||||||||||||||||||||||||||||
| BV Financial, Inc. (MHC) | 164,189 | 137,077 | 10.26 | NA | 2.43 | 100.13 | (0.06 | ) | (0.49 | ) | (0.06 | ) | (0.49 | ) | ||||||||||||||||||||||||||
| FSB Community Bankshares, Inc. (MHC) | 193,034 | 128,299 | 10.38 | 10.38 | 2.17 | 112.51 | (0.15 | ) | (1.36 | ) | (0.18 | ) | (1.65 | ) | ||||||||||||||||||||||||||
| Heritage Financial Group (MHC) | 484,407 | 316,489 | 13.48 | 13.30 | 3.52 | 84.07 | 0.61 | 4.30 | 0.66 | 4.61 | ||||||||||||||||||||||||||||||
| Kentucky First Federal Bancorp (MHC) | 253,513 | 137,316 | 23.79 | 18.99 | 2.14 | 74.20 | 0.32 | 1.41 | 0.32 | 1.41 | ||||||||||||||||||||||||||||||
| Mid-Southern Savings Bank, FSB (MHC) | 176,427 | 157,839 | 10.20 | 10.20 | 2.26 | 65.93 | 0.56 | 5.31 | 0.56 | 5.31 | ||||||||||||||||||||||||||||||
| Ottawa Savings Bancorp, Inc. (MHC) | 209,660 | 185,180 | 10.44 | 10.44 | 2.23 | 72.03 | 0.66 | 6.50 | NA | NA | ||||||||||||||||||||||||||||||
| Polonia Bancorp (MHC) | 200,744 | 155,146 | 12.07 | 12.07 | 2.61 | 107.20 | (0.14 | ) | (1.18 | ) | (0.14 | ) | (1.18 | ) | ||||||||||||||||||||||||||
| Seneca-Cayuga Bancorp, Inc. (MHC) | 151,338 | 121,988 | 12.27 | 12.05 | 3.00 | 99.88 | 0.03 | 0.26 | (0.04 | ) | (0.30 | ) | ||||||||||||||||||||||||||||
| SFSB, Inc. (MHC) | 175,198 | 117,703 | 12.44 | 12.44 | 2.04 | 87.01 | 0.09 | 0.70 | 0.09 | 0.70 | ||||||||||||||||||||||||||||||
| Wake Forest Bancshares, Inc. (MHC) | 108,625 | 86,696 | 18.86 | 18.86 | 3.50 | 34.00 | 1.38 | 7.40 | 1.38 | 7.40 | ||||||||||||||||||||||||||||||
| Source: Sunshine Savings Bank; SNL Financial; Feldman Financial. | ||||||||||||||||||||||||||||||||||||||||
64
Feldman Financial Advisors, Inc.
| Table 20 | ||||||||||||||||||||||||||||||||||||||||
| Income and Expense Analysis | ||||||||||||||||||||||||||||||||||||||||
| For the Latest Twelve Months Ended March 31, 2008 | ||||||||||||||||||||||||||||||||||||||||
| As a Percent of Average Assets | ||||||||||||||||||||||||||||||||||||||||
Interest Income | Interest Expense | Net Interest Income | Other Oper. Income | Gains & Non-rec. Income | Loan Loss Prov. | Gen. & Admin. Expense | Amort. of Intang, | Non-rec. Expense | Pretax Core Earnings | |||||||||||||||||||||||||||||||
| Sunshine Savings Bank | 5.67 | 2.28 | 3.39 | 1.47 | 0.00 | 0.56 | 4.80 | 0.00 | 0.00 | (0.51 | ) | |||||||||||||||||||||||||||||
| Comparative Group Average | 5.70 | 3.30 | 2.25 | 0.41 | 0.02 | 0.03 | 2.41 | 0.01 | 0.00 | 0.37 | ||||||||||||||||||||||||||||||
| Comparative Group Median | 5.55 | 3.22 | 2.46 | 0.19 | 0.00 | 0.04 | 2.22 | 0.00 | 0.00 | 0.15 | ||||||||||||||||||||||||||||||
| All Public Thrift Average | 5.95 | 3.23 | 2.73 | 0.68 | 0.04 | 0.36 | 2.66 | 0.07 | 0.01 | 0.48 | ||||||||||||||||||||||||||||||
| All Public Thrift Median | 5.92 | 3.26 | 2.75 | 0.54 | 0.05 | 0.13 | 2.65 | 0.00 | 0.00 | 0.72 | ||||||||||||||||||||||||||||||
| Comparative Group | ||||||||||||||||||||||||||||||||||||||||
| BV Financial, Inc. (MHC) | 5.56 | 2.92 | 2.58 | 0.19 | 0.00 | 0.10 | 2.50 | NA | 0.00 | (0.11 | ) | |||||||||||||||||||||||||||||
| FSB Community Bankshares, Inc. (MHC) | 5.47 | 3.22 | 2.55 | 0.16 | 0.05 | 0.00 | 2.59 | 0.00 | 0.00 | (0.28 | ) | |||||||||||||||||||||||||||||
| Heritage Financial Group (MHC) | 6.28 | 3.17 | 2.16 | 1.66 | (0.07 | ) | 0.31 | 4.07 | 0.00 | 0.00 | 0.46 | |||||||||||||||||||||||||||||
| Kentucky First Federal Bancorp (MHC) | 4.97 | 3.22 | 2.55 | 0.06 | 0.00 | 0.00 | 1.56 | 0.05 | 0.00 | 0.47 | ||||||||||||||||||||||||||||||
| Mid-Southern Savings Bank, FSB (MHC) | 5.92 | 3.37 | 2.59 | 0.18 | 0.00 | 0.00 | 1.59 | 0.00 | 0.00 | 0.82 | ||||||||||||||||||||||||||||||
| Ottawa Savings Bancorp, Inc. (MHC) | 5.79 | 3.17 | 2.16 | 0.14 | 0.03 | (0.46 | ) | 1.65 | 0.00 | 0.00 | NA | |||||||||||||||||||||||||||||
| Polonia Bancorp (MHC) | 5.26 | 3.37 | 2.59 | 0.36 | 0.00 | 0.00 | 3.00 | 0.00 | 0.00 | (0.20 | ) | |||||||||||||||||||||||||||||
| Seneca-Cayuga Bancorp, Inc. (MHC) | 5.40 | 3.61 | 1.51 | 0.99 | 0.11 | 0.07 | 3.92 | 0.02 | 0.00 | (0.08 | ) | |||||||||||||||||||||||||||||
| SFSB, Inc. (MHC) | 5.53 | 2.63 | 2.37 | 0.20 | 0.06 | 0.14 | 1.94 | 0.00 | 0.00 | 0.15 | ||||||||||||||||||||||||||||||
| Wake Forest Bancshares, Inc. (MHC) | 6.86 | 4.35 | 1.42 | 0.12 | 0.00 | 0.13 | 1.28 | 0.00 | 0.00 | 2.14 | ||||||||||||||||||||||||||||||
| Source: Sunshine Savings Bank; SNL Financial; Feldman Financial. | ||||||||||||||||||||||||||||||||||||||||
65
Feldman Financial Advisors, Inc.
| Table 21 | ||||||||||||||||||||||||||||||||||||||||
| Yield-Cost Structure and Growth Rates | ||||||||||||||||||||||||||||||||||||||||
| For the Latest Twelve Months Ended March 31, 2008 | ||||||||||||||||||||||||||||||||||||||||
Avg. Int. Earn. Assets/ Assets | Avg. Int.-Bear. Liabs./ Assets | Avg. Net Earning Assets/ Assets | Avg. Equity/ Assets | Yield on Int.-Earn. Assets | Cost of Int-Bear. Liabs. | Net Interest Spread | Asset Growth Rate | Loan Growth Rate | Deposit Growth Rate | |||||||||||||||||||||||||||||||
| Sunshine Savings Bank | 91.75 | 72.67 | 19.08 | 11.73 | 6.54 | 3.32 | 3.23 | 25.35 | 3.14 | 29.04 | ||||||||||||||||||||||||||||||
| Comparative Group Average | 91.86 | 75.55 | 10.88 | 13.32 | 6.03 | 3.75 | 3.05 | 6.80 | 9.09 | 5.81 | ||||||||||||||||||||||||||||||
| Comparative Group Median | 92.63 | 75.55 | 10.88 | 12.08 | 5.69 | 3.75 | 3.05 | 1.89 | 8.26 | 1.63 | ||||||||||||||||||||||||||||||
| All Public Thrift Average | 90.31 | 79.59 | 9.61 | 10.92 | 6.39 | 3.90 | 2.56 | 8.15 | 8.05 | 4.82 | ||||||||||||||||||||||||||||||
| All Public Thrift Median | 90.90 | 80.72 | 9.46 | 9.37 | 6.38 | 3.92 | 2.57 | 5.39 | 7.38 | 2.43 | ||||||||||||||||||||||||||||||
| Comparative Group | ||||||||||||||||||||||||||||||||||||||||
| BV Financial, Inc. (MHC) | 89.08 | NA | NA | 10.79 | NA | NA | NA | 22.59 | 6.82 | 36.90 | ||||||||||||||||||||||||||||||
| FSB Community Bankshares, Inc. (MHC) | 83.17 | NA | NA | 9.58 | 5.69 | NA | NA | 27.72 | 3.38 | 12.33 | ||||||||||||||||||||||||||||||
| Heritage Financial Group (MHC) | 86.43 | 75.55 | 10.88 | 13.36 | 6.79 | 3.75 | 3.05 | 9.76 | 8.89 | (1.30 | ) | |||||||||||||||||||||||||||||
| Kentucky First Federal Bancorp (MHC) | 96.95 | NA | NA | 24.11 | NA | NA | NA | (5.12 | ) | 7.83 | (1.28 | ) | ||||||||||||||||||||||||||||
| Mid-Southern Savings Bank, FSB (MHC) | 92.98 | NA | NA | 9.92 | NA | NA | NA | 7.04 | 9.02 | 7.42 | ||||||||||||||||||||||||||||||
| Ottawa Savings Bancorp, Inc. (MHC) | 94.29 | NA | NA | 10.18 | NA | NA | NA | 0.73 | 8.69 | (0.18 | ) | |||||||||||||||||||||||||||||
| Polonia Bancorp (MHC) | 92.27 | NA | NA | 11.99 | 5.62 | NA | NA | 2.59 | 20.33 | (4.17 | ) | |||||||||||||||||||||||||||||
| Seneca-Cayuga Bancorp, Inc. (MHC) | 91.05 | NA | NA | 12.17 | NA | NA | NA | 1.19 | 18.33 | 5.12 | ||||||||||||||||||||||||||||||
| SFSB, Inc. (MHC) | 95.07 | NA | NA | 12.58 | NA | NA | NA | 0.82 | 3.75 | 3.43 | ||||||||||||||||||||||||||||||
| Wake Forest Bancshares, Inc. (MHC) | 97.37 | NA | NA | 18.50 | NA | NA | NA | 0.68 | 3.83 | (0.19 | ) | |||||||||||||||||||||||||||||
| Source: Sunshine Savings Bank; SNL Financial; Feldman Financial. | ||||||||||
66
Feldman Financial Advisors, Inc.
| Table 22 | ||||||||||
| Balance Sheet Composition | ||||||||||
| As of the Latest Twelve Months Ended March 31, 2008 |
| As a Percent of Total Assets | |||||||||||||||||||||||||||||||||||||
Cash & Securities | Net Loans | Real Estate | Intang. Assets | Other Assets | Total Deposits | Borrowed Funds | Other Liabs. | Total Liabs. | Total Equity | ||||||||||||||||||||||||||||
| Sunshine Savings Bank | 20.44 | 75.42 | 0.00 | 0.00 | 4.15 | 88.90 | 0.00 | 0.63 | 89.53 | 10.47 | |||||||||||||||||||||||||||
| Comparative Group Average | 21.75 | 73.14 | 0.23 | 0.71 | 4.12 | 75.21 | 10.27 | 1.09 | 86.57 | 13.42 | |||||||||||||||||||||||||||
| Comparative Group Median | 21.82 | 72.50 | 0.03 | 0.00 | 3.67 | 78.55 | 7.59 | 1.06 | 87.83 | 12.17 | |||||||||||||||||||||||||||
| All Public Thrift Average | 22.42 | 71.76 | 0.29 | 1.16 | 4.40 | 65.86 | 21.72 | 1.15 | 88.62 | 11.16 | |||||||||||||||||||||||||||
| All Public Thrift Median | 20.48 | 72.76 | 0.06 | 0.34 | 4.18 | 67.02 | 20.09 | 1.02 | 90.44 | 9.13 | |||||||||||||||||||||||||||
| Comparative Group | |||||||||||||||||||||||||||||||||||||
| BV Financial, Inc. (MHC) | 19.66 | 74.16 | 0.00 | NA | 3.86 | 83.49 | 4.57 | 1.68 | 89.74 | 10.26 | |||||||||||||||||||||||||||
| FSB Community Bankshares, Inc. (MHC) | 34.06 | 64.09 | 0.00 | 0.00 | 1.91 | 66.46 | 22.22 | 0.93 | 89.62 | 10.38 | |||||||||||||||||||||||||||
| Heritage Financial Group (MHC) | 29.50 | 63.84 | 0.01 | 0.21 | 6.80 | 65.34 | 19.84 | 1.34 | 86.52 | 13.48 | |||||||||||||||||||||||||||
| Kentucky First Federal Bancorp (MHC) | 21.55 | 70.00 | 0.01 | 5.92 | 2.59 | 54.17 | 21.13 | 0.92 | 76.21 | 23.79 | |||||||||||||||||||||||||||
| Mid-Southern Savings Bank, FSB (MHC) | 16.99 | 81.38 | 0.04 | 0.00 | 1.63 | 89.46 | 0.00 | 0.34 | 89.80 | 10.20 | |||||||||||||||||||||||||||
| Ottawa Savings Bancorp, Inc. (MHC) | 18.61 | 75.50 | 0.12 | 0.00 | 5.78 | 88.32 | 0.00 | 1.15 | 89.47 | 10.44 | |||||||||||||||||||||||||||
| Polonia Bancorp (MHC) | 23.29 | 70.83 | 0.00 | 0.00 | 5.99 | 77.29 | 9.24 | 1.40 | 87.92 | 12.07 | |||||||||||||||||||||||||||
| Seneca-Cayuga Bancorp, Inc. (MHC) | 22.09 | 70.65 | 0.15 | 0.25 | 6.94 | 80.61 | 5.93 | 1.20 | 87.73 | 12.27 | |||||||||||||||||||||||||||
| SFSB, Inc. (MHC) | 9.53 | 86.44 | 0.63 | 0.00 | 3.49 | 67.18 | 19.41 | 0.97 | 87.56 | 12.44 | |||||||||||||||||||||||||||
| Wake Forest Bancshares, Inc. (MHC) | 22.21 | 74.49 | 1.35 | 0.00 | 2.23 | 79.81 | 0.39 | 0.93 | 81.14 | 18.86 | |||||||||||||||||||||||||||
| Source: Sunshine Savings Bank; SNL Financial; Feldman Financial. | ||||||||||
67
Feldman Financial Advisors, Inc.
| Table 23 | ||||||||||
| Regulatory Capital, Credit Risk, and Loan Composition | ||||||||||
| As of or for the Latest Twelve Months Ended March 31, 2008 |
Tier 1 Leverage Capital Ratio | Tier 1 Risk- based Capital | Total Risk- based Capital | NPLs/ Loans | Total NPAs/ Assets | Resrvs./ NPAs | Resrvs./ Loans | Resid. Mtgs./ Loans | Other Real Est. Mtgs./ Loans | Nonmtg. Loans/ Loans | |||||||||||||||||||||||||||||||
| Sunshine Savings Bank | 9.94 | 15.54 | 16.79 | 1.20 | 1.00 | 86.85 | 1.14 | 60.76 | 0.56 | 38.68 | ||||||||||||||||||||||||||||||
| Comparative Group Average | 10.91 | 18.35 | 19.09 | 0.65 | 0.74 | 106.91 | 0.63 | 68.23 | 22.27 | 9.51 | ||||||||||||||||||||||||||||||
| Comparative Group Median | 10.06 | 16.67 | 17.36 | 0.55 | 0.92 | 79.47 | 0.44 | 71.05 | 18.29 | 9.40 | ||||||||||||||||||||||||||||||
| All Public Thrift Average | 10.06 | 14.97 | 15.90 | 1.55 | 1.39 | 133.52 | 1.11 | 49.04 | 39.65 | 11.31 | ||||||||||||||||||||||||||||||
| All Public Thrift Median | 8.49 | 12.50 | 13.20 | 0.76 | 0.62 | 85.28 | 0.97 | 47.28 | 43.96 | 8.76 | ||||||||||||||||||||||||||||||
| Comparative Group | ||||||||||||||||||||||||||||||||||||||||
| BV Financial, Inc. (MHC) | 5.81 | 10.29 | 10.78 | 1.20 | 0.92 | 35.94 | 0.44 | 71.05 | 18.29 | 10.66 | ||||||||||||||||||||||||||||||
| FSB Community Bankshares, Inc. (MHC) | 9.89 | 21.81 | 22.23 | 0.00 | 0.00 | NM | 0.26 | 96.48 | 3.24 | 0.28 | ||||||||||||||||||||||||||||||
| Heritage Financial Group (MHC) | 12.60 | 15.89 | 17.14 | 1.50 | 0.98 | 99.68 | 1.51 | 30.20 | 36.12 | 33.68 | ||||||||||||||||||||||||||||||
| Kentucky First Federal Bancorp (MHC) | NA | NA | NA | NA | NA | NA | 0.37 | NA | NA | NA | ||||||||||||||||||||||||||||||
| Mid-Southern Savings Bank, FSB (MHC) | 10.14 | 15.81 | 16.11 | 0.18 | 0.18 | 121.47 | 0.28 | 60.14 | 28.64 | 11.22 | ||||||||||||||||||||||||||||||
| Ottawa Savings Bancorp, Inc. (MHC) | 10.03 | 16.67 | 17.15 | 1.42 | 1.19 | 21.23 | 0.33 | 65.88 | 24.72 | 9.40 | ||||||||||||||||||||||||||||||
| Polonia Bancorp (MHC) | 10.06 | 20.90 | 21.65 | 0.15 | 0.11 | 345.75 | 0.51 | 90.68 | 7.69 | 1.63 | ||||||||||||||||||||||||||||||
| Seneca-Cayuga Bancorp, Inc. (MHC) | 11.37 | 19.14 | 19.71 | 0.14 | 0.25 | 119.90 | 0.43 | 77.89 | 6.29 | 15.82 | ||||||||||||||||||||||||||||||
| SFSB, Inc. (MHC) | 9.81 | 16.42 | 17.36 | 0.55 | 1.10 | 52.04 | 0.66 | 86.55 | 10.76 | 2.69 | ||||||||||||||||||||||||||||||
| Wake Forest Bancshares, Inc. (MHC) | 18.49 | 28.21 | 29.65 | 0.75 | 1.92 | 59.26 | 1.51 | 35.18 | 64.64 | 0.18 | ||||||||||||||||||||||||||||||
| Source: Sunshine Savings Bank; SNL Financial; Feldman Financial. | ||||||||||
68
Feldman Financial Advisors, Inc.
III. MARKET VALUE ADJUSTMENTS
General Overview
This concluding chapter of the Appraisal identifies certain additional adjustments to the Company’s estimated pro forma market value relative to the Comparative Group selected in Chapter II. The adjustments discussed in this chapter are made from the viewpoints of potential investors, which would include depositors holding subscription rights and unrelated parties who may purchase stock in a community offering. It is assumed that these potential investors are aware of all relevant and necessary facts, as they would pertain to the value of the Company relative to other publicly traded thrift institutions and relative to alternative investments.
Our appraised value is predicated on a continuation of the current operating environment for the Company and thrift institutions in general. Changes in the Company’s operating performance along with changes in the local and national economy, the stock market, interest rates, the regulatory environment, and other external factors may occur from time to time, often with great unpredictability, which could impact materially the pro forma market value of the Company or thrift stocks in general. Therefore, the Valuation Range provided herein is subject to a more current re-evaluation prior to the actual completion of the Stock Offering.
In addition to the comparative operating fundamentals discussed in Chapter II, it is important to address additional market value adjustments based on certain financial and other criteria, which include, among other factors:
69
Feldman Financial Advisors, Inc.
| (1) | Earnings Prospects | |
| (2) | Financial Condition | |
| (3) | Market Area | |
| (4) | Management | |
| (5) | Dividend Policy | |
| (6) | Liquidity of the Issue | |
| (7) | Subscription Interest | |
| (8) | Stock Market Conditions | |
| (9) | Recent Acquisition Activity | |
| (10) | New Issue Discount |
Earnings Prospects
Earnings prospects are dependent upon the sensitivity of asset yields and liability costs to changes in market interest rates, the credit quality of assets, the stability of non-interest components of income and expense, and the ability to leverage the balance sheet. Each of the foregoing is an important factor to investors in assessing earnings prospects.
The Company derives its income mainly from the difference or “spread” between the interest earned on loans, securities and other interest-earning assets, and interest paid on deposits, borrowings and other interest-bearing liabilities. Several years ago, market interest rates were at historically low levels. However, beginning in June 2004, the U.S. Federal Reserve increased its target federal funds rate 17 times, from 1.00% to 5.25%. While the federal funds rate and other short-term market interest rates increased, intermediate- and long-term market interest rates did not increased proportionately. This has led to a “flattening” of the market yield curve, which has even “inverted” recently as short-term rates have exceeded long-term rates over an intermediate maturity horizon. The flat or “inverted” yield curve negatively affects the Company’s interest rate spread and net interest margin as the cost of deposits, which are generally tied to short-term rates, have repriced upwards faster than the interest rates earned on loans and investments, which tend to be priced off long-term rates.
70
Feldman Financial Advisors, Inc.
This increasing of the interest rates led to a slowdown in the nation’s housing industry and a related credit crunch as loans tied to subprime mortgages began to go delinquent. To counter this slowdown and try to alleviate the credit crunch, since mid-September 2007, the Federal Reserve has reduced rates five times to the current fed funds level of 2.00%. This has resulted in a steep yield curve, although mortgage rates have not risen at the same pace as other long-term rates. The Federal Reserve has recently indicated it does not foresee additional interest rate cuts as they will now focus on controlling inflation.
The Company’s profitability in recent years has been negatively impacted by the flattening of the yield curve, which led to a shrinking of the net interest margin. The Company’s ROA was 0.92%, 0.66% and 0.21%, respectively, for 2005, 2006 and 2007. For the first three months of 2008, the Company reported and ROA of (0.67)%. The Company’s earnings were benefited in 2007 by a tax benefit related to it’s conversion from a credit union to a thrift. Excluding the tax benefit, the Company would have reported an ROA for 2007 of (0.11)%. The Company’s net interest margin has declined over the past few years, but is still above the industry norm due to a low cost of funds and a higher yield on earning assets as mentioned earlier in the report. As the Company’s net interest margin has declined, the Company’s efficiency ratio has deteriorated.
The infusion of capital from the Stock Offering will provide the Company with the additional flexibility and opportunity to accommodate implementation of a planned expansion strategy, although it will take time for the Company to prudently invest these proceeds and generate significant returns on these funds. In the current business cycle, interest rate risk poses a threat to the Company’s future earnings growth. While the reinvestment returns from the
71
Feldman Financial Advisors, Inc.
offering proceeds will augment the Company’s net income, the positive impact is restrained by the added expenses associated with the stock benefit plans. It should be noted though that the restricted stock plan must still be adopted by the Board, which will occur after closing of the Offering. As such, expenses related to this benefit will not begin until at least six months after the closing of the Offering. Consequently, in light of the Company’s comparatively low historical earnings base, its pro forma profitability ratios are expected to continue to trail the Comparative Group’s performance in the near term. As the Company’s recent earnings have trended down and the current interest rate yield curve has a negative impact on the Company’s net interest margin, we believe a downward adjustment is warranted for the Company’s immediate earnings growth prospects, however, over the longer term earnings will be enhanced of the result of the new capital being deployed.
Financial Condition
As noted in Chapter II, with total assets of $167.4 million, the Company is slightly smaller than the Comparative Group median of $184.7 million. At the pro forma midpoint of the offering range, the Company is expected to have total assets of $173.6 million. The Company a similar level of net loans as a percentage of total assets at 75.4% compared to the Comparative Group median of 73.4%.
The Company has a higher level of deposits and a lower reliance on borrowed funds as compared to the Comparative Group. As a percentage of total assets, the Company has a deposit ratio of 88.9% and borrowings to assets ratio of 0.0% compared to the Comparative Group medians of 78.6% and 7.6%, respectively.
72
Feldman Financial Advisors, Inc.
The Company’s equity to assets ratio of 10.5% trails the Comparative Group median of 12.2%. At the pro forma midpoint of the offering range, the Company is projected to raise its equity to assets ratio of 13.6%. The Company has no intangible assets.
An area of importance for investors is the level of nonperforming loans and the level of allowance for loan losses as compared to the level of non-performing assets. The Company’s level of non-performing assets as a percentage of total assets at 1.00% is slightly above to the Comparative Group median of 0.92%. The Company’s level of reserves as a percentage on non-performing assets at 86.9% is above the Comparative Group median of 79.5%.
While the Company has a similar level of loans as a percentage of total assets as compared to the Comparative Group, it has a slightly higher level of non-performing assets as a percentage of total assets. The Company’s resulting capital level after the conversion will be higher than the Comparative Group median. Taken a whole, we believe that no adjustment is warranted for financial condition.
Market Area
The Company’s primary market area is the metropolitan Tallahassee region, and to a limited extent, southern Georgia. Demographic data for the Company’s local market reflects a trend of income growth comparable to the United States and Florida as a whole, but with a slightly lower-level of household income. Located in the northern part of Florida along the Georgia border, this area has not seen the same level of problem loans tied to real estate that have impacted institutions in the coastal areas of Florida. Therefore, based on the demographic trends affecting the Company’s market area as compared to the United States as a whole and the State of Florida, we do not believe that the market area conditions on the whole are notably different
73
Feldman Financial Advisors, Inc.
from those facing the Comparative Group. Accordingly, we do not believe an adjustment is warranted for market area considerations.
Management
Management’s principal challenges are to begin generating profitable results, monitor credit risks, and control operating costs while the Company competes in an increasingly competitive financial services environment while dealing with a declining net interest margin and increasing levels of non-performing assets. As such, the Company has brought in a new Chief Executive Officer who is highly experienced in running thrift institutions. We believe that investors will take into account that the Company is professionally and knowledgeably managed by a team of experienced banking executives. Additions to the management team are expected as the Company grows. This will add to its operating costs. We also note that stock investors will likely rely upon bottom-line earnings results as the means of evaluating the future performance of management. Based on these considerations, we believe no adjustment is warranted based on management.
Dividend Policy
The Company currently plans to pay cash dividends in the future, but the amount and timing of any dividends, however, have not been determined yet. The timing, amount and frequency of dividends will be determined by the Board of Directors.
Payment of cash dividends has become commonplace among publicly traded thrifts with relatively high capital levels. Four of the twelve members of the Comparative Group companies currently pay dividends. The median dividend yield of the Comparative Group was 1.60% as of June 16, 2008, and was below the average All Public Thrift dividend yield of 2.91%. A number of high profile financial institutions have recently announced cuts in their dividends and investors
74
Feldman Financial Advisors, Inc.
now focus on the ability to maintain a dividend in the future. While a formal dividend policy has yet to be established, the Company will have the capital base to pay and plans on paying a dividend in the future and therefore, we believe that no adjustment is warranted for this factor.
Liquidity of the Issue
Two of the ten members of the Comparative Group are listed on the NASDAQ National Market, while the other eight companies are listed on the OTC Bulletin Board. The Company has applied to have its common stock listed for trading on the OTC Bulletin Board following the Stock Offering and anticipates meeting the requirements for listing. Thus, we do not believe that any further adjustment is necessary to address this factor.
Subscription Interest
After a recent period of the initial public offerings (“IPOs”) of thrift stocks having attracted a great deal of investor interest and this speculative fervor, stock conversions, and particularly MHC conversions, fell out of favor in the second half of 2007 and through the first part of 2008. The total number of MCH conversions has fallen from twelve in 2006 to ten in 2007 and only four through June 16, 2008. Also trending downward is the one-day pop reported by firms converting the MHC form of ownership. After reporting an average one-day pop of 15.3% in 2006, this number fell to 9.0% in 2007 and 3.3% for 2008. As the MHC conversion structure has lost favor with investors, pricings have fallen. For conversions completed in 2006 and the first six months of 2007, the average fully converted price-to-pro forma book ratio was 78.8% compared to 71.1% for deals closed after June 30, 2007. The two most recent MHC conversions priced at a fully converted price-to-pro forma book value of 56.4% and 63.7,
75
Feldman Financial Advisors, Inc.
respectively. The fact that the majority of the thrift's voting stock is controlled by the top-tier holding company makes it difficult for shareholders to exert their influence on management.
The Company has retained the services of Keefe, Bruyette and Woods to assist in the marketing and sale of the Stock Offering. The Company also plans to form an employee stock ownership plan (“ESOP) that will purchase common stock in the offering. The Company’s Board members and executive officers currently anticipate purchasing an aggregate amount of $491,000 of common stock. The maximum individual purchase limitations per eligible category is placed at $150,000 and persons or groups acting in concert are limited to $200,000 in stock purchases in all categories.
Based on this recent experience with MHC conversions, we believe a downward adjustment is appropriate for subscription interest for the Company’s offering.
Stock Market Conditions
Table 24 graphically displays the performance of the SNL Thrift Index of all publicly traded thrifts and the SNL MHC Thrift Index as compared to the Standard & Poor’s 500-Stock Index (“S&P 500”) since year-end 2004. While the SNL Thrift Index has greatly underperformed the broader stock index, declining 42.2% as compared to an increase of 11.5% for the S&P 500, the SNL MHC Thrift Index has advanced 19.6%, during the period from December 31, 2004 to June 16, 2008. Since December 31, 2006, the All Thrift Public Index has declined 49.3% while the SNL MHC Thrift Index has declined 9.7%. This compares to a decrease of 4.8% for the S&P 500 over the same period. The decline is stock values reflects the problems in the housing industry and the related credit crunch.
76
Feldman Financial Advisors, Inc.
After reporting record net income of $16.4 billion and near record earnings of $15.9 billion in 2006, earnings of thrift industry institutions began to suffer as the housing market turned negative. The problems in the housing industry also had a negative effect on asset quality measures.
The OTS reported that the thrift industry net income was $2.9 billion for the year, down 82% from $15.9 billion in 2006. In the fourth quarter, net losses of $5.2 billion were reported, down from net income of $657 million in the third quarter and from net income of $3.1 billion in the fourth quarter one year ago. This was the first quarterly loss reported by the thrift industry since a special assessment was collected in the third quarter 1996 for the Savings Association Insurance Fund. Profitability, as measured by return on average assets (“ROA”), was 0.19% for 2007, down from 1.06% percent for 2006. In the fourth quarter, ROA was a negative 1.38%, down from 0.89% in the comparable year ago quarter, and down from 0.17% in the prior quarter. In addition, noncurrent loan rates increased to 1.40% percent of assets at the end of the fourth quarter, up from 0.54% one year ago.
For the first quarter of 2008, the thrift industry posted a $617 million loss as institutions continue to take reserves for loan losses expected from the continued downturn in the housing market. This loss compares to a net loss of $8.75 billion in the fourth quarter of 2007 and net income of $3.61 billion in the first quarter one year ago. ROA was a negative 0.16% in the first quarter, an improvement from a negative 2.31% in the fourth quarter of 2007, but down from 0.97% in the comparable quarter a year ago. Troubled assets (noncurrent loans and repossessed assets) were 2.06% of assets during the first quarter, up from 1.66% in the previous quarter and from 0.80% one year ago.
77
Feldman Financial Advisors, Inc.
Since the beginning of 2007, thrift stocks have generally trended downward in value due to concerns over the mortgage market and the sub-prime mortgage market in particular and the effect that this may have on the housing industry. While stock prices have flattened out over the past month, and even increased slightly in some cases, the still existing concerns over the housing industry, the slowdown in the economy and possible recession, record prices for oil, and the continuing war in Iraq, downward pressure still exists as it relates to thrift institution stocks.
Recent Acquisition Activity
Acquisition speculation is one factor underpinning the prices of newly converted thrifts in the after-market and existing trading companies. Table 25 summarizes recent acquisition activity involving banks and thrifts based in Florida. Since January 1, 2006, there have been thirty-eight acquisitions involving Florida financial institutions, including seven thrifts. The majority of these acquisitions occurred during 2006, as only thirteen occurred in 2007 and only two in 2008. There have been no acquisitions of a thrift based in Florida since May 2007.
Just as the number of deals has slowed down, so have the pricing ratios. For deals announced in 2006, the median price to book ratio was 259.7%, compared to 216.9% for deals announced since January 1, 2007. The median price-to-earnings ratio has declined from 25.9 times earnings for 2006 deals to 22.2 times earnings for deals announced in 2007 and 2008.
As the Company will be structured as an MHC, we do not believe that acquisition premiums are a significant factor to consider in determining the Company’s pro forma market value, and any speculative interest may be reflected to some degree in the general trading values of thrift stocks and encompass members of the Comparative Group as well.
78
Feldman Financial Advisors, Inc.
New Issue Discount
A “new issue” discount that reflects investor concerns and investment risks inherent in all IPOs is a factor to be considered for purposes of valuing converting thrifts. The magnitude of the new issue discount typically expands during periods of declining thrift stock prices, as investors require larger inducements, and narrows during strong market conditions. The thrift conversion market continues to respond to the after-market performance of recent offerings.
Table 26 presents a summary of thrifts that have completed first-stage minority MHC stock offerings since January 1, 2006. There were a total of twelve MHC stock offerings during 2006, ten in 2007 and four so far in 2008. During this period, the after-market performance of MHC thrift conversions has shown a significant weakness. Of the twelve MHC stock offerings completed during 2006, the average first day price increase was 15.3%. The offerings completed in 2007 recorded a first day price increase of 9.0% and the four offerings in 2008 have posted a one-day price increase of 3.3%. There have been no MHC conversions of Florida based thrifts since January 1, 2006.
Thrift conversions price at discounts to publicly traded companies as increases in value require ever larger increases in capital and produce marginal returns in this additional equity. Coupled with the problems in the thrift industry related to the housing market and the decline in earnings for financial institutions, this discount is now even greater. Given the recent performance of MHC conversions, we believe a downward adjustment is warranted.
79
Feldman Financial Advisors, Inc.
Table 24
Comparative Stock Index Performance
December 31, 2004 to June 16, 2008
(Index Value 100 = 12/31/04)
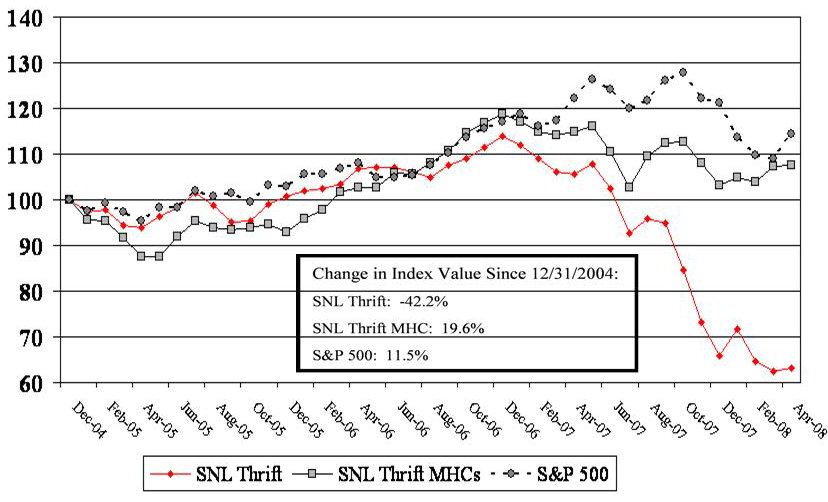
80
Feldman Financial Advisors, Inc.
| Table 25 | |||||||||||||||||
| Summary of Recent Florida Acquisition Activity | |||||||||||||||||
| Transactions Announced Since January 1, 2006 |
| Seller's Financial Data @ Announcement | Offer Value to | ||||||||||||||||
| Total | Equity/ | YTD | YTD | Offer | Book | Tang. | LTM | Total | |||||||||
| B/T | Assets | Assets | ROA | ROE | Date | Status | Value | Value | Book | EPS | Assets | ||||||
| Buyer | State | Seller | (1) | ($Mil.) | (%) | (%) | (%) | Anncd. | (2) | ($Mil.) | (%) | (%) | (x) | (%) | |||
| Average - All Deals | 634.2 | 10.32 | 0.92 | 10.30 | NA | NA | 155.1 | 250.9 | 256.6 | 28.11 | 23.70 | ||||||
| Median - All Deals | 238.7 | 9.67 | 1.00 | 11.36 | NA | NA | 43.9 | 255.8 | 255.8 | 24.68 | 24.26 | ||||||
| Average - Deals Announced Since January 1, 2007 | 795.2 | 9.99 | 0.87 | 10.14 | NA | NA | 174.8 | 242.9 | 251.6 | 24.89 | 21.89 | ||||||
| Median - Deals Announced Since January 1, 2007 | 332.4 | 10.04 | 1.15 | 13.38 | NA | NA | 75.9 | 216.9 | 216.9 | 22.18 | 22.76 | ||||||
| Caja Madrid | City National Bancshares Inc. | B | 2,761.3 | 12.14 | 2.45 | 21.84 | 04/14/08 | P | 927.0 | 333.3 | 336.5 | 25.08 | 40.45 | ||||
| Jacksonville Bancorp Inc. | FL | Heritage Bancshares Inc. | B | 161.4 | 11.32 | 1.09 | 10.30 | 01/28/08 | P | 25.9 | 176.3 | 176.3 | 17.90 | 16.06 | |||
| 1st United Bancorp Inc. | FL | Equitable Financial Group Inc | B | 194.3 | 12.42 | 1.74 | 14.23 | 10/01/07 | C | 55.6 | 216.9 | 216.9 | 16.28 | 28.61 | |||
| First Banks, Inc. | MO | Coast Financial Holdings Inc. | B | 834.1 | 6.60 | (1.23) | (17.08) | 08/03/07 | C | 22.1 | 40.2 | 40.2 | NM | 2.65 | |||
| Colonial BancGroup Inc. | AL | Citrus & Chemical Bancorp. | B | 875.6 | 6.98 | 0.84 | 12.53 | 07/17/07 | C | 218.3 | 357.4 | 357.4 | 27.40 | 24.94 | |||
| Banco Popular Español SA | Total Bancshares Corp. | B | 1,357.4 | 6.34 | 1.54 | 24.02 | 07/10/07 | C | 300.0 | 348.4 | 410.6 | 21.62 | 22.10 | ||||
| FBC Bancorp Inc. | FL | Prime Bank | B | 43.2 | 14.95 | (0.58) | (3.77) | 06/20/07 | C | 6.4 | 99.1 | 99.1 | NM | 14.81 | |||
| Florida Bank Group Inc. | FL | Cygnet Financial Corp | B | 110.7 | 10.54 | (0.51) | (3.91) | 05/21/07 | C | 22.0 | 129.9 | 129.9 | NM | 19.88 | |||
| Fifth Third Bancorp | OH | R-G Crown Bank | T | 3,017.6 | 12.89 | (0.14) | (1.15) | 05/20/07 | C | 338.0 | 86.9 | 150.2 | NM | 9.54 | |||
| CapitalSouth Bancorp | AL | Monticello Bancshares, Inc. | T | 227.8 | 10.04 | NA | NA | 02/28/07 | C | 41.2 | 205.9 | 207.0 | 28.79 | 18.07 | |||
| Banco Sabadell SA | Transatlantic Holding Corp | B | 580.3 | 8.64 | 1.59 | 19.25 | 01/24/07 | C | 175.0 | 349.0 | 349.0 | 19.96 | 30.16 | ||||
| Colonial BancGroup Inc. | AL | Commercial Bankshares Inc. | B | 1,035.4 | 8.71 | 1.20 | 14.78 | 01/23/07 | C | 317.1 | 331.5 | 332.4 | 24.68 | 30.63 | |||
| Bankshares Inc | FL | BankFirst Bancorp Inc. | B | 332.4 | 8.19 | 2.25 | 30.68 | 01/18/07 | C | 80.0 | 451.5 | 451.5 | 22.18 | 24.14 | |||
| Superior Bancorp | AL | People's Community Bancshares | B | 322.6 | 8.87 | 1.46 | 16.06 | 01/18/07 | C | 75.9 | 315.1 | 315.1 | 22.05 | 23.53 | |||
| Florida Bank Group Inc. | FL | Bank of Tallahassee | B | 73.8 | 11.26 | 0.47 | 4.16 | 01/03/07 | C | 16.8 | 202.1 | 202.1 | 47.85 | 22.76 | |||
| Coastal Cmnty Investments Inc. | FL | Bayside Financial Corp. | T | 84.0 | 9.37 | 1.45 | 16.54 | 12/26/06 | C | 18.9 | 239.4 | 239.5 | 14.90 | 22.43 | |||
| Marshall & Ilsley Corp. | WI | United Heritage Bankshares | B | 736.1 | 8.82 | 1.08 | 13.26 | 12/01/06 | C | 216.0 | 304.6 | 309.8 | 27.79 | 29.34 | |||
| Sun American Bancorp | FL | Independent Community Bank | B | 122.7 | 11.33 | 1.52 | 15.37 | 11/17/06 | C | 40.9 | 294.1 | 294.1 | 20.87 | 33.32 | |||
| Centerstate Banks of Florida | FL | Valrico Bancorp Inc. | B | 150.1 | 9.96 | 1.31 | 14.72 | 11/14/06 | C | 40.4 | 260.9 | 260.9 | 19.83 | 26.93 | |||
| TIB Financial Corp. | FL | Bank of Venice | B | 61.5 | 13.60 | 0.86 | 6.26 | 11/13/06 | C | 16.6 | 198.4 | 198.4 | 46.55 | 26.98 | |||
| Cmnty Bk Investors of America | VA | Bay Financial SB FSB | T | 71.5 | 31.98 | 0.87 | 2.92 | 10/23/06 | C | 15.0 | 152.2 | 152.2 | 55.15 | 25.65 | |||
| Whitney Holding Corp. | LA | Signature Financial Hldgs | B | 258.3 | 7.15 | 0.80 | 11.22 | 10/04/06 | C | 62.0 | 312.5 | 312.5 | 34.67 | 24.00 | |||
| Reserve Finl Associates LLC | OH | Business Bank of Florida Corp | B | 125.4 | 8.44 | 1.42 | 16.82 | 09/22/06 | C | 32.5 | 304.7 | 304.7 | 18.81 | 25.94 | |||
| Park National Corp. | OH | Vision Bancshares Inc. | B | 695.7 | 7.46 | 1.39 | 17.91 | 09/14/06 | C | 169.6 | 298.0 | 321.9 | 18.61 | 24.38 | |||
| Bancshares of Florida Inc. | FL | Old Florida Bankshares Inc. | B | 326.0 | 8.11 | 0.93 | 12.61 | 08/28/06 | C | 83.4 | 295.8 | 321.0 | 28.37 | 25.57 | |||
| National City Corp. | OH | Fidelity Bankshares Inc. | T | 4,235.0 | 6.95 | 0.79 | 11.36 | 07/26/06 | C | 1,038.4 | 342.3 | 367.8 | 30.47 | 24.52 | |||
| National City Corp. | OH | Harbor Florida Bancshares Inc. | T | 3,213.8 | 10.52 | 1.58 | 14.91 | 07/10/06 | C | 1,104.1 | 320.5 | 324.2 | 21.84 | 34.35 | |||
| Privee LLC | FL | PineBank National Association | B | 417.9 | 8.50 | 0.12 | 1.40 | 06/26/06 | C | 42.8 | 120.5 | 120.5 | 31.75 | 10.24 | |||
| Castle Creek Capital LLC | CA | Bankshares Inc. | B | 204.5 | 7.11 | 1.11 | 15.38 | 06/20/06 | C | 45.0 | 309.7 | 309.7 | 21.76 | 22.00 | |||
| Republic Bancorp Inc. | KY | GulfStream Community Bank | T | 64.7 | 13.84 | 0.54 | 3.76 | 06/09/06 | C | 18.1 | 202.0 | 202.0 | 44.91 | 27.96 | |||
| Mercantile Bancorp Inc. | IL | Royal Palm Bancorp Inc. | B | 147.4 | 10.85 | 0.67 | 5.76 | 05/30/06 | C | 42.3 | 245.1 | 245.1 | 50.64 | 28.71 | |||
| CP Capital Asset Acquisition | FL | Security Bank NA | B | 117.9 | 8.37 | 0.98 | 11.23 | 04/13/06 | C | 18.3 | 200.0 | 200.0 | 19.19 | 16.74 | |||
| Dickinson Financial Corp. II | MO | Southern Commerce Bank | B | 91.9 | 11.22 | 1.02 | 8.80 | 04/10/06 | C | 20.8 | 201.4 | 201.4 | 23.89 | 22.59 | |||
| Riverside Banking Company | FL | First Cmmty Bank Holding Corp. | B | 258.7 | 7.16 | 1.08 | 15.10 | 04/04/06 | C | 65.0 | 351.0 | 351.0 | 24.78 | 25.13 | |||
| NBC Capital Corp. | MS | SunCoast Bancorp Inc. | B | 122.5 | 11.62 | 0.77 | 6.32 | 03/16/06 | C | 35.1 | 259.7 | 259.8 | 47.67 | 28.65 | |||
| Bancshares of Florida Inc. | FL | Bristol Bank | B | 91.3 | 11.08 | (0.14) | (1.39) | 03/07/06 | C | 20.9 | 206.6 | 206.6 | NM | 22.89 | |||
| Banc Corp. | AL | Kensington Bankshares Inc. | B | 324.7 | 8.68 | 1.00 | 10.55 | 03/06/06 | C | 70.9 | 251.8 | 251.8 | 24.63 | 21.85 | |||
| Hometown Banking Company Inc. | FL | First of Homestead Inc. | B | 249.7 | 10.04 | 0.85 | 8.34 | 01/06/06 | C | 55.5 | 221.3 | 221.3 | 26.92 | 22.23 | |||
| (1) B=bank; T=thrift | |||||||||||||||||
| (2) P=pending; C=completed | |||||||||||||||||
| Source: SNL Financial |
81
Feldman Financial Advisors, Inc.
| Table 26 | |||||||||||||||||||
| Summary of Recent First-Stage MHC Stock Offerings | |||||||||||||||||||
| Transactions Completed Since January 1, 2006 | |||||||||||||||||||
| Stock | Fully | After-Market Price Chg. | Change | ||||||||||||||||
| Total | Retained | Gross | Conv. | IPO | 6/16/08 | One | One | One | Thru | ||||||||||
| Stock | IPO | Assets | by MHC | Proceeds | P/B | Price | Price | Day | Week | Month | 6/16/08 | ||||||||
| Company | State | Exchange | Date | ($Mil.) | (%) | ($Mil.) | (%) | ($) | ($) | (%) | (%) | (%) | (%) | ||||||
| Average | NA | NA | NA | 815.8 | 57.4 | 84.0 | 76.5 | 10.00 | 10.11 | 11.1 | 10.8 | 9.8 | 1.1 | ||||||
| Average -- 2007 and 2008 YTD | NA | NA | NA | 1,142.0 | 57.5 | 119.6 | 75.6 | 10.00 | 10.16 | 7.4 | 7.2 | 6.1 | 1.6 | ||||||
| Malvern Federal Bancorp, Inc. (MHC) | PA | NASDAQ | 05/20/2008 | 567.0 | 55.0 | 26.5 | 63.7 | 10.00 | 10.99 | 9.8 | 10.0 | NA | 9.9 | ||||||
| William Penn Bancorp, Inc. (MHC) | PA | OTCBB | 04/16/2008 | 268.9 | 70.0 | 10.3 | 56.4 | 10.00 | 14.25 | 17.5 | 25.0 | 37.5 | 42.5 | ||||||
| Meridian Interstate Bancorp, Inc. (MHC) | MA | NASDAQ | 01/23/2008 | 895.1 | 55.0 | 100.5 | 74.0 | 10.00 | 10.28 | (4.0) | (5.2) | (4.9) | 2.8 | ||||||
| Sound Financial, Inc. (MHC) | WA | OTCBB | 01/09/2008 | 230.7 | 55.0 | 13.0 | 72.8 | 10.00 | 9.19 | (10.0) | (10.0) | (8.5) | (8.1) | ||||||
| Northfield Bancorp, Inc. (MHC) | NJ | NASDAQ | 11/08/2007 | 1,576.8 | 55.0 | 192.7 | 83.0 | 10.00 | 11.25 | 4.5 | 13.0 | 4.9 | 12.5 | ||||||
| LaPorte Bancorp, Inc. (MHC) | IN | NASDAQ | 10/15/2007 | 257.5 | 52.7 | 13.0 | 73.0 | 10.00 | 7.25 | (8.1) | (13.8) | (21.0) | (27.5) | ||||||
| FSB Community Bankshares, Inc. (MHC) | NY | OTCBB | 08/15/2007 | 152.8 | 53.0 | 8.4 | 62.1 | 10.00 | 8.05 | NA | 0.0 | (5.0) | (19.5) | ||||||
| Beneficial Mutual Bancorp, Inc. (MHC) | PA | NASDAQ | 07/16/2007 | 2,300.2 | 55.7 | 236.1 | 83.9 | 10.00 | 11.49 | (7.9) | (6.8) | (11.5) | 14.9 | ||||||
| Hometown Bancorp, Inc. (MHC) | NY | OTCBB | 06/29/2007 | 117.4 | 55.0 | 10.7 | 83.5 | 10.00 | 7.15 | 0.0 | 0.0 | (5.0) | (28.5) | ||||||
| TFS Financial Corporation (MHC) | OH | NASDAQ | 04/23/2007 | 8,595.6 | 68.3 | 1,002.0 | 88.3 | 10.00 | 12.40 | 17.9 | 18.0 | 23.4 | 24.0 | ||||||
| Sugar Creek Financial Corp. (MHC) | IL | OTCBB | 04/04/2007 | 82.2 | 55.0 | 4.1 | 66.4 | 10.00 | 7.99 | 0.0 | 0.0 | 6.0 | (20.1) | ||||||
| Delanco Bancorp, Inc. (MHC) | NJ | OTCBB | 04/02/2007 | 97.6 | 55.0 | 7.4 | 74.7 | 10.00 | 6.50 | 0.0 | 0.0 | (5.0) | (35.0) | ||||||
| Oritani Financial Corp. (MHC) | NJ | NASDAQ | 01/24/2007 | 1,545.5 | 68.0 | 129.8 | 82.8 | 10.00 | 16.16 | 59.7 | 54.3 | 55.0 | 61.6 | ||||||
| Polonia Bancorp (MHC) | PA | OTCBB | 01/16/2007 | 167.4 | 55.0 | 14.9 | 84.5 | 10.00 | 8.50 | 1.0 | 1.4 | 0.5 | (15.0) | ||||||
| MSB Financial Corp. (MHC) | NJ | NASDAQ | 01/05/2007 | 275.7 | 55.0 | 25.3 | 84.3 | 10.00 | 10.95 | 23.0 | 21.5 | 19.3 | 9.5 | ||||||
| MainStreet Financial Corporation (MHC) | MI | OTCBB | 12/27/2006 | 114.9 | 53.0 | 3.6 | 60.2 | 10.00 | 4.00 | 10.0 | 10.0 | (2.5) | (60.0) | ||||||
| Ben Franklin Financial, Inc. (MHC) | IL | OTCBB | 10/19/2006 | 110.2 | 55.0 | 8.9 | 79.3 | 10.00 | 8.70 | 7.0 | 6.5 | 6.5 | (13.0) | ||||||
| ViewPoint Financial Group (MHC) | TX | NASDAQ | 10/03/2006 | 1,538.6 | 55.0 | 116.0 | 78.1 | 10.00 | 15.60 | 49.9 | 52.5 | 53.9 | 56.0 | ||||||
| Fox Chase Bancorp, Inc. (MHC) | PA | NASDAQ | 10/02/2006 | 735.5 | 55.5 | 64.0 | 79.2 | 10.00 | 12.00 | 29.5 | 27.9 | 30.1 | 20.0 | ||||||
| Roma Financial Corporation (MHC) | NJ | NASDAQ | 07/12/2006 | 796.5 | 69.0 | 98.2 | 79.7 | 10.00 | 14.47 | 41.0 | 45.0 | 46.6 | 44.7 | ||||||
| Seneca-Cayuga Bancorp, Inc. (MHC) | NY | OTCBB | 07/11/2006 | 150.9 | 55.0 | 10.7 | 79.1 | 10.00 | 7.50 | 0.0 | (1.5) | (7.0) | (25.0) | ||||||
| Northeast Community Bancorp, Inc. (MHC) | NY | NASDAQ | 07/06/2006 | 239.4 | 55.0 | 59.5 | 85.8 | 10.00 | 11.56 | 10.0 | 12.0 | 12.0 | 15.6 | ||||||
| Mutual Federal Bancorp, Inc. (MHC) | IL | OTCBB | 04/06/2006 | 64.5 | 70.0 | 10.9 | 74.6 | 10.00 | 11.25 | 11.3 | 10.0 | 14.0 | 12.5 | ||||||
| Lake Shore Bancorp, Inc. (MHC) | NY | NASDAQ | 04/04/2006 | 333.7 | 55.0 | 29.8 | 80.2 | 10.00 | 9.36 | 7.0 | 5.5 | 2.9 | (6.4) | ||||||
| United Community Bancorp (MHC) | IN | NASDAQ | 03/31/2006 | 323.6 | 55.0 | 36.5 | 85.1 | 10.00 | 8.00 | 8.0 | 8.4 | 5.5 | (20.0) | ||||||
| Magyar Bancorp, Inc. (MHC) | NJ | NASDAQ | 01/24/2006 | 359.7 | 54.0 | 26.2 | 82.3 | 10.00 | 10.65 | 6.5 | 5.0 | 6.0 | 6.5 | ||||||
| Greenville Federal Financial Corporation (MHC) | OH | OTCBB | 01/05/2006 | 128.4 | 55.0 | 10.3 | 69.7 | 10.00 | 7.40 | 3.8 | 2.5 | 0.0 | (26.0) | ||||||
| Source: SNL Financial. | |||||||||||||||||||
82
Feldman Financial Advisors, Inc.
Adjustments Conclusion
Based upon our analysis, we believe that downward adjustments are necessary for earnings prospects, subscription interest and new issue discount. Currently, converting thrifts are often valued at substantial discounts to peer institutions relative to price-to-book ratios, but at lesser discounts to the comparable institutions’ price-to-earnings ratios. It is the role of the appraiser to balance the relative dynamics of price-to-book and price-to-earnings discounts and premiums. Due to the lack of earnings at the Company, the price-to-book ratio is the most important guide in determining a value.
Valuation Approach
In determining the estimated pro forma market value of the Company, we have employed the comparative company approach and considered the following pricing ratios: price-to-earnings per share (“P/E”), price-to-book value per share (“P/B”), price-to-tangible book value per share (“P/TB”), and price-to-assets (“P/A”). As the Company is experiencing negative earnings, we have not given any weight to the P/E approach, as it does not present any meaningful benchmark. As such, we have relied primarily on the P/B and P/TB ratios as a pricing guideline.
Table 27 displays the market price valuation ratios of the Comparative Group on a fully converted basis as of June 16, 2008 Averages for the All Public Thrift aggregate are also shown in Table 28. Table 28 also includes the pro forma fully-converted valuation ratios attributable to the Company as compared to the Comparative Group. Table 29 detailed the pro forma MHC valuation ratios attributable to the Company and the Comparative Group. Exhibit IV displays the pro forma assumptions and calculations utilized in analyzing the Company’s valuation ratios. In
83
Feldman Financial Advisors, Inc.
reaching our conclusions of the Valuation Range, we evaluated the relationship of the Company’s pro forma valuation ratios relative to the Comparative Group valuation data and recent thrift IPO valuations.
Investors continue to make decisions to purchase thrift conversion stocks and more seasoned thrift issues based upon consideration of core earnings profitability and P/B and P/TB comparisons. The P/B and P/TB ratios are an important valuation ratio in the current thrift stock environment and were a key focus in developing our estimate of the Company’s pro forma market value, due to the Company’s lack of earnings. The Company’s net income for the quarter ending March 31, 2008 was a loss of $261,000 and reflected an ROA of (0.67)%.
The P/B ratio on a fully converted basis for the Comparative Group was 70.8%. In comparison, the All Public Thrift median P/B ratio was 86.8%. In consideration of the foregoing factors along with the additional adjustments discussed in this chapter, we have determined a fully converted pro forma price-to-book and price-to-tangible book ratio of 55.4% for the Company, which reflects an aggregate midpoint value of $18.0 million based on the assumptions summarized in Exhibit IV. Employing a range of 15% above and below the midpoint, the resulting minimum value of $15.3 million reflects a 50.7% P/B ratio and the resulting maximum value of approximately $20.7 million reflects a 59.4% P/B ratio. The adjusted maximum, an additional 15.0% above the maximum, is positioned at approximately $23.8 million and a P/B ratio of 63.4%.
The Company’s pro forma midpoint P/B ratio of 55.4% reflects a 21.8% discount to the Comparative Group median P/B ratio of 70.8% and a 36.2% discount to the All Public Thrift median of 86.8%. At the maximum, the Company’s pro forma P/B ratio of 59.4% reflects a
84
Feldman Financial Advisors, Inc.
16.0% discount to the Comparative Group median and a 31.6% discount to the All Public Thrift median. At the minimum, the Company’s pro forma P/B ratio of 50.7% reflects a 28.3% discount to the Comparative Group median and a 41.6% discount to the All Public Thrift median.
The P/TB ratio on a fully converted basis for the Comparative Group was 70.8%. In comparison, the All Public Thrift median P/B ratio was 95.0%. The Company’s pro forma midpoint P/TB ratio of 55.4% reflects a 21.8% discount to the Comparative Group median P/B ratio of 70.8% and a 41.7% discount to the All Public Thrift median of 95.0%. At the maximum, the Company’s pro forma P/B ratio of 59.4% reflects a 16.1% discount to the Comparative Group median and a 37.4% discount to the All Public Thrift median. At the minimum, the Company’s pro forma P/B ratio of 50.7% reflects a 28.4% discount to the Comparative Group median and a 46.6% discount to the All Public Thrift median.
Based on the P/A measure, the Company’s pro forma midpoint of $18.0 million reflects a corresponding valuation ratio of 9.9%, ranging from 8.5% at the minimum to 11.2% and 12.7% at the maximum and adjusted maximum, respectively.
Table 29 compares the Company’s pro forma valuation ratios, assuming sale of 45% of the outstanding common stock, with the reported market valuation ratios of the Comparative Group as reflected by their respective MHC ownership profiles. The Company’s pro forma midpoint P/B and P/TB ratio of 76.0% reflects a 31.5% discount to the Comparative Group median P/B of 111.0% and a 34.4% discount to the Comparative Group median P/TB ratio of 115.9%. At the maximum, the Company’s pro forma P/B and P/TB ratios of 83.7% reflects a 24.6% discount to the Comparative Group median P/B and a 27.8% discount to the Comparative Group median P/TB ratio. At the minimum, the Company’s pro forma P/B and P/TB ratios of
85
Feldman Financial Advisors, Inc.
67.6% reflects a 39.1% discount to the Comparative Group median P/B and a 41.7% discount to the Comparative Group median P/TB ratio. Based on the P/A measure, the Company’s pro forma midpoint under the MHC basis reflects a corresponding valuation ratio of 10.4%, ranging from 8.9% at the minimum to 11.6% and 13.5% at the maximum and adjusted maximum, respectively. The Company’s pro forma P/A ratio of 11.9% at the maximum reflects a 7.8% discount to the Comparative group median of 12.9%. At the minimum, the pro forma P/A ratio of 8.9% reflects a 31.0% discount to the Comparative Group median.
Valuation Conclusion
It is our opinion that, as of June 16, 2008, the aggregate estimated pro forma market value of the Company on a fully converted basis was within the Valuation Range of $15,300,000 to $20,700,000 with a midpoint of $18,000,000. The Valuation Range was based upon a 15% decrease from the midpoint to determine the minimum and a 15% increase to establish the maximum. An additional 15% increase above the maximum results in an adjusted maximum of $23,805,000. Exhibit IV displays the assumptions and calculations utilized in determining the Company’s estimated pro forma market value on a fully converted basis. Exhibit V displays the Company’s resulting pro forma data assuming a sale of 45% of the aggregate pro forma market value of common stock in the MHC Stock Offering.
86
Feldman Financial Advisors, Inc.
| Table 27 | ||||||||||||||||
| Fully Converted Market Valuation Analysis | ||||||||||||||||
| Comparative Group | ||||||||||||||||
| Computed from Market Price Data as of June 16, 2008 | ||||||||||||||||
| Pro Forma Fully Converted | Pro Forma Fully Converted | |||||||||||||||
| Current | Financial Data | Market Valuation Ratios | ||||||||||||||
| MHC | Gross | Total | Tang. | Price/ | Price/ | Price/ | Price/ | Price/ | ||||||||
| Owner- | Stock | Net | LTM | LTM | Equity/ | Equity/ | LTM | Core | Book | Tang. | Total | |||||
| ship | Proceeds | Income | ROA | ROE | Assets | Assets | EPS | EPS | Value | Book | Assets | |||||
| Company | (%) | ($Mil.) | ($Mil.) | (%) | (%) | (%) | (%) | (x) | (x) | (%) | (%) | (%) | ||||
| Comparative Group Average | 59.5 | 23.0 | 0.7 | 0.28 | 1.25 | 19.67 | 19.63 | 24.4 | 42.1 | 70.3 | 72.8 | 14.16 | ||||
| Comparative Group Median | 57.1 | 13.6 | 0.5 | 0.17 | 0.61 | 16.97 | 17.04 | 21.2 | 30.7 | 70.8 | 70.8 | 12.01 | ||||
| Comparative Group | ||||||||||||||||
| BV Financial, Inc. (MHC) | 59.9 | 9.5 | (0.1) | (0.06) | (0.41) | 14.53 | NA | NA | NA | 63.5 | NA | 9.23 | ||||
| FSB Community Bankshares, Inc. (MHC) | 53.0 | 7.6 | (0.3) | (0.13) | (0.99) | 13.33 | 13.33 | NA | NA | 54.0 | 54.0 | 7.20 | ||||
| Heritage Financial Group (MHC) | 73.6 | 86.6 | 2.6 | 0.47 | 1.89 | 25.02 | 24.84 | 40.9 | 37.9 | 84.1 | 84.8 | 21.05 | ||||
| Kentucky First Federal Bancorp (MHC) | 58.4 | 46.3 | 0.8 | 0.27 | 0.78 | 34.13 | 29.01 | NM | 92.8 | 79.1 | 93.1 | 27.00 | ||||
| Mid-Southern Savings Bank, FSB (MHC) | 70.8 | 15.9 | 0.9 | 0.48 | 2.86 | 16.65 | 16.65 | 23.5 | 23.5 | 70.8 | 70.8 | 11.79 | ||||
| Ottawa Savings Bancorp, Inc. (MHC) | 56.1 | 15.3 | 1.4 | 0.61 | 3.89 | 15.73 | 15.73 | 19.0 | NA | 77.8 | 77.8 | 12.23 | ||||
| Polonia Bancorp (MHC) | 55.0 | 15.5 | (0.3) | (0.14) | (0.82) | 17.54 | 17.54 | NA | NA | 74.9 | 74.9 | 13.13 | ||||
| Seneca-Cayuga Bancorp, Inc. (MHC) | 55.0 | 9.8 | 0.0 | 0.02 | 0.12 | 16.91 | 16.67 | NM | NA | 66.1 | 67.0 | 11.17 | ||||
| SFSB, Inc. (MHC) | 58.1 | 11.3 | 0.1 | 0.07 | 0.43 | 17.04 | 17.04 | NM | NM | 61.7 | 61.7 | 10.51 | ||||
| Wake Forest Bancshares, Inc. (MHC) | 54.8 | 11.9 | 1.5 | 1.23 | 4.77 | 25.85 | 25.85 | 14.2 | 14.2 | 70.7 | 70.7 | 18.28 | ||||
| Source: SNL Financial; Feldman Financial computations. | ||||||||||||||||
87
Feldman Financial Advisors, Inc.
| Table 28 | |||||||||||
| Comparative Fully Converted Market Valuation Analysis | |||||||||||
| Sunshine Financial, Inc. and the Comparative Group | |||||||||||
| Computed from Market Price Data as of June 16, 2008 | |||||||||||
| Current | Total | Price/ | Price/ | Price/ | Price/ | Price/ | Total | Current | |||
| Stock | Market | LTM | Core | Book | Tang. | Total | Equity/ | Dividend | |||
| Price | Value | EPS | EPS | Value | Book | Assets | Assets | Yield | |||
| Company | ($) | ($Mil.) | (x) | (x) | (%) | (%) | (%) | (%) | (%) | ||
| Sunshine Financial, Inc. | |||||||||||
| Pro Forma Minimum | 10.00 | 15.3 | NA | NA | 50.7 | 50.7 | 8.50 | 16.75 | 0.00 | ||
| Pro Forma Midpoint | 10.00 | 18.0 | NA | NA | 55.4 | 55.4 | 9.87 | 17.82 | 0.00 | ||
| Pro Forma Maximum | 10.00 | 20.7 | NA | NA | 59.4 | 59.4 | 11.20 | 18.86 | 0.00 | ||
| Pro Forma Adj. Maximum | 10.00 | 23.8 | NA | NA | 63.4 | 63.4 | 12.70 | 20.03 | 0.00 | ||
| Comparative Group Average | NA | 36.4 | 24.4 | 42.1 | 70.3 | 72.8 | 14.16 | 19.67 | 1.90 | ||
| Comparative Group Median | NA | 22.1 | 21.2 | 30.7 | 70.8 | 70.8 | 12.01 | 16.97 | 2.07 | ||
All Public Thrift Average(2) | NA | 464.7 | 15.6 | 16.0 | 88.1 | 104.2 | 10.09 | 11.16 | 2.84 | ||
All Public Thrift Median(2) | NA | 76.0 | 14.3 | 14.5 | 86.8 | 95.0 | 8.42 | 9.13 | 2.91 | ||
Comparative Group(1) | |||||||||||
| BV Financial, Inc. (MHC) | 6.55 | 15.9 | NA | NA | 63.5 | NA | 9.23 | 14.53 | 3.05 | ||
| FSB Community Bankshares, Inc. (MHC) | 8.05 | 14.4 | NA | NA | 54.0 | 54.0 | 7.20 | 13.33 | 0.00 | ||
| Heritage Financial Group (MHC) | 11.01 | 117.6 | 40.9 | 37.9 | 84.1 | 84.8 | 21.05 | 25.02 | 2.54 | ||
| Kentucky First Federal Bancorp (MHC) | 9.79 | 79.2 | NM | 92.8 | 79.1 | 93.1 | 27.00 | 34.13 | 4.09 | ||
| Mid-Southern Savings Bank, FSB (MHC) | 15.25 | 22.4 | 23.5 | 23.5 | 70.8 | 70.8 | 11.79 | 16.65 | 3.44 | ||
| Ottawa Savings Bancorp, Inc. (MHC) | 12.50 | 27.3 | 19.0 | NA | 77.8 | 77.8 | 12.23 | 15.73 | 1.60 | ||
| Polonia Bancorp (MHC) | 8.50 | 28.1 | NA | NA | 74.9 | 74.9 | 13.13 | 17.54 | 0.00 | ||
| Seneca-Cayuga Bancorp, Inc. (MHC) | 7.50 | 17.9 | NM | NA | 66.1 | 67.0 | 11.17 | 16.91 | 0.00 | ||
| SFSB, Inc. (MHC) | 6.90 | 19.4 | NM | NM | 61.7 | 61.7 | 10.51 | 17.04 | 0.00 | ||
| Wake Forest Bancshares, Inc. (MHC) | 18.75 | 21.7 | 14.2 | 14.2 | 70.7 | 70.7 | 18.28 | 25.85 | 4.27 | ||
| (1) Fully-converted valuation assumes sale of 100% of common stock for for the Comparative Group. | |||||||||||
| (2) Excludes existing MHC companies and companies subject to announced acquisitions. | |||||||||||
| Source: Sunshine Savings Bank; SNL Financial; Feldman Financial. | |||||||||||
88
Feldman Financial Advisors, Inc.
| Table 29 | |||||||||||
| Pro Forma Comparative MHC Valuation Analysis | |||||||||||
| Sunshine Financial, Inc. and the Comparative Group | |||||||||||
| Computed from Market Price Data as of June 16, 2008 | |||||||||||
| Current | Total | Price/ | Price/ | Price/ | Price/ | Price/ | Total | Current | |||
| Stock | Market | LTM | Core | Book | Tang. | Total | Equity/ | Dividend | |||
| Price | Value | EPS | EPS | Value | Book | Assets | Assets | Yield | |||
| Company | ($) | ($Mil.) | (x) | (x) | (%) | (%) | (%) | (%) | (%) | ||
Sunshine Financial (1) | |||||||||||
| Pro Forma Minimum | 10.00 | 6.9 | NA | NA | 67.6 | 67.6 | 8.9 | 13.1 | 0.00 | ||
| Pro Forma Midpoint | 10.00 | 8.1 | NA | NA | 76.0 | 76.0 | 10.4 | 13.6 | 0.00 | ||
| Pro Forma Maximum | 10.00 | 9.3 | NA | NA | 83.7 | 83.7 | 11.9 | 14.2 | 0.00 | ||
| Pro Forma Adjusted Maximum | 10.00 | 10.7 | NA | NA | 91.7 | 91.7 | 13.5 | 14.8 | 0.00 | ||
| Comparative Group Average | NA | 35.9 | 24.6 | 56.0 | 112.4 | 119.6 | 15.33 | 13.42 | 1.90 | ||
| Comparative Group Median | NA | 22.1 | 21.5 | 37.9 | 111.0 | 115.9 | 12.85 | 12.17 | 2.07 | ||
Comparative Group(1) | |||||||||||
| BV Financial, Inc. (MHC) | 6.55 | 15.9 | NM | NM | 94.5 | NA | 9.7 | 10.26 | 3.05 | ||
| FSB Community Bankshares, Inc. (MHC) | 8.05 | 14.4 | NA | NA | 69.0 | 69.0 | 7.2 | 10.38 | 0.00 | ||
| Heritage Financial Group (MHC) | 11.01 | 117.7 | 40.8 | 37.9 | 180.2 | 183.0 | 24.3 | 13.48 | 2.54 | ||
| Kentucky First Federal Bancorp (MHC) | 9.79 | 74.9 | NM | 89.0 | 124.4 | 165.7 | 29.6 | 23.79 | 4.09 | ||
| Mid-Southern Savings Bank, FSB (MHC) | 15.25 | 22.4 | 23.8 | 23.8 | 124.6 | 124.6 | 12.7 | 10.20 | 3.44 | ||
| Ottawa Savings Bancorp, Inc. (MHC) | 12.50 | 26.6 | 19.2 | NA | 124.5 | 124.5 | 13.0 | 10.44 | 1.60 | ||
| Polonia Bancorp (MHC) | 8.50 | 27.9 | NM | NM | 115.9 | 115.9 | 14.0 | 12.07 | 0.00 | ||
| Seneca-Cayuga Bancorp, Inc. (MHC) | 7.50 | 17.9 | NM | NM | 96.2 | 98.2 | 11.8 | 12.27 | 0.00 | ||
| SFSB, Inc. (MHC) | 6.90 | 19.4 | NM | 115.0 | 89.2 | 89.2 | 11.1 | 12.44 | 0.00 | ||
| Wake Forest Bancshares, Inc. (MHC) | 18.75 | 21.7 | 14.5 | 14.5 | 106.0 | 106.0 | 20.0 | 18.86 | 4.27 | ||
| (1) Pro forma market valuation ratios assume sale of 45% of common stock for Sunshine Savings, reflecting $15.3 million at the minimum, | |||||||||||
| $18.0 million at the midpoint, $20.7 million at the maximum, and $23.8 million at the adjusted maximum | |||||||||||
| (1) Reported market valuation ratios reflect current MHC ownership. | |||||||||||
| Source: Sunshine Savings; SNL Financial; Feldman Financial. | |||||||||||
89
Feldman Financial Advisors, Inc.
Exhibit I
Background of Feldman Financial Advisors, Inc.
Overview of Firm
Feldman Financial Advisors provides consulting and advisory services to financial institutions and mortgage companies in the areas of corporate valuations, mergers and acquisitions, strategic planning, branch sales and purchases, developing and implementing regulatory business and capital plans, and expert witness testimony and analysis. Our senior staff members have been involved in the stock conversion process since 1982 and have valued more than 350 converting institutions.
Feldman Financial Advisors was incorporated in February 1996 by a group of consultants who were previously associated with CS First Boston and Kaplan Associates. Each of the principals at Feldman Financial Advisors has more than 10 years experience in consulting and all were officers of their prior firm. Our senior staff collectively has worked with more than 1,000 banks, thrifts and mortgage companies nationwide. The firm’s office is located in Washington, D.C.
Background of Senior Professional Staff
Trent Feldman - President. Trent is a nationally recognized expert in providing strategic advice to and valuing service companies, and advising on mergers and acquisitions. Trent was with Kaplan Associates for 14 years and was one of three founding principals at that firm. Trent also has worked at the Federal Home Loan Bank Board and with the California legislature. Trent holds Bachelors and Masters Degrees from the University of California at Los Angeles.
Peter Williams - Principal. Peter specializes in merger and acquisition analysis, stock and other corporate valuations, strategic business plans and retail delivery analysis. Peter was with Kaplan Associates for 13 years. Peter also served as a Corporate Planning and Development Analyst with the Wilmington Trust Company in Delaware. Peter holds a BA in Economics from Yale University and an MBA in Finance and Investments from George Washington University.
Michael Green - Principal. Mike is an expert in mergers and acquisition analysis, financial institution and corporate valuations, and strategic and business plans. During Mike’s 10 years at Kaplan Associates, his experience also included business restructurings, litigation support, mark-to-market analysis, and goodwill valuations. Mike holds a BA in Finance and Economics from Rutgers College.
Greg Izydorczyk - Senior Vice President. Greg specializes in merger and acquisition analysis and corporate valuations and also has experience in mark-to-market analysis and business plans. Greg was with Kaplan Associates for three years. Previous, Greg worked as a Senior Auditor for First Virginia Bank and Integra Financial and as a Financial Analyst with Airbus Industrie of N.A. Greg holds a BS in Finance from Pennsylvania State University and an MBA in Finance from the Katz Graduate School, University of Pittsburgh.
I-1
Feldman Financial Advisors, Inc.
Exhibit II-1
Statement of Financial Condition
As of March 31, 2008 and December 31, 2007 and 2006
(Dollars in Thousands)
| At March 31, | At December 31, | |||||||||||
| 2008 | 2007 | 2006 | ||||||||||
| (unaudited) | ||||||||||||
| Assets | ||||||||||||
| Cash and due from banks | $ | 1,408 | $ | 2,127 | $ | 2,130 | ||||||
| Interest-bearing deposits with banks | 3,094 | 17,386 | 8,571 | |||||||||
| Federal funds sold | 29,717 | 5,002 | 0 | |||||||||
| Cash and equivalents | 34,219 | 24,515 | 10,701 | |||||||||
| Loans, net | 126,284 | 125,602 | 118,021 | |||||||||
| Premises and equipment, net | 3,553 | 3,553 | 3,806 | |||||||||
| Federal Home Loan Bank stock, at cost | 283 | 246 | 291 | |||||||||
| Deferred income taxes | 728 | 570 | 0 | |||||||||
| Accrued interest receivable | 421 | 458 | 477 | |||||||||
| NCUSIF deposit | 0 | 0 | 1,118 | |||||||||
| Other assets | 1,959 | 1,981 | 2,148 | |||||||||
| Total assets | $ | 167,447 | $ | 156,925 | $ | 136,562 | ||||||
| Liabilities and Retained Earnings | ||||||||||||
Liabilities: | ||||||||||||
| Non-interest bearing demand accounts | $ | 21,827 | $ | 20,330 | $ | 22,434 | ||||||
| Money market deposit accouts | 18,251 | 18,381 | 21,928 | |||||||||
| Savings accounts | 31,948 | 31,204 | 34,396 | |||||||||
| Time deposits | 76,834 | 67,653 | 39,319 | |||||||||
| Total deposits | 148,860 | 137,568 | 118,077 | |||||||||
| Borrowings | 0 | 500 | 0 | |||||||||
| Official checks | 289 | 296 | 274 | |||||||||
| Other liabilities | 774 | 776 | 733 | |||||||||
| Total liabilities | 149,923 | 139,140 | 119,084 | |||||||||
| Appropriates regular reserve | 0 | 0 | 3,002 | |||||||||
| Retained earnings | 17,524 | 17,785 | 14,476 | |||||||||
| Total liabilities and retained earnings | $ | 167,447 | $ | 156,925 | $ | 136,562 | ||||||
Source: Sunshine Savings Bank, unaudited financial statements.
II-1
Feldman Financial Advisors, Inc.
Exhibit II-2
Statement of Operations
For the Quarters Ended March 31, 2008 and 2007
and the Years Ended December 31, 2007 and 2006
(Dollars in Thousands)
| Three Months Ended | Year Ended | |||||||||||||||
| March 31, | December 31, | |||||||||||||||
| 2008 | 2007 | 2007 | 2006 | |||||||||||||
| Interest Income | ||||||||||||||||
| Loans | $ | 2,036 | $ | 2,120 | $ | 8,560 | $ | 8,805 | ||||||||
| Other | 196 | 90 | 459 | 577 | ||||||||||||
| Total interest income | 2,232 | 2,210 | 9,019 | 9,382 | ||||||||||||
| Interest expense on deposit accounts | 1,052 | 645 | 3,227 | 2,209 | ||||||||||||
| Net interest income | 1,180 | 1,565 | 5,792 | 7,173 | ||||||||||||
| Provision for loan losses | 225 | 225 | 898 | 897 | ||||||||||||
| Net interest income after provisions | 955 | 1,340 | 4,894 | 6,276 | ||||||||||||
| Noninterest income | ||||||||||||||||
| Fees and service charges on deposit accounts | 470 | 527 | 2,142 | 2,250 | ||||||||||||
| Fees and charges on loans | 54 | 104 | 296 | 334 | ||||||||||||
| Other | 0 | 0 | 9 | (13 | ) | |||||||||||
| Total noninterest income | 524 | 631 | 2,447 | 2,571 | ||||||||||||
| Noninterest expense | ||||||||||||||||
| Salaries and employee benefits | 1,148 | 1,094 | 4,364 | 4,178 | ||||||||||||
| Occupancy and equipment | 299 | 228 | 1,012 | 970 | ||||||||||||
| Data processing services | 164 | 179 | 831 | 1,005 | ||||||||||||
| Professional fees | 46 | 91 | 236 | 471 | ||||||||||||
| Advertising and promotion | 59 | 29 | 165 | 211 | ||||||||||||
| Stationery and supplies | 25 | 17 | 122 | 92 | ||||||||||||
| Other | 156 | 208 | 874 | 999 | ||||||||||||
| Total noninterest expense | 1,897 | 1,846 | 7,604 | 7,926 | ||||||||||||
| Earnings (loss) before income tax benefit | (418 | ) | 125 | (263 | ) | 921 | ||||||||||
| Income tax benefit | (157 | ) | 0 | (570 | ) | 0 | ||||||||||
| Net earnings (loss) | $ | (261 | ) | $ | 125 | $ | 307 | $ | 921 | |||||||
| Retained earnings at beginning of period | 17,785 | 17,478 | 17,478 | 16,557 | ||||||||||||
| Retained earnings at end of period | $ | 17,524 | $ | 17,603 | $ | 17,785 | $ | 17,478 | ||||||||
Source: Sunshine Savings Bank, unaudited financial statements.
II-2
Feldman Financial Advisors, Inc.
Exhibit II-3
Loan Portfolio Composition
As of March 31, 2008 and December 31, 2006 to 2007
(Dollars in Thousands)
| March 31, | December 31, | |||||||||||||||||||||||
| 2008 | 2007 | 2006 | ||||||||||||||||||||||
| Amount | Percent | Amount | Percent | Amount | Percent | |||||||||||||||||||
| Real estate loans: | (Dollars in thousands) | |||||||||||||||||||||||
| One- to four-family | $ | 77,537 | 60.76 | % | 75834 | 59.68 | % | 65547 | 54.88 | % | ||||||||||||||
| Construction or development | 708 | 0.56 | 592 | 0.47 | 0 | 0 | ||||||||||||||||||
| Total real estate loans | 78,245 | 61.32 | 76426 | 60.15 | 65547 | 54.88 | ||||||||||||||||||
| Consumer loans: | ||||||||||||||||||||||||
| Home equity | 19,026 | 14.91 | 19,032 | 14.99 | 15,547 | 13.02 | ||||||||||||||||||
| Automobile | 14,723 | 11.54 | 16,236 | 12.78 | 20,936 | 17.53 | ||||||||||||||||||
| Credit cards and unsecured | 11,874 | 9.3 | 12,653 | 9.96 | 14,537 | 12.17 | ||||||||||||||||||
| Deposit account | 1,520 | 1.19 | 1,816 | 1.42 | 1,979 | 1.66 | ||||||||||||||||||
| Other | 2216 | 1.74 | 905 | 0.7 | 881 | 0.74 | ||||||||||||||||||
| Total consumer loans | 49,359 | 38.68 | 50,642 | 39.85 | 53,880 | 45.12 | ||||||||||||||||||
| Total loans | $ | 127,604 | 100.00 | % | $ | 127,068 | 100.00 | % | $ | 119,427 | 100.00 | % | ||||||||||||
| Less: | ||||||||||||||||||||||||
| Loans in process | (175 | ) | (7 | ) | (215 | ) | ||||||||||||||||||
| Deferred fees and discounts | 42 | 50 | 95 | |||||||||||||||||||||
| Allowance for losses | 1,453 | 1,423 | 1,526 | |||||||||||||||||||||
| Total loans, net | $ | 126,284 | $ | 125,602 | $ | 118,021 | ||||||||||||||||||
Source: Sunshine Savings Bank, preliminary prospectus.
II-3
Feldman Financial Advisors, Inc.
Exhibit II-4
Deposit Account Distribution
As of March 31, 2008 and December 31, 2006 to 2007
(Dollars in Thousands)
| March 31, | December 31, | |||||||||||||||||||||||||
| 2008 | 2007 | 2006 | ||||||||||||||||||||||||
| Amount | Percent | Amount | Percent | Amount | Percent | |||||||||||||||||||||
| of total | of total | of total | ||||||||||||||||||||||||
| Transactions and Savings Deposits: | ||||||||||||||||||||||||||
| Non interest-bearing demand | $ | 21,827 | 14.7 | % | $ | 20,330 | 14.8 | % | $ | 22,434 | 19.0 | % | ||||||||||||||
| Statement savings | 27,801 | 18.7 | 27,091 | 19.7 | 30,090 | 25.5 | ||||||||||||||||||||
| Money market | 18,251 | 12.3 | 18,381 | 13.4 | 21,928 | 18.6 | ||||||||||||||||||||
| IRA | 4,147 | 2.8 | 4,114 | 3.0 | 4,306 | 3.6 | ||||||||||||||||||||
| Total non-certificates | 72,026 | 48.4 | % | 69,916 | 50.8 | % | 78,758 | 66.7 | % | |||||||||||||||||
| Certificates: | ||||||||||||||||||||||||||
| 2.00 - 3.99% | 7,925 | 5.3 | % | 5,109 | 3.7 | % | 11,033 | 9.3 | % | |||||||||||||||||
| 4.00 - 5.99% | 68,787 | 46.2 | 62,423 | 45.4 | 28,286 | 24.0 | ||||||||||||||||||||
| 6.00 - 7.99% | 122 | 0.1 | 120 | 0.1 | 0 | 0.0 | ||||||||||||||||||||
| Total certificates | 76,834 | 51.6 | 67,652 | 49.2 | 39,319 | 33.3 | ||||||||||||||||||||
| Total deposits | $ | 148,860 | 100.0 | % | $ | 137,568 | 100.0 | % | $ | 118,077 | 100.0 | % | ||||||||||||||
Source: Sunshine Savings Bank, preliminary prospectus.
II-4
Feldman Financial Advisors, Inc.
| Exhibit III | |||||||||||||||
| Financial Performance and Market Valuation Data for All Public Thrifts | |||||||||||||||
| Based on Closing Market Prices as of June 16, 2008 | |||||||||||||||
| Total | Tang. | Closing | Total | Price/ | Price/ | Price/ | Price/ | Price/ | |||||||
| Total | LTM | LTM | Equity/ | Equity/ | Price | Market | LTM | Core | Book | Tang. | Total | Div. | |||
| Assets | ROA | ROE | Assets | Assets | 6/16/08 | Value | EPS | EPS | Value | Book | Assets | Yield | |||
| Company | Ticker | State | ($Mil.) | (%) | (%) | (%) | (%) | ($) | ($Mil.) | (x) | (x) | (%) | (%) | (%) | (%) |
All Public Thrifts (non-MHCs) | |||||||||||||||
| Abington Bancorp, Inc. | ABBC | PA | 1,108 | 0.72 | 3.37 | 22.56 | 22.56 | 10.05 | 245.7 | 31.4 | 31.4 | 98.3 | 98.3 | 22.18 | 1.99 |
| Ameriana Bancorp | ASBI | IN | 445 | 0.37 | 4.86 | 7.51 | 7.33 | 9.00 | 26.9 | 17.0 | 17.3 | 80.5 | 81.9 | 6.04 | 1.78 |
| American Bancorp of New Jersey, Inc. | ABNJ | NJ | 624 | 0.03 | 0.16 | 14.96 | 14.96 | 10.75 | 119.7 | NM | NM | 128.2 | 128.2 | 19.18 | 1.86 |
| Anchor BanCorp Wisconsin Inc. | ABCW | WI | 5,150 | 0.63 | 9.17 | 6.70 | 5.37 | 11.13 | 237.6 | 7.5 | 7.6 | 68.8 | NA | 4.61 | 6.47 |
| Astoria Financial Corporation | AF | NY | 21,454 | 0.55 | 9.79 | 5.74 | 4.91 | 22.93 | 2,203.0 | 17.6 | 16.0 | 168.1 | 198.0 | 9.64 | 4.54 |
| Bank Mutual Corporation | BKMU | WI | 3,548 | 0.50 | 3.83 | 11.92 | 10.54 | 11.30 | 545.1 | 34.2 | 34.6 | 128.4 | 149.1 | 15.31 | 3.19 |
| BankAtlantic Bancorp, Inc. | BBX | FL | 6,391 | (0.80) | (10.47) | 6.79 | 5.67 | 1.79 | 92.0 | NM | NM | 23.2 | 28.0 | 1.57 | 1.12 |
| BankFinancial Corporation | BFIN | IL | 1,475 | 0.58 | 2.87 | 19.63 | 17.97 | 15.03 | 330.1 | 35.0 | 40.1 | 114.1 | 127.3 | 22.41 | 1.86 |
| BankUnited Financial Corporation | BKUNA | FL | 14,344 | (0.43) | (7.66) | 4.94 | 4.75 | 3.48 | 122.4 | NM | NM | 17.7 | 18.5 | 0.87 | 0.57 |
| BCSB Bancorp, Inc. | BCSB | MD | 622 | 0.07 | 1.26 | 5.81 | 5.43 | 11.50 | 35.9 | NM | 85.4 | 99.4 | 106.7 | 5.77 | - |
| Beacon Federal Bancorp, Inc. | BFED | NY | 944 | 0.37 | 4.15 | 11.85 | 11.85 | 10.75 | 79.5 | NA | NA | 71.0 | 71.0 | 8.42 | 1.49 |
| Benjamin Franklin Bancorp, Inc. | BFBC | MA | 959 | 0.46 | 3.86 | 11.16 | 7.69 | 13.57 | 104.0 | 24.7 | 26.8 | 97.3 | 146.7 | 10.86 | 2.36 |
| Berkshire Hills Bancorp, Inc. | BHLB | MA | 2,546 | 0.62 | 4.86 | 12.91 | 6.19 | 24.91 | 260.9 | 16.7 | 14.5 | 79.4 | 178.3 | 10.25 | 2.57 |
| BFC Financial Corporation | BFF | FL | 7,109 | (0.49) | (19.81) | 2.50 | 1.45 | 0.74 | 33.5 | NM | NA | 20.5 | 38.2 | 0.47 | - |
| BofI Holding, Inc. | BOFI | CA | 1,110 | 0.33 | 4.40 | 6.93 | 6.93 | 7.96 | 66.0 | 22.1 | 30.7 | 91.8 | 91.8 | 5.97 | - |
| Broadway Financial Corporation | BYFC | CA | 381 | 0.48 | 7.51 | 5.92 | 5.92 | 7.55 | 13.3 | 9.1 | 9.1 | 66.4 | 66.4 | 3.51 | 2.65 |
| Brookline Bancorp, Inc. | BRKL | MA | 2,454 | 0.65 | 2.91 | 20.70 | 19.08 | 9.93 | 578.0 | 38.2 | 36.2 | 113.8 | 126.0 | 23.54 | 3.42 |
| Cape Bancorp, Inc. | CBNJ | NJ | 1,161 | NA | NA | 16.05 | 11.86 | 9.55 | 127.1 | NA | NA | 68.2 | 97.0 | 10.95 | - |
| Carver Bancorp, Inc. | CARV | NY | 796 | 0.52 | 7.23 | 6.83 | 6.01 | 8.50 | 21.1 | 5.5 | 5.9 | 38.8 | 44.4 | 2.65 | 4.71 |
| Central Bancorp, Inc. | CEBK | MA | 571 | 0.26 | 3.77 | 6.79 | 6.43 | 15.10 | 24.8 | 14.1 | 19.9 | 63.8 | 67.7 | 4.33 | 4.77 |
| Central Federal Corporation | CFBK | OH | 276 | 0.01 | 0.08 | 9.97 | 9.97 | 4.01 | 16.8 | NM | 33.2 | 65.0 | 65.0 | 6.48 | 4.99 |
| CFS Bancorp, Inc. | CITZ | IN | 1,194 | 0.67 | 6.13 | 11.04 | 10.95 | 14.05 | 150.0 | 18.7 | 19.7 | 113.9 | 114.9 | 12.57 | 3.42 |
| Chicopee Bancorp, Inc. | CBNK | MA | 481 | 0.27 | 1.16 | 20.88 | 20.88 | 13.35 | 91.7 | NM | 100.5 | 92.6 | 92.6 | 19.33 | - |
| Citizens Community Bancorp, Inc. | CZWI | WI | 426 | 0.38 | 1.82 | 17.68 | 16.34 | 8.30 | 56.1 | 37.7 | 37.7 | 74.6 | 82.0 | 13.19 | 2.41 |
| Citizens First Bancorp, Inc. | CTZN | MI | 2,097 | 0.06 | 0.63 | 8.04 | 7.51 | 6.75 | 53.6 | 48.2 | 50.4 | 32.9 | 35.5 | 2.65 | 5.33 |
| Citizens South Banking Corporation | CSBC | NC | 777 | 0.69 | 6.20 | 10.91 | 7.22 | 8.00 | 60.3 | 11.6 | 12.0 | 71.4 | 112.4 | 7.78 | 4.25 |
| CMS Bancorp, Inc. | CMSB | NY | 180 | (0.61) | (4.53) | 12.95 | 12.95 | 10.21 | 20.1 | NM | NM | 86.4 | 86.4 | 11.18 | - |
| Community Financial Corporation | CFFC | VA | 492 | 0.79 | 9.87 | 7.87 | 7.87 | 8.50 | 36.9 | 9.8 | 9.8 | 95.2 | 95.2 | 7.49 | 3.06 |
| Danvers Bancorp, Inc. | DNBK | MA | 1,580 | NA | NA | 14.73 | 14.71 | 11.90 | 212.3 | NA | NA | 91.2 | 91.4 | 13.44 | - |
| Dime Community Bancshares, Inc. | DCOM | NY | 3,640 | 0.68 | 8.31 | 7.42 | 5.98 | 17.26 | 586.2 | 25.0 | 25.4 | 216.6 | 267.2 | 16.06 | 3.24 |
| Downey Financial Corp. | DSL | CA | 13,131 | (2.44) | (24.62) | 8.30 | 8.30 | 4.88 | 135.9 | NM | NM | 12.5 | 12.5 | 1.04 | 9.84 |
| Elmira Savings Bank, FSB | ESBK | NY | 471 | 0.48 | 6.39 | 8.84 | 6.14 | 14.31 | 27.4 | 14.9 | 17.6 | 86.0 | 149.4 | 5.95 | 5.59 |
| ESB Financial Corporation | ESBF | PA | 1,920 | 0.40 | 5.95 | 7.02 | 4.84 | 10.99 | 134.6 | 17.7 | 17.5 | 100.2 | 148.7 | 7.03 | 3.64 |
| ESSA Bancorp, Inc. | ESSA | PA | 968 | (0.43) | (1.92) | 21.64 | 21.64 | 12.80 | 217.4 | NA | NA | 103.8 | 103.8 | 22.46 | 1.25 |
| Federal Trust Corporation | FDT | FL | 673 | (2.32) | (33.46) | 5.54 | 5.54 | 0.70 | 6.6 | NM | NM | 17.6 | 17.6 | 0.98 | - |
| FFD Financial Corporation | FFDF | OH | 180 | 0.78 | 7.50 | 10.11 | 10.11 | 13.92 | 14.9 | 11.2 | 11.2 | 81.9 | 81.9 | 8.28 | 4.74 |
| Fidelity Bancorp, Inc. | FSBI | PA | 739 | 0.53 | 8.29 | 6.41 | 6.07 | 13.53 | 40.9 | 10.7 | 10.3 | 86.3 | 91.5 | 5.53 | 4.14 |
| First Advantage Bancorp | FABK | TN | 286 | 0.17 | 0.82 | 28.14 | 28.14 | 12.05 | 63.4 | NA | NA | 71.3 | 71.3 | 20.06 | - |
| First Bancshares, Inc. | FBSI | MO | 249 | 0.12 | 1.07 | 11.03 | 10.94 | 13.25 | 20.6 | 69.7 | 69.7 | 74.8 | 75.5 | 8.25 | - |
| First BancTrust Corporation | FBTC | IL | 340 | 0.39 | 4.64 | 7.99 | 7.66 | 9.58 | 20.9 | 17.1 | 18.3 | 77.1 | 80.7 | 6.16 | 2.51 |
| First Capital, Inc. | FCAP | IN | 456 | 0.79 | 7.89 | 10.26 | 9.13 | 14.24 | 40.0 | 11.3 | 11.3 | 85.7 | 97.6 | 8.79 | 5.06 |
| First Clover Leaf Financial Corp. | FCLF | IL | 410 | 0.59 | 2.54 | 20.68 | 18.53 | 9.41 | 76.9 | 36.2 | 36.9 | 90.7 | 103.9 | 18.75 | 2.55 |
| First Community Bank Corporation of America | FCFL | FL | 467 | 0.62 | 7.33 | 8.04 | 7.96 | 10.20 | 41.9 | 16.2 | 16.2 | 111.6 | 112.9 | 8.98 | - |
| First Defiance Financial Corp. | FDEF | OH | 1,886 | 0.87 | 8.23 | 10.33 | 7.02 | 19.49 | 158.0 | 10.2 | 9.9 | 81.2 | 124.0 | 8.39 | 5.34 |
| First Federal Bancshares of Arkansas, Inc. | FFBH | AR | 829 | 0.44 | 4.79 | 8.93 | 8.93 | 11.42 | 55.4 | 15.6 | 20.0 | 74.8 | 74.8 | 6.68 | 5.60 |
| First Federal Bankshares, Inc. | FFSX | IA | 597 | (0.40) | (3.69) | 9.66 | 6.78 | 10.50 | 34.7 | NM | NM | 60.1 | 88.4 | 5.80 | - |
| First Federal of Northern Michigan Bancorp, Inc. | FFNM | MI | 245 | (0.64) | (4.94) | 13.26 | 12.05 | 6.40 | 18.5 | NM | NM | 56.9 | 63.5 | 7.54 | 3.13 |
| First Financial Holdings, Inc. | FFCH | SC | 2,889 | 0.80 | 11.80 | 6.46 | 5.73 | 21.05 | 245.6 | 11.3 | 11.5 | 131.6 | 149.5 | 8.50 | 4.85 |
| First Financial Northwest, Inc. | FFNW | WA | 1,203 | NA | NA | 26.22 | 25.34 | 10.30 | 235.4 | NA | NA | 74.6 | 78.2 | 19.57 | 2.91 |
| First Franklin Corporation | FFHS | OH | 323 | 0.13 | 1.66 | 7.93 | 7.93 | 8.25 | 13.9 | 34.4 | 38.4 | 54.1 | 54.1 | 4.29 | 4.36 |
III-1
Feldman Financial Advisors, Inc.
| First Keystone Financial, Inc. | FKFS | PA | 520 | 0.13 | 1.85 | 6.91 | 6.91 | 10.25 | 24.9 | 36.6 | 39.3 | 69.4 | 69.4 | 4.80 | - |
| First Niagara Financial Group, Inc. | FNFG | NY | 9,068 | 1.03 | 6.23 | 15.80 | 7.56 | 14.45 | 1,585.2 | 17.6 | NA | 106.7 | 244.9 | 16.86 | 3.88 |
| First PacTrust Bancorp, Inc. | FPTB | CA | 798 | 0.40 | 3.69 | 10.51 | 10.51 | 14.90 | 64.4 | 20.1 | 19.4 | 74.0 | 74.0 | 7.78 | 4.97 |
| First Place Financial Corp. | FPFC | OH | 3,289 | 0.42 | 4.20 | 9.54 | 6.53 | 11.50 | 188.8 | 14.2 | 10.7 | 60.2 | 90.9 | 5.74 | 5.91 |
| FirstFed Financial Corp. | FED | CA | 7,081 | (0.12) | (1.39) | 8.29 | 8.28 | 10.89 | 149.0 | NM | NM | 25.4 | 25.4 | 2.10 | - |
| Flagstar Bancorp, Inc. | FBC | MI | 15,923 | (0.36) | (7.75) | 4.42 | 4.42 | 3.86 | 279.2 | NM | NM | 33.1 | 33.1 | 1.46 | - |
| Flushing Financial Corporation | FFIC | NY | 3,469 | 0.69 | 9.75 | 6.79 | 6.28 | 19.72 | 422.3 | 17.8 | NA | 178.8 | 194.3 | 12.13 | 2.64 |
| Franklin Bank Corp. | FBTX | TX | 5,723 | (0.71) | (8.57) | 7.21 | 3.82 | 0.97 | 24.6 | NM | NA | 7.4 | 18.2 | 0.43 | - |
| GS Financial Corp. | GSLA | LA | 201 | 0.38 | 2.48 | 14.02 | 14.02 | 16.75 | 21.5 | 29.9 | 29.9 | 76.6 | 76.6 | 10.74 | 2.39 |
| Guaranty Financial Group Inc. | GFG | TX | 16,423 | 0.25 | 3.86 | 5.43 | 4.45 | 5.82 | 260.3 | NA | NA | 24.3 | 30.0 | 1.32 | - |
| Hampden Bancorp, Inc. | HBNK | MA | 524 | 0.31 | 1.61 | 19.79 | 19.79 | 11.10 | 88.2 | 50.5 | 54.2 | 85.0 | 85.0 | 16.83 | 1.08 |
| Harleysville Savings Financial Corporation | HARL | PA | 812 | 0.44 | 7.17 | 5.59 | 5.59 | 12.97 | 46.0 | 14.3 | 14.3 | 101.3 | 101.3 | 5.66 | 5.24 |
| Harrington West Financial Group, Inc. | HWFG | CA | 1,244 | (0.08) | (1.54) | 3.43 | 2.95 | 4.74 | 29.1 | NM | 111.7 | 68.1 | 79.5 | 2.33 | 5.91 |
| HF Financial Corp. | HFFC | SD | 1,068 | 0.53 | 8.46 | 6.14 | 5.70 | 18.00 | 71.0 | 13.7 | 14.3 | 108.6 | 117.4 | 6.66 | 2.39 |
| Hingham Institution for Savings | HIFS | MA | 758 | 0.67 | 8.90 | 7.38 | 7.38 | 31.50 | 66.8 | 13.8 | 13.8 | 119.4 | 119.4 | 8.81 | 2.54 |
| HMN Financial, Inc. | HMNF | MN | 1,105 | 0.85 | 9.64 | 9.00 | 8.68 | 18.70 | 77.9 | 7.6 | 7.6 | 78.4 | 81.5 | 7.05 | 5.35 |
| Home Federal Bancorp, Inc. | HOME | ID | 768 | 0.63 | 3.18 | 26.74 | 26.74 | 10.94 | 189.7 | 37.7 | 37.7 | 92.4 | 92.4 | 24.70 | 2.01 |
| HopFed Bancorp, Inc. | HFBC | KY | 813 | 0.58 | 8.46 | 7.05 | 6.19 | 14.48 | 51.8 | 11.3 | 12.3 | 90.4 | 103.9 | 6.37 | 3.31 |
| Hudson City Bancorp, Inc. | HCBK | NJ | 46,770 | 0.75 | 6.70 | 10.07 | 9.76 | 17.18 | 8,918.7 | 27.3 | 27.3 | 176.2 | 182.6 | 17.75 | 2.56 |
| Independence Federal Savings Bank | IFSB | DC | 154 | (1.49) | (21.03) | 6.67 | 6.67 | 6.25 | 9.7 | NM | NM | 94.1 | 94.1 | 6.28 | - |
| IndyMac Bancorp, Inc. | IMB | CA | 32,305 | (2.38) | (47.48) | 2.97 | 2.60 | 1.45 | 146.3 | NM | NM | 13.3 | 15.2 | 0.39 | - |
| Jefferson Bancshares, Inc. | JFBI | TN | 334 | 0.40 | 1.84 | 21.69 | 21.69 | 9.50 | 59.0 | 41.3 | 41.3 | 81.4 | 81.4 | 17.66 | 2.53 |
| Legacy Bancorp, Inc. | LEGC | MA | 912 | 0.13 | 0.83 | 14.38 | 13.17 | 12.89 | 116.3 | NM | 115.5 | 89.5 | 99.1 | 12.87 | 1.55 |
| Liberty Bancorp, Inc. | LBCP | MO | 336 | 0.61 | 4.13 | 13.16 | 13.16 | 10.04 | 39.9 | 22.3 | 22.7 | 91.0 | 91.0 | 11.97 | 1.00 |
| Louisiana Bancorp, Inc. | LABC | LA | 291 | 1.13 | 3.93 | 31.16 | 31.16 | 13.13 | 83.3 | NA | NA | 91.9 | 91.9 | 28.63 | - |
| LSB Corporation | LSBX | MA | 676 | 0.64 | 6.53 | 9.13 | 9.13 | 15.26 | 68.0 | 18.2 | 20.8 | 110.7 | 110.7 | 10.10 | 3.67 |
| LSB Financial Corp. | LSBI | IN | 354 | 0.38 | 3.80 | 9.65 | 9.65 | 17.75 | 27.6 | 21.4 | 21.4 | 81.0 | 81.0 | 7.81 | 5.63 |
| Mayflower Bancorp, Inc. | MFLR | MA | 244 | 0.44 | 5.35 | 8.16 | 8.15 | 10.00 | 20.9 | 20.4 | 21.9 | 105.2 | 105.3 | 8.58 | 4.00 |
| Meta Financial Group, Inc. | CASH | IA | 811 | 0.78 | 12.11 | 6.52 | 6.30 | 23.78 | 61.7 | 11.7 | NA | 116.7 | 121.2 | 7.62 | 2.19 |
| MutualFirst Financial, Inc. | MFSF | IN | 960 | 0.46 | 5.04 | 9.04 | 7.58 | 11.50 | 47.7 | 10.8 | 11.0 | 55.4 | 67.1 | 5.01 | 5.57 |
| NASB Financial, Inc. | NASB | MO | 1,547 | 0.76 | 7.78 | 9.77 | 9.60 | 20.84 | 164.0 | 14.4 | 14.5 | 108.5 | 110.6 | 10.60 | 4.32 |
| New England Bancshares, Inc. | NEBS | CT | 518 | 0.28 | 1.87 | 13.27 | NA | 10.87 | 62.5 | 51.8 | 49.3 | 90.9 | 121.6 | 12.06 | 1.10 |
| New Hampshire Thrift Bancshares, Inc. | NHTB | NH | 829 | 0.63 | 7.60 | 8.94 | 5.48 | 11.60 | 66.7 | 12.6 | 11.6 | 90.0 | 152.3 | 8.04 | 4.48 |
| New York Community Bancorp, Inc. | NYB | NY | 30,910 | 0.95 | 7.10 | 13.45 | 5.70 | 20.04 | 7,280.5 | 22.3 | 22.6 | 156.2 | 401.6 | 21.01 | 4.99 |
| NewAlliance Bancshares, Inc. | NAL | CT | 8,182 | 0.34 | 1.93 | 17.29 | 10.99 | 12.85 | 1,395.4 | 47.6 | 28.7 | 98.6 | 166.9 | 17.05 | 2.18 |
| Newport Bancorp, Inc. | NFSB | RI | 384 | 0.17 | 0.95 | 15.20 | 15.20 | 12.10 | 54.9 | NM | 93.1 | 94.7 | 94.7 | 14.39 | - |
| North Central Bancshares, Inc. | FFFD | IA | 509 | 0.73 | 9.05 | 8.10 | 7.20 | 22.90 | 30.8 | 8.2 | NA | 74.5 | 84.7 | 6.04 | 6.11 |
| OceanFirst Financial Corp. | OCFC | NJ | 1,905 | 0.54 | 8.53 | 6.47 | 6.47 | 19.67 | 243.2 | 22.1 | 22.1 | 197.3 | 197.3 | 12.76 | 4.07 |
| Osage Bancshares, Inc. | OSBK | OK | 138 | 0.86 | 3.19 | 22.70 | 22.70 | 9.50 | 30.9 | 27.9 | 27.9 | 98.7 | 98.7 | 22.39 | 3.58 |
| Pamrapo Bancorp, Inc. | PBCI | NJ | 652 | 0.64 | 6.99 | 8.98 | 8.98 | 14.60 | 72.6 | 17.6 | 17.6 | 124.2 | 124.2 | 11.14 | 6.30 |
| Park Bancorp, Inc. | PFED | IL | 224 | (0.07) | (0.48) | 13.36 | 13.36 | 18.60 | 22.4 | NM | NM | 73.1 | 73.1 | 9.76 | 2.80 |
| Parkvale Financial Corporation | PVSA | PA | 1,857 | 0.78 | 11.04 | 7.02 | 5.46 | 25.58 | 140.2 | 10.0 | 10.0 | 107.6 | 140.6 | 7.55 | 3.44 |
| Peoples Community Bancorp, Inc. | PCBI | OH | 872 | (3.66) | (46.67) | 6.01 | 4.21 | 2.65 | 12.8 | NM | NM | 24.5 | 35.6 | 1.47 | - |
| People's United Financial, Inc. | PBCT | CT | 21,107 | 0.86 | 2.92 | 24.72 | 18.82 | 17.06 | 5,902.4 | 37.1 | 31.8 | 108.7 | 154.0 | 26.87 | 3.52 |
| Provident Financial Holdings, Inc. | PROV | CA | 1,674 | 0.27 | 3.46 | 7.60 | 7.60 | 12.25 | 76.0 | 17.5 | 17.7 | 59.8 | 59.8 | 4.54 | 3.27 |
| Provident Financial Services, Inc. | PFS | NJ | 6,397 | 0.60 | 3.63 | 15.80 | NA | 14.71 | 877.8 | 23.4 | 25.2 | 86.8 | 178.3 | 13.72 | 2.99 |
| Provident New York Bancorp | PBNY | NY | 2,824 | 0.77 | 5.32 | 14.46 | 8.97 | 12.39 | 496.8 | 22.9 | 23.6 | 121.7 | 209.3 | 17.59 | 1.94 |
| Pulaski Financial Corp. | PULB | MO | 1,260 | 0.83 | 11.39 | 6.76 | 6.43 | 11.74 | 119.2 | 12.4 | 12.8 | 139.1 | 146.6 | 9.40 | 3.07 |
| PVF Capital Corp. | PVFC | OH | 870 | 0.23 | 2.81 | 8.23 | 8.23 | 9.55 | 74.2 | 36.7 | 31.5 | 103.6 | 103.6 | 8.53 | 3.10 |
| Rainier Pacific Financial Group, Inc. | RPFG | WA | 879 | 0.50 | 4.97 | 9.56 | 9.21 | 10.50 | 67.7 | 14.4 | 15.4 | 75.9 | 79.1 | 7.26 | 2.67 |
| River Valley Bancorp | RIVR | IN | 349 | 0.66 | 9.15 | 7.54 | 7.53 | 16.21 | 26.5 | 11.7 | 11.9 | 100.7 | 100.8 | 7.59 | 5.18 |
| Riverview Bancorp, Inc. | RVSB | WA | 887 | 1.04 | 8.92 | 10.44 | 7.72 | 8.20 | 89.5 | 10.4 | 10.4 | 96.7 | 135.3 | 10.10 | 4.39 |
| Rome Bancorp, Inc. | ROME | NY | 322 | 0.94 | 4.08 | 20.28 | 20.28 | 11.25 | 83.2 | 28.9 | 28.9 | 128.0 | 128.0 | 25.96 | 3.02 |
III-2
Feldman Financial Advisors, Inc.
| Severn Bancorp, Inc. | SVBI | MD | 962 | 1.03 | 10.43 | 10.06 | 10.03 | 7.25 | 73.0 | 7.5 | 7.5 | 75.4 | 75.6 | 7.58 | 3.31 |
| Sovereign Bancorp, Inc. | SOV | PA | 81,913 | (1.59) | (15.60) | 8.15 | 3.72 | 9.23 | 6,112.4 | NM | NM | 68.7 | 148.9 | 5.45 | - |
| Superior Bancorp | SUPR | AL | 2,964 | 0.22 | 1.84 | 11.87 | 5.95 | 11.63 | 116.9 | 17.4 | 17.4 | 33.1 | 70.4 | 3.93 | - |
| Teche Holding Company | TSH | LA | 756 | 1.00 | 10.69 | 8.93 | 8.47 | 38.17 | 80.5 | 11.8 | 12.0 | 119.5 | 126.5 | 10.67 | 3.62 |
| TF Financial Corporation | THRD | PA | 721 | 0.70 | 7.07 | 9.67 | 9.09 | 23.52 | 66.3 | 13.4 | 13.4 | 89.9 | 95.8 | 8.69 | 3.40 |
| TierOne Corporation | TONE | NE | 3,377 | (2.37) | (22.77) | 8.45 | 8.27 | 5.99 | 108.0 | NM | NM | 37.9 | 38.8 | 3.20 | 5.34 |
| Timberland Bancorp, Inc. | TSBK | WA | 655 | 1.17 | 10.00 | 11.43 | 10.51 | 9.40 | 64.7 | 8.5 | 8.5 | 86.4 | 95.0 | 9.88 | 4.68 |
| TrustCo Bank Corp NY | TRST | NY | 3,398 | 1.09 | 15.66 | 7.15 | 7.14 | 7.93 | 600.1 | 16.2 | 16.1 | 246.5 | 247.0 | 17.63 | 5.55 |
| United Community Financial Corp. | UCFC | OH | 2,727 | 0.13 | 1.23 | 10.05 | 8.88 | 5.36 | 161.1 | 48.7 | 59.9 | 58.8 | 67.3 | 5.90 | 3.54 |
| United Financial Bancorp, Inc. | UBNK | MA | 1,153 | 0.52 | 3.26 | 19.81 | 19.79 | 11.89 | 211.2 | 35.0 | 34.0 | 92.5 | 92.6 | 18.31 | 2.35 |
| United Western Bancorp, Inc. | UWBK | CO | 2,146 | 0.54 | 9.79 | 5.25 | 5.25 | 15.33 | 112.2 | 9.9 | 10.0 | 99.7 | 99.7 | 5.23 | 1.57 |
| Washington Federal, Inc. | WFSL | WA | 11,739 | 1.31 | 10.33 | 11.72 | 10.04 | 21.89 | 1,921.7 | 14.0 | 14.0 | 139.7 | 166.7 | 16.37 | 3.84 |
| Washington Mutual, Inc. | WM | WA | 319,668 | (0.62) | (8.25) | 7.02 | NA | 6.75 | 7,106.6 | NM | NM | 31.1 | NA | 1.87 | 0.59 |
| Wayne Savings Bancshares, Inc. | WAYN | OH | 402 | 0.49 | 5.72 | 8.49 | 7.97 | 9.19 | 27.7 | 14.1 | 14.9 | 81.1 | 87.0 | 6.89 | 5.22 |
| Westfield Financial, Inc. | WFD | MA | 1,083 | 0.83 | 2.95 | 26.04 | 26.04 | 9.79 | 310.2 | 35.0 | 36.7 | 109.6 | 109.6 | 28.54 | 2.04 |
| WSB Holdings, Inc. | WSB | MD | 465 | 0.38 | 2.69 | 13.50 | 13.50 | 5.55 | 42.2 | 26.4 | NA | 67.3 | 67.3 | 9.08 | 2.88 |
| WSFS Financial Corporation | WSFS | DE | 3,175 | 0.95 | 13.93 | 6.81 | 6.77 | 47.57 | 292.2 | 10.5 | 11.1 | 135.1 | 137.0 | 9.20 | 1.01 |
| WVS Financial Corp. | WVFC | PA | 439 | 0.93 | 12.71 | 7.27 | 7.27 | 15.91 | 35.4 | 9.1 | 9.1 | 111.4 | 111.4 | 8.10 | 4.02 |
| Average | 6,522 | 0.28 | 2.25 | 11.16 | 10.08 | 464.7 | 15.6 | 16.0 | 88.1 | 104.2 | 10.09 | 2.84 | |||
| Median | 887 | 0.49 | 4.01 | 9.13 | 7.97 | 76.0 | 14.3 | 14.5 | 86.8 | 95.0 | 8.42 | 2.91 | |||
| Note: Includes all public thrifts listed on NYSE, AMEX, and NASDAQ National Market. | |||||||||||||||
III-3
Feldman Financial Advisors, Inc.
Exhibit IV-1
Pro Forma Assumptions for Full Conversion Valuation
| 1. | The total amount of the net offering proceeds was fully invested at the beginning of the applicable period. |
| 2. | The net offering proceeds are invested to yield a return of 1.55%, which represented the yield on one-year U.S. Treasury securities at March 31, 2008. The effective income tax rate was assumed to be 40.0%, resulting in a net after-tax yield of 0.93%. |
| 3. | It is assumed that 8.0% of the shares offered for sale and shares held by the foundation at the initial offering price will be acquired by the Company’s employee stock ownership plan (“ESOP”). Pro forma adjustments have been made to earnings and equity to reflect the impact of the ESOP. The annual expense is estimated based on a ten-year loan period. No reinvestment is assumed on proceeds used to fund the ESOP. |
| 4. | It is assumed that 4.0% of the shares offered for sale and shares held by the foundation at the initial offering price will be acquired by the Company’s restricted stock plan (“RSP”). Pro forma adjustments have been made to earnings and equity to reflect the impact of the RSP. The annual expense is estimated based on a five-year vesting period. No reinvestment is assumed on proceeds used to fund the RSP. |
| 5. | It is assumed that the stock option plan had been approved by stockholders of Sunshine Financial, Inc. and that Sunshine Financial, Inc. had reserved for future issuance upon the exercise of options to be granted under the plan an amount of stock equal to 10.0% of the of the shares offered for sale and shares held by the foundation. We assumed that options for all shares reserved under the plan were granted to plan participants at the beginning of the period and that 30% of the options granted were non-qualified options for income tax purposes. We assumed that the options would vest at a rate of 20% per year and that compensation expense would be recognized on a straight-line basis over the 5-year vesting period. |
| 6. | Fixed offering expenses are estimated at $660,000. |
| 7. | Marketing fees for the stock offering are estimated at 1.25% of the amount of stock sold in the offering, excluding sales to directors, officers, employees, and stock-benefit plans. |
| 8. | No effect has been given to withdrawals from deposit accounts for the purpose of purchasing common stock in the offering. |
| 9. | No effect has been given in the pro forma equity calculation for the assumed earnings on the net proceeds. |
IV-1
Feldman Financial Advisors, Inc.
| Exhibit IV-2 | ||||||||
| Pro Forma Fully Converted Valuation Range | ||||||||
| Sunshine Financial, Inc. | ||||||||
| Historical Financial Data as of March 31, 2008 | ||||||||
| (Dollars in Thousands, Except Per Share Data) | ||||||||
| Minimum | Midpoint | Maximum | Adj. Max. | |||||
| Shares offered | 1,530,000 | 1,800,000 | 2,070,000 | 2,380,500 | ||||
| Shares sold | 100% | 1,530,000 | 1,800,000 | 2,070,000 | 2,380,500 | |||
| Offering price | $10.00 | $10.00 | $10.00 | $10.00 | ||||
| Gross proceeds | $15,300 | $18,000 | $20,700 | $23,805 | ||||
| Less: estimated expenses | (830) | (861) | (892) | (928) | ||||
| Net offering proceeds | 14,470 | 17,139 | 19,808 | 22,877 | ||||
| Less: ESOP purchase | (1,224) | (1,440) | (1,656) | (1,904) | ||||
| Less: RSP purchase | (612) | (720) | (828) | (952) | ||||
| Net investable proceeds | $12,634 | $14,979 | $17,324 | $20,021 | ||||
| Net Income: | ||||||||
| QTR ended 03/31/08 | ($261) | ($261) | ($261) | ($261) | ||||
| Pro forma income on net proceeds | 29 | 35 | 40 | 47 | ||||
| Pro forma ESOP adjustment | (18) | (22) | (25) | (29) | ||||
| Pro forma RSP adjustment | (18) | (22) | (25) | (29) | ||||
| Pro forma option adjustment | (24) | (28) | (33) | (38) | ||||
| Pro forma net income | ($292) | ($298) | ($303) | ($309) | ||||
| Pro forma earnings per share | ($0.21) | ($0.18) | ($0.16) | ($0.14) | ||||
| Core Earnings: | ||||||||
| QTR ended 03/31/08 | ($261) | ($261) | ($261) | ($261) | ||||
| Pro forma income on net proceeds | 29 | 35 | 40 | 47 | ||||
| Pro forma ESOP adjustment | (18) | (22) | (25) | (29) | ||||
| Pro forma RSP adjustment | (18) | (22) | (25) | (29) | ||||
| Pro forma option adjustment | (24) | (28) | (33) | (38) | ||||
| Pro forma earnings | ($31) | ($37) | ($42) | ($48) | ||||
| Pro forma earnings per share | ($0.02) | ($0.02) | ($0.02) | ($0.02) | ||||
| Shares Used to Calculate EPS | 1,410,660 | 1,659,600 | 1,908,540 | 2,194,821 | ||||
| Total Equity | $17,524 | $17,524 | $17,524 | $17,524 | ||||
| Net offering proceeds | 14,470 | 17,139 | 19,808 | 22,877 | ||||
| Less: ESOP purchase | (1,224) | (1,440) | (1,656) | (1,904) | ||||
| Less: RSP purchase | (612) | (720) | (828) | (952) | ||||
| Pro forma total equity | $30,158 | $32,503 | $34,848 | $37,544 | ||||
| Pro forma book value | $19.71 | $18.06 | $16.83 | $15.77 | ||||
| Tangible Equity | $17,524 | $17,524 | $17,524 | $17,524 | ||||
| Net offering proceeds | 14,470 | 17,139 | 19,808 | 22,877 | ||||
| Less: ESOP purchase | (1,224) | (1,440) | (1,656) | (1,904) | ||||
| Less: RSP purchase | (612) | (720) | (828) | (952) | ||||
| Pro forma tangible equity | $30,158 | $32,503 | $34,848 | $37,544 | ||||
| Pro forma tangible book value | $19.71 | $18.06 | $16.83 | $15.77 | ||||
| Shares Used to Calculate Book Value | 1,530,000 | 1,800,000 | 2,070,000 | 2,380,500 | ||||
| Total Assets | $167,447 | $167,447 | $167,447 | $167,447 | ||||
| Net offering proceeds | 14,470 | 17,139 | 19,808 | 22,877 | ||||
| Less: ESOP purchase | (1,224) | (1,440) | (1,656) | (1,904) | ||||
| Less: RSP purchase | (612) | (720) | (828) | (952) | ||||
| Pro forma total assets | $180,081 | $182,426 | $184,771 | $187,467 | ||||
| Pro Forma Ratios: | ||||||||
| Price / EPS | NA | NA | NA | NA | ||||
| Price / Core EPS | NA | NA | NA | NA | ||||
| Price / Book Value | 50.7% | 55.4% | 59.4% | 63.4% | ||||
| Price / Tangible Book Value | 50.7% | 55.4% | 59.4% | 63.4% | ||||
| Price / Total Assets | 8.50% | 9.87% | 11.20% | 12.70% | ||||
| Equity / Assets | 16.75% | 17.82% | 18.86% | 20.03% | ||||
IV-2
Feldman Financial Advisors, Inc.
| Exhibit IV-3 | ||||||||
| Pro Forma Fully Converted Analysis at Maximum | ||||||||
| Sunshine Financial, Inc. | ||||||||
| Historical Financial Data as of March 31, 2008 | ||||||||
Valuation Parameters | Symbol | Data | ||||||
| Net income | Y | $ | -261,000 | |||||
| Core earnings | Y | -261,000 | ||||||
| Net worth | B | 17,524,000 | ||||||
| Tangible net worth | B | 17,524,000 | ||||||
| Total assets | A | 167,447,000 | ||||||
| Expenses in conversion | X | 891,913 | ||||||
| Other proceeds not reinvested | O | 2,484,000 | ||||||
| ESOP purchase | E | 1,656,000 | ||||||
| ESOP expense (pre-tax) | F | 41,250 | ||||||
| RSP purchase | M | 828,000 | ||||||
| RSP expense (pre-tax) | N | 41,250 | ||||||
| Stock option expense (pre-tax) | Q | 148,626 | ||||||
| Option expense tax-deductible | D | 30.00% | ||||||
| Re-investment rate (after-tax) | R | 0.93% | ||||||
| Tax rate | T | 40.00% | ||||||
| Shares for EPS | S | 92.20% | ||||||
Pro Forma Valuation Ratios at Maximum Value | ||||||||
| Price / EPS | P/E | NA | x | |||||
| Price / Core EPS | P/E | NA | x | |||||
| Price / Book Value | P/B | 59.42% | ||||||
| Price / Tangible Book | P/TB | 59.42% | ||||||
| Price / Assets | P/A | 11.20% | ||||||
Pro Forma Calculation at Maximum Value | Based on | |||||||
| V = | (P/E / S)*((Y-R*(O+X)-(F+N)*(1-T)-(Q-Q*D*T))) | = | $20,700,000 | [LTM earnings] | ||||
1 - (P/E / S) * R | ||||||||
| V = | (P/E / S)*((Y-R*(O+X)-(F+N)*(1-T))) | = | $20,700,000 | [Core earings] | ||||
1 - (P/E / S) * R | ||||||||
| V = | P/B * (B - X - E - M) | = | $20,700,000 | [Book value] | ||||
1 - P/B | ||||||||
| V = | P/TB * (B - X - E - M) | = | $20,700,000 | [Tangible book] | ||||
1 - P/TB | ||||||||
| V = | P/A * (B - X - E - M) | = | $20,700,000 | [Total assets] | ||||
1 - P/A | ||||||||
Pro Forma Valuation Range | ||||||||
| Minimum = | $18,000,000 | x | 0.85 | = | $15,300,000 | |||
| Midpoint = | $18,000,000 | x | 1.00 | = | $18,000,000 | |||
| Maximum = | $18,000,000 | x | 1.15 | = | $20,700,000 | |||
| Adj. Max. | $20,700,000 | x | 1.15 | = | $23,805,000 | |||
IV-3
Feldman Financial Advisors, Inc.
| Exhibit IV-4 | |||||||||||||||
| Comparative Valuation Ratio Differential | |||||||||||||||
| Pro Forma Fully Converted Valuation | |||||||||||||||
| Computed from Market Price Data as of June 16, 2008 | |||||||||||||||
| Comparative | All Public | ||||||||||||||
| Valuation | Sunshine | Group | Thrifts | ||||||||||||
| Ratio | Symbol | Financial | Average | Median | Average | Median | |||||||||
| Price / LTM EPS | P/E | 24.4 | 21.2 | 15.6 | 14.3 | ||||||||||
| Minimum | (X) | NA | NA | NA | NA | NA | |||||||||
| Midpoint | NA | NA | NA | NA | NA | ||||||||||
| Maximum | NA | NA | NA | NA | NA | ||||||||||
| Adj. Maximum | NA | NA | NA | NA | NA | ||||||||||
| Price / Core EPS | P/E | 42.1 | 30.7 | 16.0 | 14.5 | ||||||||||
| Minimum | (X) | NA | NA | NA | NA | NA | |||||||||
| Midpoint | NA | NA | NA | NA | NA | ||||||||||
| Maximum | NA | NA | NA | NA | NA | ||||||||||
| Adj. Maximum | NA | NA | NA | NA | NA | ||||||||||
| Price / Book Value | P/B | 70.3 | 70.8 | 88.1 | 86.8 | ||||||||||
| Minimum | (%) | 50.7 | -27.8% | -28.3% | -42.4% | -41.6% | |||||||||
| Midpoint | 55.4 | -21.2% | -21.8% | -37.1% | -36.2% | ||||||||||
| Maximum | 59.4 | -15.5% | -16.0% | -32.5% | -31.6% | ||||||||||
| Adj. Maximum | 63.4 | -9.8% | -10.4% | -28.0% | -27.0% | ||||||||||
| Price / Tangible Book | P/TB | 72.8 | 70.8 | 104.2 | 95.0 | ||||||||||
| Minimum | (%) | 50.7 | -30.3% | -28.4% | -51.3% | -46.6% | |||||||||
| Midpoint | 55.4 | -23.9% | -21.8% | -46.8% | -41.7% | ||||||||||
| Maximum | 59.4 | -18.3% | -16.1% | -43.0% | -37.4% | ||||||||||
| Adj. Maximum | 63.4 | -12.8% | -10.5% | -39.1% | -33.2% | ||||||||||
| Price / Total Assets | P/A | 14.16 | 12.01 | 10.09 | 8.42 | ||||||||||
| Minimum | (%) | 8.50 | -40.0% | -29.3% | -15.8% | 0.9% | |||||||||
| Midpoint | 9.87 | -30.3% | -17.8% | -2.2% | 17.2% | ||||||||||
| Maximum | 11.20 | -20.9% | -6.7% | 11.1% | 33.1% | ||||||||||
| Adj. Maximum | 12.70 | -10.3% | 5.7% | 25.9% | 50.8% | ||||||||||
IV-4
Feldman Financial Advisors, Inc.
Exhibit V-1
Pro Forma Assumptions for MHC Stock Offering
| 1. | The aggregate common stock sold in the stock offering will amount to 45% of total shares outstanding. Sunshine Savings MHC, will own the remaining 55% of common stock. |
| 2. | The total amount of the net offering proceeds was fully invested at the beginning of the applicable period. |
| 3. | The net offering proceeds are invested to yield a return of 1.55%, which represented the yield on one-year U.S. Treasury securities at March 31, 2008. The effective income tax rate was assumed to be 40.0%, resulting in a net after-tax yield of 0.94%. |
| 4. | The employee stock ownership plan (“ESOP”) will purchase an amount equal to 3.92% of the shares of common stock outstanding after the offering. Pro forma adjustments have been made to earnings and equity to reflect the impact of the ESOP. The annual expense is estimated based on a ten-year loan period. No reinvestment is assumed on proceeds used to fund the ESOP. |
| 5. | It is assumed that 1.96% of total shares outstanding will be acquired by the Company’s restricted stock plan (“RSP”). Pro forma adjustments have been made to earnings and equity to reflect the impact of the RSP. The annual expense is estimated based on a five-year vesting period. No reinvestment is assumed on proceeds used to fund the RSP. |
| 6. | It is assumed that an additional 4.90% of the total shares outstanding will be reserved for issuance by the Company’s stock option plan. The pro forma net income has been adjusted to reflect the expense associated with the granting of options at an assumed options value of $3.59 per share. It is further assumed that options for all shares reserved under the plan were granted to plan participants at the beginning of the period, 30% of the options granted were non-qualified options for income tax purposes, the options would vest at a rate of 20% per year, and compensation expense will be recognized on a straight-line basis over the five-year vesting period. |
| 7. | Fixed offering expenses are estimated at $660,000. |
| 8. | Marketing fees for the stock offering are estimated at 1.25% of the aggregate purchase price of the shares of stock sold in the offering (but not less than $125,000), excluding sales to directors, officers, employees, and stock-benefit plans. |
| 9. | No effect has been given to withdrawals from deposit accounts for the purpose of purchasing common stock in the offering. |
| 10. | No effect has been given in the pro forma equity calculation for the assumed earnings on the net proceeds. |
V-1
Feldman Financial Advisors, Inc.
| Exhibit V-2 | ||||||||
| Pro Forma MHC Stock Offering Range | ||||||||
| Sunshine Financial, Inc. | ||||||||
| Historical Financial Data as of March 31, 2008 | ||||||||
| (Dollars in Thousands, Except Per Share Data) | ||||||||
| Minimum | Midpoint | Maximum | Adj. Max. | |||||
| Shares offered | 1,530,000 | 1,800,000 | 2,070,000 | 2,380,500 | ||||
| Shares sold | 45% | 688,500 | 810,000 | 931,500 | 1,071,225 | |||
| Offering price | $10.00 | $10.00 | $10.00 | $10.00 | ||||
| Gross proceeds | $6,885 | $8,100 | $9,315 | $10,712 | ||||
| Less: estimated expenses | (785) | (785) | (785) | (785) | ||||
| Net offering proceeds | 6,100 | 7,315 | 8,530 | 9,927 | ||||
| Less: ESOP purchase | (600) | (706) | (811) | (933) | ||||
| Less: RSP purchase | (300) | (353) | (406) | (467) | ||||
| Net investable proceeds | $5,200 | $6,256 | $7,313 | $8,527 | ||||
| Net Income | ||||||||
| QTR Ended 03/31/08 | ($261) | ($261) | ($261) | ($261) | ||||
| Pro forma income on net proceeds | 12 | 15 | 17 | 20 | ||||
| Pro forma ESOP adjustment | (9) | (11) | (12) | (14) | ||||
| Pro forma RSP adjustment | (9) | (11) | (12) | (14) | ||||
| Pro forma option adjustment | (12) | (14) | (16) | (19) | ||||
| Pro forma net income | ($279) | ($282) | ($284) | ($288) | ||||
| Pro forma earnings per share | ($0.19) | ($0.16) | ($0.14) | ($0.13) | ||||
| Core Earnings | ||||||||
| QTR Ended 03/31/08 | ($261) | ($261) | ($261) | ($261) | ||||
| Pro forma income on net proceeds | 12 | 15 | 17 | 20 | ||||
| Pro forma ESOP adjustment | (9) | (11) | (12) | (14) | ||||
| Pro forma RSP adjustment | (9) | (11) | (12) | (14) | ||||
| Pro forma option adjustment | (12) | (14) | (16) | (19) | ||||
| Pro forma core earnings | ($279) | ($282) | ($284) | ($288) | ||||
| Pro forma core earnings per share | ($0.19) | ($0.16) | ($0.14) | ($0.13) | ||||
| Total Equity | $17,524 | $17,524 | $17,524 | $17,524 | ||||
| Net offering proceeds | 6,100 | 7,315 | 8,530 | 9,927 | ||||
| Less: MHC capitalization | (100) | (100) | (100) | (100) | ||||
| Less: ESOP purchase | (600) | (706) | (811) | (933) | ||||
| Less: RSP purchase | (300) | (353) | (406) | (467) | ||||
| Pro forma total equity | $22,624 | $23,681 | $24,737 | $25,951 | ||||
| Pro forma book value | $14.79 | $13.16 | $11.95 | $10.90 | ||||
| Tangible Equity | $17,524 | $17,524 | $17,524 | $17,524 | ||||
| Net offering proceeds | 6,100 | 7,315 | 8,530 | 9,927 | ||||
| Less: MHC capitalization | (100) | (100) | (100) | (100) | ||||
| Less: ESOP purchase | (600) | (706) | (811) | (933) | ||||
| Less: RSP purchase | (300) | (353) | (406) | (467) | ||||
| Pro forma tangible equity | $22,624 | $23,680 | $24,737 | $25,951 | ||||
| Pro forma tangible book value | $14.79 | $13.16 | $11.95 | $10.90 | ||||
| Total Assets | $167,447 | $167,447 | $167,447 | $167,447 | ||||
| Net offering proceeds | 6,100 | 7,315 | 8,530 | 9,927 | ||||
| Less: MHC capitalization | (100) | (100) | (100) | (100) | ||||
| Less: ESOP purchase | (600) | (706) | (811) | (933) | ||||
| Less: RSP purchase | (300) | (353) | (406) | (467) | ||||
| Pro forma total assets | $172,547 | $173,603 | $174,660 | $175,874 | ||||
| Pro Forma Ratios: | ||||||||
| Price / EPS - 03/31/08 QTR | NA | NA | NA | NA | ||||
| Price / EPS - 03/31/08 Pro Forma | NA | NA | NA | NA | ||||
| Price / Book Value | 67.6% | 76.0% | 83.7% | 91.7% | ||||
| Price / Tangible Book Value | 67.6% | 76.0% | 83.7% | 91.7% | ||||
| Price / Total Assets | 8.87% | 10.37% | 11.85% | 13.54% | ||||
| Equity / Assets | 13.11% | 13.64% | 14.16% | 14.76% | ||||
V-2