Exhibit 99.3
Feldman Financial Advisors, Inc.
1001 Connecticut Avenue, NW · Suite 840
Washington, DC 20036
202-467-6862 · (Fax) 202-467-6963
Home Federal Bancorp, Inc. of Louisiana Shreveport, Louisiana Conversion Valuation Appraisal Report Valued as of February 25, 2008 Prepared By Feldman Financial Advisors, Inc. Washington, D.C. |
Feldman Financial Advisors, Inc.
1001 Connecticut Avenue, NW · Suite 840
Washington, DC 20036
202-467-6862 · (Fax) 202-467-6963
Board of Directors
Home Federal Bancorp, Inc. of Louisiana
624 Market Street
Shreveport, Louisiana 71101-3643
Members of the Board:
At your request, we have completed and hereby provide an independent appraisal (the “Appraisal”) of the estimated pro forma market value of the common stock to be issued (the “Stock Offering”) by Home Federal Bancorp, Inc. of Louisiana (“Home Federal Bancorp” or the “Company”), a new Louisiana corporation, headquartered in Shreveport, Louisiana, as of February 25, 2008, in connection with the mutual-to-stock conversion of Home Federal MHC of Louisiana (the “MHC”). Currently, the MHC’s principal activity is the ownership of the majority interest approximating 63.1% in Home Federal Bancorp, Inc. of Louisiana (“Bancorp”), a federal corporation, the current mid-tier holding company for Home Federal Savings and Loan Association (the “Bank”). The remainder of the Bancorp’s shares (36.9%) is owned by public stockholders. Home Federal Bancorp owns a 100% interest in the common stock of the Bank. At the conclusion of the conversion, the MHC and Bancorp will no longer exist. Home Federal Bancorp is offering for sale common stock representing the majority ownership interest in Bancorp in a subscription offering to Eligible Account Holders, Supplemental Eligible Account Holders and Other Members. To the extent that shares remain available for purchase after satisfaction of all subscriptions received in the subscription offering, the shares may be offered for sale in a community offering to current holders of Bancorp shares as of the Record Date, members of the local community and the public at large. At the conclusion of the conversion, existing public stockholders of Bancorp will receive new shares of common stock of the Company in exchange for their existing shares. Home Federal Bancorp will be renamed "First Louisiana Bancshares, Inc." after the conversion and offering have been completed and shares will be issued in that name.
In connection with the conversion, Home Federal Bancorp will acquire First Louisiana Bancshares, Inc. (“First Louisiana”). On December 12, 2007, Home Federal Bancorp entered into a definitive agreement to acquire First Louisiana. First Louisiana is the holding company of First Louisiana Bank, which is based in, Shreveport, Louisiana. Pursuant to the definitive agreement, shareholders of First Louisiana will be entitled to receive $28.00 in cash or a number of shares of Home Federal Bancorp common stock based on the IPO price, subject to a requirement that 60% of the total outstanding First Louisiana common stock be exchanged for stock. Assuming an IPO price of $10.00 per share, each share of First Louisiana being exchanged would receive 2.8 shares of the new holding company. As of December 31, 2007, First Louisiana had 788,524 shares of common stock issued and outstanding. The aggregate merger consideration is estimated to amount to $23.7 million.
Feldman Financial Advisors, Inc
Board of Directors
Home Federal Bancorp, Inc. of Louisiana
February 25, 2008
Page Two
This Appraisal has been prepared in accordance with the “Guidelines for Appraisal Reports for the Valuation of Savings and Loan Associations Converting from Mutual to Stock Form of Organization” of the OTS.
Feldman Financial Advisors, Inc. (“Feldman Financial”) is a financial consulting and economic research firm that specializes in financial valuations and analyses of business enterprises and securities in the thrift, banking, and mortgage industries. The background of Feldman Financial is presented in Exhibit I. In preparing the Appraisal, we conducted an analysis of the Company that included discussions with the Company’s management, the Company’s legal counsel, Elias, Matz, Tiernan & Herrick L.L.P., and the Company’s independent auditor, LaPorte Sehrt Romig Hand. In addition, where appropriate, we considered information based on other available published sources that we believe are reliable; however, we cannot guarantee the accuracy and completeness of such information.
We also reviewed, among other factors, the economy in the Company’s primary market area and compared the Company’s financial condition and operating performance with that of selected publicly traded thrift institutions. We reviewed conditions in the securities markets in general and in the market for thrift institution common stocks in particular.
The Appraisal is based on the Company’s representation that the information contained in the Prospectus and additional evidence furnished to us by the Company and its independent auditor are truthful, accurate, and complete. We did not independently verify the financial statements and other information provided by the Company and its independent auditor, nor did we independently value the assets or liabilities of the Company. The Appraisal considers the Company only as a going concern and should not be considered as an indication of the liquidation value of the Company.
It is our opinion that, as of February 25, 2008, the estimated pro forma market value of the Company on a fully converted basis was within a range (the “Valuation Range”) of $37,488,490 to $46,044,460 with a midpoint of $41,765,850. This value includes the 1,324,720 merger shares issued to First Louisiana Bancshares’ shareholders as part of the $23.7 million cash and stock acquisition of First Louisiana Bancshares. The Valuation Range was based upon a 15% decrease from the midpoint to determine the minimum and a 15% increase from the midpoint to establish the maximum. Assuming an additional 15% decrease below the minimum would result in an adjusted minimum valuation of $35,193,490 and a 15% increase above the maximum value would result in an adjusted maximum of $50,963,920.
Feldman Financial Advisors, Inc
Board of Directors
Home Federal Bancorp, Inc. of Louisiana
February 25, 2008
Page Three
Based on the foregoing valuation, the corresponding range of shares and market values based on a $10.00 per share price are as follows:
| | | Offering | | | Exchanged | | | Merger | | | Total | |
| | | Shares | | | Shares | | | Shares | | | Shares | |
| | | | | | | | | | | | | |
| Shares | | | | | | | | | | | | |
| Super maximum | | | 2,380,500 | | | | 1,391,172 | | | | 1,324,700 | | | | 5,096,392 | |
| Maximum | | | 2,070,000 | | | | 1,209,726 | | | | 1,324,700 | | | | 4,604,446 | |
| Midpoint | | | 1,800,000 | | | | 1,051,865 | | | | 1,324,700 | | | | 4,176,585 | |
| Minimum | | | 1,530,000 | | | | 894,129 | | | | 1,324,700 | | | | 3,748,849 | |
| Adjusted Minimum | | | 1,530,000 | | | | 894,129 | | | | 1,069,700 | | | | 3,519,349 | |
| | | | | | | | | | | | | | | | | |
| Market Value | | | | | | | | | | | | | | | | |
| Super maximum | | $ | 23,805,000 | | | $ | 13,911,720 | | | $ | 13,247,000 | | | $ | 50,963,920 | |
| Maximum | | $ | 20,700,000 | | | $ | 12,097,260 | | | $ | 13,247,000 | | | $ | 46,044,460 | |
| Midpoint | | $ | 18,000,000 | | | $ | 10,518,650 | | | $ | 13,247,000 | | | $ | 41,765,850 | |
| Minimum | | $ | 15,300,000 | | | $ | 8,841,290 | | | $ | 13,247,000 | | | $ | 37,488,490 | |
| Adjusted Minimum | | $ | 15,300,000 | | | $ | 8,941,290 | | | $ | 10,952,200 | | | $ | 35,193,490 | |
OTS regulations provide that in a conversion of a mutual holding company, the minority stockholders be entitled to exchange their current shares for newly issued shares of the fully converted Company. It is our understanding that the exchange ratio has been designed to preserve the current aggregate percentage ownership in Bancorp equal to 36.9%. The actual exchange ratio to be received by the existing minority shareholders of Bancorp will be determined at the end of the offering, based on the total number of shares sold in the subscription and community offerings. Based on this calculation, and the valuation offering range above, the Company’s exchange ratio would be 0.7165 shares, 0.8429 shares, 0.9694 shares and 1.1148 shares at the minimum (and adjusted minimum), midpoint, maximum and adjusted maximum of the offering range, respectively. Feldman Financial has no opinion on the proposed exchange ratio applied to the minority shares exchanged for newly issued shares of the Company.
Our Appraisal is not intended, and must not be construed, to be a recommendation of any kind as to the advisability of purchasing shares of common stock in the Stock Offering. Moreover, because the Appraisal is necessarily based upon estimates and projections of a number of matters, all of which are subject to change from time to time, no assurance can be given that persons who purchase shares of stock in the Stock Offering will thereafter be able to sell such shares at prices related to the foregoing estimate of the Company’s pro forma market value. Feldman Financial is not a seller of securities within the meaning of any federal or state securities laws and any report prepared by Feldman Financial shall not be used as an offer or solicitation with respect to the purchase or sale of any securities.
Feldman Financial Advisors, Inc
Board of Directors
Home Federal Bancorp, Inc. of Louisiana
February 25, 2008
Page Four
The valuation reported herein will be updated as appropriate. These updates will consider, among other factors, any developments or changes in the Company’s operating performance, financial condition, or management policies, and current conditions in the securities markets for thrift institution common stocks. Should any such new developments or changes be material, in our opinion, to the valuation of the Company, appropriate adjustments to the estimated pro forma market value will be made. The reasons for any such adjustments will be explained in detail at that time.
| | Respectfully submitted, | |
| | | |
| | Feldman Financial Advisors, Inc. | |
| | | |
| | /s/ Trent R. Feldman | |
| | Trent R. Feldman | |
| | President | |
| | | |
| | /s/ Greg E. Izydorczyk | |
| | Greg E. Izydorczyk | |
| | Senior Vive President | |
Feldman Financial Advisors, Inc
TABLE OF CONTENTS
| TAB | | | PAGE |
| | | | |
| | | INTRODUCTION | 1 |
| | | | |
| I. | | Chapter One – BUSINESS OF HOME FEDERAL BANCORP AND FIRST | |
| | | LOUISIANA BANCSHARES | |
| | | General Overview | 4 |
| | | Financial Condition | 13 |
| | | Income and Expense Trends | 44 |
| | | Interest Rate Risk Management | 59 |
| | | Asset Quality | 62 |
| | | Market Area | 69 |
| | | Summary Outlook | 76 |
| | | | |
| II. | | Chapter Two – COMPARISONS WITH PUBLICLY HELD THRIFTS | |
| | | General Overview | 77 |
| | | Selection Criteria | 78 |
| | | Recent Financial Comparisons | 81 |
| | | | |
| III. | | Chapter Three – MARKET VALUE ADJUSTMENTS | |
| | | General Overview | 92 |
| | | Earnings Prospects | 93 |
| | | Financial Condition | 95 |
| | | Market Area | 97 |
| | | Management | 98 |
| | | Dividend Policy | 99 |
| | | Liquidity of the Issue | 100 |
| | | Subscription Interest | 100 |
| | | Stock Market Conditions | 101 |
| | | Recent Acquisition Activity | 102 |
| | | Marketability Discount | 104 |
| | | Adjustments Conclusion | 107 |
| | | Valuation Approach | 107 |
| | | Valuation Conclusion | 111 |
Feldman Financial Advisors, Inc
TABLE OF CONTENTS (Continued)
| TAB | | | | PAGE |
| | | | | | |
| | | | | | |
| IV. | | Appendix – EXHIBITS | |
| | | | | | |
| | | I | | Background of Feldman Financial Advisors, Inc. | I-1 |
| | | II-1 | | Consolidated Balance Sheet – Home Federal Bancorp | II-1 |
| | | II-2 | | Consolidated Income Statement – Home Federal Bancorp | II-2 |
| | | II-3 | | Consolidated Balance Sheet – First Louisiana Bancshares | II-3 |
| | | II-4 | | Consolidated Income Statement – First Louisiana Bancshares | II-4 |
| | | II-5 | | Loan Portfolio Composition – Home Federal Bancorp | II-5 |
| | | II-6 | | Loan Portfolio Composition – First Louisiana Bancshares | II-6 |
| | | II-7 | | Securities Portfolio – Home Federal Bancorp | II-7 |
| | | II-8 | | Securities Portfolio – First Louisiana Bancshares | II-8 |
| | | II-9 | | Deposit Portfolio – Home Federal Bancorp | II-9 |
| | | II-10 | | Deposit Portfolio – First Louisiana Bancshares | II-10 |
| | | III | | Financial and Market Data for All Public Thrifts | III-1 |
| | | IV-1 | | Pro Forma Assumptions for Fully Converted Valuation | IV-1 |
| | | IV-2 | | Pro Forma Fully-Converted Valuation Range – December 31, 2007 | IV-2 |
| | | IV-3 | | Pro Forma Fully-Converted Conversion Analysis at Midpoint | IV-3 |
| | | IV-4 | | Valuation Ratio Differential | IV-4 |
| | | IV-5 | | Pro Forma Fully-Converted Valuation Range – June 30, 2007 | IV-5 |
Feldman Financial Advisors, Inc
LIST OF TABLES
| TAB | | | | PAGE |
| | | | | |
| I. | Chapter One – BUSINESS OF HOME FEDERAL BANCORP | |
| | Table 1 | | Selected Financial Condition Data – Home Federal Bancorp | 13 |
| | Table 2 | | Selected Financial Condition Data – First Louisiana Bancshares | 14 |
| | Table 3 | | Pro Forma Balance Sheet as of December 31, 2007 | 19 |
| | Table 4 | | Pro Forma Balance Sheet as of June 30, 2007 | 20 |
| | Table 5 | | Loan Portfolio – Home Federal Bancorp | 23 |
| | Table 6 | | Loan Originations, Sales and Repayments – Home Federal Bancorp | 28 |
| | Table 7 | | Loan Portfolio – First Louisiana Bancshares | 29 |
| | Table 8 | | Securities Portfolio – Home Federal Bancorp | 33 |
| | Table 9 | | Securities Portfolio by Contractual Maturity – Home Federal Bancorp | 36 |
| | Table 10 | | Securities Portfolio – First Louisiana Bancshares | 37 |
| | Table 11 | | Deposit Portfolio – Home Federal Bancorp | 38 |
| | Table 12 | | Average Deposits and Yields – Home Federal Bancorp | 39 |
| | Table 13 | | Borrowings – Home Federal Bancorp | 41 |
| | Table 14 | | Deposit Portfolio – First Louisiana Bancshares | 42 |
| | Table 15 | | Summary Income Statement data – Home Federal Bancorp | 44 |
| | Table 16 | | Average Balances and Yields – Home Federal Bancorp | 45 |
| | Table 17 | | Average Balances and Yields – Home Federal Bancorp | 46 |
| | Table 18 | | Rate/Volume Analysis – Home Federal Bancorp | 47 |
| | Table 19 | | Average Balances and Yields – First Louisiana Bancshares | 54 |
| | Table 20 | | Rate/Volume Analysis – First Louisiana Bancshares | 55 |
| | Table 21 | | Pro Forma Income Statement - Six-Months Ended December 31, 2007 | 58 |
| | Table 22 | | Pro Forma Income Statement - Twelve-Months Ended June 30, 2007 | 58 |
| | Table 23 | | Interest Rate Risk Analysis – Home Federal Bancorp | 61 |
| | Table 24 | | Non-Performing Asset Summary – Home Federal Bancorp | 63 |
| | Table 25 | | Allowance for Loan Losses Summary – Home Federal Bancorp | 65 |
| | Table 26 | | Allocation of Allowance for Loan Losses – Home Federal Bancorp | 66 |
| | Table 27 | | Non-Performing Asset Summary – First Louisiana Bancshares | 67 |
| | Table 28 | | Allowance for Loan Losses Summary – First Louisiana Bancshares | 68 |
| | Table 29 | | Selected Demographic Data | 71 |
| | Table 30 | | Employment by Industry Shreveport-Bossier City MSA | 72 |
| | Table 31 | | Largest Employers in Caddo/Bossier City Parishes | 72 |
| | Table 32 | | Deposit Market Share – City of Shreveport | 74 |
| | Table 33 | | Deposit Market Share – City of Bossier | 74 |
| | Table 34 | | Deposit Market Share – Parish of Caddo | 75 |
| | Table 35 | | Deposit Market Share – Parish of Bossier City | 75 |
Feldman Financial Advisors, Inc
LIST OF TABLES (Continued)
| TAB | | | | PAGE |
| | | | | |
| | | | | |
| II. | Chapter Two – COMPARISONS WITH PUBLICLY HELD THRIFTS | |
| | Table 36 | | Comparative Group Operating Summary | 80 |
| | Table 37 | | Key Financial Comparisons | 83 |
| | Table 38 | | General Financial Performance Ratios | 87 |
| | Table 39 | | Income and Expense Analysis | 88 |
| | Table 40 | | Yield-Cost Structure and Growth Rates | 89 |
| | Table 41 | | Balance Sheet Composition | 90 |
| | Table 42 | | Regulatory Capital, Credit Risk, and Loan Composition | 91 |
| | | | | |
| III. | Chapter Three – MARKET VALUE ADJUSTMENTS | |
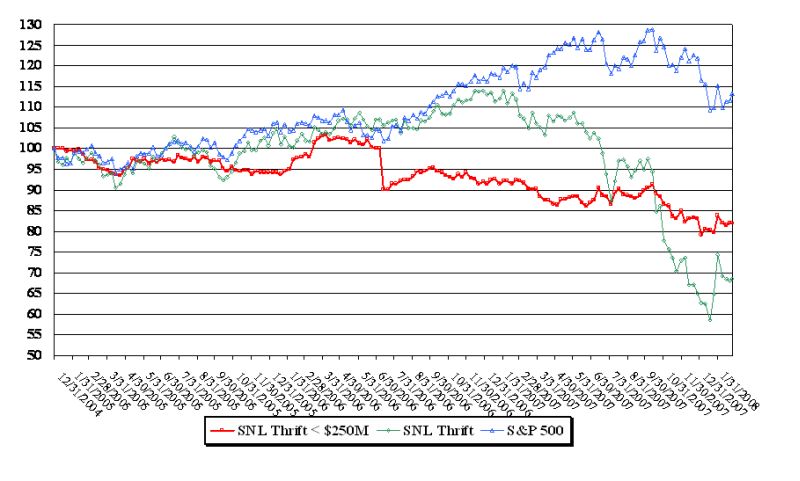
| | Table 43 | | Comparative Stock Index Performance | 103 |
| | Table 44 | | Summary of Recent Acquisition Activity | 105 |
| | Table 45 | | Summary of Recent Second-Step Stock Offerings | 106 |
| | Table 46 | | Pro Forma Comparative Market Valuation Analysis | 112 |
Feldman Financial Advisors, Inc
INTRODUCTION
At your request, we have completed and hereby provide an independent appraisal (the “Appraisal”) of the estimated pro forma market value of the common stock to be issued (the “Stock Offering”) by Home Federal Bancorp, Inc. of Louisiana (“Home Federal” or the “Company”), a new Louisiana corporation, headquartered in Shreveport, Louisiana, as of February 25, 2008, in connection with the mutual-to-stock conversion of Home Federal Mutual Holding Company of Louisiana (the “MHC”). Currently, the MHC’s principal activity is the ownership of the majority interest approximating 63.1% in Home Federal Bancorp, Inc. of Louisiana (“Bancorp”), a federal corporation, the mid-tier holding company for Home Federal Savings and Loan Association (the “Bank”). Public stockholders own the remainder of the Bancorp’s shares (36.9%). Bancorp owns a 100% interest in the common stock of the Bank. At the conclusion of the conversion, the MHC and Bancorp will no longer exist.
As part of the conversion, the Company is offering for sale common stock representing the majority ownership interest in Bancorp that is currently held by Home Federal Mutual Holding Company of Louisiana in a subscription offering to Eligible Account Holders, Supplemental Eligible Account Holders and Other Members. To the extent that shares remain available for purchase after satisfaction of all subscriptions received in the subscription offering, the shares may be offered for sale in a community offering to current holders of Bancorp shares as of the Record Date, members of the local community and the public at large. At the conclusion of the conversion, existing public stockholders of Bancorp will receive new shares of common stock (adjusted for an exchange ratio) of the Company in exchange for their existing shares. This Appraisal has been prepared in accordance with the “Guidelines for Appraisal Reports for the Valuation of Savings and Loan Associations Converting from Mutual to Stock Form of Organization” of the Office of Thrift Supervision (“OTS”).
Feldman Financial Advisors, Inc
In the course of preparing the Appraisal, we reviewed and discussed with the Company’s management, the Company’s independent accountants, LaPorte Sehrt Romig Hand, the audited financial statements of the Company’s operations for the years ended June 30, 2006 and 2007, and the unaudited financial statements dated as of December 31, 2006 and 2007. We also reviewed and discussed with management other financial matters of the Bank and held discussions with Sandler O’Neill, the investment-banking firm engaged by the Company to market and sell the common stock.
Where appropriate, we considered information based upon other available public sources, which we believe to be reliable; however, we cannot guarantee the accuracy or completeness of such information. We visited the Company’s primary market area and examined the prevailing economic conditions. We also examined the competitive environment within which the Company operates and assessed the Company’s relative strengths and weaknesses.
We examined and compared the Company’s financial performance with selected segments of the thrift industry and selected publicly traded thrift institutions. We reviewed conditions in the securities markets in general and the market for thrift institution common stocks in particular. We included in our analysis an examination of the potential effects of the Stock Offering on the Company’s operating characteristics and financial performance as they relate to the estimated pro forma market value of the Company.
In preparing the Appraisal, we have relied upon and assumed the accuracy and completeness of financial and statistical information provided by the Company and its independent accountants. We did not independently verify the financial statements and other information provided by the Company and its independent accountants, nor did we independently value the assets or liabilities of the Company. The Appraisal considers the Company only as a going concern and should not be considered as an indication of the liquidation value of the Company.
Feldman Financial Advisors, Inc
Our Appraisal is not intended, and must not be construed, to be a recommendation of any kind as to the advisability of purchasing shares of common stock in the Stock Offering. Moreover, because such the Appraisal is necessarily based on estimates and projections of a number of matters, all of which are subject to change from time to time, no assurance can be given that persons who purchase shares of common stock in the Stock Offering will thereafter be able to sell such shares at prices related to the foregoing estimate of the Company’s pro forma market value. Feldman Financial is not a seller of securities within the meaning of any federal and state securities laws and any report prepared by Feldman Financial shall not be used as an offer or solicitation with respect to the purchase or sale of any securities.
The valuation reported herein will be updated as appropriate. Further updates will consider, among other factors, any developments or changes in the Company’s financial performance or management policies, and current conditions in the securities market for thrift institution common stocks. Should any such developments or changes be material, in our opinion, to the Stock Offering valuation of the Company, appropriate adjustments to the estimated pro forma market value may be made. The reasons for any such adjustments will be explained in detail at that time.
Feldman Financial Advisors, Inc
I. BUSINESS OF HOME FEDERAL BANCORP, INC. OF LOUISIANA AND FIRST LOUISIANA BANCSHARES
General Overview
Home Federal Bancorp
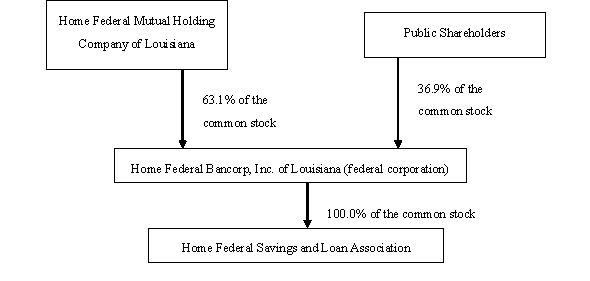
Home Federal Bancorp, Inc. of Louisiana is a new Louisiana chartered corporation, formed for the purpose of holding all of the capital stock of Home Federal Savings and Loan Association. To date, Home Federal Bancorp has only conducted organizational activities. Currently, Home Federal Bancorp, Inc. of Louisiana, a federally chartered corporation, the mid-tier stock holding company that was formed in 2005 owns all of the capital stock of the Bank. The mid-tier holding company is 63.1% owed by Home Federal Mutual Holding Company of Louisiana and 36.9% owned by public shareholders. After the conversion, Home Federal Mutual Holding Company of Louisiana and Home Federal Bancorp, Inc. of Louisiana, a federally chartered corporation, will no longer exist. In addition, as part of the conversion, existing public stockholders of Bancorp will receive new shares of common stock in Home Federal Bancorp in exchange for their existing shares of common stock of Bancorp. The Company’s principal executive offices are located at 624 Market Street, Shreveport, Louisiana. At December 31, 2007, the Company had total assets of $128.1 million, deposits of $81.0 million and equity capital of $30.4 million.
Home Federal Savings and Loan Association is a federally chartered stock-form savings association originally organized in 1924 and is subject to federal regulation by the Federal Deposit Insurance Corporation and the Office of Thrift Supervision. The association reorganized into the mutual holding company format in January 2005. After the conversion and offering and completion of the merger, Home Federal Savings and Loan will change its name to "First Louisiana Bank" and will continue to be regulated by the Office of Thrift Supervision as its primary Federal banking regulator.
Feldman Financial Advisors, Inc
Home Federal Savings and Loan's current headquarters and main office and two additional full service branch offices located in Shreveport, Louisiana, serve the Shreveport-Bossier City metropolitan area. The area served by Home Federal Savings and Loan is primarily the Shreveport-Bossier City metropolitan area; however, loan and deposit customers are found dispersed in a wider geographical area covering much of northwest Louisiana. Following the merger, the Company expects to use First Louisiana Bank's main office, which is newer and larger than Home Federal Bancorp’s current main office, as the main office for the combined company. In addition to the main office, the Company will operate six branch offices following the merger, five of which will be located in Shreveport and one in Bossier City.
Home Federal Savings and Loan's business primarily consists of attracting deposits from the general public and using those funds to originate loans and invest in securities. Home Federal Savings and Loan's market area is Caddo Parrish, Louisiana, which includes the city of Shreveport, and neighboring communities in Bossier Parish, Louisiana. At December 31, 2007, the Bank had total assets of $128.3 million, deposits of $83.9 million and equity capital of $27.8 million.
The Bank faces strong competition both in attracting deposits and in making loans. Its most direct competition for deposits has come historically from commercial banks, credit unions and other savings institutions located in the primary market area, including many large financial institutions, which have greater financial and marketing resources available to them. In addition, the Bank faces significant competition for investors' funds from short-term money market securities, mutual funds and other corporate and government securities. The Bank does not rely upon any individual group or entity for a material portion of its deposits. The Bank’s ability to attract and retain deposits depends on its ability to generally provide a rate of return, liquidity and risk comparable to that offered by competing investment opportunities.
Feldman Financial Advisors, Inc
Competition for real estate loans comes principally from mortgage banking companies, commercial banks, other savings institutions and credit unions. The Bank competes for loan originations primarily through the interest rates and loan fees charged, and the efficiency and quality of services provided borrowers. Factors, which affect competition, include general and local economic conditions, current interest rate levels and volatility in the mortgage markets. Competition may increase as a result of the continuing reduction of restrictions on the interstate operations of financial institutions.
The chart on the following page shows the Company’s current ownership structure, which is commonly referred to as the "two-tier" mutual holding company structure:
Feldman Financial Advisors, Inc
Following the conversion and offering and the merger, the new ownership structure will be as follows:
The conversion and offering are commonly referred to as a "second-step" conversion.
The Company has several business strategies that are designed to further improve long-term profitability and enhance the franchise. These strategies include:
| | · | Acquiring First Louisiana Bank, a commercial bank in-market competitor. Through the merger, the Company expects to: |
| | •• | Diversify its loan portfolio by adding more commercial real estate and commercial business loans, |
| | •• | Strengthen management by adding senior loan officers, including a commercial lender; and |
| | •• | Diversify the products and services offered for a larger customer base and an enhanced competitive position; |
| | · | Continuing geographic expansion of its market presence by opening additional de novo branches or through acquisitions; |
| | · | Improving the interest rate spread by acquiring First Louisiana Bank's lower costing transaction and savings accounts combined with higher yielding commercial real estate and business loans; and |
| | · | Maintaining high asset quality. |
Feldman Financial Advisors, Inc
The Company’s business strategy is focused on operating a growing and profitable community-oriented financial institution. The acquisition of First Louisiana Bancshares is an integral component of such strategy. As a result of the merger, the Company expects to:
| | · | Grow and Diversify the Loan Portfolio by, among other things, increasing the origination of commercial real estate and business loans. Home Federal Bancorp’s traditional lending activity has been concentrated on the origination of single-family residential loans and to a lesser degree, consumer loans. The acquisition of First Louisiana Bancshares will assist in the goal to develop a loan portfolio more consistent with that of a community bank. First Louisiana Bancshares’ primary lending activity is the origination of commercial real estate and business loans. At December 31, 2007, First Louisiana Bancshares’ commercial real estate loans amounted to $45.8 million, or 53.6% of its total loan portfolio, and its commercial business loans amounted to $26.7 million or 31.3% of its total loan portfolio.�� On a pro forma basis, as if the merger had been completed as of December 31, 2007, commercial real estate and business loans will account for 63.9% of the total loan portfolio. Commercial real estate, commercial business, construction and development and consumer loans all typically have higher yields and are more interest sensitive than long-term single-family residential mortgage loans. |
| | · | Strengthen the Management Team. As part of Home Federal Bancorp’s intent to transform itself to be more like a community bank, the acquisition of First Louisiana Bancshares presented Home Federal Bancorp with the opportunity to obtain the services of several experienced commercial lenders including Mr. Tom Glass, currently the chief lending officer of First Louisiana Bancshares, as well as two other experienced senior commercial lending officers. |
| | · | Diversify Products and Services. The acquisition of First Louisiana Bancshares also addresses the intent of Home Federal Bancorp to expand its products and services, particularly with respect to loan products. Home Federal Bancorp in the past has not been in a position to offer to its customers commercial real estate and business loans. As discussed above, the merger will result in Home Federal Bancorp obtaining the services of several experienced commercial lenders which will allow us to offer to customers and to the marketplace commercial loan products which it believe will materially improve its competitive position in the market area. The merger also results in the ability to expand involvement in construction and land lending. The merger with First Louisiana Bancshares also will provide Home Federal with a significant increase in non-interest bearing checking accounts due to the nature of First Louisiana Bancshares’ commercial lending activities. As a consequence, post-merger Home Federal Bancorp intends to emphasize increasing the amount of its checking accounts due to the ability to provide full-service banking relationships to commercial customers. |
Feldman Financial Advisors, Inc
| | · | Enhancing Core Earnings. The acquisition of First Louisiana Bancshares is expected to improve Home Federal Bancorp’s interest rate spread due to the infusion of the substantial amount of commercial real estate and business loans which generally bear interest rates higher than residential real estate loans as well as the typical investment securities invested in by Home Federal Bancorp, including mortgage-backed securities and U.S. Government and agency securities. |
| | · | Growing the franchise by expanding the franchise in the market area and contiguous communities. The Company intends to pursue opportunities to expand its market area by opening additional de novo banking offices and possibly, through acquisitions of other financial institutions and banking related businesses (although there are no current plans, understandings or agreements with respect to any specific acquisitions). The Company expects to focus on contiguous areas to the current locations in Caddo and Bossier Parishes. |
| | · | Strengthen Asset Quality. The Company expects to strengthen its asset quality. At December 31, 2007, non-performing assets totaled $52,000 or 0.4% of total assets. At the same date, First Louisiana Bancshares’ total non-performing assets totaled $2.6 million or 2.1% of total assets. A substantial majority of First Louisiana Bancshares’ non-performing assets consists of other real estate owned, [all] of which are commercial properties. The company intends to continue to aggressively address the resolution of non-performing assets. The Company also intends to continue to stress maintaining high asset quality after the reorganization and offering and the merger even as it continues to grow Home Federal Savings and Loan. The Company has no exposure to the sub-prime market for mortgage loans. |
In addition, the Stock Offering will afford the opportunity to bolster the Company’s stock-based compensation and benefit plans for management and employees, thereby improving the Company’s capacity to attract and retain qualified personnel.
First Louisiana Bancshares
First Louisiana Bancshares, Inc. is a Louisiana corporation and registered financial holding company under the Bank Holding Company Act of 1956, as amended, headquartered in Shreveport, Louisiana. First Louisiana Bancshares was organized on June 30, 1998 for the purpose of acquiring First Louisiana Bank and becoming a bank holding company under the Bank Holding Company Act and conducts business primarily through its banking subsidiary, First Louisiana Bank, a Louisiana state-chartered commercial bank, which commenced operations in September 1999. It also owns indirectly, First Louisiana Agency, Inc., a Louisiana corporation and state-licensed general insurance agency that is a subsidiary of the bank.
Feldman Financial Advisors, Inc
First Louisiana Bancshares currently conducts no significant operations other than providing managerial resources and strategic planning for First Louisiana Bank, and derives its revenues primarily from the operations of First Louisiana Bank. First Louisiana Bank is a full-service commercial bank, providing a wide variety of commercial banking services through three banking offices to small and middle-market businesses and individuals in its target marketplace, which is comprised primarily of the Shreveport-Bossier City metropolitan area and Caddo and Bossier Parishes, Louisiana. Although First Louisiana Bank has identified the Shreveport/Bossier City metropolitan area as its primary market area, it also has a number of customers located throughout Northwest Louisiana. First Louisiana Bank has actively pursued its target market for loans and deposits, particularly from small businesses, professionals and business owners.
The deposits of First Louisiana Bank are insured by the Deposit Insurance Fund of the Federal Deposit Insurance Corporation up to applicable limits. The operations of First Louisiana Bank are subject to the supervision and regulation of the FDIC and the Louisiana Office of Financial Institutions. First Louisiana Bancshares also owns 100% of the common stock of First Louisiana Statutory Trust I, a Delaware statutory trust that was formed for the purpose of issuing trust-preferred securities.
Feldman Financial Advisors, Inc
As of December 31, 2007, First Louisiana Bancshares had, on a consolidated basis, total assets of approximately $123.1 million, net loans receivable of approximately $84.5 million, total deposits of approximately $92.8 million, and shareholders’ equity of approximately $11.2 million. The revenues of First Louisiana Bank are primarily derived from interest and fees received in connection with commercial lending, interest and dividends from investment securities, and service charge income generated from demand deposits. The principal sources of funds for its lending activities are deposits, loan repayments and Federal Home Loan Bank advances. First Louisiana Bank’s principal expenses are interest paid on deposits and operating and administrative expenses.
The business strategy of First Louisiana Bancshares is to operate as a profitable, diversified financial services company, providing a variety of banking and other financial services, with an emphasis on small business lending, loans to professionals and business owners and residential mortgage loans. First Louisiana Bank offers a wide range of commercial and retail lending and financial services to businesses and individuals. To continue asset growth and profitability, First Louisiana Bancshares’ marketing strategy is targeted to:
| | • | Capitalize on its personal relationship approach that it believes differentiates the bank from its lager competitors; |
| | • | Provide customers with access to the bank’s executives who make key credit and other decisions; |
| | • | Pursue commercial lending opportunities with small to mid-sized businesses that are underserved by the larger competitors in the market; and |
| | • | Cross-sell products and services to the bank’s existing customers to leverage its relationships and enhance profitability. |
Feldman Financial Advisors, Inc
The remainder of Chapter I examines in more detail the trends addressed in this section, including the impact of changes in the Company’s economic and competitive environment, and recent management initiatives. The discussion is supplemented by the exhibits in the Appendix. Exhibit II-1 summarizes the Company’s consolidated balance sheets as of the years ended June 30, 2006 to 2007 and December 31, 2006 and 2007. Exhibit II-2 presents the Company’s consolidated income statements for the years ended June 30, 2006 to 2007 and for the six months ended December 31, 2006 and 2007. Exhibit II-3 summarizes First Louisiana’s consolidated balance sheets as of the years ended December 31, 2006 to 2007 and Exhibit II-4 presents First Louisiana’s consolidated income statements for the years ended December 31, 2006 to 2007.
Feldman Financial Advisors, Inc
Financial Condition
Table 1 presents selected data concerning the Company’s financial position as of June 30, 2003 to 2007 and December 31, 2007. The table also displays relative financial and performance ratios for the Company for the years ended June 30, 2003 through 2007 and for the six months ended December 31, 2006 and 2007.
Table 1
Selected Financial Condition Data – Home Federal Bancorp
As of June 30, 2003 through 2007 and December 31, 2007
| | | | | | At June 30, | |
| (Dollars in Thousands, except per share data) | | At December 31, 2007 | | | 2007 | | | 2006 | | | 2005 | | | 2004 | | | 2003 | |
| Selected Financial and Other Data: | | (unaudited) | | | | | | | | | | | | | | | | |
| Assets | | $ | 128,084 | | | $ | 118,785 | | | $ | 114,000 | | | $ | 111,331 | | | $ | 95,663 | | | $ | 100,759 | |
| Cash and cash equivalents | | | 14,958 | | | | 3,972 | | | | 4,930 | | | | 9,292 | | | | 4,342 | | | | 9,471 | |
| Securities available for sale | | | 81,163 | | | | 83,752 | | | | 83,694 | | | | 75,760 | | | | 64,254 | | | | 52,959 | |
| Securities held to maturity | | | 1,331 | | | | 1,408 | | | | 1,425 | | | | 1,613 | | | | 2,516 | | | | 4,068 | |
| Loans receivable, net | | | 28,751 | | | | 26,689 | | | | 20,866 | | | | 23,645 | | | | 22,786 | | | | 33,219 | |
| Deposits | | | 80,986 | | | | 77,710 | | | | 71,279 | | | | 69,995 | | | | 68,134 | | | | 71,390 | |
| FHLB advances | | | 15,933 | | | | 12,368 | | | | 13,417 | | | | 8,224 | | | | 9,748 | | | | 9,008 | |
| Total Stockholders' Equity | | | 30,441 | | | | 27,812 | | | | 28,539 | | | | 32,431 | | | | 17,309 | | | | 19,149 | |
| Full service offices | | | 3 | | | | 3 | | | | 3 | | | | 3 | | | | 3 | | | | 3 | |
| | | As of or For the Six Months | | | | | | | | | | | | | | | | |
| | | Ended December 31, | | | As of or For the Year Ended June 30, | |
| | | 2007 | | | 2006 | | | 2007 | | | 2006 | | | 2005 | | | 2004 | | | 2003 | |
| Selected Operating Data: | | (unaudited) | | | | | | | | | | | | | | | | |
| Total interest income | | $ | 3,506 | | | $ | 3,210 | | | $ | 6,590 | | | $ | 5,664 | | | $ | 5,064 | | | $ | 5,154 | | | $ | 6,115 | |
| Total interest expense | | | 1,967 | | | | 1,634 | | | | 3,448 | | | | 2,433 | | | | 2,030 | | | | 2,163 | | | | 2,710 | |
| Net interest income | | | 1,539 | | | | 1,576 | | | | 3,142 | | | | 3,231 | | | | 3,034 | | | | 2,991 | | | | 3,405 | |
| Provision for loan losses | | | - | | | | - | | | | 1 | | | | - | | | | - | | | | - | | | | (474 | ) |
| Net interest income after provision for loan losses | | | 1,539 | | | | 1,576 | | | | 3,141 | | | | 3,231 | | | | 3,034 | | | | 2,991 | | | | 3,879 | |
| Total non-interest income | | | 120 | | | | 151 | | | | 240 | | | | 144 | | | | 387 | | | | 321 | | | | 216 | |
| Total non-interest expense | | | 1,262 | | | | 1,224 | | | | 2,417 | | | | 2,414 | | | | 2,119 | | | | 2,080 | | | | 2,596 | |
| Income before income taxes | | | 397 | | | | 503 | | | | 964 | | | | 961 | | | | 1,302 | | | | 1,232 | | | | 1,499 | |
| Income taxes | | | 134 | | | | 171 | | | | 327 | | | | 327 | | | | 452 | | | | 411 | | | | 490 | |
| Net income | | $ | 263 | | | $ | 332 | | | $ | 637 | | | $ | 634 | | | $ | 850 | | | $ | 821 | | | $ | 1,009 | |
| Earnings per share of common stock: | | | | | | | | | | | | | | | | | | | | | | | | | | | | |
| Basic | | | | | | | | | | | | | | | | | | | | | | | | | | | | |
| Diluted | | | | | | | | | | | | | | | | | | | | | | | | | | | | |
| Selected Operating Ratios: | | | | | | | | | | | | | | | | | | | | | |
| Average yield on interest-earning assets | | | 5.81 | % | | | 5.62 | % | | | 5.69 | % | | | 5.35 | % | | | 5.09 | % | | | 5.33 | % | | | 6.09 | % |
| Average yield on interest-bearing liabilities | | | 4.15 | | | | 3.69 | | | | 3.84 | | | | 2.98 | | | | 2.62 | | | | 2.74 | | | | 3.29 | |
| Average interest rate spread | | | 1.66 | | | | 1.93 | | | | 1.85 | | | | 2.37 | | | | 2.47 | | | | 2.59 | | | | 2.80 | |
| Net interest margin | | | 2.55 | | | | 2.76 | | | | 2.71 | | | | 3.05 | | | | 3.05 | | | | 3.09 | | | | 3.39 | |
| Average interest-earning assets to interest-bearing liabilities | | | 127.44 | | | | 129.11 | | | | 128.93 | | | | 129.49 | | | | 128.6 | | | | 122.54 | | | | 121.86 | |
| Net interest income after provision for loan losses to non-interest expense | | | 121.95 | | | | 128.76 | | | | 129.95 | | | | 133.82 | | | | 143.18 | | | | 143.8 | | | | 149.42 | |
| Total non-interest expense to average assets | | | 1.98 | | | | 2.04 | | | | 2.00 | | | | 2.14 | | | | 2.02 | | | | 2.12 | | | | 2.55 | |
| Efficiency ratio | | | 76.07 | | | | 70.87 | | | | 71.49 | | | | 71.53 | | | | 61.94 | | | | 62.8 | | | | 63.39 | |
| Return on average assets | | | 0.41 | | | | 0.55 | | | | 0.53 | | | | 0.56 | | | | 0.81 | | | | 0.84 | | | | 0.99 | |
| Return on average equity | | | 1.67 | | | | 2.18 | | | | 2.13 | | | | 2.10 | | | | 3.17 | | | | 4.40 | | | | 5.48 | |
| Average equity to average assets | | | 24.75 | | | | 25.38 | | | | 24.82 | | | | 26.81 | | | | 25.57 | | | | 19.00 | | | | 18.08 | |
| Asset Quality Ratios: | | | | | | | | | | | | | | | | | | | | | |
| Non-performing loans as a percent of total loans receivable | | | 0.07 | % | | | -- | % | | | 0.46 | % | | | -- | % | | | -- | % | | | -- | % | | | 0.22 | |
| Non-performing assets as a percent of total assets | | | 0.04 | | | | -- | | | | 0.10 | | | | -- | | | | -- | | | | -- | | | | 0.07 | |
| Allowance for loan losses as a percent of total loans receivable | | | 0.85 | | | | 1.03 | | | | 0.92 | | | | 1.11 | | | | 0.98 | | | | 1.02 | | | | 0.68 | |
| Net charge-offs to average loans receivable | | | -- | | | | -- | | | | -- | | | | -- | | | | -- | | | | -- | | | | -- | |
| | | | | | | | | | | | | | | | | | | | | | |
| Association Capital Ratios: | | | | | | | | | | | | | | | | | | | | | |
| Tangible capital ratio | | | 21.82 | % | | | 22.05 | % | | | 22.79 | % | | | 21.82 | % | | | 24.2 | % | | | 19.45 | % | | | 18.25 | |
| Core capital ratio | | | 21.82 | | | | 22.05 | | | | 22.79 | | | | 21.82 | | | | 24.2 | | | | 19.45 | | | | 18.25 | |
| Total capital ratio | | | 79.67 | | | | 83.74 | | | | 80.63 | | | | 79.67 | | | | 91.56 | | | | 71.21 | | | | 61.94 | |
Source: Home Federal Bancorp, Prospectus
Feldman Financial Advisors, Inc
Table 2 presents selected data concerning First Louisiana’s financial position as of December 31, 2003 to 2007 and December 31, 2007. The table also displays relative financial and performance ratios for the same period.
Table 2
Selected Financial Condition Data – First Louisiana Bancshares
As of December 31, 2003 Through 2007
| | | At December 31, | | |
| (Dollars in Thousands, except per share data) | | 2007 | | | 2006 | | | 2005 | | | 2004 | | | 2003 |
| Selected Financial and Other Data: | | | | | | | | | | | | | | |
| Total assets | | $ | 123,092 | | | $ | 112,687 | | | $ | 109,951 | | | $ | 101,501 | | | $ | 90,001 | |
| Loans receivable, net | | $ | 84,539 | | | $ | 79,157 | | | $ | 73,243 | | | $ | 70,799 | | | $ | 62,616 | |
| Cash, federal funds sold and other interest-bearing deposits | | | 8,462 | | | | 5,035 | | | | 7,799 | | | | 7,550 | | | | 5,650 | |
| Investment securities | | | 16,577 | | | | 16,457 | | | | 17,101 | | | | 11,716 | | | | 12,538 | |
| Deposits | | | 92,811 | | | | 86,682 | | | | 85,020 | | | | 74,390 | | | | 63,116 | |
| Borrowings | | | 12,446 | | | | 9,087 | | | | 13,872 | | | | 17,823 | | | | 17,837 | |
| Subordinated debentures to First Louisiana Statutory Trust I | | | 4,124 | | | | 4,124 | | | | -- | | | | -- | | | | -- | |
| Stockholders' Equity | | | 11,237 | | | | 10,335 | | | | 9,158 | | | | 8,737 | | | | 8,700 | |
| Full service offices | | | 3 | | | | 3 | | | | 3 | | | | 3 | | | | 3 | |
| | | As of or For the Year Ended December 31, | |
| | | 2007 | | | 2006 | | | 2005 | | | 2004 | | | 2003 | |
| Selected Operating Data: | | | | | | | | | | | | | | | |
| Interest income | | $ | 8,430 | | | $ | 7,587 | | | $ | 6,409 | | | $ | 5,172 | | | $ | 4,845 | |
| Interest expense | | | 3,101 | | | | 2,254 | | | | 1,715 | | | | 1,177 | | | | 1,216 | |
| Net interest income | | | 5,329 | | | | 5,333 | | | | 4,694 | | | | 3,995 | | | | 3,630 | |
| Provision for loan losses | | | 703 | | | | 983 | | | | 1,040 | | | | 1,270 | | | | 479 | |
| Net interest income after provision for loan losses | | | 4,626 | | | | 4,350 | | | | 3,653 | | | | 2,725 | | | | 3,151 | |
| Non-interest income | | | 1,104 | | | | 1,575 | | | | 944 | | | | 1,050 | | | | 1,049 | |
| Non-interest expense | | | 4,621 | | | | 4,380 | | | | 4,010 | | | | 3,704 | | | | 3,315 | |
| Income before income taxes | | | 1,109 | | | | 1,546 | | | | 587 | | | | 72 | | | | 885 | |
| Income taxes | | | 291 | | | | 488 | | | | 144 | | | | (45 | ) | | | 303 | |
| Net income | | | 818 | | | | 1,058 | | | | 443 | | | | 117 | | | | 582 | |
| Earnings per share of common stock: | | | | | | | | | | | | | | | | | | | | |
| Basic | | | 1.04 | | | | 1.35 | | | | 0.57 | | | | 0.15 | | | | 0.76 | |
| Diluted | | | 0.93 | | | | 1.22 | | | | 0.52 | | | | 0.14 | | | | 0.69 | |
| | | | | | | | | | | | | | | | |
| Selected Operating Ratios: | | | | | | | | | | | | | | | |
| Average yield on interest-earning assets | | | 7.73 | % | | | 7.45 | % | | | 6.76 | % | | | 6.27 | % | | | 6.62 | % |
| Average yield on interest-bearing liabilities | | | 3.50 | | | | 2.82 | | | | 2.27 | | | | 1.76 | | | | 2.09 | |
| Average interest rate spread | | | 4.23 | | | | 4.63 | | | | 4.49 | | | | 4.51 | | | | 4.53 | |
| Net interest margin | | | 5.01 | | | | 5.37 | | | | 5.01 | | | | 4.85 | | | | 4.95 | |
| Average interest-earning assets to interest-bearing liabilities | | | 156.11 | | | | 162.09 | | | | 160.72 | | | | 161.57 | | | | 162.09 | |
| Net interest income after provision for loan losses to non-interest expense | | | 100.11 | | | | 99.34 | | | | 91.12 | | | | 73.57 | | | | 95.05 | |
| Total non-interest expense to average assets | | | 3.96 | | | | 3.99 | | | | 3.91 | | | | 4.08 | | | | 4.1 | |
| Efficiency ratio | | | 71.83 | | | | 63.4 | | | | 71.12 | | | | 73.42 | | | | 70.85 | |
| Return on average assets | | | 0.7 | | | | 0.96 | | | | 0.43 | | | | 0.13 | | | | 0.72 | |
| Return on average equity | | | 7.51 | | | | 10.71 | | | | 4.95 | | | | 1.33 | | | | 6.93 | |
| Average equity to average assets | | | 9.33 | | | | 8.99 | | | | 8.73 | | | | 9.68 | | | | 10.37 | |
| | | | | | | | | | | | | | | | | | | | | |
| | | | | | | | | | | | | | | | |
| Asset Quality Ratios: | | | | | | | | | | | | | | | |
| Non-performing loans as a percent of total loans receivable | | | 0.37 | % | | | 2.67 | % | | | 1.68 | % | | | 1.10 | % | | | 4.37 | % |
| Non-performing assets as a percent of total assets | | | 2.13 | | | | 2.90 | | | | 1.62 | | | | 2.18 | | | | 3.46 | |
| Allowance for loan losses as a percent of total loans receivable | | | 1.04 | | | | 1.32 | | | | 1.41 | | | | 1.07 | | | | 1.17 | |
| Net charge-offs to average loans receivable | | | 1.02 | | | | 1.24 | | | | 1.04 | | | | 1.90 | | | | 0.52 | |
| | | | | | | | | | | | | | | | |
| Bank Capital Ratios: | | | | | | | | | | | | | | | |
| Tangible capital ratio | | | 10.88 | % | | | 11.02 | % | | | 10.44 | % | | | 10.29 | % | | | 11.48 | % |
| Core capital ratio | | | 10.88 | | | | 11.02 | | | | 10.44 | | | | 10.29 | | | | 11.48 | |
| Total capital ratio | | | 11.6 | | | | 11.96 | | | | 11.43 | | | | 11.08 | | | | 12.35 | |
Source: First Louisiana Bancshares, Prospectus
Feldman Financial Advisors, Inc
Balance Sheet Analysis
Home Federal Bancorp
The Company’s total assets experienced relatively steady growth since December 31, 2003, increasing by a compound annual rate of 5.5% from $100.8 million at June 30, 2003 to $128.1 million at December 31, 2007. The net asset expansion of $27.3 million over this period occurred primarily in the securities available for sale portfolio, which increased to $81.2 million at December 31, 2007 from $53.0 million at June 30, 2003. The loan portfolio decreased from $33.2 million at June 30, 2003 to $28.8 million at December 31, 2007, a decline of $4.5 million.
At December 31, 2007, total assets amounted to $128.1 million compared to $118.8 million at June 30, 2007, an increase of approximately $9.3 million, or 7.8%. This increase was primarily due to an increase in cash and cash equivalents of $11.0 million, or 276.6%, and an increase in loans receivable of $2.6 million, or 10.3%. These increases were partially offset by a decrease in the Company's deferred tax asset of $1.2 million, or 80.6%, and a decrease in investment securities of $2.7 million, or 3.1%.
The increase in cash and cash equivalents was due primarily to proceeds received through deposits, principal payments on securities and advances from the Federal Home Loan Bank of Dallas. The increase in loans receivable was primarily due to the purchase of first mortgage loans originated by another mortgage loan company. The purchased loans are from a mortgage loan originator in Arkansas and are secured by one-to-four-family residential properties. While the purchased loans are originated as fixed rate loans, Home Federal receives an adjustable rate of interest. Under the terms of the loan agreements, the seller repurchases any loan that becomes more than 90 days delinquent. At December 31, 2007, the balance of the purchased loans approximated $10.8 million. The decrease in investment securities was primarily due to sale of securities, partially offset by an increase in the market value of securities available for sale and the purchase of new securities.
Feldman Financial Advisors, Inc
Home Federal Bancorp's total assets increased $4.8 million, or 4.2%, to $118.8 million at June 30, 2007 compared to $114.0 million at June 30, 2006. This increase was primarily due to an increase in loans receivable and held-for-sale of $5.8 million and partially offset by a decrease in cash and cash equivalents of $958,000 compared to the prior year period.
Loans receivable, net increased $4.3 million, or 20.6%, from $20.9 million at June 30, 2006 to $25.2 million at June 30, 2007. The increase in loans receivable, net was attributable primarily to an increase in one-to-four family residential loans of $3.0 million, and an increase in home equity and second mortgage loans of $1.2 million.
Cash and cash equivalents decreased $958,000, or 18.3%, from $4.9 million at June 30, 2006 to $4.0 million at June 30, 2007. Securities available for sale remained stable from June 30, 2006 to June 30, 2007 at $83.7 million. During the past two years, the Company has experienced significant loan prepayments due to the heavy volume of loan refinancing. However, when interest rates were at their cyclical lows, management was reluctant to invest in long-term, fixed rate mortgage loans for portfolio and instead sold the majority of the long-term, fixed-rate mortgage loan production. The Company has attempted to strengthen its interest-rate risk position and favorably structure the balance sheet to take advantage of a rising rate environment by purchasing investment securities classified as available for sale.
The Company's total liabilities amounted to $97.6 million at December 31, 2007 an increase of approximately $6.6 million, or 7.3%, compared to total liabilities of $91.0 million at June 30, 2007. The primary reason for the increase in liabilities was due to the $3.3 million, or 4.2%, increase of customers' deposits due to normal deposits inflow, and a $3.5 million, 28.8%, increase in advances from the Federal Home Loan Bank.
Feldman Financial Advisors, Inc
Total liabilities increased $5.5 million, or 6.4%, from $85.5 million at June 30, 2006 to $91.0 million at June 30, 2007 due primarily to an increase in deposits of $6.4 million over the prior year period, partially offset by a decrease of $1.0 million, or 7.5%, in FHLB advances. The increase in deposits was attributable primarily to increases in certificates of deposit as well as increases in non-interest bearing and NOW accounts, partially offset by decreases in money market and passbook savings accounts. Certificates of deposit increased $6.0 million, or 10.5%, from $57.0 million at June 30, 2006 to $63.0 million at June 30, 2007.
Stockholders' equity increased $2.6 million, or 9.5%, to $30.4 million at December 31, 2007 compared to $27.8 million at June 30, 2007. This increase was primarily the result of the change in the Company's Accumulated Other Comprehensive Loss associated with securities available-for-sale of $2.3 million, or 82.2%, the recognition of net income of $263,000 for the six months ended December 31, 2007, and the distribution of shares associated with the Company's Recognition and Retention Plan of $156,000. These increases were offset by dividends of $147,000 paid during the six months ended December 31, 2007, and the acquisition of treasury shares of $38,000.
Stockholders' equity decreased $727,000, or 2.5%, to $27.8 million at June 30, 2007 from June 30, 2006 due primarily to treasury stock acquisitions for fiscal 2007 of $1.6 million, partially offset by accumulated comprehensive income of $275,000 and net income of $637,000. The change in accumulated other comprehensive income was primarily due to the change in net unrealized loss on securities available for sale due to recent minor declines in interest rates.
Feldman Financial Advisors, Inc
First Louisiana Bancshares
At December 31, 2007, total assets amounted to $123.1 million compared to $112.7 million at December 31, 2006, an increase of approximately $10.4 million, or 9.2%. This increase was primarily due to an increase in cash. Federal funds sold and other interest-bearing deposits of $3.4 million, or 68.1%, and an increase in loans receivable of $5.4 million, or 6.8%. The growth in loans receivable was driven by an increase in the commercial real estate portfolio. In addition, real estate owned increased by $1.2 million, or 105.0%
Deposits increased by $6.1 million, or 7.1%, from $86.7 million at December 31, 2006 to $92.8 million at December 31, 2007. This increase was primarily due to an increase in time deposit accounts. Time deposits increased from $30.4 million at December 31, 2006 to $38.3 million at December 31, 2007, an increase of $7.8 million or 25.8%. Borrowings from the Federal Home Loan Bank increased by $3.4 million, or 37.0%, from $9.1 million at December 31, 2006 to $12.4 million at December 31, 2007.
Stockholders’ equity increased by approximately $902,000, or 8.7%, from $10.3 million at December 31, 2006 to $11.2 million at December 31, 2007, which was primarily attributable to the increase in retained earnings of approximately $714,000.
Pro Forma Balance Sheet Impact of Acquisition of First Louisiana Bancshares
The pro forma balance sheet impact of the First Louisiana acquisition is shown in Table 3 as of December 31, 2007. This analysis does not take into consideration the proceeds from the Conversion. On the asset side of the balance sheet, the ratio of loans-to-assets will increase and the level of cash and investments comprising total assets will decline before factoring in the infusion of the net conversion proceeds. The decline in the pro forma level of cash and investments reflects the impact of funding the cash consideration and related acquisition cost, which have been estimated to total $9.9 million in the pro forma adjustments.
Feldman Financial Advisors, Inc
Table 3
Pro Forma Balance Sheet Data
As of December 31, 2007
| | | | | | | | | Pro | | | Home | |
| | | Home | | | First | | | Forma | | | Federal | |
| | | Federal | | | Louisiana | | | Merger | | | Bancorp | |
| | | Bancorp | | | Bancshares | | | Adjust- | | | Pro Forma | |
| | | Historical | | | Historical | | | ments | | | Consolidated | |
| Assets: | | | | | | | | | | | | |
| Cash and cash equivalents | | $ | 14,958 | | | $ | 8,462 | | | $ | (9,894 | ) | | $ | 13,526 | |
| Investment securities available for sale | | | 81,163 | | | | 15,449 | | | | - | | | | 96,612 | |
| Investment securities held to maturity | | | 1,331 | | | | 1,128 | | | | - | | | | 2,459 | |
| Loans receivable, net | | | 28,751 | | | | 84,539 | | | | (374 | ) | | | 112,916 | |
| Premises and equipment | | | 907 | | | | 6,252 | | | | 500 | | | | 7,659 | |
| Bank owned life insurance | | | - | | | | 3,039 | | | | - | | | | 3,039 | |
| Goodwill | | | - | | | | - | | | | 11,653 | | | | 11,653 | |
| Core deposit intangible | | | - | | | | - | | | | 1,660 | | | | 1,660 | |
| Other assets | | | 974 | | | | 4,223 | | | | (441 | ) | | | 4,756 | |
| Total assets | | $ | 128,084 | | | $ | 123,092 | | | $ | 3,104 | | | $ | 254,280 | |
| | | | | | | | | | | | | | | | | |
| Liabilities: | | | | | | | | | | | | | | | | |
| Deposits | | $ | 80,986 | | | $ | 92,811 | | | $ | 103 | | | $ | 173,900 | |
| Borrowings | | | 15,933 | | | | 13,160 | | | | 148 | | | | 29,241 | |
| Other liabilities | | | 724 | | | | 1,760 | | | | - | | | | 2,484 | |
| Subordinated debentures | | | - | | | | 4,124 | | | | (480 | ) | | | 3,644 | |
| Total liabilities | | | 97,643 | | | | 111,855 | | | | (229 | ) | | | 209,269 | |
| | | | | | | | | | | | | | | | | |
| Stockholders' equity: | | | | | | | | | | | | | | | | |
| Preferred stock | | | - | | | | - | | | | - | | | | - | |
| Common stock | | | 14 | | | | 1,577 | | | | (1,564 | ) | | | 27 | |
| Additional paid-in capital | | | 13,541 | | | | 6,538 | | | | 8,018 | | | | 28,097 | |
| Retained earnings | | | 20,565 | | | | 3,073 | | | | (3,073 | ) | | | 20,565 | |
| Employee stock ownership plan | | | (969 | ) | | | - | | | | - | | | | (969 | ) |
| Recognition and retention plan | | | (395 | ) | | | - | | | | - | | | | (395 | ) |
| Accumulated other comprehensive (loss) income | | | (506 | ) | | | 49 | | | | (49 | ) | | | (506 | ) |
| Treasury stock, at cost | | | (1,809 | ) | | | - | | | | - | | | | (1,809 | ) |
| Total stockholders' equity | | | 30,441 | | | | 11,237 | | | | 3,333 | | | | 45,011 | |
| | | | | | | | | | | | | | | | | |
| Total liabilities and stockholders' equity | | $ | 128,084 | | | $ | 123,092 | | | $ | 3,104 | | | $ | 254,280 | |
Source: Home Federal Bancorp; First Louisiana Bancshares; preliminary prospectus.
Feldman Financial Advisors, Inc
Table 4 shows the pro forma balance sheet impact of the First Louisiana acquisition as of June 30, 2007.
Table 4
Pro Forma Balance Sheet Data
As of June 30, 2007
| | | | | | | | | Pro | | | Home | |
| | | Home | | | First | | | Forma | | | Federal | |
| | | Federal | | | Louisiana | | | Merger | | | Bancorp | |
| | | Bancorp | | | Bancshares | | | Adjust- | | | Pro Forma | |
| | | Historical | | | Historical | | | ments | | | Consolidated | |
| Assets: | | | | | | | | | | | | |
| Cash and cash equivalents | | $ | 3,972 | | | $ | 5,413 | | | $ | (9,894 | ) | | $ | (509 | ) |
| Investment securities available for sale | | | 83,752 | | | | 12,446 | | | | - | | | | 96,198 | |
| Investment securities held to maturity | | | 1,408 | | | | 1,109 | | | | - | | | | 2,517 | |
| Loans receivable, net | | | 26,689 | | | | 83,577 | | | | (374 | ) | | | 109,892 | |
| Premises and equipment | | | 923 | | | | 6,005 | | | | 500 | | | | 7,428 | |
| Bank owned life insurance | | | - | | | | 2,990 | | | | - | | | | 2,990 | |
| Goodwill | | | - | | | | - | | | | 12,131 | | | | 12,131 | |
| Core deposit intangible | | | - | | | | - | | | | 1,660 | | | | 1,660 | |
| Other assets | | | 2,041 | | | | 4,642 | | | | (441 | ) | | | 6,242 | |
| Total assets | | $ | 118,785 | | | $ | 116,182 | | | $ | 3,582 | | | $ | 238,549 | |
| | | | | | | | | | | | | | | | | |
| Liabilities: | | | | | | | | | | | | | | | | |
| Deposits | | $ | 77,710 | | | $ | 85,590 | | | $ | 103 | | | $ | 163,403 | |
| Borrowings | | | 12,368 | | | | 14,038 | | | | 148 | | | | 26,554 | |
| Other liabilities | | | 895 | | | | 1,671 | | | | - | | | | 2,566 | |
| Subordinated debentures | | | - | | | | 4,124 | | | | (480 | ) | | | 3,644 | |
| Total liabilities | | | 90,973 | | | | 105,423 | | | | (229 | ) | | | 196,167 | |
| | | | | | | | | | | | | | | | | |
| Stockholders' equity: | | | | | | | | | | | | | | | | |
| Preferred stock | | | - | | | | - | | | | - | | | | - | |
| Common stock | | | 14 | | | | 1,577 | | | | (1,564 | ) | | | 51 | |
| Additional paid-in capital | | | 13,509 | | | | 6,538 | | | | 8,018 | | | | 28,065 | |
| Retained earnings | | | 20,449 | | | | 2,745 | | | | (2,745 | ) | | | 20,449 | |
| Employee stock ownership plan | | | (997 | ) | | | - | | | | - | | | | (997 | ) |
| Recognition and retention plan | | | (551 | ) | | | - | | | | - | | | | (551 | ) |
| Accumulated other comprehensive (loss) income | | | (2,841 | ) | | | (101 | ) | | | 101 | | | | (2,841 | ) |
| Treasury stock, at cost | | | (1,771 | ) | | | - | | | | - | | | | (1,771 | ) |
| Total stockholders' equity | | | 27,812 | | | | 10,759 | | | | 3,811 | | | | 42,382 | |
| | | | | | | | | | | | | | | | | |
| Total liabilities and stockholders' equity | | $ | 118,785 | | | $ | 116,182 | | | $ | 3,582 | | | $ | 238,549 | |
Source: Home Federal Bancorp; First Louisiana Bancshares; preliminary prospectus.
Feldman Financial Advisors, Inc
As of December 31, 2007, the Company had no intangible assets, while on a pro forma combined basis goodwill and intangibles equaled 5.2% of assets. On the liability side of the balance sheet, the level of deposits and borrowings funding assets will increase, on a pro forma combined basis. Deposits increase to 68.4% of assets on a pro forma combined basis, while borrowings increase slightly from 12.4% of assets to 12.9% of assets on a pro forma combined basis. Before factoring in the impact of the net conversion proceeds, the Company’s equity-to-asset ratio decreases from 23.8% to 17.7% on a pro forma combined basis and the tangible equity-to-assets ratio decreases from 23.8% to 13.2%.
Lending Activities
Home Federal Bancorp
At December 31, 2007, Home Federal Bancorp's net loan portfolio amounted to $28.8 million, representing approximately 22.4% of total assets at that date. Historically, the Company’s principal lending activity has been the origination of one- to four-family residential loans. At December 31, 2007, one- to four-family residential loans totaled $19.0 million, or 67.6% of the total loan portfolio. As part of its desire to diversify the loan portfolio, the Company also offers consumer loans, which includes home equity loans, second mortgage loans and lines of credit and amounted to $5.5 million, or 19.5% of the total loan portfolio at December 31, 2007.
If the merger is completed, and the Company acquires First Louisiana Bancshares, the composition of the loan portfolio will change. First Louisiana Bancshares' primary lending activity is the origination of commercial real estate and commercial business loans. At December 31, 2007, First Louisiana Bancshares' commercial real estate loans amounted to $45.8 million, or 53.6% of the total loan portfolio and commercial business loans amounted to $26.7 million, or 31.3% of the total loan portfolio.
Feldman Financial Advisors, Inc
The types of loans that the Company may originate are subject to federal and state laws and regulations. Interest rates charged on loans are affected principally by the demand for such loans and the supply of money available for lending purposes and the rates offered by competitors. These factors are, in turn, affected by general and economic conditions, the monetary policy of the federal government, including the Federal Reserve Board, legislative and tax policies, and governmental budgetary matters.
A savings institution generally may not make loans to one borrower and related entities in an amount that exceeds 15% of its unimpaired capital and surplus. In addition, upon application the Office of Thrift Supervision permits a savings institution to lend up to an additional 15% of unimpaired capital and surplus to one borrower to develop domestic residential housing units.
At December 31, 2007, the regulatory limit on loans-to-one borrower was $4.2 million and the five largest loans or groups of loans-to-one borrower, including related entities, aggregated $3.1 million, $270,000, $355,000, $443,000 and $422,000. Each of the Company’s five largest loans or groups of loans was performing in accordance with its terms at December 31, 2007. The loan commitment described below is related to the largest loan to one borrower. The Company has applied to and received the approval of the Office of Thrift Supervision to utilize the higher lending limit for this loan relationship. Loans to or guaranteed by general obligations of a state or political subdivision are not subject to the foregoing lending limits
The board of directors has authorized a loan commitment of approximately $1.5 million to a limited partnership established by the Housing Authority of Bossier City, Louisiana, which is expected to be entered into in the third or fourth quarter of fiscal 2008. The loan will be secured by a first mortgage lien on real estate and low to moderate income rental units in Bossier City, Louisiana as well as a conditional assignment of rents. The commitment letter will include a condition that the Housing Authority of Bossier City, Louisiana executes takeout agreements with respect to the Company’s position in the event of default.
Feldman Financial Advisors, Inc
Table 5 and Exhibit II-5 analyze the composition of the loan portfolio by loan category at the dates indicated for Home Federal Bancorp.
Table 5
Loan Portfolio – Home Federal Bancorp
At June 30, 2003 to 2007 and at December 31, 2007
(Dollars in Thousands)
| | | | | | | | | June 30, | |
| | | December 31, 2007 | | | 2007 | | | 2006 | | | 2005 | | | 2004 | | | 2003 | |
| | | Amount | | | % | | | Amount | | | % | | | Amount | | | % | | | Amount | | | % | | | Amount | | | % | | | Amount | | | % | |
| Real estate loans: | | | | | | | | | | | | | | | | | | | | | | | | | | | | | | | | | | | | |
| One- to four-family residential | | $ | 19,016 | | | | 67.64 | | | $ | 16,669 | | | | 65.27 | | | $ | 13,721 | | | | 64.72 | | | $ | 19,301 | | | | 80.79 | | | $ | 20,903 | | | | 90.82 | | | $ | 30,341 | | | | 93.62 | |
| Other mortgage | | | 3,619 | | | | 12.87 | | | | 3,650 | | | | 14.29 | | | | 3,164 | | | | 14.92 | | | | 837 | | | | 3.50 | | | | 101 | | | | 0.44 | | | | 116 | | | | 0.36 | |
| Total real estate loans | | | 22,635 | | | | 80.51 | | | | 20,319 | | | | 79.56 | | | | 16,885 | | | | 79.64 | | | | 20,138 | | | | 84.29 | | | | 21,004 | | | | 91.26 | | | | 30,457 | | | | 93.98 | |
| | | | | | | | | | | | | | | | | | | | | | | | | | | | | | | | | | | | | | | | | | | | | | | | | |
| Consumer loans: | | | | | | | | | | | | | | | | | | | | | | | | | | | | | | | | | | | | | | | | | | | | | | | | |
| Home equity loans and second mortgage loans | | | 4,209 | | | | 14.97 | | | | 4,454 | | | | 17.44 | | | | 3,287 | | | | 15.50 | | | | 2,776 | | | | 11.62 | | | | 1,077 | | | | 4.68 | | | | 1,046 | | | | 3.23 | |
| Savings account | | | 490 | | | | 1.74 | | | | 283 | | | | 1.11 | | | | 613 | | | | 2.89 | | | | 470 | | | | 1.97 | | | | 590 | | | | 2.56 | | | | 714 | | | | 2.20 | |
| Equity lines of credit | | | 719 | | | | 2.56 | | | | 427 | | | | 1.67 | | | | 374 | | | | 1.76 | | | | 500 | | | | 2.09 | | | | 343 | | | | 1.49 | | | | 187 | | | | 0.58 | |
| Other | | | 60 | | | | 0.21 | | | | 57 | | | | 0.22 | | | | 43 | | | | 0.20 | | | | 6 | | | | 0.03 | | | | 1 | | | | 0.00 | | | | 5 | | | | 0.02 | |
| Total consumer loans | | | 5,478 | | | | 19.49 | | | | 5,221 | | | | 20.44 | | | | 4,317 | | | | 20.36 | | | | 3,752 | | | | 15.71 | | | | 2,011 | | | | 8.74 | | | | 1,952 | | | | 6.02 | |
| Total loans | | | 28,113 | | | | 100.00 | | | | 25,540 | | | | 100.00 | | | | 21,202 | | | | 100.00 | | | | 23,890 | | | | 100.00 | | | | 23,015 | | | | 100.00 | | | | 32,409 | | | | 100.00 | |
| | | | | | | | | | | | | | | | | | | | | | | | | | | | | | | | | | | | | | | | | | | | | | | | | |
| Less: | | | | | | | | | | | | | | | | | | | | | | | | | | | | | | | | | | | | | | | | | | | | | | | | |
| Allowance for loan losses | | | (235 | ) | | | | | | | (235 | ) | | | | | | | (235 | ) | | | | | | | (235 | ) | | | | | | | (235 | ) | | | | | | | (235 | ) | | | | |
| Deferred loan fees | | | (89 | ) | | | | | | | (94 | ) | | | | | | | (101 | ) | | | | | | | (80 | ) | | | | | | | (101 | ) | | | | | | | (183 | ) | | | | |
| Net Loans (1) | | $ | 27,789 | | | | | | | $ | 25,211 | | | | | | | $ | 20,866 | | | | | | | $ | 23,575 | | | | | | | $ | 22,679 | | | | | | | $ | 31,991 | | | | | |
______________________
| (1) | Does not include loans held for sale amounting to $961,644, $1,478,434, $0, $70,000, $108,000 and $1.2 million at December 31, 2007 2006, 2005, 2004 and 2003 respectively. |
Source: Home Federal Bancorp, Prospectus
One- to Four-Family Residential Real Estate Loans. The Company’s primary lending activity is the origination of loans secured by single-family residences. At December 31, 2007, $19.0 million, or 67.6%, of the total loan portfolio, before net items, consisted of one- to four-family residential loans. The loan-to-value ratio, maturity and other provisions of the loans made by us generally have reflected the policy of making less than the maximum loan permissible under applicable regulations, in accordance with sound lending practices, market conditions and underwriting standards established by us. The current lending policy on one- to four-family residential loans generally limits the maximum loan-to-value ratio to 80% or less of the appraised value of the property although the Company will lend up to a 95% loan-to-value ratio with private mortgage insurance. These loans are amortized on a monthly basis with principal and interest due each month and generally include "due-on-sale" clauses.
Feldman Financial Advisors, Inc
At December 31, 2007, $8.1 million, or 42.8%, of the one- to four-family residential mortgage loans were fixed-rate loans. Fixed-rate loans generally have maturities ranging from 15 to 30 years and are fully amortizing with monthly loan payments sufficient to repay the total amount of the loan with interest by the end of the loan term. Fixed-rate loans generally are originated under terms, conditions and documentation, which permit them to be sold to U.S. Government-sponsored agencies, such as the Federal Home Loan Mortgage Corporation, and other investors in the secondary mortgage market. Consistent with the asset/liability management, the Company has sold a significant portion of long-term, fixed rate loans over the past two years.
Although the Company offers adjustable rate loans, substantially all of the single-family loan originations over the last few years have consisted of fixed-rate loans due to the low interest rate environment. The adjustable-rate loans held in portfolio typically have interest rates, which adjust on an annual basis or semi-annual basis. These loans generally have an annual cap of 2% on any increase or decrease and a cap of 6% above or below the initial rate over the life of the loan. Such loans are underwritten based on the initial rate plus 2%.
Consumer Loans. The Company is authorized to make loans for a wide variety of personal or consumer purposes. The Company originates consumer loans in order to accommodate customers and because such loans generally have shorter terms and higher interest rates than residential mortgage loans. The consumer loans offered consist of home equity and second mortgage loans, loans secured by deposit accounts with us, equity lines of credit and automobile loans. However, the Company does not intend to materially expand its product offerings and instead intends to focus on increasing the volume of current products, primarily home equity and second mortgage loans. At December 31, 2007, $5.5 million, or 19.5% of the total loan portfolio consisted of consumer loans compared to $5.2 million, or 22.4% of the loan portfolio at December 31, 2006.
Feldman Financial Advisors, Inc
Of the $5.5 million of consumer loans held at December 31, 2007, $4.2 million consisted of home equity and second mortgage loans compared to $5.0 million of home equity and second mortgage loans at December 31, 2006. These loans are secured by the underlying equity in the borrower's residence. The Company does not require that it hold the first mortgage on the properties that secure the second mortgage loans. The amount of second mortgage loans generally cannot exceed a loan-to-value ratio of 80% after taking into consideration the first mortgage loan. These loans are typically three-to-five year balloon loans with fixed rates and contain an on-demand clause that allows for a call on the loan at any time.
The Company offers loans secured by deposit accounts held with the Company, which loans amounted to $490,000, or 1.7% of the total loan portfolio at December 31, 2007. Such loans are originated for up to 90% of the account balance, with a hold placed on the account restricting the withdrawal of the account balance. The interest rate on the loan is equal to the interest rate paid on the account plus 2%. These loans typically are payable on demand with a maturity date of one year.
The Company also offers lines of credit secured by a borrower's equity in real estate, which loans amounted to $719,000 or 2.6% of the total loan portfolio at December 31, 2007. The rates and terms of such lines of credit depend on the history and income of the borrower, purpose of the loan and collateral. Lines of credit will not exceed 90% of the value of the equity in the collateral.
Feldman Financial Advisors, Inc
Consumer loans generally have shorter terms and higher interest rates than residential mortgage loans, but generally entail greater credit risk than residential mortgage loans, particularly those loans secured by assets that depreciate rapidly, such as automobiles, boats and recreational vehicles. In such cases, repossessed collateral for a defaulted consumer loan may not provide an adequate source of repayment for the outstanding loan and the remaining deficiency often does not warrant further substantial collection efforts against the borrower. In particular, amounts realizable on the sale of repossessed automobiles may be significantly reduced based upon the condition of the automobiles and the fluctuating demand for used automobiles.
The Company’s lending activities are subject to the written underwriting standards and loan origination procedures established by the board of directors and management. Loan originations are obtained through a variety of sources, primarily consisting of referrals from real estate brokers and existing customers. Written loan applications are taken by one of the loan officers. The loan officer also supervises the procurement of credit reports, appraisals and other documentation involved with a loan. As a matter of practice, the Company obtains independent outside appraisals on substantially all of its loans. Under the lending policy, a title opinion must be obtained for each real estate loan. The Company also requires fire and extended coverage casualty insurance in order to protect the properties securing the real estate loans. Borrowers must also obtain flood insurance policies when the property is in a flood hazard area.
The loan approval process is intended to assess the borrower's ability to repay the loan, the viability of the loan and the value of the property that will secure the loan. Loans up to $417,000, the current Fannie Mae conforming loan limit for single-family mortgage loans, must be approved by the loan committee, which consists of the Chief Executive Officer, the principal financial officer and the Vice President of Lending. Loans in excess of $417,000 must be approved by the board of directors. In accordance with past practice, all loans are ratified by the board of directors.
Feldman Financial Advisors, Inc
During fiscal 2007 and the six months ended December 31, 2007, the Company also purchased loans from a mortgage originator secured by single family housing located in the mid-south region of the United States . The loans were generally secured by rural properties and the seller retained servicing rights. Although the loans were originated with fixed-rates, the Company received an adjustable rate of interest with a floor rate of 5.0% and a ceiling of 8.0%. Under the terms of the loan agreements, the seller must repurchase any loan that becomes more than 90 days delinquent. At December 31, 2007, the Company had approximately $10.6 million of such loans in portfolio. Table 6 shows total loans originated, sold and repaid during the periods indicated.
First Louisiana Bancshares
The primary lending activity of First Louisiana Bank is the origination of commercial loans to small and mid-size businesses. Commercial loan products include commercial real estate construction and term loans, working capital loans and lines of credit, business equipment, inventory, and accounts receivable financing. First Louisiana Bank also offers a range of cash management services and deposit products to its commercial customers. On-line banking is also available to commercial customers.
Feldman Financial Advisors, Inc
Table 6
Loan Originations, Sales and Repayments – Home Federal Bancorp
For the Years Ended June 30, 2005 to 2007
And the Six Months Ended December 31, 2006 and 2007
(Dollars in Thousands)
| | | Six Months | | | | | | | | | | |
| | | Ended December 31, | | | Year Ended June 30, | |
| | | 2007 | | | 2006 | | | 2007 | | | 2006 | | | 2005 | |
| Loan originations: | | | | | | | | | | | | | | | |
| One- to - four-family residential | | $ | 9,587 | | | $ | 5,421 | | | $ | 15,108 | | | $ | 12,076 | | | $ | 6,799 | |
| Other mortgage | | | - | | | | - | | | | 530 | | | | 2,312 | | | | 843 | |
| Consumer | | | 903 | | | | 2,052 | | | | 2,842 | | | | 3,045 | | | | 3,583 | |
| Total loan originations | | | 10,490 | | | | 7,473 | | | | 18,480 | | | | 17,433 | | | | 11,225 | |
| Loans purchased | | | 3,455 | | | | 2,068 | | | | 5,797 | | | | - | | | | 2,086 | |
| Total loan originations and loans purchased | | | 13,945 | | | | 9,541 | | | | 24,277 | | | | 17,433 | | | | 13,311 | |
| | | | | | | | | | | | | | | | | | | | | |
| Loans sold | | | (9,438 | ) | | | (4,802 | ) | | | (12,356 | ) | | | (2,944 | ) | | | (2,146 | ) |
| Loan principal payments | | | (2,450 | ) | | | (2,534 | ) | | | (6,104 | ) | | | (17,247 | ) | | | (10,327 | ) |
| Total loans sold and principal repayments | | | (11,888 | ) | | | (7,336 | ) | | | (18,460 | ) | | | (20,191 | ) | | | (12,473 | ) |
| (Increase) decrease due to other items, net (1) | | | 521 | | | | (256 | ) | | | (1,472 | ) | | | 49 | | | | 58 | |
| Net increase (decrease) in loan portfolio | | $ | 2,578 | | | $ | 1,949 | | | $ | 4,345 | | | $ | (2,709 | ) | | $ | 896 | |
______________________
| (1) | Other items consist of deferred loan fees, the allowance for loan losses and loans held for sale at year end. |
Source: Home Federal Bancorp; Prospectus
At December 31, 2007, First Louisiana Bank’s loan portfolio totaled approximately $85.4 million, representing approximately 69.4% of its total assets of approximately $123.1 million. The composition of First Louisiana Bank’s loan portfolio at December 31, 2007 and 2006 is summarized below in Table 7 and Exhibit II-6.
First Louisiana Bank’s lending activities are subject to written loan policies approved by the board of directors to ensure proper management of credit risk. Loans are subject to a defined credit process that includes credit evaluation of borrowers, risk rating of credits, establishment of lending limits, and application of lending procedures, including holding of adequate collateral and the maintenance of compensating balances, as well as procedures for on-going identification and management of credit problems. Regular portfolio reviews are performed by an outside third party to identify potential underperforming credits, estimate of loss exposure, and to ascertain compliance with the bank’s policies.
Feldman Financial Advisors, Inc
First Louisiana Bank’s lending activities are subject to written loan policies approved by the board of directors to ensure proper management of credit risk. Loans are subject to a defined credit process that includes credit evaluation of borrowers, risk rating of credits, establishment of lending limits, and application of lending procedures, including holding of adequate collateral and the maintenance of compensating balances, as well as procedures for on-going identification and management of credit problems. Regular portfolio reviews are performed by an outside third party to identify potential underperforming credits, estimate of loss exposure, and to ascertain compliance with the bank’s policies.
Table 7
Loan Portfolio – First Louisiana Bancshares
At December 31, 2006 and 2007
(Dollars in Thousands)
| | | Year Ended December 31, | |
| | | 2007 | | | 2006 | |
| | | Amount | | | % | | | Amount | | | % | |
| | | | | | | | | | | | | |
| Commercial Real Estate | | $ | 45,821 | | | | 53.6 | | | $ | 40,081 | | | | 50.0 | |
| Residential Real Estate | | | 5,854 | | | | 6.9 | | | | 6,041 | | | | 7.5 | |
| Commercial and Industrial | | | 26,724 | | | | 31.3 | | | | 25,111 | | | | 31.3 | |
| Consumer and Other | | | 7,042 | | | | 8.2 | | | | 8,988 | | | | 11.2 | |
| Total loans | | $ | 85,441 | | | | 100.0 | | | $ | 80,221 | | | | 100.0 | |
| | | | | | | | | | | | | | | | | |
| Less: | | | | | | | | | | | | | | | | |
| Deferred loan origination fees | | | 11 | | | | | | | | 6 | | | | | |
| Allowance for loan losses | | | 891 | | | | | | | | 1,058 | | | | | |
| | | | 902 | | | | | | | | 1,064 | | | | | |
| | | | | | | | | | | | | | | | | |
| Total loans, net | | $ | 84,539 | | | | | | | $ | 79,157 | | | | | |
Commercial Real Estate Loans. At December 31, 2007, First Louisiana Bank's commercial real estate portfolio, excluding commercial construction loans, totaled approximately $32.7 million. First Louisiana Bank originates mortgage loans secured by commercial real estate. Such loans are primarily secured by commercial offices, warehouses, strip shopping centers, hotels and retail buildings. The value of underlying collateral is assessed through independent appraisers. Although terms may vary, the First Louisiana Bank’s commercial mortgages are normally long term in nature. First Louisiana Bank seeks to reduce the risks associated with commercial real estate lending by generally lending in its market area and obtaining periodic financial statements and tax returns from the borrowers. It is also the general policy of First Louisiana Bank to obtain personal guarantees from the principals of these companies and assignments of all leases, rents and revenues related to the collateral.
Feldman Financial Advisors, Inc
Commercial Loans. At December 31, 2007, First Louisiana Bank’s commercial loan portfolio totaled approximately $26.0 million. First Louisiana Bank originates secured and unsecured loans for business purposes. Loans are made for acquisition, expansion and working capital purposes and may be secured by real estate, accounts receivable, inventory, equipment or other assets. The financial condition and cash flow of commercial borrowers are closely monitored by the submission of corporate financial statements, personal financial statements and income tax returns. The frequency of submissions of required financial information depends on the size and complexity of the credit and the collateral that secures the loan. It is the general policy of First Louisiana Bank to obtain personal guarantees from the principals of the commercial loan borrowers.
Construction Loans. At December 31, 2007, First Louisiana Bank’s construction loan portfolio totaled approximately $7.7 million. First Louisiana Bank provides interim real estate acquisition development and construction loans to builders, developers and persons who will ultimately occupy the property. Real estate development and construction loans to provide interim financing on the property are based on acceptable percentages of the appraised value of the property securing the loan in each case. Real estate development and construction loan proceeds are funded periodically at pre-specified stages of completion and after on-site inspections of the property.
Feldman Financial Advisors, Inc
Development and construction loans are secured by the properties under development or construction and personal guarantees are typically obtained. Further, to assure that reliance is not placed solely on the value of the property, First Louisiana Bank considers the financial condition and reputation of the borrower and any guarantors, the amount of the borrower’s equity in the project, independent appraisals, costs estimates and pre-construction sale information.
Loans to individuals for the construction of their primary or secondary residences are secured by the property under construction. The loan-to-value ratio of each construction loan is based on the lesser of the cost to build or the appraised value of the completed home. Construction loans have a normal maturity of 12 months and are typically approved with a permanent take-out commitment.
Residential Real Estate Loans. At December 31, 2007, First Louisiana Bank’s residential loan portfolio totaled approximately $10.7 million. First Louisiana Bank originates adjustable and fixed rate mortgage loans, most of which are referred to a third party, who underwrites these loans and sells them in the secondary market. First Louisiana Bank originates some of the loans for its portfolio.
Other Consumer Loans and Home Equity Lines. At December 31, 2007, First Louisiana Bank’s consumer loan portfolio totaled approximately $6.4 million and its home equity lines totaled approximately $1.8 million. First Louisiana Bank offers a variety of consumer loans. These loans are typically secured by residential and other personal property. Home equity loans and lines of credit are typically based on 80% of the appraised value of the property securing the loan, less the amount of the first lien on the property. Maturities run from five to ten years.
Feldman Financial Advisors, Inc
Investment Portfolio
Home Federal Bancorp
The Company has the authority to invest in various types of securities, including mortgage-backed securities, U.S. Treasury obligations, securities of various federal agencies and of state and municipal governments, certificates of deposit at federally insured banks and savings institutions, certain bankers' acceptances and federal funds. The investment strategy is established by the Board of Directors.
The Company’s investment policy is designed to foster earnings and manage cash flows within prudent interest rate risk and credit risk guidelines. Generally, the investment policy is to invest funds in various categories of securities and maturities based upon liquidity needs, asset/liability management and diversification policies, pledging requirements, investment quality, marketability and performance objectives.
Exhibit II-6 and Table 8 present a summary of the Company’s investment portfolio at the dates indicated.
Feldman Financial Advisors, Inc
Table 8
Securities Portfolio
Home Federal Bancorp
As of June 30, 2005 to 2007 and at December 31, 2007
(Dollars in Thousands)
| | | | | | June 30, | |
| | | December 31, 2007, | | | 2007 | | | 2006 | | | 2005 | |
| | | Amortized | | | Fair | | | Amortized | | | Fair | | | Amortized | | | Fair | | | Amortized | | | Fair | |
| | | Cost | | | Value | | | Cost | | | Value | | | Cost | | | Value | | | Cost | | | Value | |
| Securities Held to Maturity: | | | | | | | | | | | | | | | | | | | | | | | | |
| FHLB Stock | | $ | 779 | | | $ | 779 | | | $ | 779 | | | $ | 779 | | | $ | 649 | | | $ | 649 | | | $ | 632 | | | $ | 632 | |
| Mortgage-backed Securities | | | 552 | | | | 570 | | | | 629 | | | | 643 | | | | 776 | | | | 793 | | | | 981 | | | | 1,024 | |
| Total Securities Held to Maturity | | | 1,331 | | | | 1,349 | | | | 1,408 | | | | 1,422 | | | | 1,425 | | | | 1,442 | | | | 1,613 | | | | 1,656 | |
| | | | | | | | | | | | | | | | | | | | | | | | | | | | | | | | | |
| Securities Available for Sale: | | | | | | | | | | | | | | | | | | | | | | | | | | | | | | | | |
| FHLB and FNMA Notes | | | - | | | | - | | | | - | | | | - | | | | 1,992 | | | | 1,975 | | | | 1,976 | | | | 1,980 | |
| Corporate Securities | | | 2,349 | | | | 2,286 | | | | 2,290 | | | | 2,227 | | | | 2,180 | | | | 2,121 | | | | 2,094 | | | | 2,057 | |
| Mortgage-backed Securities | | | 79,580 | | | | 78,877 | | | | 85,767 | | | | 81,525 | | | | 84,243 | | | | 79,598 | | | | 71,222 | | | | 71,723 | |
| Total Securities Available for Sale | | | 81,929 | | | | 81,163 | | | | 88,057 | | | | 83,752 | | | | 88,415 | | | | 83,694 | | | | 75,292 | | | | 75,760 | |
| | | | | | | | | | | | | | | | | | | | | | | | | | | | | | | | | |
| Total Investment Securities | | $ | 83,260 | | | $ | 82,512 | | | $ | 89,465 | | | $ | 85,174 | | | $ | 89,840 | | | $ | 85,136 | | | $ | 76,905 | | | $ | 77,416 | |
Source: Home Federal Bancorp, preliminary prospectus.
All of the Company’s securities carry market risk insofar as increases in market rates of interest may cause a decrease in their market value. Prior to investing, consideration is given to the interest rate, tax considerations, market volatility, yield, settlement date and maturity of the security, the Company’s liquidity position, and anticipated cash needs and sources. The effect that the proposed security would have on credit and interest rate risk and risk-based capital is also considered.
Statement of Financial Accounting Standards No. 115, “Accounting for Certain Investments in Debt and Equity Securities,” requires that securities be categorized as “held to maturity,” “trading securities” or “available-for-sale,” based on management’s intent as to the ultimate disposition of each security. Statement No. 115 allows debt securities to be classified as “held to maturity” and reported in financial statements at amortized cost only if the reporting entity has the positive intent and ability to hold these securities to maturity. Securities that might be sold in response to changes in market interest rates, changes in the security’s prepayment risk, increases in loan demand, or other similar factors cannot be classified as “held to maturity.”
Feldman Financial Advisors, Inc
The Bank does not currently use or maintain a trading account. Securities not classified as “held to maturity” are classified as “available-for-sale.” These securities are reported at fair value, and unrealized gains and losses on the securities are excluded from earnings and reported, net of deferred taxes, as a separate component of equity.
The Bank does not currently participate in hedging programs, interest rate caps, floors or swaps, or other activities involving the use of off-balance sheet derivative financial instruments, however, they may in the future utilize such instruments if it is believed it would be beneficial for managing interest rate risk. In addition, the Bank does not purchase securities, which are not rated investment grade.
Mortgage-backed securities represent a participation interest in a pool of one- to four-family or multifamily mortgages. The mortgage originators use intermediaries (generally U.S. Government agencies and government-sponsored enterprises) to pool and repackage the participation interests in the form of securities, with investors receiving the principal and interest payments on the mortgages. Such U.S. Government agencies and government-sponsored enterprises guarantee the payment of principal and interest to investors.
Mortgage-backed securities are typically issued with stated principal amounts, and the securities are backed by pools of mortgages that have loans with interest rates that are within a range and have varying maturities. The underlying pool of mortgages, i.e., fixed-rate or adjustable-rate, as well as prepayment risk, is passed on to the certificate holder. The life of a mortgage-backed pass-through security approximates the life of the underlying mortgages.
The Company’s mortgage-backed securities consist of Ginnie Mae securities, Freddie Mac securities and Fannie Mae securities. Ginnie Mae is a government agency within the Department of Housing and Urban Development, which is intended to help finance government-assisted housing programs. Ginnie Mae securities are backed by loans insured by the Federal Housing Administration, or guaranteed by the Veterans Administration. The timely payment of principal and interest on Ginnie Mae securities is guaranteed by Ginnie Mae and backed by the full faith and credit of the U.S. Government. Freddie Mac is a private corporation chartered by the U.S. Government. Freddie Mac issues participation certificates backed principally by conventional mortgage loans. Freddie Mac guarantees the timely payment of interest and the ultimate return of principal on participation certificates. Fannie Mae is a private corporation chartered by the U.S. Congress with a mandate to establish a secondary market for mortgage loans. Fannie Mae guarantees the timely payment of principal and interest on Fannie Mae securities. Freddie Mac and Fannie Mae securities are not backed by the full faith and credit of the U.S. Government, but because Freddie Mac and Fannie Mae are U.S. Government-sponsored enterprises, these securities are considered to be among the highest quality investments with minimal credit risks.
Feldman Financial Advisors, Inc
Mortgage-backed securities generally yield less than the loans, which underlie such securities because of their payment guarantees, or credit enhancements, which offer nominal credit risk. In addition, mortgage-backed securities are more liquid than individual mortgage loans and may be used to collateralize borrowings or other obligations.
Table 9 sets forth the composition of the mortgage-backed securities portfolio at each of the dates indicated. The amounts reflect the fair value of the mortgage-backed securities at the dates indicated.
Feldman Financial Advisors, Inc
Table 9
Securities Portfolio by Contractual Maturity
As of June 30, 2005 to 2007 and at December 31, 2006 and 2007
(Dollars in Thousands)
| | | December 31, 2007, | | | June 30, | |
| | | 2007 | | | 2006 | | | 2007 | | | 2006 | | | 2005 | |
| Fixed Rate: | | | | | | | | | | | | | | | |
| GNMA | | $ | 381 | | | $ | 477 | | | $ | 433 | | | $ | 524 | | | $ | 671 | |
| FHLMC | | $ | 6,692 | | | $ | 7,448 | | | $ | 6,962 | | | $ | 7,604 | | | $ | 8,081 | |
| FNMA | | | 70,115 | | | | 71,338 | | | | 72,293 | | | | 69,194 | | | | 60,037 | |
| Total Fixed Rate | | | 77,188 | | | | 79,263 | | | | 79,688 | | | | 77,322 | | | | 68,789 | |
| | | | | | | | | | | | | | | | | | | | | |
| Adjustable Rate: | | | | | | | | | | | | | | | | | | | | |
| GNMA | | | 220 | | | | 411 | | | | 292 | | | | 504 | | | | 833 | |
| FHLMC | | | 1,396 | | | | 1,598 | | | | 1,492 | | | | 1,731 | | | | 2,069 | |
| FNMA | | | 644 | | | | 736 | | | | 696 | | | | 834 | | | | 1,056 | |
| Total Adjustable Rate | | | 2,260 | | | | 2,745 | | | | 2,480 | | | | 3,069 | | | | 3,958 | |
| | | | | | | | | | | | | | | | | | | | | |
| Total Mortgage-Backed Securities | | $ | 79,448 | | | $ | 82,008 | | | $ | 82,168 | | | $ | 80,391 | | | $ | 72,747 | |
Source: Home Federal Bancorp, preliminary prospectus.
First Louisiana Bancshares
Investment securities consisting primarily of U.S. Government and agency securities, state and municipal securities, mortgage-backed securities and mutual funds, remaining essentially the same at December 31, 2007 and 2006, increasing only $120,000 or 0.7%. Table 10 and Exhibit II-7 present a summary of First Louisiana Bancshares’ investment portfolio at the dates indicated.
Feldman Financial Advisors, Inc
Table 10
Securities Portfolio
First Louisiana Bancshares
As of December 31, 2006 and 2007
(Dollars in Thousands)
| | | December 31, 2007 | |
| | | | | | Gross | | | Gross | | | Estimated | |
| | | Amortized | | | Unrealized | | | Unrealized | | | Fair | |
| | | Cost | | | Gains | | | Losses | | | Value | |
| Securities available-for-sale | | (in thousands) | |
| Debt securities | | | | | | | | | | | | |
| U.S. Government and agency securities | | $ | 6,958 | | | $ | 62 | | | $ | 0 | | | $ | 7,019 | |
| State and municipal securities | | | 2,693 | | | | 40 | | | | 0 | | | | 2,734 | |
| Mortgage-backed securities | | | 2,529 | | | | 10 | | | | 5 | | | | 2,534 | |
| Other debt securities | | | 1,000 | | | | 1 | | | | 0 | | | | 1,001 | |
| Total debt securities | | | 13,180 | | | | 113 | | | | 5 | | | | 13,288 | |
| | | | | | | | | | | | | | | | | |
| Mutual funds | | | 2,195 | | | | 0 | | | | 33 | | | $ | 2,162 | |
| | | | | | | | | | | | | | | | | |
| Total available-for-sale securities | | $ | 15,375 | | | $ | 113 | | | $ | 38 | | | $ | 15,450 | |
| | | December 31, 2006 | |
| | | | | | Gross | | | Gross | | | Estimated | |
| | | Amortized | | | Unrealized | | | Unrealized | | | Fair | |
| | | Cost | | | Gains | | | Losses | | | Value | |
| Securities available-for-sale | | (in thousands) | |
| Debt securities | | | | | | | | | | | | |
| U.S. Government and agency securities | | $ | 7,767 | | | $ | 8 | | | $ | 18 | | | $ | 7,757 | |
| State and municipal securities | | | 3,018 | | | | 8 | | | | 15 | | | | 3,011 | |
| Mortgage-backed securities | | | 3,092 | | | | 3 | | | | 22 | | | | 3,073 | |
| Other debt securities | | | 500 | | | | 1 | | | | 0 | | | | 501 | |
| Total debt securities | | | 14,377 | | | | 20 | | | | 55 | | | | 14,342 | |
| | | | | | | | | | | | | | | | | |
| Mutual funds | | | 1,136 | | | | 0 | | | | 31 | | | $ | 1,105 | |
| | | | | | | | | | | | | | | | | |
| Total available-for-sale securities | | $ | 15,513 | | | $ | 20 | | | $ | 86 | | | $ | 15,447 | |
Source: First Louisiana Bancshares; Preliminary Prospectus
Liability Composition
Home Federal Bancorp
Deposits are the Company’s major external source of funds for lending and other investment purposes. Exhibit II-9 and Table 11 present a summary of the Company’s deposit composition as of June 30, 2005 to June 30, 2007 and at December 31, 2007. Total deposits amounted to $81.0 million or 63.2% of total assets and 82.9% of total liabilities at December 31, 2007. Table 12 shows the average balance of each type of deposit and the average rate paid on each type of deposit for the periods indicated.
Feldman Financial Advisors, Inc
The Company primarily attracts deposits from residents of Louisiana and particularly from Caddo Parish and to a lesser extent from Bossier Parish. Deposit account terms vary, with the principal differences being the minimum balance required, the time periods the funds must remain on deposit and the interest rate. The Company has not solicited deposits from outside Louisiana or paid fees to brokers to solicit funds for deposit.
The Company establishes interest rates paid, maturity terms, service fees and withdrawal penalties on a periodic basis. Management determines the rates and terms based on rates paid by competitors, the need for funds or liquidity, growth goals and federal regulations. The Company attempts to control the flow of deposits by pricing the accounts to remain generally competitive with other financial institutions in the market area. The Company operates two automated teller machines in its two branch offices. The Company also has an internet-based banking system to provide additional customer service.
Table 11
Deposit Portfolio – Home Federal Bancorp
As of June 30, 2005 to 2007 and at December 31, 2007
‘(Dollars in Thousands)
| | | | | | | | | | June 30, | |
| | | | December 31, 2007 | | | 2007 | | | 2006 | | | 2005 | |
| | | | Amount | | | % | | | Amount | | | % | | | Amount | | | % | | | Amount | | | % | |
| Certificate accounts: | | | | | | | | | | | | | | | | | | | | | | | | | |
| 0.00% - 0.99% | | | $ | 9 | | | | 0.01 | | | $ | 9 | | | | 0.01 | | | $ | 245 | | | | 0.34 | | | $ | 250 | | | | 0.36 | |
| 1.00% - 1.99% | | | | 304 | | | | 0.38 | | | | 194 | | | | 0.25 | | | | 411 | | | | 0.58 | | | | 6,543 | | | | 9.35 | |
| 2.00% - 2.99% | | | | 1,651 | | | | 2.04 | | | | 1,543 | | | | 1.99 | | | | 9,911 | | | | 13.90 | | | | 20,564 | | | | 29.38 | |
| 3.00% - 3.99% | | | | 10,741 | | | | 13.26 | | | | 12,164 | | | | 15.65 | | | | 14,902 | | | | 20.91 | | | | 12,922 | | | | 18.46 | |
| 4.00% - 4.99% | | | | 26,992 | | | | 33.33 | | | | 18,388 | | | | 23.66 | | | | 28,230 | | | | 39.60 | | | | 10,493 | | | | 14.99 | |
| 5.00% - 5.99% | | | | 25,765 | | | | 31.81 | | | | 30,705 | | | | 39.51 | | | | 3,282 | | | | 4.60 | | | | 1,941 | | | | 2.77 | |
| 6.00% - 6.99% | | | | -- | | | | -- | | | | -- | | | | -- | | | | -- | | | | -- | | | | 1,796 | | | | 2.57 | |
| Total certificate accounts | | | | 65,462 | | | | 80.83 | | | | 63,003 | | | | 81.07 | | | | 56,981 | | | | 79.94 | | | | 54,509 | | | | 77.88 | |
| | | | | | | | | | | | | | | | | | | | | | | | | | | | | | | | | | |
| Transaction accounts: | | | | | | | | | | | | | | | | | | | | | | | | | | | | | | | | | |
| Savings | | | | 4,431 | | | | 5.47 | | | | 4,473 | | | | 5.76 | | | | 4,756 | | | | 6.67 | | | | 4,917 | | | | 7.02 | |
| NOW | | | | 8,177 | | | | 10.10 | | | | 7,293 | | | | 9.38 | | | | 6,240 | | | | 8.75 | | | | 6,825 | | | | 9.75 | |
| Money market | | | | 2,916 | | | | 3.60 | | | | 2,941 | | | | 3.78 | | | | 3,302 | | | | 4.63 | | | | 3,744 | | | | 5.35 | |
| Total transaction accounts | | | | 15,524 | | | | 19.17 | | | | 14,707 | | | | 18.93 | | | | 14,298 | | | | 20.06 | | | | 15,486 | | | | 22.12 | |
| | | | | | | | | | | | | | | | | | | | | | | | | | | | | | | | | | |
| Total deposits | | | $ | 80,986 | | | | 100.00 | | | $ | 77,710 | | | | 100.00 | | | $ | 71,279 | | | | 100.00 | | | $ | 69,995 | | | | 100.00 | |
Source: Home Federal Bancorp, preliminary prospectus.
Feldman Financial Advisors, Inc
Table 12
Average Deposits and Yields – Home Federal Bancorp
For the Years Ended June 30, 2005 to 2007
and the Six Months Ended December 31, 2006 and 2007
| | | Six Months Ended December 31, | | | Year Ended June 30, |
| | | 2007 | | | 2006 | | | 2007 | | | 2006 | | | 2005 |
| | | Average | | | Interest | | | Average | | | Average | | | Interest | | | Average | | | Average | | | Interest | | | Average | | | Average | | | Interest | | | Average | | | Average | | | Interest | | | Average |
| | | Balance | | | Expense | | | Rate Paid | | | Balance | | | Expense | | | Rate Paid | | | Balance | | | Expense | | | Rate Paid | | | Balance | | | Expense | | | Rate Paid | | | Balance | | | Expense | | | Rate Paid |
| | | | | | | | | | | | | | | | | | | | | | | | | | | | | | | | | | | | | | | | | | | | | | |
| Savings | | $ | 4,425 | | | $ | 11 | | | | 0.50 | % | | $ | 4,753 | | | $ | 12 | | | | 0.50 | % | | $ | 4,630 | | | $ | 23 | | | | 0.49 | % | | $ | 5,009 | | | $ | 24 | | | | 0.48 | % | | $ | 5,368 | | | $ | 27 | | | | 0.50 | % |
| NOW | | | 6,833 | | | | 8 | | | | 0.23 | | | | 6,863 | | | | 8 | | | | 0.23 | | | | 6,893 | | | | 15 | | | | 0.21 | | | | 7,597 | | | | 16 | | | | 0.21 | | | | 6,041 | | | | 13 | | | | 0.22 | |
| Money Market | | | 2,904 | | | | 6 | | | | 0.41 | | | | 3,118 | | | | 6 | | | | 0.39 | | | | 3,030 | | | | 12 | | | | 0.40 | | | | 3,516 | | | | 14 | | | | 0.40 | | | | 4,129 | | | | 17 | | | | 0.41 | |
| Certificates of deposit | | | 64,460 | | | | 1,542 | | | | 4.78 | | | | 58,914 | | | | 1,281 | | | | 4.35 | | | | 60,344 | | | | 2,710 | | | | 4.49 | | | | 56,269 | | | | 2,054 | | | | 3.65 | | | | 53,335 | | | | 1,710 | | | | 3.21 | |
| Total deposits | | $ | 78,622 | | | $ | 1,567 | | | | 3.99 | % | | $ | 73,648 | | | $ | 1,307 | | | | 3.55 | % | | $ | 74,897 | | | $ | 2,760 | | | | 3.68 | % | | $ | 72,391 | | | $ | 2,108 | | | | 2.91 | % | | $ | 68,873 | | | $ | 1,767 | | | | 2.57 | % |
Source: Home Federal Bancorp, preliminary prospectus.
Feldman Financial Advisors, Inc
A large percentage of the Company’s deposits are in certificates of deposit, which totaled $65.5 million or 80.8% of total deposits at December 31, 2007. The inflow of certificates of deposit and the retention of such deposits upon maturity are significantly influenced by general interest rates and money market conditions, making certificates of deposit traditionally a more volatile source of funding than core deposits. Liquidity could be reduced if a significant amount of certificates of deposit maturing within a short period of time were not renewed. To the extent that such deposits do not remain with the Company, they may need to be replaced with borrowings, which could increase the cost of funds and negatively impact the interest rate spread and financial condition. At December 31, 2007, $10.9 million, or 16.7%, of total certificates of deposit were “jumbo” certificates of $100,000 or more.
To supplement deposits as a source of funds for lending or investment, the Company may funds in the form of advances from the Federal Home Loan Bank Dallas upon the security of the common stock owned in that bank and certain of the Company’s residential mortgage loans and mortgage-backed and other investment securities, provided certain standards related to creditworthiness have been met. These advances are made pursuant to several credit programs, each of which has its own interest rate and range of maturities. Federal Home Loan Bank advances are generally available to meet seasonal and other withdrawals of deposit accounts and to permit increased lending.
As of December 31, 2007, the Company was permitted to borrow up to an aggregate total of $82.0 million from the Federal Home Loan Bank of Dallas. The Company had $15.9 million of Federal Home Loan Bank advances outstanding at December 31, 2007.
Table 13 sets forth certain information regarding FHLB borrowings at the end of and during the period indicated.
Feldman Financial Advisors, Inc
Table 13
Borrowings – Home Federal Bancorp
At or for the Year Ended June 30, 2005 to 2007
And the Six Months Ended December 31, 2006 and 2007
‘(Dollars in Thousands)
| | | At or for the Six | | | At or for the Year | |
| | | Months Ended | | | Ended June 30, | |
| | | December 31, 2007 | | | 2007 | | | 2006 | | | 2005 | |
| FHLB Advances: | | | | | | | | | | | | |
| Average balance outstanding | | $ | 16,146 | | | $ | 14,883 | | | $ | 9,320 | | | $ | 8,471 | |
| Maximum amount outstanding | | | 17,194 | | | | 16,695 | | | | 13,665 | | | | 9,541 | |
| Balance outstanding at end of period | | | 15,933 | | | | 12,368 | | | | 13,417 | | | | 8,224 | |
| Average interest rate during the period | | | 4.28 | % | | | 4.63 | % | | | 3.49 | % | | | 3.10 | % |
| Weighted average interest rate at the end of the period | | | 4.99 | % | | | 4.68 | % | | | 4.34 | % | | | 3.24 | % |
Source: Home Federal Bancorp, preliminary prospectus.
At December 31, 2007, $5.4 million of the outstanding borrowings were short-term (maturities of one year or less). Such short-term borrowings had a weighted average interest rate of 4.89% at December 31, 2007.
First Louisiana Bancshares
First Louisiana Bank’s retail banking activity emphasizes consumer deposits and checking accounts. An extensive range of those services is offered by the bank to meet the varied needs of its customers Table 14 and Exhibit II-10 details First Louisiana Bancshares’ deposit portfolio.
Feldman Financial Advisors, Inc
Table 14
Deposit Portfolio – First Louisiana Bancshares
As of December 31, 2006 to 2007
‘(Dollars in Thousands)
| | | December 31, | |
| | | 2007 | | | 2006 | |
| | | Amount | | | % | | | Amount | | | % | |
| Transaction accounts: | | | |
| Non-interest-bearing demand | | $ | 24,320 | | | | 26.20 | % | | $ | 23,528 | | | | 27.14 | % |
| Interest-bearing demand | | | 22,939 | | | | 24.72 | | | | 25,450 | | | | 29.36 | |
| Savings | | | 7,266 | | | | 7.83 | | | | 7,264 | | | | 8.38 | |
| Total | | | 54,525 | | | | 58.75 | | | | 56,242 | | | | 64.88 | |
| Certificate accounts | | | 38,286 | | | | 41.25 | | | | 30,440 | | | | 35.12 | |
| Total Deposits | | $ | 92,811 | | | | 100.00 | % | | $ | 86,682 | | | | 100.00 | % |
Source: First Louisiana Bancshares, preliminary prospectus.
If First Louisiana Bancshares requires funds beyond its ability to generate them internally, First Louisiana Bancshares has borrowing agreements with the Federal Home Loan Bank of Dallas, which provide an additional source of funds. At December 31, 2007, First Louisiana Bancshares had $12.5 million in advances from the Federal Home Loan Bank of Dallas and had $9.6 million in additional borrowing capacity. First Louisiana Bancshares also had access to additional sources of liquidity through an unsecured federal funds purchased line of credit for $4.9 million and a secured line of credit for $1.5 million. First Louisiana Bancshares has pledged the stock of First Louisiana Bank with respect to the secured line of credit. At December 31, 2007, no amounts were advanced under either line of credit.
First Louisiana Bancshares also owns 100% of the common stock of First Louisiana Statutory Trust I, a Delaware statutory trust that was organized in 2006 for the purpose of issuing trust preferred securities. On September 21, 2006, Trust I issued $4.0 million of floating rate trust preferred securities due in 2036, with a liquidation amount of $1,000 per security and with an option to redeem the securities in whole or in part beginning after the fifth anniversary. Distributions payable on each capital security are payable at an annual rate equal to the three-month LIBOR plus 1.80%. The capital securities of Trust I are fully and unconditionally guaranteed by First Louisiana Bancshares. In connection with the issuance of the trust preferred securities, First Louisiana Bancshares issued $1.1 million of floating rate junior subordinated deferrable interest debentures to Trust I due in 2036. The terms of the debentures, which comprise substantially all of the assets of Trust I, are the same as the terms of the capital securities issued by Trust I.
Feldman Financial Advisors, Inc
Equity Capital
Home Federal Bancorp
The Company had equity capital of $30.4 million or 23.77% of total assets as of December 31, 2007. Since June 30, 2003, the Company’s equity to assets ratio has increased from 19.00% at June 30, 2003 to its current level as of December 31, 2007. The Company currently pays a quarterly dividend equal to $0.06 per share.
At December 31, 2007, the Bank exceeded all regulatory capital requirements and is “well capitalized” by regulatory standards. At December 31, 2007, Home Federal Savings and Loan exceeded all of its regulatory capital requirements, with tangible, core and risk-based capital ratios of 21.82%, 21.82% and 79.67%, respectively.
First Louisiana Bancshares
As of December 31, 2007, First Louisiana Bancshares had total equity of $11.2 million, or 9.12% of total assets. In order to be adequately capitalized for regulatory reporting purposes, First Louisiana Bank is required to maintain regulatory capital sufficient to meet total capital to risk weighted assets, Tier 1 capital to risk weighted assets and Tier 1 capital to average assets of at least 8.0%, 4.0% and 4.0%, respectively. At December 31, 2007, First Louisiana Bank exceeded each of its capital requirements with ratios of 13.72%, 12.86% and 10.88%, respectively.
Feldman Financial Advisors, Inc
Income and Expense Trends
Home Federal Bancorp
Table 15 displays the main components of the Company’s earnings performance over the years ended June 30, 2003 to 2007 and the six-month periods ended December 31, 2006 and 2007. Table 16 sets forth certain average balance and yield information relating to the Company at and for the periods indicated. The average yields and costs are derived by dividing income or expense by the daily average balance of assets or liabilities, respectively, for the periods presented. Table 17 reflects the sensitivity of the Company’s interest income and interest expense to changes in volume and in prevailing interest rates during the periods indicated.
Table 15
Summary Income Statement Data – Home Federal Bancorp
For the Years Ended June 30, 2003 to 2007
And the Six Months Ended December 31, 2006 and 2007
(Dollars in Thousands)
| | | As of or For the | | | | | | | | | | | | | | | | |
| | | Six Months Ended | | | | | | | | | | | | | | | | |
| | | December 31, | | | As of or For the Year Ended June 30, | |
| | | 2007 | | | 2006 | | | 2007 | | | 2006 | | | 2005 | | | 2004 | | | 2003 | |
| | | (unaudited) | | | | | | | | | | | | | | | | |
| Total interest income | | $ | 3,506 | | | $ | 3,210 | | | $ | 6,590 | | | $ | 5,664 | | | $ | 5,064 | | | $ | 5,154 | | | $ | 6,115 | |
| Total interest expense | | | 1,967 | | | | 1,634 | | | | 3,448 | | | | 2,433 | | | | 2,030 | | | | 2,163 | | | | 2,710 | |
| Net interest income | | | 1,539 | | | | 1,576 | | | | 3,142 | | | | 3,231 | | | | 3,034 | | | | 2,991 | | | | 3,405 | |
| Provision for loan losses | | | 0 | | | | 0 | | | | 1 | | | | 0 | | | | 0 | | | | 0 | | | | (474 | ) |
| Net interest income after provision for loan losses | | | 1,539 | | | | 1,576 | | | | 3,141 | | | | 3,231 | | | | 3,034 | | | | 2,991 | | | | 3,879 | |
| Total non-interest income | | | 120 | | | | 151 | | | | 240 | | | | 144 | | | | 387 | | | | 321 | | | | 216 | |
| Total non-interest expense | | | 1,262 | | | | 1,224 | | | | 2,417 | | | | 2,414 | | | | 2,119 | | | | 2,080 | | | | 2,596 | |
| Income before income taxes | | | 397 | | | | 503 | | | | 964 | | | | 961 | | | | 1,302 | | | | 1,232 | | | | 1,499 | |
| Income taxes | | | 134 | | | | 171 | | | | 327 | | | | 327 | | | | 452 | | | | 411 | | | | 490 | |
| Net income | | $ | 263 | | | $ | 332 | | | $ | 637 | | | $ | 634 | | | $ | 850 | | | $ | 821 | | | $ | 1,009 | |
Source: Home Federal Bancorp, preliminary prospectus
Feldman Financial Advisors, Inc.
Table 16
Average Balances and Yields – Home Federal Bancorp
For the Six Months Ended December 31, 2006 and 2007
(Dollars in Thousands)
| | | | | | Six Months Ended December 31, | |
| | | | | | 2007 | | | 2006 | |
| | | Yield/Rate | | | Average Balance | | | | | | Average Yield/Rate | | | Average Balance | | | | | | Average Yield/Rate | |
| | | at December 31, 2007 | | | | | Interest | | | | | | | Interest | | | |
| Interest-earning assets: | | | | | | | | | | | | | | | | | | | | | |
| Investment securities | | | 5.21 | % | | $ | 88,577 | | | $ | 2,375 | | | | 5.36 | % | | $ | 87,154 | | | $ | 2,285 | | | | 5.24 | % |
| Loans receivable | | | 6.81 | | | | 28,407 | | | | 1,045 | | | | 7.36 | | | | 21,860 | | | | 801 | | | | 7.33 | |
| Interest-earning deposits | | | 3.84 | | | | 3,789 | | | | 86 | | | | 4.54 | | | | 5,301 | | | | 124 | | | | 4.68 | |
| Total interest-earning assets | | | 5.54 | % | | | 120,773 | | | | 3,506 | | | | 5.81 | % | | | 114,315 | | | | 3,210 | | | | 5.62 | % |
| Non-interest-earning assets | | | | | | | 3,789 | | | | | | | | | | | | 5,541 | | | | | | | | | |
| Total assets | | | | | | $ | 124,562 | | | | | | | | | | | $ | 119,856 | | | | | | | | | |
| | | | | | | | | | | | | | | | | | | | | | | | | | | | | |
| Interest-bearing liabilities: | | | | | | | | | | | | | | | | | | | | | | | | | | | | |
| Savings accounts | | | 0.50 | % | | $ | 4,425 | | | | 11 | | | | 0.50 | % | | $ | 4,753 | | | | 12 | | | | 0.50 | % |
| NOW accounts | | | 0.16 | | | | 6,833 | | | | 8 | | | | 0.23 | | | | 6,863 | | | | 8 | | | | 0.23 | |
| Money market accouts | | | 0.40 | | | | 2,904 | | | | 6 | | | | 0.41 | | | | 3,118 | | | | 6 | | | | 0.39 | |
| Certificate accounts | | | 4.73 | | | | 64,460 | | | | 1,542 | | | | 4.78 | | | | 58,914 | | | | 1,281 | | | | 4.35 | |
| Total deposits | | | 3.77 | | | $ | 78,622 | | | | 1,567 | | | | 3.99 | | | $ | 73,648 | | | | 1,307 | | | | 3.55 | |
| FHLB advances | | | 4.99 | | | | 16,146 | | | | 400 | | | | 4.95 | | | | 14,896 | | | | 327 | | | | 4.39 | |
| Total interest-bearing liabilities | | | 3.97 | % | | | 94,768 | | | $ | 1,967 | | | | 4.15 | % | | | 88,544 | | | $ | 1,634 | | | | 3.69 | % |
| Non-interest-earning liabilities | | | | | | | 1,059 | | | | | | | | | | | | 896 | | | | | | | | | |
| Total liabilities | | | | | | | 95,827 | | | | | | | | | | | | 89,440 | | | | | | | | | |
| Total stockholders' equity | | | | | | | 31,511 | | | | | | | | | | | | 30,416 | | | | | | | | | |
| Total liabilities and equity | | | | | | $ | 127,338 | | | | | | | | | | | $ | 119,856 | | | | | | | | | |
| Net interest-earning assets | | | | | | $ | 26,005 | | | | | | | | | | | $ | 25,771 | | | | | | | | | |
| Net interest income; average interest rate spread | | | | | | | | | | $ | 1,539 | | | | 1.66 | % | | | | | | $ | 1,576 | | | | 1.93 | % |
| Net interest margin | | | | | | | | | | | | | | | 2.55 | % | | | | | | | | | | | 2.76 | % |
| Average interest-earning assets to average interest-bearing liabilities | | | | | | | | | | | | | | | 127.44 | % | | | | | | | | | | | 129.11 | % |
Source: Home Federal Bancorp, preliminary prospectus
Feldman Financial Advisors, Inc.
Table 17
Average Balances and Yields – Home Federal Bancorp
For the Years Ended June 30, 2005 to 2007
(Dollars in Thousands)
| | | Year Ended June 30, | |
| | | 2007 | | | 2006 | | | 2005 | |
| | | Average | | | | | | Average | | | Average | | | | | | Average | | | Average | | | | | | Average | |
| | | Balance | | | Interest | | | Yield/Rate | | | Balance | | | Interest | | | Yield/Rate | | | Balance | | | Interest | | | Yield/Rate | |
| Interest-earning assets: | | | | | | | | | | | | | | | | | | | | | | | | | | | |
| Investment securities | | $ | 86,552 | | | $ | 4,550 | | | | 5.26 | % | | $ | 80,734 | | | $ | 4,039 | | | | 5.00 | % | | $ | 71,088 | | | $ | 3,358 | | | | 4.72 | % |
| Loans receivable | | | 23,680 | | | | 1,739 | | | | 7.34 | | | | 20,141 | | | | 1,420 | | | | 7.04 | | | | 22,973 | | | | 1,568 | | | | 6.83 | |
| Interest-earning deposits | | | 5,633 | | | | 301 | | | | 5.35 | | | | 4,936 | | | | 205 | | | | 4.15 | | | | 5,406 | | | | 137 | | | | 2.54 | |
| Total interest-earning assets | | | 115,865 | | | | 6,590 | | | | 5.69 | % | | | 105,811 | | | | 5,664 | | | | 5.35 | % | | | 99,467 | | | | 5,063 | | | | 5.09 | % |
| Non-interest-earning assets | | | 4,875 | | | | | | | | | | | | 6,774 | | | | | | | | | | | | 5,323 | | | | | | | | | |
| Total assets | | $ | 120,740 | | | | | | | | | | | $ | 112,585 | | | | | | | | | | | $ | 104,790 | | | | | | | | | |
| | | | | | | | | | | | | | | | | | | | | | | | | | | | | | | | | | | | | |
| Interest-bearing liabilities: | | | | | | | | | | | | | | | | | | | | | | | | | | | | | | | | | | | | |
| Savings accounts | | $ | 4,630 | | | | 23 | | | | 0.49 | % | | $ | 5,009 | | | | 24 | | | | 0.48 | % | | $ | 5,368 | | | | 27 | | | | 0.50 | % |
| NOW accounts | | | 6,983 | | | | 15 | | | | 0.21 | | | | 7,597 | | | | 16 | | | | 0.21 | | | | 6,041 | | | | 13 | | | | 0.22 | |
| Money market accouts | | | 3,030 | | | | 12 | | | | 0.40 | | | | 3,516 | | | | 14 | | | | 0.40 | | | | 4,129 | | | | 17 | | | | 0.41 | |
| Certificate accounts | | | 60,344 | | | | 2,710 | | | | 4.49 | | | | 56,269 | | | | 2,054 | | | | 3.65 | | | | 53,335 | | | | 1,710 | | | | 3.21 | |
| Total deposits | | $ | 74,987 | | | | 2,760 | | | | 3.68 | | | $ | 72,391 | | | | 2,108 | | | | 2.91 | | | $ | 68,873 | | | | 1,767 | | | | 2.57 | |
| FHLB advances | | | 14,883 | | | | 688 | | | | 4.63 | | | | 9,320 | | | | 325 | | | | 3.49 | | | | 8,471 | | | | 262 | | | | 3.10 | |
| Total interest-bearing liabilities | | | 89,870 | | | $ | 3,448 | | | | 3.84 | % | | | 81,711 | | | $ | 2,433 | | | | 2.98 | % | | | 77,344 | | | $ | 2,029 | | | | 2.62 | % |
| Non-interest-earning liabilities | | | 899 | | | | | | | | | | | | 688 | | | | | | | | | | | | 649 | | | | | | | | | |
| Total liabilities | | | 90,769 | | | | | | | | | | | | 82,399 | | | | | | | | | | | | 77,993 | | | | | | | | | |
| Total stockholders' equity | | | 29,971 | | | | | | | | | | | | 30,186 | | | | | | | | | | | | 26,797 | | | | | | | | | |
| Total liabilities and equity | | $ | 120,740 | | | | | | | | | | | $ | 112,585 | | | | | | | | | | | $ | 104,790 | | | | | | | | | |
| Net interest-earning assets | | $ | 25,995 | | | | | | | | | | | $ | 24,100 | | | | | | | | | | | $ | 22,123 | | | | | | | | | |
| Net interest income; average interest rate spread | | | | | | $ | 3,142 | | | | 1.85 | % | | | | | | $ | 3,231 | | | | 2.37 | % | | | | | | $ | 3,034 | | | | 2.47 | % |
| Net interest margin | | | | | | | | | | | 2.71 | % | | | | | | | | | | | 3.05 | % | | | | | | | | | | | 3.05 | % |
| Average interest-earning assets to average interest-bearing liabilities | | | | | | | | | | | 128.93 | % | | | | | | | | | | | 129.49 | % | | | | | | | | | | | 128.60 | % |
Feldman Financial Advisors, Inc.
Table 18 describes the extent to which changes in interest rates and changes in volume of interest-related assets and liabilities have affected Home Federal Bancorp's interest income and interest expense during the periods indicated. For each category of interest-earning assets and interest-bearing liabilities, information is provided on changes attributable to (1) changes in volume (change in volume multiplied by prior year rate), (2) changes in rate (change in rate multiplied by current year volume), and (3) total change in rate and volume. The combined effect of changes in both rate and volume has been allocated proportionately to the change due to rate and the change due to volume.
Table 18
Rate/Volume Analysis – Home Federal Bancorp
| | | Six Months Ended December 31, | | | Year Ended June 30, | |
| | | 2007 vs 2006 | | | 2007 vs 2006 | | | 2006 vs 2005 | |
| | | Increase (Decrease) | | | Total | | | Increase (Decrease) | | | Total | | | Increase (Decrease) | | | Total | |
| | | Due to | | | Increase | | | Due to | | | Increase | | | Due to | | | Increase | |
| | | Rate | | | Volume | | | (Decrease) | | | Rate | | | Volume | | | (Decrease) | | | Rate | | | Volume | | | (Decrease) | |
| Interest income: | | | | | | | | | | | | | | | | | | | | | | | | | | | |
| Investment securities | | $ | 53 | | | $ | 37 | | | $ | 90 | | | $ | 220 | | | $ | 291 | | | $ | 511 | | | $ | 225 | | | $ | 455 | | | $ | 680 | |
| Loans receivable, net | | | 4 | | | | 240 | | | | 244 | | | | 69 | | | | 250 | | | | 319 | | | | 44 | | | | (192 | ) | | | (148 | ) |
| Interest-earning deposits | | | (3 | ) | | | (35 | ) | | | (38 | ) | | | 67 | | | | 29 | | | | 96 | | | | 79 | | | | (11 | ) | | | 68 | |
| Total interest-earning assets | | | 54 | | | | 242 | | | | 296 | | | | 356 | | | | 570 | | | | 926 | | | | 348 | | | | 252 | | | | 600 | |
| | | | | | | | | | | | | | | | | | | | | | | | | | | | | | | | | | | | | |
| Interest expense: | | | | | | | | | | | | | | | | | | | | | | | | | | | | | | | | | | | | |
| Savings accouts | | | -- | | | | (1 | ) | | | (1 | ) | | | 1 | | | | (2 | ) | | | (1 | ) | | | (1 | ) | | | (2 | ) | | | (3 | ) |
| NOW accounts | | | -- | | | | -- | | | | 0 | | | | -- | | | | (1 | ) | | | (1 | ) | | | -- | | | | 3 | | | | 3 | |
| Money market accounts | | | -- | | | | -- | | | | 0 | | | | -- | | | | (2 | ) | | | (2 | ) | | | -- | | | | (3 | ) | | | (3 | ) |
| Certificate accounts | | | 140 | | | | 121 | | | | 261 | | | | 507 | | | | 149 | | | | 656 | | | | 248 | | | | 95 | | | | 343 | |
| Total deposits | | | 140 | | | | 120 | | | | 260 | | | | 508 | | | | 144 | | | | 652 | | | | 247 | | | | 93 | | | | 340 | |
| FHLB advances | | | 46 | | | | 27 | | | | 73 | | | | 169 | | | | 194 | | | | 363 | | | | 37 | | | | 26 | | | | 63 | |
| Total interest-bearing liabilities | | | 186 | | | | 147 | | | | 333 | | | | 677 | | | | 338 | | | | 1,015 | | | | 284 | | | | 119 | | | | 403 | |
| (decrease) Increase in net interest income | | $ | (132 | ) | | $ | 95 | | | $ | (37 | ) | | $ | (321 | ) | | $ | 232 | | | $ | (89 | ) | | $ | 64 | | | $ | 133 | | | $ | 197 | |
Source: Home Federal Bancorp, preliminary prospectus.
As noted in the previous tables, the Company’s nominal earnings have been declining over the past few years. Earnings have been negatively impacted by a declining net interest spread. The Company’s net interest spread has declined from 2.80% for the year ended June 30, 2003 to 1.85% for the year ended June 30, 2007. The Company reported a net interest spread of 1.66% for the six months ended December 31, 2007 compared to 1.93% for the six months ended December 31, 2006. Earnings have also been impacted by an increasing efficiency ratio, which has increased from 63.39% for the year ended June 30, 2003 to 71.49% for the year ended June 30, 2007.
Feldman Financial Advisors, Inc.
Comparison of Operating Results for the Six Months Ended December 31, 2007 and December 31, 2006
Net Income. For the six-months ended December 31, 2007, net income amounted to $263,000, compared to $332,000 for the same period in 2007, a decrease of $69,000, or 20.8%. The decrease was primarily due to decreases in net interest income and non-interest income, and an increase in non-interest expense. These were partially offset by a decrease in income tax expense.
Net Interest Income. Net interest income for the six months ended December 31, 2007, was $1.5 million, a decrease of $38,000, or 2.4%, in comparison to the six months ended December 31, 2006. This decrease was due primarily to the increase in interest expense incurred on deposit accounts and advances from the Federal Home Loan Bank, partially offset by an increase in total interest income.
The average interest rate spread was 1.66% for the six months ended December 31, 2007, compared to 1.93% for the six months ended December 31, 2006. The net interest margin was 2.55% for the six months ended December 31, 2007, compared to 2.76% for the six months ended December 31, 2006. The decrease in net interest income and net interest margin is attributable primarily to the increase in interest expense on interest-bearing liabilities and average cost associated with deposits and advances from the Federal Home Loan Bank. The average rate paid on interest-bearing liabilities was 4.15% for the six months ended December 31, 2007 compared to 3.69% for the six months ended December 31, 2006, an increase of 46 basis points. The average yield on interest-earning assets was 5.81% for the six months ended December 31, 2007 compared to 5.62% for the six months ended December 31, 2006, an increase of 19 basis points.
Feldman Financial Advisors, Inc.
Interest expense increased $333,000, or 20.4%, to $2.0 million for the six months ended December 31, 2007 compared to the six months ended December 31, 2006, primarily as a result of an increase in the average rate paid and average balance of certificate accounts and an increase in average Federal Home Loan Bank borrowings and the average cost of such borrowings.
Provision for Losses on Loans. Based on an analysis of historical experience, the volume and type of lending conducted by Home Federal Savings and Loan, the status of past due principal and interest payments, general economic conditions, particularly as such conditions relate to Home Federal Bancorp's market area and other factors related to the collectibility of Home Federal's loan portfolio, no provisions for loan losses were made during the six months ended December 31, 2007 or 2006. Home Federal Savings and Loan's allowance for loan losses was $235,000, or 0.81% of total loans, at December 31, 2007 compared to $235,000, or 1.01% of total loans at December 31, 2006. At December 31, 2007, Home Federal had non-performing loans of $19,000 and other non-performing assets of $33,000. Home Federal did not have any non-performing loans at December 31, 2006. There can be no assurance that the loan loss allowance will be sufficient to cover losses on non-performing assets in the future.
Non-interest Income. Total non-interest income amounted to $120,000 for the six months ended December 31, 2007, compared to $151,000 for the same period in 2006. The decrease was primarily due to decreases in gain on sale of securities and other income.
Non-interest Expense. Total non-interest expense increased $37,000, or 3.0%, for the six months ended December 31, 2007 compared to the prior year period. The increase was primarily due to an increase of $37,000, or 4.9%, in compensation and benefits expense, and an increase in audit and professional fees of $8,000, offset by a decrease in occupancy and equipment expense of $8,000.
Feldman Financial Advisors, Inc.
The increase in compensation and benefits expenses was a result of normal compensation increases including increased recognition and retention plan expense due to the acceleration of vesting of awards during the six-month period following the death of a participant. Compensation expense recognized for the Company Stock Option and Recognition and Retention Plans amounted to $32,446 and $86,375, respectively, for the six months ended December 31, 2007.
Effective January 1, 2006, the Company, through its subsidiary Home Federal Savings and Loan Association, became subject to the Louisiana bank shares tax. This tax is assessed on the Association's equity and earnings. For the six months ended December 31, 2007, the Company recognized franchise and bank shares tax expense of $72,600.
Provision for Income Tax Expense. Income taxes amounted to $134,000 and $171,000 for the six months ended December 31, 2007 and 2006, respectively, resulting in an effective tax rate of 33.7% and 34.0%, respectively.
Comparison of Operating Results for the Years Ended June 30, 2007 and 2006
Net Income. Net income amounted to $637,000 for the year ended June 30, 2007, an increase of $3,000 compared to net income of $634,000 for the year ended June 30, 2006. This increase was due to an increase in noninterest income, partially offset by a decrease in net interest income and an increase in non-interest expense.
Net Interest Income. Net interest income amounted to $3.1 million for fiscal year 2007 compared to $3.2 million for fiscal year 2006.
Feldman Financial Advisors, Inc.
The average interest rate spread declined from 2.37% for fiscal 2006 to 1.85% for fiscal 2007 while the average balances of net interest-earning assets increased from $24.1 million to $26.0 million during the same periods. The percentage of average interest-earning assets to average interest-bearing liabilities decreased to 128.93% for fiscal 2007 compared to 129.49% for fiscal 2006. The decrease in the average interest rate spread reflects the low interest rate environment and management's decision to temporarily invest in lower rate securities available for sale rather than long-term, fixed rate residential mortgage loans. Additionally, Home Federal Bancorp's average cost of funds increased 114 basis points in fiscal 2007 compared to fiscal 2006 as the Federal Reserve was aggressively raising short-term rates. Competition for deposits in our market area led us to increase the average rates paid on certificates of deposit 84 basis points in fiscal 2007 compared to fiscal 2006. Net interest margin declined to 2.71% in fiscal 2007 compared to 3.05% for fiscal 2006.
Interest income increased $926,000, or 16.3%, to $6.6 million for fiscal 2007 compared to fiscal 2006. This increase was primarily due to an increase in the average yield on all interest earning assets and an increase in the average balance of all interest earning assets. The increase in average yields on interest earning assets reflects rising interest rates in general during fiscal 2007. The increase in the average balance of investment securities was due to the redeployment of proceeds from payment and prepayment of loans, largely as a result of refinancing and loan sales, and the investment of such funds in investment securities classified as available-for-sale. The increase in the average balance of loans receivable was primarily due to the purchase of mortgage loans originated by a third party mortgage company. Our agreement with the mortgage company provides that they will retain servicing and are required to repurchase such loans as long as they are outstanding if they are not performing according to their terms.
Feldman Financial Advisors, Inc.
Interest expense increased $1.0 million, or 41.8%, to $3.4 million for fiscal 2007 compared to fiscal 2006 primarily as a result of an increase in the average rate paid and average balance of certificate accounts and an increase in average Federal Home Loan Bank borrowings and the average cost of such borrowings.
Provision for Loan Losses. The allowance for loan losses is established through a provision for loan losses charged to earnings as losses are estimated to have occurred in our loan portfolio. Loan losses are charged against the allowance when management believes the uncollectibility of a loan balance is confirmed. Subsequent recoveries, if any, are credited to the allowance.
The allowance for loan losses is evaluated on a regular basis by management and is based upon management's periodic review of the collectibility of the loans in light of historical experience, the nature and volume of the loan portfolio, adverse situations that may affect the borrower's ability to repay, estimated value of the underlying collateral and prevailing economic conditions. The evaluation is inherently subjective as it requires estimates that are susceptible to significant revision as more information becomes available.
A loan is considered impaired when, based on current information or events, it is probable that we will be unable to collect the scheduled payments of principal and interest when due according to the contractual terms of the loan agreement. When a loan is impaired, the measurement of such impairment is based upon the fair value of the collateral of the loan. If the fair value of the collateral is less than the recorded investment in the loan, we will recognize the impairment by creating a valuation allowance with a corresponding charge against earnings.
An allowance is also established for uncollectible interest on loans classified as substandard. Substandard loans are those loans that are in excess of ninety days delinquent. The allowance is established by a charge to interest income equal to all interest previously accrued and income is subsequently recognized only to the extent that cash payments are received. When, in management's judgment, the borrower's ability to make interest and principal payments is back to normal, the loan is returned to accrual status.
Feldman Financial Advisors, Inc.
A minimal provision was made to the allowance in fiscal 2007. No provision was made to the allowance in fiscal 2006 because the allowance was maintained at a level believed, to the best of management's knowledge, to cover all known and inherent losses in the loan portfolio, both probable and reasonable.
Non-Interest Income. Non-interest income amounted to $240,000 for the year ended June 30, 2007, an increase of $95,000, or 65.5%, compared to non-interest income of $145,000 for the year ended June 30, 2006. Such increase was due to a $116,000 increase in gain on sale of securities, partially offset by a $21,000 decrease in gain on sale of loans. The decrease in gain on sale of loans was due to a decrease in originations of long-term, fixed rate residential loans for sale.
Non-Interest Expense. Non-interest expense remained stable at $2.4 million for fiscal 2007 and 2006.
Provision For Income Tax Expense. The provision for income taxes amounted to $327,000 for both the fiscal years ended June 30, 2007 and 2006. Home Federal Bancorp's effective tax rate was 33.9% for both fiscal 2007 and 2006.
First Louisiana Bancshares
Table 19 sets forth certain average balance and yield information relating to First Louisiana Bancshares at and for the periods indicated. The average yields and costs are derived by dividing income or expense by the daily average balance of assets or liabilities, respectively, for the periods presented. Table 20 reflects the sensitivity of the First Louisiana Bancshares’ interest income and interest expense to changes in volume and in prevailing interest rates during the periods indicated.
Feldman Financial Advisors, Inc.
Table 19
Average Balances and Yields – First Louisiana Bancshares
For the Years Ended June 30, 2006 to 2007
(Dollars in Thousands)
| | | | | | Year Ended December 31, | |
| | | | | | 2007 | | | 2006 | |
| | | Yield/Rate | | | Average | | | | | | Average | | | Average | | | | | | Average | |
| | | at December 31, 2007 | | | Balance | | | Interest | | | Yield/Rate | | | Balance | | | Interest | | | Yield/Rate | |
| Interest-earning assets: | | | | | | | | | | | | | | | | | | | | | |
| Loans receivable | | | 8.40 | % | | $ | 84,232 | | | $ | 7,554 | | | | 8.97 | % | | $ | 77,259 | | | $ | 6,777 | | | | 8.77 | % |
| Investment securities | | | 4.70 | | | | 19,731 | | | | 871 | | | | 4.11 | | | | 19,571 | | | | 800 | | | | 4.09 | |
| Interest-earning deposits | | | 2.66 | | | | 115 | | | | 5 | | | | 4.35 | | | | 288 | | | | 10 | | | | 3.47 | |
| Total interest-earning assets | | | 7.47 | % | | | 104,078 | | | | 8,430 | | | | 8.10 | % | | | 97,118 | | | | 7,587 | | | | 7.81 | % |
| Non-interest-earning assets | | | | | | | 12,981 | | | | | | | | | | | | 13,086 | | | | | | | | | |
| Total assets | | | | | | $ | 117,059 | | | | | | | | | | | $ | 110,204 | | | | | | | | | |
| | | | | | | | | | | | | | | | | | | | | | | | | | | | | |
| Interest-bearing liabilities: | | | | | | | | | | | | | | | | | | | | | | | | | | | | |
| Interest-bearing demand accounts | | | 2.32 | % | | $ | 22,595 | | | | 503 | | | | 2.23 | % | | $ | 22,398 | | | | 411 | | | | 1.83 | % |
| Savings accounts | | | 1.75 | | | | 7,204 | | | | 126 | | | | 1.75 | | | | 8,529 | | | | 129 | | | | 1.51 | |
| Certificate accounts | | | 4.58 | | | | 35,571 | | | | 1,582 | | | | 4.45 | | | | 29,220 | | | | 1,109 | | | | 3.80 | |
| Total interest-bearing deposits | | | 3.50 | | | $ | 65,370 | | | | 2,211 | | | | 3.38 | | | $ | 60,147 | | | | 1,649 | | | | 2.74 | |
| Federal funds purchased | | | 4.50 | | | | 228 | | | | 13 | | | | 5.70 | | | | 134 | | | | 9 | | | | 6.72 | |
| FHLB advances | | | 4.50 | | | | 12,579 | | | | 548 | | | | 4.36 | | | | 10,087 | | | | 339 | | | | 3.36 | |
| Securities sold under agreement to repurchase | | | 2.84 | | | | 735 | | | | 27 | | | | 3.67 | | | | 1,054 | | | | 37 | | | | 3.51 | |
| Other borrowings | | | | | | | | | | | | | | | | | | | 1,738 | | | | 137 | | | | 7.88 | |
| Subordinated debt | | | 6.79 | | | | 4,124 | | | | 302 | | | | 7.32 | | | | 1,173 | | | | 83 | | | | 7.16 | |
| Total interest-bearing liabilities | | | 3.82 | % | | | 83,036 | | | | 3,101 | | | | 3.73 | % | | | 74,333 | | | | 2,254 | | | | 3.03 | % |
| Non-interest-earning liabilities | | | | | | | 23,125 | | | | | | | | | | | | 25,996 | | | | | | | | | |
| Total liabilities | | | | | | | 106,161 | | | | | | | | | | | | 100,329 | | | | | | | | | |
| Total stockholders' equity | | | | | | | 10,898 | | | | | | | | | | | | 9,875 | | | | | | | | | |
| Total liabilities and equity | | | | | | $ | 117,059 | | | | | | | | | | | $ | 110,204 | | | | | | | | | |
| Net interest-earning assets | | | | | | $ | 21,042 | | | | | | | | | | | $ | 22,785 | | | | | | | | | |
| Net interest income; average interest rate spread | | | | | | | | | | $ | 5,329 | | | | 4.37 | % | | | | | | $ | 5,333 | | | | 4.78 | % |
| Net interest margin | | | | | | | | | | | | | | | 5.12 | % | | | | | | | | | | | 5.49 | % |
| Average interest-earning assets to average interest-bearing liabilities | | | | | | | | | | | | | | | 125.34 | % | | | | | | | | | | | 130.65 | % |
Source: First Louisiana Bancshares; preliminary prospectus
Table 20 describes the extent to which changes in interest rates and changes in volume of interest-related assets and liabilities have affected First Louisiana Bancshares’ interest income and interest expense during the periods indicated. For each category of interest-earning assets and interest-bearing liabilities, information is provided on changes attributable to (1) changes in volume (change in volume multiplied by prior year rate), (2) changes in rate (change in rate multiplied by current year volume), and (3) total change in rate and volume. The combined effect of changes in both rate and volume has been allocated proportionately to the change due to rate and the change due to volume.
Feldman Financial Advisors, Inc.
Table 20
Rate/Volume Analysis – First Louisiana Bancshares
| | | Year Ended December 31, | |
| | | 2007 vs 2006 | |
| | | Increase (Decrease) | | | Total | |
| | | Due to | | | Increase | |
| | | Rate | | | Volume | | | (Decrease) | |
| Interest income: | | | | | | | | | |
| Loans receivable, net | | $ | 165 | | | $ | 612 | | | $ | 777 | |
| Investment securities | | | 64 | | | | 7 | | | | 71 | |
| Interest-earning deposits | | | 1 | | | | (6 | ) | | | (5 | ) |
| Total interest-earning assets | | | 231 | | | | 612 | | | | 843 | |
| | | | | | | | | | | | | |
| Interest expense: | | | | | | | | | | | | |
| Interest-bearing demand accounts | | | 88 | | | | 4 | | | | 92 | |
| Savings accouts | | | 17 | | | | (20 | ) | | | (3 | ) |
| Certificate accounts | | | 232 | | | | 241 | | | | 473 | |
| Total interest-bearing deposits | | | 337 | | | | 225 | | | | 562 | |
| Fed funds purchased | | | (2 | ) | | | 6 | | | | 4 | |
| FHLB advances | | | 125 | | | | 84 | | | | 209 | |
| Securities sold under agreement to repurchase | | | 1 | | | | (11 | ) | | | (10 | ) |
| Other borrowings | | | 0 | | | | (137 | ) | | | (137 | ) |
| Subordinated debentures | | | 7 | | | | 211 | | | | 218 | |
| Total interest-bearing liabilities | | | 468 | | | | 378 | | | | 846 | |
| (Decrease) Increase in net interest income | | $ | (237 | ) | | $ | 234 | | | $ | (3 | ) |
Source: First Louisiana Bancshares, preliminary prospectus.
Comparison of Operating Results for the Year Ended December 31, 2007 and December 31, 2006
Net income. For the year ended December 31, 2007, net income amounted to $818,000, compared to $1.1 million for the year ended December 31, 2006, a decrease of $240,000, or 22.7%. The decrease was primarily attributable to a decrease in non-interest income from 2006, which was partially offset in 2007 by decreases in provisions for loans losses and income tax expense.
Feldman Financial Advisors, Inc.
Net Interest Income. Net interest income of $5.3 million was relatively unchanged for the year ended December 31, 2007 compared to the year ended December 31, 2006. Interest income increased $843,000, or 11.1%, which was offset by a corresponding increase in interest expense of $847,000, or 37.6%, for fiscal 2007 compared to fiscal 2006.
First Louisiana Bancshares’s average interest rate spread was 4.37% for the year ended December 31, 2007 compared to 4.78% for the year ended December 31, 2006. First Louisiana Bancshares’ net interest margin was 5.12% for the year ended December 31, 2007 compared to 5.49% for the year ended December 31, 2006. The decreases in the average interest rate spread and net interest margin are attributable primarily to the increase in interest expense on interest-bearing liabilities and average cost associated with deposits and advances from the Federal Home Loan Bank. The average rate paid on interest-bearing liabilities increased 70 basis points from 3.03% for the year ended December 31, 2006 to 3.73% for the year ended December 31, 2007 while the average yield earned on interest-earning assets only increased 29 basis points from 7.81% for the year ended December 31, 2006 to 8.10% for the year ended December 31, 2007.
Provision for Losses on Loans. Based on an analysis of historical experience, the volume and type of lending conducted by First Louisiana Bank, the status of past due principal and interest payments, general economic conditions, particularly as such conditions relate to First Louisiana Bank’s market area and other factors related to the collectibility of First Louisiana Bank’s loan portfolio. First Louisiana Bank made a provision for loan losses of $703,000 during the year ended December 31, 2007, compared to $983,000 for the year ended December 31, 2006. First Louisiana Bank’s allowance for loan losses was $891,000, or 1.04% of total loans, at December 31, 2007 compared to $1.1 million, or 1.32%, of total loans at December 31, 2006.
Feldman Financial Advisors, Inc.
Non-interest Income. Total non-interest income amounted to $1.1 million for the year ended December 31, 2007, compared to $1.6 million for the year ended December 31, 2006, a decrease of $471,000 or 29.9%. The decrease was primarily due to the sale of vacant land by First Louisiana Bank in fiscal 2006 for a gain of $356,000.
Non-interest Expense. Total non-interest expense increased $241,000, or 5.5%, for the year ended December 31, 2007 compared to the prior year. The increase was primarily due to an increase of $225,000, or 10.4%, in salaries and personnel expense. The increase in salaries and personnel expenses was a result of a combination of items, including normal compensation increases, an increase in number of First Louisiana Bank employees, and increases in cost of employee health benefits. Professional services and fees increased by $38,000 or 7.7%. The increase was primarily due to a $30,000 increase in FDIC insurance assessments. Capital stock taxes increased by $27,000 or 14.3%, which was due to the increase in equity.
Provision for Income Tax Expense. Income taxes amounted to $291,000 and $488,000 for the years ended December 31, 2007 and 2006, respectively, resulting in effective tax rates of 26.2% and 31.6%, respectively.
Pro Forma Income Statement Impact of Acquisition of First Louisiana Bancshares
The pro forma income statement impact of the First Louisiana acquisition is shown in Table 21 for the six months ending December 31, 2007 and Table 22 for the twelve-month period ended June 30, 2007. This analysis does not take into consideration the proceeds from the Conversion.
Feldman Financial Advisors, Inc.
Table 21
Pro Forma Income Statement
For the Six Months Ended December 31, 2007
| | | | | | | | | | | | Home | |
| | | Home | | | First | | | | | | Federal | |
| | | Federal | | | Louisiana | | | Merger | | | Bancorp | |
| | | Bancorp | | | Bancshares | | | Adjust- | | | Pro Forma | |
| | | Historical | | | Historical | | | ments(1) | | | Consolidated | |
| | | | | | | | | | | | | |
| Interest income | | $ | 3,506 | | | $ | 4,377 | | | $ | - | | | $ | 7,883 | |
| Interest expense | | | (1,967 | ) | | | (1,696 | ) | | | 15 | | | | (3,649 | ) |
| Net interest income | | | 1,539 | | | | 2,681 | | | | 15 | | | | 4,235 | |
| Provision for loan losses | | | - | | | | (368 | ) | | | - | | | | (368 | ) |
| Net interest income after provision for loan losses | | | 1,539 | | | | 2,313 | | | | 15 | | | | 3,867 | |
| Noninterest income | | | 120 | | | | 556 | | | | - | | | | 676 | |
| Noninterest expense | | | (1,262 | ) | | | (2,402 | ) | | | (153 | ) | | | (3,817 | ) |
| Income before income taxes | | | 397 | | | | 467 | | | | 15 | | | | 763 | |
| Income tax expense | | | (134 | ) | | | (140 | ) | | | 34 | | | | (240 | ) |
| Net income | | $ | 263 | | | $ | 327 | | | $ | (67 | ) | | $ | 523 | |
Source: Home Federal Bancorp; First Louisiana Bancshares; preliminary prospectus.
Table 22
Pro Forma Income Statement
For the Twelve Months Ended June 30, 2007
| | | | | | | | | | | | Home | |
| | | Home | | | First | | | | | | Federal | |
| | | Federal | | | Louisiana | | | Merger | | | Bancorp | |
| | | Bancorp | | | Bancshares | | | Adjust- | | | Pro Forma | |
| | | Historical | | | Historical | | | ments(1) | | | Consolidated | |
| | | | | | | | | | | | | |
| Interest income | | $ | 6,590 | | | $ | 7,948 | | | $ | 139 | | | $ | 14,677 | |
| Interest expense | | | (3,448 | ) | | | (2,667 | ) | | | (35 | ) | | | (6,150 | ) |
| Net interest income | | | 3,142 | | | | 5,281 | | | | 103 | | | | 8,526 | |
| Provision for loan losses | | | (1 | ) | | | (1,001 | ) | | | - | | | | (1,002 | ) |
| Net interest income after provision for loan losses | | | 3,141 | | | | 4,280 | | | | 103 | | | | 7,524 | |
| Noninterest income | | | 240 | | | | 1,509 | | | | - | | | | 1,749 | |
| Noninterest expense | | | (2,417 | ) | | | (4,414 | ) | | | (306 | ) | | | (7,137 | ) |
| Income before income taxes | | | 964 | | | | 1,375 | | | | (202 | ) | | | 2,137 | |
| Income tax expense | | | (327 | ) | | | (330 | ) | | | 69 | | | | (588 | ) |
| Net income | | $ | 637 | | | $ | 1,045 | | | $ | (133 | ) | | $ | 1,549 | |
Source: Home Federal Bancorp; First Louisiana Bancshares; preliminary prospectus.
Feldman Financial Advisors, Inc.
Interest Rate Risk Management
Because the majority of the Company’s assets and liabilities are sensitive to changes in interest rates, a significant form of market risk for the Company is interest rate risk, or changes in interest rates.
Home Federal Bancorp's ability to maintain net interest income depends upon the ability to earn a higher yield on interest-earning assets than the rates paid on deposits and borrowings. Home Federal Bancorp's interest-earning assets consist primarily of securities available-for-sale and long-term residential mortgage loans, which have fixed rates of interest. Consequently, the ability to maintain a positive spread between the interest earned on assets and the interest paid on deposits and borrowings can be adversely affected when market rates of interest rise.
Although long-term, fixed-rate mortgage loans made up a significant portion of the loan portfolio at December 31, 2007, the Company sold a substantial amount of these loans and maintained a significant portfolio of securities available-for-sale during the past few years in order to better position Home Federal Bancorp for a rising rate environment. At December 31, 2007 and 2006, securities available-for-sale amounted to $81.2 million and $83.8 million, respectively, or 63.4% and 70.5%, respectively, of total assets at such dates. Although this asset/liability management strategy has adversely impacted short-term net income, it provides greater flexibility to reinvest such assets in higher-yielding single-family, consumer and commercial business loans in a rising interest rate environment.
Home Federal Bancorp’s fixed-rate loans generally are profitable if interest rates are stable or declining since these loans have yields that exceed the cost of funds. If interest rates increase, however, the Company would have to pay more on deposits and new borrowings, which would adversely affect the interest rate spread. In order to counter the potential effects of dramatic increases in market rates of interest, the Company has underwritten mortgage loans to allow for their sale in the secondary market. Total loan originations amounted to $10.5 million and $7.5 million for six months ended December 31, 2007 and 2006, respectively, while loans sold amounted to $9.4 million and $4.8 million during the same respective periods.
Feldman Financial Advisors, Inc.
More significantly, Home Federal Bancorp has invested excess funds from loan payments and prepayments and loan sales in investment securities classified as available for sale. As a result, Home Federal Bancorp is not as susceptible to rising interest rates as it would be if its interest-earning assets were primarily comprised of long-term fixed rate mortgage loans.
With respect to its floating or adjustable rate loans, Home Federal Bancorp writes interest rate floors and caps into such loan documents. Interest rate floors limit our interest rate risk by limiting potential decreases in the interest yield on an adjustable rate loan to a certain level. As a result, the Company receives a minimum yield even if rates decline farther and the interest rate on the particular loan would otherwise adjust to a lower amount. Conversely, interest rate ceilings limit the amount by which the yield on an adjustable rate loan may increase to no more than six percentage points over the rate at the time of origination. Finally, Home Federal Bancorp intends to place a greater emphasis on shorter-term consumer loans and commercial business loans in the future.
The Office of Thrift Supervision provides a quarterly report on the potential impact of interest rate changes upon the market value of portfolio equity. Management reviews the quarterly reports from the Office of Thrift Supervision, which show the impact of changing interest rates on net portfolio value. Net portfolio value is the difference between incoming and outgoing discounted cash flows from assets, liabilities, and off-balance sheet contracts.
Feldman Financial Advisors, Inc.
Interest rate sensitivity is monitored by management through the use of a model that internally generates estimates of the change in the net portfolio value ("NPV") over a range of interest rate scenarios. NPV is the present value of expected cash flows from assets, liabilities, and off-balance sheet contracts. The NPV ratio, under any interest rate scenario, is defined as the NPV in that scenario divided by the market value of assets in the same scenario.
Table 23 presents the Bank’s net portfolio value as of December 31, 2007. The net portfolio values shown in this table was calculated by the Office of Thrift Supervision, based on information provided by the Bank.
As shown in Table 23, a rising interest rate scenario of 100 basis points would have a negative effect on the Company’s NPV. Under this scenario, NPV would decrease by $2.6 million or by 9.06% with a resulting NPV ratio of 20.30% of assets. In the event of a 200 basis point increase in interest rates, NPV would experience a 19% decrease with a resulting NPV ratio of 18.67%. A downward movement in market rates by 100 basis points would result in a positive impact on NPV of 6.26% as the Company’s NPV ratio measures 22.43% under this declining rate scenario.
Table 23
Interest Rate Risk Analysis – Home Federal Bancorp
Net Portfolio Value
| | | | | | | | | | | | | NPV as % of | |
| Change in Rates | | | Net Portfolio Value | | | PV of Assets | |
| | (bp) | | | Amount | | | $ Change | | | % Change | | | NPV Ratio | | | Change | |
| | | | | (Dollars in Thousands) | | | | | | | | | |
| | 300 | | | $ | 19,908 | | | $ | (8,321 | ) | | | (29.48 | ) % | | | 16.87 | % | | | (4.77 | ) % |
| | 200 | | | | 22,824 | | | | (5,403 | ) | | | (19.14 | ) | | | 18.67 | | | | (2.97 | ) |
| | 100 | | | | 25,669 | | | | (2,558 | ) | | | (9.06 | ) | | | 20.30 | | | | (1.34 | ) |
| | 0 | | | | 28,227 | | | | -- | | | | -- | | | | 21.64 | | | | -- | |
| | (100) | | | | 29,995 | | | | 1,768 | | | | 6.26 | | | | 22.43 | | | | 0.79 | |
| | (200) | | | | 30,635 | | | | 2,408 | | | | 8.53 | | | | 22.53 | | | | 0.89 | |
Source: Home Federal Bancorp, preliminary prospectus.
Feldman Financial Advisors, Inc.
Asset Quality
Home Federal Bancorp
Table 24 provides information regarding the Company’s non-performing assets (defined as non-accruing loans, accruing loans 90 days or more past due and real estate owned). Tables 19 and 20 detail the Company’s allowance for loan loss reserves and the allocation of the reserve among loan types for the periods ending June 30, 2003 to 2007 an at December 31, 2007.
At December 31, 2007, the allowance for loan losses totaled $235,000, non-performing loans (“NPLs”) totaled $19,000 million, and the ratio of allowance for loan losses to loans outstanding was 0.84%. The Company’s overall asset quality has remained excellent over the recent years. As of December 31, 2007, NPLs measured 0.07% of total loans and 0.04% of total assets.
Loans are placed on non-accrual status when management believes the probability of collection of interest is doubtful. When a loan is placed on non-accrual status, previously accrued but unpaid interest is deducted from interest income. The Company generally discontinues the accrual of interest income when the loan becomes 90 days past due as to principal or interest unless the credit is well secured and believes it will fully collect.
Real estate and other assets acquired as a result of foreclosure or by deed-in-lieu of foreclosure are classified as real estate owned until sold. The Company did not have any real estate owned at December 31, 2007 or 2006.
Feldman Financial Advisors, Inc.
Table 24
Non-performing Asset Summary – Home Federal Bancorp
As of June 30, 2003 to June 30, 2007, and at December 31, 2007
(Dollars in Thousands)
| | | December 31, | | | June 30, | |
| | | 2007 | | | 2007 | | | 2006 | | | 2005 | | | 2004 | | | 2003 | |
| Non-accruing loans: | | | | | | | | | | | | | | | | | | |
| One- to four-family residential | | $ | 19 | | | $ | 116 | | | $ | 0 | | | $ | 0 | | | $ | 0 | | | $ | 0 | |
| Other mortgage | | | -- | | | | -- | | | | -- | | | | -- | | | | -- | | | | -- | |
| Consumer | | | -- | | | | -- | | | | -- | | | | -- | | | | -- | | | | -- | |
| Total non-accruing loans | | $ | 19 | | | $ | 116 | | | $ | 0 | | | $ | 0 | | | $ | 0 | | | $ | 0 | |
| | | | | | | | | | | | | | | | | | | | | | | | | |
| Accruing loans more than 90 days of more past due: | | | | | | | | | | | | | | | | | | | | | | | | |
| One - to four-family residential | | $ | 0 | | | $ | 0 | | | $ | 1 | | | $ | 0 | | | $ | 0 | | | $ | 70 | |
| Other mortgage | | | -- | | | | -- | | | | -- | | | | -- | | | | -- | | | | -- | |
| Consumer | | | -- | | | | -- | | | | -- | | | | -- | | | | -- | | | | -- | |
| Total accruing loans more than 90 days of more past due | | | -- | | | | -- | | | | 1 | | | | -- | | | | -- | | | | 70 | |
| Total non-performing loans | | $ | 19 | | | $ | 0 | | | $ | 1 | | | $ | 0 | | | $ | 0 | | | $ | 70 | |
| Real estate owned, net | | | 33 | | | | 0 | | | | 0 | | | | 0 | | | | 0 | | | | 0 | |
| Total non-performing assets | | $ | 52 | | | $ | 0 | | | $ | 1 | | | $ | 0 | | | $ | 0 | | | $ | 70 | |
| | | | | | | | | | | | | | | | | | | | | | | | | |
| Total non-performing loans as a percent of loans, net | | | 0.07 | % | | | 0.46 | % | | NM % | | | | - | % | | | - | % | | | 0.22 | % |
| Total non-performing assets as a percent of total assets | | | 0.04 | % | | | 0.10 | % | | NM % | | | | - | % | | | - | % | | | 0.07 | % |
Source: Home Federal Bancorp; preliminary prospectus.
Federal regulations require that each insured savings institution classify its assets on a regular basis. In addition, in connection with examinations of insured institutions, federal examiners have authority to identify problem assets and, if appropriate, classify them. There are three classifications for problem assets: "substandard," "doubtful" and "loss.” Substandard assets have one or more defined weaknesses and are characterized by the distinct possibility that the insured institution will sustain some loss if the deficiencies are not corrected. Doubtful assets have the weaknesses of substandard assets with the additional characteristic that the weaknesses make collection or liquidation in full on the basis of currently existing facts, conditions and values questionable, and there is a higher possibility of loss. An asset classified loss is considered uncollectible and of such little value that continuance as an asset of the institution is not warranted. Another category designated "special mention" also must be established and maintained for assets which do not currently expose an insured institution to a sufficient degree of risk to warrant classification as substandard, doubtful or loss. Assets classified as substandard or doubtful require the institution to establish general allowances for loan losses. If an asset or portion thereof is classified as loss, the insured institution must either establish specific allowances for loan losses in the amount of 100% of the portion of the asset classified loss, or charge-off such amount. General loss allowances established to cover possible losses related to assets classified substandard or doubtful may be included in determining an institution's regulatory capital, while specific valuation allowances for loan losses do not qualify as regulatory capital. Federal examiners may disagree with an insured institution's classifications and amounts reserved. Assets classified as substandard at December 31, 2007 amounted to $19,000.
Feldman Financial Advisors, Inc.
At December 31, 2007, the allowance for loan losses amounted to $235,000. The allowance for loan losses is maintained at a level believed, to the best of knowledge, to cover all known and inherent losses in the portfolio both probable and reasonable to estimate at each reporting date. The level of allowance for loan losses is based on a periodic review of the collectibility of the loans in light of historical experience, the nature and volume of the loan portfolio, adverse situations that may affect the borrower's ability to repay, estimated value of any underlying collateral and prevailing conditions.
Table 25 shows changes in the allowance for loan losses during the periods presented. The Company did not have any charge-offs or recoveries during the six months ended December 31, 2007 and 2006 and fiscal 2006, 2005, 2004 and 2003. During fiscal year 2007, one consumer loan with a balance of $1,000 was charged off directly to the provision for bad debt expense.
Feldman Financial Advisors, Inc.
Table 25
Allowance for Loan Losses Summary – Home Federal Bancorp
As of June 30, 2003 to June 30, 2007, and at December 31, 2007
(Dollars in Thousands)
| | | Six Months Ended | | | | | | | | | | | | | | | | |
| | | December 31, | | | At or For the Year Ended June 30, | |
| | | 2007 | | | 2006 | | | 2007 | | | 2006 | | | 2005 | | | 2004 | | | 2003 | |
| | | | | | | | | | | | | | | | | | | | | | |
| Total loans outstanding at end of period | | $ | 28,113 | | | $ | 23,140 | | | $ | 25,540 | | | $ | 21,202 | | | $ | 23,960 | | | $ | 23,122 | | | $ | 34,447 | |
| Average loans outstanding | | | 28,407 | | | | 21,860 | | | | 23,680 | | | | 20,141 | | | | 22,973 | | | | 27,277 | | | | 43,912 | |
| | | | | | | | | | | | | | | | | | | | | | | | | | | | | |
| Allowance for loan losses, beginning of period | | | 235 | | | | 235 | | | | 235 | | | | 235 | | | | 235 | | | | 235 | | | | 709 | |
| Provision for losses | | | -- | | | | -- | | | | 1 | | | | -- | | | | -- | | | | -- | | | | (474 | ) |
| Charge-offs | | | -- | | | | -- | | | | (1 | ) | | | -- | | | | -- | | | | -- | | | | -- | |
| Allowance for loan losses, end of period | | | 235 | | | | 235 | | | | 235 | | | | 235 | | | | 235 | | | | 235 | | | | 235 | |
| | | | | | | | | | | | | | | | | | | | | | | | | | | | | |
| Allowance for loan losses as a percent of non-performing loans | | NM | % | | | 164.33 | % | | | 202.59 | % | | NM | % | | | -- | % | | NM | % | | | 335.71 | % |
| Allowance for loan losses as a percent of loans outstanding | | | 0.84 | % | | | 1.02 | % | | | 0.92 | % | | | 1.11 | % | | | 0.98 | % | | | 1.02 | % | | | 0.68 | % |
Source: Home Federal Bancorp; preliminary prospectus.
Table 26 shows how the allowance for loan losses is allocated by type of loan at each of the dates indicated.
Feldman Financial Advisors, Inc.
Table 26
Allocation of Allowance for Loan Losses – Home Federal Bancorp
As of June 30, 2003 to June 30, 2007, and at December 31, 2007
(Dollars in Thousands)
| | | | | | | | | June 30, |
| | | December 31, 2007 | | | 2007 | | | 2006 | | | 2005 | | | 2004 | | | 2003 |
| | | | | | Loan | | | | | | Loan | | | | | | Loan | | | | | | Loan | | | | | | Loan | | | | | | Loan |
| | | | | | Category | | | | | | Category | | | | | | Category | | | | | | Category | | | | | | Category | | | | | | Category |
| | | Amount | | | as a % | | | Amount | | | as a % | | | Amount | | | as a % | | | Amount | | | as a % | | | Amount | | | as a % | | | Amount | | | as a % |
| | | of | | | of Total | | | of | | | of Total | | | of | | | of Total | | | of | | | of Total | | | of | | | of Total | | | of | | | of Total |
| | | Allowance | | | Loans | | | Allowance | | | Loans | | | Allowance | | | Loans | | | Allowance | | | Loans | | | Allowance | | | Loans | | | Allowance | | | Loans |
| | | | | | | | | | | | | | | | | | | | | | | | | | | | | | | | | | | | | |
| One- to four-family residential | | $ | 235 | | | | 67.64 | % | | $ | 235 | | | | 65.27 | % | | $ | 235 | | | | 64.72 | % | | $ | 235 | | | | 80.79 | % | | $ | 235 | | | | 90.78 | % | | $ | 235 | | | | 95.58 | % |
| Other mortgage | | | -- | | | | 12.87 | | | | -- | | | | 14.29 | | | | -- | | | | 14.92 | | | | -- | | | | 3.5 | | | | -- | | | | 0.44 | | | | -- | | | | 0.36 | |
| Consumer | | | -- | | | | 19.49 | | | | -- | | | | 20.44 | | | | -- | | | | 20.36 | | | | -- | | | | 15.71 | | | | -- | | | | 8.78 | | | | -- | | | | 6.06 | |
| Total | | $ | 235 | | | | 100.00 | % | | $ | 235 | | | | 100.00 | % | | $ | 235 | | | | 100.00 | % | | $ | 235 | | | | 100.00 | % | | $ | 235 | | | | 100.00 | % | | $ | 235 | | | | 102.00 | % |
Source: Home Federal Bancorp, preliminary prospectus.
Feldman Financial Advisors, Inc.
First Louisiana Bancshares
At December 31, 2007, First Louisiana Bancshares had non-performing loans of $318,000, which amounted to 0.37% of net loans. At such date, it also had $2.3 million of other real estate owned, resulting in total non-performing assets of $2.6 million or 2.13% of total assets. Other real estate owned consists of five commercial properties and two residential properties.
Table 27 shows the amounts of First Louisiana Bancshares’s non-performing assets (defined as non-accruing loans, accruing loans 90 days or more past due and real estate owned) at the dates indicated. Troubled debt restructurings totaled $1.7 million at December 31, 2007 and $2.2 million at December 31, 2006. Assets classified as substandard at December 31, 2007 amounted to $589,000.
Table 27
Non-performing Asset Summary – First Louisiana Bancshares
As of December 31, 2006 and 2007
(Dollars in Thousands)
| | | December 31, | |
| | | 2007 | | | 2006 | |
| | | | |
| Non-accruing loans: | | | | | | |
| Commercial real estate | | $ | 159 | | | $ | 1,915 | |
| Residential real estate | | | 0 | | | | 0 | |
| Commercial and industrial | | | 149 | | | | 200 | |
| Consumer | | | 10 | | | | 28 | |
| Total non-accruing loans | | | 318 | | | | 2,143 | |
| | | | | | | | | |
| Accruing loans 90 days or more past due: | | | | | | | | |
| Commercial real estate | | | 0 | | | | 0 | |
| Residential real estate | | | 0 | | | | 0 | |
| Commercial and industrial | | | 0 | | | | 0 | |
| Consumer | | ___0 | | | ____0 | |
| Total accruing loans 90 days or more past due | | | 0 | | | | 0 | |
| Total non-performing loans(1) | | | 318 | | | | 2,143 | |
| Real estate owned, net | | | 2,302 | | | | 1,123 | |
| Other Repossessed Assets | | | 0 | | | | 46 | |
| Total non-performing assets | | $ | 2,620 | | | $ | 3,312 | |
| Total non-performing loans as a percent of loans, net | | | 0.37 | % | | | 2.67 | % |
| Total non-performing assets as a percent of total assets | | | 2.13 | % | | | 2.90 | % |
Source: First Louisiana Bancshares; preliminary prospectus.
Feldman Financial Advisors, Inc.
At December 31, 2007, the allowance for loan losses amounted to $891,000. The allowance for loan losses is maintained at a level believed, to the best of management’s knowledge, to cover all known and inherent losses in the portfolio both probable and reasonable to estimate at each reporting date. The level of allowance for loan losses is based on a periodic review of the collectibility of the loans in light of historical experience, the nature and volume of the loan portfolio, adverse situations that may affect the borrower’s ability to repay, estimated value of any underlying collateral and prevailing conditions. First Louisiana Bank is primarily engaged in lending to small and mid-sized businesses and professionals. Management considers the deficiencies of all classified loans in determining the amount of allowance for loan losses required at each reporting date. Management analyzes the probability of the correction of the substandard loans' weaknesses and the extent of any known or inherent losses that might be sustained on them. Table 28 shows changes in the allowance for loan losses during the periods presented.
Table 28
Allowance for Loan Losses Summary – First Louisiana Bancshares
As of December 31, 2006 and 2007
(Dollars in Thousands)
| | | At or For the Year Ended | |
| | | December 31, | |
| | | 2007 | | | 2006 | |
| | | | |
| Total loans outstanding at end of period | | $ | 85,442 | | | $ | 80,221 | |
| Average loans outstanding | | | | | | | | |
| | | | | | | | | |
| Allowance for loan losses, beginning of period | | | 1,058 | | | | 1,047 | |
| Provision for loan losses | | | 703 | | | | 983 | |
| Charge-offs | | | (960 | ) | | | (1,047 | ) |
| Recoveries | | | 91 | | | | 75 | |
| Allowance for loan losses, end of period | | $ | 891 | | | $ | 1,058 | |
| | | | | | | | | |
| Allowance for loan losses as a percent of non-performing loans | | | 280.19 | % | | | 49.37 | % |
| Allowance for loan losses as a percent of loans outstanding | | | 1.04 | % | | | 1.32 | % |
Source: First Louisiana Bancshares; preliminary prospectus.
Feldman Financial Advisors, Inc.
Market Area
The Company is headquartered in Shreveport, Louisiana, and operates three retail banking offices in the city. Shreveport is the largest city in the Parish of Caddo and the third largest city in the state of Louisiana. The Bank’s principal lending and savings market area covers the parishes of Caddo and Bossier. The Bank’s market can be described as stable to slightly expanding in regards to the local economy.
The primary business of the Bank of attracting deposits and making loans is primarily conducted within its market area. A downturn in the local economy could reduce the amount of funds available for deposit and the ability of borrowers to repay their loans.
The Company operates in a market area with a high concentration of banking and financial institutions, and faces substantial competition in attracting deposits and in originating loans. A number of competitors are significantly larger institutions with greater financial and managerial resources and lending limits. The Company’s ability to compete successfully is a significant factor affecting growth potential and profitability.
Table 29 displays selected demographic data for the United States, the state of Louisiana, the parishes of Caddo and Bossier and the city of Shreveport. Table 30 displays employment data by industry for the Shreveport-Bossier City MSA and Table 31 details the fifteen largest public and private employers in the parishes of Caddo and Bossier.
As detailed in Table 31, the local economy is primarily dependent upon three sectors: the military through Barksdale Air Force base, health care and gaming. The market is also home to a General Motors assembly plant.
Feldman Financial Advisors, Inc.
Demographic data for the parishes of Caddo and the city of Shreveport generally follow the comparable demographic data for Louisiana, which is generally lower than the figures for the United States, while the data for the Bossier Parish is generally higher that data for the state of Louisiana, but still behind figures for the United States. The median household income for Caddo Parish was estimated at $35,251 and $33,964 for the city of Shreveport in 2007, trailing the state median household income level of $37,186 and the median household income level of $53,154 for the United States. In comparison, the median household income for Bossier Parish was $44,596 for 2007.
Feldman Financial Advisors, Inc.
| Table 29 |
| Selected Demographic Data |
| United States, State of Louisiana, Caddo Parish, Bossier Parish, City of Shreveport |
| | | United | | | State of | | | Caddo | | | Bossier | | | City of | |
| | | States | | | Louisiana | | | Parish | | | Parish | | | Shreveport | |
| | | | | | | | | | | | | | | | |
| Total Population | | | | | | | | | | | | | | | |
| 2007 - Current | | | 306,438,230 | | | | 4,385,281 | | | | 257,726 | | | | 110,186 | | | | 200,925 | |
| % Change 2000-07 | | | 8.9 | % | | | -1.9 | % | | | 2.0 | % | | | 12.1 | % | | | 0.4 | % |
| % Change 2007-12 | | | 6.3 | % | | | 3.8 | % | | | 1.6 | % | | | 7.9 | % | | | 0.8 | % |
| | | | | | | | | | | | | | | | | | | | | |
| Age Distribution, 2007 | | | | | | | | | | | | | | | | | | | | |
| 0 - 14 Age Group | | | 21.4 | % | | | 20.9 | % | | | 20.2 | % | | | 21.6 | % | | | 20.6 | % |
| 15 -34 Age Group | | | 28.1 | % | | | 28.5 | % | | | 28.3 | % | | | 28.3 | % | | | 29.0 | % |
| 35 -54 Age Group | | | 29.4 | % | | | 28.3 | % | | | 27.0 | % | | | 29.0 | % | | | 26.3 | % |
| 55+ Age Group | | | 21.1 | % | | | 22.3 | % | | | 24.5 | % | | | 21.2 | % | | | 24.1 | % |
| Median Age (years) | | | 36.7 | | | | 35.5 | | | | 36.3 | | | | 35.1 | | | | 35.3 | |
| | | | | | | | | | | | | | | | | | | | | |
| Total Households | | | | | | | | | | | | | | | | | | | | |
| 2007 - Current | | | 115,337,039 | | | | 1,645,507 | | | | 101,081 | | | | 42,107 | | | | 79,860 | |
| % Change 2000-07 | | | 9.3 | % | | | -0.6 | % | | | 3.2 | % | | | 15.0 | % | | | 1.5 | % |
| % Change 2007-12 | | | 6.5 | % | | | 4.6 | % | | | 2.2 | % | | | 9.0 | % | | | 1.5 | % |
| | | | | | | | | | | | | | | | | | | | | |
| Median Household Net Worth | | $ | 105,518 | | | $ | 48,473 | | | $ | 51,809 | | | $ | 61,278 | | | $ | 48,221 | |
| | | | | | | | | | | | | | | | | | | | | |
| Average Household Income | | | | | | | | | | | | | | | | | | | | |
| 2007 - Current | | $ | 73,126 | | | $ | 51,812 | | | $ | 51,812 | | | $ | 56,261 | | | $ | 50,380 | |
| % Change 2000-07 | | | 29.1 | % | | | 15.6 | % | | | 14.7 | % | | | 17.7 | % | | | 13.3 | % |
| % Change 2007-12 | | | 21.3 | % | | | 12.6 | % | | | 11.4 | % | | | 13.4 | % | | | 11.0 | % |
| | | | | | | | | | | | | | | | | | | | | |
| Median Household Income | | | | | | | | | | | | | | | | | | | | |
| 2007 - Current | | $ | 53,154 | | | $ | 37,186 | | | $ | 35,251 | | | $ | 44,596 | | | $ | 33,964 | |
| % Change 2000-07 | | | 26.1 | % | | | 13.3 | % | | | 11.6 | % | | | 13.8 | % | | | 11.2 | % |
| % Change 2007-12 | | | 17.6 | % | | | 9.7 | % | | | 8.4 | % | | | 9.2 | % | | | 8.5 | % |
| | | | | | | | | | | | | | | | | | | | | |
| Per Capita Income | | | | | | | | | | | | | | | | | | | | |
| 2007 - Current | | $ | 27,916 | | | $ | 19,796 | | | $ | 20,659 | | | $ | 21,735 | | | $ | 20,339 | |
| % Change 2000-07 | | | 29.3 | % | | | 17.1 | % | | | 15.8 | % | | | 20.0 | % | | | 14.5 | % |
| % Change 2007-12 | | | 21.3 | % | | | 13.3 | % | | | 12.0 | % | | | 14.4 | % | | | 11.7 | % |
Source: SNL Financial and ESRI.
Feldman Financial Advisors, Inc.
Table 30
Employment by Industry for the Shreveport-Bossier City MSA
As of 2005
| | | Shreveport- | | | | |
| | | Bossier City | | | | |
| Industry | | MSA | | | U.S. | |
| | | | | | | |
| | | | | | | |
| Services | | | 40.8 | % | | | 40.4 | % |
| Government | | | 19.8 | | | | 16.7 | |
| Trade, Transportation and Utilities | | | 19.3 | | | | 19.8 | |
| Manufacturing | | | 8.2 | | | | 10.9 | |
| Finance, Insurance and Real Estate | | | 4.4 | | | | 6.3 | |
| Construction | | | 5.5 | | | | 5.5 | |
| Mining | | | 2.0 | | | | 0.4 | |
| Total | | | 100.0 | % | | | 100.0 | % |
Source: Louisiana and U.S. Department of Labor
Table 31
Largest Employers in Caddo and Bossier Parishes
| | | | Type of | | Number of | | |
| Rank | | Employer | Business | | Employees | | Parish |
| | | | | | | | |
| | | | | | | | |
| | 1 | | Barksdale Air Force Base | Military | | | 9,423 | | Bossier |
| | 2 | | Caddo Parish School Board | School system | | | 6,289 | | Caddo |
| | 3 | | LSU Health Sciences Center | Health Care | | | 5,902 | | Caddo |
| | 4 | | Willis Knighton Health Systems | Health Care | | | 4,306 | | Caddo |
| | 5 | | Harrah's Horshoe Casino & Hotel/Louisiana Downs | Gaming | | | 3,332 | | Bossier |
| | 6 | | General Motors | Truck Assembly | | | 3,002 | | Caddo |
| | 7 | | City of Shreveport | Government | | | 2,657 | | Caddo |
| | 8 | | Bossier Parish School Board | School system | | | 2,633 | | Bossier |
| | 9 | | Christus Schumpert Health System | Health Care | | | 2,074 | | Caddo |
| | 10 | | U.S. Support Company | Call Center | | | 1,952 | | Caddo |
| | 11 | | Eldorado | Gaming | | | 1,469 | | Caddo |
| | 12 | | Sam's Town Hotel and Casino | Gaming | | | 1,364 | | Caddo |
| 13 | | Overton Brooks VA Medical Center | Health Care | | | 1,238 | | Caddo |
| | 14 | | Diamond Jacks Casino | Gaming | | | 1,056 | | Bossier |
| | 15 | | Red River Sanitors, Inc. | Janitorial Service | | | 970 | | Caddo |
Source: Greater Shreveport Chamber of Commerce Major Employers Directory 2006-2007
Feldman Financial Advisors, Inc.
Tables 32 through 35 detail the deposit market data for all commercial banks and thrift institutions with offices in the cities of Shreveport and Bossier, and the parishes of Caddo and Bossier. Based on deposit data as of June 30, 2007 and adjusted for any subsequent merger transactions, including the acquisition of First Louisiana, the Company ranked 5th among the financial institutions operating in both the city of Shreveport and the Parish of Caddo, while ranking 10th in the Parish of Bossier. As of such date, the Company had pro forma total deposits of $151.3 million in the Parish of Caddo, which reflected a 4.6% market share based on the parish’s total deposits of $3.3 billion. Three large regional commercial banks occupied the top three market share rankings of deposits in the Parish. Regions Financial Corporation, Capital One Financial Corporation, and JPMorgan Chase Corporation held market shares of 27.3%, 26.7% and 21.5 %, respectively.
Feldman Financial Advisors, Inc.
Table 32
Deposit Market Share for the City of Shreveport
Data as of June 30, 2007
(adjusted for pending and completed mergers)
| Shreveport, LA | | | | | | | | | | | | | | | | | | |
| | | | | | | | | 2007 | | | 2006 | |
| Rank | | | | | Number of | | | Total | | | Market | | | Total | | | Market | |
| 2007 | | | 2006 | | Institution (ST) | Type | | Branches | | | Deposits | | | Share | | | Deposits | | | Share | |
| | | | | | | | | | | | | | | | | | | | | | |
| | | | | | | | | | | | | | | | | | | | | | |
| | 1 | | | | 1 | | Regions Financial Corp. (AL) | Bank | | | 13 | | | | 905,758 | | | | 28.44 | | | | 960,088 | | | | 30.31 | |
| | 2 | | | | 2 | | Capital One Financial Corp. (VA) | Bank | | | 15 | | | | 883,194 | | | | 27.74 | | | | 903,187 | | | | 28.51 | |
| | 3 | | | | 3 | | JPMorgan Chase & Co. (NY) | Bank | | | 12 | | | | 712,906 | | | | 22.39 | | | | 689,146 | | | | 21.76 | |
| 4 | | | | 4 | | BancorpSouth Inc. (MS) | Bank | | | 6 | | | | 262,558 | | | | 8.25 | | | | 255,101 | | | | 8.05 | |
| 5 | | | | 6 | | Home Fedl Bncp Inc., LA (MHC) (LA) | Thrift | | | 3 | | | | 80,663 | | | | 2.53 | | | | 74,129 | | | | 2.34 | |
| 6 | | | | 7 | | First LA Bancshares Inc. (LA) | Bank | | | 2 | | | | 70,641 | | | | 2.22 | | | | 66,500 | | | | 2.10 | |
| | 7 | | | | 5 | | IBERIABANK Corp. (LA) | Bank | | | 1 | | | | 55,384 | | | | 1.74 | | | | 78,942 | | | | 2.49 | |
| | 8 | | | | 8 | | Mansfield Bancshares Inc. (LA) | Bank | | | 3 | | | | 45,566 | | | | 1.43 | | | | 46,851 | | | | 1.48 | |
| | 9 | | | | 9 | | Citizens National Bancshares (LA) | Bank | | | 3 | | | | 45,404 | | | | 1.43 | | | | 39,167 | | | | 1.24 | |
| | 10 | | | | NA | | Business First Bancshares Inc. (LA) | Bank | | | 1 | | | | 44,137 | | | | 1.39 | | | NA | | | NA | |
| | 11 | | | | 10 | | Ouachita Bancshares Corp. (LA) | Bank | | | 2 | | | | 35,988 | | | | 1.13 | | | | 29,263 | | | | 0.92 | |
| | 12 | | | | 12 | | Red River Bancshares Inc. (LA) | Bank | | | 4 | | | | 22,294 | | | | 0.70 | | | | 5,552 | | | | 0.18 | |
| | 13 | | | | 11 | | C B & T Bancshares Inc. (LA) | Bank | | | 1 | | | | 13,861 | | | | 0.44 | | | | 14,653 | | | | 0.46 | |
| | 14 | | | | 13 | | Tri-State Bancshares Inc. (LA) | Bank | | | 1 | | | | 5,675 | | | | 0.18 | | | | 4,986 | | | | 0.16 | |
| | 15 | | | | 14 | | Progressive NB DeSoto Parish (LA) | Bank | | | 1 | | | | 316 | | | | 0.01 | | | | 0 | | | | 0.00 | |
| | | | | | | | Total For Institutions In Market | | | | 68 | | | | 3,184,345 | | | | 100.00 | | | | 3,167,565 | | | | 100.00 | |
Source: SNL Financial.
Table 33
Deposit Market Share for the City of Bossier
Data as of June 30, 2007
(adjusted for pending and completed mergers)
| Bossier City, LA | | | | | | | | | | | | | | | | | | |
| | | | | | | | | 2007 | | | 2006 | |
| Rank | | | | | Number of | | | Total | | | Market | | | Total | | | Market | |
| 2007 | | | 2006 | | Institution (ST) | Type | | Branches | | | Deposits | | | Share | | | Deposits | | | Share | |
| | | | | | | | | | | | | | | | | | | | | | |
| | | | | | | | | | | | | | | | | | | | | | |
| | 1 | | | | 2 | | JPMorgan Chase & Co. (NY) | Bank | | | 4 | | | | 196,812 | | | | 26.58 | | | | 183,768 | | | | 25.88 | |
| | 2 | | | | 1 | | Capital One Financial Corp. (VA) | Bank | | | 3 | | | | 176,949 | | | | 23.90 | | | | 190,816 | | | | 26.87 | |
| | 3 | | | | 3 | | Citizens National Bancshares (LA) | Bank | | | 3 | | | | 172,643 | | | | 23.31 | | | | 164,014 | | | | 23.09 | |
| | 4 | | | | 4 | | Regions Financial Corp. (AL) | Bank | | | 3 | | | | 134,075 | | | | 18.11 | | | | 121,954 | | | | 17.17 | |
| | 5 | | | | 7 | | Ouachita Bancshares Corp. (LA) | Bank | | | 1 | | | | 21,207 | | | | 2.86 | | | | 11,393 | | | | 1.60 | |
| | 6 | | | | 6 | | BancorpSouth Inc. (MS) | Bank | | | 1 | | | | 18,485 | | | | 2.50 | | | | 14,437 | | | | 2.03 | |
| | 7 | | | | 5 | | First LA Bancshares Inc. (LA) | Bank | | | 1 | | | | 16,673 | | | | 2.25 | | | | 20,626 | | | | 2.90 | |
| | 8 | | | | 8 | | Mansfield Bancshares Inc. (LA) | Bank | | | 1 | | | | 3,665 | | | | 0.49 | | | | 3,189 | | | | 0.45 | |
| | | | | | | | Total For Institutions In Market | | | | 17 | | | | 740,509 | | | | 100.00 | | | | 710,197 | | | | 100.00 | |
Source: SNL Financial.
Feldman Financial Advisors, Inc.
Table 34
Deposit Market Share for the Parish of Caddo
Data as of June 30, 2007
(adjusted for pending and completed mergers)
| Caddo, LA (Parish) | | | | | | | | | | | | | | | | | | |
| | | | | | | | | 2007 | | | 2006 | |
| Rank | | | | | Number of | | | Total | | | Market | | | Total | | | Market | |
| 2007 | | | 2006 | | Institution (ST) | Type | | Branches | | | Deposits | | | Share | | | Deposits | | | Share | |
| | | | | | | | | | | | | | | | | | | | | | |
| | | | | | | | | | | | | | | | | | | | | | |
| | 1 | | | | 1 | | Regions Financial Corp. (AL) | Bank | | | 13 | | | | 905,758 | | | | 27.33 | | | | 960,088 | | | | 29.21 | |
| | 2 | | | | 2 | | Capital One Financial Corp. (VA) | Bank | | | 15 | | | | 883,194 | | | | 26.65 | | | | 903,187 | | | | 27.48 | |
| | 3 | | | | 3 | | JPMorgan Chase & Co. (NY) | Bank | | | 12 | | | | 712,906 | | | | 21.51 | | | | 689,146 | | | | 20.97 | |
| | 4 | | | | 4 | | BancorpSouth Inc. (MS) | Bank | | | 6 | | | | 262,558 | | | | 7.92 | | | | 255,101 | | | | 7.76 | |
| | 5 | | | | 7 | | Home Fedl Bncp Inc., LA (MHC) (LA) | Thrift | | | 3 | | | | 80,663 | | | | 2.43 | | | | 74,129 | | | | 2.26 | |
| | 6 | | | | 6 | | C B & T Bancshares Inc. (LA) | Bank | | | 2 | | | | 79,974 | | | | 2.41 | | | | 75,359 | | | | 2.29 | |
| | 7 | | | | 8 | | First LA Bancshares Inc. (LA) | Bank | | | 2 | | | | 70,641 | | | | 2.13 | | | | 66,500 | | | | 2.02 | |
| | 8 | | | | 5 | | IBERIABANK Corp. (LA) | Bank | | | 1 | | | | 55,384 | | | | 1.67 | | | | 78,942 | | | | 2.40 | |
| | 9 | | | | 9 | | Mansfield Bancshares Inc. (LA) | Bank | | | 3 | | | | 45,566 | | | | 1.37 | | | | 46,851 | | | | 1.43 | |
| | 10 | | | | 10 | | Citizens National Bancshares (LA) | Bank | | | 3 | | | | 45,404 | | | | 1.37 | | | | 39,167 | | | | 1.19 | |
| | 11 | | | | NA | | Business First Bancshares Inc. (LA) | Bank | | | 1 | | | | 44,137 | | | | 1.33 | | | NA | | | NA | |
| | 12 | | | | 11 | | First Guaranty Bancshares Inc. (LA) | Bank | | | 2 | | | | 41,793 | | | | 1.26 | | | | 37,839 | | | | 1.15 | |
| | 13 | | | | 12 | | Ouachita Bancshares Corp. (LA) | Bank | | | 2 | | | | 35,988 | | | | 1.09 | | | | 29,263 | | | | 0.89 | |
| | 14 | | | | 13 | | PSB Financial Corporation (LA) | Bank | | | 1 | | | | 22,349 | | | | 0.67 | | | | 20,247 | | | | 0.62 | |
| | 15 | | | | 14 | | Red River Bancshares Inc. (LA) | Bank | | | 4 | | | | 22,294 | | | | 0.67 | | | | 5,552 | | | | 0.17 | |
| | 16 | | | | 15 | | Tri-State Bancshares Inc. (LA) | Bank | | | 1 | | | | 5,675 | | | | 0.17 | | | | 4,986 | | | | 0.15 | |
| | 17 | | | | 16 | | Progressive NB DeSoto Parish (LA) | Bank | | | 1 | | | | 316 | | | | 0.01 | | | | 0 | | | | 0.00 | |
| | | | | | | | Total For Institutions In Market | | | | 72 | | | | 3,314,600 | | | | 100.00 | | | | 3,286,357 | | | | 100.00 | |
Source: SNL Financial.
Table 35
Deposit Market Share for the Parish of Bossier
Data as of June 30, 2007
(adjusted for pending and completed mergers)
| Bossier, LA (Parish) | | | | | | | | | | | | | | | | | | |
| | | | | | | | | 2007 | | | 2006 | |
| Rank | | | | | Number of | | | Total | | | Market | | | Total | | | Market | |
| 2007 | | | 2006 | | Institution (ST) | Type | | Branches | | | Deposits | | | Share | | | Deposits | | | Share | |
| | | | | | | | | | | | | | | | | | | | | | |
| | | | | | | | | | | | | | | | | | | | | | |
| | 1 | | | | 1 | | JPMorgan Chase & Co. (NY) | Bank | | | 6 | | | | 241,685 | | | | 26.68 | | | | 226,261 | | | | 25.55 | |
| | 2 | | | | 2 | | Capital One Financial Corp. (VA) | Bank | | | 4 | | | | 198,709 | | | | 21.93 | | | | 212,524 | | | | 24.00 | |
| | 3 | | | | 3 | | Citizens National Bancshares (LA) | Bank | | | 3 | | | | 172,643 | | | | 19.06 | | | | 164,014 | | | | 18.52 | |
| | 4 | | | | 4 | | Regions Financial Corp. (AL) | Bank | | | 3 | | | | 134,075 | | | | 14.80 | | | | 121,954 | | | | 13.77 | |
| | 5 | | | | 6 | | Northwest Bancshares Corp. (LA) | Bank | | | 1 | | | | 39,584 | | | | 4.37 | | | | 38,505 | | | | 4.35 | |
| | 6 | | | | 5 | | First Guaranty Bancshares Inc. (LA) | Bank | | | 1 | | | | 29,399 | | | | 3.25 | | | | 39,641 | | | | 4.48 | |
| | 7 | | | | 10 | | Ouachita Bancshares Corp. (LA) | Bank | | | 1 | | | | 21,207 | | | | 2.34 | | | | 11,393 | | | | 1.29 | |
| | 8 | | | | 7 | | Tri-State Bancshares Inc. (LA) | Bank | | | 1 | | | | 20,109 | | | | 2.22 | | | | 23,479 | | | | 2.65 | |
| 9 | | | | 9 | | BancorpSouth Inc. (MS) | Bank | | | 1 | | | | 18,485 | | | | 2.04 | | | | 14,437 | | | | 1.63 | |
| | 10 | | | | 8 | | First LA Bancshares Inc. (LA) | Bank | | | 1 | | | | 16,673 | | | | 1.84 | | | | 20,626 | | | | 2.33 | |
| 11 | | | | 11 | | Ctzns Bkshrs Springhill Inc. (LA) | Bank | | | 1 | | | | 9,721 | | | | 1.07 | | | | 9,509 | | | | 1.07 | |
| | 12 | | | | 12 | | Mansfield Bancshares Inc. (LA) | Bank | | | 1 | | | | 3,665 | | | | 0.40 | | | | 3,189 | | | | 0.36 | |
| | | | | | | | Total For Institutions In Market | | | | 24 | | | | 905,955 | | | | 100.00 | | | | 885,532 | | | | 100.00 | |
Source: SNL Financial.
Feldman Financial Advisors, Inc.
Summary Outlook
Home Federal Bancorp is a small, local thrift whose earnings are constrained despite its high capital levels due to its limited level of loans and high concentration of investments on its balance sheet. The Company has limited product offerings and generates very little new loans each year. Due to this low level of lending, the Company’s net interest margin is small and the Company does not generate significant amounts of non-interest income to offset these low margins.
Through the acquisition of First Louisiana Bancshares and the Offering, this will allow the Company to expand its product offering, increase the level of the Company’s loan portfolio and improve the Company’s net interest margin.
Feldman Financial Advisors, Inc.
II. COMPARISONS WITH PUBLICLY HELD THRIFTS
General Overview
The comparative market approach provides a sound basis for determining estimates of going-concern valuations where a regular and active market exists for the stocks of peer institutions. The comparative market approach was utilized in determining the estimated pro forma market value of the Company because: (i) reliable market and financial data are readily available for comparable institutions; (ii) the comparative market method is required by the applicable regulatory guidelines; and (iii) other alternative valuation methods (such as income capitalization, liquidation analysis, or discounted cash flow) are unlikely to produce a valuation relevant to the future trading patterns of the related equity interest. The generally employed valuation method in initial public offerings, where possible, is the comparative market approach, which also can be relied upon to determine pro forma market value in a thrift stock conversion.
The comparative market approach derives valuation benchmarks from the trading patterns of selected peer institutions that, due to certain factors such as financial performance and operating strategies, enable the appraiser to estimate the potential value of the subject institution in a stock conversion offering. The pricing and trading history of recent initial public offerings and second-stage offerings of thrifts are also examined to provide evidence of the “new issue discount” or “marketability” that must be considered. In Chapter II, our valuation analysis focuses on the selection and comparison of the Company with a comparable group of publicly traded thrift institutions (the “Comparative Group”). Chapter III will detail any additional discounts or premiums that we believe are appropriate to the Company’s pro forma market value.
Feldman Financial Advisors, Inc.
Selection Criteria
Selected market price and financial performance data for all public thrifts are shown in Exhibit III. The list excludes companies that are subject to being acquired under a pending transaction and companies that have a majority ownership interest controlled by a mutual holding company. Several criteria, discussed below, were used to select the individual members of the Comparative Group from the overall universe of publicly held thrifts.
| | · | Operating characteristics – An institution's operating characteristics are the most important factors because they affect investors’ expected rates of return on a company’s stock under various business/economic scenarios, and they influence the market’s general perception of the quality and attractiveness of a given company. Operating characteristics, which may vary in importance during the business cycle, include financial variables such as profitability, balance sheet growth, capitalization, asset quality, and other factors such as lines of business and management strategies. |
| | · | Degree of marketability and liquidity – Marketability of a stock reflects the relative ease and promptness with which a security may be sold when desired, at a representative current price, without material concession in price merely because of the necessity of sale. Marketability also connotes the existence of buying interest as well as selling interest and is usually indicated by trading volumes and the spread between the bid and asked price for a security. Liquidity of the stock issue refers to the organized market exchange process whereby the security can be converted into cash. We attempted to limit our selection to companies that have access to a regular trading market or price quotations. We eliminated from the comparative group companies with market prices that were materially influenced by publicly announced or widely rumored acquisitions. However, the expectation of continued industry consolidation is currently embedded in thrift equity valuations. |
| | · | Geographic Location – The region of the country where a company operates is also of importance in selecting the comparative group. The operating environment for thrift institutions varies from region to region with respect to business and economic environments, real estate market conditions, speculative takeover activity, and investment climates. Economic and investor climates can also vary greatly within a region, particularly due to takeover activity. |
Feldman Financial Advisors, Inc.
In determining the Comparative Group composition, we focused on the Company’s location, corporate structure, asset size, profitability, and equity level. As with any composition of a group of comparable companies, the selection criteria were broadened sufficiently to assemble a meaningful number of members for inclusion. Specifically, we applied the following selection criteria:
| | · | Publicly traded thrift – stock-form thrift whose shares are traded on a major stock exchange, listed on NASDAQ or traded OTCBB or Pink Sheet. |
| | · | Geographic – located in the Southwest, Southeast or Midwest regions of the United States. |
| | · | Non-acquisition target – company is not subject to a pending acquisition. |
| | · | Ownership profile – fully-converted thrifts (excludes mutual holding companies). |
| | · | Current financial data – publicly reported financial data available as of December 31, 2007. |
| | · | Asset size – total assets of between $100 million and $400 million. |
| | · | Equity level – equity to assets greater than 7.00% as of December 31, 2007. |
As a result of applying the above criteria, the screening process produced a reliable representation of publicly traded thrifts with operations comparable to those of the Company. A general operating summary of the twelve members selected for the Comparative Group is presented in Table 36. For comparative purposes, we have also included data for First Louisiana Bancshares.
The companies in the Comparative Group were drawn from across the southern and mid-western United States with five located in the Southwest region (three in Louisiana, one in Oklahoma and one from Texas), four from the Southeast (two from Tennessee and one from North Carolina), and three located in the Mid-west (all located in the state of Missouri). The asset sizes of the selected companies range from $135.1 million at United Tennessee Bankshares, Inc. to $344.2 million at Jefferson Bancshares, Inc. The median asset size of the Comparative Group was $176.2 million.
Feldman Financial Advisors, Inc.
While some differences inevitably may exist between the Company and the individual companies, we believe that the chosen Comparative Group as a whole provides a meaningful basis of financial comparison for valuation purposes.
Table 36
Comparative Group Operating Summary
As of December 31, 2007
| | | | | | | | | Initial | | Total | | | Equity/ | |
| | | | | | | No. of | | Conversion | | Assets | | | Assets | |
| Company | | City | | State | | Offices | | Date | | ($000s) | | | (%) | |
| | | | | | | | | | | | | | | |
| Home Federal Bancorp | | Shreveport | | LA | | | 3 | | 01/21/05 | | | 128,084 | | | | 23.77 | |
| First Louisiana Bancshares | | Shreveport | | LA | | | 3 | | NA | | | 123,092 | | | | 9.13 | |
| | | | | | | | | | | | | | | | | | |
| | | | | | | | | | | | | | | | | | |
| CKF Bancorp, Inc. | | Danville | | KY | | | 3 | | 01/04/95 | | | 149,975 | | | | 10.63 | |
| Coddle Creek Financial Corp. | | Mooresville | | NC | | | 3 | | 12/31/97 | | | 155,564 | | | | 12.60 | |
| East Texas Financial Services, Inc. | | Tyler | | TX | | | 3 | | 01/10/95 | | | 213,005 | | | | 10.43 | |
| First Bancshares, Inc. | | Mountain Grove | | MO | | | 11 | | 12/22/93 | | | 243,446 | | | | 11.19 | |
| FPB Financial Corp. | | Hammond | | LA | | | 1 | | 07/01/99 | | | 166,722 | | | | 7.24 | |
| GS Financial Corp. | | Metairie | | LA | | | 5 | | 04/01/97 | | | 185,671 | | | | 15.21 | |
| Jefferson Bancshares, Inc. | | Morristown | | TN | | | 5 | | 07/02/03 | | | 344,152 | | | | 21.22 | |
| Lexington B&L Financial Corp. | | Lexington | | MO | | | 4 | | 06/06/96 | | | 135,204 | | | | 11.50 | |
| Liberty Bancorp, Inc. | | Liberty | | MO | | | 6 | | 07/24/06 | | | 339,112 | | | | 14.07 | |
| Louisiana Bancorp, Inc. | | Metairie | | LA | | | 3 | | 07/10/07 | | | 270,999 | | | | 33.16 | |
| Osage Bancshares, Inc. | | Pawhuska | | OK | | | 2 | | 01/18/07 | | | 136,770 | | | | 25.79 | |
| United Tennessee Bankshares, Inc. | | Newport | | TN | | | 3 | | 01/05/98 | | | 135,113 | | | | 10.22 | |
Source: Home Federal Bancorp; First Louisiana Bancshares; SNL Financial; Feldman Financial.
Feldman Financial Advisors, Inc.
Recent Financial Comparisons
Table 37 summarizes certain key financial comparisons between the Company and the Comparative Group. Tables 38 through 42 contain the detailed financial comparisons of the Company with the individual Comparative Group companies based on measures of profitability, income and expense components, yield-cost structure, capital levels, credit risk, balance sheet composition, and growth rates. Financial data for the Company, the Comparative Group, and All Public Thrift aggregate were utilized as of or for the most recent available last twelve month (“LTM”) period ending December 31, 2007.
The Company’s LTM return on average assets (“ROAA”) was 0.46%, reflecting a profitability measure below the Comparative Group median of 0.57% and just below the All Public Thrift median of 0.49%. First Louisiana reported an ROAA of 0.70%. The Company’s comparatively lower earnings level was attributable primarily to its comparatively lower net interest margin and higher efficiency ratio. The Company’s LTM return on average equity at 1.92% also compared unfavorably to the Comparative Group median of 3.67% and the All Public Thrift median of 4.39%. The Bank’s lower ROAA is attributable to the lower level of earnings exhibited by the Company and its much higher equity ratio. First Louisiana reported an ROAE of 7.51%, which is above the ROAE reported by both the Comparative Group or the All Public Thrift group due to its higher net interest margin and a slightly lower equity base.
The Company’s net interest income level of 2.52% relative to average assets was in-line with the Comparative Group median of 2.55% but below the All Public Thrift median of 2.76%. The Company’s lower level of net interest income production was attributable primarily to its higher concentration than the Comparative Group in cash and investment securities, which tend to have a lower yield than loans. First Louisiana reported a net interest income level of 4.52% which was well above Comparative Group and All Public Thrift Group as First Louisiana benefited from having a higher concentration of non-interest deposit accounts which lowered its overall cost of funds and a higher concentration of commercial real estate loans which generally carry a higher level of interest compared to residential mortgage loans. The Company’s net interest spread of 1.71% was lower than the Comparative Group and All Public Thrift medians of 2.42% and 2.55%, respectively. First Louisiana reported a net interest spread of 4.23%
Feldman Financial Advisors, Inc.
The Company’s earning asset yield measured 5.78% and trailed the Comparative Group median of 6.74 and the All Public Thrift median of 6.36%. First Louisiana’s earning asset yield measured 7.73% for the period. The Company’s lower asset yield resulted from having a larger concentration of cash and securities as a percentage of total assets and a lower level of net loans as a percentage of total assets as compared to the Comparative Group. The Company’s ratio of net loans to total assets measured 22.6% compared to the Comparative Group median of 71.1% and the All Public Thrift Median of 72.8%. First Louisiana’s level of loans to total assets measured 68.9% as of December 31, 2007. The Company’s ratio of residential mortgages to total loans measured 84.3% as compared to medians of 55.4% for the Comparative Group and 49.6% for the All Public Thrift Group while First Louisiana was 14.6%. The Company’s cost of interest-bearing liabilities at 4.07% was less than the Comparative Group median cost of funds of 4.31% but above the All Public Thrift median of 3.97%. The Company’s level of borrowed funds was comparable to the Comparative Group’s median debt utilization. Borrowings measured 12.4% of the Company’s assets and 11.7% for the Comparative Group median and 19.9% for the All Public Thrift median.
Feldman Financial Advisors, Inc.
| Table 37 |
| Key Financial Comparisons |
| Home Federal Bancorp and the Comparative Group |
| As of or for the Last Twelve Months Ended December 31, 2007 |
| | | | | | | | | Comparative | | | All Public | |
| | | Home | | | First | | | Group | | | Thrift | |
| | | Federal | | | Louisiana | | | Median | | | Median | |
| Profitability (%) | | | | | | | | | | | | |
| LTM Return on Average Assets | | | 0.46 | | | | 0.70 | | | | 0.57 | | | | 0.47 | |
| LTM Return on Average Equity | | | 1.92 | | | | 7.51 | | | | 3.67 | | | | 4.46 | |
| Core Return on Average Assets | | | 0.38 | | | | 0.70 | | | | 0.60 | | | | 0.49 | |
| Core Return on Average Equity | | | 1.57 | | | | 7.51 | | | | 3.89 | | | | 4.13 | |
| | | | | | | | | | | | | | | | | |
| Income and Expense (% of avg. assets) | | | | | | | | | | | | | | | | |
| Total Interest Income | | | 5.59 | | | | 7.15 | | | | 6.05 | | | | 5.95 | |
| Total Interest Expense | | | 3.07 | | | | 2.63 | | | | 3.21 | | | | 3.29 | |
| Net Interest Income | | | 2.52 | | | | 4.52 | | | | 2.55 | | | | 2.76 | |
| Provision for Loan Losses | | | 0.00 | | | | 0.60 | | | | 0.04 | | | | 0.11 | |
| Other Operating Income | | | 0.04 | | | | 0.94 | | | | 0.48 | | | | 0.54 | |
| Net Gains and Nonrecurring Income | | | 0.14 | | | | - | | | | 0.00 | | | | 0.03 | |
| General and Administrative Expense | | | 1.99 | | | | 3.96 | | | | 2.46 | | | | 2.57 | |
| Intangibles Amortization Expense | | | - | | | | - | | | | - | | | | - | |
| Nonrecurring Expense | | | - | | | | - | | | | - | | | | - | |
| Pre-tax Core Earnings | | | 0.57 | | | | 0.94 | | | | 0.88 | | | | 0.71 | |
| Efficiency Ratio | | | 77.83 | | | | 71.83 | | | | 68.90 | | | | 69.62 | |
| | | | | | | | | | | | | | | | | |
| Yield-Cost Data (%) | | | | | | | | | | | | | | | | |
| Yield on Interest-earning Assets | | | 5.78 | | | | 7.73 | | | | 6.74 | | | | 6.36 | |
| Cost of Interest-bearing Liabilities | | | 4.07 | | | | 3.50 | | | | 4.31 | | | | 3.97 | |
| Net Interest Spread | | | 1.71 | | | | 4.23 | | | | 2.42 | | | | 2.55 | |
| Net Interest Margin | | | 2.56 | | | | 5.01 | | | | 3.31 | | | | 2.97 | |
| | | | | | | | | | | | | | | | | |
| Asset Utilization (% of avg. total assets) | | | | | | | | | | | | | | | | |
| Avg. Interest-earning Assets | | | 94.57 | | | | 81.41 | | | | 90.13 | | | | 91.30 | |
| Avg. Interest-bearing Liabilities | | | 75.54 | | | | 65.49 | | | | 89.56 | | | | 80.20 | |
| Avg. Net Interest-earning Assets | | | 19.03 | | | | 15.92 | | | | 8.70 | | | | 9.63 | |
Source: Home Federal Bancorp; First Louisiana Bancshares; SNL Financial; Feldman Financial
Feldman Financial Advisors, Inc.
| Table 37 (continued) |
| Key Financial Comparisons |
| Home Federal Bancorp and the Comparative Group |
| As of or for the Last Twelve Months Ended December 31, 2007 |
| | | | | | | | | Comparative | | | All Public | |
| | | Home | | | First | | | Group | | | Thrift | |
| | | Federal | | | Louisiana | | | Median | | | Median | |
| Balance Sheet Composition (% of total assets) | | | | | | | | | | | | |
| Cash and Securities | | | 76.08 | | | | 20.34 | | | | 24.09 | | | | 20.30 | |
| Loans Receivable, net | | | 22.59 | | | | 68.68 | | | | 71.08 | | | | 72.76 | |
| Real Estate | | | 0.03 | | | | 1.87 | | | | 0.19 | | | | 0.05 | |
| Intangible Assets | | | - | | | | - | | | | - | | | | 0.28 | |
| Other Assets | | | 1.44 | | | | 8.81 | | | | 5.22 | | | | 3.99 | |
| Total Deposits | | | 63.23 | | | | 75.40 | | | | 70.53 | | | | 66.89 | |
| Borrowed Funds | | | 12.44 | | | | 10.69 | | | | 11.92 | | | | 19.91 | |
| Other Liabilities | | | 0.57 | | | | 4.78 | | | | 0.73 | | | | 1.01 | |
| Total Equity | | | 23.77 | | | | 9.13 | | | | 12.05 | | | | 9.64 | |
| | | | | | | | | | | | | | | | | |
| Loan Portfolio (% of total loans) | | | | | | | | | | | | | | | | |
| Residential Mortgage Loans | | | 84.29 | | | | 14.61 | | | | 55.41 | | | | 49.58 | |
| Other Real Estate Mortgage Loans | | | 13.76 | | | | 47.38 | | | | 29.81 | | | | 41.05 | |
| Non-mortgage Loans | | | 1.95 | | | | 38.01 | | | | 8.17 | | | | 9.37 | |
| | | | | | | | | | | | | | | | | |
| Growth Rates (%) | | | | | | | | | | | | | | | | |
| Total Assets | | | 3.14 | | | | 9.23 | | | | 5.77 | | | | 4.22 | |
| Total Loans | | | 24.63 | | | | 6.80 | | | | 8.36 | | | | 5.67 | |
| Total Deposits | | | 6.18 | | | | 7.07 | | | | 5.33 | | | | 2.33 | |
| | | | | | | | | | | | | | | | | |
| Regulatory Capital Ratios (%) | | | | | | | | | | | | | | | | |
| Tier 1 Leverage Ratio | | | 21.95 | | | | 10.88 | | | | 10.98 | | | | 8.69 | |
| Tier 1 Risk-based Capital | | | 78.19 | | | | 12.86 | | | | 16.96 | | | | 12.10 | |
| Total Risk-based Capital | | | 78.85 | | | | 13.72 | | | | 18.41 | | | | 12.83 | |
| | | | | | | | | | | | | | | | | |
| Credit Risk Ratios (%) | | | | | | | | | | | | | | | | |
| Nonperforming Loans / Total Loans | | | 0.07 | | | | 2.22 | | | | 0.49 | | | | 0.66 | |
| Nonperforming Assets / Total Assets | | | 0.04 | | | | 3.42 | | | | 0.66 | | | | 0.56 | |
| Reserves / Total Loans | | | 0.81 | | | | 1.04 | | | | 1.07 | | | | 0.89 | |
| Reserves / Nonperforming Assets | | | 451.92 | | | | 21.20 | | | | 108.80 | | | | 89.22 | |
Source: Home Federal Bancorp; First Louisiana Bancshares; SNL Financial; Feldman Financial
Feldman Financial Advisors, Inc.
The Company’s non-interest operating income totaled 0.04% of average assets, significantly trailing the Comparative Group and All Public Thrift medians of 0.48% and 0.54%, respectively. First Louisiana reported a non-interest income level of 0.94%.
The Company’s provision for loan losses measured 0.00% of average assets, as compared to the Comparative Group median of 0.04% and the All Public Thrift median of 0.11%. The Company’s non-performing asset ratio measured 0.07% of total assets versus the Comparative Group median of 0.66% and All Public Thrift median of 0.56%. First Louisiana’s level of non-performing assets totaled 3.42% at December 31, 2007. The Company’s non-performing loan ratio as a percent of gross loans was 0.07% and was well below the corresponding Comparative Group median of 0.49% and the All Public Thrift median of 0.66%. The Company maintained a lower level of loan loss reserves at 0.81% of total loans versus the Comparative Group median of 1.07% and the All Public Thrift median of 0.89%. First Louisiana’s level of loan loss reserves of total loans measured 1.04%
The Company’s operating expense ratio was lower than the Comparative Group and All Public Thrift medians. The Company’s general and administrative expense ratio of 1.99% was below the Comparative Group median of 2.46% and the All Public Thrift median of 2.57%. Following the Conversion, operating expenses are likely to increase as the Company will recognize additional employee compensation and benefits expenses resulting from the shares granted to employees and executives under the benefit plans. First Louisiana’s level of non-interest expense measured 3.96%.
The Company’s balance sheet composition had a higher concentration of cash and securities and a lower level of loans compared to the Comparative Group as a whole. Total net loans amounted to 22.6% of assets at the Company as of December 31, 2007, versus 71.1% for the Comparative Group median and 72.8% for the All Public Thrift group. Cash and securities aggregated 76.1% of assets at the Company, compared to 24.1% for the Comparative Group median. Neither the Company nor the Comparative group reported any intangible assets as of December 31, 2007. Other assets, excluding intangibles and foreclosed real estate, composed 1.4% of the Company’s assets versus the Comparative Group median of 5.2%.
Feldman Financial Advisors, Inc.
The Company’s borrowings level at 12.4% of assets reflected some continued usage of FHLB advances as a supplemental funding source. The Comparative Group is characterized by companies with borrowing activity similar to the Company but below the overall thrift industry as demonstrated by the median debt level of 11.9% of total assets versus the All Public Thrift median of 19.9%. First Louisiana reported a borrowing level comparable to the Company at 10.7%. The Company’s equity level before the Stock Offering was 23.7% relative to assets, which was well above the Comparative Group median of 12.1% and the All Public Thrift median of 9.6%. The Company’s risk-based capital ratios were also well above both the Comparative Group median and the All Public Thrift median.
The Company’s loan portfolio increased by 24.6% during the LTM period. The Comparative Group experienced a median loan portfolio growth rate of 8.4% as compared to the All Public Thrift median of 5.7%. Overall, the Company’s assets grew 3.1% compared to 5.8% and 4.2% growth for the Comparative Group and All Public Thrifts, respectively. Deposits also grew for the LTM period by 6.2%, compared to the Comparative Group median of 5.3%.
In summary, the Company’s recent earnings performance lagged the results attained by the Comparative Group and All Public Thrift aggregate when based on returns on assets and returns on equity. The Company’s lower level of profitability was a result of a weak net interest margin, low concentration of loans to total assets and low levels of non-interest income. Management believes that the competition in the banking and financial services industry in its primary market area is intense and that many of its competitors have substantially greater resources and lending limits than the Company do and offer services that it does not or cannot provide. The acquisition of First Louisiana Bancshares and the completion of the Offering should enable the Company to offer a wider variety of loan and deposit products, allowing it to compete more competitively in its marketplace.
Feldman Financial Advisors, Inc.
| Table 38 |
| General Financial Performance Ratios |
| As of or for the Latest Twelve Months Ended December 31, 2007 |
| | | | | | | | | Total | | | Tang. | | | Net | | | | | | | | | | | | | | | | |
| | | Total | | | Total | | | Equity/ | | | Equity/ | | | Interest | | | Effcy. | | | LTM | | | LTM | | | Core | | | Core | |
| | | Assets | | | Deposits | | | Assets | | | Assets | | | Margin | | | Ratio | | | ROA | | | ROE | | | ROA | | | ROE | |
| | | ($000s) | | | ($000s) | | | (%) | | | (%) | | | (%) | | | (%) | | | (%) | | | (%) | | | (%) | | | (%) | |
| | | | | | | | | | | | | | | | | | | | | | | | | | | | | | | |
| Home Federal Bancorp | | | 128,084 | | | | 80,986 | | | | 23.77 | | | | 23.77 | | | | 2.56 | | | | 77.83 | | | | 0.46 | | | | 1.92 | | | | 0.38 | | | | 1.57 | |
| First Louisiana Bancshares | | | 123,092 | | | | 92,811 | | | | 9.13 | | | | 9.13 | | | | 5.01 | | | | 71.83 | | | | 0.70 | | | | 7.51 | | | | 0.70 | | | | 7.51 | |
| | | | | | | | | | | | | | | | | | | | | | | | | | | | | | | | | | | | | | | | | |
| Comparative Group Average | | | 206,311 | | | | 143,609 | | | | 15.27 | | | | 15.06 | | | | 3.16 | | | | 73.51 | | | | 0.57 | | | | 4.20 | | | | 0.58 | | | | 4.24 | |
| Comparative Group Median | | | 176,197 | | | | 118,580 | | | | 12.05 | | | | 11.85 | | | | 3.31 | | | | 68.90 | | | | 0.57 | | | | 3.67 | | | | 0.60 | | | | 3.89 | |
| | | | | | | | | | | | | | | | | | | | | | | | | | | | | | | | | | | | | | | | | |
| All Public Thrift Average | | | 6,597,855 | | | | 3,706,155 | | | | 11.48 | | | | 10.64 | | | | 2.95 | | | | 73.75 | | | | 0.41 | | | | 3.71 | | | | 0.40 | | | | 3.80 | |
| All Public Thrift Median | | | 877,886 | | | | 610,030 | | | | 9.64 | | | | 8.29 | | | | 2.97 | | | | 69.62 | | | | 0.47 | | | | 4.46 | | | | 0.49 | | | | 4.13 | |
| | | | | | | | | | | | | | | | | | | | | | | | | | | | | | | | | | | | | | | | | |
| Comparative Group | | | | | | | | | | | | | | | | | | | | | | | | | | | | | | | | | | | | | | | | |
| CKF Bancorp, Inc. | | | 149,975 | | | | 106,938 | | | | 10.63 | | | | 9.97 | | | | 2.81 | | | | 59.65 | | | | 0.65 | | | | 6.19 | | | | 0.65 | | | | 6.19 | |
| Coddle Creek Financial Corp. | | | 155,564 | | | NA | | | | 12.60 | | | | 12.60 | | | NA | | | NA | | | | 0.36 | | | | 2.99 | | | NA | | | NA | |
| East Texas Financial Services, Inc. | | | 213,005 | | | | 110,868 | | | | 10.43 | | | | 9.51 | | | | 1.86 | | | | 94.87 | | | | 0.14 | | | | 1.41 | | | | 0.14 | | | | 1.41 | |
| First Bancshares, Inc. | | | 243,446 | | | | 191,991 | | | | 11.19 | | | | 11.10 | | | | 2.95 | | | | 91.20 | | | | 0.21 | | | | 1.91 | | | | 0.16 | | | | 1.48 | |
| FPB Financial Corp. | | | 166,722 | | | | 118,580 | | | | 7.24 | | | | 7.24 | | | | 3.97 | | | | 68.90 | | | | 0.80 | | | | 10.11 | | | | 0.77 | | | | 9.72 | |
| GS Financial Corp. | | | 185,671 | | | | 129,840 | | | | 15.21 | | | | 15.21 | | | | 3.42 | | | | 87.79 | | | | 0.44 | | | | 2.77 | | | | 0.44 | | | | 2.77 | |
| Jefferson Bancshares, Inc. | | | 344,152 | | | | 231,774 | | | | 21.22 | | | | 21.22 | | | | 3.77 | | | | 76.71 | | | | 0.39 | | | | 1.78 | | | | 0.39 | | | | 1.78 | |
| Lexington B&L Financial Corp. | | | 135,204 | | | | 110,877 | | | | 11.50 | | | | 10.98 | | | | 3.05 | | | | 66.99 | | | | 0.71 | | | | 6.31 | | | | 0.71 | | | | 6.31 | |
| Liberty Bancorp, Inc. | | | 339,112 | | | | 239,168 | | | | 14.07 | | | | 14.07 | | | | 3.31 | | | | 67.05 | | | | 0.60 | | | | 3.89 | | | | 0.60 | | | | 3.89 | |
| Louisiana Bancorp, Inc. | | | 270,999 | | | | 143,629 | | | | 33.16 | | | | 33.16 | | | | 3.31 | | | | 57.92 | | | | 1.08 | | | | 4.47 | | | | 1.09 | | | | 4.49 | |
| Osage Bancshares, Inc. | | | 136,770 | | | | 85,793 | | | | 25.79 | | | | 25.79 | | | | 3.51 | | | | 62.70 | | | | 0.93 | | | | 3.44 | | | | 0.93 | | | | 3.44 | |
| United Tennessee Bankshares, Inc. | | | 135,113 | | | | 110,246 | | | | 10.22 | | | | 9.91 | | | | 2.75 | | | | 74.78 | | | | 0.53 | | | | 5.10 | | | | 0.54 | | | | 5.14 | |
Source: Home Federal Bancorp; First Louisiana Bancshares; SNL Financial; Feldman Financial.
Feldman Financial Advisors, Inc.
| Table 39 |
| Income and Expense Analysis |
| For the Latest Twelve Months Ended December 31, 2007 |
| | | As a Percent of Average Assets | |
| | | | | | | | | Net | | | Other | | | Gains & | | | Loan | | | Gen. & | | | Amort. | | | | | | Pretax | |
| | | Interest | | | Interest | | | Interest | | | Oper. | | | Non-rec. | | | Loss | | | Admin. | | | of | | | Non-rec. | | | Core | |
| | | Income | | | Expense | | | Income | | | Income | | | Income | | | Prov. | | | Expense | | | Intang, | | | Expense | | | Earnings | |
| | | | | | | | | | | | | | | | | | | | | | | | | | | | | | | |
| Home Federal Bancorp | | | 5.59 | | | | 3.07 | | | | 2.52 | | | | 0.04 | | | | 0.14 | | | | 0.00 | | | | 1.99 | | | | 0.00 | | | | 0.00 | | | | 0.57 | |
| First Louisiana Bancshares | | | 7.15 | | | | 2.63 | | | | 4.52 | | | | 0.94 | | | | 0.00 | | | | 0.60 | | | | 3.96 | | | | 0.00 | | | | 0.00 | | | | 0.94 | |
| | | | | | | | | | | | | | | | | | | | | | | | | | | | | | | | | | | | | | | | | |
| Comparative Group Average | | | 6.16 | | | | 3.40 | | | | 2.50 | | | | 0.52 | | | | 0.04 | | | | 0.09 | | | | 2.60 | | | | 0.00 | | | | 0.00 | | | | 0.86 | |
| Comparative Group Median | | | 6.05 | | | | 3.21 | | | | 2.55 | | | | 0.48 | | | | 0.00 | | | | 0.04 | | | | 2.46 | | | | 0.00 | | | | 0.00 | | | | 0.88 | |
| | | | | | | | | | | | | | | | | | | | | | | | | | | | | | | | | | | | | | | | | |
| All Public Thrift Average | | | 6.06 | | | | 3.30 | | | | 2.76 | | | | 0.67 | | | | 0.04 | | | | 0.23 | | | | 2.61 | | | | 0.05 | | | | 0.01 | | | | 0.61 | |
| All Public Thrift Median | | | 5.95 | | | | 3.29 | | | | 2.76 | | | | 0.54 | | | | 0.03 | | | | 0.11 | | | | 2.57 | | | | 0.00 | | | | 0.00 | | | | 0.71 | |
| | | | | | | | | | | | | | | | | | | | | | | | | | | | | | | | | | | | | | | | | |
| Comparative Group | | | | | | | | | | | | | | | | | | | | | | | | | | | | | | | | | | | | | | | | |
| CKF Bancorp, Inc. | | | 6.53 | | | | 3.08 | | | | 2.55 | | | | 0.35 | | | | 0.00 | | | | 0.22 | | | | 1.85 | | | | 0.00 | | | | 0.00 | | | | 0.99 | |
| Coddle Creek Financial Corp. | | NA | | | | 3.30 | | | | 2.30 | | | NA | | | | 0.00 | | | NA | | | NA | | | | 0.00 | | | | 0.00 | | | NA | |
| East Texas Financial Services, Inc. | | | 5.39 | | | | 3.21 | | | | 2.19 | | | | 0.48 | | | | 0.00 | | | | 0.03 | | | | 2.10 | | | | 0.00 | | | | 0.00 | | | | 0.09 | |
| First Bancshares, Inc. | | | 6.05 | | | | 3.71 | | | | 2.72 | | | | 0.74 | | | | 0.24 | | | | 0.14 | | | | 3.42 | | | | 0.02 | | | | 0.00 | | | | 0.17 | |
| FPB Financial Corp. | | | 6.92 | | | | 3.21 | | | | 2.19 | | | | 1.35 | | | | 0.05 | | | | 0.42 | | | | 3.53 | | | | 0.00 | | | | 0.00 | | | | 1.17 | |
| GS Financial Corp. | | | 6.51 | | | | 3.71 | | | | 2.72 | | | | 0.14 | | | | 0.11 | | | | (0.17 | ) | | | 3.11 | | | | 0.00 | | | | 0.00 | | | | 0.61 | |
| Jefferson Bancshares, Inc. | | | 6.42 | | | | 3.58 | | | | 1.55 | | | | 0.41 | | | | 0.00 | | | | 0.04 | | | | 2.96 | | | | 0.00 | | | | 0.00 | | | | 0.88 | |
| Lexington B&L Financial Corp. | | | 6.03 | | | NA | | | NA | | | | 0.48 | | | | 0.00 | | | | 0.14 | | | | 2.21 | | | | 0.00 | | | | 0.00 | | | | 1.00 | |
| Liberty Bancorp, Inc. | | | 6.62 | | | | 4.33 | | | | 1.32 | | | | 0.43 | | | | 0.08 | | | | 0.24 | | | | 2.55 | | | | 0.00 | | | | 0.00 | | | | 0.87 | |
| Louisiana Bancorp, Inc. | | | 5.50 | | | | 3.18 | | | | 3.48 | | | | 0.22 | | | | (0.01 | ) | | | (0.11 | ) | | | 1.99 | | | | 0.00 | | | | 0.00 | | | | 1.55 | |
| Osage Bancshares, Inc. | | | 5.90 | | | | 3.10 | | | | 3.06 | | | | 0.53 | | | | 0.02 | | | | 0.00 | | | | 2.46 | | | | 0.00 | | | | 0.00 | | | | 1.47 | |
| United Tennessee Bankshares, Inc. | | | 5.90 | | | | 2.96 | | | | 3.39 | | | | 0.56 | | | | (0.01 | ) | | | 0.01 | | | | 2.38 | | | NA | | | | 0.00 | | | | 0.71 | |
Source: Home Federal Bancorp; First Louisiana Bancshares; SNL Financial; Feldman Financial.
Feldman Financial Advisors, Inc.
| Table 40 |
| Yield-Cost Structure and Growth Rates |
| For the Latest Twelve Months Ended December 31, 2007 |
| | | Avg. | | | Avg. | | | Avg. Net | | | | | | | | | | | | | | | | | | | | | | |
| | | Int. Earn. | | | Int.-Bear. | | | Earning | | | Avg. | | | Yield on | | | Cost of | | | Net | | | Asset | | | Loan | | | Deposit | |
| | | Assets/ | | | Liabs./ | | | Assets/ | | | Equity/ | | | Int.-Earn. | | | Int-Bear. | | | Interest | | | Growth | | | Growth | | | Growth | |
| | | Assets | | | Assets | | | Assets | | | Assets | | | Assets | | | Liabs. | | | Spread | | | Rate | | | Rate | | | Rate | |
| | | | | | | | | | | | | | | | | | | | | | | | | | | | | | | |
| Home Federal Bancorp | | | 94.57 | | | | 75.54 | | | | 19.03 | | | | 23.09 | | | | 5.78 | | | | 4.07 | | | | 1.71 | | | | 3.14 | | | | 24.63 | | | | 6.18 | |
| First Louisiana Bancshares | | | 81.41 | | | | 65.49 | | | | 15.92 | | | | 8.76 | | | | 7.73 | | | | 3.50 | | | | 4.23 | | | | 9.23 | | | | 6.80 | | | | 7.07 | |
| | | | | | | | | | | | | | | | | | | | | | | | | | | | | | | | | | | | | | | | | |
| Comparative Group Average | | | 91.40 | | | | 89.56 | | | | 8.70 | | | | 14.17 | | | | 6.38 | | | | 3.92 | | | | 2.14 | | | | 7.78 | | | | 8.40 | | | | 5.51 | |
| Comparative Group Median | | | 90.13 | | | | 89.56 | | | | 8.70 | | | | 11.56 | | | | 6.74 | | | | 4.31 | | | | 2.42 | | | | 5.77 | | | | 8.36 | | | | 5.33 | |
| | | | | | | | | | | | | | | | | | | | | | | | | | | | | | | | | | | | | | | | | |
| All Public Thrift Average | | | 91.25 | | | | 79.37 | | | | 10.72 | | | | 11.01 | | | | 6.41 | | | | 3.96 | | | | 2.53 | | | | 5.65 | | | | 5.94 | | | | 3.31 | |
| All Public Thrift Median | | | 91.30 | | | | 80.20 | | | | 9.63 | | | | 9.71 | | | | 6.36 | | | | 3.97 | | | | 2.55 | | | | 4.22 | | | | 5.67 | | | | 2.33 | |
| | | | | | | | | | | | | | | | | | | | | | | | | | | | | | | | | | | | | | | | | |
| Comparative Group | | | | | | | | | | | | | | | | | | | | | | | | | | | | | | | | | | | | | | | | |
| CKF Bancorp, Inc. | | | 100.29 | | | | 91.47 | | | | 8.82 | | | | 10.90 | | | | 6.74 | | | | 4.32 | | | | 2.42 | | | | (5.76 | ) | | | (6.16 | ) | | | (2.77 | ) |
| Coddle Creek Financial Corp. | | | 94.88 | | | NA | | | NA | | | | 11.82 | | | NA | | | NA | | | NA | | | | 1.28 | | | NA | | | NA | |
| East Texas Financial Services, Inc. | | | 96.22 | | | | 87.65 | | | | 8.58 | | | | 10.29 | | | | 5.79 | | | | 4.31 | | | | 1.48 | | | | (7.25 | ) | | | 0.17 | | | | 0.75 | |
| First Bancshares, Inc. | | | 92.39 | | | NA | | | NA | | | | 10.97 | | | NA | | | NA | | | NA | | | | 2.74 | | | | 1.76 | | | | 4.03 | |
| FPB Financial Corp. | | | 80.68 | | | NA | | | NA | | | | 6.81 | | | NA | | | NA | | | NA | | | | 23.04 | | | | 12.97 | | | | 19.37 | |
| GS Financial Corp. | | | 89.78 | | | NA | | | NA | | | | 14.72 | | | | 6.75 | | | NA | | | NA | | | | 10.27 | | | | 26.06 | | | | 5.77 | |
| Jefferson Bancshares, Inc. | | | 89.84 | | | NA | | | NA | | | | 21.42 | | | | 6.97 | | | NA | | | NA | | | | 4.15 | | | | 5.68 | | | | 10.42 | |
| Lexington B&L Financial Corp. | | | 95.11 | | | NA | | | NA | | | | 11.29 | | | NA | | | NA | | | NA | | | | 1.30 | | | | (0.24 | ) | | | 3.94 | |
| Liberty Bancorp, Inc. | | | 89.61 | | | NA | | | NA | | | | 14.52 | | | NA | | | NA | | | NA | | | | 14.91 | | | | 14.47 | | | | 11.31 | |
| Louisiana Bancorp, Inc. | | | 87.71 | | | NA | | | NA | | | | 21.80 | | | | 5.64 | | | | 3.13 | | | | 2.51 | | | | 23.33 | | | | 8.36 | | | | (4.46 | ) |
| Osage Bancshares, Inc. | | | 89.98 | | | NA | | | NA | | | | 25.37 | | | NA | | | NA | | | NA | | | | 17.91 | | | | 17.93 | | | | 6.92 | |
| United Tennessee Bankshares, Inc. | | | 90.27 | | | NA | | | NA | | | | 10.15 | | | NA | | | NA | | | NA | | | | 7.39 | | | | 11.37 | | | | 5.33 | |
Source: Home Federal Bancorp; First Louisiana Bancshares; SNL Financial; Feldman Financial.
Feldman Financial Advisors, Inc.
| Table 41 |
| Balance Sheet Composition |
| As of the Latest Twelve Months Ended December 31, 2007 |
| | | As a Percent of Total Assets | |
| | | Cash & | | | Net | | | Real | | | Intang. | | | Other | | | Total | | | Borrowed | | | Other | | | Total | | | Total | |
| | | Securities | | | Loans | | | Estate | | | Assets | | | Assets | | | Deposits | | | Funds | | | Liabs. | | | Liabs. | | | Equity | |
| | | | | | | | | | | | | | | | | | | | | | | | | | | | | | | |
| Home Federal Bancorp | | | 76.08 | | | | 22.59 | | | | 0.03 | | | | 0.00 | | | | 1.44 | | | | 63.23 | | | | 12.44 | | | | 0.57 | | | | 76.23 | | | | 23.77 | |
| First Louisiana Bancshares | | | 20.34 | | | | 68.68 | | | | 1.87 | | | | 0.00 | | | | 8.81 | | | | 75.40 | | | | 10.69 | | | | 4.78 | | | | 90.87 | | | | 9.13 | |
| | | | | | | | | | | | | | | | | | | | | | | | | | | | | | | | | | | | | | | | | |
| Comparative Group Average | | | 22.83 | | | | 72.38 | | | | 0.27 | | | | 0.23 | | | | 4.95 | | | | 69.13 | | | | 13.28 | | | | 0.83 | | | | 84.69 | | | | 15.27 | |
| Comparative Group Median | | | 24.09 | | | | 71.08 | | | | 0.19 | | | | 0.00 | | | | 5.22 | | | | 70.53 | | | | 11.92 | | | | 0.73 | | | | 87.95 | | | | 12.05 | |
| | | | | | | | | | | | | | | | | | | | | | | | | | | | | | | | | | | | | | | | | |
| All Public Thrift Average | | | 21.92 | | | | 71.66 | | | | 0.29 | | | | 1.06 | | | | 4.24 | | | | 65.88 | | | | 21.21 | | | | 1.26 | | | | 88.43 | | | | 11.48 | |
| All Public Thrift Median | | | 20.30 | | | | 72.76 | | | | 0.05 | | | | 0.28 | | | | 3.99 | | | | 66.89 | | | | 19.91 | | | | 1.01 | | | | 90.37 | | | | 9.64 | |
| | | | | | | | | | | | | | | | | | | | | | | | | | | | | | | | | | | | | | | | | |
| Comparative Group | | | | | | | | | | | | | | | | | | | | | | | | | | | | | | | | | | | | | | | | |
| CKF Bancorp, Inc. | | | 8.04 | | | | 88.26 | | | | 0.83 | | | | 0.73 | | | | 2.18 | | | | 71.30 | | | | 17.34 | | | | 0.73 | | | | 89.37 | | | | 10.63 | |
| Coddle Creek Financial Corp. | | NA | | | NA | | | NA | | | | 0.00 | | | NA | | | NA | | | | 0.00 | | | NA | | | | 87.40 | | | | 12.60 | |
| East Texas Financial Services, Inc. | | | 33.01 | | | | 60.51 | | | | 0.14 | | | | 1.02 | | | | 5.38 | | | | 52.05 | | | | 36.01 | | | | 1.51 | | | | 89.57 | | | | 10.43 | |
| First Bancshares, Inc. | | | 27.62 | | | | 65.82 | | �� | | 0.30 | | | | 0.11 | | | | 6.45 | | | | 78.86 | | | | 9.50 | | | | 0.44 | | | | 88.81 | | | | 11.19 | |
| FPB Financial Corp. | | | 24.09 | | | | 72.01 | | | | 0.00 | | | | 0.00 | | | | 4.15 | | | | 71.12 | | | | 21.16 | | | | 0.47 | | | | 92.76 | | | | 7.24 | |
| GS Financial Corp. | | | 31.47 | | | | 64.47 | | | | 0.24 | | | | 0.00 | | | | 4.48 | | | | 69.93 | | | | 14.53 | | | | 0.33 | | | | 84.79 | | | | 15.21 | |
| Jefferson Bancshares, Inc. | | | 9.81 | | | | 82.92 | | | | 0.32 | | | | 0.00 | | | | 7.03 | | | | 67.35 | | | | 11.13 | | | | 0.30 | | | | 78.78 | | | | 21.22 | |
| Lexington B&L Financial Corp. | | | 21.58 | | | | 72.83 | | | | 0.03 | | | | 0.58 | | | | 5.22 | | | | 82.01 | | | | 5.55 | | | | 0.95 | | | | 88.50 | | | | 11.50 | |
| Liberty Bancorp, Inc. | | | 23.02 | | | | 70.15 | | | | 0.77 | | | | 0.00 | | | | 6.32 | | | | 70.53 | | | | 14.91 | | | | 0.49 | | | | 85.93 | | | | 14.07 | |
| Louisiana Bancorp, Inc. | | NA | | | NA | | | | 0.00 | | | | 0.00 | | | NA | | | | 53.00 | | | | 12.70 | | | | 1.14 | | | | 66.84 | | | | 33.16 | |
| Osage Bancshares, Inc. | | | 26.84 | | | | 69.89 | | | | 0.04 | | | | 0.00 | | | | 3.32 | | | | 62.73 | | | | 10.24 | | | | 0.84 | | | | 73.80 | | | | 25.79 | |
| United Tennessee Bankshares, Inc. | | NA | | | | 76.91 | | | NA | | | | 0.35 | | | NA | | | | 81.60 | | | | 6.29 | | | | 1.89 | | | | 89.78 | | | | 10.22 | |
Source: Home Federal Bancorp; First Louisiana Bancshares; SNL Financial; Feldman Financial.
Feldman Financial Advisors, Inc.
| Table 42 |
| Regulatory Capital, Credit Risk, and Loan Composition |
| As of or for the Latest Twelve Months Ended December 31, 2007 |
| | | Tier 1 | | | Tier 1 | | | Total | | | | | | | | | | | | | | | | | | Other | | | | |
| | | Leverage | | | Risk- | | | Risk- | | | | | | Total | | | | | | | | | Resid. | | | Real Est. | | | Nonmtg. | |
| | | Capital | | | based | | | based | | | NPLs/ | | | NPAs/ | | | Resrvs./ | | | Resrvs./ | | | Mtgs./ | | | Mtgs./ | | | Loans/ | |
| | | Ratio | | | Capital | | | Capital | | | Loans | | | Assets | | | NPAs | | | Loans | | | Loans | | | Loans | | | Loans | |
| | | | | | | | | | | | | | | | | | | | | | | | | | | | | | | |
| Home Federal Bancorp | | | 21.95 | | | | 78.19 | | | | 78.85 | | | | 0.07 | | | | 0.04 | | | | 451.92 | | | | 0.81 | | | | 84.29 | | | | 13.76 | | | | 1.95 | |
| First Louisiana Bancshares | | | 10.88 | | | | 12.86 | | | | 13.72 | | | | 2.22 | | | | 3.42 | | | | 21.20 | | | | 1.04 | | | | 14.61 | | | | 47.38 | | | | 38.01 | |
| | | | | | | | | | | | | | | | | | | | | | | | | | | | | | | | | | | | | | | | | |
| Comparative Group Average | | | 13.05 | | | | 22.59 | | | | 23.65 | | | | 0.67 | | | | 0.84 | | | | 144.53 | | | | 1.07 | | | | 57.63 | | | | 32.64 | | | | 9.73 | |
| Comparative Group Median | | | 10.98 | | | | 16.96 | | | | 18.41 | | | | 0.49 | | | | 0.66 | | | | 108.80 | | | | 1.07 | | | | 55.41 | | | | 29.81 | | | | 8.17 | |
| | | | | | | | | | | | | | | | | | | | | | | | | | | | | | | | | | | | | | | | | |
| All Public Thrift Average | | | 9.79 | | | | 14.79 | | | | 15.68 | | | | 1.28 | | | | 1.17 | | | | 154.22 | | | | 0.97 | | | | 50.04 | | | | 38.00 | | | | 11.97 | |
| All Public Thrift Median | | | 8.69 | | | | 12.10 | | | | 12.83 | | | | 0.66 | | | | 0.56 | | | | 89.22 | | | | 0.89 | | | | 49.58 | | | | 41.05 | | | | 9.37 | |
| | | | | | | | | | | | | | | | | | | | | | | | | | | | | | | | | | | | | | | | | |
| Comparative Group | | | | | | | | | | | | | | | | | | | | | | | | | | | | | | | | | | | | | | | | |
| CKF Bancorp, Inc. | | | 9.51 | | | | 14.99 | | | | 15.77 | | | | 0.49 | | | | 1.26 | | | | 28.90 | | | | 0.41 | | | | 70.69 | | | | 24.97 | | | | 4.34 | |
| Coddle Creek Financial Corp. | | | 11.11 | | | | 17.49 | | | | 18.22 | | | NA | | | NA | | | NA | | | NA | | | | 86.29 | | | | 9.54 | | | | 4.17 | |
| East Texas Financial Services, Inc. | | | 9.42 | | | | 15.26 | | | | 15.74 | | | | 0.07 | | | | 0.19 | | | | 164.07 | | | | 0.51 | | | | 67.27 | | | | 24.45 | | | | 8.28 | |
| First Bancshares, Inc. | | | 10.11 | | | | 15.97 | | | | 17.20 | | | | 1.59 | | | | 1.36 | | | | 63.62 | | | | 1.30 | | | | 50.10 | | | | 36.82 | | | | 13.08 | |
| FPB Financial Corp. | | | 8.34 | | | | 13.08 | | | | 14.33 | | | | 0.40 | | | | 0.29 | | | | 311.11 | | | | 1.25 | | | | 51.15 | | | | 34.65 | | | | 14.20 | |
| GS Financial Corp. | | | 15.09 | | | | 26.72 | | | | 27.97 | | | | 0.88 | | | | 0.58 | | | | 320.75 | | | | 2.82 | | | | 52.45 | | | | 44.67 | | | | 2.88 | |
| Jefferson Bancshares, Inc. | | | 19.82 | | | | 25.36 | | | | 26.09 | | | | 0.28 | | | | 0.56 | | | | 95.11 | | | | 0.64 | | | | 27.78 | | | | 53.09 | | | | 19.13 | |
| Lexington B&L Financial Corp. | | | 11.19 | | | | 17.45 | | | | 18.60 | | | | 0.96 | | | | 0.73 | | | | 122.48 | | | | 1.22 | | | | 54.57 | | | | 22.64 | | | | 22.79 | |
| Liberty Bancorp, Inc. | | | 10.84 | | | | 13.91 | | | | 15.08 | | | | 1.34 | | | | 1.71 | | | | 50.18 | | | | 1.22 | | | | 22.54 | | | | 69.39 | | | | 8.07 | |
| Louisiana Bancorp, Inc. | | | 24.10 | | | | 60.55 | | | | 61.81 | | | NA | | | NA | | | NA | | | NA | | | | 56.25 | | | | 39.07 | | | | 4.68 | |
| Osage Bancshares, Inc. | | | 17.64 | | | | 33.77 | | | | 34.34 | | | NA | | | NA | | | NA | | | | 0.42 | | | | 73.14 | | | | 16.14 | | | | 10.72 | |
| United Tennessee Bankshares, Inc. | | | 9.37 | | | | 16.47 | | | | 18.64 | | | | 0.00 | | | NA | | | NA | | | | 0.91 | | | | 79.27 | | | | 16.28 | | | | 4.45 | |
Source: Home Federal Bancorp; First Louisiana Bancshares; SNL Financial; Feldman Financial.
Feldman Financial Advisors, Inc.
III. MARKET VALUE ADJUSTMENTS
General Overview
This concluding chapter of the Appraisal identifies certain additional adjustments to the Company’s estimated pro forma market value relative to the Comparative Group selected in Chapter II. The adjustments discussed in this chapter are made from the viewpoints of potential investors, which would include depositors holding subscription rights and unrelated parties who may purchase stock in a community offering. It is assumed that these potential investors are aware of all relevant and necessary facts as they would pertain to the value of the Company relative to other publicly traded thrift institutions and relative to alternative investments.
Our appraised value is predicated on a continuation of the current operating environment for the Company and thrift institutions in general. We also take into account the impact of the acquisition of First Louisiana Bancshares on the Company’s pro forma financial position and operating results. Changes in the Company’s operating performance along with changes in the local and national economy, the stock market, interest rates, the regulatory environment, and other external factors may occur from time to time, often with great unpredictability, which could impact materially the pro forma market value of the Company or thrift stocks in general. Therefore, the Valuation Range provided herein is subject to a more current re-evaluation prior to the actual completion of the Stock Offering.
In addition to the comparative operating fundamentals discussed in Chapter II, it is important to address additional market value adjustments based on certain financial and other criteria, which include, among other factors:
Feldman Financial Advisors, Inc.
| | (1) Earnings Prospects |
| | (2) Financial Condition |
| | (3) Market Area |
| | (4) Management |
| | (5) Dividend Policy |
| | (6) Liquidity of the Issue |
| | (7) Subscription Interest |
| | (8) Stock Market Conditions |
| | (9) Recent Acquisition Activity |
| | (10) New Issue Discount |
Earnings Prospects
Earnings prospects are dependent upon the sensitivity of asset yields and liability costs to changes in market interest rates, the credit quality of assets, the stability of non-interest components of income and expense, and the ability to profitably leverage the balance sheet. Each of the foregoing is an important factor to investors in assessing earnings prospects.
The Company derives its income mainly from the difference or “spread” between the interest earned on loans, securities and other interest-earning assets, and interest paid on deposits, borrowings and other interest-bearing liabilities. Since June 30, 2004 through mid-September 2007, the U.S. Federal Reserve increased its target federal funds rate 17 times, from 1.00% to 5.25%. Since mid-September 2007, the Federal Reserve has reduced rates five times to the current fed funds level of 3.50%. The Federal Reserve has also recently indicated it will continue to cut interest rates as needed in an attempt to stimulate the economy. Generally, during the period of increasing rates, while the federal funds rate and other short-term market interest rates have increased, intermediate- and long-term market interest rates have not increased proportionately. This has led to a “flattening” of the market yield curve, which has even “inverted” during the past two years as short-term rates have exceeded long-term rates over an intermediate maturity horizon. The spread between the yields on the 10-year Treasury note and the two-year note had not exceeded 25 basis points between December 31, 2005 and June 30, 2007, and was actually negative for a period. Beginning in the third quarter of 2007, as shown in the graphic below, short term rates have fallen as the Federal Reserve has lowered the discount rate and the spread between the two-year note and 10-year has widened. At February 25, 2008 the spread was 1.78% (3.91% for the 10-year and 2.13% for the 2-year).
Feldman Financial Advisors, Inc.
Despite steady asset growth, the Company’s profitability in recent years has declined due to the low levels of loans on the Company’s balance sheet and the high concentration of investment securities, which generally carry a lower yield than loans. The Company’s ROA has declined from 0.99% for the fiscal year 2003 to 0.53% for fiscal year 2007. For the six months ended December 31, 2007, the Company reported an ROA of 0.41% compared to 0.55% for the same period in 2006. The Company’s net interest margin has shown a similar decline dramatically over this period, and continues to lag the industry norm due to its asset structure.
Feldman Financial Advisors, Inc.
Due to its more diversified asset mix and greater concentration of loans as a percentage of total assets, First Louisiana has shown growth, if somewhat erratic, in earnings since 2003. First Louisiana Bancshares reported an ROA of 0.70% for the year ended December 31, 2007 compared to an ROA of 0.82% for the year ended December 31, 2003. First Louisiana Bancshares net interest margin has increased over this period, increasing from 4.95% for the year ended December 31, 2003 to 5.01% for the year ended December 31, 2007
The infusion of capital from the Stock Offering will provide the Company with the additional operating flexibility and opportunities, although it will take time for the Company to prudently invest these proceeds and generate significant returns on these funds. In the current business cycle, interest rate risk and asset quality pose the largest threats to the Company’s future earnings growth. While the reinvestment returns from the offering proceeds will augment the Company’s net income, the positive impact is restrained by the added expenses associated with the stock benefit plans. With the infusion of proceeds from the offering plus the income from the acquisition of First Louisiana Bancshares, we expect the Company’s pro forma profitability ratios (ROA, ROE and efficiency ratio) to be more in-line with the Comparative Group’s performance in the near term, although there may be some integration issues which may dampen performance. Thus, we believe no adjustment is warranted for the Company’s near term earnings prospects.
Financial Condition
As noted in Chapter II, with total assets of $128.1 million, Home Federal Bancorp is smaller as compared to the Comparative Group median of $176.2 million. At the pro forma minimum of the offering range combined with the acquisition of First Louisiana Bancshares, the Company is expected to have total assets approximating $267.4 million. The Company has a lower level of net loans as a percentage of total assets at 22.6% compared to the Comparative Group median of 71.1% while having a higher level of cash and securities at 76.1% of total assets as compared to the Comparative Group median of 24.1%. At the minimum of the offering range and assuming the acquisition of First Louisiana Bancshares, while the Company’s ratio loans to total assets on a pro forma basis will increase to 42.2% while its ratio of cash and securities will fall to 47.0%. While an improvement upon the Company’s current ratios, these ratios still lag the Comparative Group.
Feldman Financial Advisors, Inc.
On a pro forma basis assuming the acquisition of first Louisiana Bancshares, the Company will have a lower level of deposits and a similar reliance on borrowed funds as compared to the Comparative Group. While the Company’s deposit portfolio is largely comprised of certificates of deposit, the acquisition of First Louisiana Bancshares deposit base will provide an influx of non-interest bearing deposits. On a pro forma basis, certificates as a percentage of total deposits will decrease from the current level of 80.8% to 59.7% and non-interest bearing deposits will increase to 16.4% of total deposits as compared to the current level of 5.1%. As a percentage of total assets, the Company will have a pro forma deposit ratio of 65.0% and a borrowings-to-assets ratio of 12.3% compared to the Comparative Group medians of 70.5% and 11.9%, respectively.
Home Federal Bancorp’s equity to assets ratio of 23.8% is well above the Comparative Group median of 12.1%. At the pro forma minimum of the offering range, the Company is projected to have a slightly lowered equity-to-assets ratio of 21.8%. Assuming the acquisition of First Louisiana Bancshares, the Company’s ratio of intangibles-to-assets ratio of 0.0% is estimated to increase to 5.0%. As such, on a pro forma basis, the Company’s tangible equity to asset ratio will approximate 17.7%, assuming the minimum of the offering range. The Comparative group has an intangible asset ratio of 0.0%
Feldman Financial Advisors, Inc.
An area of importance for investors is the level of non-performing loans and the level of allowance for loan losses as compared to the level of non-performing assets. The Company’s level of non-performing assets as a percentage of total assets at 0.04% is lower than the Comparative Group median of 0.66%. The Company’s level of reserves as a percentage on non-performing assets at 451.9% is higher than that of Comparative Group median of 108.8%. In comparison, First Louisiana Bancshares reported a level of non-performing assets tot total assets of 3.42% and a level of reserves as a percentage on non-performing assets at 21.2%. On a pro forma basis, the ratio of non-performing assets to total assets is projected to increase to approximately 1.0% and the level of reserves as a percentage of non-performing assets would be 42.1%.
Taken as a whole, and given the Company’s relative balance sheet structure, the level of loans as a percentage of total assets, and the asset quality and reserve levels on a pro forma basis, we believe that a slight downward adjustment is warranted for financial condition.
Market Area
The members of the Comparative Group were drawn from across the southern and mid-western United States and are characterized by a cross-section of market areas that encompass mid-sized metropolitan communities. The Company’s primary market area is Shreveport/Bossier City metropolitan area. Demographic data for the Company’s local market projects income growth below the projected growth for the United States as a whole. The Company’s market area has lower per capita and household income levels than those of the United States. In comparison with the median household income for the counties in which the Comparative Group operates, the median household income for the counties in which the Company operates is below the weighted average median household income by county for the Comparative Group. We believe that market area conditions affecting the Company warrants a slight downward adjustment.
Feldman Financial Advisors, Inc.
Management
Management’s principal challenge is to improve profitability while combining the operations of Home Federal Bancorp and First Louisiana Bancshares while the Company competes in an increasingly competitive financial services environment while dealing with a flat yield curve and a tight credit market.
In connection with the consummation of the merger, Daniel R. Herndon, currently President and Chief Executive Officer of Home Federal Bancorp and Home Federal Savings and Loan, will remain as Chairman of the Board of Home Federal Bancorp and Home Federal Savings and Loan and will be appointed as Chief Executive Officer of Home Federal Bancorp. Ron C. Boudreaux, currently President and Chief Executive Officer of First Louisiana Bancshares and First Louisiana Bank, will be appointed Home Federal Bancorp's President and Chief Operating Officer and President and Chief Executive Officer of Home Federal Savings and Loan. David L. Winkler will be appointed as Vice Chairman of the Boards of Directors of Home Federal Bancorp and Home Federal Savings and Loan. Clyde D. Patterson, currently Executive Vice President of Home Federal Bancorp and Home Federal Savings and Loan Association will be appointed Executive Vice President and Chief Financial Officer of the new holding company and Executive Vice President and Chief Administrative Officer of Home Federal Savings and Loan Association.
Feldman Financial Advisors, Inc.
Mr. Boudreaux organized First Louisiana Bank in 1999 and served as its President and Chief Executive Officer and member of the Board of Directors. Prior to organizing First Louisiana Bank, from March 1987 to August 1998, Mr. Boudreaux served as President and Chief Executive Officer and member of the Board of Directors of City Bank & Trust, Shreveport, Louisiana.
We believe that investors will take into account that the Company is professionally and knowledgeably managed by a team of experienced banking executives. However, while the management team is seasoned, its ability to work together to improve the Company are unproven. Based on these considerations, we believe no adjustment is warranted based on management.
Dividend Policy
Home Federal Bancorp has paid quarterly cash dividends since the third quarter of fiscal 2005. Home Federal Bancorp's current quarterly dividend is $0.06 per share. After completion of the conversion and the merger, dividends will be paid by the new holding company on its outstanding shares of common stock. The Company currently expects that the level of cash dividends per share after the conversion and offering will be substantially consistent with the current amount of dividends of $0.06 per share. A dividend of $0.06 per share would equate to a dividend yield of 2.4%, assuming an offering price of $10.00 per share
Payment of cash dividends has become commonplace among publicly traded thrifts. Ten of the twelve members of the Comparative Group companies currently pay dividends. The median dividend yield of the Comparative Group was 2.24% as of February 25, 2008, and was below the median All Public Thrift dividend yield of 2.91%. As the Company plans to continue its current dividend, we believe that no adjustment is appropriate for this factor.
Feldman Financial Advisors, Inc.
Liquidity of the Issue
Six of the twelve members of the Comparative Group are listed on the NASDAQ National Market, while three companies is listed on OTCBB (Over the Counter) and three companies are traded Pink Sheet. Home Federal Bancorp's common stock is currently quoted on the OTC Bulletin Board and following the Stock Offering, the Company has applied to have the common stock of the new holding company listed for trading on the NASDAQ Global Market. As such, we believe no adjustment is warranted for the liquidity of the issue.
Subscription Interest
Until recently, initial public offerings (“IPOs”) of thrift stocks have attracted a great deal of investor interest. With a total of 27 completed conversions, 2005 marked the third consecutive year of increased volume in the conversion market and represented the most conversions completed in one year since 1999. Conversion volume dropped in 2006 to 18 while there were 27 completed offerings in 2007. Of the 27 completed transactions, nine were standard conversions, seven were second-step MHC conversions and 11 were initial MHC transactions.
The Company has retained the services of Sandler O’Neill & Partners, L.P. to assist in the marketing and sale of the Stock Offering. The Company also has an employee stock ownership plan (“ESOP) that will purchase common stock in the offering. The Company’s Board members and executive officers currently anticipate purchasing 20,300 shares representing an aggregate amount of $203,000 of common stock.
Generally, individuals may purchase no more than $400,000 (40,000 shares)of common stock offered in any single purchase priority category. The maximum amount of shares that a person together with any associates or group of persons acting in concert with such person may subscribe for or purchase in the offering is $1.0 million (100,000 shares) of common stock. In addition, the number of shares of Home Federal Bancorp common stock that an individual may purchase in the offering individually, and together with associates or persons acting in concert, plus any exchange shares received, may not exceed 5% of the total shares of Home Federal Bancorp common stock to be issued and outstanding at the completion of the conversion and offering.
Feldman Financial Advisors, Inc.
Notwithstanding the demand for thrift IPOs, recent second-step offerings have not produced strong demand characteristics. Potential investors have the opportunity to purchase existing traded stock before the offering in the public markets. Further, the aftermarket demand for shares in second-step offerings has not been as strong as standard or MHC thrift IPOs. For second-step offerings completed since January 1, 2005, the median one-month after-market price change is 0.0% and a negative 0.1% for offerings completed after January 1, 2007. After this consideration of historical experience, we believe a downward adjustment is warranted for the likely subscription interest.
Stock Market Conditions
Table 43 graphically displays the performance of the SNL Thrift Index of all publicly traded thrifts and the SNL Thrift Index (of thrifts with assets less than $250 million) as compared to the Standard & Poor’s 500-Stock Index (“S&P 500”) since year-end 2004. The SNL Thrift Index and SNL Index of Less Than $250 Million thrifts have both significantly underperformed the broader stock index, declining 31.5% and 17.9%, respectively, during the period from December 31, 2004 to February 25, 2008, as compared to the S&P 500 increasing by 13.2%. During calendar 2007, the SNL Thrift Index declined 42.9% while the SNL Index of Thrifts Less Than $250 Million in assets declined by 9.6%, compared to a 4.2% increase in the S&P 500.
Feldman Financial Advisors, Inc.
The Thrift Industry had seen a steady recovery since the 1990s. This has been fueled primarily by the demand for housing loans, as the real estate sector of the economy has flourished. The thrift industry posted record profits of $16.4 billion in the calendar year ended December 31, 2005. Since December 31, 2006, given the general uncertainties about the pace of economic recovery, deterioration in the sub-prime and Alt-A mortgage markets, rising oil prices, the continuing war in Iraq, and the flat to inverted yield curve, the performance of he thrift industry has deteriorated. The thrift industry posted a record loss of $5.24 billion for the fourth quarter of 2007. Net income was $2.87 billion for the year 2007, down from $15.85 billion in 2006.
Recent Acquisition Activity
Acquisition speculation is one factor underpinning the prices of thrift stocks. Table 44 summarizes recent acquisition activity involving banks and thrifts based in Louisiana. Since January 1, 2007, there have been six acquisitions involving Louisiana financial institutions, two of which were thrift institutions. Overall acquisition valuation ratios for Louisiana financial institutions were comparable to the premiums reported nationwide. The most recent transaction was announced on November 20, 2007 and involved a thrift, Dryades Bancorp Inc., which announced that it would be acquired by First NBC Bank Holding Company. We believe that any speculative interest may be reflected to some degree in the general trading values of thrift stocks and encompass members of the Comparative Group as well. However, since converting thrifts are subject to a three-year regulatory moratorium from being acquired, acquisition speculation in Home federal Bancorp’s stock should tend to be less compared to the stocks of the Comparative Group companies.
Feldman Financial Advisors, Inc.
Comparative Stock Index Performance
December 31, 2004 to February 25, 2008
(Index Value 100 = 12/31/2004)
Feldman Financial Advisors, Inc.
Marketability Discount
A “marketability” discount that reflects investor concerns and investment risks inherent in IPOs and second-step offerings is a factor to be considered for purposes of valuing converting thrifts. The magnitude of the new issue discount typically expands during periods of declining thrift stock prices as investors require larger inducements, and narrows during strong market conditions. Recently, the after-market conditions for second-step offerings have been generally unfavorable. Table 45 presents a summary of thrifts that have completed second-stage stock offerings since January 1, 2005.
There were a total of 18 stock offerings during 2006 and 27 in 2007. Of these past transactions, four of the 2006 conversions and seven of the 2007 conversions involved second-step offerings. The after-market performance of second-step thrift conversions has been restrained. Of the 16 second-step stock offerings completed since January 1, 2005, the median first day price increase was 2.8%, with a median price increase of 0.4% and 0.0% for the one-week and one-month periods, respectively. Of the eleven second-step offerings since January 1, 2006, five are trading at a discount to their offering price.
The most recently completed second-stage offering was that of Home Federal Bancorp, a $700 million institution headquartered in Nampa, Idaho. Home Federal completed its offering of $85.8 million of net proceeds on December 20, 2007. The transaction priced at the bottom of the valuation range, with a pro forma price-to-book ratio of 88.3%. Home is currently trading approximately 15.1% above its offering price.
Feldman Financial Advisors, Inc.
Table 44
Summary of Recent Loiusiana Acquisition Activity
Transactions Announced Since January 1, 2007
| | | | | | | | | | Seller's Prior Financial Data | | | | | | | | | | Offer Value to | |
| | | | | | | | | | Total | | | Equity/ | | | YTD | | | YTD | | | | | | | Offer | | | Book | | | Tang. | | | LTM | | | Total | |
| | | | | | | | B/T | | | Assets | | | Assets | | | ROA | | | ROE | | Date | | Status | | | Value | | | Value | | | Book | | | EPS | | | Assets | |
| Buyer | | State | | Seller | | | (1) | | | ($Mil.) | | | (%) | | | (%) | | | (%) | | Anncd. | | | (2) | | | ($Mil.) | | | (%) | | | (%) | | | (x) | | | (%) | |
| | | | | | | | | | | | | | | | | | | | | | | | | | | | | | | | | | | | | | | | | |
| Average | | | | | | | | | | | 84.9 | | | | 9.14 | | | | 1.25 | | | | 12.07 | | | | | | | | | 11.1 | | | | 174.8 | | | | 179.4 | | | | 22.90 | | | | 14.62 | |
| Median | | | | | | | | | | | 70.8 | | | | 8.26 | | | | 1.32 | | | | 12.92 | | | | | | | | | 10.9 | | | | 169.9 | | | | 183.8 | | | | 16.91 | | | | 14.23 | |
| | | | | | | | | | | | | | | | | | | | | | | | | | | | | | | | | | | | | | | | | | | | | | | | | | |
| First NBC Bank Holding Co. | | LA | | Dryades Bancorp Inc. | | | T | | | | 80.2 | | | | 3.49 | | | NA | | | NA | | 11/20/07 | | | P | | | | 2.9 | | | | 103.3 | | | | 103.3 | | | NM | | | | 3.60 | |
| First Guaranty Bancshares Inc. | | LA | | First Community Holding Co. | | | B | | | | 143.8 | | | | 7.25 | | | | 1.22 | | | | 17.40 | | 11/02/07 | | | P | | | | 19.0 | | | | 274.6 | | | | 274.6 | | | | 14.16 | | | | 13.22 | |
| Caldwell Holding Co. | | LA | | Citizens Progressive Bank | | | B | | | | 41.1 | | | | 11.08 | | | | 2.05 | | | | 18.66 | | 10/10/07 | | | C | | | | 8.7 | | | | 190.8 | | | | 190.8 | | | | 15.90 | | | | 21.15 | |
| Saint Martin Bancshares Inc. | | LA | | Cmnty Bncp of Louisiana Inc. | | | B | | | | 61.5 | | | | 16.48 | | | | 1.41 | | | | 8.43 | | 08/15/07 | | | C | | | | 15.1 | | | | 149.0 | | | | 176.7 | | | | 17.91 | | | | 24.56 | |
| Fidelity Homestead SB | | LA | | Your Bank | | | B | | | | 51.2 | | | | 7.48 | | | NA | | | NA | | 08/10/07 | | | C | | | | 7.8 | | | | 203.8 | | | | 203.8 | | | NM | | | | 15.24 | |
| First Guaranty Bancshares Inc. | | LA | | Homestead Bancorp Inc. | | | T | | | | 131.9 | | | | 9.04 | | | | 0.33 | | | | 3.80 | | 01/04/07 | | | C | | | | 13.1 | | | | 127.0 | | | | 127.0 | | | | 43.63 | | | | 9.92 | |
(1) B=bank; T=thrift.
(2) P=pending; C=completed.
Source: SNL Financial.
Feldman Financial Advisors, Inc.
Table 45
Summary of Recent Second Step Stock Offerings
Transactions Completed Since 2005
| | | | | | | | | | | Price/Pro Forma | | | | | | | | | After-Market Price Chg. | | | Change | |
| | | | | | | | Net | | | Book | | | Tang. | | | IPO | | | 2/25/08 | | | One | | | One | | | One | | | Thru | |
| | | | | Stock | IPO | | Proceeds | | | Value | | | Book | | | Price | | | Price | | | Day | | | Week | | | Month | | | 2/25/08 | |
| Company | | State | | Exchange | Date | | ($Mil.) | | | (%) | | | (%) | | | ($) | | | ($) | | | (%) | | | (%) | | | (%) | | | (%) | |
| | | | | | | | | | | | | | | | | | | | | | | | | | | | | | | | | |
| Average | | NA | | NA | NA | | | 439.8 | | | | 102.3 | | | | 105.2 | | | NA | | | NA | | | | 2.6 | | | | 1.6 | | | | 0.3 | | | | 3.1 | |
| Median | | NA | | NA | NA | | | 49.6 | | | | 102.1 | | | | 104.8 | | | NA | | | NA | | | | 2.8 | | | | 0.4 | | | | 0.0 | | | | 1.9 | |
| | | | | | | | | | | | | | | | | | | | | | | | | | | | | | | | | | | | | | | | |
| Home Federal Bancorp, Inc. | | ID | | NASDAQ | 12/20/07 | | | 85.8 | | | | 88.3 | | | | 88.3 | | | | 10.00 | | | | 11.51 | | | | (1.2 | ) | | | 0.2 | | | | 3.0 | | | | 15.1 | |
| United Financial Bancorp, Inc. | | MA | | NASDAQ | 12/04/07 | | | 82.1 | | | | 80.4 | | | | 80.5 | | | | 10.00 | | | | 11.83 | | | | 3.0 | | | | 4.5 | | | | 7.7 | | | | 18.3 | |
| North Penn Bancorp, Inc. | | PA | | OTCBB | 10/02/07 | | | 6.7 | | | | 79.0 | | | | 79.0 | | | | 10.00 | | | | 8.50 | | | | 2.6 | | | | 0.5 | | | | (0.5 | ) | | | (15.0 | ) |
| Abington Bancorp, Inc. | | PA | | NASDAQ | 06/28/07 | | | 121.4 | | | | 102.5 | | | | 102.5 | | | | 10.00 | | | | 10.07 | | | | (4.0 | ) | | | (3.1 | ) | | | (4.8 | ) | | | 0.7 | |
| People's United Financial, Inc. | | CT | | NASDAQ | 04/16/07 | | | 2,915.9 | | | | 143.3 | | | | 147.0 | | | | 20.00 | | | | 17.20 | | | | 3.8 | | | | 3.7 | | | | (0.1 | ) | | | (14.0 | ) |
| Osage Bancshares, Inc. | | OK | | NASDAQ | 01/18/07 | | | 21.7 | | | | 103.3 | | | | 103.3 | | | | 10.00 | | | | 9.35 | | | | (0.5 | ) | | | 0.0 | | | | (6.8 | ) | | | (6.5 | ) |
| Westfield Financial, Inc. | | MA | | NASDAQ | 01/04/07 | | | 170.1 | | | | 111.7 | | | | 111.7 | | | | 10.00 | | | | 10.28 | | | | 7.0 | | | | 7.2 | | | | 9.0 | | | | 2.8 | |
| Citizens Community Bancorp, Inc. | | WI | | NASDAQ | 10/31/06 | | | 46.5 | | | | 93.2 | | | | 103.1 | | | | 10.00 | | | | 9.10 | | | | 4.7 | | | | (1.0 | ) | | | (2.5 | ) | | | (9.0 | ) |
| Liberty Bancorp, Inc. | | MO | | NASDAQ | 07/24/06 | | | 25.0 | | | | 101.7 | | | | 101.7 | | | | 10.00 | | | | 10.65 | | | | 2.5 | | | | 0.7 | | | | 0.9 | | | | 6.5 | |
| First Clover Leaf Financial Corp. | | IL | | NASDAQ | 07/11/06 | | | 40.5 | | | | 96.9 | | | | 110.9 | | | | 10.00 | | | | 10.10 | | | | 3.9 | | | | 7.0 | | | | 10.2 | | | | 1.0 | |
| Monadnock Bancorp, Inc. | | NH | | OTCBB | 06/29/06 | | | 4.4 | | | | 109.4 | | | | 112.4 | | | | 8.00 | | | | 6.20 | | | | 0.0 | | | | 0.0 | | | | (13.8 | ) | | | (22.5 | ) |
| New England Bancshares, Inc. | | CT | | NASDAQ | 12/29/05 | | | 26.5 | | | | 96.3 | | | | 106.5 | | | | 10.00 | | | | 11.09 | | | | 6.6 | | | | 7.0 | | | | 7.0 | | | | 10.9 | |
| American Bancorp of New Jersey, Inc. | | NJ | | NASDAQ | 10/06/05 | | | 86.0 | | | | 113.3 | | | | 113.3 | | | | 10.00 | | | | 10.53 | | | | 1.6 | | | | (2.0 | ) | | | 0.1 | | | | 5.3 | |
| Hudson City Bancorp, Inc. | | NJ | | NASDAQ | 06/07/05 | | | 3,337.4 | | | | 122.1 | | | | 122.1 | | | | 10.00 | | | | 16.36 | | | | 9.6 | | | | 10.7 | | | | 15.5 | | | | 63.6 | |
| First Federal of Northern Michigan Bancorp, Inc. | | MI | | NASDAQ | 04/01/05 | | | 14.7 | | | | 89.8 | | | | 94.3 | | | | 10.00 | | | | 7.50 | | | | (1.2 | ) | | | (7.5 | ) | | | (14.8 | ) | | | (25.0 | ) |
| Rome Bancorp, Inc. | | NY | | NASDAQ | 03/30/05 | | | 52.7 | | | | 106.3 | | | | 106.3 | | | | 10.00 | | | | 11.74 | | | | 3.2 | | | | (1.8 | ) | | | (5.6 | ) | | | 17.4 | |
Source: SNL Financial.
United Financial Bancorp, a $1.1 billion thrift headquartered in West Springfield, MA also recently completed a second-stage conversion. United Financial, which completed its offering of $82.1 million of net proceeds on December 4, 2007, near the bottom of the valuation range with a pro forma price-to-book value ratio of 80.4%. United is currently trading approximately 18.3% above its offering price.
Another recently completed second stage conversion was North Penn Bancorp, which completed its offering of $6.7 million of net proceeds on October 2, 2007. The North Penn transaction closed at the bottom of the valuation range with a pro forma price-to-book value ratio of 79.0%. North Penn is currently trading approximately 15% below its offering price.
Abington Bancorp, a $950 million thrift with 17 branches headquartered outside of Philadelphia, completed a second-step conversion on June 28, 2007. This transaction priced near the bottom of the offering valuation range at 102.5% of pro forma book value and closed down 4.0% in its first day of trading and currently trades at approximately its offering price.
Feldman Financial Advisors, Inc.
Thrift conversions continue to be priced at discounts to publicly traded thrifts. This is due to the relatively high pro forma equity ratios, expected low returns on equity, and the uncertainty regarding the prospects of an institution to adeptly leverage the balance sheet in the currently low interest rate environment. Moreover, the mixed after-market performance of recent thrift second-step offerings provides added reason to continue to factor in a “marketability” discount for valuation of current thrift IPOs.
Investors are aware that at initial pro forma price-to-book ratios approaching the current trading range of a majority of public thrifts, price-to-earnings ratios of converting thrifts would be excessive, returns on equity very low, and capital levels dramatically high. Based upon the price-to-book ratio measure, thrift conversions recently have been discounted by 40% to 50% relative to the overall thrift trading market on a fully converted basis.
Adjustments Conclusion
Based upon our analysis, we believe that a downward adjustment is appropriate for financial condition, market area, subscription interest and market conditions, but do not believe that any of the other previously described areas specifically analyzed result in an upward or downward adjustment relative to the Comparative Group.
Valuation Approach
In determining the estimated pro forma market value of the Company, we have employed the comparative company approach and considered the following pricing ratios: price-to-earnings per share (“P/E”), price-to-book value per share (“P/B”), price-to-tangible book value per share (“P/TB”), and price-to-assets (“P/A”). As the Company is anticipating acquiring First Louisiana Bancshares subsequent to the Offering, we have calculated our ratios using a pro forma combined company. Table 38 displays the market price valuation ratios of the Comparative Group as of February 25, 2008. Averages for the All Public Thrift aggregate are also shown in Table 46. Exhibit IV displays the pro forma assumptions and calculations utilized in analyzing the Company’s valuation ratios. In reaching our conclusions of the Valuation Range, we evaluated the relationship of the Company’s pro forma valuation ratios relative to the Comparative Group valuation data and recent thrift second-step valuations.
Feldman Financial Advisors, Inc.
Investors continue to make decisions to purchase thrift conversion stocks and more seasoned thrift issues based upon consideration of core earnings profitability, P/B and P/TB comparisons. The Company’s pro forma net income for the six-month period ending December 31, 2007 is $523,000.
We have determined the midpoint of the valuation range, on a fully converted basis to be $18.0 million for the new shares to be issued. This midpoint valuation produces a minimum valuation of $15.3 million, a maximum of $20.7 million and an adjusted maximum of $23.8 million.
Assuming the shares to be exchanged and to be issued to First Louisiana Bancshares, this range results in a pro forma valuation for the Company to be $41.8 million. This midpoint valuation produces a minimum valuation of $37.5 million, a maximum of $46.0 million and an adjusted maximum of $51.0 million. Assuming the Company cannot sell the full allotment of shares at the minimum, the Company may issue up to 15% of the offering to shareholders of First Louisiana Bancshares, resulting in an adjusted minimum valuation of $35.2 million.
The average P/B ratio for the Comparative Group was 95.4% and the median was 97.9%. At the midpoint value of $41.8 million based on the assumptions summarized in Exhibit IV, we have determined a pro forma price-to-book ratio of 68.6% for the Company. Employing a range of 15% above and below the midpoint, the resulting minimum value of $37.5 million reflects a 64.4% P/B ratio and the resulting maximum value of approximately $46.0 million reflects a 72.9% P/B ratio. The adjusted minimum, an additional 15.0% below the minimum, is positioned at approximately $35.2 million and a P/B ratio of 62.9%. The adjusted maximum, an additional 15.0% above the maximum, is positioned at approximately $51.0 million and a P/B ratio of 77.3%.
Feldman Financial Advisors, Inc.
The average P/TB ratio for the Comparative Group was 99.1% and the median was 99.7%. At the midpoint value, we have determined a pro forma price-to-tangible book ratio of 88.2% for the Company. Employing a range of 15% above and below the midpoint, the resulting minimum value reflects a 83.6% P/TB ratio and the resulting maximum value reflects a 92.4% P/TB ratio. The adjusted minimum, an additional 15.0% below the minimum, results in a P/TB ratio of 82.6% and the adjusted maximum, an additional 15.0% above the maximum, results in a P/B ratio of 96.8%.
At the midpoint price-to-book valuation ratio, the Company is valued significantly below the P/B 102.1% median of recent second step stock offerings as displayed in Table 37. At the midpoint price-to-tangible-book valuation ratio of 88.2%, the Company is valued below the 104.8% price-to-tangible-book ratio exhibited by the companies displayed in Table 37. At the minimum of the offering range, the P/B and P/TB ratios for the Company are 64.4% and 83.6%, respectively.
The Company’s pro forma midpoint P/B ratio of 68.9% reflects a 30.50% discount to the Comparative Group median P/B ratio of 99.1% and a 28.8% discount to the All Public Thrift median of 96.7%. At the minimum, the Company’s pro forma P/B ratio of 64.4% reflects a 35.0% discount to the Comparative Group median and a 33.3% discount to the All Public Thrift median.
Feldman Financial Advisors, Inc.
The Company’s pro forma midpoint P/TB ratio of 88.2% reflects an 11.5% discount to the Comparative Group median P/TB ratio of 99.7% and a 15.2% discount to the All Public Thrift median of 104.1%. At the minimum, the Company’s pro forma P/TB ratio of 83.6% reflects a 16.2% discount to the Comparative Group median and a 19.7% discount to the All Public Thrift median.
The Company’s pro forma midpoint P/E ratio of 45.5x reflects a 79.2% premium to the Comparative Group median P/E ratio of 25.4x and a 186.0% premium to the All Public Thrift median of 15.9x. At the minimum, the Company’s pro forma P/E ratio of 41.7x reflects a 64.3% premium to the Comparative Group median and a 162.1% premium to the All Public Thrift median.
Based on the P/A measure, the Company’s pro forma midpoint of $41.8 million reflects a corresponding valuation ratio of 15.5%, ranging from 13.3% at the adjusted minimum to 14.0%, 16.9% and 18.5% at the minimum, maximum and adjusted maximum, respectively. Pricing at the midpoint, the P/A ratio is at a 34.6% premium to the Comparative Group median of 11.5%, and a 65.0% premium to the All Public Thrift median of 9.4%.
Home Federal Bancorp, in its current mutual holding company ownership structure, has public shares outstanding and is currently traded OTCBB. As such, it may be an indicator of investor interest in the Company’s conversion stock and therefore received some consideration in our valuation. Based on Home Federal Bancorp’s current trading level of $9.22 as of February 25, 2008, its market capitalization approximates $31.1 million or $2.6 million more than the midpoint of the valuation range (excluding the shares issued to First Louisiana Bancshares) and was considered in the valuation process. Home Federal Bancorp’s market price has ranged from $9.22 to $10.30 per share Since January 1, 2007. However, since the conversion stock will have different characteristics than the minority shares, and since pro forma information has not been publicly disseminated to date, the current market value of Home Federal Bancorp’s stock was somewhat discounted herein.
Feldman Financial Advisors, Inc.
Valuation Conclusion
It is our opinion that, as of February 25, 2008, the aggregate estimated pro forma market value of the Company on a fully converted basis was within the Valuation Range of $37,488,515 to $46,044,272 with a midpoint of $41,766,394. The Valuation Range was based upon a 15% decrease from the midpoint to determine the minimum and a 15% increase to establish the maximum. An additional 15% increase above the maximum results in an adjusted maximum of $50,963,832. An additional 15% decrease below the minimum results in an adjusted minimum of $35,193,515. Exhibit IV displays the assumptions and calculations utilized in determining the Company’s estimated pro forma market value on a fully converted basis.
Feldman Financial Advisors, Inc.
Table 46
Pro Forma Comparative Valuation Analysis
Home Federal Bancorp and the Comparative Group
Computed from Market Price Data as of February 25, 2008
| | | | | | | | | | | | | | | | | | | | | | | | | | | | | | | |
| | | Closing | | | Total | | | Price/ | | | Price/ | | | Price/ | | | Price/ | | | Price/ | | | Total | | | Tang. | | | Current | |
| | | Stock | | | Market | | | LTM | | | Core | | | Book | | | Tang. | | | Total | | | Equity/ | | | Equity/ | | | Dividend | |
| | | Price | | | Value | | | EPS | | | EPS | | | Value | | | Book | | | Assets | | | Assets | | | Assets | | | Yield | |
| Company | | ($) | | | ($Mil.) | | | (x) | | | (x) | | | (%) | | | (%) | | | (%) | | | (%) | | | (%) | | | (%) | |
| | | | | | | | | | | | | | | | | | | | | | | | | | | | | | | |
| Home Federal Bancorp, Inc. | | | | | | | | | | | | | | | | | | | | | | | | | | | | | | |
| Pro Forma Adjusted Minimum | | $ | 10.00 | | | | 35.2 | | | | 38.5 | | | | 45.5 | | | | 62.9 | | | | 82.6 | | | | 13.27 | | | | 21.08 | | | | 16.91 | | | | 2.40 | |
| Pro Forma Minimum | | $ | 10.00 | | | | 37.5 | | | | 41.7 | | | | 45.5 | | | | 64.4 | | | | 83.6 | | | | 14.02 | | | | 21.75 | | | | 17.65 | | | | 2.40 | |
| Pro Forma Midpoint | | $ | 10.00 | | | | 41.8 | | | | 45.5 | | | | 50.0 | | | | 68.9 | | | | 88.2 | | | | 15.47 | | | | 22.47 | | | | 18.45 | | | | 2.40 | |
| Pro Forma Maximum | | $ | 10.00 | | | | 46.0 | | | | 50.0 | | | | 55.6 | | | | 72.9 | | | | 92.4 | | | | 16.90 | | | | 23.17 | | | | 19.23 | | | | 2.40 | |
| Pro Forma Adjusted Maximum | | $ | 10.00 | | | | 51.0 | | | | 50.0 | | | | 62.5 | | | | 77.3 | | | | 96.8 | | | | 18.52 | | | | 23.97 | | | | 20.10 | | | | 2.40 | |
| | | | | | | | | | | | | | | | | | | | | | | | | | | | | | | | | | | | | | | | | |
| Comparative Group Average | | NA | | | | 30.3 | | | | 30.6 | | | | 33.8 | | | | 95.4 | | | | 97.9 | | | | 12.87 | | | | 15.27 | | | | 15.06 | | | | 2.30 | |
| Comparative Group Median | | NA | | | | 19.8 | | | | 25.4 | | | | 25.4 | | | | 99.1 | | | | 99.7 | | | | 11.50 | | | | 12.05 | | | | 11.85 | | | | 2.24 | |
| | | | | | | | | | | | | | | | | | | | | | | | | | | | | | | | | | | | | | | | | |
All Public Thrift Average (1) | | NA | | | | 538.1 | | | | 16.8 | | | | 16.9 | | | | 98.8 | | | | 114.9 | | | | 11.27 | | | | 11.48 | | | | 10.64 | | | | 2.67 | |
All Public Thrift Median (1) | | NA | | | | 90.5 | | | | 15.9 | | | | 15.8 | | | | 96.7 | | | | 104.1 | | | | 9.38 | | | | 9.64 | | | | 8.29 | | | | 2.91 | |
| | | | | | | | | | | | | | | | | | | | | | | | | | | | | | | | | | | | | | | | | |
| Comparative Group | | | | | | | | | | | | | | | | | | | | | | | | | | | | | | | | | | | | | | | | |
| CKF Bancorp, Inc. | | $ | 12.00 | | | | 15.8 | | | | 15.4 | | | | 15.4 | | | | 97.4 | | | | 104.6 | | | | 10.36 | | | | 10.63 | | | | 9.97 | | | | 6.00 | |
| Coddle Creek Financial Corp. | | $ | 21.00 | | | | 12.8 | | | | 22.1 | | | NA | | | | 65.4 | | | | 65.4 | | | | 8.25 | | | | 12.60 | | | | 12.60 | | | | 4.76 | |
| East Texas Financial Services, Inc. | | $ | 14.75 | | | | 19.3 | | | | 61.5 | | | | 61.5 | | | | 86.8 | | | | 96.2 | | | | 9.05 | | | | 10.43 | | | | 9.51 | | | | 1.36 | |
| First Bancshares, Inc. | | $ | 18.05 | | | | 28.0 | | | | 54.7 | | | | 69.9 | | | | 102.7 | | | | 103.7 | | | | 11.50 | | | | 11.19 | | | | 11.10 | | | | 0.00 | |
| FPB Financial Corp. | | $ | 38.50 | | | | 13.6 | | | | 11.0 | | | | 11.5 | | | | 112.2 | | | | 112.2 | | | | 8.13 | | | | 7.24 | | | | 7.24 | | | | 1.45 | |
| GS Financial Corp. | | $ | 16.00 | | | | 20.3 | | | | 26.2 | | | NA | | | | 71.8 | | | | 71.8 | | | | 10.91 | | | | 15.21 | | | | 15.21 | | | | 2.50 | |
| Jefferson Bancshares, Inc. | | $ | 11.54 | | | | 72.0 | | | | 55.0 | | | | 55.0 | | | | 99.7 | | | | 99.7 | | | | 21.15 | | | | 21.22 | | | | 21.22 | | | | 2.08 | |
| Lexington B&L Financial Corp. | | $ | 25.05 | | | | 15.3 | | | | 16.5 | | | | 16.5 | | | | 101.1 | | | | 106.5 | | | | 11.63 | | | | 11.50 | | | | 10.98 | | | | 2.40 | |
| Liberty Bancorp, Inc. | | $ | 10.65 | | | | 43.6 | | | | 25.4 | | | | 25.4 | | | | 99.1 | | | | 99.1 | | | | 13.95 | | | | 14.07 | | | | 14.07 | | | | 0.94 | |
| Louisiana Bancorp, Inc. | | $ | 11.54 | | | | 73.2 | | | NA | | | NA | | | NA | | | NA | | | NA | | | | 33.16 | | | | 33.16 | | | | 0.00 | |
| Osage Bancshares, Inc. | | $ | 9.35 | | | | 33.7 | | | | 26.0 | | | | 26.0 | | | | 95.5 | | | | 95.5 | | | | 24.64 | | | | 25.79 | | | | 25.79 | | | | 3.64 | |
| United Tennessee Bankshares, Inc. | | $ | 18.95 | | | | 16.3 | | | | 23.4 | | | | 23.2 | | | | 117.8 | | | | 122.0 | | | | 12.04 | | | | 10.22 | | | | 9.91 | | | | 2.43 | |
(1) Excludes mutual holding companies and companies subject to announced acquisitions.
Source: Home Federal Bancorp, Inc.; SNL Financial; Feldman Financial.
Feldman Financial Advisors, Inc.
Exhibit I
Background of Feldman Financial Advisors, Inc.
Overview of Firm
Feldman Financial Advisors provides consulting and advisory services to financial institutions and mortgage companies in the areas of corporate valuations, mergers and acquisitions, strategic planning, branch sales and purchases, developing and implementing regulatory business and capital plans, and expert witness testimony and analysis. Our senior staff members have been involved in the stock conversion process since 1982 and have valued more than 350 converting institutions.
Feldman Financial Advisors was incorporated in February 1996 by a group of consultants who were previously associated with CS First Boston and Kaplan Associates. Each of the principals at Feldman Financial Advisors has more than 10 years experience in consulting and all were officers of their prior firm. Our senior staff collectively has worked with more than 1,000 banks, thrifts and mortgage companies nationwide. The firm’s office is located in Washington, D.C.
Background of Senior Professional Staff
Trent Feldman - - President. Trent is a nationally recognized expert in providing strategic advice to and valuing service companies, and advising on mergers and acquisitions. Trent was with Kaplan Associates for 14 years and was one of three founding principals at that firm. Trent also has worked at the Federal Home Loan Bank Board and with the California legislature. Trent holds Bachelors and Masters Degrees from the University of California at Los Angeles.
Peter Williams - - Principal. Peter specializes in merger and acquisition analysis, stock and other corporate valuations, strategic business plans and retail delivery analysis. Peter was with Kaplan Associates for 13 years. Peter also served as a Corporate Planning and Development Analyst with the Wilmington Trust Company in Delaware. Peter holds a BA in Economics from Yale University and an MBA in Finance and Investments from George Washington University.
Michael Green - - Principal. Mike is an expert in mergers and acquisition analysis, financial institution and corporate valuations, and strategic and business plans. During Mike’s 10 years at Kaplan Associates, his experience also included business restructurings, litigation support, mark-to-market analysis, and goodwill valuations. Mike holds a BA in Finance and Economics from Rutgers College.
Greg Izydorczyk - Senior Vice President. Greg specializes in merger and acquisition analysis and corporate valuations and also has experience in mark-to-market analysis and business plans. Greg was with Kaplan Associates for three years. Previous, Greg worked as a Senior Auditor for First Virginia Bank and Integra Financial and as a Financial Analyst with Airbus Industrie of N.A. Greg holds a BS in Finance from Pennsylvania State University and an MBA in Finance from the Katz Graduate School, University of Pittsburgh.
Feldman Financial Advisors, Inc.
Exhibit II-1
Home Federal Bancorp
Consolidated Balance Sheet
As of June 30, 2006 and 2007 and December 31, 2007
| | | December 31, | | | June 30, | |
| | | 2007 | | | 2007 | | | 2006 | |
| | | (Unaudited) | | | | | | | |
| | | (in thousands) | |
| Assets: | | | | | | | | | |
| Cash and cash equivalents | | $ | 14,958 | | | $ | 3,972 | | | $ | 4,930 | |
| Investment securities available for sale | | | 81,163 | | | | 83,752 | | | | 83,694 | |
| Investment securities held to maturity | | | 1,331 | | | | 1,408 | | | | 1,425 | |
| Loans held for sale | | | 962 | | | | 1,478 | | | | - | |
| Loans receivable, net | | | 27,789 | | | | 25,211 | | | | 20,866 | |
| Accrued interest receivable | | | 491 | | | | 499 | | | | 465 | |
| Premises and equipment, net | | | 907 | | | | 923 | | | | 948 | |
| Deferred tax asset | | | 284 | | | | 1,476 | | | | 1,597 | |
| Other assets | | | 166 | | | | 66 | | | | 75 | |
| Real estate acquired through foreclosure | | | 33 | | | | - | | | | - | |
| Total Assets | | $ | 128,084 | | | $ | 118,785 | | | $ | 114,000 | |
| | | | | | | | | | | | | |
| Liabilities and Stockholders' Equity | | | | | | | | | | | | |
| Liabilities | | | | | | | | | | | | |
| Deposits | | $ | 80,986 | | | $ | 77,710 | | | $ | 71,279 | |
| Advances by borrowers for taxes and insurance | | | 118 | | | | 196 | | | | 219 | |
| Advances from FHLB Dallas | | | 15,933 | | | | 12,368 | | | | 13,417 | |
| Other accrued expenses and liabilities | | | 606 | | | | 699 | | | | 546 | |
| Total liabilities | | | 97,643 | | | | 90,973 | | | | 85,461 | |
| | | | | | | | | | | | | |
| Retained Earnings: | | | | | | | | | | | | |
| Preferred stock | | | - | | | | - | | | | - | |
| Common stock | | | 14 | | | | 14 | | | | 14 | |
| Additional paid in capital | | | 13,541 | | | | 13,509 | | | | 13,445 | |
| Treasury stock | | | (1,809 | ) | | | (1,771 | ) | | | (211 | ) |
| Unearned ESOP stock | | | (969 | ) | | | (997 | ) | | | (1,054 | ) |
| Unearned RRP trust stock | | | (395 | ) | | | (551 | ) | | | (688 | ) |
| Retained earnings | | | 20,565 | | | | 20,449 | | | | 20,149 | |
| Accumulated other comprehensive income (loss) | | | (506 | ) | | | (2,841 | ) | | | (3,116 | ) |
| Total Stockholders' equity | | | 30,441 | | | | 27,812 | | | | 28,539 | |
| | | | | | | | | | | | | |
| Total Liabilities and Stockholders' Equity | | $ | 128,084 | | | $ | 118,785 | | | $ | 114,000 | |
Source: Home Federal Bancorp, audited and unaudited financial statements.
Feldman Financial Advisors, Inc.
Exhibit II-2
Home Federal Bancorp
Consolidated Income Statements
For the Years Ended June 30, 2006 to 2007
And the Six Months Ended December 31, 2006 and 2007
| | | Six Months Ended | | | Years Ended | |
| | | December 31, | | | June 30, | |
| | | 2007 | | | 2006 | | | 2007 | | | 2006 | |
| | | (unaudited) | | | (unaudited) | | | | | | | |
| | | (in thousands) | |
| Interest Income | | | | | | | | | | | | |
| Loans, including fees | | $ | 1,045 | | | $ | 802 | | | $ | 1,739 | | | $ | 1,420 | |
| Investment securities | | | 144 | | | | 153 | | | | 285 | | | | 338 | |
| Mortgage-backed securities | | | 2,231 | | | | 2,132 | | | | 4,265 | | | | 3,701 | |
| Other interet-earning assets | | | 86 | | | | 124 | | | | 301 | | | | 205 | |
| Total Interest Income | | | 3,506 | | | | 3,211 | | | | 6,590 | | | | 5,664 | |
| | | | | | | | | | | | | | | | | |
| Interest Expense | | | | | | | | | | | | | | | | |
| Deposits | | | 1,567 | | | | 1,307 | | | | 2,760 | | | | 2,108 | |
| FHLB borrowings | | | 400 | | | | 327 | | | | 688 | | | | 325 | |
| Total Interest Expense | | | 1,967 | | | | 1,634 | | | | 3,448 | | | | 2,433 | |
| | | | | | | | | | | | | | | | | |
| Net Interest Income | | | 1,539 | | | | 1,577 | | | | 3,142 | | | | 3,231 | |
| | | | | | | | | | | | | | | | | |
| Provision for Loan Losses | | | - | | | | - | | | | 1 | | | | - | |
| �� | | | | | | | | | | | | | | | | |
| Net Interest Income After Provisions for Loan Losses | | | 1,539 | | | | 1,577 | | | | 3,141 | | | | 3,231 | |
| | | | | | | | | | | | | | | | | |
| Non-Interest Income | | | | | | | | | | | | | | | | |
| Gain on sale of loans | | | 4 | | | | - | | | | 3 | | | | 24 | |
| Gain on sale of securities | | | 94 | | | | 101 | | | | 168 | | | | 52 | |
| Other income | | | 22 | | | | 50 | | | | 69 | | | | 69 | |
| Total Non-Interest Income | | | 120 | | | | 151 | | | | 240 | | | | 145 | |
| | | | | | | | | | | | | | | | | |
| Non-Interest Expenses | | | | | | | | | | | | | | | | |
| Compensation and benefits | | | 790 | | | | 753 | | | | 1,487 | | | | 1,486 | |
| Occupancy and equipment | | | 85 | | | | 93 | | | | 178 | | | | 178 | |
| Data processing | | | 33 | | | | 33 | | | | 73 | | | | 80 | |
| Audit and examination fees | | | 60 | | | | 69 | | | | 142 | | | | 140 | |
| Advertising | | | - | | | | 13 | | | | 36 | | | | 51 | |
| Deposit insurance premiums | | | 5 | | | | 5 | | | | 9 | | | | 9 | |
| Legal fees | | | 57 | | | | 43 | | | | 66 | | | | 94 | |
| Franchise and bank shares tax | | | 76 | | | | 79 | | | | 158 | | | | 89 | |
| Other expense | | | 156 | | | | 137 | | | | 268 | | | | 288 | |
| Total Non-Interest Expenses | | | 1,262 | | | | 1,225 | | | | 2,417 | | | | 2,415 | |
| | | | | | | | | | | | | | | | | |
| Income Before Income Taxes | | | 397 | | | | 503 | | | | 964 | | | | 961 | |
| | | | | | | | | | | | | | | | | |
| Provision for Income Taxes | | | 134 | | | | 171 | | | | 327 | | | | 327 | |
| | | | | | | | | | | | | | | | | |
| Net Income | | $ | 263 | | | $ | 332 | | | $ | 637 | | | $ | 634 | |
Source: Home Federal Bancorp, audited and unaudited financial statements.
Feldman Financial Advisors, Inc.
Exhibit II-3
First Louisiana Bancshares
Consolidated Balance Sheets
As of December 31, 2006 and 2007
| | | December 31, | |
| | | 2007 | | | 2006 | |
| | | (in thousands) | |
| Assets: | | | | | | |
| Cash and cash equivalents: | | | | | | |
| Cash and due from banks | | $ | 3,662 | | | $ | 4,235 | |
| Federal funds sold | | | 4,800 | | | | 800 | |
| Total cash and cash equivalents | | | 8,462 | | | | 5,035 | |
| | | | | | | | | |
| Investment securities: | | | | | | | | |
| Securities available for sale | | | 15,450 | | | | 15,447 | |
| FHLB stock | | | 783 | | | | 665 | |
| Other investment securities | | | 345 | | | | 345 | |
| Total investment securities | | | 16,577 | | | | 16,457 | |
| | | | | | | | | |
| Investment in unconsolidated subsidiary/affiliate | | | 370 | | | | 368 | |
| | | | | | | | | |
| Loans receivable, net | | | 84,539 | | | | 79,157 | |
| Accrued interest receivable | | | 590 | | | | 598 | |
| Premises and equipment, net | | | 6,252 | | | | 6,015 | |
| Real estate owned other than bank premises | | | 2,303 | | | | 1,123 | |
| Cash surrender value of life insurance | | | 3,039 | | | | 2,941 | |
| Other assets | | | 961 | | | | 992 | |
| Total Assets | | $ | 123,092 | | | $ | 112,687 | |
| | | | | | | | | |
| Liabilities and Stockholders' Equity | | | | | | | | |
| Liabilities | | | | | | | | |
| Deposits: | | | | | | | | |
| Non0interest bearing demand | | $ | 24,320 | | | $ | 23,528 | |
| Interest-bearing demand | | | 22,939 | | | | 25,450 | |
| Savings | | | 7,266 | | | | 7,264 | |
| Time | | | 38,286 | | | | 30,440 | |
| Total deposits | | | 92,811 | | | | 86,682 | |
| | | | | | | | | |
| Other borrowed funds | | | 12,446 | | | | 9,087 | |
| | | | | | | | | |
| Securities dsold under agreement to repurchase | | | 714 | | | | 953 | |
| Accrued interest payable | | | 607 | | | | 360 | |
| Other liabilities | | | 1,153 | | | | 1,146 | |
| Subordinated debentures | | | 4,124 | | | | 4,124 | |
| Total liabilities | | | 111,855 | | | | 102,352 | |
| | | | | | | | | |
| Retained Earnings: | | | | | | | | |
| Common stock | | | 1,577 | | | | 1,563 | |
| Surplus | | | 6,538 | | | | 6,457 | |
| Retained earnings | | | 3,072 | | | | 2,359 | |
| Accumulated other comprehensive income (loss) | | | 49 | | | | (43 | ) |
| Total Stockholders' equity | | | 11,237 | | | | 10,335 | |
| | | | | | | | | |
| Total Liabilities and Stockholders' Equity | | $ | 123,092 | | | $ | 112,687 | |
Source: First Louisiana Bancshares, audited financial statements.
Feldman Financial Advisors, Inc.
Exhibit II-4
First Louisiana Bancshares
Consolidated Income Statements
For the Years Ended December 31, 2006 to 2007
| | | Years Ended December 31, | |
| | | 2007 | | | 2006 | |
| | | (in thousands) | |
| Interest income: | | | | | | |
| Interest and fees on loans | | $ | 7,554 | | | $ | 6,777 | |
| Interest of federal funds sold | | | 132 | | | | 120 | |
| Interest on U.S. Treasury securities | | | 2 | | | | - | |
| Intrerest on U.S. Government and agency securities | | | 225 | | | | 330 | |
| Interest on mortgage-backed securities | | | 142 | | | | 76 | |
| Interest on state and municipal securities | | | 104 | | | | 47 | |
| Income on other debt securities | | | 52 | | | | 43 | |
| Income on other investments | | | 208 | | | | 192 | |
| Income on trust preferred securities | | | 9 | | | | 2 | |
| Total interest income | | | 8,430 | | | | 7,587 | |
| | | | | | | | | |
| Interest expense: | | | | | | | | |
| Interest on savings and interest-bearing deposits | | | 629 | | | | 540 | |
| Interest on time deposits | | | 1,582 | | | | 1,109 | |
| Interest on federal funds purchased | | | 13 | | | | 9 | |
| Interest on othr borrowings | | | 575 | | | | 513 | |
| Interest on subordinated debentures | | | 302 | | | | 84 | |
| Total interest expense | | | 3,101 | | | | 2,254 | |
| | | | | | | | | |
| Net Interest Income | | | 5,329 | | | | 5,333 | |
| | | | | | | | | |
| Provision for loan losses | | | 703 | | | | 983 | |
| | | | | | | | | |
| Net Interest Income After Provisions for Loan Losses | | | 4,626 | | | | 4,351 | |
| | | | | | | | | |
| Other income: | | | | | | | | |
| Service charges and fees | | | 1,036 | | | | 1,126 | |
| Net gain on sale of bank premises and equipment | | | - | | | | 356 | |
| Other | | | 67 | | | | 94 | |
| Total other income | | | 1,104 | | | | 1,575 | |
| | | | | | | | | |
| Other expenses: | | | | | | | | |
| Salaries | | | 1,744 | | | | 1,571 | |
| Personnel expense | | | 636 | | | | 584 | |
| Occupancy | | | 728 | | | | 734 | |
| Other | | | 1,513 | | | | 1,492 | |
| Total other expense | | | 4,621 | | | | 4,380 | |
| | | | | | | | | |
| Income before income taxes | | | 1,109 | | | | 1,546 | |
| | | | | | | | | |
| Income tax expense | | | 291 | | | | 488 | |
| | | | | | | | | |
| Net income | | $ | 818 | | | $ | 1,058 | |
Source: First Louisiana Bancshares, audited financial statements.
Feldman Financial Advisors, Inc.
Exhibit II-5
Home Federal Bancorp
Loan Portfolio Composition
As of June 30, 2006 to 2007 and at December 31, 2007
| | | December 31, | | | June 30, | | | | |
| | | 2007 | | | 2007 | | | 2006 | |
| | | (in thousands) | |
| Real estate loans: | | | | | | | | | |
| One- to four-family residential | | $ | 19,016 | | | $ | 16,669 | | | $ | 13,721 | |
| Other mortgage | | | 3,619 | | | | 3,650 | | | | 3,164 | |
| Total real estate loans | | | 22,635 | | | | 20,319 | | | | 16,885 | |
| | | | | | | | | | | | | |
| Consumer loans: | | | | | | | | | | | | |
| Home equity and second mortgage loans | | | 4,209 | | | | 4,454 | | | | 3,287 | |
| Savings account | | | 490 | | | | 283 | | | | 613 | |
| Equity lines of credit | | | 719 | | | | 427 | | | | 374 | |
| Other | | | 60 | | | | 57 | | | | 43 | |
| Total consumer loans | | | 5,478 | | | | 5,221 | | | | 4,317 | |
| Total loans | | | 28,113 | | | | 25,540 | | | | 21,202 | |
| | | | | | | | | | | | | |
| Less: | | | | | | | | | | | | |
| Allowance for loan losses | | | (235 | ) | | | (235 | ) | | | (235 | ) |
| Deferred loan fees | | | (89 | ) | | | (94 | ) | | | (101 | ) |
| Net Loans | | $ | 27,789 | | | $ | 25,211 | | | $ | 20,866 | |
Source: Home Federal Bancorp, audited and unaudited financial statements.
Feldman Financial Advisors, Inc.
Exhibit II-6
First Louisiana Bancshares
Loan Portfolio Composition
As of December 31, 2006 and 2007
| | | December 31, | |
| | | 2007 | | | 2006 | |
| | | (in thousands) | |
| | | | | | | |
| Commercial real estate | | $ | 45,821 | | | $ | 40,081 | |
| Commercial non-real estate | | | 26,724 | | | | 25,111 | |
| Consumer real estate | | | 5,854 | | | | 6,041 | |
| Consumer non-real estate | | | 6,356 | | | | 6,302 | |
| Cash flow manager | | | 129 | | | | 267 | |
| Nonacccrual | | | 318 | | | | 2,143 | |
| Overdrafts | | | 240 | | | | 277 | |
| Total | | | 85,442 | | | | 80,221 | |
| Less: | | | | | | | | |
| Deferred origination fees | | | (11 | ) | | | (6 | ) |
| Allowance for loan losses | | | (891 | ) | | | (1,058 | ) |
| Loans, net | | $ | 84,539 | | | $ | 79,157 | |
Source: First Louisiana Bancshares, audited financial statements.
Feldman Financial Advisors, Inc.
Exhibit II-7
Home Federal Bancorp
Securities Portfolio
As of June 30, 2006 to 2007 and at December 31, 2007
| | | December 31, | | | June 30, | |
| | | 2007 | | | 2007 | | | 2006 | |
| | | (unaudited) | | | | | | | |
| | | (in thousands) | |
| Securities available-for-sale | | | | | | | | | |
| Debt securities | | | | | | | | | |
| FHLMC Mortgage-backed certificates | | $ | 7,293 | | | $ | 7,615 | | | $ | 990 | |
| FNMA Mortgage-backed certificates | | | 71,386 | | | | 73,640 | | | | 985 | |
| GNMA Mortgage-backed certificates | | | 198 | | | | 270 | | | | 8,381 | |
| Total debt securities | | | 78,877 | | | | 81,525 | | | | 10,356 | |
| | | | | | | | | | | | | |
| Equity securities | | | | | | | | | | | | |
| 237,343 shares, AMF ARM fund | | | 2,286 | | | | 2,227 | | | | 2,121 | |
| | | | | | | | | | | | | |
| Total available-for-sale securities | | $ | 81,163 | | | $ | 83,752 | | | $ | 12,477 | |
| | | | | | | | | | | | | |
| | | | | | | | | | | | | |
| Securities held-to-maturity | | | | | | | | | | | | |
| Debt securities | | | | | | | | | | | | |
| GNMA Mortgage-backed certificates | | $ | 387 | | | $ | 445 | | | $ | 535 | |
| FNMA Mortgage-backed certificates | | | 129 | | | | 142 | | | | 184 | |
| FHLMC Mortgage-backed certificates | | | 36 | | | | 42 | | | | 57 | |
| Total debt securities | | | 552 | | | | 629 | | | | 776 | |
| | | | | | | | | | | | | |
| Equity securities | | | | | | | | | | | | |
| 7,894 shares, FHLB | | | 779 | | | | 779 | | | | 649 | |
| | | | | | | | | | | | | |
| Total held-to-maturity securities | | $ | 1,331 | | | $ | 1,408 | | | $ | 1,425 | |
Source: Home Federal Bancorp, audited and unaudited financial statements.
Feldman Financial Advisors, Inc.
Exhibit II-8
First Louisiana Bancshares
Securities Portfolio
As of December 31, 2006 and 2007
| | | December 31, 2007 | |
| | | | | | Gross | | | Gross | | | Estimated | |
| | | Amortized | | | Unrealized | | | Unrealized | | | Fair | |
| | | Cost | | | Gains | | | Losses | | | Value | |
| Securities available-for-sale | | (in thousands) | |
| Debt securities | | | | | | | | | | | | |
| U.S. Government and agency securities | | $ | 6,958 | | | $ | 62 | | | $ | 0 | | | $ | 7,019 | |
| State and municipal securities | | | 2,693 | | | | 40 | | | | 0 | | | | 2,734 | |
| Mortgage-backed securities | | | 2,529 | | | | 10 | | | | 5 | | | | 2,534 | |
| Other debt securities | | | 1,000 | | | | 1 | | | | 0 | | | | 1,001 | |
| Total debt securities | | | 13,180 | | | | 113 | | | | 5 | | | | 13,288 | |
| | | | | | | | | | | | | | | | | |
| Mutual funds | | | 2,195 | | | | 0 | | | | 33 | | | $ | 2,162 | |
| | | | | | | | | | | | | | | | | |
| Total available-for-sale securities | | $ | 15,375 | | | $ | 113 | | | $ | 38 | | | $ | 15,450 | |
| | | December 31, 2006 | |
| | | | | | | Gross | | | Gross | | | Estimated | |
| | | Amortized | | | Unrealized | | | Unrealized | | | Fair | |
| | | Cost | | | Gains | | | Losses | | | Value | |
| Securities available-for-sale | | (in thousands) | |
| Debt securities | | | | | | | | | | | | | | | | |
| U.S. Government and agency securities | | $ | 7,767 | | | $ | 8 | | | $ | 18 | | | $ | 7,757 | |
| State and municipal securities | | | 3,018 | | | | 8 | | | | 15 | | | | 3,011 | |
| Mortgage-backed securities | | | 3,092 | | | | 3 | | | | 22 | | | | 3,073 | |
| Other debt securities | | | 500 | | | | 1 | | | | 0 | | | | 501 | |
| Total debt securities | | | 14,377 | | | | 20 | | | | 55 | | | | 14,342 | |
| | | | | | | | | | | | | | | | | |
| Mutual funds | | | 1,136 | | | | 0 | | | | 31 | | | $ | 1,105 | |
| | | | | | | | | | | | | | | | | |
| Total available-for-sale securities | | $ | 15,513 | | | $ | 20 | | | $ | 86 | | | $ | 15,447 | |
Source: First Louisiana Bancshares, audited financial statements.
Feldman Financial Advisors, Inc.
Exhibit II-9
Home Federal Bancorp
Deposit Portfolio
As of June 30, 2006 to 2007 and at December 31, 2007
| | | December 31, 2007 | | | June 30, | |
| | | (unaudited) | | | 2007 | | | 2006 | |
| | | Amount | | | Percent | | | Balance | | | Rate Paid | | | Balance | | | Rate Paid | |
| | | (in thousands) | |
| | | | | | | | | | | | | | | | | | | |
| Non-interest bearing | | $ | 4,115 | | | | 5.08 | % | | $ | 1,372 | | | | 1.77 | % | | $ | 828 | | | | 1.16 | % |
| NOW | | | 4,062 | | | | 5.02 | | | | 5,921 | | | | 7.62 | | | | 5,412 | | | | 7.59 | |
| Money Market | | | 2,916 | | | | 3.60 | | | | 2,941 | | | | 3.78 | | | | 3,302 | | | | 4.63 | |
| Passbook savings | | | 4,431 | | | | 5.47 | | | | 4,473 | | | | 5.76 | | | | 4,756 | | | | 6.67 | |
| | | | 15,524 | | | | 19.17 | | | | 14,707 | | | | 18.93 | | | | 14,298 | | | | 20.06 | |
| | | | | | | | | | | | | | | | | | | | | | | | | |
| Certificates of deposit | | | 65,462 | | | | 80.83 | | | | 63,003 | | | | 81.07 | | | | 56,981 | | | | 79.94 | |
| Total deposits | | $ | 80,986 | | | | 100.00 | % | | $ | 77,710 | | | | 100.00 | % | | $ | 71,279 | | | | 100.00 | % |
Source: Home Federal Bancorp, audited and unaudited financial statements.
Feldman Financial Advisors, Inc.
Exhibit II-10
First Louisiana Bancshares
Deposit Portfolio
As of December 31, 2006 and 2007
| | | December 31, | |
| | | 2007 | | | 2006 | |
| | | Balance | | | Rate Paid | | | Balance | | | Rate Paid | |
| | | | | | | | | | | | | |
| | | | | | | | | | | | | |
| Non-interest bearing | | $ | 24,320 | | | | 26.20 | % | | $ | 23,528 | | | | 27.14 | % |
| NOW | | | 22,939 | | | | 24.72 | | | | 25,450 | | | | 29.36 | |
| Savings | | | 7,266 | | | | 7.83 | | | | 7,264 | | | | 8.38 | |
| Time | | | 38,286 | | | | 41.25 | | | | 30,440 | | | | 35.12 | |
| Total deposits | | $ | 92,811 | | | | 100.00 | % | | $ | 86,682 | | | | 100.00 | % |
Source: First Louisiana Bancshares, audited financial statements.
Feldman Financial Advisors, Inc.
| Exhibit III |
| Financial Performance and Market Valuation Data for All Public Thrifts |
| Based on Closing Market Prices as of February 25, 2008 |
| | | | | | | | | | | | | | | | |
| | | | | | | | | | | | | | | | |
| | | | | | | Total | Tang. | Closing | Total | Price/ | Price/ | Price/ | Price/ | Price/ | |
| | | | Total | LTM | LTM | Equity/ | Equity/ | Price | Market | LTM | Core | Book | Tang. | Total | Div. |
| | | | Assets | ROA | ROE | Assets | Assets | 02/05/08 | Value | EPS | EPS | Value | Book | Assets | Yield |
| Company | Ticker | State | ($Mil.) | (%) | (%) | (%) | (%) | ($) | ($Mil.) | (x) | (x) | (%) | (%) | (%) | (%) |
| | | | | | | | | | | | | | | | |
| | | | | | | | | | | | | | | |
| Abington Bancorp, Inc. | ABBC | PA | 1,080 | 0.70 | 3.73 | 23.15 | 23.15 | 10.07 | 246.2 | 33.6 | 33.6 | 98.5 | 98.5 | 22.80 | 1.79 |
| Ameriana Bancorp | ASBI | IN | 427 | 0.36 | 4.63 | 7.96 | 7.78 | 9.40 | 28.1 | 18.4 | NA | 82.7 | 84.8 | 6.58 | 1.70 |
| American Bancorp of New Jersey, Inc. | ABNJ | NJ | 569 | 0.06 | 0.31 | 16.97 | 16.97 | 10.53 | 119.6 | NM | NM | 125.6 | 125.6 | 21.31 | 1.52 |
| Anchor BanCorp Wisconsin Inc. | ABCW | WI | 4,726 | 0.74 | 10.00 | 7.22 | 6.82 | 20.55 | 438.5 | 13.0 | 13.0 | 128.6 | 136.6 | 9.28 | 3.50 |
| Astoria Financial Corporation | AF | NY | 21,719 | 0.58 | 10.39 | 5.58 | 4.77 | 26.66 | 2,552.1 | 19.6 | 17.9 | 198.1 | 233.7 | 11.05 | 3.90 |
| Bank Mutual Corporation | BKMU | WI | 3,488 | 0.49 | 3.57 | 12.33 | 10.92 | 11.14 | 555.2 | 35.9 | 34.3 | 129.1 | 149.5 | 15.91 | 3.23 |
| BankAtlantic Bancorp, Inc. | BBX | FL | 6,379 | (0.35) | (4.37) | 7.20 | 6.08 | 5.08 | 284.9 | NM | NM | 62.0 | 74.3 | 4.47 | 0.39 |
| BankFinancial Corporation | BFIN | IL | 1,481 | 0.47 | 2.30 | 19.66 | 17.98 | 15.04 | 334.6 | 43.0 | 39.9 | 114.9 | 128.3 | 22.60 | 1.86 |
| BankUnited Financial Corporation | BKUNA | FL | 14,425 | 0.20 | 3.52 | 5.38 | 5.20 | 5.54 | 197.6 | 7.9 | 6.8 | 25.7 | 26.7 | 1.37 | 0.36 |
| Beacon Federal Bancorp, Inc. | BFED | NY | 878 | 0.36 | 4.88 | 12.90 | 12.90 | 10.72 | 79.3 | NA | NA | 70.0 | 70.0 | 9.03 | - |
| Benjamin Franklin Bancorp, Inc. | BFBC | MA | 903 | 0.40 | 3.36 | 11.89 | 8.21 | 14.02 | 110.2 | 29.8 | 34.0 | 102.6 | 154.8 | 12.20 | 1.71 |
| Berkshire Hills Bancorp, Inc. | BHLB | MA | 2,513 | 0.60 | 4.75 | 13.00 | 6.19 | 23.30 | 244.5 | 16.2 | NA | 74.8 | 168.6 | 9.73 | 2.58 |
| BFC Financial Corporation | BFF | FL | 7,446 | (0.39) | (16.57) | 2.50 | 1.50 | 1.26 | 60.1 | NM | NA | 34.9 | 62.8 | 0.81 | - |
| BofI Holding, Inc. | BOFI | CA | 1,040 | 0.34 | 4.29 | 7.39 | 7.39 | 6.80 | 56.4 | 20.0 | 22.2 | 78.4 | 78.4 | 5.44 | - |
| Broadway Financial Corporation | BYFC | CA | 357 | 0.46 | 6.92 | 6.18 | 6.18 | 8.01 | 14.1 | 10.8 | 10.8 | 72.4 | 72.4 | 3.98 | 2.50 |
| Brookline Bancorp, Inc. | BRKL | MA | 2,419 | 0.75 | 3.23 | 21.45 | 19.83 | 10.09 | 585.2 | 33.6 | 33.7 | 112.9 | 124.6 | 24.21 | 3.37 |
| Carver Bancorp, Inc. | CARV | NY | 803 | 0.63 | 9.55 | 6.75 | 5.93 | 15.00 | 37.2 | 8.1 | 8.3 | 68.9 | 79.1 | 4.65 | 2.67 |
| Central Bancorp, Inc. | CEBK | MA | 555 | 0.25 | 3.61 | 7.06 | 6.69 | 20.50 | 33.6 | 20.5 | 34.5 | 85.8 | 91.0 | 6.06 | 3.51 |
| Central Federal Corporation | CFBK | OH | 280 | (0.01) | (0.06) | 9.79 | 9.79 | 4.51 | 20.0 | NM | NM | 73.1 | 73.1 | 7.16 | 4.43 |
| CFS Bancorp, Inc. | CITZ | IN | 1,150 | 0.62 | 5.78 | 11.34 | 11.24 | 14.17 | 151.7 | 20.5 | 21.5 | 116.3 | 117.5 | 13.19 | 3.39 |
| Chicopee Bancorp, Inc. | CBNK | MA | 463 | 0.35 | 1.48 | 22.50 | 22.50 | 13.18 | 96.0 | 54.9 | 83.1 | 92.1 | 92.1 | 20.72 | - |
| Citizens Community Bancorp, Inc. | CZWI | WI | 409 | 0.38 | 1.69 | 18.51 | 17.11 | 9.10 | 61.6 | 45.5 | 45.5 | 81.9 | 90.1 | 15.15 | 2.20 |
| Citizens First Bancorp, Inc. | CTZN | MI | 1,824 | 0.29 | 2.87 | 9.57 | 8.96 | 12.79 | 105.2 | 20.3 | 20.2 | 58.3 | 62.7 | 5.58 | 2.81 |
| Citizens South Banking Corporation | CSBC | NC | 779 | 0.75 | 6.68 | 10.79 | 7.08 | 10.35 | 78.7 | 14.2 | NA | 93.7 | 148.5 | 10.10 | 3.09 |
| CMS Bancorp, Inc. | CMSB | NY | 175 | (0.59) | (5.02) | 13.67 | 13.67 | 9.70 | 19.1 | NA | NA | 82.0 | 82.0 | 11.22 | - |
| Community Financial Corporation | CFFC | VA | 491 | 0.80 | 9.69 | 7.76 | 7.76 | 8.92 | 38.5 | 10.5 | 10.6 | 100.8 | 100.8 | 7.83 | 2.91 |
| Danvers Bancorp, Inc. | DNBK | MA | 1,448 | 0.34 | 6.50 | 5.07 | NA | 10.20 | 182.0 | NA | NA | NA | NA | NA | - |
| Dime Community Bancshares, Inc. | DCOM | NY | 3,501 | 0.69 | 8.11 | 7.68 | 6.19 | 16.04 | 543.9 | 23.9 | 24.3 | 202.3 | 250.2 | 15.53 | 3.49 |
| Downey Financial Corp. | DSL | CA | 13,409 | (0.38) | (3.92) | 9.95 | 9.93 | 30.33 | 844.8 | NM | NM | 63.3 | 63.5 | 6.30 | 1.58 |
| Elmira Savings Bank, FSB | ESBK | NY | 390 | 0.44 | 6.86 | 6.50 | 6.46 | 19.46 | 33.8 | 16.9 | 12.7 | 111.3 | 112.0 | 7.24 | 4.52 |
| ESB Financial Corporation | ESBF | PA | 1,880 | 0.40 | 6.00 | 7.07 | 4.84 | 10.34 | 128.3 | 17.0 | 16.8 | 96.6 | 144.3 | NA | 3.87 |
| ESSA Bancorp, Inc. | ESSA | PA | 931 | (0.48) | (2.55) | 22.25 | 22.25 | 12.01 | 203.9 | NA | NA | 98.5 | 98.5 | 21.91 | - |
| Federal Trust Corporation | FDT | FL | 690 | (1.98) | (28.05) | 5.75 | 5.75 | 2.35 | 22.1 | NM | NA | 55.7 | 55.7 | 3.20 | - |
| FFD Financial Corporation | FFDF | OH | 176 | 0.90 | 8.61 | 10.44 | 10.44 | 16.30 | 17.5 | 11.6 | 11.6 | 95.9 | 95.9 | 10.00 | 4.05 |
| Fidelity Bancorp, Inc. | FSBI | PA | 725 | 0.51 | 8.11 | 6.48 | 6.12 | 16.75 | 50.6 | 13.7 | 13.4 | 107.4 | 114.1 | 6.96 | 3.34 |
| First Advantage Bancorp | FABK | TN | 253 | (0.12) | (0.69) | 31.37 | 31.37 | 11.72 | 61.7 | NA | NA | 77.6 | 77.6 | 24.35 | - |
Feldman Financial Advisors, Inc.
| Exhibit III |
| Financial Performance and Market Valuation Data for All Public Thrifts |
| Based on Closing Market Prices as of February 25, 2008 |
| | | | | | | | | | | | | | | | |
| | | | | | | Total | Tang. | Closing | Total | Price/ | Price/ | Price/ | Price/ | Price/ | |
| | | | Total | LTM | LTM | Equity/ | Equity/ | Price | Market | LTM | Core | Book | Tang. | Total | Div. |
| | | | Assets | ROA | ROE | Assets | Assets | 02/05/08 | Value | EPS | EPS | Value | Book | Assets | Yield |
| Company | Ticker | State | ($Mil.) | (%) | (%) | (%) | (%) | ($) | ($Mil.) | (x) | (x) | (%) | (%) | (%) | (%) |
| | | | | | | | | | | | | | | | |
| First Bancorp of Indiana, Inc. | FBEI | IN | 368 | 0.15 | 1.62 | 9.34 | 7.57 | 12.05 | 22.0 | 43.0 | 31.3 | 64.0 | 80.5 | 5.98 | 4.98 |
| First Bancshares, Inc. | FBSI | MO | 243 | 0.21 | 1.91 | 11.19 | 11.10 | 18.05 | 28.0 | 54.7 | 69.9 | 102.7 | 103.7 | 11.50 | - |
| First BancTrust Corporation | FBTC | IL | 303 | 0.40 | 4.61 | 8.73 | 8.36 | 8.45 | 18.8 | 15.9 | 16.7 | 71.2 | 74.7 | 6.22 | 2.84 |
| First Capital, Inc. | FCAP | IN | 453 | 0.76 | 7.64 | 10.09 | 8.95 | 16.00 | 45.0 | 13.3 | 13.3 | NA | NA | NA | 4.25 |
| First Clover Leaf Financial Corp. | FCLF | IL | 378 | 0.68 | 2.78 | 23.58 | 21.28 | 10.10 | 86.3 | 33.7 | 34.2 | 98.0 | 111.8 | 23.10 | 2.38 |
| First Community Bank Corporation of America | FCFL | FL | 436 | 0.69 | NA | NA | NA | 10.49 | 42.8 | 15.0 | NA | NA | NA | NA | - |
| First Defiance Financial Corp. | FDEF | OH | 1,609 | 0.90 | 8.48 | 10.31 | 8.00 | 19.65 | 138.7 | 10.1 | 10.2 | 83.6 | 110.5 | 8.62 | 5.29 |
| First Federal Bancshares of Arkansas, Inc. | FFBH | AR | 792 | 0.32 | 3.53 | 9.30 | 9.30 | 14.87 | 72.0 | 27.5 | 27.5 | 97.8 | 97.8 | 9.09 | 4.30 |
| First Federal Bankshares, Inc. | FFSX | IA | 626 | 0.38 | 3.49 | 10.61 | 7.90 | 12.89 | 42.6 | 17.7 | 20.6 | 64.1 | 88.7 | 6.80 | 3.26 |
| First Federal of Northern Michigan Bancorp, Inc. | FFNM | MI | 263 | (0.04) | (0.31) | 12.89 | 11.67 | 7.50 | 21.6 | NM | NM | 64.0 | 71.6 | 8.24 | 2.67 |
| First Financial Holdings, Inc. | FFCH | SC | 2,818 | 0.82 | 11.78 | 6.65 | 5.89 | 22.97 | 267.8 | 12.4 | 12.5 | 142.9 | 162.5 | 9.50 | 4.44 |
| First Financial Northwest, Inc. | FFNW | WA | 1,119 | NA | NA | 9.91 | 8.75 | 9.79 | 223.7 | NA | NA | NA | NA | NA | - |
| First Franklin Corporation | FFHS | OH | 320 | 0.28 | 3.51 | 8.01 | 8.01 | 8.40 | 14.1 | 15.9 | 31.2 | 55.1 | 55.1 | 4.41 | 4.29 |
| First Keystone Financial, Inc. | FKFS | PA | 517 | 0.12 | 1.76 | 6.88 | 6.88 | 13.68 | 33.3 | 52.6 | 65.8 | 93.5 | 93.5 | 6.44 | - |
| First Niagara Financial Group, Inc. | FNFG | NY | 8,096 | 1.05 | 6.24 | 16.71 | 8.21 | 12.13 | 1,270.9 | 15.0 | NA | 90.5 | 202.8 | 15.12 | 4.62 |
| First PacTrust Bancorp, Inc. | FPTB | CA | 770 | 0.42 | 4.05 | 10.85 | 10.85 | 17.60 | 77.4 | 22.0 | 22.0 | 88.3 | 88.3 | 9.57 | 4.20 |
| First Place Financial Corp. | FPFC | OH | 3,304 | 0.48 | 4.68 | 9.45 | 6.42 | 12.74 | 209.1 | 14.3 | 11.1 | 67.0 | 101.9 | 6.33 | 5.34 |
| FirstFed Financial Corp. | FED | CA | 7,223 | 1.17 | 13.37 | 9.06 | 9.05 | 32.96 | 449.6 | 5.5 | 5.5 | 68.7 | 68.8 | 6.23 | - |
| Flagstar Bancorp, Inc. | FBC | MI | 15,793 | (0.24) | (5.14) | 4.39 | 4.39 | 7.71 | 464.7 | NM | NM | 67.0 | 67.0 | 2.94 | - |
| Flushing Financial Corporation | FFIC | NY | 3,355 | 0.66 | 9.15 | 6.97 | 6.44 | 17.22 | 367.2 | 16.9 | 14.7 | 157.1 | 171.0 | 10.94 | 2.79 |
| Franklin Bank Corp. | FBTX | TX | 5,723 | (0.71) | (8.57) | 7.21 | 3.82 | 4.07 | 103.3 | NM | NA | 31.0 | 76.5 | 1.79 | - |
| GS Financial Corp. | GSLA | LA | 186 | 0.44 | 2.77 | 15.21 | 15.21 | 16.00 | 20.3 | 26.2 | NA | 71.8 | 71.8 | 10.91 | 2.50 |
| Guaranty Financial Group Inc. | GFG | TX | 16,796 | NA | NA | 6.78 | 5.82 | 15.75 | 557.2 | 7.2 | NA | 49.0 | 57.6 | 3.32 | - |
| Hampden Bancorp, Inc. | HBNK | MA | 529 | (0.23) | (1.33) | 19.64 | 19.64 | 10.35 | 82.3 | NA | NA | 79.3 | 79.3 | 15.56 | 1.16 |
| Harleysville Savings Financial Corporation | HARL | PA | 792 | 0.43 | 6.81 | 5.97 | 5.97 | 13.20 | 49.3 | 15.4 | 15.8 | 104.2 | 104.2 | 6.21 | 5.15 |
| Harrington West Financial Group, Inc. | HWFG | CA | 1,223 | 0.36 | 6.29 | 4.50 | 4.01 | 11.00 | 61.1 | 14.9 | 10.0 | 111.0 | 125.1 | 4.99 | 4.55 |
| HF Financial Corp. | HFFC | SD | 1,021 | 0.48 | 7.66 | 6.31 | 5.86 | 16.25 | 64.5 | 14.0 | 14.0 | 100.0 | 108.3 | 6.31 | 2.65 |
| Hingham Institution for Savings | HIFS | MA | 745 | 0.63 | 8.40 | 7.36 | 7.36 | 30.50 | 64.6 | 14.4 | 14.4 | 118.0 | 118.0 | 8.68 | 2.62 |
| HMN Financial, Inc. | HMNF | MN | 1,117 | 1.03 | 11.53 | 8.78 | 8.47 | 24.39 | 101.8 | 8.4 | 8.4 | 103.8 | 108.0 | 9.12 | 4.10 |
| Home Federal Bancorp, Inc. | HOME | ID | 783 | 0.67 | 4.04 | 26.05 | 26.05 | 11.51 | 199.4 | 38.4 | 38.3 | 97.9 | 97.9 | 25.49 | 1.91 |
| HopFed Bancorp, Inc. | HFBC | KY | 808 | 0.53 | 7.74 | 6.90 | 6.01 | 14.10 | 50.6 | 12.4 | 12.4 | 90.7 | 105.2 | 6.26 | 3.40 |
| Hudson City Bancorp, Inc. | HCBK | NJ | 44,424 | 0.74 | 6.23 | 10.38 | 10.05 | 16.36 | 8,483.8 | 28.2 | 28.2 | 171.3 | 177.4 | 17.78 | 2.20 |
| Independence Federal Savings Bank | IFSB | DC | 159 | (1.39) | (18.40) | 7.02 | 7.02 | 6.03 | 9.4 | NM | NM | 83.7 | 83.7 | 5.88 | - |
| IndyMac Bancorp, Inc. | IMB | CA | 32,734 | (1.71) | (31.10) | 4.11 | NA | 7.24 | 585.8 | NM | NM | 43.6 | NA | 1.79 | - |
| Jefferson Bancshares, Inc. | JFBI | TN | 344 | 0.39 | 1.78 | 21.22 | 21.22 | 11.54 | 72.0 | 55.0 | 55.0 | 99.7 | 99.7 | 21.15 | 2.08 |
| Legacy Bancorp, Inc. | LEGC | MA | 925 | 0.15 | 0.88 | 14.40 | 13.49 | 14.19 | 131.1 | NM | 138.1 | 98.5 | 109.1 | 14.19 | 1.13 |
| Liberty Bancorp, Inc. | LBCP | MO | 339 | 0.60 | 3.89 | 14.07 | 14.07 | 10.65 | 43.6 | 25.4 | 25.4 | 99.1 | 99.1 | 13.95 | 0.94 |
Feldman Financial Advisors, Inc.
| Exhibit III |
| Financial Performance and Market Valuation Data for All Public Thrifts |
| Based on Closing Market Prices as of February 25, 2008 |
| | | | | | | | | | | | | | | | |
| | | | | | | Total | Tang. | Closing | Total | Price/ | Price/ | Price/ | Price/ | Price/ | |
| | | | Total | LTM | LTM | Equity/ | Equity/ | Price | Market | LTM | Core | Book | Tang. | Total | Div. |
| | | | Assets | ROA | ROE | Assets | Assets | 02/05/08 | Value | EPS | EPS | Value | Book | Assets | Yield |
| Company | Ticker | State | ($Mil.) | (%) | (%) | (%) | (%) | ($) | ($Mil.) | (x) | (x) | (%) | (%) | (%) | (%) |
| | | | | | | | | | | | | | | | |
| Louisiana Bancorp, Inc. | LABC | LA | 271 | 1.08 | 4.47 | 33.16 | 33.16 | 11.54 | 73.2 | NA | NA | NA | NA | NA | - |
| LSB Corporation | LSBX | MA | 622 | 0.64 | 6.35 | 9.70 | 9.70 | 16.09 | 72.7 | 19.9 | 22.9 | 120.5 | 120.5 | 11.69 | 3.48 |
| LSB Financial Corp. | LSBI | IN | 342 | 0.45 | 4.53 | 9.92 | 9.92 | 19.50 | 30.4 | 19.7 | 19.8 | 89.5 | 89.5 | 8.88 | 5.13 |
| MASSBANK Corp. | MASB | MA | 802 | 0.95 | 7.21 | 13.59 | 13.47 | 38.34 | 162.6 | 21.5 | 22.0 | 149.2 | 150.8 | 20.28 | 3.03 |
| Mayflower Bancorp, Inc. | MFLR | MA | 243 | 0.43 | 5.28 | 8.31 | 8.29 | 11.10 | 23.3 | 22.7 | 23.3 | 115.2 | 115.4 | 9.57 | 3.60 |
| Meta Financial Group, Inc. | CASH | IA | 686 | 0.17 | 2.69 | 7.01 | 6.81 | 27.94 | 72.4 | 62.1 | NM | 150.5 | 161.9 | 10.55 | 1.86 |
| MutualFirst Financial, Inc. | MFSF | IN | 963 | 0.44 | 4.84 | 9.04 | 7.58 | 13.61 | 57.5 | 13.3 | 13.3 | 66.1 | 80.1 | 5.98 | 4.70 |
| NASB Financial, Inc. | NASB | MO | 1,529 | 0.82 | 8.35 | 9.79 | 9.63 | 22.92 | 180.3 | 14.8 | 14.8 | 120.4 | 122.8 | 11.80 | 3.93 |
| New Hampshire Thrift Bancshares, Inc. | NHTB | NH | 834 | 0.62 | 7.82 | 8.71 | NA | 13.10 | 74.9 | 14.2 | NA | 103.2 | NA | 8.99 | 3.97 |
| New York Community Bancorp, Inc. | NYB | NY | 30,580 | 0.94 | 7.13 | 13.68 | 5.83 | 17.18 | 5,563.1 | 19.1 | 19.4 | 132.7 | 339.5 | 18.14 | 5.82 |
| NewAlliance Bancshares, Inc. | NAL | CT | 8,211 | 0.30 | 1.69 | 17.14 | 10.79 | 12.24 | 1,332.3 | 53.2 | 29.2 | 94.7 | 161.9 | 16.22 | 2.12 |
| Newport Bancorp, Inc. | NFSB | RI | 361 | 0.24 | 1.26 | 16.32 | 16.32 | 12.75 | 59.5 | NM | 75.0 | 100.9 | 100.9 | 16.46 | - |
| North Central Bancshares, Inc. | FFFD | IA | 510 | 0.77 | 9.57 | 8.03 | 7.13 | 33.79 | 45.3 | 11.5 | NA | 110.6 | 125.8 | 8.88 | 4.14 |
| OceanFirst Financial Corp. | OCFC | NJ | 1,927 | 0.05 | 0.86 | 6.45 | 6.45 | 16.31 | 201.3 | NM | 181.2 | 161.9 | 161.9 | 10.44 | 4.91 |
| Osage Bancshares, Inc. | OSBK | OK | 137 | 0.93 | 3.44 | 25.79 | 25.79 | 9.35 | 33.7 | 26.0 | 26.0 | 95.5 | 95.5 | 24.64 | 3.64 |
| Pamrapo Bancorp, Inc. | PBCI | NJ | 657 | 0.68 | 7.35 | 8.92 | 8.92 | 18.00 | 89.6 | 20.7 | 20.7 | 152.7 | 152.7 | 13.62 | 5.11 |
| Park Bancorp, Inc. | PFED | IL | 219 | 0.12 | 0.88 | 13.92 | 13.92 | 21.71 | 26.4 | NM | 120.0 | 83.8 | 83.8 | 11.67 | 3.32 |
| Parkvale Financial Corporation | PVSA | PA | 1,829 | 0.75 | 10.62 | 7.00 | 5.41 | 27.01 | 148.0 | 11.2 | 11.3 | 115.1 | 151.6 | 8.06 | 3.26 |
| Peoples Bancorp | PFDC | IN | 471 | 0.58 | 4.44 | 13.30 | 12.87 | 15.53 | 48.2 | 17.5 | 17.5 | 76.9 | 79.9 | 10.23 | 4.89 |
| Peoples Community Bancorp, Inc. | PCBI | OH | 902 | (0.42) | (4.81) | 9.36 | 6.40 | 6.70 | 32.4 | NM | NM | 38.4 | 58.0 | 3.59 | - |
| People's United Financial, Inc. | PBCT | CT | 13,555 | 1.18 | 4.21 | 32.80 | 32.28 | 17.20 | 5,891.1 | 33.1 | 34.2 | 111.5 | 114.1 | 36.56 | 3.10 |
| PFF Bancorp, Inc. | PFB | CA | 4,374 | (0.20) | (2.42) | 7.46 | 7.43 | 9.14 | 206.8 | NM | NM | 63.4 | 63.6 | 4.73 | 8.32 |
| Provident Financial Holdings, Inc. | PROV | CA | 1,640 | 0.39 | 4.98 | 7.70 | 7.70 | 16.59 | 102.8 | 16.3 | 16.3 | 81.4 | 81.4 | 6.27 | 4.34 |
| Provident Financial Services, Inc. | PFS | NJ | 6,359 | 0.62 | 3.63 | 15.74 | NA | 12.62 | 752.7 | 20.0 | NA | 75.2 | 156.8 | 11.84 | 3.49 |
| Provident New York Bancorp | PBNY | NY | 2,799 | 0.75 | 5.14 | 14.36 | 8.80 | 13.69 | 549.7 | 26.3 | 26.3 | 136.6 | 237.7 | 19.62 | 1.75 |
| Pulaski Financial Corp. | PULB | MO | 1,251 | 0.84 | 11.17 | 6.68 | 6.35 | 11.00 | 110.4 | 12.1 | 12.3 | 131.6 | 138.9 | 8.79 | 3.27 |
| Rainier Pacific Financial Group, Inc. | RPFG | WA | 879 | 0.43 | 4.33 | 9.88 | 9.57 | 14.33 | 92.7 | 22.4 | 21.8 | 100.3 | 104.1 | 9.91 | 1.95 |
| River Valley Bancorp | RIVR | IN | 350 | 0.65 | 8.98 | 7.34 | 7.33 | 17.00 | 27.8 | 12.5 | NA | 108.2 | 108.3 | 7.94 | 4.94 |
| Riverview Bancorp, Inc. | RVSB | WA | 844 | 1.25 | 10.45 | 10.94 | 8.09 | 11.33 | 123.6 | 12.3 | 12.3 | 133.9 | 187.6 | 14.66 | 3.88 |
| Rome Bancorp, Inc. | ROME | NY | 318 | 1.00 | 4.14 | 21.69 | 21.69 | 11.74 | 91.5 | 30.1 | 30.2 | 132.5 | 132.5 | 28.75 | 2.90 |
| Sovereign Bancorp, Inc. | SOV | PA | 84,746 | (1.62) | (15.40) | 8.25 | 3.95 | 11.75 | 5,656.5 | NM | NM | 83.2 | 188.6 | 6.69 | - |
| Superior Bancorp | SUPR | AL | 2,886 | 0.29 | 2.47 | 12.12 | 5.99 | 5.27 | 211.4 | 26.4 | 25.6 | 60.4 | 130.8 | 7.32 | - |
| Teche Holding Company | TSH | LA | 735 | 0.95 | 10.20 | 9.34 | 8.87 | 36.75 | 81.3 | 12.3 | 12.5 | 118.2 | 125.0 | 11.04 | 3.65 |
| TF Financial Corporation | THRD | PA | 702 | 0.73 | 7.24 | 9.70 | 9.11 | 24.66 | 69.8 | 13.9 | 13.9 | 96.8 | 103.4 | 9.38 | 3.24 |
| Timberland Bancorp, Inc. | TSBK | WA | 647 | 1.25 | 10.35 | 11.60 | 10.66 | 12.75 | 87.5 | 11.2 | 11.2 | 117.6 | 129.3 | 13.64 | 3.45 |
| TrustCo Bank Corp NY | TRST | NY | 3,378 | 1.20 | 16.93 | 7.02 | 7.00 | 9.30 | 700.5 | 17.6 | 17.6 | 295.5 | 296.2 | 20.74 | 4.73 |
| United Community Financial Corp. | UCFC | OH | 2,765 | 0.27 | 2.57 | 9.87 | 8.72 | 6.02 | 180.9 | 24.1 | 24.1 | 66.3 | 76.0 | 6.54 | 6.31 |
Feldman Financial Advisors, Inc.
| Exhibit III |
| Financial Performance and Market Valuation Data for All Public Thrifts |
| Based on Closing Market Prices as of February 25, 2008 |
| | | | | | | | | | | | | | | | |
| | | | | | | Total | Tang. | Closing | Total | Price/ | Price/ | Price/ | Price/ | Price/ | |
| | | | Total | LTM | LTM | Equity/ | Equity/ | Price | Market | LTM | Core | Book | Tang. | Total | Div. |
| | | | Assets | ROA | ROE | Assets | Assets | 02/05/08 | Value | EPS | EPS | Value | Book | Assets | Yield |
| Company | Ticker | State | ($Mil.) | (%) | (%) | (%) | (%) | ($) | ($Mil.) | (x) | (x) | (%) | (%) | (%) | (%) |
| | | | | | | | | | | | | | | | |
| United Financial Bancorp, Inc. | UBNK | MA | 1,079 | 0.42 | 2.99 | 20.95 | 20.93 | 11.83 | 210.2 | 45.5 | 43.7 | 92.9 | 93.0 | 19.47 | 2.03 |
| United Western Bancorp, Inc. | UWBK | CO | 2,096 | 0.48 | 8.91 | 5.41 | 5.41 | 19.00 | 138.0 | 13.6 | NA | 121.7 | 121.7 | 6.59 | 1.26 |
| Washington Federal, Inc. | WFSL | WA | 10,577 | 1.35 | 10.32 | 12.69 | 11.80 | 23.52 | 2,057.4 | 15.3 | 15.3 | 153.3 | 166.6 | 19.45 | 3.57 |
| Washington Mutual, Inc. | WM | WA | 327,913 | (0.02) | (0.28) | 7.50 | NA | 17.07 | 14,834.4 | NM | 56.4 | 69.5 | NA | 4.54 | 3.51 |
| Wayne Savings Bancshares, Inc. | WAYN | OH | 401 | 0.51 | 5.91 | 8.64 | 8.11 | 10.49 | 32.8 | 15.9 | 16.0 | 94.6 | 101.4 | 8.17 | 4.58 |
| Westfield Financial, Inc. | WFD | MA | 1,040 | 0.86 | 2.99 | 27.56 | 27.56 | 10.28 | 328.3 | 35.5 | NA | 114.6 | 114.6 | 31.58 | 1.95 |
| Willow Financial Bancorp, Inc. | WFBC | PA | NA | NA | NA | NA | NA | 7.84 | 122.8 | NA | NA | NA | NA | NA | 5.87 |
| WSB Holdings, Inc. | WSB | MD | 453 | 1.06 | 7.34 | 14.09 | 14.09 | 5.89 | 44.7 | 10.3 | NA | 70.0 | 70.0 | 9.87 | 2.72 |
| WSFS Financial Corporation | WSFS | DE | 3,201 | 0.97 | 14.14 | 6.59 | 6.55 | 46.66 | 287.8 | 10.4 | 10.5 | 136.4 | 138.4 | 8.99 | 0.86 |
| WVS Financial Corp. | WVFC | PA | 441 | 0.95 | 12.83 | 7.20 | 7.20 | 16.10 | 36.0 | 9.3 | 9.3 | 114.8 | 114.8 | 8.26 | 3.98 |
| | | | | | | | | | | | | | | | |
| Average | | | 6,598 | 0.41 | 3.71 | 11.48 | 10.64 | | 538.1 | 16.8 | 16.9 | 98.8 | 114.9 | 11.27 | 2.67 |
| Median | | | 878 | 0.47 | 4.46 | 9.64 | 8.29 | | 90.5 | 15.9 | 15.8 | 96.7 | 104.1 | 9.38 | 2.91 |
Note: Includes all public thrifts listed on NYSE, AMEX, and NASDAQ National Market.
Source: SNL Financial.
Feldman Financial Advisors, Inc.
Exhibit IV-1
Pro Forma Assumptions for Full Conversion Valuation
| 1. | The total amount of the net offering proceeds from the sale of the 63.1% MHC owned interest to the public was fully invested at the beginning of the applicable period. |
| 2. | The new holding company will sell all shares of common stock in the subscription offering and community offering with no shares sold in a syndicated community offering. |
| 3. | The net offering proceeds are invested to yield a return of 3.34%, which represented the yield on one-year U.S. Treasury securities at December 31, 2007. The effective income tax rate was assumed to be 34.0%, resulting in a net after-tax yield of 2.20%. |
| 4. | It is assumed that 4.0% of the shares of common stock sold in the offering will be acquired by the Company’s ESOP. Pro forma adjustments have been made to earnings and equity to reflect the impact of the ESOP purchase. The annual expense is estimated based on a fifteen-year period. No reinvestment is assumed on proceeds used to fund the ESOP. |
| 5. | Assumes that open market purchases of shares equal to 3.07% of the shares of common stock sold in the offering for the recognition plan (“RSP”). Pro forma adjustments have been made to earnings and equity to reflect the impact of the RSP. The annual expense is estimated based on a five-year vesting period. No reinvestment is assumed on proceeds used to fund the RSP. |
| 6. | The adjustment to pro forma net income for stock options reflects the compensation expense associated with the stock options that may be granted, if the plan is approved by stockholders. A number of shares equal to 7.68% of the shares of common stock sold in the offering, is assumed. We assumed that the options would vest at a rate of 20% per year and that compensation expense would be recognized on a straight-line basis over the 5-year vesting period. |
| 7. | Fixed offering expenses are estimated at $950,000. |
| 8. | Marketing fees for the stock offering are estimated at 1.4% of the amount of stock sold in the subscription offering, excluding sales to directors, officers, employees, and stock-benefit plans. |
| 9. | 20,300 shares of common stock will be purchased by Home Federal Bancorp's executive officers and directors, and their immediate families. |
| 10. | No effect has been given to withdrawals from deposit accounts for the purpose of purchasing common stock in the offering. |
| 11. | No effect has been given in the pro forma equity calculation for the assumed earnings on the net proceeds. |
Feldman Financial Advisors, Inc.
Exhibit IV-2
Pro Forma Fully Converted Valuation Range
Home Federal Bancorp
Historical Financial Data as of December 31, 2007
(Dollars in Thousands, Except Per Share Data)
| | | | 1,530,000 | | | | 1,530,000 | | | | 1,800,000 | | | | 2,070,000 | | | | 2,380,500 | |
| | | Shares Sold | | | Shares Sold | | | Shares Sold | | | Shares Sold | | | Shares Sold | |
| | | Minimum, | | | | | | | | | | | | | | | Maximum, | |
| | | as Adjusted | | | Minimum | | | Midpoint | | | Maximum | | | as Adjusted | |
| Gross Proceeds of Offering | | | 15,300 | | | | 15,300 | | | | 18,000 | | | | 20,700 | | | | 23,805 | |
| Fair value of shares exchanged for existing shares | | | 8,941 | | | | 8,941 | | | | 10,519 | | | | 12,097 | | | | 13,912 | |
| Fair value of shares issued in merger with First Louisiana | | | 10,952 | | | | 13,247 | | | | 13,247 | | | | 13,247 | | | | 13,247 | |
| Pro Forma value | | | 35,194 | | | | 37,489 | | | | 41,766 | | | | 46,044 | | | | 50,964 | |
| Offering price | | $ | 10.00 | | | $ | 10.00 | | | $ | 10.00 | | | $ | 10.00 | | | $ | 10.00 | |
| Exchange ratio | | | 0.71650 | | | | 0.71650 | | | | 0.84294 | | | | 0.96938 | | | | 1.11479 | |
| Gross Offering Proceeds | | | 15,300 | | | | 15,300 | | | | 18,000 | | | | 20,700 | | | | 23,805 | |
| Less: estimated expenses | | | (1,121 | ) | | | (1,153 | ) | | | (1,189 | ) | | | (1,225 | ) | | | (1,267 | ) |
| Net offering proceeds | | | 14,179 | | | | 14,147 | | | | 16,811 | | | | 19,475 | | | | 22,538 | |
| Less: merger shares used to complete the offering | | | (2,295 | ) | | | 0 | | | | 0 | | | | 0 | | | | 0 | |
| Less: ESOP purchase | | | (612 | ) | | | (612 | ) | | | (720 | ) | | | (828 | ) | | | (952 | ) |
| Less: RRP purchase | | | (470 | ) | | | (470 | ) | | | (553 | ) | | | (636 | ) | | | (731 | ) |
| Plus: assets received from mutual holding company | | | 100 | | | | 100 | | | | 100 | | | | 100 | | | | 100 | |
| Net investable proceeds, as adjusted | | $ | 10,902 | | | $ | 13,165 | | | $ | 15,638 | | | $ | 18,111 | | | $ | 20,955 | |
| Funds required to effect merger with First Louisiana | | | 9,894 | | | $ | 9,894 | | | $ | 9,894 | | | $ | 9,894 | | | $ | 9,894 | |
| Pro Forma Net Income: | | | | | | | | | | | | | | | | | | | | |
| Historical | | $ | 523 | | | $ | 523 | | | $ | 523 | | | $ | 523 | | | $ | 523 | |
| Pro forma income on net proceeds | | | 120 | | | | 145 | | | | 172 | | | | 200 | | | | 231 | |
| Pro forma impact of funding the merger with First Louisiana | | | (109 | ) | | | (109 | ) | | | (109 | ) | | | (109 | ) | | | (109 | ) |
| Pro forma state shares and franchise tax | | | (34 | ) | | | (41 | ) | | | (49 | ) | | | (58 | ) | | | (67 | ) |
| Less: Pro forma ESOP adjustment | | | (13 | ) | | | (13 | ) | | | (16 | ) | | | (18 | ) | | | (21 | ) |
| Less: Pro forma RRP adjustment | | | (31 | ) | | | (31 | ) | | | (36 | ) | | | (42 | ) | | | (48 | ) |
| Less: Pro forma option adjustment | | | (27 | ) | | | (27 | ) | | | (32 | ) | | | (36 | ) | | | (42 | ) |
| Pro forma net income | | $ | 429 | | | $ | 446 | | | $ | 453 | | | $ | 460 | | | $ | 467 | |
| Pro forma net income per share | | $ | 0.13 | | | $ | 0.12 | | | $ | 0.11 | | | $ | 0.10 | | | $ | 0.10 | |
| Pro Forma Core Earnings: | | | | | | | | | | | | | | | | | | | | |
| Historical | | $ | 459 | | | $ | 459 | | | $ | 459 | | | $ | 459 | | | $ | 459 | |
| Pro forma income on net proceeds | | $ | 120 | | | $ | 145 | | | $ | 172 | | | $ | 200 | | | $ | 231 | |
| Pro forma impact of funding the merger with First Louisiana | | | (109 | ) | | | (109 | ) | | | (109 | ) | | | (109 | ) | | | (109 | ) |
| Pro forma state shares and franchise tax | | | (34 | ) | | | (41 | ) | | | (49 | ) | | | (58 | ) | | | (67 | ) |
| Less: Pro forma ESOP adjustment | | | (13 | ) | | | (13 | ) | | | (16 | ) | | | (18 | ) | | | (21 | ) |
| Less: Pro forma RRP adjustment | | | (31 | ) | | | (31 | ) | | | (36 | ) | | | (42 | ) | | | (48 | ) |
| Less: Pro forma option adjustment | | | (27 | ) | | | (27 | ) | | | (32 | ) | | | (36 | ) | | | (42 | ) |
| Pro forma net income | | $ | 365 | | | $ | 382 | | | $ | 389 | | | $ | 396 | | | $ | 403 | |
| Pro forma net income per share | | $ | 0.11 | | | $ | 0.11 | | | $ | 0.10 | | | $ | 0.09 | | | $ | 0.08 | |
| Pro Forma Stockholders' Equity: | | $ | 45,011 | | | $ | 45,011 | | | $ | 45,011 | | | $ | 45,011 | | | $ | 45,011 | |
| Net offering proceeds | | | 14,179 | | | | 14,147 | | | | 16,811 | | | | 19,475 | | | | 22,538 | |
| Merger shares used to complete the offering | | | (2,295 | ) | | | 0 | | | | 0 | | | | 0 | | | | 0 | |
| Less: ESOP purchase | | | (612 | ) | | | (612 | ) | | | (720 | ) | | | (828 | ) | | | (952 | ) |
| Less: RRP purchase | | | (470 | ) | | | (470 | ) | | | (553 | ) | | | (636 | ) | | | (731 | ) |
| Plus: assets received from mutual holding company | | | 100 | | | | 100 | | | | 100 | | | | 100 | | | | 100 | |
| Pro forma total equity | | $ | 55,913 | | | $ | 58,176 | | | $ | 60,649 | | | $ | 63,122 | | | $ | 65,966 | |
| Pro forma book value | | $ | 15.89 | | | $ | 15.52 | | | $ | 14.52 | | | $ | 13.71 | | | $ | 12.94 | |
| Pro Forma Tangible Stockholders' Equity: | | $ | 31,698 | | | $ | 31,698 | | | $ | 31,698 | | | $ | 31,698 | | | $ | 31,698 | |
| Net offering proceeds | | | 14,179 | | | | 14,147 | | | | 16,811 | | | | 19,475 | | | | 22,538 | |
| Merger shares used to complete the offering | | | (2,295 | ) | | | 0 | | | | 0 | | | | 0 | | | | 0 | |
| Less: ESOP purchase | | | (612 | ) | | | (612 | ) | | | (720 | ) | | | (828 | ) | | | (952 | ) |
| Less: RRP purchase | | | (470 | ) | | | (470 | ) | | | (553 | ) | | | (636 | ) | | | (731 | ) |
| Plus: assets received from mutual holding company | | | 100 | | | | 100 | | | | 100 | | | | 100 | | | | 100 | |
| Pro forma tangible equity | | $ | 42,600 | | | $ | 44,863 | | | $ | 47,336 | | | $ | 49,809 | | | $ | 52,653 | |
| Pro forma tangible book value | | $ | 12.10 | | | $ | 11.97 | | | $ | 11.33 | | | $ | 10.82 | | | $ | 10.33 | |
| Pro Forma Total Assets: | | $ | 254,280 | | | $ | 254,280 | | | $ | 254,280 | | | $ | 254,280 | | | $ | 254,280 | |
| Net offering proceeds | | | 14,179 | | | | 14,147 | | | | 16,811 | | | | 19,475 | | | | 22,538 | |
| Merger shares used to complete the offering | | | (2,295 | ) | | | 0 | | | | 0 | | | | 0 | | | | 0 | |
| Less: ESOP purchase | | | (612 | ) | | | (612 | ) | | | (720 | ) | | | (828 | ) | | | (952 | ) |
| Less: RRP purchase | | | (470 | ) | | | (470 | ) | | | (553 | ) | | | (636 | ) | | | (731 | ) |
| Plus: assets received from mutual holding company | | | 100 | | | | 100 | | | | 100 | | | | 100 | | | | 100 | |
| Pro forma total assets | | $ | 265,182 | | | $ | 267,445 | | | $ | 269,918 | | | $ | 272,391 | | | $ | 275,235 | |
| Pro Forma Ratios: | | | | | | | | | | | | | | | | | | | | |
| Price / EPS - LTM | | | 38.5 | | | | 41.7 | | | | 45.5 | | | | 50.0 | | | | 50.0 | |
| Price / Core EPS - LTM | | | 45.5 | | | | 45.5 | | | | 50.0 | | | | 55.6 | | | | 62.5 | |
| Price / Book Value | | | 62.9 | % | | | 64.4 | % | | | 68.9 | % | | | 72.9 | % | | | 77.3 | % |
| Price / Tangible Book Value | | | 82.6 | % | | | 83.6 | % | | | 88.2 | % | | | 92.4 | % | | | 96.8 | % |
| Price / Total Assets | | | 13.27 | % | | | 14.02 | % | | | 15.47 | % | | | 16.90 | % | | | 18.52 | % |
| Equity / Assets | | | 21.08 | % | | | 21.75 | % | | | 22.47 | % | | | 23.17 | % | | | 23.97 | % |
| Tang. Equity / Assets | | | 16.91 | % | | | 17.65 | % | | | 18.45 | % | | | 19.23 | % | | | 20.10 | % |
Feldman Financial Advisors, Inc.
Exhibit IV-3
Pro Forma Fully Converted Analysis at Midpoint
Home Federal Bancorp
Historical Financial Data as of December 31, 2007
| Valuation Parameters | | | Symbol | | | Data | |
| Net income -- LTM as tax-effected | | | Y | | $ | 523,000 | |
| Core earnings -- LTM as tax-effected | | | Y | | | 459,000 | |
| Net worth | | | B | | | 45,011,000 | |
| Tangible net worth | | | B | | | 31,698,000 | |
| Total assets | | | A | | | 254,280,000 | |
| Expenses in conversion | | | X | | | 1,189,078 | |
| Other proceeds not reinvested | | | O | | | 1,272,764 | |
| ESOP purchase | | | E | | | 720,000 | |
| ESOP expense (pre-tax) | | | F | | | 15,840 | |
| RSP purchase | | | M | | | 552,764 | |
| RSP expense (pre-tax) | | | N | | | 36,482 | |
| Stock option expense (pre-tax) | | | Q | | | 31,611 | |
| Option expense tax-deductible | | | D | | | 0.00% | |
| Re-investment rate (after-tax) | | | R | | | 2.20% | |
| Tax rate | | | T | | | 34.00% | |
| Shares for EPS | | | S | | | 95.43% | |
| | | | | | | | |
| Pro Forma Valuation Ratios at Midpoint Value | | | | | | | |
| Price / EPS -- LTM | | | P/E | | | 45.45 | x |
| Price / Core EPS -- LTM | | | P/E | | | 50.00 | x |
| Price / Book Value | | | P/B | | | 68.87% | |
| Price / Tangible Book | | | P/TB | | | 88.23% | |
| Price / Assets | | | P/A | | | 15.47% | |
| Pro Forma Calculation at Midpoint Value (1) | | | | | | | | Based on |
| V = | | (P/E / S)*((Y-R*(O+X)-(F+N)*(1-T)-(Q-Q*D*T))) | | = | | $ | 28,519,190 | | [LTM earnings] |
| | | 1 - (P/E / S) * R | | | | | | | |
| | | | | | | | | | |
| V = | | (P/E / S)*((Y-R*(O+X)-(F+N)*(1-T))) | | = | | $ | 28,519,190 | | [Core earings] |
| | | 1 - (P/E / S) * R | | | | | | | |
| | | | | | | | | | |
| V = | | P/B * (B - X - E - M) | | = | | $ | 28,519,190 | | [Book value] |
| | | | 1 - P/B | | | | | | | |
| | | | | | | | | | | |
| V = | | P/TB * (B - X - E - M) | | = | | $ | 28,519,190 | | [Tangible book] |
| | | 1 - P/TB | | | | | | | |
| | | | | | | | | | | |
| V = | | P/A * (B - X - E - M) | | = | | $ | 28,519,190 | | [Total assets] |
| | | | 1 - P/A | | | | | | | |
| Pro Forma Valuation Range (1) | | | | | | | | | | | | | |
| Adj. Min. = | | $ | 24,241,310 | | | | x | | | | 0.85 | | = | | $ | 20,605,111 | |
| Minimum = | | $ | 28,519,190 | | | | x | | | | 0.85 | | = | | $ | 24,241,310 | |
| Midpoint = | | $ | 28,519,190 | | | | x | | | | 1.00 | | = | | $ | 28,519,190 | |
| Maximum = | | $ | 28,519,190 | | | | x | | | | 1.15 | | = | | $ | 32,797,070 | |
| Adj. Max. | | $ | 32,797,070 | | | | x | | | | 1.15 | | = | | $ | 37,716,625 | |
(1) Excludes value of shares issued to First Louisiana Bancshares
Feldman Financial Advisors, Inc.
Exhibit IV-4
Comparative Valuation Ratio Differential
Pro Forma Stock Offering Valuation
Computed from Market Price Data as of February 25, 2008
| | | | Home | | | Comparative | | | | |
| Valuation | | | | | Federal | | | Group | | | All Public | |
| Ratio | | Symbol | | | Bancorp | | | Average | | | Median | | | Average | | | Median | |
| | | | | | | | | | | | | | | | | |
| Price / EPS | | | P/E | | | | | | | 30.6 | | | | 25.4 | | | | 16.8 | | | | 15.9 | |
| Adj. Minimum | | | (X) | | | | 38.5 | | | | 25.5 | % | | | 51.7 | % | | | 129.4 | % | | | 142.0 | % |
| Minimum | | | | | | | 41.7 | | | | 36.0 | % | | | 64.3 | % | | | 148.5 | % | | | 162.1 | % |
| Midpoint | | | | | | | 45.5 | | | | 48.3 | % | | | 79.2 | % | | | 171.1 | % | | | 186.0 | % |
| Maximum | | | | | | | 50.0 | | | | 63.2 | % | | | 97.2 | % | | | 198.2 | % | | | 214.6 | % |
| Adj. Maximum | | | | | | | 50.0 | | | | 63.2 | % | | | 97.2 | % | | | 198.2 | % | | | 214.6 | % |
| | | | | | | | | | | | | | | | | | | | | | | | | |
| Price / Core EPS | | | P/E | | | | | | | | 33.8 | | | | 25.4 | | | | 16.9 | | | | 15.8 | |
| Adj. Minimum | | | (X) | | | | 45.5 | | | | 34.5 | % | | | 79.2 | % | | | 169.8 | % | | | 187.1 | % |
| Minimum | | | | | | | 45.5 | | | | 34.5 | % | | | 79.2 | % | | | 169.8 | % | | | 187.1 | % |
| Midpoint | | | | | | | 50.0 | | | | 47.9 | % | | | 97.2 | % | | | 196.7 | % | | | 215.9 | % |
| Maximum | | | | | | | 55.6 | | | | 64.3 | % | | | 119.1 | % | | | 229.7 | % | | | 251.0 | % |
| Adj. Maximum | | | | | | | 62.5 | | | | 84.9 | % | | | 146.5 | % | | | 270.9 | % | | | 294.8 | % |
| | | | | | | | | | | | | | | | | | | | | | | | | |
| Price / Book Value | | | P/B | | | | | | | | 95.4 | | | | 99.1 | | | | 98.8 | | | | 96.7 | |
| Adj. Minimum | | | (%) | | | | 62.9 | | | | -34.0 | % | | | -36.5 | % | | | -36.3 | % | | | -34.9 | % |
| Minimum | | | | | | | 64.4 | | | | -32.5 | % | | | -35.0 | % | | | -34.8 | % | | | -33.3 | % |
| Midpoint | | | | | | | 68.9 | | | | -27.8 | % | | | -30.5 | % | | | -30.3 | % | | | -28.8 | % |
| Maximum | | | | | | | 72.9 | | | | -23.6 | % | | | -26.4 | % | | | -26.1 | % | | | -24.5 | % |
| Adj. Maximum | | | | | | | 77.3 | | | | -19.0 | % | | | -22.0 | % | | | -21.7 | % | | | -20.1 | % |
| | | | | | | | | | | | | | | | | | | | | | | | | |
| Price / Tangible Book | | P/TB | | | | | | | | 97.9 | | | | 99.7 | | | | 114.9 | | | | 104.1 | |
| Adj. Minimum | | | (%) | | | | 82.6 | | | | -15.6 | % | | | -17.1 | % | | | -28.1 | % | | | -20.6 | % |
| Minimum | | | | | | | 83.6 | | | | -14.6 | % | | | -16.2 | % | | | -27.3 | % | | | -19.7 | % |
| Midpoint | | | | | | | 88.2 | | | | -9.9 | % | | | -11.5 | % | | | -23.2 | % | | | -15.2 | % |
| Maximum | | | | | | | 92.4 | | | | -5.6 | % | | | -7.2 | % | | | -19.6 | % | | | -11.2 | % |
| Adj. Maximum | | | | | | | 96.8 | | | | -1.1 | % | | | -2.9 | % | | | -15.8 | % | | | -7.0 | % |
| | | | | | | | | | | | | | | | | | | | | | | | | |
| Price / Total Assets | | | P/A | | | | | | | | 12.87 | | | | 11.50 | | | | 11.27 | | | | 9.38 | |
| Adj. Minimum | | | (%) | | | | 13.3 | | | | 3.1 | % | | | 15.4 | % | | | 17.8 | % | | | 41.5 | % |
| Minimum | | | | | | | 14.0 | | | | 8.9 | % | | | 21.9 | % | | | 24.4 | % | | | 49.4 | % |
| Midpoint | | | | | | | 15.5 | | | | 20.2 | % | | | 34.6 | % | | | 37.3 | % | | | 65.0 | % |
| Maximum | | | | | | | 16.9 | | | | 31.3 | % | | | 47.0 | % | | | 50.0 | % | | | 80.2 | % |
| Adj. Maximum | | | | | | | 18.5 | | | | 43.8 | % | | | 61.0 | % | | | 64.3 | % | | | 97.4 | % |
Feldman Financial Advisors, Inc.
Exhibit IV-5
Pro Forma Fully Converted Valuation Range
Home Federal Bancorp
Historical Financial Data as of June 30, 2007
(Dollars in Thousands, Except Per Share Data)
| | | | 1,530,000 | | | | 1,530,000 | | | | 1,800,000 | | | | 2,070,000 | | | | 2,380,500 | |
| | | Shares Sold | | | Shares Sold | | | Shares Sold | | | Shares Sold | | | Shares Sold | |
| | | Minimum, | | | | | | | | | | | | | | Maximum, | |
| | | as Adjusted | | | Minimum | | | Midpoint | | | Maximum | | | as Adjusted | |
| Gross Proceeds of Offering | | | 15,300 | | | | 15,300 | | | | 18,000 | | | | 20,700 | | | | 23,805 | |
| Fair value of shares exchanged for existing shares | | | 8,941 | | | | 8,941 | | | | 10,519 | | | | 12,097 | | | | 13,912 | |
| Fair value of shares issued in merger with First Louisiana | | | 10,952 | | | | 13,247 | | | | 13,247 | | | | 13,247 | | | | 13,247 | |
| Pro Forma value | | | 35,194 | | | | 37,489 | | | | 41,766 | | | | 46,044 | | | | 50,964 | |
| Offering price | | $ | 10.00 | | | $ | 10.00 | | | $ | 10.00 | | | $ | 10.00 | | | $ | 10.00 | |
| Exchange ratio | | | 0.71650 | | | | 0.71650 | | | | 0.84294 | | | | 0.96938 | | | | 1.11479 | |
| Gross Offering Proceeds | | | 15,300 | | | | 15,300 | | | | 18,000 | | | | 20,700 | | | | 23,805 | |
| Less: estimated expenses | | | (1,121 | ) | | | (1,153 | ) | | | (1,189 | ) | | | (1,225 | ) | | | (1,267 | ) |
| Net offering proceeds | | | 14,179 | | | | 14,147 | | | | 16,811 | | | | 19,475 | | | | 22,538 | |
| Less: merger shares used to complete the offering | | | (2,295 | ) | | | 0 | | | | 0 | | | | 0 | | | | 0 | |
| Less: ESOP purchase | | | (612 | ) | | | (612 | ) | | | (720 | ) | | | (828 | ) | | | (952 | ) |
| Less: RRP purchase | | | (470 | ) | | | (470 | ) | | | (553 | ) | | | (636 | ) | | | (731 | ) |
| Plus: assets received from mutual holding company | | | 100 | | | | 100 | | | | 100 | | | | 100 | | | | 100 | |
| Net investable proceeds, as adjusted | | $ | 10,902 | | | $ | 13,165 | | | $ | 15,638 | | | $ | 18,111 | | | $ | 20,955 | |
| Funds required to effect merger with First Louisiana | | | 9,894 | | | $ | 9,894 | | | $ | 9,894 | | | $ | 9,894 | | | $ | 9,894 | |
| Pro Forma Net Income: | | | | | | | | | | | | | | | | | | | | |
| Historical | | $ | 1,549 | | | $ | 1,549 | | | $ | 1,549 | | | $ | 1,549 | | | $ | 1,549 | |
| Pro forma income on net proceeds | | | 353 | | | | 427 | | | | 507 | | | | 587 | | | | 679 | |
| Pro forma impact of funding the merger with First Louisiana | | | (321 | ) | | | (321 | ) | | | (321 | ) | | | (321 | ) | | | (321 | ) |
| Pro forma impact of funding the merger with First Louisiana | | | (67 | ) | | | (82 | ) | | | (99 | ) | | | (115 | ) | | | (134 | ) |
| Less: Pro forma ESOP adjustment | | | (27 | ) | | | (27 | ) | | | (32 | ) | | | (36 | ) | | | (42 | ) |
| Less: Pro forma RRP adjustment | | | (62 | ) | | | (62 | ) | | | (73 | ) | | | (84 | ) | | | (96 | ) |
| Less: Pro forma option adjustment | | | (54 | ) | | | (54 | ) | | | (63 | ) | | | (73 | ) | | | (84 | ) |
| Pro forma net income | | $ | 1,372 | | | $ | 1,430 | | | $ | 1,469 | | | $ | 1,507 | | | $ | 1,552 | |
| Pro forma net income per share | | $ | 0.40 | | | $ | 0.39 | | | $ | 0.36 | | | $ | 0.34 | | | $ | 0.31 | |
| Pro Forma Core Earnings: | | | | | | | | | | | | | | | | | | | | |
| Historical | | $ | 1,436 | | | $ | 1,436 | | | $ | 1,436 | | | $ | 1,436 | | | $ | 1,436 | |
| Pro forma income on net proceeds | | $ | 353 | | | $ | 427 | | | $ | 507 | | | $ | 587 | | | $ | 679 | |
| Pro forma impact of funding the merger with First Louisiana | | | (321 | ) | | | (321 | ) | | | (321 | ) | | | (321 | ) | | | (321 | ) |
| Pro forma impact of funding the merger with First Louisiana | | | (67 | ) | | | (82 | ) | | | (99 | ) | | | (115 | ) | | | (134 | ) |
| Less: Pro forma ESOP adjustment | | | (27 | ) | | | (27 | ) | | | (32 | ) | | | (36 | ) | | | (42 | ) |
| Less: Pro forma RRP adjustment | | | (62 | ) | | | (62 | ) | | | (73 | ) | | | (84 | ) | | | (96 | ) |
| Less: Pro forma option adjustment | | | (54 | ) | | | (54 | ) | | | (63 | ) | | | (73 | ) | | | (84 | ) |
| Pro forma net income | | $ | 1,259 | | | $ | 1,317 | | | $ | 1,356 | | | $ | 1,394 | | | $ | 1,439 | |
| Pro forma net income per share | | $ | 0.36 | | | $ | 0.36 | | | $ | 0.33 | | | $ | 0.31 | | | $ | 0.29 | |
| Pro Forma Stockholders' Equity: | | $ | 42,382 | | | $ | 42,382 | | | $ | 42,382 | | | $ | 42,382 | | | $ | 42,382 | |
| Net offering proceeds | | | 14,179 | | | | 14,147 | | | | 16,811 | | | | 19,475 | | | | 22,538 | |
| Merger shares used to complete the offering | | | (2,295 | ) | | | 0 | | | | 0 | | | | 0 | | | | 0 | |
| Less: ESOP purchase | | | (612 | ) | | | (612 | ) | | | (720 | ) | | | (828 | ) | | | (952 | ) |
| Less: RRP purchase | | | (470 | ) | | | (470 | ) | | | (553 | ) | | | (636 | ) | | | (731 | ) |
| Plus: assets received from mutual holding company | | | 100 | | | | 100 | | | | 100 | | | | 100 | | | | 100 | |
| Pro forma total equity | | $ | 53,284 | | | $ | 55,547 | | | $ | 58,020 | | | $ | 60,492 | | | $ | 63,336 | |
| Pro forma book value | | $ | 15.14 | | | $ | 14.82 | | | $ | 13.89 | | | $ | 13.14 | | | $ | 12.43 | |
| Pro Forma Tangible Stockholders' Equity: | | $ | 29,069 | | | $ | 29,069 | | | $ | 29,069 | | | $ | 29,069 | | | $ | 29,069 | |
| Net offering proceeds | | | 14,179 | | | | 14,147 | | | | 16,811 | | | | 19,475 | | | | 22,538 | |
| Merger shares used to complete the offering | | | (2,295 | ) | | | 0 | | | | 0 | | | | 0 | | | | 0 | |
| Less: ESOP purchase | | | (612 | ) | | | (612 | ) | | | (720 | ) | | | (828 | ) | | | (952 | ) |
| Less: RRP purchase | | | (470 | ) | | | (470 | ) | | | (553 | ) | | | (636 | ) | | | (731 | ) |
| Plus: assets received from mutual holding company | | | 100 | | | | 100 | | | | 100 | | | | 100 | | | | 100 | |
| Pro forma tangible equity | | $ | 39,971 | | | $ | 42,234 | | | $ | 44,707 | | | $ | 47,179 | | | $ | 50,023 | |
| Pro forma tangible book value | | $ | 11.36 | | | $ | 11.27 | | | $ | 10.70 | | | $ | 10.25 | | | $ | 9.82 | |
| Pro Forma Total Assets: | | $ | 238,549 | | | $ | 238,549 | | | $ | 238,549 | | | $ | 238,549 | | | $ | 238,549 | |
| Net offering proceeds | | | 14,179 | | | | 14,147 | | | | 16,811 | | | | 19,475 | | | | 22,538 | |
| Merger shares used to complete the offering | | | (2,295 | ) | | | 0 | | | | 0 | | | | 0 | | | | 0 | |
| Less: ESOP purchase | | | (612 | ) | | | (612 | ) | | | (720 | ) | | | (828 | ) | | | (952 | ) |
| Less: RRP purchase | | | (470 | ) | | | (470 | ) | | | (553 | ) | | | (636 | ) | | | (731 | ) |
| Plus: assets received from mutual holding company | | | 100 | | | | 100 | | | | 100 | | | | 100 | | | | 100 | |
| Pro forma total assets | | $ | 249,451 | | | $ | 251,714 | | | $ | 254,187 | | | $ | 256,659 | | | $ | 259,503 | |
| Pro Forma Ratios: | | | | | | | | | | | | | | | | | | | | |
| Price / EPS - LTM | | | 25.0 | | | | 25.6 | | | | 27.8 | | | | 29.4 | | | | 32.3 | |
| Price / Core EPS - LTM | | | 27.8 | | | | 27.8 | | | | 30.3 | | | | 32.3 | | | | 34.5 | |
| Price / Book Value | | | 66.1 | % | | | 67.5 | % | | | 72.0 | % | | | 76.1 | % | | | 80.5 | % |
| Price / Tangible Book Value | | | 88.0 | % | | | 88.8 | % | | | 93.4 | % | | | 97.6 | % | | | 101.9 | % |
| Price / Total Assets | | | 14.11 | % | | | 14.89 | % | | | 16.43 | % | | | 17.94 | % | | | 19.64 | % |
| Equity / Assets | | | 21.36 | % | | | 22.07 | % | | | 22.83 | % | | | 23.57 | % | | | 24.41 | % |
| Tang. Equity / Assets | | | 16.93 | % | | | 17.72 | % | | | 18.56 | % | | | 19.39 | % | | | 20.32 | % |
IV-5