UNITED STATES
SECURITIES AND EXCHANGE COMMISSION
Washington, D.C. 20549
FORM 6-K
Report of Foreign Issuer
Pursuant To Rule 13a-16 Or 15d-16 of the
Securities Exchange Act of 1934
For the month of November 2021
Commission File Number: 333-251238
|
COSAN S.A.
(Exact name of registrant as specified in its charter)
N/A
(Translation of registrant’s name into English)
|
Av. Brigadeiro Faria Lima, 4100, – 16th floor
São Paulo, SP 04538-132 Brazil
(Address of principal executive offices)
Indicate by check mark whether the registrant files or will file annual reports under cover of Form 20-F or Form 40‑F:
Form 20-F ☒ Form 40-F ☐
Indicate by check mark if the registrant is submitting the Form 6-K in paper as permitted by Regulation S-T Rule 101(b)(1):
Yes ☐ No ☒
Indicate by check mark if the registrant is submitting the Form 6-K in paper as permitted by Regulation S-T Rule 101(b)(7):
Yes ☐ No ☒
São Paulo, November 12, 2021 – COSAN S.A. (B3: CSAN3) (NYSE: CSAN) announces today its results for the third quarter (July, August, and September) of 2021 (3Q21). The results are presented on a consolidated basis, in conformity with the accounting practices adopted in Brazil and the international standards (IFRS). The comparisons made in this report consider the 3Q21 and 3Q20, except when otherwise indicated. Highlights of 3Q21 Cosan presented record adjusted pro forma EBITDA of R$3.4 billion (+7%), driven by operating results expansion, reflecting the resumption of economic activity. Net income for the quarter registered R$3.3 billion, considering all extraordinary effects, the highest net result in the Company's history. Raízen Renewables reached adjusted EBITDA of R$1.8 billion (+63%), reflecting higher ethanol prices. Sugar delivered adjusted EBITDA of R$603 million (-21%), due to the drop of sugar production and sales in the quarter. Marketing & Services presented adjusted EBITDA (Brazil + Argentina) of R$917 million (+1%), driven by the resumption of demand for fuels in both countries. Compass Gás & Energia reached EBITDA of R$871 million (+35%), supported by strong expansion in Comgás’ natural gas distributed. Moove totaled EBITDA of R$157 million (-12%) due to the decrease in volume sold, given the strong comparison basis. Rumo reached EBITDA of R$903 million (-19%), due to the lower transported volumes, affected by the corn crop setback. Executive Summary - Cosan Pro forma¹ 3Q21 3Q20 Chg. % 2Q21 Chg. % BRL mln (Jul-Sep) (Jul-Sep) 3Q21/3Q20 (Apr-Jun) 3Q21/2Q21 Net Revenue 31,016.7 19,509.3 59.0% 25,214.5 23.0% Gross profit 3,224.1 2,914.2 10.6% 2,971.7 8.5% Adjusted EBITDA² 3,441.4 3,226.4 6.7% 3,031.2 13.5% Net Income 3,264.7 222.9 n/a 942.4 n/a Adjusted Net Income2 531.0 498.5 6.5% 996.6 -46.7% Investments³ 1,745.2 1,366.1 27.8% 1,870.6 -6.7% Cash Generated (Used)4 8,343.3 2,493.3 n/a 794.0 n/a Net Debt5 28,610.4 27,510.2 4.0% 27,982.1 2.2% Leverage (Net Debt/EBITDA LTM)6 2.1x 3.1x -1,0x 2.8x -0,7x Note 1: Considers the consolidation of 50% of Raízen, also in pro forma basis. Note 2: Adjusted EBITDA and net income exclude the specific effects incurred in the quarters, detailed on page 7 of this report, including Biosev results. Note 3: Includes investments in assets derived from contracts with clients at Raízen and Comgás. Note 4: Generation of Pro forma Free Cash to shareholders, before dividends paid (Free Cash Flow to Equity). Note 5: Includes liabilities with preferred shareholders in subsidiaries until 2Q21 and excludes lease liabilities (IFRS 16). Note 6: EBITDA LTM adjusted by the effect of Comgás CCR in the last periods to March 31, 2020 and by the lease liabilities (IFRS 16) at Raízen.CONFERENCE CALL November 16, 2021 (Tuesday) Portuguese (simultaneous translation into English) Time: 11:00 a.m. (Brasília) | 09:00 a.m. (New York) HD Webinar EN: click here (Code 7253) HD Webinar BR: click here (Code 7173) US: +1 (914) 359-2483 BR: +55 (11) 4935-1146 INVESTOR RELATIONS E-mail: ri@cosan.com.br Phone: +55 11 3897-9797 Website: www.cosan.com.br/en/
.
A. Cosan Pro forma – Business Units For purposes of comparison of the results from previous periods, we present below the pro forma consolidated financial information, that is, consolidation of 100% of the results in direct subsidiaries and 50% of the results in co-subsidiary Raízen S.A., also pro forma, including results of Biosev, as explained below. On August 10, 2021, the acquisition of all the shares issued by Biosev was concluded. The integration of assets held by Biosev consolidates Raízen as the largest world producer of sugarcane, owning 35 bioenergy parks and a processing capacity of 105 million tons of sugarcane per harvest. To ensure greater transparency in the performance of Raízen's businesses, Biosev's results will be presented since the beginning of crop year 2021/22, starting on April 1, 2021, with adjustments and eliminations between businesses. For comparison purposes with the previous crop year (2020/21 crop), Raízen combined the results reported by Biosev with its results reported in 3Q20 and in the accumulated result for the 2020/21 crop year, without considering any adjustments and eliminations. It is worth remembering that this combination of results for the comparative period is not audited. More information is available in Raízen's earnings release (https://ri.raizen.com.br). The pro forma information is presented for purposes of clarification only and shall not be construed as an indication of the results. The comparisons made in this report consider the 3Q21 and 3Q20, except when otherwise indicated. The business units and Cosan’s market share in each sector, according to the abovementioned considerations, are described below: Raízen (44%) Renewables: Production and trading of Ethanol, Bioenergy and Other Renewable Sources Sugar: Sugar Production and Commercialization Marketing & Services: Fuels distribution and Proximity in Brazil and Argentina Compass Gás & Energia (91%)1 Distribution of Natural Gas and Others Moove (70%) Lubricants, Base oil and Specialties Rumo (30%) Logistics Operator Cosan Corporativo (100%) Corporate and Other Investments Note 1: Adjustment in participation from Sep/21, due to the partial conclusion of the capital increase rounds at Compass. Upon definitive completion, Cosan's final stake in Compass will be 88%.
B. Letter from the CEO Over the past few months, we have written another important chapter of Cosan’s history. We are keeping up with the pace of our marathon, focusing on the long term, overcoming obstacles and speeding up when tailwinds are favorable. In the macroeconomic scenario, we faced great volatility on prices, inflation, and interest rates, increasing the difficulty level of the journey, and demanding focus and technique from our teams. On the other hand, vaccination has brought the pandemic under control, allowing the gradual recovery of economic activity to accelerate, and leveraging consumption across the board, thereby paving the way for our portfolio to deliver record results in the quarter. The numbers are strong: we reached at Cosan adjusted EBITDA of R$3.4 billion, historical level of R$3.3 billion of net income, and R$8.3 billion worth of free cash flow to the equity. At Raízen, the commitment to continuous efficiency improvement and increased profitability has ensured the highest quarterly results in the Company’s history. In Renewables & Sugar, scale gains resulting from Biosev’s addition to our portfolio and our ability to maximize pricing and commercialization in a favorable environment for our products, has allowed us to overcome one of Brazil’s worst crops setbacks ever. Furthermore, we took an important step in our sustainable growth agenda with new contracts signed for the supply of E2G, Bioenergy, Biomethane, and Distributed Generation, reinforcing our role as leaders in the energy matrix transition with increased contribution of renewable sources. In Marketing & Services, we saw fuel volumes surpass pre-pandemic levels, sustaining healthy margins both in Brazil and in Argentina. We have continued to expand our integrated platform, which will soon include the Paraguay operation, by opening new proximity stores at an accelerated pace and consistently leveraging the number of Shell BOX transactions. Compass Gás & Energia delivered relevant results driven by distributed natural gas volumes. We’ve signed the Comgás concession extension until 2049, which will allow us to continue making investments to ensure gas supply, competitivity, safe operations, and customer satisfaction. In line with the Gaspetro acquisition strategy, we have acquired 51% of Sulgás equity, taking all of our experience to Rio Grande do Sul. In order to ensure the right capital structure and enable Compass’ expansion, we’ve placed a second round of private investments. Moove met expectations and presented another solid quarter in terms of results, supported by the resumption of demand and the right supply and commercialization strategy. Rumo was heavily impacted by the corn crop setback. The company has been taking the necessary measures to overcome short-term challenges, increasing market share, and keeping its capital discipline. As part of its liability management process, Rumo has issued another Green Bond, proposing to meet significant GHG emission reduction targets, while at the same time reducing the cost of debt. We are confident that the business’ long-term strategy is on track. We have taken an important step in signing the contract with the State of Mato Grosso to build Brazil’s first state railway, thereby connecting us to Lucas do Rio Verde (MT), providing further support to the flow of agribusiness exports, creating jobs, and contributing to the country’s development. I’m proud to share so many achievements in our permanent portfolio. As usual, we faced challenges and opportunities and, through great discipline and creativity, we have delivered robust and sustainable results. This has only been possible because we are a strong and integrated group, with competent people who think of the future and execute the strategy in the present. With that in mind, in the last few months we have launched a new investment vehicle in the group: Cosan Investimentos. Our purpose as a holding company is to create even more value based on what we do best: sustainable capital allocation and management. We will foster new business models that can be scaled up by our portfolio focused on energy and logistics infrastructure, and looking for naturally competitive sectors in Brazil, for digital expansion and innovation, so we can unleash the potential of our eco system. We have announced to the market our investments in mining & logistics (Mining JV), land management expansion (Radar) and, more recently, in mobility (Mobitech), with partners whose values are in line with ours and which complement us. Through Cosan Investimentos, we have also invested in the Climate Tech Fund, a fund managed by Fifth Wall and one of the largest venture capital managers specializing in technology innovation. This connects us with entrepreneurs, startups, and investors so that, together, we can think disruptively about how to accelerate the fight against climate change. Aligned to that, Cosan, along with over 100 other entrepreneurs, has joined the “Business Manifesto for Climate Action”, an initiative led by the CEBDS to position Brazil as a true green power. We are confident of being on the right path, with EESG principles as our strategic guidelines. Our actions reiterate our commitment with the decarbonization of the production chain and the sustainable development of our country. Congratulations Cosan team for your continued success on this journey. We have much to do. Let’s do it together! Warm Regards, Luis Henrique Guimarães CEO, Cosan
C. 3Q21 Executive Summary As of the first quarter of 2021, the earnings release reflects Cosan's new structure, after the conclusion of the corporate reorganization. Below, we present the highlights by business line, including Rumo, and the pro forma consolidated results of the Company. Raízen: Agroindustrial Operation: The second quarter of crop year 21’22 was significantly impacted by the climate related issues. Sugarcane production in the center-south region in Brazil was harshly hit by the driest weather in the last 90 years, besides some points of wildfires and frosts. In Raízen, the impacts were minimized, as a result of our journey to capture the agricultural efficiencies and productivity gains. Raízen’s Bioenergy Parks crushed 37.3 million tons of sugarcane (-5%) and produced 5.2 million t (-6%) of sugar equivalent, out of which 53% was destined to sugar. Lower sugarcane availability impacted the cash cost, pressured by the reduced dilution of fixed costs and by inflation in inputs and raw material. Renewables: Pro forma adjusted EBITDA totaled R$1.8 billion (+63%) in the period. Despite the lower volumes sold of both ethanol and bioenergy, the strong expansion of results reflects the better pricing of our products in the period, benefiting from a more favorable scenario for the biofuel. Sugar: Pro forma adjusted EBITDA reached R$ 603 million (-21%). The results reflect the lower sugar sales in the quarter but aligned with the commercialization strategy for the year, which will concentrate a higher sales volume in the second half of the crop. In addition, the crop setback reduced the sugar output. The increase of Raízen’s presence in the sugar value chain and the more favorable scenario for the commodity prices leveraged the sugar price in the quarter. Marketing & Services: Adjusted EBITDA for the integrated platform (Brazil + Argentina) totaled R$ 917 million (+1%). Sales volume registered a record level, especially in Brazil, with 15% growth compared to the same period in 2020, and 5% compared to the same period in 2019 (pre-pandemic). In Argentina, service station network expansion resulted in an increase in market share and a 27% growth in sales volume. The otto cycle demand keeps accelerated, reflecting the easing pandemic restrictions. The growth in Diesel demand was significant, leveraged by some sectors, such as agribusiness and transportation. In aviation, Raízen focused on sectors with greater profitability, as the network gradually resumes, which should be intensified with the opening of borders and the prospect of returning international flights. Compared to 2Q21, the reduction in adjusted EBITDA (-5%) reflects the reduction in gains from the supply and commercialization strategy. Compass Gás & Energia: EBITDA for the period achieved R$871 million (+35%), driven by strong increase in natural gas volumes distributed by Comgás (+14%). Volumes for the industrial segment grew 10% versus 3Q20, supported by the resumption of activities in virtually every sector we serve. In addition to the industry segment, the demand in commercial segment also presented relevant growth (+29%), given the lower restrictions in the period. The residential segment expanded 6%, reflecting the gross addition of 153,000 customers last year and the lower average temperature compared to the same period of last year. Moove: EBITDA reached R$157 million (-12%) in 3Q21, mainly reflecting the 26% reduction in sales volumes. It is worth mentioning that sales of 3Q20 represent a strong comparison basis once it captured additional demand from initial lockdown period. In addition, quarterly results continue to capture the benefits from the commercial and supply strategy, focused on maximizing the portfolio of premium products. Rumo: EBITDA came in R$903 million in the quarter (-19%), due to the 7% drop in transported volumes, affected by the corn crop setback. In addition, the lower mix for grains and lower fixed cost dilution squeezed margins resulting in a 8 p.p. drop in the EBITDA margin to 46%. Rumo gained 17 p.p. of grain market share in the Port of Santos (SP) in a quite challenging scenario, reflecting the commercial efforts to maximize its operational capacity. Cosan Consolidated (Pro forma): Adjusted EBITDA and adjusted net profit were R$3.4 billion (+7%) and R$531 million (+7%) respectively in 3Q21, following the group’s better operational performance. Free cash flow to equity (FCFE) totaled R$8.3 billion (+10x) mainly due to the proceeds from Raizen’s IPO and the private placement of Compass. As a result, leverage (net debt/LTM EBITDA) reduced to 2.1x in the period (-0,7x compared to 2Q21).
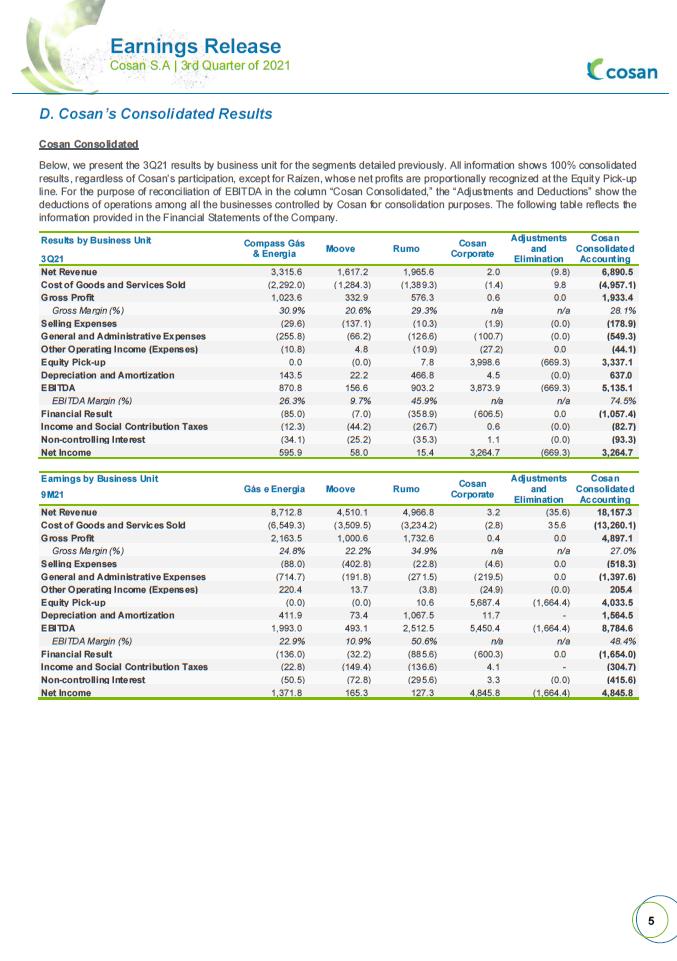
D. Cosan’s Consolidated Results Cosan Consolidated Below, we present the 3Q21 results by business unit for the segments detailed previously. All information shows 100% consolidated results, regardless of Cosan’s participation, except for Raízen, whose net profits are proportionally recognized at the Equity Pick-up line. For the purpose of reconciliation of EBITDA in the column “Cosan Consolidated,” the “Adjustments and Deductions” show the deductions of operations among all the businesses controlled by Cosan for consolidation purposes. The following table reflects the information provided in the Financial Statements of the Company. Results by Business Unit Compass Gás & Energia Moove Rumo Cosan Corporate Adjustments and Elimination Cosan Consolidated Accounting 3Q21 Net Revenue 3,315.6 1,617.2 1,965.6 2.0 (9.8) 6,890.5 Cost of Goods and Services Sold (2,292.0) (1,284.3) (1,389.3) (1.4) 9.8 (4,957.1) Gross Profit 1,023.6 332.9 576.3 0.6 0.0 1,933.4 Gross Margin (%) 30.9% 20.6% 29.3% n/a n/a 28.1% Selling Expenses (29.6) (137.1) (10.3) (1.9) (0.0) (178.9) General and Administrative Expenses (255.8) (66.2) (126.6) (100.7) (0.0) (549.3) Other Operating Income (Expenses) (10.8) 4.8 (10.9) (27.2) 0.0 (44.1) Equity Pick-up 0.0 (0.0) 7.8 3,998.6 (669.3) 3,337.1 Depreciation and Amortization 143.5 22.2 466.8 4.5 (0.0) 637.0 EBITDA 870.8 156.6 903.2 3,873.9 (669.3) 5,135.1 EBITDA Margin (%) 26.3% 9.7% 45.9% n/a n/a 74.5% Financial Result (85.0) (7.0) (358.9) (606.5) 0.0 (1,057.4) Income and Social Contribution Taxes (12.3) (44.2) (26.7) 0.6 (0.0) (82.7) Non-controlling Interest (34.1) (25.2) (35.3) 1.1 (0.0) (93.3) Net Income 595.9 58.0 15.4 3,264.7 (669.3) 3,264.7 Earnings by Business Unit Gás e Energia Moove Rumo Cosan Corporate Adjustments and Elimination Cosan Consolidated Accounting 9M21 Net Revenue 8,712.8 4,510.1 4,966.8 3.2 (35.6) 18,157.3 Cost of Goods and Services Sold (6,549.3) (3,509.5) (3,234.2) (2.8) 35.6 (13,260.1) Gross Profit 2,163.5 1,000.6 1,732.6 0.4 0.0 4,897.1 Gross Margin (%) 24.8% 22.2% 34.9% n/a n/a 27.0% Selling Expenses (88.0) (402.8) (22.8) (4.6) 0.0 (518.3) General and Administrative Expenses (714.7) (191.8) (271.5) (219.5) 0.0 (1,397.6) Other Operating Income (Expenses) 220.4 13.7 (3.8) (24.9) (0.0) 205.4 Equity Pick-up (0.0) (0.0) 10.6 5,687.4 (1,664.4) 4,033.5 Depreciation and Amortization 411.9 73.4 1,067.5 11.7 - 1,564.5 EBITDA 1,993.0 493.1 2,512.5 5,450.4 (1,664.4) 8,784.6 EBITDA Margin (%) 22.9% 10.9% 50.6% n/a n/a 48.4% Financial Result (136.0) (32.2) (885.6) (600.3) 0.0 (1,654.0) Income and Social Contribution Taxes (22.8) (149.4) (136.6) 4.1 - (304.7) Non-controlling Interest (50.5) (72.8) (295.6) 3.3 (0.0) (415.6) Net Income 1,371.8 165.3 127.3 4,845.8 (1,664.4) 4,845.8
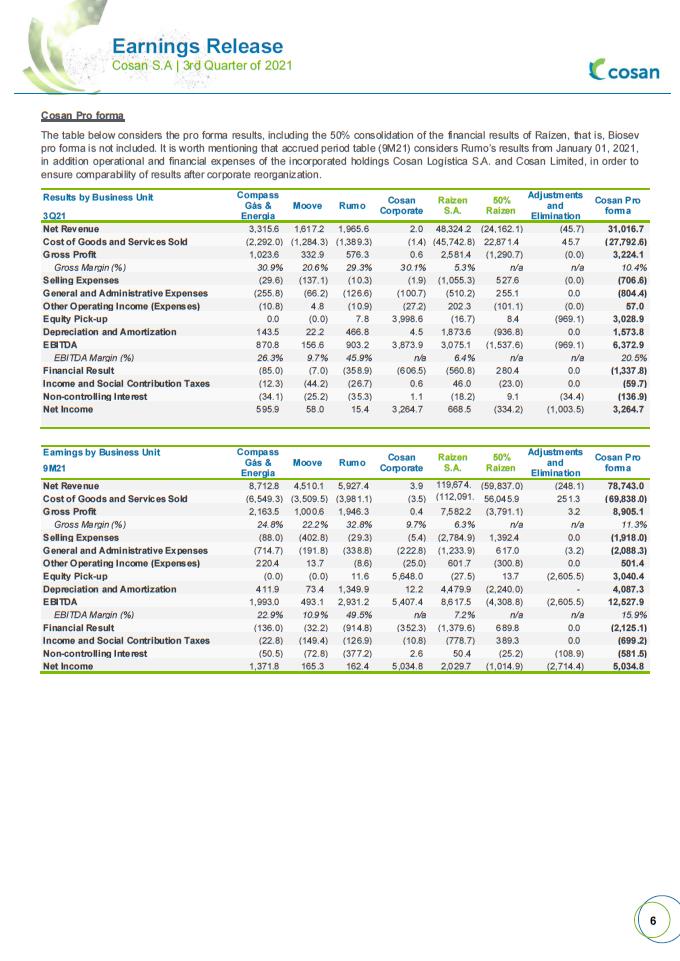
Cosan Pro forma The table below considers the pro forma results, including the 50% consolidation of the financial results of Raízen, that is, Biosev pro forma is not included. It is worth mentioning that accrued period table (9M21) considers Rumo’s results from January 01, 2021, in addition operational and financial expenses of the incorporated holdings Cosan Logística S.A. and Cosan Limited, in order to ensure comparability of results after corporate reorganization. Results by Business Unit Compass Gás & Energia Moove Rumo Cosan Corporate Raízen S.A. 50% Raízen Adjustments and Elimination Cosan Pro forma 3Q21 Net Revenue 3,315.6 1,617.2 1,965.6 2.0 48,324.2 (24,162.1) (45.7) 31,016.7 Cost of Goods and Services Sold (2,292.0) (1,284.3) (1,389.3) (1.4) (45,742.8) 22,871.4 45.7 (27,792.6) Gross Profit 1,023.6 332.9 576.3 0.6 2,581.4 (1,290.7) (0.0) 3,224.1 Gross Margin (%) 30.9% 20.6% 29.3% 30.1% 5.3% n/a n/a 10.4% Selling Expenses (29.6) (137.1) (10.3) (1.9) (1,055.3) 527.6 (0.0) (706.6) General and Administrative Expenses (255.8) (66.2) (126.6) (100.7) (510.2) 255.1 0.0 (804.4) Other Operating Income (Expenses) (10.8) 4.8 (10.9) (27.2) 202.3 (101.1) (0.0) 57.0 Equity Pick-up 0.0 (0.0) 7.8 3,998.6 (16.7) 8.4 (969.1) 3,028.9 Depreciation and Amortization 143.5 22.2 466.8 4.5 1,873.6 (936.8) 0.0 1,573.8 EBITDA 870.8 156.6 903.2 3,873.9 3,075.1 (1,537.6) (969.1) 6,372.9 EBITDA Margin (%) 26.3% 9.7% 45.9% n/a 6.4% n/a n/a 20.5% Financial Result (85.0) (7.0) (358.9) (606.5) (560.8) 280.4 0.0 (1,337.8) Income and Social Contribution Taxes (12.3) (44.2) (26.7) 0.6 46.0 (23.0) 0.0 (59.7) Non-controlling Interest (34.1) (25.2) (35.3) 1.1 (18.2) 9.1 (34.4) (136.9) Net Income 595.9 58.0 15.4 3,264.7 668.5 (334.2) (1,003.5) 3,264.7 Earnings by Business Unit Compass Gás & Energia Moove Rumo Cosan Corporate Raízen S.A. 50% Raízen Adjustments and Elimination Cosan Pro forma 9M21 Net Revenue 8,712.8 4,510.1 5,927.4 3.9 119,674.0 (59,837.0) (248.1) 78,743.0 Cost of Goods and Services Sold (6,549.3) (3,509.5) (3,981.1) (3.5) (112,091.9) 56,045.9 251.3 (69,838.0) Gross Profit 2,163.5 1,000.6 1,946.3 0.4 7,582.2 (3,791.1) 3.2 8,905.1 Gross Margin (%) 24.8% 22.2% 32.8% 9.7% 6.3% n/a n/a 11.3% Selling Expenses (88.0) (402.8) (29.3) (5.4) (2,784.9) 1,392.4 0.0 (1,918.0) General and Administrative Expenses (714.7) (191.8) (338.8) (222.8) (1,233.9) 617.0 (3.2) (2,088.3) Other Operating Income (Expenses) 220.4 13.7 (8.6) (25.0) 601.7 (300.8) 0.0 501.4 Equity Pick-up (0.0) (0.0) 11.6 5,648.0 (27.5) 13.7 (2,605.5) 3,040.4 Depreciation and Amortization 411.9 73.4 1,349.9 12.2 4,479.9 (2,240.0) - 4,087.3 EBITDA 1,993.0 493.1 2,931.2 5,407.4 8,617.5 (4,308.8) (2,605.5) 12,527.9 EBITDA Margin (%) 22.9% 10.9% 49.5% n/a 7.2% n/a n/a 15.9% Financial Result (136.0) (32.2) (914.8) (352.3) (1,379.6) 689.8 0.0 (2,125.1) Income and Social Contribution Taxes (22.8) (149.4) (126.9) (10.8) (778.7) 389.3 0.0 (699.2) Non-controlling Interest (50.5) (72.8) (377.2) 2.6 50.4 (25.2) (108.9) (581.5) Net Income 1,371.8 165.3 162.4 5,034.8 2,029.7 (1,014.9) (2,714.4) 5,034.8
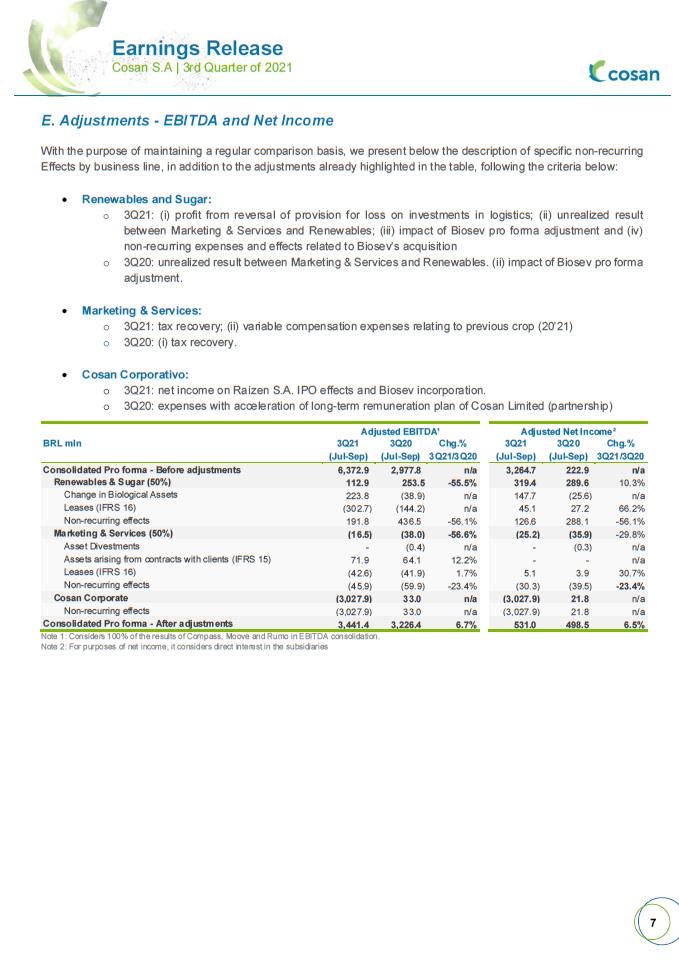
E. Adjustments - EBITDA and Net Income With the purpose of maintaining a regular comparison basis, we present below the description of specific non-recurring Effects by business line, in addition to the adjustments already highlighted in the table, following the criteria below: • Renewables and Sugar: o 3Q21: (i) profit from reversal of provision for loss on investments in logistics; (ii) unrealized result between Marketing & Services and Renewables; (iii) impact of Biosev pro forma adjustment and (iv) non-recurring expenses and effects related to Biosev’s acquisition o 3Q20: unrealized result between Marketing & Services and Renewables. (ii) impact of Biosev pro forma adjustment. • Marketing & Services: o 3Q21: tax recovery; (ii) variable compensation expenses relating to previous crop (20'21) o 3Q20: (i) tax recovery. • Cosan Corporativo: o 3Q21: net income on Raízen S.A. IPO effects and Biosev incorporation. o 3Q20: expenses with acceleration of long-term remuneration plan of Cosan Limited (partnership) Adjusted EBITDA¹ Adjusted Net Income² BRL mln 3Q21 3Q20 Chg.% 3Q21 3Q20 Chg.% (Jul-Sep) (Jul-Sep) 3Q21/3Q20 (Jul-Sep) (Jul-Sep) 3Q21/3Q20 Consolidated Pro forma - Before adjustments 6,372.9 2,977.8 n/a 3,264.7 222.9 n/a Renewables & Sugar (50%) 112.9 253.5 -55.5% 319.4 289.6 10.3% Change in Biological Assets 223.8 (38.9) n/a 147.7 (25.6) n/a Leases (IFRS 16) (302.7) (144.2) n/a 45.1 27.2 66.2% Non-recurring effects 191.8 436.5 -56.1% 126.6 288.1 -56.1% Marketing & Services (50%) (16.5) (38.0) -56.6% (25.2) (35.9) -29.8% Asset Divestments - (0.4) n/a - (0.3) n/a Assets arising from contracts with clients (IFRS 15) 71.9 64.1 12.2% - - n/a Leases (IFRS 16) (42.6) (41.9) 1.7% 5.1 3.9 30.7% Non-recurring effects (45.9) (59.9) -23.4% (30.3) (39.5) -23.4% Cosan Corporate (3,027.9) 33.0 n/a (3,027.9) 21.8 n/a Non-recurring effects (3,027.9) 33.0 n/a (3,027.9) 21.8 n/a Consolidated Pro forma - After adjustments 3,441.4 3,226.4 6.7% 531.0 498.5 6.5% Note 1: Considers 100% of the results of Compass, Moove and Rumo in EBITDA consolidation. Note 2: For purposes of net income, it considers direct interest in the subsidiaries
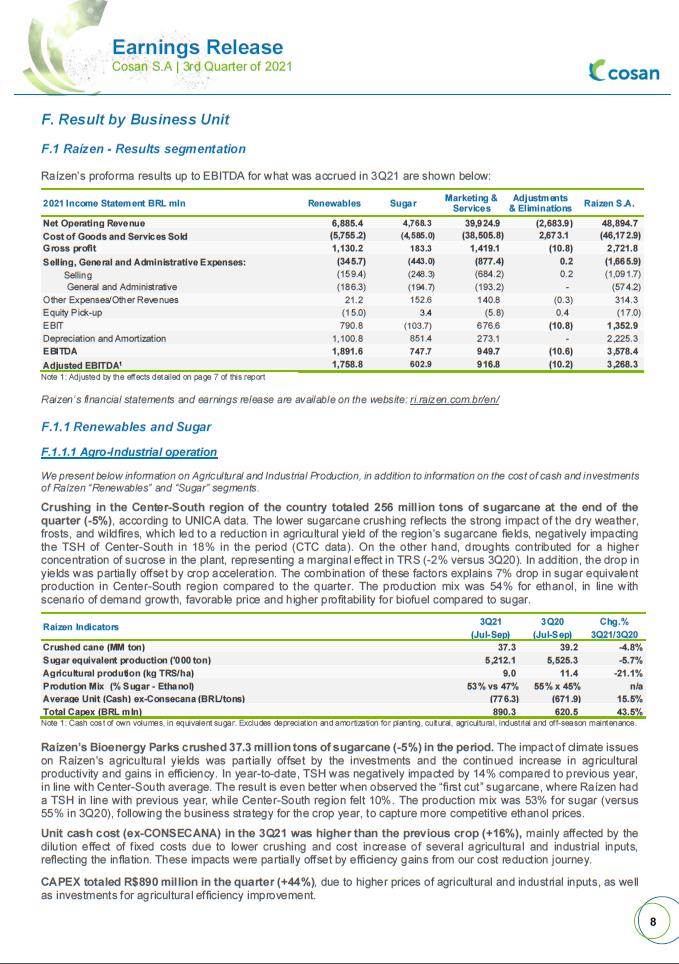
F. Result by Business Unit F.1 Raízen - Results segmentation Raízen’s proforma results up to EBITDA for what was accrued in 3Q21 are shown below: 2021 Income Statement BRL mln Renewables Sugar Marketing & Services Adjustments & Eliminations Raízen S.A. Net Operating Revenue 6,885.4 4,768.3 39,924.9 (2,683.9) 48,894.7 Cost of Goods and Services Sold (5,755.2) (4,585.0) (38,505.8) 2,673.1 (46,172.9) Gross profit 1,130.2 183.3 1,419.1 (10.8) 2,721.8 Selling, General and Administrative Expenses: (345.7) (443.0) (877.4) 0.2 (1,665.9) Selling (159.4) (248.3) (684.2) 0.2 (1,091.7) General and Administrative (186.3) (194.7) (193.2) - (574.2) Other Expenses/Other Revenues 21.2 152.6 140.8 (0.3) 314.3 Equity Pick-up (15.0) 3.4 (5.8) 0.4 (17.0) EBIT 790.8 (103.7) 676.6 (10.8) 1,352.9 Depreciation and Amortization 1,100.8 851.4 273.1 - 2,225.3 EBITDA 1,891.6 747.7 949.7 (10.6) 3,578.4 Adjusted EBITDA1 1,758.8 602.9 916.8 (10.2) 3,268.3 Note 1: Adjusted by the effects detailed on page 7 of this report Raizen’s financial statements and earnings release are available on the website: ri.raizen.com.br/en/ F.1.1 Renewables and Sugar F.1.1.1 Agro-Industrial operation We present below information on Agricultural and Industrial Production, in addition to information on the cost of cash and investments of Raízen “Renewables” and “Sugar” segments. Crushing in the Center-South region of the country totaled 256 million tons of sugarcane at the end of the quarter (-5%), according to UNICA data. The lower sugarcane crushing reflects the strong impact of the dry weather, frosts, and wildfires, which led to a reduction in agricultural yield of the region's sugarcane fields, negatively impacting the TSH of Center-South in 18% in the period (CTC data). On the other hand, droughts contributed for a higher concentration of sucrose in the plant, representing a marginal effect in TRS (-2% versus 3Q20). In addition, the drop in yields was partially offset by crop acceleration. The combination of these factors explains 7% drop in sugar equivalent production in Center-South region compared to the quarter. The production mix was 54% for ethanol, in line with scenario of demand growth, favorable price and higher profitability for biofuel compared to sugar. Raízen Indicators 3Q21 3Q20 Chg.% (Jul-Sep) (Jul-Sep) 3Q21/3Q20 Crushed cane (MM ton) 37.3 39.2 -4.8% Sugar equivalent production ('000 ton) 5,212.1 5,525.3 -5.7% Agricultural prodution (kg TRS/ha) 9.0 11.4 -21.1% Prodution Mix (% Sugar - Ethanol) 53% vs 47% 55% x 45% n/a Average Unit (Cash) ex-Consecana (BRL/tons) (776.3) (671.9) 15.5% Total Capex (BRL mln) 890.3 620.5 43.5% Note 1: Cash cost of own volumes, in equivalent sugar. Excludes depreciation and amortization for planting, cultural, agricultural, industrial and off-season maintenance. Raízen’s Bioenergy Parks crushed 37.3 million tons of sugarcane (-5%) in the period. The impact of climate issues on Raízen's agricultural yields was partially offset by the investments and the continued increase in agricultural productivity and gains in efficiency. In year-to-date, TSH was negatively impacted by 14% compared to previous year, in line with Center-South average. The result is even better when observed the “first cut” sugarcane, where Raízen had a TSH in line with previous year, while Center-South region felt 10%. The production mix was 53% for sugar (versus 55% in 3Q20), following the business strategy for the crop year, to capture more competitive ethanol prices. Unit cash cost (ex-CONSECANA) in the 3Q21 was higher than the previous crop (+16%), mainly affected by the dilution effect of fixed costs due to lower crushing and cost increase of several agricultural and industrial inputs, reflecting the inflation. These impacts were partially offset by efficiency gains from our cost reduction journey. CAPEX totaled R$890 million in the quarter (+44%), due to higher prices of agricultural and industrial inputs, as well as investments for agricultural efficiency improvement.
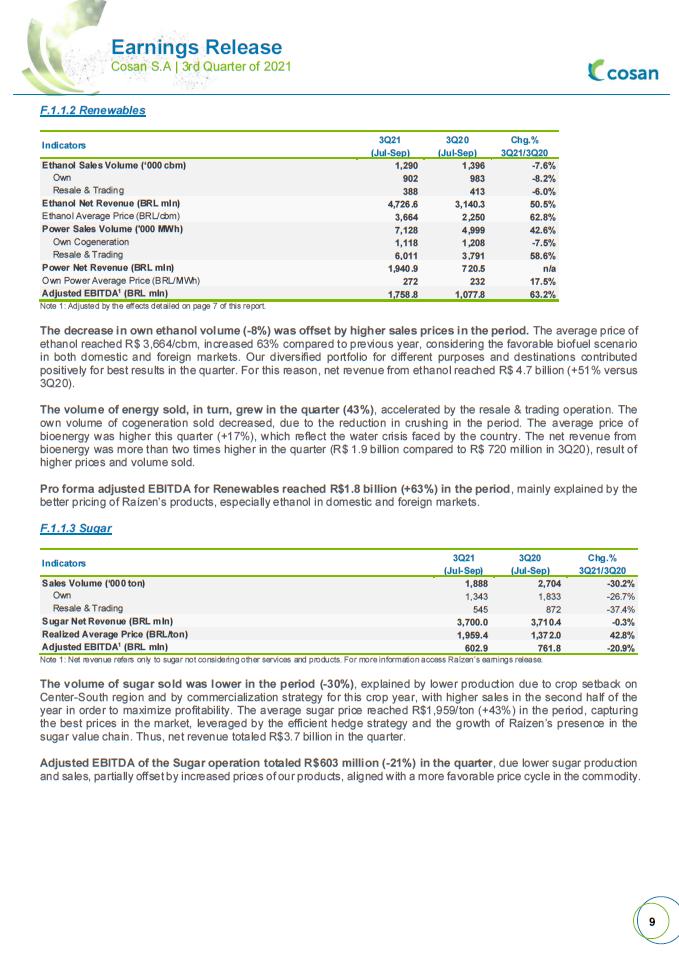
F.1.1.2 Renewables Indicators 3Q21 3Q20 Chg.% (Jul-Sep) (Jul-Sep) 3Q21/3Q20 Ethanol Sales Volume (‘000 cbm) 1,290 1,396 -7.6% Own 902 983 -8.2% Resale & Trading 388 413 -6.0% Ethanol Net Revenue (BRL mIn) 4,726.6 3,140.3 50.5% Ethanol Average Price (BRL/cbm) 3,664 2,250 62.8% Power Sales Volume ('000 MWh) 7,128 4,999 42.6% Own Cogeneration 1,118 1,208 -7.5% Resale & Trading 6,011 3,791 58.6% Power Net Revenue (BRL mIn) 1,940.9 720.5 n/a Own Power Average Price (BRL/MWh) 272 232 17.5% Adjusted EBITDA1 (BRL mIn) 1,758.8 1,077.8 63.2% Note 1: Adjusted by the effects detailed on page 7 of this report. The decrease in own ethanol volume (-8%) was offset by higher sales prices in the period. The average price of ethanol reached R$ 3,664/cbm, increased 63% compared to previous year, considering the favorable biofuel scenario in both domestic and foreign markets. Our diversified portfolio for different purposes and destinations contributed positively for best results in the quarter. For this reason, net revenue from ethanol reached R$ 4.7 billion (+51% versus 3Q20). The volume of energy sold, in turn, grew in the quarter (43%), accelerated by the resale & trading operation. The own volume of cogeneration sold decreased, due to the reduction in crushing in the period. The average price of bioenergy was higher this quarter (+17%), which reflect the water crisis faced by the country. The net revenue from bioenergy was more than two times higher in the quarter (R$ 1.9 billion compared to R$ 720 million in 3Q20), result of higher prices and volume sold. Pro forma adjusted EBITDA for Renewables reached R$1.8 billion (+63%) in the period, mainly explained by the better pricing of Raízen’s products, especially ethanol in domestic and foreign markets. F.1.1.3 Sugar Indicators 3Q21 3Q20 Chg.% (Jul-Sep) (Jul-Sep) 3Q21/3Q20 Sales Volume (‘000 ton) 1,888 2,704 -30.2% Own 1,343 1,833 -26.7% Resale & Trading 545 872 -37.4% Sugar Net Revenue (BRL mIn) 3,700.0 3,710.4 -0.3% Realized Average Price (BRL/ton) 1,959.4 1,372.0 42.8% Adjusted EBITDA1 (BRL mIn) 602.9 761.8 -20.9% Note 1: Net revenue refers only to sugar not considering other services and products. For more information access Raízen’s earnings release. The volume of sugar sold was lower in the period (-30%), explained by lower production due to crop setback on Center-South region and by commercialization strategy for this crop year, with higher sales in the second half of the year in order to maximize profitability. The average sugar price reached R$1,959/ton (+43%) in the period, capturing the best prices in the market, leveraged by the efficient hedge strategy and the growth of Raízen’s presence in the sugar value chain. Thus, net revenue totaled R$3.7 billion in the quarter. Adjusted EBITDA of the Sugar operation totaled R$603 million (-21%) in the quarter, due lower sugar production and sales, partially offset by increased prices of our products, aligned with a more favorable price cycle in the commodity.
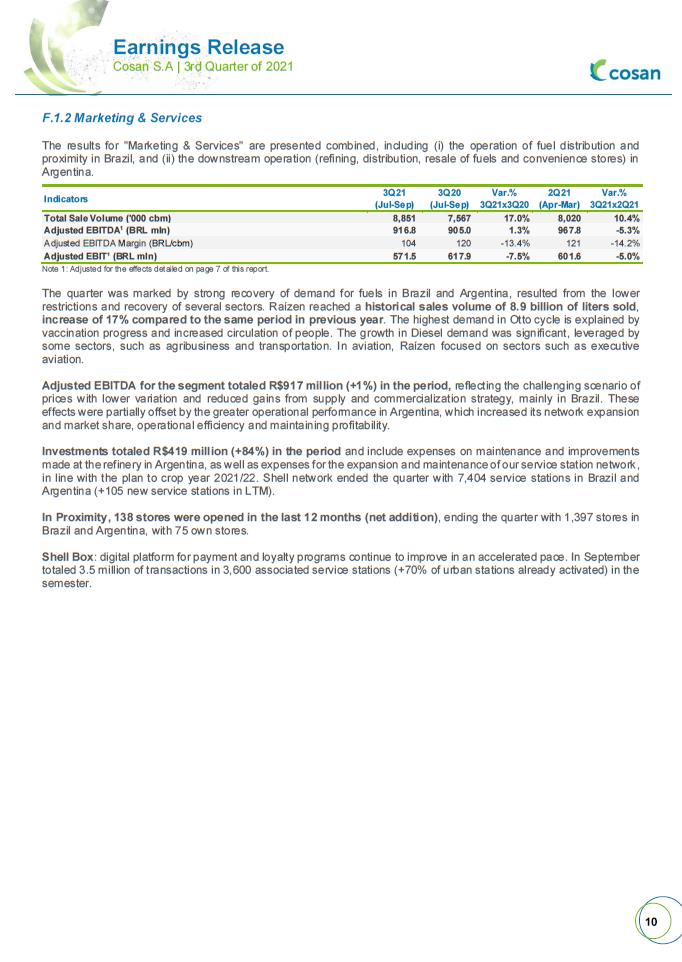
F.1.2 Marketing & Services The results for "Marketing & Services" are presented combined, including (i) the operation of fuel distribution and proximity in Brazil, and (ii) the downstream operation (refining, distribution, resale of fuels and convenience stores) in Argentina. Indicators 3Q21 3Q20 Var.% 2Q21 Var.% (Jul-Sep) (Jul-Sep) 3Q21x3Q20 (Apr-Mar) 3Q21x2Q21 Total Sale Volume ('000 cbm) 8,851 7,567 17.0% 8,020 10.4% Adjusted EBITDA1 (BRL mln) 916.8 905.0 1.3% 967.8 -5.3% Adjusted EBITDA Margin (BRL/cbm) 104 120 -13.4% 121 -14.2% Adjusted EBIT¹ (BRL mln) 571.5 617.9 -7.5% 601.6 -5.0% Note 1: Adjusted for the effects detailed on page 7 of this report. The quarter was marked by strong recovery of demand for fuels in Brazil and Argentina, resulted from the lower restrictions and recovery of several sectors. Raízen reached a historical sales volume of 8.9 billion of liters sold, increase of 17% compared to the same period in previous year. The highest demand in Otto cycle is explained by vaccination progress and increased circulation of people. The growth in Diesel demand was significant, leveraged by some sectors, such as agribusiness and transportation. In aviation, Raízen focused on sectors such as executive aviation. Adjusted EBITDA for the segment totaled R$917 million (+1%) in the period, reflecting the challenging scenario of prices with lower variation and reduced gains from supply and commercialization strategy, mainly in Brazil. These effects were partially offset by the greater operational performance in Argentina, which increased its network expansion and market share, operational efficiency and maintaining profitability. Investments totaled R$419 million (+84%) in the period and include expenses on maintenance and improvements made at the refinery in Argentina, as well as expenses for the expansion and maintenance of our service station network, in line with the plan to crop year 2021/22. Shell network ended the quarter with 7,404 service stations in Brazil and Argentina (+105 new service stations in LTM). In Proximity, 138 stores were opened in the last 12 months (net addition), ending the quarter with 1,397 stores in Brazil and Argentina, with 75 own stores. Shell Box: digital platform for payment and loyalty programs continue to improve in an accelerated pace. In September totaled 3.5 million of transactions in 3,600 associated service stations (+70% of urban stations already activated) in the semester.
.
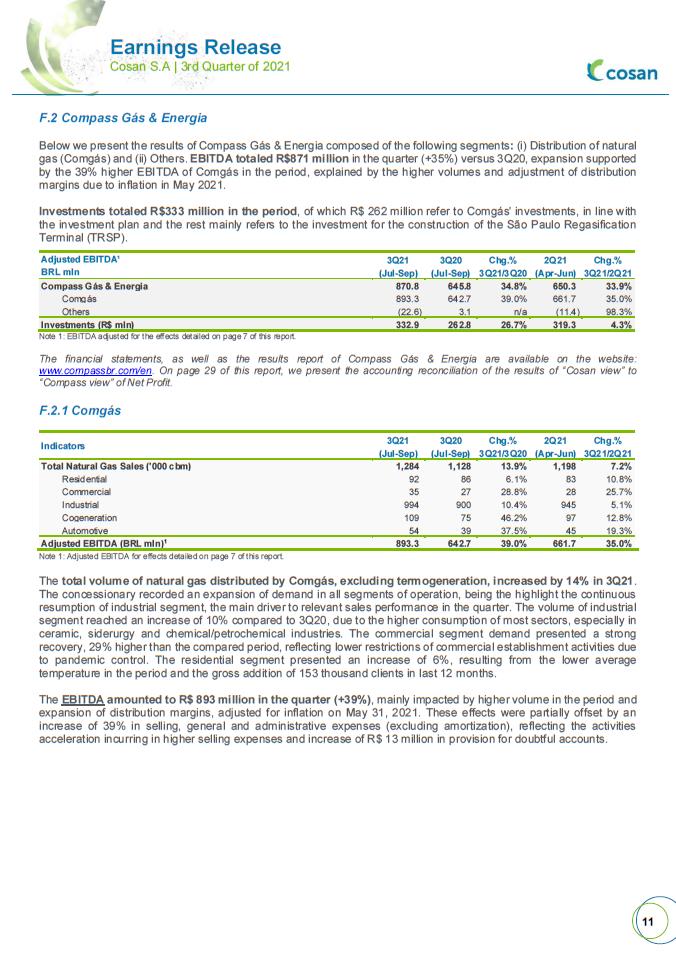
F.2 Compass Gás & Energia Below we present the results of Compass Gás & Energia composed of the following segments: (i) Distribution of natural gas (Comgás) and (ii) Others. EBITDA totaled R$871 million in the quarter (+35%) versus 3Q20, expansion supported by the 39% higher EBITDA of Comgás in the period, explained by the higher volumes and adjustment of distribution margins due to inflation in May 2021. Investments totaled R$333 million in the period, of which R$ 262 million refer to Comgás' investments, in line with the investment plan and the rest mainly refers to the investment for the construction of the São Paulo Regasification Terminal (TRSP). Adjusted EBITDA¹ 3Q21 3Q20 Chg.% 2Q21 Chg.% BRL mln (Jul-Sep) (Jul-Sep) 3Q21/3Q20 (Apr-Jun) 3Q21/2Q21 Compass Gás & Energia 870.8 645.8 34.8% 650.3 33.9% Comgás 893.3 642.7 39.0% 661.7 35.0% Others (22.6) 3.1 n/a (11.4) 98.3% Investments (R$ mln) 332.9 262.8 26.7% 319.3 4.3% Note 1: EBITDA adjusted for the effects detailed on page 7 of this report. The financial statements, as well as the results report of Compass Gás & Energia are available on the website: www.compassbr.com/en. On page 29 of this report, we present the accounting reconciliation of the results of “Cosan view” to “Compass view” of Net Profit. F.2.1 Comgás Indicators 3Q21 3Q20 Chg.% 2Q21 Chg.% (Jul-Sep) (Jul-Sep) 3Q21/3Q20 (Apr-Jun) 3Q21/2Q21 Total Natural Gas Sales ('000 cbm) 1,284 1,128 13.9% 1,198 7.2% Residential 92 86 6.1% 83 10.8% Commercial 35 27 28.8% 28 25.7% Industrial 994 900 10.4% 945 5.1% Cogeneration 109 75 46.2% 97 12.8% Automotive 54 39 37.5% 45 19.3% Adjusted EBITDA (BRL mIn)1 893.3 642.7 39.0% 661.7 35.0% Note 1: Adjusted EBITDA for effects detailed on page 7 of this report. The total volume of natural gas distributed by Comgás, excluding termogeneration, increased by 14% in 3Q21. The concessionary recorded an expansion of demand in all segments of operation, being the highlight the continuous resumption of industrial segment, the main driver to relevant sales performance in the quarter. The volume of industrial segment reached an increase of 10% compared to 3Q20, due to the higher consumption of most sectors, especially in ceramic, siderurgy and chemical/petrochemical industries. The commercial segment demand presented a strong recovery, 29% higher than the compared period, reflecting lower restrictions of commercial establishment activities due to pandemic control. The residential segment presented an increase of 6%, resulting from the lower average temperature in the period and the gross addition of 153 thousand clients in last 12 months. The EBITDA amounted to R$ 893 million in the quarter (+39%), mainly impacted by higher volume in the period and expansion of distribution margins, adjusted for inflation on May 31, 2021. These effects were partially offset by an increase of 39% in selling, general and administrative expenses (excluding amortization), reflecting the activities acceleration incurring in higher selling expenses and increase of R$ 13 million in provision for doubtful accounts.
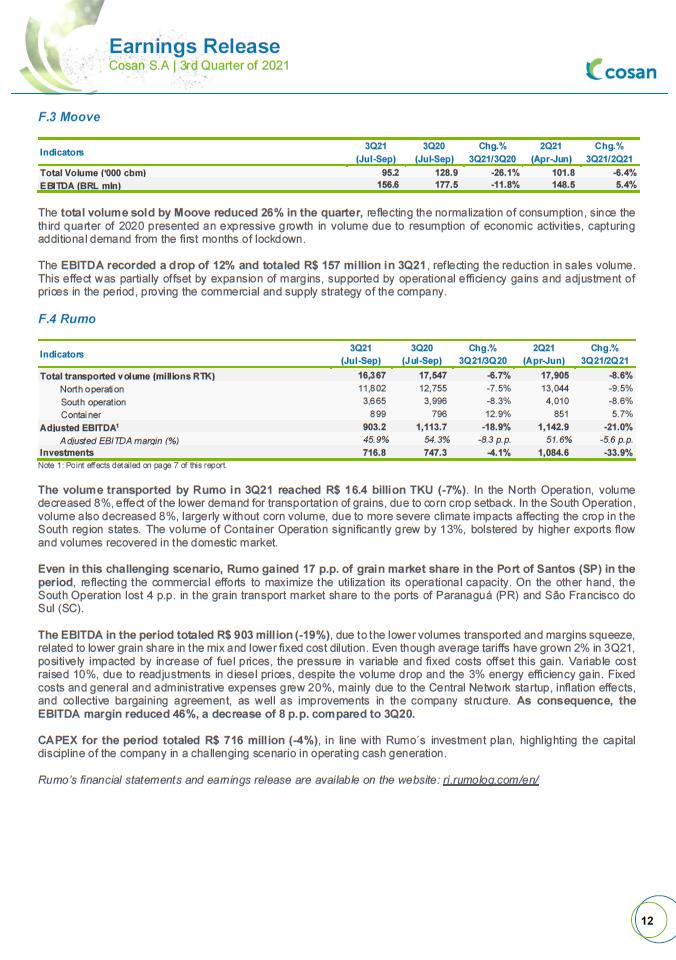
F.3 Moove Indicators 3Q21 3Q20 Chg.% 2Q21 Chg.% (Jul-Sep) (Jul-Sep) 3Q21/3Q20 (Apr-Jun) 3Q21/2Q21 Total Volume (‘000 cbm) 95.2 128.9 -26.1% 101.8 -6.4% EBITDA (BRL mln) 156.6 177.5 -11.8% 148.5 5.4% The total volume sold by Moove reduced 26% in the quarter, reflecting the normalization of consumption, since the third quarter of 2020 presented an expressive growth in volume due to resumption of economic activities, capturing additional demand from the first months of lockdown. The EBITDA recorded a drop of 12% and totaled R$ 157 million in 3Q21, reflecting the reduction in sales volume. This effect was partially offset by expansion of margins, supported by operational efficiency gains and adjustment of prices in the period, proving the commercial and supply strategy of the company. F.4 Rumo Indicators 3Q21 3Q20 Chg.% 2Q21 Chg.% (Jul-Sep) (Jul-Sep) 3Q21/3Q20 (Apr-Jun) 3Q21/2Q21 Total transported volume (millions RTK) 16,367 17,547 -6.7% 17,905 -8.6% North operation 11,802 12,755 -7.5% 13,044 -9.5% South operation 3,665 3,996 -8.3% 4,010 -8.6% Container 899 796 12.9% 851 5.7% Adjusted EBITDA1 903.2 1,113.7 -18.9% 1,142.9 -21.0% Adjusted EBITDA margin (%) 45.9% 54.3% -8.3 p.p. 51.6% -5.6 p.p. Investments 716.8 747.3 -4.1% 1,084.6 -33.9% Note 1: Point effects detailed on page 7 of this report. The volume transported by Rumo in 3Q21 reached R$ 16.4 billion TKU (-7%). In the North Operation, volume decreased 8%, effect of the lower demand for transportation of grains, due to corn crop setback. In the South Operation, volume also decreased 8%, largerly without corn volume, due to more severe climate impacts affecting the crop in the South region states. The volume of Container Operation significantly grew by 13%, bolstered by higher exports flow and volumes recovered in the domestic market. Even in this challenging scenario, Rumo gained 17 p.p. of grain market share in the Port of Santos (SP) in the period, reflecting the commercial efforts to maximize the utilization its operational capacity. On the other hand, the South Operation lost 4 p.p. in the grain transport market share to the ports of Paranaguá (PR) and São Francisco do Sul (SC). The EBITDA in the period totaled R$ 903 million (-19%), due to the lower volumes transported and margins squeeze, related to lower grain share in the mix and lower fixed cost dilution. Even though average tariffs have grown 2% in 3Q21, positively impacted by increase of fuel prices, the pressure in variable and fixed costs offset this gain. Variable cost raised 10%, due to readjustments in diesel prices, despite the volume drop and the 3% energy efficiency gain. Fixed costs and general and administrative expenses grew 20%, mainly due to the Central Network startup, inflation effects, and collective bargaining agreement, as well as improvements in the company structure. As consequence, the EBITDA margin reduced 46%, a decrease of 8 p.p. compared to 3Q20. CAPEX for the period totaled R$ 716 million (-4%), in line with Rumo´s investment plan, highlighting the capital discipline of the company in a challenging scenario in operating cash generation. Rumo’s financial statements and earnings release are available on the website: ri.rumolog.com/en/
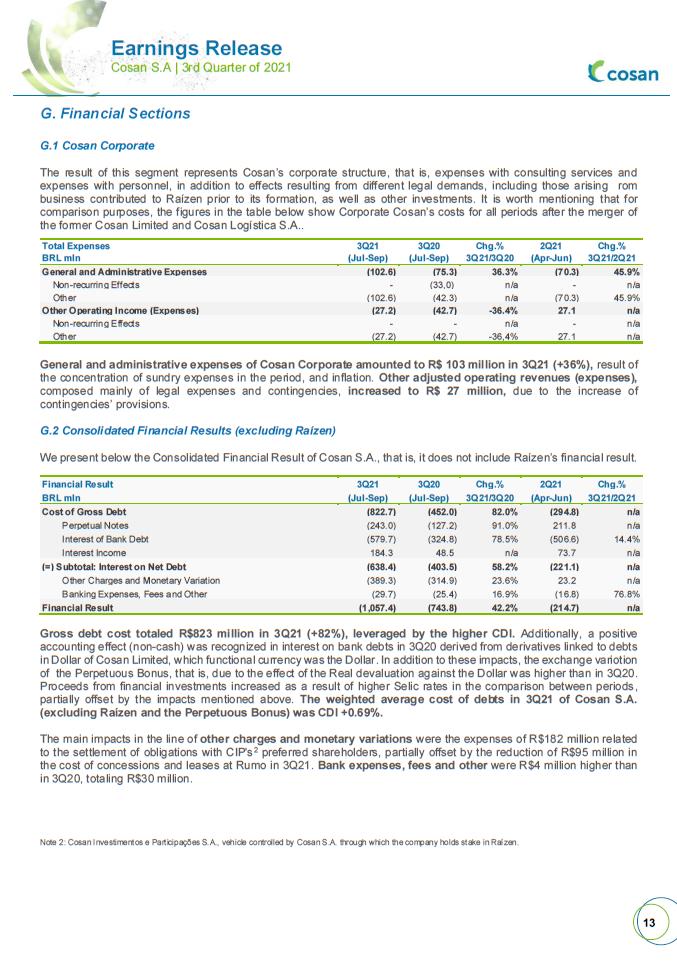
G. Financial Sections G.1 Cosan Corporate The result of this segment represents Cosan’s corporate structure, that is, expenses with consulting services and expenses with personnel, in addition to effects resulting from different legal demands, including those arising rom business contributed to Raízen prior to its formation, as well as other investments. It is worth mentioning that for comparison purposes, the figures in the table below show Corporate Cosan’s costs for all periods after the merger of the former Cosan Limited and Cosan Logística S.A.. Total Expenses 3Q21 3Q20 Chg.% 2Q21 Chg.% BRL mln (Jul-Sep) (Jul-Sep) 3Q21/3Q20 (Apr-Jun) 3Q21/2Q21 General and Administrative Expenses (102.6) (75.3) 36.3% (70.3) 45.9% Non-recurring Effects - (33,0) n/a - n/a Other (102.6) (42.3) n/a (70.3) 45.9% Other Operating Income (Expenses) (27.2) (42.7) -36.4% 27.1 n/a Non-recurring Effects - - n/a - n/a Other (27.2) (42.7) -36,4% 27.1 n/a General and administrative expenses of Cosan Corporate amounted to R$ 103 million in 3Q21 (+36%), result of the concentration of sundry expenses in the period, and inflation. Other adjusted operating revenues (expenses), composed mainly of legal expenses and contingencies, increased to R$ 27 million, due to the increase of contingencies’ provisions. G.2 Consolidated Financial Results (excluding Raízen) We present below the Consolidated Financial Result of Cosan S.A., that is, it does not include Raízen’s financial result. Financial Result 3Q21 3Q20 Chg.% 2Q21 Chg.% BRL mln (Jul-Sep) (Jul-Sep) 3Q21/3Q20 (Apr-Jun) 3Q21/2Q21 Cost of Gross Debt (822.7) (452.0) 82.0% (294.8) n/a Perpetual Notes (243.0) (127.2) 91.0% 211.8 n/a Interest of Bank Debt (579.7) (324.8) 78.5% (506.6) 14.4% Interest Income 184.3 48.5 n/a 73.7 n/a (=) Subtotal: Interest on Net Debt (638.4) (403.5) 58.2% (221.1) n/a Other Charges and Monetary Variation (389.3) (314.9) 23.6% 23.2 n/a Banking Expenses, Fees and Other (29.7) (25.4) 16.9% (16.8) 76.8% Financial Result (1,057.4) (743.8) 42.2% (214.7) n/a Gross debt cost totaled R$823 million in 3Q21 (+82%), leveraged by the higher CDI. Additionally, a positive accounting effect (non-cash) was recognized in interest on bank debts in 3Q20 derived from derivatives linked to debts in Dollar of Cosan Limited, which functional currency was the Dollar. In addition to these impacts, the exchange variotion of the Perpetuous Bonus, that is, due to the effect of the Real devaluation against the Dollar was higher than in 3Q20. Proceeds from financial investments increased as a result of higher Selic rates in the comparison between periods, partially offset by the impacts mentioned above. The weighted average cost of debts in 3Q21 of Cosan S.A. (excluding Raízen and the Perpetuous Bonus) was CDI +0.69%. The main impacts in the line of other charges and monetary variations were the expenses of R$182 million related to the settlement of obligations with CIP's2 preferred shareholders, partially offset by the reduction of R$95 million in the cost of concessions and leases at Rumo in 3Q21. Bank expenses, fees and other were R$4 million higher than in 3Q20, totaling R$30 million. Note 2: Cosan Investimentos e Participações S.A., vehicle controlled by Cosan S.A. through which the company holds stake in Raízen.
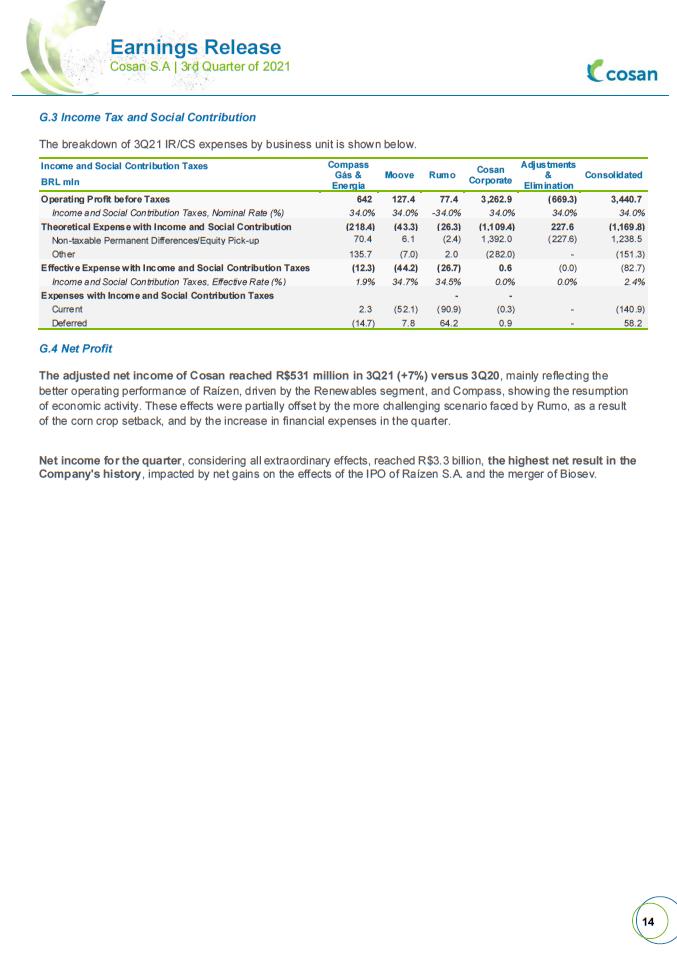
G.3 Income Tax and Social Contribution The breakdown of 3Q21 IR/CS expenses by business unit is shown below. Income and Social Contribution Taxes Compass Gás & Energia Moove Rumo Cosan Corporate Adjustments & Elimination Consolidated BRL mln Operating Profit before Taxes 642 127.4 77.4 3,262.9 (669.3) 3,440.7 Income and Social Contribution Taxes, Nominal Rate (%) 34.0% 34.0% -34.0% 34.0% 34.0% 34.0% Theoretical Expense with Income and Social Contribution (218.4) (43.3) (26.3) (1,109.4) 227.6 (1,169.8) Non-taxable Permanent Differences/Equity Pick-up 70.4 6.1 (2.4) 1,392.0 (227.6) 1,238.5 Other 135.7 (7.0) 2.0 (282.0) - (151.3) Effective Expense with Income and Social Contribution Taxes (12.3) (44.2) (26.7) 0.6 (0.0) (82.7) Income and Social Contribution Taxes, Effective Rate (%) 1.9% 34.7% 34.5% 0.0% 0.0% 2.4% Expenses with Income and Social Contribution Taxes - - Current 2.3 (52.1) (90.9) (0.3) - (140.9) Deferred (14.7) 7.8 64.2 0.9 - 58.2 G.4 Net Profit The adjusted net income of Cosan reached R$531 million in 3Q21 (+7%) versus 3Q20, mainly reflecting the better operating performance of Raízen, driven by the Renewables segment, and Compass, showing the resumption of economic activity. These effects were partially offset by the more challenging scenario faced by Rumo, as a result of the corn crop setback, and by the increase in financial expenses in the quarter. Net income for the quarter, considering all extraordinary effects, reached R$3.3 billion, the highest net result in the Company's history, impacted by net gains on the effects of the IPO of Raízen S.A. and the merger of Biosev.
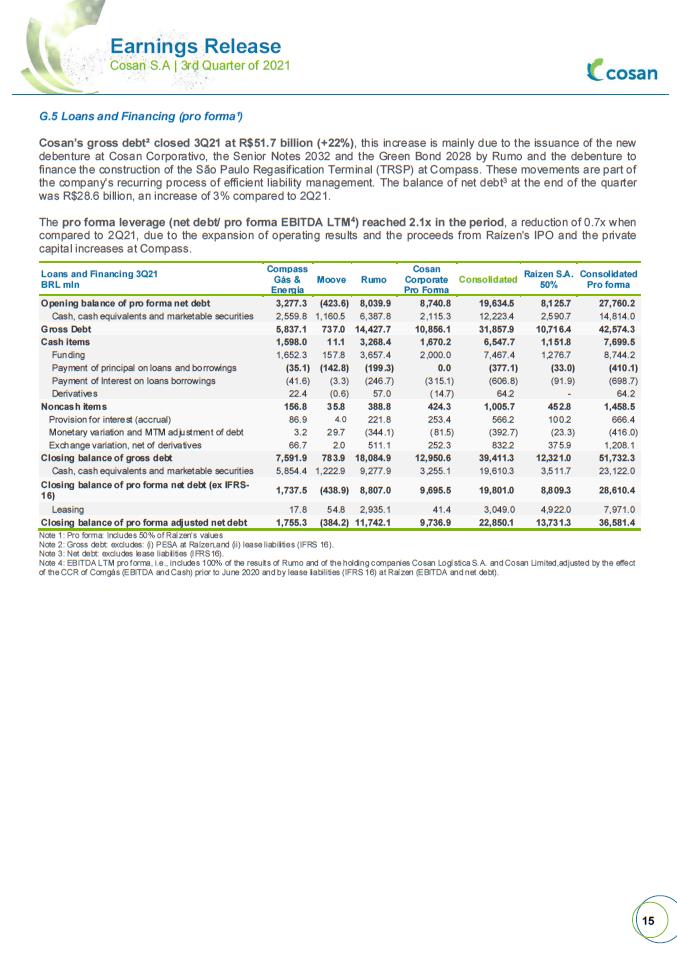
G.5 Loans and Financing (pro forma¹) Cosan’s gross debt² closed 3Q21 at R$51.7 billion (+22%), this increase is mainly due to the issuance of the new debenture at Cosan Corporativo, the Senior Notes 2032 and the Green Bond 2028 by Rumo and the debenture to finance the construction of the São Paulo Regasification Terminal (TRSP) at Compass. These movements are part of the company's recurring process of efficient liability management. The balance of net debt3 at the end of the quarter was R$28.6 billion, an increase of 3% compared to 2Q21. The pro forma leverage (net debt/ pro forma EBITDA LTM4) reached 2.1x in the period, a reduction of 0.7x when compared to 2Q21, due to the expansion of operating results and the proceeds from Raízen's IPO and the private capital increases at Compass. Loans and Financing 3Q21 BRL mln Compass Gás & Energia Moove Rumo Cosan Corporate Pro Forma Consolidated Raízen S.A. 50% Consolidated Pro forma Opening balance of pro forma net debt 3,277.3 (423.6) 8,039.9 8,740.8 19,634.5 8,125.7 27,760.2 Cash, cash equivalents and marketable securities 2,559.8 1,160.5 6,387.8 2,115.3 12,223.4 2,590.7 14,814.0 Gross Debt 5,837.1 737.0 14,427.7 10,856.1 31,857.9 10,716.4 42,574.3 Cash items 1,598.0 11.1 3,268.4 1,670.2 6,547.7 1,151.8 7,699.5 Funding 1,652.3 157.8 3,657.4 2,000.0 7,467.4 1,276.7 8,744.2 Payment of principal on loans and borrowings (35.1) (142.8) (199.3) 0.0 (377.1) (33.0) (410.1) Payment of Interest on loans borrowings (41.6) (3.3) (246.7) (315.1) (606.8) (91.9) (698.7) Derivatives 22.4 (0.6) 57.0 (14.7) 64.2 - 64.2 Noncash items 156.8 35.8 388.8 424.3 1,005.7 452.8 1,458.5 Provision for interest (accrual) 86.9 4.0 221.8 253.4 566.2 100.2 666.4 Monetary variation and MTM adjustment of debt 3.2 29.7 (344.1) (81.5) (392.7) (23.3) (416.0) Exchange variation, net of derivatives 66.7 2.0 511.1 252.3 832.2 375.9 1,208.1 Closing balance of gross debt 7,591.9 783.9 18,084.9 12,950.6 39,411.3 12,321.0 51,732.3 Cash, cash equivalents and marketable securities 5,854.4 1,222.9 9,277.9 3,255.1 19,610.3 3,511.7 23,122.0 Closing balance of pro forma net debt (ex IFRS-16) 1,737.5 (438.9) 8,807.0 9,695.5 19,801.0 8,809.3 28,610.4 Leasing 17.8 54.8 2,935.1 41.4 3,049.0 4,922.0 7,971.0 Closing balance of pro forma adjusted net debt 1,755.3 (384.2) 11,742.1 9,736.9 22,850.1 13,731.3 36,581.4 Note 1: Pro forma: Includes 50% of Raízen’s values Note 2: Gross debt: excludes: (i) PESA at Raízen,and (ii) lease liabilities (IFRS 16). Note 3: Net debt: excludes lease liabilities (IFRS16). Note 4: EBITDA LTM pro forma, i.e., includes 100% of the results of Rumo and of the holding companies Cosan Logística S.A. and Cosan Limited,adjusted by the effect of the CCR of Comgás (EBITDA and Cash) prior to June 2020 and by lease liabilities (IFRS 16) at Raízen (EBITDA and net debt).
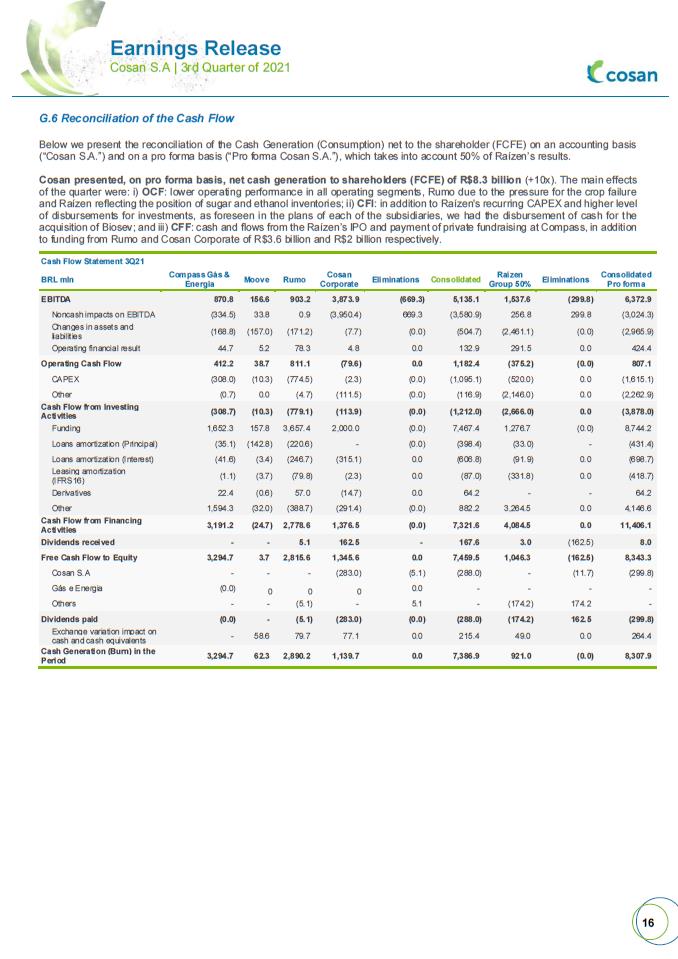
G.6 Reconciliation of the Cash Flow Below we present the reconciliation of the Cash Generation (Consumption) net to the shareholder (FCFE) on an accounting basis (“Cosan S.A.”) and on a pro forma basis (“Pro forma Cosan S.A.”), which takes into account 50% of Raízen’s results. Cosan presented, on pro forma basis, net cash generation to shareholders (FCFE) of R$8.3 billion (+10x). The main effects of the quarter were: i) OCF: lower operating performance in all operating segments, Rumo due to the pressure for the crop failure and Raízen reflecting the position of sugar and ethanol inventories; ii) CFI: in addition to Raízen's recurring CAPEX and higher level of disbursements for investments, as foreseen in the plans of each of the subsidiaries, we had the disbursement of cash for the acquisition of Biosev; and iii) CFF: cash and flows from the Raízen’s IPO and payment of private fundraising at Compass, in addition to funding from Rumo and Cosan Corporate of R$3.6 billion and R$2 billion respectively. Cash Flow Statement 3Q21 BRL mln Compass Gás & Energia Moove Rumo Cosan Corporate Eliminations Consolidated Raízen Group 50% Eliminations Consolidated Pro forma EBITDA 870.8 156.6 903.2 3,873.9 (669.3) 5,135.1 1,537.6 (299.8) 6,372.9 Noncash impacts on EBITDA (334.5) 33.8 0.9 (3,950.4) 669.3 (3,580.9) 256.8 299.8 (3,024.3) Changes in assets and liabilities (168.8) (157.0) (171.2) (7.7) (0.0) (504.7) (2,461.1) (0.0) (2,965.9) Operating financial result 44.7 5.2 78.3 4.8 0.0 132.9 291.5 0.0 424.4 Operating Cash Flow 412.2 38.7 811.1 (79.6) 0.0 1,182.4 (375.2) (0.0) 807.1 CAPEX (308.0) (10.3) (774.5) (2.3) (0.0) (1,095.1) (520.0) 0.0 (1,615.1) Other (0.7) 0.0 (4.7) (111.5) (0.0) (116.9) (2,146.0) 0.0 (2,262.9) Cash Flow from Investing Activities (308.7) (10.3) (779.1) (113.9) (0.0) (1,212.0) (2,666.0) 0.0 (3,878.0) Funding 1,652.3 157.8 3,657.4 2,000.0 (0.0) 7,467.4 1,276.7 (0.0) 8,744.2 Loans amortization (Principal) (35.1) (142.8) (220.6) - (0.0) (398.4) (33.0) - (431.4) Loans amortization (Interest) (41.6) (3.4) (246.7) (315.1) 0.0 (606.8) (91.9) 0.0 (698.7) Leasing amortization (IFRS16) (1.1) (3.7) (79.8) (2.3) 0.0 (87.0) (331.8) 0.0 (418.7) Derivatives 22.4 (0.6) 57.0 (14.7) 0.0 64.2 - - 64.2 Other 1,594.3 (32.0) (388.7) (291.4) (0.0) 882.2 3,264.5 0.0 4,146.6 Cash Flow from Financing Activities 3,191.2 (24.7) 2,778.6 1,376.5 (0.0) 7,321.6 4,084.5 0.0 11,406.1 Dividends received - - 5.1 162.5 - 167.6 3.0 (162.5) 8.0 Free Cash Flow to Equity 3,294.7 3.7 2,815.6 1,345.6 0.0 7,459.5 1,046.3 (162.5) 8,343.3 Cosan S.A - - - (283.0) (5.1) (288.0) - (11.7) (299.8) Gás e Energia (0.0) 0 0 0 0.0 - - - - Others - - (5.1) - 5.1 - (174.2) 174.2 - Dividends paid (0.0) - (5.1) (283.0) (0.0) (288.0) (174.2) 162.5 (299.8) Exchange variation impact on cash and cash equivalents - 58.6 79.7 77.1 0.0 215.4 49.0 0.0 264.4 Cash Generation (Burn) in the Period 3,294.7 62.3 2,890.2 1,139.7 0.0 7,386.9 921.0 (0.0) 8,307.9
H. Relevant events We present below the main issues that impacted this quarter until the release of this report: Mining JV On August 23, 2021, Cosan released a new investment strategy through an investment fund’s structure, with the first investment aimed to the mining and logistics segments. On this date, Cosan (i) signed with the controlling shareholder São Luís Port Company SARL, a China Communications Construction Company Limited (“CCCC”) group company, and with the other minority shareholders jointly holding a 49% interest, a binding proposal for the acquisition of 100% of TUP Porto São Luis S.A., a company that owns a private terminal located in São Luis/MA, for the amount of R$720 million, subject to usual adjustments on the closing date of the transaction; and (ii) signed a Binding Memorandum of Understanding (“MoU”) with a subsidiary that is part of Paulo Brito Group to form a joint venture for the exploration of iron ore, to be evacuated through the Port (“Mining JV”). The Mining JV will be an integrated mining and logistics company which will own, in addition to the Port, exploration rights for mining assets in three mineral projects located in the State of Pará, with significant potential for iron ore reserves, to be exported through the Port. On November 03, 2021, São Luís Port Company S.A.R.L celebrated the Share Purchase and Sale Agreement with Cosan. The transaction has already obtained the approval of the Administrative Council for Economic Defense - CADE, but remains subject to CCCC’s corporate approvals, as well as approvals by the competent Chinese authorities. In addition, a Memorandum of Understanding for the construction of the Port, aimed at the flow of ore, was signed with Concremat and companies of the CCCC group. The definitive agreements for the construction of Porto São Luis are subject to the closing of the acquisition of 100% of the shares of Porto São Luis. Creation of Joint Venture between Cosan and Porto Seguro to work in mobility On November, 08, 2021, Cosan released an Association and Investment Agreement with Porto Seguro Serviços e Comércio S.A.:, aiming to form a joint venture for the creation of a mobility services platform (“Mobitech”). The closing of the association depends on CADE authorization and will be effected through a capital contribution to Mobitech by the Company in the amount of approximately R$ 300 million, subject to adjustments usual to this type of transaction, as well as the contribution, by Porto Seguro, of the Carro Fácil business, which currently offers vehicle subscription This partnership strengthens the Company’s growth and diversification strategy. The union of Cosan’s and Porto Seguro’s complimentary ecosystems, as well as the sum of their best management practices, will allow the development of differentiated mobility solutions to provide facility and safety to customers. Among the services that will be offered are: vehicle subscription models, fleet management for companies, among others types of vehicle leasing. Raízen IPO and Biosev Acquisition On August 04, 2021, we successfully announced Raizen’s IPO and on August 10, 2021 the conclusion of Biosev’s acquisition which resulted in capitalizations in Raízen’s equity of R$ 6.6 billion and R$ 2.4 billion, respectively, generating: (i) a dilution of Cosan’s share in Raizen, without changing the share control and joint venture status; and (ii) a R$3 billion net gain in the result. Proposal for CIP’s incorporation An Extraordinary Shareholder Meeting was called for December 1, 2021, for the merger of CIP into Cosan S.A. with the objective of efficiently segregating CIP's net assets, reducing administrative costs. Capital increase at Compass On August 27, 2021, the financial settlement of the investment was concluded through a capital increase at Compass in the amount of R$810 million through the issuance of new preferred shares. Compass was listed on B3 S.A. – Brasil, Bolsa, Balcão, and the preferred shares issued for this transaction were admitted to trading. According to Material Fact disclosed on September 4th, 2021, there was a second round of investments through a private transaction at Compass that foresees the subscription of R$1.4 billion and the issuance of new class B preferred shares, and on September 10, 2021, took place the partial conclusion of this investment amounting to R$810 million. With the first round of investments, Compass shall have increased its capital stock by R$2.3 billion, and therefore Cosan’s stake in Compass' total capital stock will be 88.00%.
Acquisition of additional stake on Radar On September 20, 2021, the Company announced another capital allocation movement by Cosan Investimentos, when it celebrated signed a Share Purchase and Sale Agreement for the acquisition of an additional interest on Radar, a land management company, with ability to invest in assets with high productive potential in Brazil. The net acquisition price was approximately R$1.5 billion for approximately 47% stake in the business and after the conclusion of the acquisition and subsequent corporate reorganization, Cosan will hold more than 50% of Radar’s total equity. The acquisition was concluded on November 3, 2021, upon the payment of R$602 million by Cosan. The outstanding amount is due in three annual installments to be paid until 2024, as set forth in the agreement executed by the parties. This movement is aligned to the strategy of capital allocation, strengthening the commitments with Brazilian agribusiness sustainable development and value creation for Cosan’s stakeholders. Extension of the Concession Agreement of Comgás On October 01, 2021, Compass Gás e Energia and Comgás signed with the State of São Paulo the 7th Amendment of the Concession Agreement for Public Services related to Natural Gas Distribution n° CSPE/01/99 of Comgás, extending the concession for the public services of natural gas distribution of Comgás until 2049. The extension aligns the contractual conditions to the continuity of the necessary investments for the expansion of access to natural gas, ensuring energy security and efficiency and promoting the economic development of the state of São Paulo. Acquisition of shareholder control of Sulgas by Compass On October 22, 2021, Compass has taken part in the Public Auction Session the object of Auction Notice No. 01/2021 for the acquisition of 51% of the capital stock of Companhia de Gás do Estado do Rio Grande do Sul (“Sulgás”), owned by the Government of the State of Rio Grande do Sul, after having submitted the winning bid of said Auction. Sulgás is a piped natural gas distributor in the State of Rio Grande do Sul and operates this service exclusively under a concession model, effective until August 2044. The investment amount for this acquisition is R$928 million, to be paid at its closing, subject to the adjustments provided for in the agreement. The long experience of Sulgás, added to that of Compass, has the potential to create an important vector for infrastructure development in the state. With this, society benefits through the expansion of access to natural gas, ensuring the energy security necessary for the region's economic growth. North Network Extension Project at Rumo On September 20, 2021, Rumo entered into the Adhesion Agreement, with the State of Mato Grosso, having as its object the Project of construction, operation, exploration and conservation of F.A.T.O (Olacyr de Moraes Authorized Railway) railroad that independently will connect the road-rail terminal of Rondonópolis/MT to Cuiabá/MT and Lucas do Rio Verde/MT, allowing better flowage of grains produced in the state to Brazil and other countries. The estimated investment for the Project is between R$9 and 11 billion, with the first terminal expected to operate in 2025/2026, and its completion in 2030. The term of the Adhesion Contract is valid for 45 years, renewable successively for equal periods, in accordance with the contractual requirements. EESG Regarding the best EESG practices, in September, Raízen has entered into an agreement for its first long-term sale of renewable natural gas ("Biomethane") with Yara Brasil Fertilizantes, symbolizing a new step towards the consolidation of renewable energies as development platform. The agreement has a term of 5 years with a volume of 20,000 cbm/day for the supply of biomethane – from biogas technology, using residues from the ethanol production process, vinasse and filter cake, through Raízen’s bioenergy parks, in addition to being injected into Comgás pipelines to Yara's ammonia plant in Cubatão. Also in September, our CEO Luis Henrique signed the " Entrepreneurs for the Climate Manifesto ", together with more than 100 other businessmen, led by the Brazilian Business Council for Sustainable Development, and aimed at sustainable growth in the country, in line with combating change climate, low-carbon economy and biodiversity’s protection, taking positions and works that contribute to progress throughout the country. This commitment shows how Cosan is concerned with this agenda, supporting the engagement of Brazil, based on an active participation in the 2021 UN Climate Change Conference in Glasgow and preparations for it. Finally, in October we announced Cosan's investment in the Climate Tech Fund, a fund managed by Fifth Wall, one of the largest venture capital managers specializing in technological innovation. This fund invests in companies that promote technology and solutions to tackle climate change. This movement allows the Company to form partnerships with entrepreneurs, startups and investors who, like Cosan, are committed to decarbonising our economy. For more information acces IR’s website www.cosan.com
I. Guidance As informed in Material Fact, on November 12, 2021, Raízen S.A. (B3: RAIZ4) disclosed a new guidance of its segments Agroindustrial Operation, Renewables, Sugar and Marketing & Services for the crop year 2021/22 from April 2021 until March 2022, as detailed in the table below: Guidance Crop Year 2021/22 (abr/21-mar/22) Raízen Consolidated EBITDA (BRL Mln) 10.000 ≤ ∆ ≤ 11.000 Investments (BRL Mln) 7.100 ≤ ∆ ≤ 7.550 Agroindustrial Operation Volume of Sugarcane Crushed ('000 ton) 76.000 ≤ ∆ ≤ 77.000 Investments (BRL Mln) 5.400 ≤ ∆ ≤ 5.550 Renewables EBITDA (BRL Mln) 4.100 ≤ ∆ ≤ 4.400 Sugar EBITDA (BRL Mln) 2.400 ≤ ∆ ≤ 2.600 Marketing & Services EBITDA (BRL Mln) 3.500 ≤ ∆ ≤ 4.000 Investments (BRL Mln) 1.700 ≤ ∆ ≤ 2.000 In addition, Moove’s EBITDA forecast for 2021 was reviewed, as detailed below, reflecting higher results expectations across all geographies. It is worth mentioning that there were no changes in Compass Gás e Energia’s estimates disclosed by Cosan through the Material Fact released on August 13, 2021. Guidance 2021 (jan-dez) Compass EBITDA (R$ MM) 2.500 ≤ ∆ ≤ 2.800 Gás & Energia Investiments (R$ MM) 1.250 ≤ ∆ ≤ 1.450 Moove EBITDA (R$ MM) 600 ≤ ∆ ≤ 625 Main Assumptions: (i) EBITDA considers the adjustments highlighted in the Company’s earnings releases each quarter, that is, reflecting the recurring results of operations, excluding any one-off effects. (ii) Investments from subsidiaries and co-controlled company includes assets arising from contracts with clients and excludes acquisitions. (iii) The macroeconomic assumptions are based on data from specialized outsourced consultants. The information provided in this document is only an estimate about the businesses and projections of operating and financial results and, as such, is based primarily on management’s beliefs and assumptions. Such estimates are subject to diverse risk factors and uncertainties, and are based on information currently available, substantially depending on market conditions, performance of the Brazilian economy, the industries operated by the Company and its subsidiaries and international markets and, hence, are subject to change. In view of these uncertainties, investors should not take any investment decision based on these estimates and forward-looking statements, as they are not guarantee of performance. Any change in the perception or in the aforementioned factors can cause actual results to differ from the projections made and disclosed.
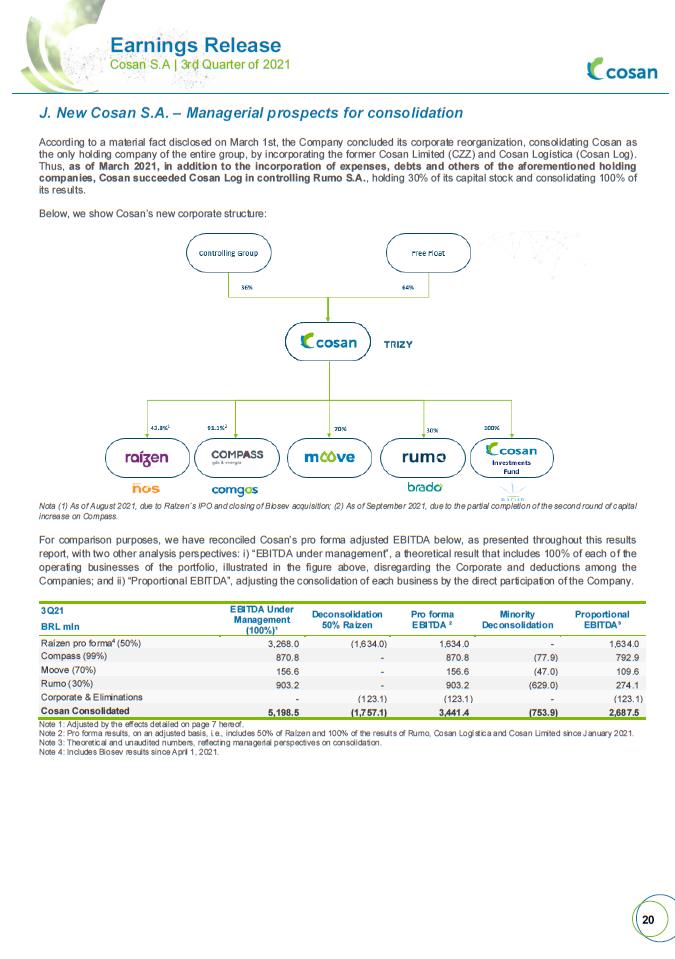
J. New Cosan S.A. – Managerial prospects for consolidation According to a material fact disclosed on March 1st, the Company concluded its corporate reorganization, consolidating Cosan as the only holding company of the entire group, by incorporating the former Cosan Limited (CZZ) and Cosan Logística (Cosan Log). Thus, as of March 2021, in addition to the incorporation of expenses, debts and others of the aforementioned holding companies, Cosan succeeded Cosan Log in controlling Rumo S.A., holding 30% of its capital stock and consolidating 100% of its results. Below, we show Cosan’s new corporate structure: Nota (1) As of August 2021, due to Raízen´s IPO and closing of Biosev acquisition; (2) As of September 2021, due to the partial completion of the second round of capital increase on Compass. For comparison purposes, we have reconciled Cosan’s pro forma adjusted EBITDA below, as presented throughout this results report, with two other analysis perspectives: i) “EBITDA under management”, a theoretical result that includes 100% of each of the operating businesses of the portfolio, illustrated in the figure above, disregarding the Corporate and deductions among the Companies; and ii) “Proportional EBITDA”, adjusting the consolidation of each business by the direct participation of the Company. 3Q21 EBITDA Under Management (100%)¹ Deconsolidation 50% Raízen Pro forma EBITDA ² Minority Deconsolidation Proportional EBITDA³ BRL mln Raízen pro forma4 (50%) 3,268.0 (1,634.0) 1,634.0 - 1,634.0 Compass (99%) 870.8 - 870.8 (77.9) 792.9 Moove (70%) 156.6 - 156.6 (47.0) 109.6 Rumo (30%) 903.2 - 903.2 (629.0) 274.1 Corporate & Eliminations - (123.1) (123.1) - (123.1) Cosan Consolidated 5,198.5 (1,757.1) 3,441.4 (753.9) 2,687.5 Note 1: Adjusted by the effects detailed on page 7 hereof. Note 2: Pro forma results, on an adjusted basis, i.e., includes 50% of Raízen and 100% of the results of Rumo, Cosan Logística and Cosan Limited since January 2021. Note 3: Theoretical and unaudited numbers, reflecting managerial perspectives on consolidation. Note 4: Includes Biosev results since April 1, 2021.
.
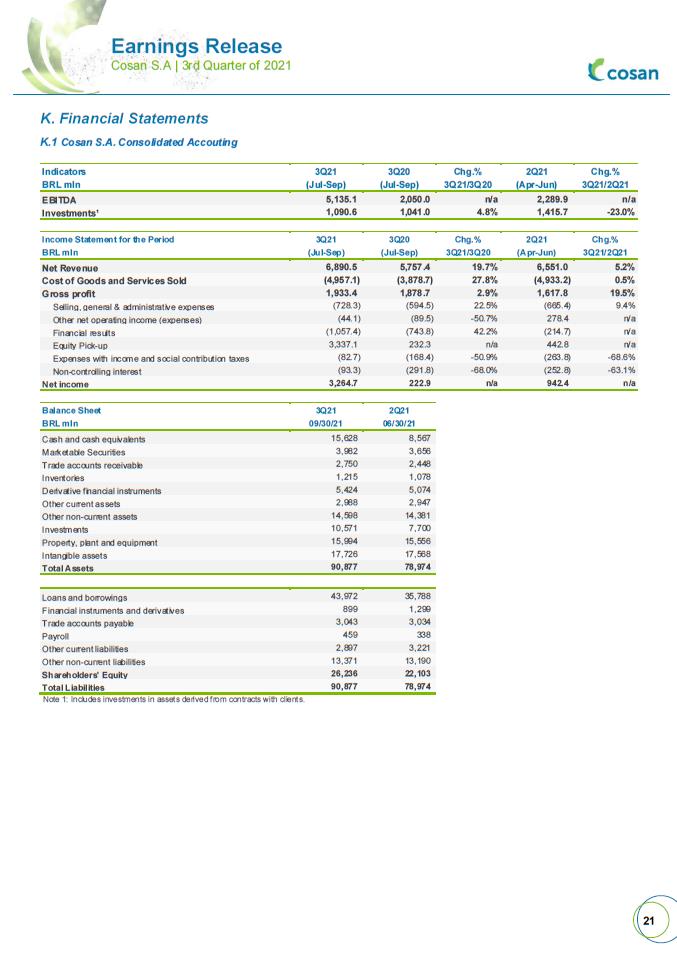
K. Financial Statements K.1 Cosan S.A. Consolidated Accouting Indicators 3Q21 3Q20 Chg.% 2Q21 Chg.% BRL mln (Jul-Sep) (Jul-Sep) 3Q21/3Q20 (Apr-Jun) 3Q21/2Q21 EBITDA 5,135.1 2,050.0 n/a 2,289.9 n/a Investments¹ 1,090.6 1,041.0 4.8% 1,415.7 -23.0% Income Statement for the Period 3Q21 3Q20 Chg.% 2Q21 Chg.% BRL mln (Jul-Sep) (Jul-Sep) 3Q21/3Q20 (Apr-Jun) 3Q21/2Q21 Net Revenue 6,890.5 5,757.4 19.7% 6,551.0 5.2% Cost of Goods and Services Sold (4,957.1) (3,878.7) 27.8% (4,933.2) 0.5% Gross profit 1,933.4 1,878.7 2.9% 1,617.8 19.5% Selling, general & administrative expenses (728.3) (594.5) 22.5% (665.4) 9.4% Other net operating income (expenses) (44.1) (89.5) -50.7% 278.4 n/a Financial results (1,057.4) (743.8) 42.2% (214.7) n/a Equity Pick-up 3,337.1 232.3 n/a 442.8 n/a Expenses with income and social contribution taxes (82.7) (168.4) -50.9% (263.8) -68.6% Non-controlling interest (93.3) (291.8) -68.0% (252.8) -63.1% Net income 3,264.7 222.9 n/a 942.4 n/a Balance Sheet 3Q21 2Q21 BRL mln 09/30/21 06/30/21 Cash and cash equivalents 15,628 8,567 Marketable Securities 3,982 3,656 Trade accounts receivable 2,750 2,448 Inventories 1,215 1,078 Derivative financial instruments 5,424 5,074 Other current assets 2,988 2,947 Other non-current assets 14,598 14,381 Investments 10,571 7,700 Property, plant and equipment 15,994 15,556 Intangible assets 17,726 17,568 Total Assets 90,877 78,974 Loans and borrowings 43,972 35,788 Financial instruments and derivatives 899 1,299 Trade accounts payable 3,043 3,034 Payroll 459 338 Other current liabilities 2,897 3,221 Other non-current liabilities 13,371 13,190 Shareholders' Equity 26,236 22,103 Total Liabilities 90,877 78,974 Note 1: Includes investments in assets derived from contracts with clients.
.
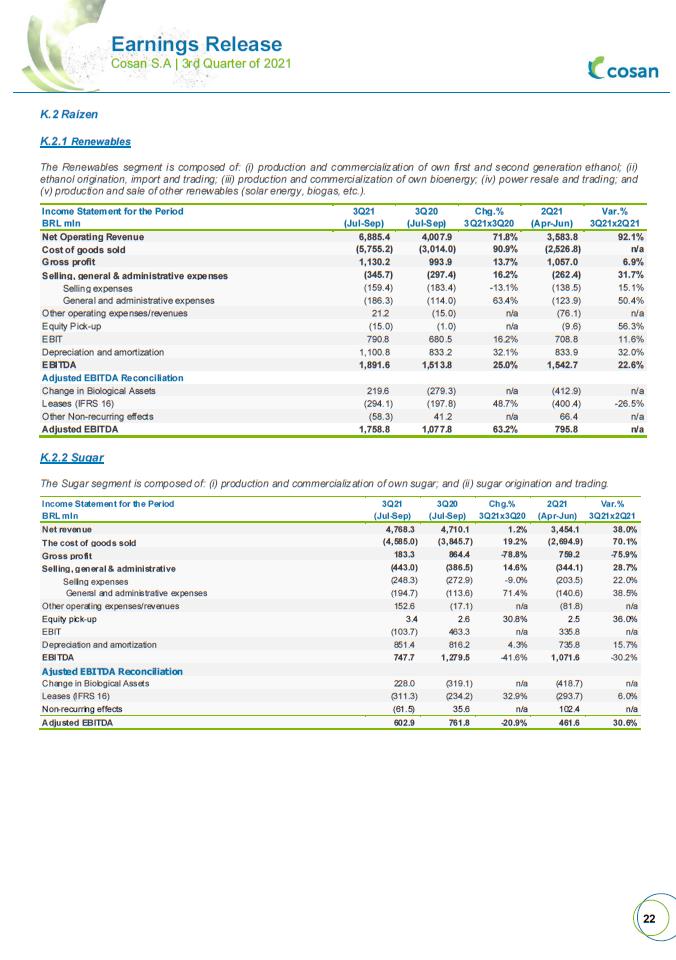
K.2 Raízen K.2.1 Renewables The Renewables segment is composed of: (i) production and commercialization of own first and second generation ethanol; (ii) ethanol origination, import and trading; (iii) production and commercialization of own bioenergy; (iv) power resale and trading; and (v) production and sale of other renewables (solar energy, biogas, etc.). Income Statement for the Period 3Q21 3Q20 Chg.% 2Q21 Var.% BRL mln (Jul-Sep) (Jul-Sep) 3Q21x3Q20 (Apr-Jun) 3Q21x2Q21 Net Operating Revenue 6,885.4 4,007.9 71.8% 3,583.8 92.1% Cost of goods sold (5,755.2) (3,014.0) 90.9% (2,526.8) n/a Gross profit 1,130.2 993.9 13.7% 1,057.0 6.9% Selling, general & administrative expenses (345.7) (297.4) 16.2% (262.4) 31.7% Selling expenses (159.4) (183.4) -13.1% (138.5) 15.1% General and administrative expenses (186.3) (114.0) 63.4% (123.9) 50.4% Other operating expenses/revenues 21.2 (15.0) n/a (76.1) n/a Equity Pick-up (15.0) (1.0) n/a (9.6) 56.3% EBIT 790.8 680.5 16.2% 708.8 11.6% Depreciation and amortization 1,100.8 833.2 32.1% 833.9 32.0% EBITDA 1,891.6 1,513.8 25.0% 1,542.7 22.6% Adjusted EBITDA Reconciliation Change in Biological Assets 219.6 (279.3) n/a (412.9) n/a Leases (IFRS 16) (294.1) (197.8) 48.7% (400.4) -26.5% Other Non-recurring effects (58.3) 41.2 n/a 66.4 n/a Adjusted EBITDA 1,758.8 1,077.8 63.2% 795.8 n/a K.2.2 Sugar The Sugar segment is composed of: (i) production and commercialization of own sugar; and (ii) sugar origination and trading. Income Statement for the Period 3Q21 3Q20 Chg.% 2Q21 Var.% BRL mln (Jul-Sep) (Jul-Sep) 3Q21x3Q20 (Apr-Jun) 3Q21x2Q21 Net revenue 4,768.3 4,710.1 1.2% 3,454.1 38.0% The cost of goods sold (4,585.0) (3,845.7) 19.2% (2,694.9) 70.1% Gross profit 183.3 864.4 -78.8% 759.2 -75.9% Selling, general & administrative (443.0) (386.5) 14.6% (344.1) 28.7% Selling expenses (248.3) (272.9) -9.0% (203.5) 22.0% General and administrative expenses (194.7) (113.6) 71.4% (140.6) 38.5% Other operating expenses/revenues 152.6 (17.1) n/a (81.8) n/a Equity pick-up 3.4 2.6 30.8% 2.5 36.0% EBIT (103.7) 463.3 n/a 335.8 n/a Depreciation and amortization 851.4 816.2 4.3% 735.8 15.7% EBITDA 747.7 1,279.5 -41.6% 1,071.6 -30.2% Ajusted EBITDA Reconciliation Change in Biological Assets 228.0 (319.1) n/a (418.7) n/a Leases (IFRS 16) (311.3) (234.2) 32.9% (293.7) 6.0% Non-recurring effects (61.5) 35.6 n/a 102.4 n/a Adjusted EBITDA 602.9 761.8 -20.9% 461.6 30.6%
.
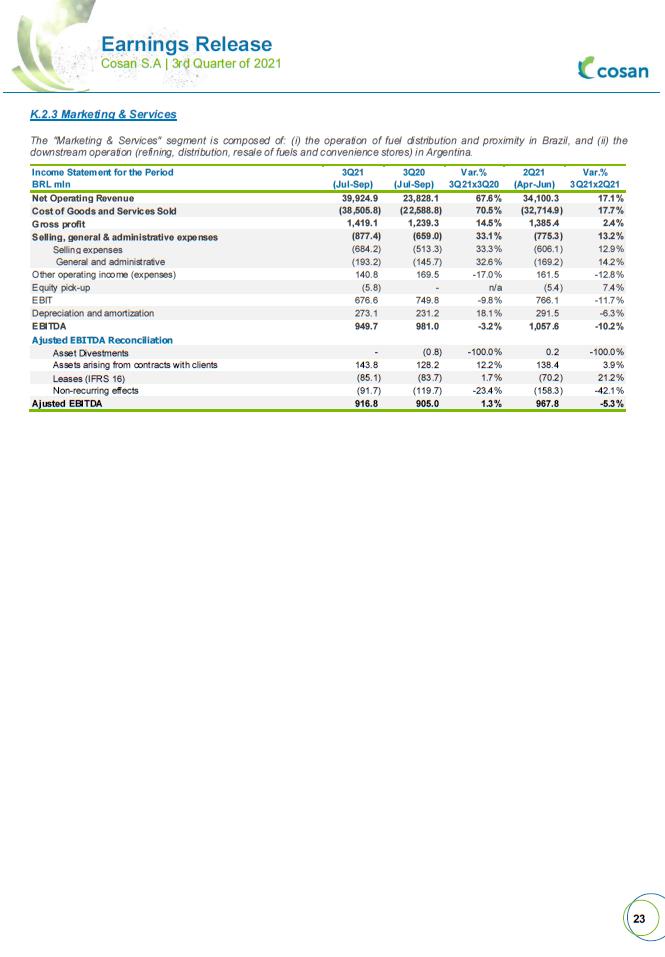
K.2.3 Marketing & Services The "Marketing & Services" segment is composed of: (i) the operation of fuel distribution and proximity in Brazil, and (ii) the downstream operation (refining, distribution, resale of fuels and convenience stores) in Argentina. Income Statement for the Period 3Q21 3Q20 Var.% 2Q21 Var.% BRL mln (Jul-Sep) (Jul-Sep) 3Q21x3Q20 (Apr-Jun) 3Q21x2Q21 Net Operating Revenue 39,924.9 23,828.1 67.6% 34,100.3 17.1% Cost of Goods and Services Sold (38,505.8) (22,588.8) 70.5% (32,714.9) 17.7% Gross profit 1,419.1 1,239.3 14.5% 1,385.4 2.4% Selling, general & administrative expenses (877.4) (659.0) 33.1% (775.3) 13.2% Selling expenses (684.2) (513.3) 33.3% (606.1) 12.9% General and administrative (193.2) (145.7) 32.6% (169.2) 14.2% Other operating income (expenses) 140.8 169.5 -17.0% 161.5 -12.8% Equity pick-up (5.8) - n/a (5.4) 7.4% EBIT 676.6 749.8 -9.8% 766.1 -11.7% Depreciation and amortization 273.1 231.2 18.1% 291.5 -6.3% EBITDA 949.7 981.0 -3.2% 1,057.6 -10.2% Ajusted EBITDA Reconciliation Asset Divestments - (0.8) -100.0% 0.2 -100.0% Assets arising from contracts with clients 143.8 128.2 12.2% 138.4 3.9% Leases (IFRS 16) (85.1) (83.7) 1.7% (70.2) 21.2% Non-recurring effects (91.7) (119.7) -23.4% (158.3) -42.1% Ajusted EBITDA 916.8 905.0 1.3% 967.8 -5.3%
.
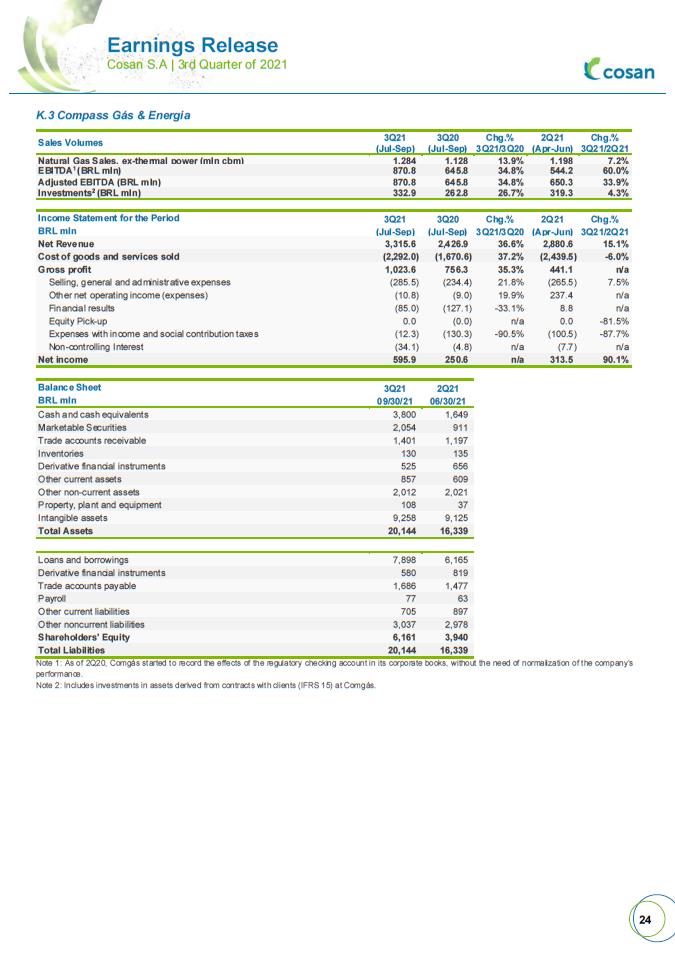
K.3 Compass Gás & Energia Sales Volumes 3Q21 3Q20 Chg.% 2Q21 Chg.% (Jul-Sep) (Jul-Sep) 3Q21/3Q20 (Apr-Jun) 3Q21/2Q21 Natural Gas Sales, ex-thermal power (mIn cbm) 1,284 1,128 13.9% 1,198 7.2% EBITDA1 (BRL mIn) 870.8 645.8 34.8% 544.2 60.0% Adjusted EBITDA (BRL mIn) 870.8 645.8 34.8% 650.3 33.9% Investments2 (BRL mIn) 332.9 262.8 26.7% 319.3 4.3% Income Statement for the Period 3Q21 3Q20 Chg.% 2Q21 Chg.% BRL mln (Jul-Sep) (Jul-Sep) 3Q21/3Q20 (Apr-Jun) 3Q21/2Q21 Net Revenue 3,315.6 2,426.9 36.6% 2,880.6 15.1% Cost of goods and services sold (2,292.0) (1,670.6) 37.2% (2,439.5) -6.0% Gross profit 1,023.6 756.3 35.3% 441.1 n/a Selling, general and administrative expenses (285.5) (234.4) 21.8% (265.5) 7.5% Other net operating income (expenses) (10.8) (9.0) 19.9% 237.4 n/a Financial results (85.0) (127.1) -33.1% 8.8 n/a Equity Pick-up 0.0 (0.0) n/a 0.0 -81.5% Expenses with income and social contribution taxes (12.3) (130.3) -90.5% (100.5) -87.7% Non-controlling Interest (34.1) (4.8) n/a (7.7) n/a Net income 595.9 250.6 n/a 313.5 90.1% Balance Sheet 3Q21 2Q21 BRL mln 09/30/21 06/30/21 Cash and cash equivalents 3,800 1,649 Marketable Securities 2,054 911 Trade accounts receivable 1,401 1,197 Inventories 130 135 Derivative financial instruments 525 656 Other current assets 857 609 Other non-current assets 2,012 2,021 Property, plant and equipment 108 37 Intangible assets 9,258 9,125 Total Assets 20,144 16,339 Loans and borrowings 7,898 6,165 Derivative financial instruments 580 819 Trade accounts payable 1,686 1,477 Payroll 77 63 Other current liabilities 705 897 Other noncurrent liabilities 3,037 2,978 Shareholders' Equity 6,161 3,940 Total Liabilities 20,144 16,339 Note 1: As of 2Q20, Comgás started to record the effects of the regulatory checking account in its corporate books, without the need of normalization of the company’s performance. Note 2: Includes investments in assets derived from contracts with clients (IFRS 15) at Comgás.
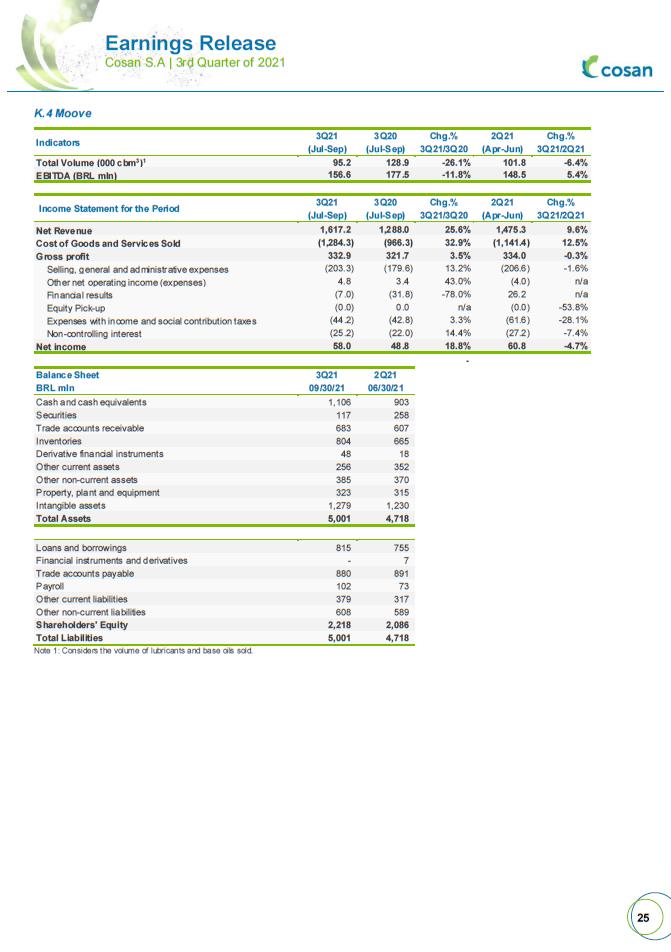 .
.K.4 Moove Indicators 3Q21 3Q20 Chg.% 2Q21 Chg.% (Jul-Sep) (Jul-Sep) 3Q21/3Q20 (Apr-Jun) 3Q21/2Q21 Total Volume (000 cbm3)1 95.2 128.9 -26.1% 101.8 -6.4% EBITDA (BRL mln) 156.6 177.5 -11.8% 148.5 5.4% Income Statement for the Period 3Q21 3Q20 Chg.% 2Q21 Chg.% (Jul-Sep) (Jul-Sep) 3Q21/3Q20 (Apr-Jun) 3Q21/2Q21 Net Revenue 1,617.2 1,288.0 25.6% 1,475.3 9.6% Cost of Goods and Services Sold (1,284.3) (966.3) 32.9% (1,141.4) 12.5% Gross profit 332.9 321.7 3.5% 334.0 -0.3% Selling, general and administrative expenses (203.3) (179.6) 13.2% (206.6) -1.6% Other net operating income (expenses) 4.8 3.4 43.0% (4.0) n/a Financial results (7.0) (31.8) -78.0% 26.2 n/a Equity Pick-up (0.0) 0.0 n/a (0.0) -53.8% Expenses with income and social contribution taxes (44.2) (42.8) 3.3% (61.6) -28.1% Non-controlling interest (25.2) (22.0) 14.4% (27.2) -7.4% Net income 58.0 48.8 18.8% 60.8 -4.7% - Balance Sheet 3Q21 2Q21 BRL mln 09/30/21 06/30/21 Cash and cash equivalents 1,106 903 Securities 117 258 Trade accounts receivable 683 607 Inventories 804 665 Derivative financial instruments 48 18 Other current assets 256 352 Other non-current assets 385 370 Property, plant and equipment 323 315 Intangible assets 1,279 1,230 Total Assets 5,001 4,718 Loans and borrowings 815 755 Financial instruments and derivatives - 7 Trade accounts payable 880 891 Payroll 102 73 Other current liabilities 379 317 Other non-current liabilities 608 589 Shareholders' Equity 2,218 2,086 Total Liabilities 5,001 4,718 Note 1: Considers the volume of lubricants and base oils sold.
.
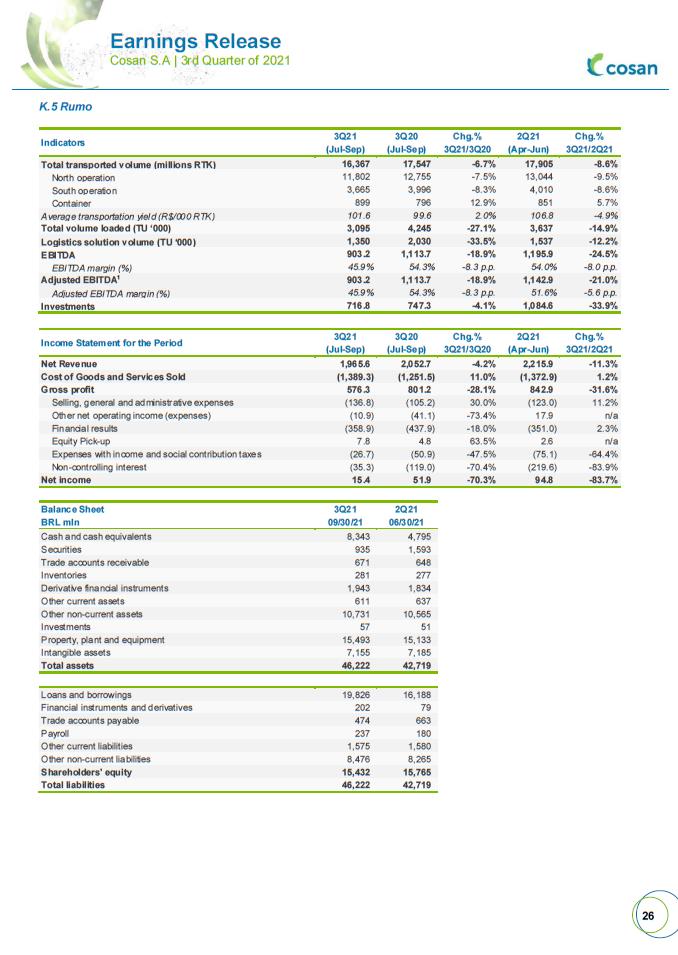
K.5 Rumo Indicators 3Q21 3Q20 Chg.% 2Q21 Chg.% (Jul-Sep) (Jul-Sep) 3Q21/3Q20 (Apr-Jun) 3Q21/2Q21 Total transported volume (millions RTK) 16,367 17,547 -6.7% 17,905 -8.6% North operation 11,802 12,755 -7.5% 13,044 -9.5% South operation 3,665 3,996 -8.3% 4,010 -8.6% Container 899 796 12.9% 851 5.7% Average transportation yield (R$/000 RTK) 101.6 99.6 2.0% 106.8 -4.9% Total volume loaded (TU ‘000) 3,095 4,245 -27.1% 3,637 -14.9% Logistics solution volume (TU ‘000) 1,350 2,030 -33.5% 1,537 -12.2% EBITDA 903.2 1,113.7 -18.9% 1,195.9 -24.5% EBITDA margin (%) 45.9% 54.3% -8.3 p.p. 54.0% -8.0 p.p. Adjusted EBITDA1 903.2 1,113.7 -18.9% 1,142.9 -21.0% Adjusted EBITDA margin (%) 45.9% 54.3% -8.3 p.p. 51.6% -5.6 p.p. Investments 716.8 747.3 -4.1% 1,084.6 -33.9% Income Statement for the Period 3Q21 3Q20 Chg.% 2Q21 Chg.% (Jul-Sep) (Jul-Sep) 3Q21/3Q20 (Apr-Jun) 3Q21/2Q21 Net Revenue 1,965.6 2,052.7 -4.2% 2,215.9 -11.3% Cost of Goods and Services Sold (1,389.3) (1,251.5) 11.0% (1,372.9) 1.2% Gross profit 576.3 801.2 -28.1% 842.9 -31.6% Selling, general and administrative expenses (136.8) (105.2) 30.0% (123.0) 11.2% Other net operating income (expenses) (10.9) (41.1) -73.4% 17.9 n/a Financial results (358.9) (437.9) -18.0% (351.0) 2.3% Equity Pick-up 7.8 4.8 63.5% 2.6 n/a Expenses with income and social contribution taxes (26.7) (50.9) -47.5% (75.1) -64.4% Non-controlling interest (35.3) (119.0) -70.4% (219.6) -83.9% Net income 15.4 51.9 -70.3% 94.8 -83.7% Balance Sheet 3Q21 2Q21 BRL mln 09/30/21 06/30/21 Cash and cash equivalents 8,343 4,795 Securities 935 1,593 Trade accounts receivable 671 648 Inventories 281 277 Derivative financial instruments 1,943 1,834 Other current assets 611 637 Other non-current assets 10,731 10,565 Investments 57 51 Property, plant and equipment 15,493 15,133 Intangible assets 7,155 7,185 Total assets 46,222 42,719 Loans and borrowings 19,826 16,188 Financial instruments and derivatives 202 79 Trade accounts payable 474 663 Payroll 237 180 Other current liabilities 1,575 1,580 Other non-current liabilities 8,476 8,265 Shareholders' equity 15,432 15,765 Total liabilities 46,222 42,719
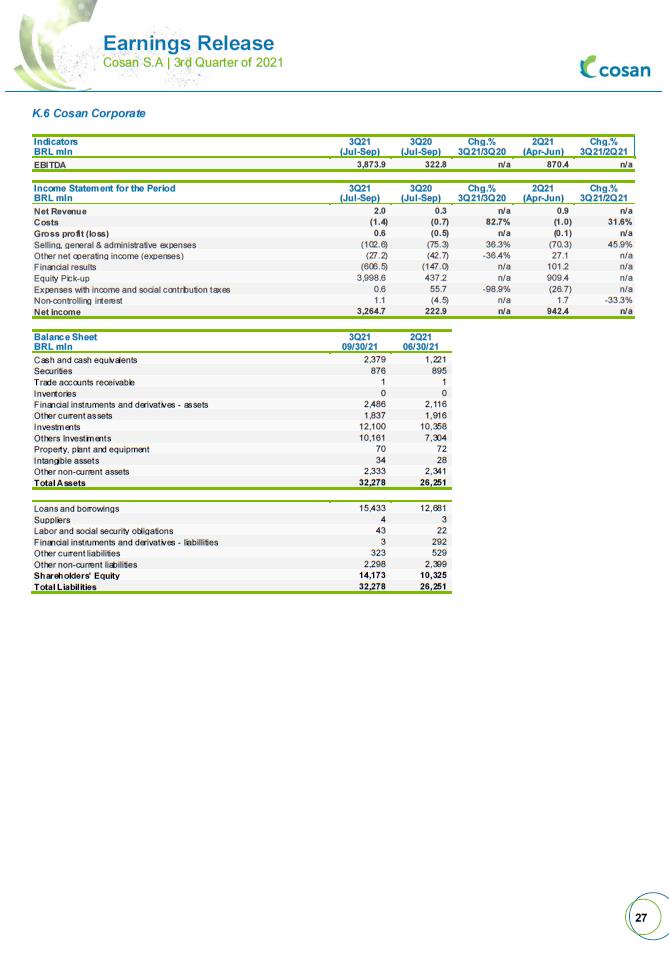
K.6 Cosan Corporate Indicators 3Q21 3Q20 Chg.% 2Q21 Chg.% BRL mln (Jul-Sep) (Jul-Sep) 3Q21/3Q20 (Apr-Jun) 3Q21/2Q21 EBITDA 3,873.9 322.8 n/a 870.4 n/a Income Statement for the Period 3Q21 3Q20 Chg.% 2Q21 Chg.% BRL mln (Jul-Sep) (Jul-Sep) 3Q21/3Q20 (Apr-Jun) 3Q21/2Q21 Net Revenue 2.0 0.3 n/a 0.9 n/a Costs (1.4) (0.7) 82.7% (1.0) 31.6% Gross profit (loss) 0.6 (0.5) n/a (0.1) n/a Selling, general & administrative expenses (102.6) (75.3) 36.3% (70.3) 45.9% Other net operating income (expenses) (27.2) (42.7) -36.4% 27.1 n/a Financial results (606.5) (147.0) n/a 101.2 n/a Equity Pick-up 3,998.6 437.2 n/a 909.4 n/a Expenses with income and social contribution taxes 0.6 55.7 -98.9% (26.7) n/a Non-controlling interest 1.1 (4.5) n/a 1.7 -33.3% Net income 3,264.7 222.9 n/a 942.4 n/a Balance Sheet 3Q21 2Q21 BRL mln 09/30/21 06/30/21 Cash and cash equivalents 2,379 1,221 Securities 876 895 Trade accounts receivable 1 1 Inventories 0 0 Financial instruments and derivatives - assets 2,486 2,116 Other current assets 1,837 1,916 Investments 12,100 10,358 Others Investiments 10,161 7,304 Property, plant and equipment 70 72 Intangible assets 34 28 Other non-current assets 2,333 2,341 Total Assets 32,278 26,251 Loans and borrowings 15,433 12,681 Suppliers 4 3 Labor and social security obligations 43 22 Financial instruments and derivatives - liabillities 3 292 Other current liabilities 323 529 Other non-current liabilities 2,298 2,399 Shareholders' Equity 14,173 10,325 Total Liabilities 32,278 26,251
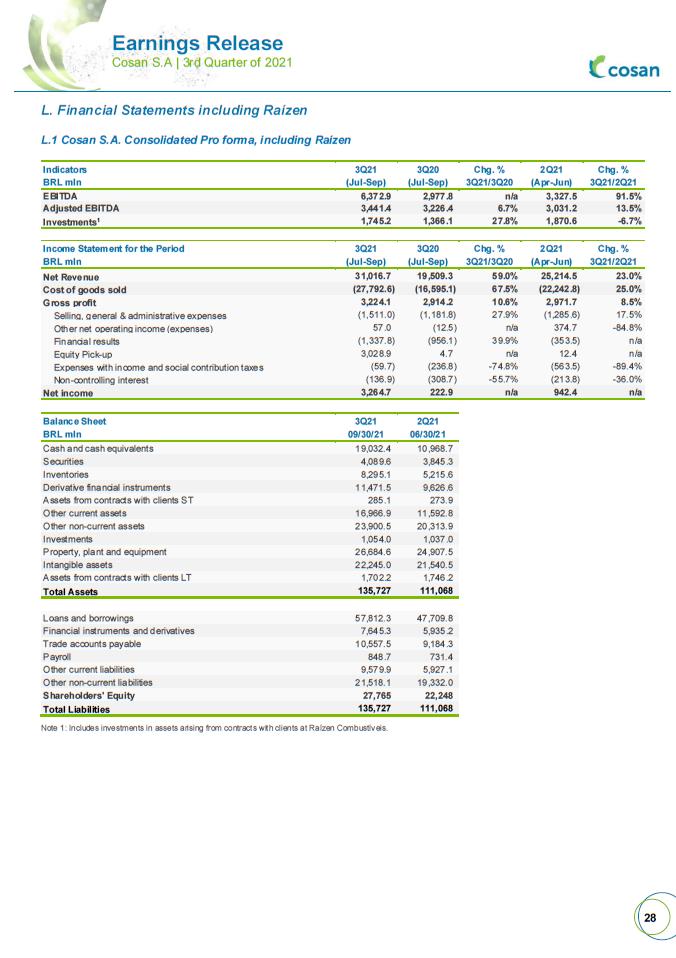
L. Financial Statements including Raízen L.1 Cosan S.A. Consolidated Pro forma, including Raízen Indicators 3Q21 3Q20 Chg. % 2Q21 Chg. % BRL mln (Jul-Sep) (Jul-Sep) 3Q21/3Q20 (Apr-Jun) 3Q21/2Q21 EBITDA 6,372.9 2,977.8 n/a 3,327.5 91.5% Adjusted EBITDA 3,441.4 3,226.4 6.7% 3,031.2 13.5% Investments1 1,745.2 1,366.1 27.8% 1,870.6 -6.7% Income Statement for the Period 3Q21 3Q20 Chg. % 2Q21 Chg. % BRL mln (Jul-Sep) (Jul-Sep) 3Q21/3Q20 (Apr-Jun) 3Q21/2Q21 Net Revenue 31,016.7 19,509.3 59.0% 25,214.5 23.0% Cost of goods sold (27,792.6) (16,595.1) 67.5% (22,242.8) 25.0% Gross profit 3,224.1 2,914.2 10.6% 2,971.7 8.5% Selling, general & administrative expenses (1,511.0) (1,181.8) 27.9% (1,285.6) 17.5% Other net operating income (expenses) 57.0 (12.5) n/a 374.7 -84.8% Financial results (1,337.8) (956.1) 39.9% (353.5) n/a Equity Pick-up 3,028.9 4.7 n/a 12.4 n/a Expenses with income and social contribution taxes (59.7) (236.8) -74.8% (563.5) -89.4% Non-controlling interest (136.9) (308.7) -55.7% (213.8) -36.0% Net income 3,264.7 222.9 n/a 942.4 n/a Balance Sheet 3Q21 2Q21 BRL mln 09/30/21 06/30/21 Cash and cash equivalents 19,032.4 10,968.7 Securities 4,089.6 3,845.3 Inventories 8,295.1 5,215.6 Derivative financial instruments 11,471.5 9,626.6 Assets from contracts with clients ST 285.1 273.9 Other current assets 16,966.9 11,592.8 Other non-current assets 23,900.5 20,313.9 Investments 1,054.0 1,037.0 Property, plant and equipment 26,684.6 24,907.5 Intangible assets 22,245.0 21,540.5 Assets from contracts with clients LT 1,702.2 1,746.2 Total Assets 135,727 111,068 Loans and borrowings 57,812.3 47,709.8 Financial instruments and derivatives 7,645.3 5,935.2 Trade accounts payable 10,557.5 9,184.3 Payroll 848.7 731.4 Other current liabilities 9,579.9 5,927.1 Other non-current liabilities 21,518.1 19,332.0 Shareholders' Equity 27,765 22,248 Total Liabilities 135,727 111,068 Note 1: Includes investments in assets arising from contracts with clients at Raízen Combustíveis.
 .
.M. Financial Statements, Cosan approach M.1 Reconcilation of earnings from Raízen S.A. Pro forma to Cosan perspective Earnings Conciliation 3Q21 3Q20 BRL mln (Jul-Sep) (Jul-Sep) EBITDA - Raízen perspective 3,092.0 2,330.4 Fair Value Effects (0.8) (1.9) Right of Exclusive Supply (16.0) (16.0) EBITDA - Cosan perspective 3,075.1 2,312.4 Net Income - Raízen perspective 712.7 498.2 Depreciation & Amortization (50.0) (43.9) Fair Value Effects (0.8) (1.9) Right of Exclusive Supply (16.0) (16.0) Financial Expenses (0.0) (1.0) Income Tax (34%) 22.8 21.4 Net Income - Cosan perspective 668.5 456.8 M.2 Reconcilation of earnings from Comgás to Cosan perspective Earnings Conciliation 3Q21 3Q20 BRL mln (Jul-Sep) (Jul-Sep) Net Income - Comgás perspective 655.9 292.2 Amortization adjustments (30.5) (30.5) Income Tax and Social Contribution 10.4 10.4 Net Income - Cosan perspective 635.8 272.0
SIGNATURES
Pursuant to the requirements of the Securities Exchange Act of 1934, the registrant has duly caused this report to be signed on its behalf by the undersigned, thereunto duly authorized.
Date: November 12, 2021
COSAN S.A. | |
By: | /s/ Marcelo Eduardo Martins |
| Name: Marcelo Eduardo Martins |
| Title: Chief Financial Officer |