UNITED STATES
SECURITIES AND EXCHANGE COMMISSION
Washington, D.C. 20549
FORM 6-K
Report of Foreign Issuer
Pursuant To Rule 13a-16 Or 15d-16 of the
Securities Exchange Act of 1934
For the month of February 2022
Commission File Number: 333-251238
|
COSAN S.A.
(Exact name of registrant as specified in its charter)
N/A
(Translation of registrant’s name into English)
|
Av. Brigadeiro Faria Lima, 4100, – 16th floor
São Paulo, SP 04538-132 Brazil
(Address of principal executive offices)
Indicate by check mark whether the registrant files or will file annual reports under cover of Form 20-F or Form 40‑F:
Form 20-F ☒ Form 40-F ☐
Indicate by check mark if the registrant is submitting the Form 6-K in paper as permitted by Regulation S-T Rule 101(b)(1):
Yes ☐ No ☒
Indicate by check mark if the registrant is submitting the Form 6-K in paper as permitted by Regulation S-T Rule 101(b)(7):
Yes ☐ No ☒

To the Shareholders, Board of Directors and Officers
Cosan S.A.
São Paulo - SP
Opinion
We have audited the individual and consolidated financial statements of Cosan S.A. (“Company”), identified as Individual and Consolidated, respectively, which comprise the statement of financial position as at December 31, 2021, and the respective statements of profit or loss, of comprehensive income, of changes in equity, and of cash flows for the year then ended, and notes to the financial statements, including a summary of significant accounting policies.
In our opinion, the financial statements referred to above present fairly, in all material respects, the individual and consolidated financial position of the Company as at December 31, 2021, and its individual and consolidated financial performance and cash flows for the year then ended, in accordance with accounting practices adopted in Brazil and with the International Financial Reporting Standards (IFRS) issued by the International Accounting Standards Board (IASB).
Basis for opinion
We conducted our audit in accordance with Brazilian and International Standards on Auditing. Our responsibilities under those standards are further described in the “Auditor’s responsibilities for the audit of the individual and consolidated financial statements” section of our report. We are independent of the Company and its subsidiaries in accordance with the relevant ethical principles set forth in the Code of Professional Ethics for Accountants and the professional standards issued by Brazil’s National Association of State Boards of Accountancy (CFC), and we have fulfilled our other ethical responsibilities in accordance with these requirements. We believe that the audit evidence we have obtained is sufficient and appropriate to provide a basis for our opinion.
Emphasis of matter
Restatement of earnings per share and disclosure of operating segments
As mentioned in Note 17, as a result of the stock split, the Company adjusted the earnings per share and the respective explanatory notes corresponding to the year ended December 31, 2020, as provided for in NBC TG 41 - Resultado por Ação (IAS 33 – Earnings per share). Additionally, as mentioned in Note 4, as a result of the change in the operating segment structure, the Company adjusted the disclosure of operating segments for the year ended December 31, 2020, as provided for in NBC TG 22 – Informações por Segmento (IFRS 8 - Operating segments). Our opinion is not modified in respect of these matters.
Key audit matters
Key audit matters are those that, in our professional judgment, were of most significance in our audit of the financial statements of the current year. These matters were addressed in the context of our audit of the individual and consolidated financial statements as a whole, and in forming our opinion thereon, and we do not provide an individual opinion on these matters. For each matter below, our description of how our audit addressed the matter, including any commentary on the findings or outcome of our procedures, is provided in that context.
We have fulfilled the responsibilities described in the “Auditor’s responsibilities for the audit of the individual and consolidated financial statements” section of our report, including in relation to these matters. Accordingly, our audit included the performance of procedures designed to respond to our assessment of the risks of material misstatement of the financial statements. The results of our audit procedures, including the procedures performed to address the matters below, provide the basis for our audit opinion on the Company’s financial statements.
Recognition of unbilled revenue from supply of gas
As mentioned in Notes 5.3 and 18 to the financial statements, unbilled revenue from supply of gas refers to the portion of gas supplied for which metering and billing to customers have not yet taken place. This amount is estimated by the Company based on the period between the date of the last measurement and the last day of the month. In the year ended December 31, 2021, total unbilled revenue and the respective accounts receivable balance, on this same date, is R$975,588 thousand.
The monitoring of this matter was considered significant for our audit due to the materiality of the amounts involved in relation to the accounts receivable balance and the matching entry in profit or loss, in addition to the uncertainties inherent in determining the estimate of the amounts recorded, given the use of information by segment of customers with different tariffs, and the degree of management’s judgment in allocating the volume of gas distributed by segment. A change in any of these assumptions could have a significant impact on the Company's consolidated financial statements.
How our audit addressed this matter:
Our audit procedures included the following, among others: (i) understanding of the internal control environment related to the allocation of estimated volumes of gas by segment and the respective tariffs for each segment, in accordance with the regulated tariffs; (ii) evaluation of the design of internal controls implemented by the Company to ensure the proper recording of revenue transactions; (iii) the involvement of more experienced audit professionals in defining the testing strategy, evaluating supporting audit documentation, and supervising the audit procedures performed. We also i) documented, on a sampling basis, the information that feeds the calculation for allocation of the volume of gas supplied by segment; ii) performed the recalculation of unbilled revenue from supply of gas by segment, including an evaluation of the key assumptions used; iii) made an independent estimate of the allocation of the volume of gas between the segments considering the consumption history at the end of the period and the comparison with the estimated volume by segment calculated by the Company; iv) compared, on a sampling basis, the tariffs used to measure revenue by segment with the tariffs determined by the regulatory agency; v) compared the average consumption assumption estimated by the Company with the actual average consumption referring to the billing of the subsequent cycle occurring in January 2022; vi) carried out analytical procedures to develop an independent expectation based on the historical behavior of the balances under analysis; and vii) reconciled the balance of unbilled revenue from supply of gas with accounting records. Furthermore, we analyzed the accuracy of the arithmetic calculations. Lastly, we evaluated the adequacy of disclosures in Notes 5.3 and 18 to the financial statements as of December 31, 2021.
Based on the result of the audit procedures conducted on unbilled revenue from supply of gas in the statement of profit or loss, and the respective accounts receivable balance, in assets, which are consistent with management's assessment, we consider that the criteria and assumptions adopted by management, as well as the respective disclosures in Notes 5.3 and 18 are acceptable in the context of the individual and consolidated financial statements taken as a whole.
Public concession infrastructure related to the gas distribution service
As disclosed in Note 10 to the financial statements, as of December 31, 2021, the Company records contract assets and intangible assets from public concession related to the gas distribution service in the amounts of R$684,970 thousand and R$8,953,495 thousand, respectively, which substantially represent the infrastructure of this concession.
The amount invested in the concession infrastructure is an essential part of the methodology applied by the granting authority to define the tariff to be charged by the Company to end consumers, under the terms of the Concession Agreement. The definition of eligible expenses to be capitalized as infrastructure costs and the definition of the useful life are subject to judgment by management.
Given the specific aspects of the capitalization process and the subsequent assessment of infrastructure expenses, in addition to the materiality of the amounts involved, this was considered a significant audit matter.
How our audit addressed this matter:
Our audit procedures involved, among others, i) a general understanding of the internal control environment on accounting of investments in public concession infrastructure related to the gas distribution service, including the classification as an qualifying asset for capitalization; ii) assessment of the nature of these investments with the applied infrastructure; iii) sampling tests of materials and services applied to the works as well as allocation of labor hours; iv) evaluation of the accounting classifications between the contract asset and the intangible concession right, observing the periods of the works; v) review of the policies established by the Company for such accounting and their applicability to current accounting standards; vi) capitalization of interest, when applicable; vii) use of substantive analytical procedures on additions and amortization; and viii) amortization test of the intangible concession right.
Based on the results of audit procedures performed, which are consistent with management’s assessment, we understand that the criteria and policies for capitalization and amortization of public concession infrastructure assets related to the gas distribution service prepared by management, as well as the respective disclosures in Note 10, are acceptable in the context of the financial statements taken as a whole.
Business combination
As disclosed in Note 8.2.1 to the financial statements as of December 31, 2021, the Company acquired, on November 3, 2021, the control of nine companies of Grupo Radar for R$1,572,352 thousand and recorded this business combination using the acquisition method, having determined a gain on bargain purchase of R$416,268 thousand.
This was considered a significant audit matter due to the judgments involved in the identification and determination of the fair value of the assets acquired and the liabilities assumed and the consequent determination of gain on bargain purchase. Additionally, the amounts involved in this transaction are material in relation to the financial statements as of December 31, 2021.
How our audit addressed this matter:
Our audit procedures included, among others: i) the performance of audit procedures on the opening balances of the acquired companies on the acquisition date as part of the determination of the fair value of the assets acquired and the liabilities assumed, including a review of the alignment of the accounting practices of the Company with those of the acquired companies; and ii) the involvement of our corporate finance specialists to assist us in assessing the assumptions and methodologies used by management for measurement and recognition of the fair value of assets acquired and liabilities assumed and gain on bargain purchase.
We also evaluated the adequacy of disclosures in Note 8.2.1 to the financial statements as of December 31, 2021.
Based on the results of the audit procedures carried out, which are consistent with management's assessment, we consider that the Company’s business combination accounting policies adopted to support judgments and information included in the context of the financial statements as a whole are acceptable.
Other matters
Statements of value added
The individual and consolidated statements of value added (SVA) for the year ended December 31, 2021, prepared under the responsibility of the Company’s Executive Board, and presented as supplementary information for IFRS purposes, were submitted to audit procedures conducted jointly with the audit of the Company's financial statements. To form our opinion, we evaluated if these statements are reconciled to the financial statements and accounting records, as applicable, and if their form and content comply with the criteria defined by Accounting Pronouncement NBC TG 09 – Demonstração do Valor Adicionado (Statement of Value Added).
In our opinion, these statements of value added were prepared fairly, in all material respects, in accordance with the criteria defined in the abovementioned accounting pronouncement, and are consistent in relation to the individual and consolidated financial statements taken as a whole.
Other information accompanying the individual and consolidated financial statements and the auditor’s report
The Company’s Executive Board is responsible for such other information, which comprises the Management Report.
Our opinion on the individual and consolidated financial statements does not cover the Management Report and we do not express any form of assurance conclusion thereon.
In connection with our audit of the individual and consolidated financial statements, our responsibility is to read the Management Report and, in doing so, consider whether this report is materially inconsistent with the individual and consolidated financial statements or our knowledge obtained in the audit or otherwise appears to be materially misstated. If, based on the work we have performed, we conclude that there is a material misstatement of the Management Report, we are required to report that fact. We have nothing to report in this regard.
Responsibilities of the Executive Board and those charged with governance for the individual and consolidated financial statements
The Executive Board is responsible for the preparation and fair presentation of the individual and consolidated financial statements in accordance with accounting practices adopted in Brazil and with the International Financial Reporting Standards (IFRS) issued by the International Accounting Standards Board (IASB), and for such internal control as it determines is necessary to enable the preparation of financial statements that are free from material misstatement, whether due to fraud or error.
In preparing the individual and consolidated financial statements, the Executive Board is responsible for assessing the Company’s ability to continue as a going concern, disclosing, as applicable, matters related to going concern and using the going concern basis of accounting unless the Executive Board either intends to liquidate the Company or to cease its operations, or has no realistic alternative but to do so.
Those charged with governance are responsible for overseeing the Company’s and its subsidiaries’ financial reporting process.
Auditor’s responsibilities for the audit of the individual and consolidated financial statements
Our objectives are to obtain reasonable assurance about whether the individual and consolidated financial statements as a whole are free from material misstatement, whether due to fraud or error, and to issue an auditor’s report that includes our opinion. Reasonable assurance is a high level of assurance, but is not a guarantee that an audit conducted in accordance with Brazilian and International Standards on Auditing will always detect a material misstatement when it exists.
Misstatements can arise from fraud or error and are considered material if, individually or in the aggregate, they could reasonably be expected to influence the economic decisions of users taken on the basis of these financial statements.
As part of an audit in accordance with Brazilian and International Standards on Auditing, we exercise professional judgment and maintain professional skepticism throughout the audit. We also:
- Identified and assessed risks of material misstatement of the individual and consolidated financial statements, whether due to fraud or error, designed and performed audit procedures responsive to those risks, and obtained audit evidence that is sufficient and appropriate to provide a basis for our opinion. The risk of not detecting a material misstatement resulting from fraud is higher than for one resulting from error, as fraud may involve collusion, forgery, intentional omissions, misrepresentations, or the override of internal control.
- Obtained an understanding of internal control relevant to the audit in order to design audit procedures that are appropriate in the circumstances, but not for the purpose of expressing an opinion on the effectiveness of the Company’s and its subsidiaries’ internal control.
- Evaluated the appropriateness of accounting policies used and the reasonableness of accounting estimates and related disclosures made by the Executive Board.
- Concluded on the appropriateness of the Executive Board’s use of the going concern basis of accounting and, based on the audit evidence obtained, whether a material uncertainty exists related to events or conditions that may cast significant doubt on the Company’s and its subsidiaries’ ability to continue as a going concern. If we conclude that a material uncertainty exists, we are required to draw attention in our auditor’s report to the related disclosures in the individual and consolidated financial statements or, if such disclosures are inadequate, to modify our opinion. Our conclusions are based on the audit evidence obtained up to the date of our report. However, future events or conditions may cause the Company and its subsidiaries to cease to continue as a going concern.
- Evaluated the overall presentation, structure and content of the financial statements, including the disclosures, and whether the individual and consolidated financial statements represent the underlying transactions and events in a manner that achieves fair presentation.
- Obtained sufficient and appropriate audit evidence regarding the financial information of the entities or business activities within the Group to express an opinion on the individual and consolidated financial statements. We are responsible for the direction, supervision and performance of the Group's audit and, consequently, for the audit opinion.
We communicate with those charged with governance regarding, among other matters, the planned scope and timing of the audit procedures and of the significant audit findings, including any significant deficiencies in internal control that we identified during our audit.
We also provide those charged with governance with a statement that we have complied with relevant ethical requirements, including applicable independence requirements, and communicated with them all relationships and other matters that may reasonably be thought to bear on our independence, and where applicable, related safeguards.
From the matters communicated with those charged with governance, we determined those matters that were of most significance in the audit of the financial statements of the current year and are therefore the key audit matters. We described these matters in our auditor’s report unless law or regulation precludes public disclosure about the matter or when, in extremely rare circumstances, we determine that a matter should not be communicated in our report because the adverse consequences of doing so would reasonably be expected to outweigh the public interest benefits of such communication.
São Paulo, February 18, 2022.
ERNST & YOUNG
Auditores Independentes S.S.
CRC-2SP034519/O-6
Clinton L. Fernandes
Accountant CRC-1SP205541/O-2
(In thousands of Brazilian Reais - R$)
|
|
| Parent Company |
| Consolidated | ||||
| Note |
| December 31, 2021 |
| December 31, 2020 |
| December 31, 2021 |
| December 31, 2020 |
Assets |
|
|
|
|
|
|
|
|
|
Cash and cash equivalents | 5.1 |
| 1,718,077 |
| 1,149,267 |
| 16,174,130 |
| 4,614,053 |
Marketable securities | 5.2 |
| 893,087 |
| 788,965 |
| 4,372,696 |
| 2,271,570 |
Trade receivables | 5.3 |
| — |
| — |
| 2,580,776 |
| 1,585,708 |
Derivative financial instruments | 5.10 |
| 54,963 |
| — |
| 194,878 |
| 156,208 |
Inventories | 7 |
| — |
| — |
| 1,149,304 |
| 685,900 |
Receivables from related parties | 5.5 |
| 135,924 |
| 286,993 |
| 98,280 |
| 71,783 |
Income tax receivable |
|
| 222,981 |
| 141,018 |
| 442,957 |
| 178,501 |
Other current tax receivable | 6 |
| 33,616 |
| 35,507 |
| 921,472 |
| 434,480 |
Dividends receivable | 16 |
| 540,091 |
| 160,694 |
| 519,965 |
| 77,561 |
Sector financial assets | 5.9 |
| — |
| — |
| 489,601 |
| 241,749 |
Other financial assets | 5.4 |
| — |
| 779,695 |
| 466 |
| 848,821 |
Other current assets |
|
| 124,851 |
| 101,673 |
| 348,658 |
| 270,065 |
Total current assets |
|
| 3,723,590 |
| 3,443,812 |
| 27,293,183 |
| 11,436,399 |
Trade receivables | 5.3 |
| — |
| — |
| 165,077 |
| 19,131 |
Marketable securities | 5.2 |
| — |
| — |
| 15,311 |
| — |
Restricted cash | 5.2 |
| 31,181 |
| — |
| 58,990 |
| — |
Deferred tax assets | 14 |
| 777,686 |
| 54,032 |
| 3,051,628 |
| 629,591 |
Receivables from related parties | 5.5 |
| 393,440 |
| 473,349 |
| 318,211 |
| 199,983 |
Income tax receivable |
|
| — |
| — |
| 344,059 |
| 836 |
Other non-current tax receivable | 6 |
| 42,932 |
| 37,533 |
| 1,879,695 |
| 167,224 |
Judicial deposits | 15 |
| 431,591 |
| 380,727 |
| 923,061 |
| 544,226 |
Derivative financial instruments | 5.10 |
| 2,507,893 |
| 2,457,604 |
| 4,538,048 |
| 2,971,210 |
Sector financial assets | 5.9 |
| — |
| — |
| 68,709 |
| — |
Other non-current assets |
|
| 67,613 |
| 165,310 |
| 179,598 |
| 227,857 |
Other financial assets |
|
| — |
| — |
| 319,727 |
| — |
Investments in subsidiaries and associates | 8.1 |
| 14,787,469 |
| 11,026,580 |
| 780,067 |
| 333,705 |
Investments in joint venture | 9 |
| 10,936,663 |
| 2,314,537 |
| 10,936,663 |
| 7,988,208 |
Property, plant and equipment | 10.1 |
| 53,007 |
| 61,459 |
| 16,648,553 |
| 416,996 |
Intangible assets and goodwill | 10.2 |
| 1,804 |
| 2,191 |
| 17,781,498 |
| 10,045,296 |
Contract asset | 10.3 |
| — |
| — |
| 705,982 |
| 695,938 |
Right-of-use assets | 10.4 |
| 34,171 |
| 24,809 |
| 7,947,267 |
| 84,224 |
Investment properties | 10.5 |
| — |
| — |
| 3,886,696 |
| — |
Total non-current assets |
|
| 30,065,450 |
| 16,998,131 |
| 70,548,840 |
| 24,324,425 |
Total assets |
|
| 33,789,040 |
| 20,441,943 |
| 97,842,023 |
| 35,760,824 |
The accompanying notes are an integral part of these financial statements.
Statements of financial position
(In thousands of Brazilian Reais - R$)
|
|
| Parent Company |
| Consolidated | ||||
| Note |
| December 31, 2021 |
| December 31, 2020 |
| December 31, 2021 |
| December 31, 2020 |
Liabilities |
|
|
|
|
|
|
|
|
|
Loans, borrowings and debentures | 5.6 |
| 269,793 |
| — |
| 4,241,368 |
| 2,352,057 |
Leases | 5.8 |
| 8,423 |
| 11,108 |
| 405,820 |
| 20,466 |
Derivative financial instruments | 5.10 |
| 31,202 |
| 7,291 |
| 925,650 |
| 293,656 |
Trade payables | 5.7 |
| 4,506 |
| 4,066 |
| 3,253,504 |
| 1,875,192 |
Employee benefits payables |
|
| 57,393 |
| 25,168 |
| 552,991 |
| 195,881 |
Income tax payables |
|
| 4,013 |
| 2,571 |
| 71,224 |
| 374,339 |
Other taxes payable | 13 |
| 134,956 |
| 125,368 |
| 536,220 |
| 367,076 |
Dividends payable | 16 |
| 754,282 |
| 216,929 |
| 799,634 |
| 285,177 |
Concessions payable | 12 |
| — |
| — |
| 160,771 |
| — |
Payables to related parties | 5.5 |
| 302,607 |
| 278,740 |
| 287,609 |
| 150,484 |
Sector financial liabilities | 5.9 |
| — |
| — |
| 85,866 |
| 91,912 |
Other financial liabilities | 5 |
| — |
| — |
| 726,423 |
| 149,293 |
Other current liabilities |
|
| 368,188 |
| 103,501 |
| 909,956 |
| 259,580 |
Total current liabilities |
|
| 1,935,363 |
| 774,742 |
| 12,957,036 |
| 6,415,113 |
Loans, borrowings and debentures | 5.6 |
| 7,894,463 |
| — |
| 41,417,669 |
| 13,075,170 |
Leases | 5.8 |
| 31,624 |
| 17,037 |
| 2,861,858 |
| 59,297 |
Preferred shareholders payable in subsidiaries |
|
| — |
| 387,044 |
| — |
| 387,044 |
Derivative financial instruments | 5.10 |
| 110,278 |
| 124,171 |
| 150,511 |
| 124,171 |
Other taxes payable | 13 |
| 141,423 |
| 141,233 |
| 146,889 |
| 146,895 |
Provision for legal proceedings | 15 |
| 361,859 |
| 308,819 |
| 1,644,061 |
| 887,794 |
Concessions payable | 12 |
| — |
| — |
| 2,893,477 |
| — |
Provision for uncovered liability of associates | 8.1 |
| 356,442 |
| 458,852 |
| — |
| — |
Payables to related parties | 5.5 |
| 7,397,822 |
| 7,096,139 |
| — |
| — |
Post-employment benefits | 22 |
| 219 |
| 177 |
| 669,475 |
| 728,677 |
Deferred tax liabilities | 14 |
| — |
| — |
| 3,818,056 |
| 1,271,208 |
Sector financial liabilities | 5.9 |
| — |
| — |
| 1,286,417 |
| 473,999 |
Deferred revenue |
|
| — |
| — |
| 36,440 |
| — |
Other non-current liabilities |
|
| 818,610 |
| 286,064 |
| 1,090,112 |
| 685,642 |
Total non-current liabilities |
|
| 17,112,740 |
| 8,819,536 |
| 56,014,965 |
| 17,839,897 |
Total liabilities |
|
| 19,048,103 |
| 9,594,278 |
| 68,972,001 |
| 24,255,010 |
Shareholders' equity | 16 |
|
|
|
|
|
|
|
|
Share capital |
|
| 6,365,853 |
| 5,727,478 |
| 6,365,853 |
| 5,727,478 |
Treasury shares |
|
| (69,064) |
| (583,941) |
| (69,064) |
| (583,941) |
Additional paid-in capital |
|
| (1,690,235) |
| (939,347) |
| (1,690,235) |
| (939,347) |
Accumulated other comprehensive loss |
|
| (521,609) |
| (252,610) |
| (521,609) |
| (252,610) |
Retained earnings |
|
| 10,655,992 |
| 6,896,085 |
| 10,655,992 |
| 6,896,085 |
Equity attributable to: |
|
|
|
|
|
|
|
|
|
Owners of the Company |
|
| 14,740,937 |
| 10,847,665 |
| 14,740,937 |
| 10,847,665 |
Non-controlling interests | 8.3 |
| — |
| — |
| 14,129,085 |
| 658,149 |
Total shareholders' equity |
|
| 14,740,937 |
| 10,847,665 |
| 28,870,022 |
| 11,505,814 |
Total shareholders' equity and liabilities |
|
| 33,789,040 |
| 20,441,943 |
| 97,842,023 |
| 35,760,824 |
The accompanying notes are an integral part of these financial statements.
(In thousands of Brazilian Reais - R$, except earnings per share)
|
|
| Parent Company |
| Consolidated | ||||
| Note |
| December 31, 2021 |
| December 31, 2020 |
| December 31, 2021 |
| December 31, 2020 |
Net sales | 18 |
| — |
| — |
| 24,907,150 |
| 13,508,787 |
Cost of sales | 19 |
| — |
| — |
| (18,568,049) |
| (9,816,078) |
Gross profit |
|
| — |
| — |
| 6,339,101 |
| 3,692,709 |
Selling expenses | 19 |
| — |
| — |
| (716,210) |
| (927,346) |
General and administrative expenses | 19 |
| (295,476) |
| (181,418) |
| (2,053,813) |
| (1,006,625) |
Other income (expenses), net | 20 |
| 381,380 |
| (11,454) |
| 387,440 |
| 71,774 |
Operating income (expenses) |
|
| 85,904 |
| (192,872) |
| (2,382,583) |
| (1,862,197) |
Result before equity in earnings of investees, finance results and taxes |
|
| 85,904 |
| (192,872) |
| 3,956,518 |
| 1,830,512 |
Interest in earnings in subsidiaries and associates | 8.1 |
| 6,748,458 |
| 1,347,408 |
| 129,159 |
| 15,714 |
Interest in earnings of joint venture |
|
| (177,217) |
| (80,900) |
| 4,590,631 |
| 583,001 |
Equity in earnings of investees |
|
| 6,571,241 |
| 1,266,508 |
| 4,719,790 |
| 598,715 |
Finance expense |
|
| (1,130,433) |
| (719,523) |
| (3,027,089) |
| (1,679,752) |
Finance income |
|
| 208,103 |
| 188,005 |
| 1,234,950 |
| 227,925 |
Foreign exchange, net |
|
| (500,948) |
| (1,399,682) |
| (608,655) |
| (1,612,525) |
Net effect of derivatives |
|
| 261,433 |
| 1,532,029 |
| (375,491) |
| 1,801,790 |
Finance results, net | 21 |
| (1,161,845) |
| (399,171) |
| (2,776,285) |
| (1,262,562) |
Profit before taxes |
|
| 5,495,300 |
| 674,465 |
| 5,900,023 |
| 1,166,665 |
Income taxes | 14 |
|
|
|
|
|
|
|
|
Current |
|
| 312 |
| (39) |
| (191,012) |
| (695,832) |
Deferred |
|
| 627,604 |
| 177,432 |
| 641,765 |
| 437,981 |
|
|
| 627,916 |
| 177,393 |
| 450,753 |
| (257,851) |
Profit for the year |
|
| 6,123,216 |
| 851,858 |
| 6,350,776 |
| 908,814 |
Profit attributable to: |
|
|
|
|
|
|
|
|
|
Owners of the Company |
|
| 6,123,216 |
| 851,858 |
| 6,123,216 |
| 851,858 |
Non-controlling interests |
|
| — |
| — |
| 227,560 |
| 56,956 |
|
|
| 6,123,216 |
| 851,858 |
| 6,350,776 |
| 908,814 |
Earnings per share | 17 |
|
|
|
|
|
|
|
|
Basic |
|
|
|
|
|
| R$3.3378 |
| R$0.5523 |
Diluted |
|
|
|
|
|
| R$3.3264 |
| R$0.5472 |
The accompanying notes are an integral part of these financial statements.
(In thousands of Brazilian Reais - R$)
|
| Parent Company |
| Consolidated | |||||
|
| December 31, 2021 |
| December 31, 2020 |
|
| December 31, 2021 |
| December 31, 2020 |
Profit for the year |
| 6,123,216 |
| 851,858 |
|
| 6,350,776 |
| 908,814 |
Other comprehensive income |
|
|
|
|
|
|
|
|
|
Items that are or may be reclassified subsequently to profit or loss: |
|
|
|
|
|
|
|
|
|
Foreign currency translation differences |
| 297,044 |
| 624,257 |
|
| 310,467 |
| 732,715 |
Loss on cash flow hedges |
| (609,532) |
| (526,856) |
|
| (601,415) |
| (526,628) |
Actuarial gain (loss) with defined benefit plan net of tax |
| 42,120 |
| (787) |
|
| 41,832 |
| (37,384) |
Change in fair value of financial assets |
| 1,369 |
| 277 |
|
| 2,269 |
| 277 |
Total other comprehensive (loss) income, net of tax |
| (268,999) |
| 96,891 |
|
| (246,847) |
| 168,980 |
Total comprehensive income for the year |
| 5,854,217 |
| 948,749 |
|
| 6,103,929 |
| 1,077,794 |
Profit attributable to: |
|
|
|
|
|
|
|
|
|
Owners of the Company |
| 6,123,216 |
| 851,858 |
|
| 6,123,216 |
| 851,858 |
Non-controlling interests |
| — |
| — |
|
| 227,560 |
| 56,956 |
|
| 6,123,216 |
| 851,858 |
|
| 6,350,776 |
| 908,814 |
Total comprehensive income attributable to: |
|
|
|
|
|
|
|
|
|
Owners of the Company |
| 5,854,217 |
| 948,749 |
|
| 5,840,670 |
| 948,749 |
Non-controlling interests |
| — |
| — |
|
| 263,259 |
| 129,045 |
|
| 5,854,217 |
| 948,749 |
|
| 6,103,929 |
| 1,077,794 |
The accompanying notes are an integral part of these financial statements.
(In thousands of Brazilian Reais - R$)
|
|
|
|
|
| Capital reserve |
|
|
| Profit reserve |
|
|
|
|
|
|
|
| ||||||||
|
| Share capital |
| Treasury |
| Corporate transactions - Law 6404 |
| Capital transactions |
| Accumulated |
| Legal |
| Statutory reserve |
| Profit to be realized |
| Retained earnings |
| Accumulated profits |
| Equity |
| Non- |
| Total equity |
At January 1, 2020 |
| 5,045,214 |
| (112,785) |
| 737 |
| (958,738) |
| (349,501) |
| 121,270 |
| 6,288,472 |
| 171,021 |
| 348,044 |
| — |
| 10,553,734 |
| 507,482 |
| 11,061,216 |
Profit for the year |
| — |
| — |
| — |
| — |
| — |
| — |
| — |
| — |
| — |
| 851,858 |
| 851,858 |
| 56,956 |
| 908,814 |
Other comprehensive income: (note 16) |
|
|
|
|
|
|
|
|
|
|
|
|
|
|
|
|
|
|
|
|
|
|
|
|
|
|
Income (loss) on cash flow hedges |
| — |
| — |
| — |
| — |
| (526,856) |
| — |
| — |
| — |
| — |
| — |
| (526,856) |
| 228 |
| (526,628) |
Foreign currency translation differences |
| — |
| — |
| — |
| — |
| 624,257 |
| — |
| — |
| — |
| — |
| — |
| 624,257 |
| 108,458 |
| 732,715 |
Actuarial income (loss) on defined benefit plan |
| — |
| — |
| — |
| — |
| (787) |
| — |
| — |
| — |
| — |
| — |
| (787) |
| (36,597) |
| (37,384) |
Change in fair value of financial assets |
| — |
| — |
| — |
| — |
| 277 |
| — |
| — |
| — |
| — |
| — |
| 277 |
| — |
| 277 |
Total comprehensive income (loss) for the year |
| — |
| — |
| — |
| — |
| 96,891 |
| — |
| — |
| — |
| — |
| 851,858 |
| 948,749 |
| 129,045 |
| 1,077,794 |
Transactions with owners of the Company |
|
|
|
|
|
|
|
|
|
|
|
|
|
|
|
|
|
|
|
|
|
|
|
|
|
|
Contributions and distributions: |
|
|
|
|
|
|
|
|
|
|
|
|
|
|
|
|
|
|
|
|
|
|
|
|
|
|
Capital increase |
| 682,264 |
| — |
| — |
| — |
| — |
| (121,270) |
| (560,994) |
| — |
| — |
| — |
| — |
| 6,666 |
| 6,666 |
Dividends - non-controlling interests |
| — |
| — |
| — |
| (533) |
| — |
| — |
| — |
| — |
| — |
| — |
| (533) |
| 533 |
| — |
Share-based compensation - settled in shares |
| — |
| 13,886 |
| — |
| (13,886) |
| — |
| — |
| — |
| — |
| — |
| — |
| — |
| — |
| — |
Share-based compensation - cash settled |
| — |
| — |
| — |
| (22,758) |
| — |
| — |
| — |
| — |
| — |
| — |
| (22,758) |
| (46) |
| (22,804) |
Proposed dividends |
| — |
| — |
| — |
| — |
| — |
| — |
| — |
| — |
| — |
| (202,316) |
| (202,316) |
| (16,054) |
| (218,370) |
Constitution of legal reserve |
| — |
| — |
| — |
| — |
| — |
| 42,593 |
| — |
| — |
| — |
| (42,593) |
| — |
| — |
| — |
Constitution of statutory reserve |
| — |
| — |
| — |
| — |
| — |
| — |
| 606,949 |
| — |
| — |
| (606,949) |
| — |
| — |
| — |
Treasury shares acquired |
| — |
| (485,042) |
| — |
| — |
| — |
| — |
| — |
| — |
| — |
| — |
| (485,042) |
| — |
| (485,042) |
Transactions with share-based compensation |
| — |
| — |
| — |
| 11,262 |
| — |
| — |
| — |
| — |
| — |
| — |
| 11,262 |
| 92 |
| 11,354 |
Total contributions and distributions |
| 682,264 |
| (471,156) |
| — |
| (25,915) |
| — |
| (78,677) |
| 45,955 |
| — |
| — |
| (851,858) |
| (699,387) |
| (8,809) |
| (708,196) |
Changes in ownership interests |
|
|
|
|
|
|
|
|
|
|
|
|
|
|
|
|
|
|
|
|
|
|
|
|
|
|
Change of shareholding interest in subsidiary |
| — |
| — |
| — |
| 44,569 |
| — |
| — |
| — |
| — |
| — |
| — |
| 44,569 |
| 30,431 |
| 75,000 |
Total changes in ownership interests |
| — |
| — |
| — |
| 44,569 |
| — |
| — |
| — |
| — |
| — |
| — |
| 44,569 |
| 30,431 |
| 75,000 |
At December 31, 2020 |
| 5,727,478 |
| (583,941) |
| 737 |
| (940,084) |
| (252,610) |
| 42,593 |
| 6,334,427 |
| 171,021 |
| 348,044 |
| — |
| 10,847,665 |
| 658,149 |
| 11,505,814 |
The accompanying notes are an integral part of these financial statements.
Statement of changes in equity
(In thousands of Brazilian Reais - R$)
|
|
|
|
|
| Capital reserve |
|
|
| Profit reserve |
|
|
|
|
|
|
|
| ||||||||
|
| Share capital |
| Treasury |
| Corporate transactions - Law 6404 |
| Capital transactions |
| Accumulated other comprehensive loss |
| Legal |
| Statutory reserve |
| Profit to be realized |
| Retained earnings |
| Accumulated profits |
| Equity attributable |
| Non- |
| Total equity |
At January 1, 2021 |
| 5,727,478 |
| (583,941) |
| 737 |
| (940,084) |
| (252,610) |
| 42,593 |
| 6,334,427 |
| 171,021 |
| 348,044 |
| — |
| 10,847,665 |
| 658,149 |
| 11,505,814 |
Profit for the year |
| — |
| — |
| — |
| — |
| — |
| — |
| — |
| — |
| — |
| 6,123,216 |
| 6,123,216 |
| 227,560 |
| 6,350,776 |
Other comprehensive income: (note 16) |
|
|
|
|
|
|
|
|
|
|
|
|
|
|
|
|
|
|
|
|
|
|
|
|
|
|
Income (loss) on cash flow hedges |
| — |
| — |
| — |
| — |
| (609,532) |
| — |
| — |
| — |
| — |
| — |
| (609,532) |
| 8,117 |
| (601,415) |
Foreign currency translation differences |
| — |
| — |
| — |
| — |
| 297,044 |
| — |
| — |
| — |
| — |
| — |
| 297,044 |
| 13,423 |
| 310,467 |
Actuarial income (loss) on defined benefit plan |
| — |
| — |
| — |
| — |
| 42,120 |
| — |
| — |
| — |
| — |
| — |
| 42,120 |
| (288) |
| 41,832 |
Change in fair value of financial assets |
| — |
| — |
| — |
| — |
| 1,369 |
| — |
| — |
| — |
| — |
| — |
| 1,369 |
| 900 |
| 2,269 |
Total comprehensive income (loss) for the year |
| — |
| — |
| — |
| — |
| (268,999) |
| — |
| — |
| — |
| — |
| 6,123,216 |
| 5,854,217 |
| 249,712 |
| 6,103,929 |
Transactions with owners of the Company |
|
|
|
|
|
|
|
|
|
|
|
|
|
|
|
|
|
|
|
|
|
|
|
|
|
|
Contributions and distributions: |
|
|
|
|
|
|
|
|
|
|
|
|
|
|
|
|
|
|
|
|
|
|
|
|
|
|
Capital increase (Note 16) |
| 638,375 |
| — |
| — |
| (638,375) |
| — |
| — |
| — |
| — |
| — |
| — |
| — |
| 2,252,306 |
| 2,252,306 |
Treasury shares disposal (Note 16) |
| — |
| 4,603 |
| — |
| 3,825 |
| — |
| — |
| — |
| — |
| — |
| — |
| 8,428 |
| — |
| 8,428 |
Cancellation of treasury shares (Note 16) |
| — |
| 496,916 |
| — |
| — |
| — |
| — |
| (496,916) |
| — |
| — |
| — |
| — |
| — |
| — |
Share-based compensation - settled in shares |
| — |
| 18,136 |
| — |
| (30,795) |
| — |
| — |
| — |
| — |
| — |
| — |
| (12,659) |
| (12,866) |
| (25,525) |
Dividends (Note 16) |
| — |
| — |
| — |
| — |
| — |
| — |
| (328,267) |
| — |
| (83,863) |
| (1,454,263) |
| (1,866,393) |
| (162,457) |
| (2,028,850) |
Constitution of legal reserve (note 16) |
| — |
| — |
| — |
| — |
| — |
| 306,160 |
| — |
| — |
| — |
| (306,160) |
| — |
| — |
| — |
Constitution of statutory reserve (note 16) |
| — |
| — |
| — |
| — |
| — |
| — |
| 4,362,793 |
| — |
| — |
| (4,362,793) |
| — |
| — |
| — |
Treasury shares acquired (Note 16) |
| — |
| (4,778) |
| — |
| — |
| — |
| — |
| — |
| — |
| — |
| — |
| (4,778) |
| — |
| (4,778) |
Business combination (Note 8.2) |
| — |
| — |
| — |
| — |
| — |
| — |
| — |
| — |
| — |
| — |
| — |
| 2,115,554 |
| 2,115,554 |
Corporate reorganization (Note 1.1) |
| — |
| — |
| — |
| (1,400,557) |
| — |
| — |
| — |
| — |
| — |
| — |
| (1,400,557) |
| 10,836,134 |
| 9,435,577 |
Transactions with share-based compensation |
| — |
| — |
| — |
| (7,942) |
| — |
| — |
| — |
| — |
| — |
| — |
| (7,942) |
| 28,274 |
| 20,332 |
Total contributions and distributions |
| 638,375 |
| 514,877 |
| — |
| (2,073,844) |
| — |
| 306,160 |
| 3,537,610 |
| — |
| (83,863) |
| (6,123,216) |
| (3,283,901) |
| 15,056,945 |
| 11,773,044 |
Changes in ownership interests |
|
|
|
|
|
|
|
|
|
|
|
|
|
|
|
|
|
|
|
|
|
|
|
|
|
|
Change of shareholding interest in subsidiary (Note 8) |
| — |
| — |
| — |
| 1,322,956 |
| — |
| — |
| — |
| — |
| — |
| — |
| 1,322,956 |
| (1,835,721) |
| (512,765) |
Total changes in ownership interests |
| — |
| — |
| — |
| 1,322,956 |
| — |
| — |
| — |
| — |
| — |
| — |
| 1,322,956 |
| (1,835,721) |
| (512,765) |
Total transactions with owners of the Company |
| 638,375 |
| 514,877 |
| — |
| (750,888) |
| — |
| 306,160 |
| 3,537,610 |
| — |
| (83,863) |
| (6,123,216) |
| (1,960,945) |
| 13,221,224 |
| 11,260,279 |
At December 31, 2021 |
| 6,365,853 |
| (69,064) |
| 737 |
| (1,690,972) |
| (521,609) |
| 348,753 |
| 9,872,037 |
| 171,021 |
| 264,181 |
| — |
| 14,740,937 |
| 14,129,085 |
| 28,870,022 |
The accompanying notes are an integral part of these financial statements.
(In thousands of Brazilian Reais - R$)
|
|
| Parent Company |
| Consolidated | ||||
| Note |
| December 31, 2021 |
| December 31, 2020 |
| December 31, 2021 |
| December 31, 2020 |
Cash flows from operating activities |
|
|
|
|
|
|
|
|
|
Profit before taxes |
|
| 5,495,300 |
| 674,465 |
| 5,900,023 |
| 1,166,665 |
Adjustments for: |
|
|
|
|
|
|
|
|
|
Depreciation and amortization | 19 |
| 13,403 |
| 11,411 |
| 2,221,536 |
| 623,084 |
Interest in earnings of associates | 8.1 |
| (6,748,458) |
| (1,347,408) |
| (129,159) |
| (15,714) |
Interest in earnings of joint venture | 9 |
| 177,217 |
| 80,900 |
| (4,590,631) |
| (583,001) |
Loss (gain) on disposals assets |
|
| 667 |
| 96 |
| (6,774) |
| 11,961 |
Share-based payment |
|
| 26,672 |
| 5,303 |
| 50,414 |
| 13,543 |
Change in fair value of investment property | 10.5 |
| — |
| — |
| (17,116) |
| — |
Legal proceedings provision, receivables and tax installments | 20 |
| 93,039 |
| (62,756) |
| 250,109 |
| (59,309) |
Interest and exchange, net |
|
| 1,180,557 |
| 417,396 |
| 3,141,765 |
| 1,330,283 |
Gain from a bargain purchase | 20 |
| (416,268) |
| — |
| (416,268) |
| — |
Sectorial financial assets and liabilities, net | 5.9 |
| — |
| — |
| 246,101 |
| 337,620 |
Provisions for employee benefits |
|
| 44,140 |
| 23,876 |
| 335,502 |
| 113,470 |
Allowance for expected credit losses |
|
| — |
| — |
| (3,034) |
| 31,196 |
Contractual obligations for sales of credit rights | 20 |
| — |
| 68,311 |
| — |
| 68,311 |
Recovering tax credits |
|
| (14,136) |
| (29,823) |
| (648,315) |
| (29,823) |
Loss in energy derivative operations |
|
| — |
| — |
| 58,701 |
| 175,105 |
Other |
|
| (14,514) |
| 8,307 |
| 87,229 |
| 25,051 |
|
|
| (162,381) |
| (149,922) |
| 6,480,083 |
| 3,208,442 |
Changes in: |
|
|
|
|
|
|
|
|
|
Trade receivables |
|
| — |
| — |
| (315,607) |
| 54,108 |
Inventories |
|
| — |
| — |
| (243,620) |
| (113,066) |
Other current tax, net |
|
| (26,161) |
| (26,554) |
| 164,732 |
| 80,870 |
Income tax |
|
| (17,688) |
| (75,830) |
| (905,284) |
| (793,117) |
Related parties, net |
|
| (31,638) |
| (194,822) |
| (134,838) |
| (89,750) |
Trade payables |
|
| 167 |
| (3,128) |
| 679,774 |
| 50,860 |
Employee benefits |
|
| (15,676) |
| (18,076) |
| (143,445) |
| (77,225) |
Provision for legal proceedings |
|
| (6,400) |
| (16,607) |
| (118,411) |
| (55,461) |
Other financial liabilities |
|
| — |
| — |
| 108,849 |
| (30,840) |
Judicial deposits |
|
| (37,777) |
| (279) |
| (58,725) |
| 24,624 |
Cash paid on disposal of credit rights |
|
| — |
| (31,857) |
| — |
| (31,857) |
Tax losses acquired | 1.2.21 |
| — |
| — |
| (208,118) |
| — |
Post-employment benefits |
|
| — |
| — |
| (34,004) |
| (37,444) |
Other assets and liabilities, net |
|
| (59,820) |
| 27,669 |
| (49,404) |
| (47,329) |
|
|
| (194,993) |
| (339,484) |
| (1,258,101) |
| (1,065,627) |
Net cash (used in) generated from operating activities |
|
| (357,374) |
| (489,406) |
| 5,221,982 |
| 2,142,815 |
Statement of cash flows
(In thousands of Brazilian Reais - R$)
| Cash flows from investing activities | |||||||||
Capital contribution in associates |
|
| (439,964) |
| (11,142) |
| (416,375) |
| (1,142) |
Acquisition of subsidiary, net of cash acquired |
|
| (592,733) |
| — |
| (592,733) |
| (94,631) |
Sale (purchase) of marketable securities |
|
| (62,347) |
| 142,392 |
| 1,107,942 |
| (862,098) |
Restricted cash |
|
| (31,181) |
| — |
| 21,142 |
| — |
Dividends received from associates | 16 |
| 895,022 |
| 821,108 |
| 16,426 |
| 9,265 |
Dividends received from joint venture | 16 |
| 588,562 |
| 1,417 |
| 819,729 |
| 1,852 |
Acquisition of instruments designated at fair value |
|
| — |
| (290,000) |
| (14,168) |
| (289,989) |
Acquisition of property, plant and equipment, intangible assets and contract assets |
|
| (723) |
| (10,630) |
| (4,066,728) |
| (1,052,502) |
Proceeds from legal merger | 1.1 |
| 353,601 |
| — |
| 8,125,855 |
| — |
Acquisition of associates shares |
|
| — |
| — |
| — |
| (51,299) |
Cash received on sale of fixed assets, and intangible assets |
|
| — |
| — |
| 3,090 |
| — |
Other |
|
| (4,475) |
| — |
| 1,024 |
| (194) |
Net cash generated (used in) investing activities |
|
| 705,762 |
| 653,145 |
| 5,005,204 |
| (2,340,738) |
|
|
|
|
|
|
|
|
|
|
Cash flows from financing activities |
|
|
|
|
|
|
|
|
|
Loans, borrowings and debentures raised | 5.6 |
| 1,986,070 |
| — |
| 11,390,562 |
| 2,443,732 |
Repayment of principal on loans, borrowings and debentures | 5.6 |
| (5,427) |
| (1,700,000) |
| (8,612,361) |
| (2,739,416) |
Payment of interest on loans, borrowings and debentures | 5.6 |
| (262,407) |
| (35,203) |
| (1,916,413) |
| (796,040) |
Payment of derivative financial instruments |
|
| (123,042) |
| (54,651) |
| (639,639) |
| (56,811) |
Receipt of derivative financial instruments |
|
| 520,674 |
| 572,374 |
| 1,708,196 |
| 765,759 |
Payment of derivative financial instruments, except debt |
|
| (227,012) |
| — |
| (227,012) |
| — |
Receipt of derivative financial instruments, except debt |
|
| 197,679 |
| — |
| 197,679 |
| — |
Repayment of principal on leases | 5.8 |
| (3,689) |
| (1,466) |
| (421,394) |
| (23,699) |
Payment of interest on leases | 5.8 |
| (3,554) |
| (1,523) |
| (142,484) |
| (5,023) |
Equity contribution from non-controlling interest |
|
| — |
| — |
| 2,252,306 |
| 81,666 |
Related parties |
|
| (387,534) |
| (205,828) |
| — |
| — |
Sale (purchase) of treasury shares |
|
| (4,778) |
| (485,042) |
| (34,529) |
| (485,042) |
Proceeds from the sale of treasury shares |
|
| 8,428 |
| — |
| 8,428 |
| — |
Acquisition of non-controlling interests |
|
| (290,285) |
| — |
| (698,147) |
| — |
Dividends paid |
|
| (1,181,011) |
| (574,140) |
| (1,318,902) |
| (590,769) |
Dividends paid for preference shares |
|
| — |
| — |
| (522,592) |
| (174,227) |
Transactions with non-controlling interests | 5.4 |
| — |
| — |
| 69,155 |
| 65,478 |
Share options exercised |
|
| (14,688) |
| (20,281) |
| (45,024) |
| (22,804) |
Other |
|
| 963 |
| — |
| 1,397 |
| — |
Net cash generated by (used in) financing activities |
|
| 210,387 |
| (2,505,760) |
| 1,049,226 |
| (1,537,196) |
Increase (decrease) in cash and cash equivalents |
|
| 558,775 |
| (2,342,021) |
| 11,276,412 |
| (1,735,119) |
Cash and cash equivalents at beginning of the year |
|
| 1,149,267 |
| 3,490,707 |
| 4,614,053 |
| 6,076,644 |
Effect of foreign exchange rate changes |
|
| 10,035 |
| 581 |
| 283,665 |
| 272,528 |
Cash and cash equivalents at end of the year |
|
| 1,718,077 |
| 1,149,267 |
| 16,174,130 |
| 4,614,053 |
Additional information |
|
|
|
|
|
|
|
|
|
Income tax paid |
|
| — |
| 4,597 |
| 462,120 |
| 580,367 |
The accompanying notes are an integral part of these financial statements.
Statement of cash flows
(In thousands of Brazilian Reais - R$
Non-cash transactions
- Recognition of interest on shareholder’s equity decided by Raízen S.A in the amount of R$ 222,798 (R$62,380 as of December 31, 2020).
- Acquisition of assets for the construction of pipeline and assets for logistics operations with payment in installments in the amount of R$263,143 (R$7,804 as of December 31, 2020).
- Capital contribution to the subsidiary Payly Soluções de Pagamentos S.A. (“Payly”) in the amount of R$3,750, (R$10,000 on December 31, 2020), through the capitalization of expenses that would be reimbursed to Cosan S.A..
- Recognition of right-of-use in the R$104,840 related to new lease agreements in December 31, 2021.
- The subsidiary Comgás used tax credits, avoiding cash outflow, of the total amount presented as payment in the supplementary information, R$262,843 referring to the payment of the annual adjustment for 2020.
Disclosure of interest and dividends
The Company classifies dividends and interest on shareholder’s equity received as cash flow from investing activities.
Interest received or paid is classified as cash flow in financing activities.
(In thousands of Brazilian Reais - R$)
|
| Parent Company |
| Consolidated | ||||
|
| December 31, 2021 |
| December 31, 2020 |
| December 31, 2021 |
| December 31, 2020 |
Revenues |
|
|
|
|
|
|
|
|
Sales of products and services net of returns |
| — |
| — |
| 29,923,191 |
| 17,503,638 |
Other operating revenues (expenses), net |
| 438,045 |
| (68,545) |
| 864,357 |
| (24,006) |
Allowance for doubtful accounts |
| — |
| — |
| 3,034 |
| (31,196) |
|
| 438,045 |
| (68,545) |
| 30,790,582 |
| 17,448,436 |
Raw materials acquired from third parties |
|
|
|
|
|
|
|
|
Cost of goods sold and services rendered |
| — |
| — |
| 10,104,416 |
| 9,762,747 |
Materials, energy, third party services, others |
| 179,774 |
| 47,300 |
| 10,807,171 |
| 535,653 |
|
| 179,774 |
| 47,300 |
| 20,911,587 |
| 10,298,400 |
Gross value added |
| 258,271 |
| (115,845) |
| 9,878,995 |
| 7,150,036 |
Retention |
|
|
|
|
|
|
|
|
Depreciation and amortization |
| 13,403 |
| 11,411 |
| 2,221,536 |
| 623,084 |
|
| 13,403 |
| 11,411 |
| 2,221,536 |
| 623,084 |
Net value added |
| 244,868 |
| (127,256) |
| 7,657,459 |
| 6,526,952 |
Value added transferred in |
|
|
|
|
|
|
|
|
Interest in earnings of subsidiaries |
| 6,748,458 |
| 1,347,408 |
| 129,159 |
| 15,714 |
Interest in earnings of joint ventures |
| (177,217) |
| (80,900) |
| 4,590,631 |
| 583,001 |
Finance income |
| 208,103 |
| 188,005 |
| 1,010,427 |
| 227,925 |
|
| 6,779,344 |
| 1,454,513 |
| 5,730,217 |
| 826,640 |
Value added to be distributed |
| 7,024,212 |
| 1,327,257 |
| 13,387,676 |
| 7,353,592 |
Distribution of value added |
|
|
|
|
|
|
|
|
Payroll and social charges |
| 142,101 |
| 75,554 |
| 1,654,638 |
| 591,722 |
Direct remuneration |
| 127,345 |
| 66,150 |
| 1,299,017 |
| 535,646 |
Benefits |
| 8,031 |
| 5,813 |
| 283,228 |
| 44,842 |
FGTS and others |
| 6,725 |
| 3,591 |
| 72,393 |
| 11,234 |
Taxes and contributions |
| (611,053) |
| (193,568) |
| 1,462,879 |
| 4,362,573 |
Federal |
| (616,039) |
| (193,568) |
| 76,547 |
| 2,069,934 |
State |
| — |
| — |
| 1,251,735 |
| 2,281,008 |
Municipal |
| 4,986 |
| — |
| 134,597 |
| 11,631 |
Finance expense and rents |
| 1,369,948 |
| 593,413 |
| 3,919,383 |
| 1,490,483 |
Interest and exchange variation |
| 1,326,823 |
| 641,778 |
| 3,582,517 |
| 933,154 |
Rents |
| — |
| 6,239 |
| 135,019 |
| 28,632 |
Others |
| 43,125 |
| (54,604) |
| 201,847 |
| 528,697 |
Non-controlling interests |
| — |
| — |
| 227,560 |
| 56,956 |
Dividends |
| 1,454,263 |
| 202,316 |
| 1,454,263 |
| 202,316 |
Profit for the year |
| 4,668,953 |
| 649,542 |
| 4,668,953 |
| 649,542 |
|
| 7,024,212 |
| 1,327,257 |
| 13,387,676 |
| 7,353,592 |
The accompanying notes are an integral part of these financial statements.
(In thousands of Brazilian Reais - R$, unless otherwise stated)
1 Operations
Cosan S.A. (“Cosan” or “the Company”) is a publicly-traded Company on the B3 S.A. - Brasil, Bolsa, Balcão, or “B3,” on the special New Market (Novo Mercado) segment under the ticker symbol “CSAN3.” The Company’s American Depositary Shares, or “ADSs,” are listed on the New York Stock Exchange, or “NYSE,” and traded under the symbol “CSAN.” Cosan is a corporation (sociedade anônima) of indefinite term incorporated under the laws of Brazil, with its registered office in the city of São Paulo, state of São Paulo. Mr. Rubens Ometto Silveira Mello is the ultimate controlling shareholder of Cosan.
1.1 Corporate reorganization
On July 2, 2020, the boards of directors of Cosan S.A., Cosan Limited and Cosan Logística S.A. ("Cosan Logística"), or collectively the "Companies", authorized studies on a proposed corporate reorganization to simplify the structure of the economic group.
As part of an effort to streamline its operations, Cosan S.A. carried out at corporate reorganization to enhance its corporate structure by making Cosan S.A. the sole holding company of the Cosan Group (“Grupo Cosan” refers to the economic entity previously represented by Cosan Limited, Cosan S.A., Cosan Logística and its subsidiaries before the merger, which, after the merger, is represented by Cosan S.A. and its subsidiaries, as the context requires). The corporate reorganization simplified our corporate structure, unifying and consolidating the outstanding shares in the financial market (“free floats”) of the Companies, in order to increase share liquidity, and unlock value that exists within the Cosan Group and facilitate future fundraising.
As part of the corporate reorganization, Cosan Limited and Cosan Logística were merged into Cosan S.A. Following the completion of the reorganization outstanding shares of Cosan S.A. were directly owned by all shareholders of Cosan Limited, Cosan S.A. and Cosan Logística. As a result, Cosan S.A. issued ADSs to the shareholders of Cosan Limited and the shareholders of Cosan Logística became owners of Cosan S.A. common shares.
Notes to the financial statements
(In thousands of Brazilian Reais - R$, unless otherwise stated)
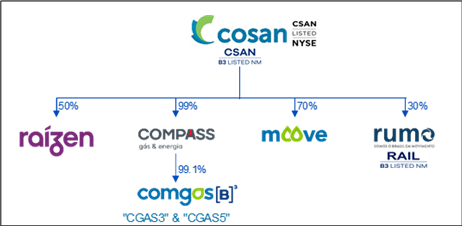
Figure 1: Simplified operational structure after the merger.
The administrators of Cosan S.A., Cosan Limited and Cosan Logística evaluated the exchange ratio negotiated and recommended by the committees and stated as follows:
- The exchange ratio was 0.772788 Cosan Limited shares for each Cosan S.A. shares or Cosan S.A. ADS. Thus, 308,554,969 Cosan S.A. shares were issued for Cosan Limited shareholders; and
- The exchange ratio was 3.943112 Cosan Logística shares for each Cosan S.A. share. Thus, 31,025,350 Cosan S.A. shares were issued for shareholders of Cosan Logística.
On January 22, 2021, the shareholders of the Companies approved the intra-group restructuring, which consisted of the merger of companies under common control, pursuant to which Cosan Limited and Cosan Logística were merged into Cosan S.A.
On February 5, 2021, the board of directors approved cancellation 10,000,000 shares issued by the Company that were held in treasury.
Notes to the financial statements
(In thousands of Brazilian Reais - R$, unless otherwise stated)
On February 23, 2021, the deadline for exercising the right of withdrawal guaranteed to shareholders of Cosan Logística ended without any manifestation of withdrawal. As a result, on March 1, 2021, Cosan concluded the merger of Cosan Limited and Cosan Logística and now holds a share capital of R$6,365,853.
The results of the Companies that were consolidated from March 1, 2021, generated a positive result of R$38,998 in the Cosan S.A. net income for the year ended on December 31, 2021.
1.1.1 Basis of preparation of financial information
As a result of the mergers on March 1, 2021, for comparative purposes, the consolidated balances presented for the year ended December 31, 2020, are those of Cosan S.A. and, therefore, the Company's financial statements as of December 31, 2021 were prepared to reflect:
- The income statements and balance sheets of Cosan S.A. on a historical basis;
- The effects of the merger of shares of Cosan Limited and Cosan Logística by the Company; and
- the non-controlling interest in the Company, which was determined by the proportional share of identifiable shareholders' equity and net income. The individual financial statements reflect the equity in the subsidiary Rumo S.A. while the consolidated financial statements were prepared considering the Company's control as of March 1, 2021.
The financial position as of March 1, 2021, is based on the individual and consolidated historical balances of Cosan S.A., Cosan Limited and Cosan Logística, as shown below:
16 Notes to the financial statements
(In thousands of Brazilian Reais - R$, unless otherwise stated)
Parent company
Open Balance (March 1st, 2021)
|
|
|
|
| Incorporated companies |
|
|
|
|
|
| ||||
|
|
| Cosan S.A. - Parent Company |
| Cosan Limited - Parent Company |
| Cosan Logística - Parent Company |
| Total incorporated assets |
| Elimination |
| Adjustments |
| Cosan S.A. post-reorganization |
Assets |
|
|
|
|
|
|
|
|
|
| 1.1.2(a) |
| 1.1.2(b) |
|
|
Cash and cash equivalents |
|
| 1,099,643 |
| 353,595 |
| 6 |
| 353,601 |
| — |
| — |
| 1,453,244 |
Marketable securities |
|
| 927,011 |
| — |
| — |
| — |
| — |
| — |
| 927,011 |
Derivative financial instruments |
|
| 71,133 |
| — |
| — |
| — |
| — |
| — |
| 71,133 |
Receivables from related parties |
|
| 279,718 |
| 54 |
| 194 |
| 248 |
| (12,481) |
| — |
| 267,485 |
Income tax receivable |
|
| 143,359 |
| 3 |
| 2,841 |
| 2,844 |
| — |
| — |
| 146,203 |
Other current tax receivable |
|
| 35,515 |
| — |
| 4 |
| 4 |
| — |
| — |
| 35,519 |
Dividends receivable |
|
| 160,694 |
| 148,271 |
| — |
| 148,271 |
| (148,271) |
| — |
| 160,694 |
Other financial assets |
|
| 734,903 |
| — |
| — |
| — |
| — |
| (734,903) |
| — |
Other current assets |
|
| 101,221 |
| 1,744 |
| — |
| 1,744 |
| — |
| — |
| 102,965 |
Total current assets |
|
| 3,553,197 |
| 503,667 |
| 3,045 |
| 506,712 |
| (160,752) |
| (734,903) |
| 3,164,254 |
|
|
|
|
|
|
|
|
|
|
|
|
|
|
|
|
Deferred tax assets |
|
| 75,959 |
| — |
| — |
| — |
| — |
| 80,483 |
| 156,442 |
Receivables from related parties |
|
| 576,929 |
| — |
| — |
| — |
| — |
| — |
| 576,929 |
Other non-current tax receivable |
|
| 37,623 |
| — |
| — |
| — |
| — |
| — |
| 37,623 |
Judicial deposits |
|
| 384,455 |
| — |
| 1,017 |
| 1,017 |
| — |
| — |
| 385,472 |
Derivative financial instruments |
|
| 2,758,732 |
| 183,426 |
| — |
| 183,426 |
| — |
| — |
| 2,942,158 |
Other non-current assets |
|
| 169,370 |
| — |
| — |
| — |
| — |
| — |
| 169,370 |
Investments in subsidiaries and associates |
|
| 13,025,364 |
| 8,769,145 |
| 4,259,390 |
| 13,028,535 |
| (8,761,919) |
| 329,118 |
| 17,621,098 |
Property, plant and equipment |
|
| 60,457 |
| 2,724 |
| — |
| 2,724 |
| — |
| — |
| 63,181 |
Intangible assets and goodwill |
|
| 2,067 |
| — |
| — |
| — |
| — |
| — |
| 2,067 |
Right-of-use assets |
|
| 24,212 |
| 8,430 |
| — |
| 8,430 |
| — |
| — |
| 32,642 |
Total non-current assets |
|
| 17,115,168 |
| 8,963,725 |
| 4,260,407 |
| 13,224,132 |
| (8,761,919) |
| 409,601 |
| 21,986,982 |
Total assets |
|
| 20,668,365 |
| 9,467,392 |
| 4,263,452 |
| 13,730,844 |
| (8,922,671) |
| (325,302) |
| 25,151,236 |
Notes to the financial statements
(In thousands of Brazilian Reais - R$, unless otherwise stated)
|
|
|
|
| Incorporated companies |
|
|
|
|
|
| ||||
|
|
| Cosan S.A. - Parent Company |
| Cosan Limited - Parent Company |
| Cosan Logística Consolidated |
| Total incorporated assets |
| Elimination |
| Adjustments |
| Cosan S.A. post-reorganization |
Liabilities |
|
|
|
|
|
|
|
|
|
| 1.1.2(a) |
| 1.1.2(b) |
|
|
Loans, borrowings and debentures |
|
| — |
| 98,397 |
| 38,981 |
| 137,378 |
| — |
| — |
| 137,378 |
Leases |
|
| 2,785 |
| 824 |
| — |
| 824 |
| — |
| — |
| 3,609 |
Derivative financial instruments |
|
| 1,253 |
| — |
| — |
| — |
| — |
| — |
| 1,253 |
Trade payables |
|
| 1,769 |
| 207 |
| 40 |
| 247 |
| — |
| — |
| 2,016 |
Employee benefits payables |
|
| 24,246 |
| — |
| — |
| — |
| — |
| — |
| 24,246 |
Income tax payables |
|
| 614 |
| 3 |
| 5 |
| 8 |
| — |
| — |
| 622 |
Other taxes payable |
|
| 115,593 |
| 9 |
| 1,251 |
| 1,260 |
| — |
| (11,544) |
| 105,309 |
Dividends payable |
|
| 216,929 |
| — |
| 241 |
| 241 |
| (148,271) |
| — |
| 68,899 |
Payables to related parties |
|
| 318,535 |
| 4,844 |
| 407 |
| 5,251 |
| (12,483) |
| — |
| 311,303 |
Other current liabilities |
|
| 107,502 |
| 7,902 |
| 992 |
| 8,894 |
| — |
| — |
| 116,396 |
Total current liabilities |
|
| 789,226 |
| 112,186 |
| 41,917 |
| 154,103 |
| (160,754) |
| (11,544) |
| 771,031 |
|
|
|
|
|
|
|
|
|
|
|
|
|
|
|
|
Loans, borrowings and debentures |
|
| — |
| 4,124,973 |
| 1,719,992 |
| 5,844,965 |
| — |
| — |
| 5,844,965 |
Leases |
|
| 24,930 |
| 8,887 |
| — |
| 8,887 |
| — |
| — |
| 33,817 |
Preferred shareholders payable in subsidiaries |
|
| 389,585 |
| — |
| — |
| — |
| — |
| — |
| 389,585 |
Derivative financial instruments |
|
| 110,554 |
| — |
| — |
| — |
| — |
| — |
| 110,554 |
Other taxes payable |
|
| 140,978 |
| — |
| — |
| — |
| — |
| — |
| 140,978 |
Provision for legal proceedings |
|
| 309,484 |
| — |
| — |
| — |
| — |
| — |
| 309,484 |
Provision for uncovered liability of associates |
|
| 432,350 |
| — |
| — |
| — |
| — |
| — |
| 432,350 |
Payables to related parties |
|
| 7,499,128 |
| 47,771 |
| — |
| 47,771 |
| — |
| — |
| 7,546,899 |
Post-employment benefits |
|
| 155 |
| — |
| — |
| — |
| — |
| — |
| 155 |
Other non-current liabilities |
|
| 288,658 |
| — |
| — |
| — |
| — |
| — |
| 288,658 |
Total non-current liabilities |
|
| 9,195,822 |
| 4,181,631 |
| 1,719,992 |
| 5,901,623 |
| — |
| — |
| 15,097,445 |
Total liabilities |
|
| 9,985,048 |
| 4,293,817 |
| 1,761,909 |
| 6,055,726 |
| (160,754) |
| (11,544) |
| 15,868,476 |
|
|
|
|
|
|
|
|
|
|
|
|
|
|
|
|
Shareholders' equity |
|
|
|
|
|
|
|
|
|
|
|
|
|
|
|
Share capital |
|
| 5,727,478 |
| 5,328 |
| 2,284,893 |
| 2,290,221 |
| (1,651,846) |
| — |
| 6,365,853 |
Reserves and other components of equity |
|
| 4,955,839 |
| 5,168,247 |
| 216,650 |
| 5,384,897 |
| (7,110,071) |
| (313,758) |
| 2,916,907 |
|
|
| 10,683,317 |
| 5,173,575 |
| 2,501,543 |
| 7,675,118 |
| (8,761,917) |
| (313,758) |
| 9,282,760 |
Equity attributable to: |
|
|
|
|
|
|
|
|
|
|
|
|
|
|
|
Owners of the Company |
|
| 10,683,317 |
| 5,173,575 |
| 2,501,543 |
| 7,675,118 |
| (8,761,917) |
| (313,758) |
| 9,282,760 |
Total shareholders' equity |
|
| 10,683,317 |
| 5,173,575 |
| 2,501,543 |
| 7,675,118 |
| (8,761,917) |
| (313,758) |
| 9,282,760 |
Total shareholders' equity and liabilities |
|
| 20,668,365 |
| 9,467,392 |
| 4,263,452 |
| 13,730,844 |
| (8,922,671) |
| (325,302) |
| 25,151,236 |
Notes to the financial statements
(In thousands of Brazilian Reais - R$, unless otherwise stated)
Consolidated
Open Balance (March 1st, 2021)
|
|
|
|
| Incorporated companies |
|
|
|
|
|
| ||||
|
|
| Cosan S.A. Consolidated |
| Cosan Limited Corporate (i) |
| Cosan Logística Consolidated |
| Total incorporated assets |
| Elimination |
| Adjustments |
| Cosan S.A. post-reorganization |
Assets |
|
|
|
|
|
|
|
|
|
| 1.1.2(a) |
| 1.1.2(b) |
|
|
Cash and cash equivalents |
|
| 4,367,675 |
| 356,410 |
| 7,769,445 |
| 8,125,855 |
| — |
| — |
| 12,493,530 |
Marketable securities |
|
| 1,686,029 |
| 327 |
| 3,025,185 |
| 3,025,512 |
| — |
| — |
| 4,711,541 |
Trade receivables |
|
| 1,639,123 |
| 305 |
| 617,546 |
| 617,851 |
| — |
| — |
| 2,256,974 |
Derivative financial instruments |
|
| 182,922 |
| — |
| 82,191 |
| 82,191 |
| — |
| — |
| 265,113 |
Inventories |
|
| 659,485 |
| 8 |
| 255,042 |
| 255,050 |
| — |
| — |
| 914,535 |
Receivables from related parties |
|
| 205,383 |
| 36 |
| 36,451 |
| 36,487 |
| (12,481) |
| — |
| 229,389 |
Income tax receivable |
|
| 169,644 |
| 7 |
| 98,343 |
| 98,350 |
| — |
| — |
| 267,994 |
Other current tax receivable |
|
| 372,525 |
| 172 |
| 345,539 |
| 345,711 |
| — |
| — |
| 718,236 |
Dividends receivable |
|
| 77,561 |
| 148,271 |
| 6,322 |
| 154,593 |
| (148,271) |
| — |
| 83,883 |
Sectorial financial assets |
|
| 216,488 |
| — |
| — |
| — |
| — |
| — |
| 216,488 |
Other financial assets |
|
| 804,256 |
| — |
| — |
| — |
| — |
| (734,903) |
| 69,353 |
Other current assets |
|
| 294,606 |
| 1,955 |
| 264,994 |
| 266,949 |
| — |
| — |
| 561,555 |
Total current assets |
|
| 10,675,697 |
| 507,491 |
| 12,501,058 |
| 13,008,549 |
| (160,752) |
| (734,903) |
| 22,788,591 |
|
|
|
|
|
|
|
|
|
|
|
|
|
|
|
|
Trade receivables |
|
| 19,476 |
| — |
| 6,303 |
| 6,303 |
| — |
| — |
| 25,779 |
Restricted cash |
|
| — |
| — |
| 29,835 |
| 29,835 |
| — |
| — |
| 29,835 |
Deferred tax assets |
|
| 631,987 |
| 33 |
| 1,350,121 |
| 1,350,154 |
| — |
| — |
| 1,982,141 |
Receivables from related parties |
|
| 207,905 |
| — |
| 94,473 |
| 94,473 |
| (47,770) |
| — |
| 254,608 |
Income taxes receivable |
|
| 309 |
| — |
| 40,707 |
| 40,707 |
| — |
| — |
| 41,016 |
Other non-current tax receivable |
|
| 168,666 |
| — |
| 782,580 |
| 782,580 |
| — |
| — |
| 951,246 |
Judicial deposits |
|
| 551,833 |
| — |
| 328,984 |
| 328,984 |
| — |
| — |
| 880,817 |
Derivative financial instruments |
|
| 3,311,933 |
| 183,426 |
| 2,346,374 |
| 2,529,800 |
| — |
| — |
| 5,841,733 |
Contract asset |
|
| 655,680 |
| — |
| — |
| — |
| — |
| — |
| 655,680 |
Other non-current assets |
|
| 235,161 |
| 2 |
| 57,726 |
| 57,728 |
| — |
| — |
| 292,889 |
Investments in subsidiaries and associates |
|
| 331,005 |
| 8,758,462 |
| 49,953 |
| 8,808,415 |
| (9,087,580) |
| 329,118 |
| 380,958 |
Investments in joint venture |
|
| 7,613,457 |
| — |
| — |
| — |
| — |
| — |
| 7,613,457 |
Property, plant and equipment |
|
| 424,651 |
| 4,335 |
| 14,032,909 |
| 14,037,244 |
| — |
| — |
| 14,461,895 |
Intangible assets and goodwill |
|
| 10,184,202 |
| 15,159 |
| 7,226,616 |
| 7,241,775 |
| — |
| — |
| 17,425,977 |
Right-of-use assets |
|
| 83,664 |
| 8,853 |
| 7,809,397 |
| 7,818,250 |
| — |
| — |
| 7,901,914 |
Total non-current assets |
|
| 24,419,929 |
| 8,970,270 |
| 34,155,978 |
| 43,126,248 |
| (9,135,350) |
| 329,118 |
| 58,739,945 |
Total assets |
|
| 35,095,626 |
| 9,477,761 |
| 46,657,036 |
| 56,134,797 |
| (9,296,102) |
| (405,785) |
| 81,528,536 |
(i) Comprise the companies directly controlled by Cosan Limited, except Cosan S.A. and Cosan Logística.
Notes to the financial statements
(In thousands of Brazilian Reais - R$, unless otherwise stated)
|
|
|
|
| Incorporated companies |
|
|
|
|
|
| ||||
|
|
| Cosan S.A. Consolidated |
| Cosan Limited Corporate (i) |
| Cosan Logística Consolidated |
| Total incorporated assets |
| Elimination |
| Adjustments |
| Cosan S.A. post-reorganization |
Liabilities |
|
|
|
|
|
|
|
|
|
| 1.1.2(a) |
| 1.1.2(b) |
|
|
Loans, borrowings and debentures |
|
| 842,781 |
| 98,420 |
| 2,318,462 |
| 2,416,882 |
| — |
| — |
| 3,259,663 |
Leases |
|
| 11,867 |
| 1,068 |
| 510,047 |
| 511,115 |
| — |
| — |
| 522,982 |
Derivative financial instruments |
|
| 146,261 |
| — |
| — |
| — |
| — |
| — |
| 146,261 |
Trade payables |
|
| 1,813,517 |
| 1,335 |
| 566,273 |
| 567,608 |
| — |
| — |
| 2,381,125 |
Employee benefits payables |
|
| 214,941 |
| 1,782 |
| 154,262 |
| 156,044 |
| — |
| — |
| 370,985 |
Income tax payables |
|
| 331,264 |
| 580 |
| 245,826 |
| 246,406 |
| — |
| — |
| 577,670 |
Other taxes payable |
|
| 375,996 |
| 10 |
| 33,092 |
| 33,102 |
| — |
| (11,544) |
| 397,554 |
Dividends payable |
|
| 285,209 |
| — |
| 10,267 |
| 10,267 |
| (148,271) |
| — |
| 147,205 |
Concessions payable |
|
| — |
| — |
| 159,330 |
| 159,330 |
| — |
| — |
| 159,330 |
Payables to related parties |
|
| 304,021 |
| 5,786 |
| 188,971 |
| 194,757 |
| (12,483) |
| — |
| 486,295 |
Sectorial financial liabilities |
|
| 93,244 |
| — |
| — |
| — |
| — |
| — |
| 93,244 |
Other financial liabilities |
|
| 120,247 |
| — |
| 361,494 |
| 361,494 |
| — |
| — |
| 481,741 |
Other current liabilities |
|
| 229,603 |
| 9,289 |
| 298,692 |
| 307,981 |
| — |
| — |
| 537,584 |
Total current liabilities |
|
| 4,768,951 |
| 118,270 |
| 4,846,716 |
| 4,964,986 |
| (160,754) |
| (11,544) |
| 9,561,639 |
|
|
|
|
|
|
|
|
|
|
|
|
|
|
|
|
Loans, borrowings and debentures |
|
| 14,091,982 |
| 4,125,001 |
| 20,275,636 |
| 24,400,637 |
| — |
| — |
| 38,492,619 |
Leases |
|
| 67,882 |
| 9,097 |
| 2,430,749 |
| 2,439,846 |
| — |
| — |
| 2,507,728 |
Preferred shareholders payable in subsidiaries |
|
| 389,585 |
| — |
| — |
| — |
| — |
| — |
| 389,585 |
Derivative financial instruments |
|
| 110,554 |
| — |
| — |
| — |
| — |
| — |
| 110,554 |
Other taxes payable |
|
| 146,539 |
| — |
| 2,112 |
| 2,112 |
| — |
| — |
| 148,651 |
Provision for legal proceedings |
|
| 890,189 |
| — |
| 497,574 |
| 497,574 |
| — |
| — |
| 1,387,763 |
Concessions payable |
|
| — |
| — |
| 2,849,861 |
| 2,849,861 |
| — |
| — |
| 2,849,861 |
Payables to related parties |
|
| — |
| 47,771 |
| — |
| 47,771 |
| (47,771) |
| — |
| — |
Post-employment benefits |
|
| 733,047 |
| — |
| 57 |
| 57 |
| — |
| — |
| 733,104 |
Deferred tax liabilities |
|
| 1,326,171 |
| — |
| 1,988,261 |
| 1,988,261 |
| — |
| (80,483) |
| 3,233,949 |
Sectorial financial liabilities |
|
| 499,016 |
| — |
| — |
| — |
| — |
| — |
| 499,016 |
Deferred revenue |
|
| — |
| — |
| 42,100 |
| 42,100 |
| — |
| — |
| 42,100 |
Other non-current liabilities |
|
| 694,781 |
| — |
| 64,680 |
| 64,680 |
| — |
| — |
| 759,461 |
Total non-current liabilities |
|
| 18,949,746 |
| 4,181,869 |
| 28,151,030 |
| 32,332,899 |
| (47,771) |
| (80,483) |
| 51,154,391 |
Total liabilities |
|
| 23,718,697 |
| 4,300,139 |
| 32,997,746 |
| 37,297,885 |
| (208,525) |
| (92,027) |
| 60,716,030 |
|
|
|
|
|
|
|
|
|
|
|
|
|
|
|
|
Shareholders' equity |
|
|
|
|
|
|
|
|
|
|
|
|
|
|
|
Share capital |
|
| 5,727,478 |
| 5,328 |
| 2,284,893 |
| 2,290,221 |
| (1,651,846) |
| — |
| 6,365,853 |
Reserves and other components of equity |
|
| 4,955,839 |
| 5,168,247 |
| 216,650 |
| 5,384,897 |
| (7,110,071) |
| (313,758) |
| 2,916,907 |
|
|
| 10,683,317 |
| 5,173,575 |
| 2,501,543 |
| 7,675,118 |
| (8,761,917) |
| (313,758) |
| 9,282,760 |
Equity attributable to: |
|
|
|
|
|
|
|
|
|
|
|
|
|
|
|
Owners of the Company |
|
| 10,683,317 |
| 5,173,575 |
| 2,501,543 |
| 7,675,118 |
| (8,761,917) |
| (313,758) |
| 9,282,760 |
Non-controlling interests |
|
| 693,612 |
| 4,047 |
| 11,157,747 |
| 11,161,794 |
| (325,660) |
| — |
| 11,529,746 |
Total shareholders' equity |
|
| 11,376,929 |
| 5,177,622 |
| 13,659,290 |
| 18,836,912 |
| (9,087,577) |
| (313,758) |
| 20,812,506 |
Total shareholders' equity and liabilities |
|
| 35,095,626 |
| 9,477,761 |
| 46,657,036 |
| 56,134,797 |
| (9,296,102) |
| (405,785) |
| 81,528,536 |
(i) Comprise the companies directly controlled by Cosan Limited, except Cosan S.A. and Cosan Logística.
Notes to the financial statements
(In thousands of Brazilian Reais - R$, unless otherwise stated)
1.1.2 Adjustments and assumptions used
The financial information was prepared and presented based on the individual and consolidated balances and the adjustments were determined following Management's assumptions and best estimates that include the following adjustments:
(a) Elimination
The consummate operation was an intra-group reorganization, in which: (1) it involved only entities that are under common control; and (2) all the entities involved were already presented at Cosan Limited on a consolidated basis. As a result, the investment balances that Cosan Limited held in Cosan Logística and Cosan S.A. were eliminated, as well as the effects of transactions between related parties.
(b) Adjustment of other financial assets
Cosan S.A. owned 40,065,607 shares of Rumo S.A., representing 2.16% of its shareholders' equity, and 477,196 shares of Cosan Logística, representing 0.10% of its shareholders' equity. These shares were recorded in the financial position as a financial asset, being measured at fair value through profit or loss, as Management considered trading these shares.
With the corporate reorganization, the financial asset, as well as its applicable taxes, was derecognized by R$734,903 and, consequently, an investment in subsidiary of R$329,118 was recorded. Additionally, the amount of R$313,758 was recognized in the capital reserve.
Notes to the financial statements
(In thousands of Brazilian Reais - R$, unless otherwise stated)
1.2 Recent developments and other events
1.2.1 Contribution of Comgás' control to Compass Gás e Energia S.A
On January 14, 2020, the Company contributed to the subsidiary Compass Gás e Energia S.A. (“Compass Gás e Energia”), all shares it held in Companhia de Gás de São Paulo - COMGÁS (“Comgás”), representing 103,699,333 common shares and 27,682,044 preferred shares equivalent to 99.15% of the total share capital of Comgás, for an amount of R$ 2,861,936 (note 8.1). The Shareholders' equity of December 31, 2019, was contributed and, therefore, on January 1, 2020, Compass Gás e Energia started to hold the control of Comgás.
1.2.2 Start in the commercialization business
On January 30, 2020, the Company acquired, through its subsidiary Compass Comercialização S.A. (formerly Comercializadora de Gás S.A., the control of Black River Participações Ltda. (“Black River”), Compass Comercializadora de Energia Ltda., Compass Geração Ltda. and Compass Energia Ltda. for an amount equivalent to R$99,385. The purpose of the investment is to enter the electricity and gas trading business (note 8.2.2).
1.2.3 New Gas and Energy segment
On March 9, 2020, Cosan S.A. announced the creation of the “Gas and Energy” segment. This segment will integrate the operations of Comgás, TRSP - São Paulo LNG Regasification Terminal S.A. (Terminal de Regaseificação de GNL de São Paulo S.A) or “TRSP”, Rota 4 Participações S.A. (“Rota 4”) and Compass Comercialização S.A. (“Compass Comercialização”). The new gas and energy segment will be the vehicle through which the Company will develop the activities of (i) distribution of piped natural gas in part of the State of São Paulo to customers in the industrial, residential, commercial, automotive and cogeneration sectors; (ii) sale of electricity and natural gas; (iii) infrastructure in a regasification terminal and offshore flow pipeline; and (iv) thermal generation through natural gas.
Notes to the financial statements
(In thousands of Brazilian Reais - R$, unless otherwise stated)
1.2.4 Cybersecurity Incident
On March 11, 2020, the Company and its subsidiaries and jointly controlled companies suffered a cyber-attack by ransomware that caused a partial and temporary interruption of their operations.
After the incident, the Company made significant investments in privacy, protection and security of information/cybernetics, both in technologies and in processes and hiring for the teams. As part of the actions, we take steps to combat access and misuse of our data, including more robust investigations and audits of our information technology systems. As a result of these efforts, we mitigate additional incidents of data misuse or other undesirable activities by third parties.
In addition, we performed an audit and forensic assessment of the attack suffered and did not identify any relevant impacts on the Company's and subsidiaries financial statements.
1.2.5 Share buyback program
On March 16, 2020, the Company approved the common share buyback program (note 16.b). From October 2 to October 19, 2020, 2,149,600 common shares were repurchased in the amount of R$ 166,080.
1.2.6 Proposal for the acquisition of 51% of Gaspetro
On October 26, 2020, the subsidiary Compass Gás e Energia presented, with the approval of its Board of Directors, a proposal in the competitive divestment process promoted by Petróleo Brasileiro S.A. – Petrobras for the sale of the 51% interest in the share capital of Petrobras Gás S.A. – Gaspetro (“Gaspetro”).
Notes to the financial statements
(In thousands of Brazilian Reais - R$, unless otherwise stated)
On July 28, 2021, Compass Gás e Energia entered into a share purchase and sale agreement for the acquisition of control of Gaspetro for the amount of R$2,030,000, to be paid at closing, subject to the adjustments provided for in the agreement.
The conclusion of the transaction is subject to the fulfillment of certain suspensive conditions, which include, but are not limited to, the observation of the period for exercising the preemptive right of other shareholders of Gaspetro and its investees and the approval by the competent bodies.
1.2.7 Renewal of license to use Shell trademark
On May 20, 2021, Raízen entered into a renewal of the license agreement for the use of the "Shell" brand with Shell Brands International AG. With this renewal, Raízen S.A. keeps the right to use the "Shell" brand, in the fuel distribution sector and related activities in Brazil, for a minimum period of 13 years, which can be renewed in certain cases, upon compliance with certain conditions established in the contract.
1.2.8 Corporate reorganization in the Raízen S.A.
On June 1, 2021, Raízen Combustíveis S.A. (“Raízen Combustíveis”) and Raízen Energia S.A. (“Raízen Energia”) contributed all common shares, as well as class A and D preferred shares, all shares issued by Raízen Energia, in a capital increase of Raízen Combustíveis (with the exception of two common shares that remained held one by each shareholder - Cosan Investimentos e Participações S.A. and Shell Brasil Holding BV (“Shell”), by their respective book equity value and without any impact on the accounting and income items. On this date Raízen Energia also redeemed all of its own class B preferred shares. As a result, Raízen Combustíveis became the holder of shares representing 100% of the capital stock of Raízen Energia (subject to the exception mentioned above) (“Raízen Reorganization”).
Notes to the financial statements
(In thousands of Brazilian Reais - R$, unless otherwise stated)
As a result of the corporate reorganization, Cosan S.A. and Shell terminated the Raízen Energia shareholders’ agreement and amended the Raízen Combustíveis shareholders’ agreement in order to adapt its terms and conditions to the new corporate situation.
With effect from June 2, 2021, the name of the Raízen Combustíveis S.A. was changed to Raízen S.A.
1.2.9 Initial public offering registration, or “IPO,” of Raízen S.A.
On June 3, 2021, Raízen S.A., or “Raízen,” (formerly known as Raízen Combustíveis S.A.) filed the IPO registration statement on the Brazilian Securities Commission (Comissão de Valores Mobiliários), or “CVM.”
On September 9, 2021, Raízen closed the IPO in which 906,712,350 preferred shares were subscribed at the price of R$7.40 per share, for a net amount of R$6,599,987 (R$6,709,671 capitalized less R$109,684 funding costs).
See the effects determined in Raízen's IPO in note 9.
1.2.10 Acquisition of Biosev S.A. by Raízen
On August 10, 2021, the acquisition of all shares issued by Biosev S.A., or “Biosev”, by Raízen was concluded, with payment in the amount of R$4,581,899. This payment was used, in turn, to pay part of Biosev's financial debts, with the remaining balance of such debts of Biosev being paid with funds from a new financing contracted by Hédera Investimentos e Participações S.A., or “Hédera”. Also, as part of the transaction Hédera exercised the subscription bonus in amount of R$2,423,944, adjusted to market value on the transaction date by the amount of R$76,663, totaling R$2,347,281, issued at the Company's general meeting held on June 1, 2021, becoming holder of 330,602,900 preferred shares issued by Raízen, representing approximately 3.22% of its capital.
(In thousands of Brazilian Reais - R$, unless otherwise stated)
Biosev's main activities are the production, processing and sale of rural and agricultural products, mainly sugarcane and its derivatives, generation and sale of energy as well, as derivatives from energy cogeneration.
This business combination is in line with Raízen's strategy of leading the transformation of the energy matrix with its own technology, by expanding the crushing capacity and increasing the share of renewable products in our portfolio.
See the calculated effects of Raízen in note 9.
1.2.11 Investment agreement in the subsidiary Compass Gás e Energia S.A.
On May 31, 2021, the subsidiary Compass Gás e Energia S.A. entered into an investment agreement with Atmos Ilíquidos 1 Fundo de Investimento em Ações, Atmos Master Fundo de Investimento em Ações, Manzat Inversiones Auu S.A. and Ricardo Ernesto Correa da Silva (together “Investors”), through which the Investors agreed to jointly subscribe 30,853,032 preferred shares issued by Compass Gás e Energia S.A. (“Compass”), representing 4.68% of the capital stock, through the Compass contribution of R$810,000.
In compliance with one of the conditions precedent, on August 12, 2021, Compass Gás e Energia was registered at B3.
Notes to the financial statements
(In thousands of Brazilian Reais - R$, unless otherwise stated)
The investment agreement was concluded with the financial settlement carried out by the Investors on August 27, 2021.
On September 4, 2021, the Compass entered into a second investment agreement with Bradesco Vida e Previdência S.A. (“Bradesco”), BC Gestão de Recursos Ltda., Prisma Capital Ltda. and Nucleus Capital Ltda., with the subscription of R$1,440,000 and the issue of new preferred shares, representing 7.68% of share capital.
On September 10, 2021, the first financial settlement of the investment made by Bradesco was concluded, via capital increase in Compass in the amount of R$810,015 through the issuance of new preferred shares representing 4.47% of the share capital
On October 29, 2021, the remaining settlement of the investment was carried out, in the total amount of R$630,000, which is part of the second round of investments via a private transaction to increase capital. As a result, Compass Gás e Energia increased its capital by R$23,996, through the issuance of 23,996,342 class B preferred shares, all registered, book-entry and without par value, at the issue price of R$26.25 per share. The total sum of contributions was R$2,250,015.
See transaction details in note 8.1.
1.2.12 Rumo Malha Central S.A.: Start of railroad operations
In February 2021, Rumo Malha Central S.A., or “Rumo Malha Central”, started its logistic rail service. The operations began with rail connecting between operations of Rumo Malha Paulista S.A., or “Rumo Malha Paulista” and Rumo Malha Norte S.A. or “Rumo Malha Norte.”
(In thousands of Brazilian Reais - R$, unless otherwise stated)
1.2.13 Acquisition of TUP Porto São Luis S.A.
On August 23, 2021, the Company, through its subsidiary Atlântico Participações Ltda. (“Atlântico”), entered into a binding proposal for the acquisition of 100% of TUP Porto São Luis S.A. (“Porto São Luis”) for the amount of R$720,000.
On November 3, 2021, the Company concluded the acquisition of the minority interest for the price of R$393,579.
On February 11, 2022 (“Acquisition Date”), the acquisition of the remaining shares of 51% of the capital of Porto São Luís was concluded, for the amount of R$411,224, with the transfer of control, held by São Luís Port Company SARL, a company of the China Communications Construction Company Limited (“CCCC”) group. The total amount paid for both transactions was R$804,803.
The acquisition generated preliminary goodwill in the amount of R$417,028 resulting from the acquisition of Porto that could not be recognized separately.
With the conclusion of this stage, the Company now holds 100% of the equity interest in Porto.
1.2.14 Acquisition of additional interest in Group Radar
On September 20, 2021, the Company entered into a Share Purchase Agreement with Mansilla Participações Ltda. (“Mansilla”, vehicle of the investment fund TIAA - Teachers Insurance and Annuity Association of America), for the acquisition of an additional interest to that already held by the Company in Grupo Radar (“Radar”). The transaction was completed on November 3, 2021, as detailed in Note 8.2.1.
Notes to the financial statements
(In thousands of Brazilian Reais - R$, unless otherwise stated)
1.2.15 Acquisition of Brado's interest
On September 10, 2021, the subsidiary Rumo definitively ended the existing arbitration procedure with the non-controlling shareholders of Brado Logística e Participações S.A. (Logística Brasil – Fundo de Investimento e Participações, Dimitrio Markakis and Deminvest Empreendimentos e Participações), acquiring 2,000 shares, the which represents 15.42% of the capital stock, for R$388,739, increasing its interest to 77.65%.
1.2.16 Rumo Malha Norte extension project
On September 19, 2021, the subsidiary Rumo Malha Norte signed the Adhesion Agreement, with the State of Mato Grosso, for the construction, operation, exploration and conservation Project, by means of authorization, under the regime of private law, at its own risk, a railroad that independently connects the Rondonópolis/MT road-rail terminal to Cuiabá/MT and Lucas do Rio Verde/MT.
1.2.17 São Paulo Regasification Terminal
On August 3, 2021, the start of construction of São Paulo Regasification Terminal (Terminal de Regaseificação de São Paulo or “TRSP” or “Project”) located at Porto de Santos was approved. TRSP will have a nominal licensed regasification capacity of 14 million m³/day and storage of 173,000 m³ of liquefied natural gas (“LNG”). The estimated time for construction is 20 months.
Notes to the financial statements
(In thousands of Brazilian Reais - R$, unless otherwise stated)
1.2.18 Anticipation of obligations with preferred shareholders and termination of Cosan Investimentos e Participações S.A.
On September 1, 2021, Cosan S.A anticipated the payment of obligations with non-controlling preferred shareholders of Cosan Investimentos e Participações S.A (“CIP”) for the amount of R$182,373.
On December 1, 2021, CIP was merged into the Company. Considering that CIP's net assets were represented by the investment in Raízen S.A., the effect on Cosan was a reclassification between the lines of “Investments in subsidiaries and associates” to “investment in joint venture”.
1.2.19 Cosan Investimentos
On August 23, 2021, Cosan started a new investment strategy, through a new vehicle of the group – Cosan Investimentos. In which, through a structure of investment funds, it will invest in new businesses with its own resources and, eventually, also from third parties.
On December 29, 2021, Cosan contributed all the shares it held in the companies acquired from Radar, note 1.2.14, equivalent to 50% of the share capital, in the amount of R$2,115,554 to Verde Pinho Fundo de Investimento em Participações Multiestratégia (“FIP Verde Pinho”). FIP Verde Pinho is an exclusive investment fund, present in the structure of Cosan Investimentos, in which Cosan owns 100% of the shares issued through its participation in the multimarket investment fund Violeta Fundo de Investimento Multimercado Crédito Privado (“FIM Violeta”).
1.2.20 Acquisition of control of Sulgás by the Compass e Energia
On October 22, 2021, Compass Gás e Energia, through its wholly-owned subsidiary Compass Um Participações S.A. (“Compass Um”), participated in Auction No. B3 S.A., for the acquisition of 51% of the capital stock of Companhia de Gás do Estado do Rio Grande do Sul (“Sulgás”), owned by the Government of the State of Rio Grande do Sul (“Transaction”), having submitted the bid Auction winner.
Notes to the financial statements
(In thousands of Brazilian Reais - R$, unless otherwise stated)
Sulgás is the distributor of piped natural gas in the State of Rio Grande do Sul and operates this service exclusively through a concession model valid until August 2044. Its distribution network totals approximately 1,400 km, serving more of 68 thousand customers in 42 municipalities, with a distributed volume of 2 million m3/day.
The preliminary goodwill in the amount of R$873,512 resulting from the acquisition comprises the amount of the concession right that could not be recognized separately. The goodwill is allocated in its entirety to the concession right recorded in intangible.
The 49% minority interest recognized on the Acquisition Date was measured based on the fair value of the minority interest and totaled R$917,784.
1.2.21 Tax Optimization with ExxonMobil
On October 19, 2021, under the Amendment to the Sale and Purchase of Member Interests, the Company and ExxonMobil International Holdings BV agreed on the payment made by Cosan Lubrificantes e Especialidades S.A. ("CLE") of R$208,118 related to tax credits granted during the Tax Optimization Program that CLE has entered into. CLE has now the full right of these tax credits.
(In thousands of Brazilian Reais - R$, unless otherwise stated)
1.3 Covid-19
During the year ended on December 31, 2021, the Company, its subsidiaries and jointly controlled companies continue to monitor the evolution of the COVID-19 pandemic in Brazil and worldwide, in order to take preventive measures to minimize the spread of the virus, ensure continuity of operations and safeguard the health and safety of our employees and partners. The response to the pandemic has been effective in limiting the impacts on our operational facilities, employees, supply chain and logistics.
On December 31, 2021, the Company had positive consolidated working capital of R$14,336,147 (R$5,021,286 on December 31, 2020), cash and cash equivalents and marketable securities of R$20,546,826 (R$6,885,623 on December 31, 2020), and profit for the year ended on December 31, 2021 of R$6,350,776 (profit for the year ended on December 31, 2020 of R$908,814).
Our covenants are assessed monthly for our need to generate sufficient cash flows to meet indebtedness and our ability to meet the covenants contained in the contracts that govern our indebtedness. Until December 31, 2021, the Company and its subsidiaries have been complying with all restrictive financial clauses.
Considering the level of interest rates in Brazil and in the locations of our subsidiaries, we consider that despite the short-term fluctuations in some macroeconomic assumptions due to the impacts of the COVID-19 pandemic, our weighted average cost of capital should not undergo material changes.
The Company assessed the circumstances that could indicate impairment of its non-financial assets and concluded that there were no changes in the circumstances that would indicate an impairment loss. Our tax recovery projections are based on the same scenarios and assumptions used in the impairment assessment.
Notes to the financial statements
(In thousands of Brazilian Reais - R$, unless otherwise stated)
Losses due to the non-recoverability of financial assets were calculated based on the credit risk analysis, which includes the history of losses, the individual situation of the customers, the situation of the economic group to which they belong, the real guarantees for debts and macroeconomic indicators and is considered on December 31, 2021, sufficient to cover possible losses on the amounts receivable, in addition to a prospective assessment that consider the change or expected change in economic factors that affect the expected credit losses, which will be determined based on weighted probabilities and measured at an amount equal to the expected credit loss for life.
The credit quality of accounts receivable falling due is considered adequate, and the amount of the effective risk of possible losses in accounts receivable from customers is presented as losses due to the non-recoverability of financial assets.
Our inventories are composed, substantially, of lubricants, base oil and materials for the construction of gas pipelines, which are products that are do not expire or have a long duration and, therefore, we do not observe indicators of obsolescence or impairment.
To date, there have been no changes in the scope of the Company's leases, including adding, terminating, extending and reducing the contractual term of the lease. Also, there was no change in the consideration for the leases that we are lessees and lessors.
2 Statement of compliance
These individual and consolidated financial statements have been prepared and are being presented in accordance with accounting practices adopted in Brazil, which include the Brazilian Corporate Law, the rules of the Brazilian Securities Commission (CVM) and the pronouncements of the Accounting Pronouncements Committee (CPC), as well as International Accounting Standards (IFRS) issued by the International Accounting Standards Board (IASB).
Notes to the financial statements
(In thousands of Brazilian Reais - R$, unless otherwise stated)
The presentation of the individual and consolidated Value Added Statements (“VAS”) is required by Brazilian Corporate Law and the accounting practices adopted in Brazil applicable to publicly traded companies CPC 09 - Statement of Value Added. IFRS does not require the presentation of this statement. As a result, under IFRS, this statement is presented as supplementary information, without prejudice to the set of financial statements.
The relevant information in the financial statements, and only them, are being disclosed and that correspond to those used by management in its management.
These financial statements were authorized for issuance by Board of Directors on February 18, 2022.
3 Accounting policies
Accounting policies are included in the notes, except those described below:
3.1 Functional and presentation currency
The individual and consolidated financial statements are presented in Brazilian Reais, which is the functional currency of the Company, its subsidiaries and the joint venture, located in Brazil, as it is the currency of the primary economic environment in which they operate, generate and consume resources. The main functional currencies of subsidiaries located outside Brazil are the US dollar, Euro or Pound Sterling. All balances have been rounded to the nearest thousand, unless otherwise indicated.
Monetary assets and liabilities denominated and calculated in foreign currencies on the balance sheet date are reconverted to the functional currency at the exchange rate on that date. Non-monetary assets and liabilities that are measured at fair value in a foreign currency are reconverted to the functional currency at the exchange rate on the date the fair value was determined. Non-monetary items that are measured at historical cost in a foreign currency are translated at the exchange rate on the transaction date. Foreign currency differences resulting from translation are generally recognized in profit or loss.
Notes to the financial statements
(In thousands of Brazilian Reais - R$, unless otherwise stated)
Assets and liabilities arising from foreign operations, including goodwill and fair value adjustments resulting from the acquisition, are translated into Brazilian Reais using the exchange rates at the balance sheet date. Revenues and expenses from foreign operations are translated into Brazilian Reais using exchange rates on the transaction dates.
Foreign currency differences are recognized and presented in other comprehensive income in shareholders' equity. However, if the foreign operation is a non-wholly owned subsidiary, then the relevant proportion of the translation difference is allocated to non-controlling interests. When a foreign operation is disposed of such control, loss or significant influence is lost, the accumulated amount in the translation reserve related to that foreign operation is reclassified to profit or loss as part of the gain or loss on disposal.
The following table sets forth the exchange rate, expressed in reais (R$) per US dollar (US$), pound sterling (£) and euro (€) for the years indicated, as reported by the Central Bank of Brazil (“BACEN”):
Currency | December 31, 2021 |
| December 31, 2020 |
United States Dollar (US$) | 5.58 |
| 5.20 |
Pound Sterling (£) | 7.92 |
| 7.10 |
Euro (€) | 6.55 |
| 6.38 |
3.2 Use of judgments and estimates
The preparation of the financial statements requires the Management to make judgments, estimates and assumptions that affect the application of accounting policies and the reported amounts of assets, liabilities, revenues and expenses. Actual results may differ from these estimates.
Notes to the financial statements
(In thousands of Brazilian Reais - R$, unless otherwise stated)
Underlying estimates and assumptions are continuously reviewed and prospectively recognized, when applicable. Information on critical judgments, assumptions and estimates of uncertainties in the application of accounting policies that have the most significant effect on the amounts recognized in the financial statements is included in the following notes:
- Note 5.3 – Trade receivables
- Note 5.8 – Leases
- Note 5.9 – Sector financial assets and liabilities
- Note 5.11 – Recognized fair value measurements
- Note 9 – Investments in joint venture
- Notes 10.1 e 10.2 – Property, plant and equipment, intangible assets and goodwill
- Note 10.5 – Investment properties
- Note 11 – Commitments
- Note 14 – Income tax
- Note 15 – Provision for legal proceedings
- Note 22 – Post-employment benefits
- Note 23 – Share-based payments
4 Segment information
The following segment information is used by Company’s senior management (the “Chief Operating Decision Maker”) to assess the performance of the operating segments and to make decisions regarding the allocation of resources. This information is prepared on a basis consistent with the accounting policies used in the preparation of the financial statements. The Company evaluates the performance of its operating segments based on the measure of Earnings Before Interest, Taxes, Depreciation and Amortization (“EBITDA”).
Notes to the financial statements
(In thousands of Brazilian Reais - R$, unless otherwise stated)
Reported segments:
- Raízen: fuel distribution and marketing, primarily through a franchised network of service stations under the Shell brand throughout Brazil, petroleum refining, fuel retailer operation, convenience store business, the manufacture and sale of automotive and industrial lubricants, and the production and sale of liquefied petroleum gas throughout Argentina; in addition to the production and marketing of a variety of products derived from sugarcane, including raw sugar (Very High Polarization, or “VHP”), anhydrous and hydrated ethanol, activities related to energy cogeneration from sugarcane bagasse, and sale of electricity, comprising the purchase and sale of electricity to other traders. In addition, this segment has interests in companies involved in research and development of new technologies;
- Gas and Energy: its main activities are: (i) distribution of piped natural gas in part of the State of São Paulo to customers in the industrial, residential, commercial, automotive and cogeneration sectors; and (ii) the sale of electricity, comprising the purchase and sale of electricity to other traders, to consumers who have a free choice of supplier and to other agents permitted by law, (iii) other investments in the development process and corporate activities, including, Rota 4 and Edge II - Empresa de Geração de Energia S.A.;
- Moove: production and distribution of lubricants under the Mobil brand in Brazil, Argentina, Bolivia, Uruguay, Paraguay, the United States of America and Europe, as well as in the European and Asian markets under the “Comma” trademark and corporate activities;
- Logistics: logistics services for rail transportation, storage and port loading of commodities, mainly for grains and sugar, leasing of locomotives, wagons and another railroad equipment. The results of the Logistics segment were consolidated as of March 1, 2021 as a result of the corporate reorganization, as detailed in Note 1.1;
Notes to the financial statements
(In thousands of Brazilian Reais - R$, unless otherwise stated)
- Cosan Investimentos: management of agricultural properties, mining and logistics projects and investment in the Climate Tech Fund, a fund managed by Fifth Wall, specializing in technological innovation.; and
Reconciliation:
- Cosan Corporate: digital wallet platform and other investments, in addition to the corporate activities of the Company. The Cosan corporate segment includes the financing subsidiaries for the Cosan group.
Although, Raízen S.A. is a joint venture recorded under the equity method and is not proportionally consolidated, senior management continues to review the information by segment. The reconciliation of these segments is presented in the column “Deconsolidation of jointly controlled company”.
With the corporate reorganization of Raízen S.A., as per note 1.2.8, the Company reassessed its operating segments and began to disclose Raízen as a single segment. Due to this Company reassessment the corresponding information from previous periods is being restated.
Notes to the financial statements
(In thousands of Brazilian Reais - R$, unless otherwise stated)
| December 31, 2021 | ||||||||||||||||
| Reported segments |
| Reconciliation |
| Consolidated | ||||||||||||
| Raízen |
| Gas and Energy |
| Moove |
| Logistics |
| Cosan Investments (ii) |
| Cosan Corporate |
| Deconsolidated effects |
| Segments eliminations |
| |
|
|
|
|
|
|
|
|
| |||||||||
Statement of profit or loss: |
|
|
|
|
|
|
|
|
|
|
|
|
|
|
|
|
|
Gross sales | 188,825,984 |
| 15,711,939 |
| 7,697,074 |
| 6,925,628 |
| 32,695 |
| 4,973 |
| (188,825,984) |
| (50,538) |
| 30,321,771 |
Domestic market (i) | 182,035,680 |
| 15,711,939 |
| 7,021,757 |
| 6,588,282 |
| 32,695 |
| 4,973 |
| (182,035,680) |
| (50,538) |
| 29,309,108 |
External market (i) | 6,790,304 |
| — |
| 675,317 |
| 337,346 |
| — |
| — |
| (6,790,304) |
| — |
| 1,012,663 |
Net sales | 175,047,270 |
| 12,330,209 |
| 6,112,457 |
| 6,479,031 |
| 31,502 |
| 4,489 |
| (175,047,270) |
| (50,538) |
| 24,907,150 |
Cost of sales | (163,367,574) |
| (9,200,224) |
| (4,808,643) |
| (4,605,187) |
| — |
| (4,533) |
| 163,367,574 |
| 50,538 |
| (18,568,049) |
Gross profit | 11,679,696 |
| 3,129,985 |
| 1,303,814 |
| 1,873,844 |
| 31,502 |
| (44) |
| (11,679,696) |
| — |
| 6,339,101 |
Selling expenses | (3,882,690) |
| (125,412) |
| (551,520) |
| (32,533) |
| — |
| (6,745) |
| 3,882,690 |
| — |
| (716,210) |
General and administrative expenses | (1,788,180) |
| (1,057,249) |
| (269,810) |
| (405,414) |
| (6,499) |
| (314,841) |
| 1,788,180 |
| — |
| (2,053,813) |
Other income (expenses), net | 717,792 |
| 25,569 |
| 23,414 |
| (64,189) |
| 21,017 |
| 381,629 |
| (717,792) |
| — |
| 387,440 |
Interest in earnings of associates | (43,534) |
| — |
| — |
| 11,791 |
| — |
| 2,006,200 |
| 43,534 |
| (1,888,832) |
| 129,159 |
Interest in earnings of joint venture | — |
| — |
| — |
| — |
| — |
| 4,590,631 |
| — |
| — |
| 4,590,631 |
Finance results, net | (1,967,124) |
| (289,616) |
| (63,797) |
| (1,330,736) |
| 3,199 |
| (1,095,334) |
| 1,967,124 |
| — |
| (2,776,284) |
Finance expense | (1,606,724) |
| (900,783) |
| (61,870) |
| (1,086,354) |
| (51) |
| (978,031) |
| 1,606,724 |
| — |
| (3,027,089) |
Finance income | 580,266 |
| 703,204 |
| 58,071 |
| 375,941 |
| 3,250 |
| 94,484 |
| (580,266) |
| — |
| 1,234,950 |
Foreign exchange, net | (1,076,722) |
| (60,953) |
| (66,118) |
| (11,761) |
| — |
| (469,822) |
| 1,076,722 |
| — |
| (608,654) |
Derivatives | 136,056 |
| (31,084) |
| 6,120 |
| (608,562) |
| — |
| 258,035 |
| (136,056) |
| — |
| (375,491) |
Income tax (expense)benefit | (1,350,252) |
| 59,360 |
| (147,138) |
| (13,765) |
| (4,215) |
| 556,510 |
| 1,350,252 |
| — |
| 450,752 |
Profit for the year | 3,365,708 |
| 1,742,637 |
| 294,963 |
| 38,998 |
| 45,004 |
| 6,118,006 |
| (3,365,708) |
| (1,888,832) |
| 6,350,776 |
Profit (loss) attributable to: |
|
|
|
|
|
|
|
|
|
|
|
|
|
|
|
|
|
Owners of the Company | 3,379,014 |
| 1,650,725 |
| 205,139 |
| 10,465 |
| 22,502 |
| 6,123,217 |
| (3,379,014) |
| (1,888,832) |
| 6,123,216 |
Non-controlling interests | (13,306) |
| 91,912 |
| 89,824 |
| 28,533 |
| 22,502 |
| (5,211) |
| 13,306 |
| — |
| 227,560 |
| 3,365,708 |
| 1,742,637 |
| 294,963 |
| 38,998 |
| 45,004 |
| 6,118,006 |
| (3,365,708) |
| (1,888,832) |
| 6,350,776 |
Other select data |
|
|
|
|
|
|
|
|
|
|
|
|
|
|
|
|
|
Depreciation and amortization | 6,393,642 |
| 559,994 |
| 96,852 |
| 1,548,289 |
| 39 |
| 16,362 |
| (6,393,642) |
| (2) |
| 2,221,534 |
EBITDA | 13,076,726 |
| 2,532,887 |
| 602,750 |
| 2,931,788 |
| 46,059 |
| 6,673,192 |
| (13,076,726) |
| (1,888,834) |
| 10,897,842 |
Additions to PP&E, intangible and contract assets | 5,282,100 |
| 1,269,886 |
| 42,536 |
| 2,746,692 |
| 278 |
| 8,201 |
| (5,282,100) |
| — |
| 4,067,593 |
|
|
|
|
|
|
|
|
|
|
|
|
|
|
|
|
|
|
Reconciliation of EBITDA |
|
|
|
|
|
|
|
|
|
|
|
|
|
|
|
|
|
Profit for the year | 3,365,708 |
| 1,742,637 |
| 294,963 |
| 38,998 |
| 45,004 |
| 6,118,006 |
| (3,365,708) |
| (1,888,832) |
| 6,350,776 |
Income tax and (expense) benefit | 1,350,252 |
| (59,360) |
| 147,138 |
| 13,765 |
| 4,215 |
| (556,510) |
| (1,350,252) |
| — |
| (450,752) |
Finance results, net | 1,967,124 |
| 289,616 |
| 63,797 |
| 1,330,736 |
| (3,199) |
| 1,095,334 |
| (1,967,124) |
| — |
| 2,776,284 |
Depreciation and amortization | 6,393,642 |
| 559,994 |
| 96,852 |
| 1,548,289 |
| 39 |
| 16,362 |
| (6,393,642) |
| (2) |
| 2,221,534 |
EBITDA | 13,076,726 |
| 2,532,887 |
| 602,750 |
| 2,931,788 |
| 46,059 |
| 6,673,192 |
| (13,076,726) |
| (1,888,834) |
| 10,897,842 |
(i) Domestic markets: sales within the countries where each entity is located; external markets: sales export.
(ii) The results of the Cosan Investimentos segment were consolidated as of November 1, 2021, as detailed in Note 8.2.
Notes to the financial statements
(In thousands of Brazilian Reais - R$, unless otherwise stated)
| December 31, 2020 (restated) | ||||||||||||
| Reported segments |
| Reconciliation |
| Consolidated | ||||||||
| Raízen |
| Gas and Energy |
| Moove |
| Cosan Corporate |
| Deconsolidated effects |
| Segments eliminations |
| |
|
|
|
|
|
|
| |||||||
Statement of profit or loss: |
|
|
|
|
|
|
|
|
|
|
|
|
|
Gross sales | 127,832,718 |
| 12,024,615 |
| 5,588,754 |
| 49 |
| (127,832,718) |
| — |
| 17,613,418 |
Domestic market (i) | 117,788,563 |
| 12,024,615 |
| 3,851,554 |
| 49 |
| (117,788,563) |
| — |
| 15,876,218 |
External market (i) | 10,044,155 |
| — |
| 1,737,200 |
| — |
| (10,044,155) |
| — |
| 1,737,200 |
Net sales | 118,049,722 |
| 9,093,170 |
| 4,415,575 |
| 42 |
| (118,049,722) |
| — |
| 13,508,787 |
Cost of sales | (110,800,498) |
| (6,434,189) |
| (3,380,304) |
| (1,585) |
| 110,800,498 |
| — |
| (9,816,078) |
Gross profit | 7,249,224 |
| 2,658,981 |
| 1,035,271 |
| (1,543) |
| (7,249,224) |
| — |
| 3,692,709 |
Selling expenses | (3,264,756) |
| (454,131) |
| (471,829) |
| (1,386) |
| 3,264,756 |
| — |
| (927,346) |
General and administrative expenses | (1,263,733) |
| (577,475) |
| (229,672) |
| (199,478) |
| 1,263,733 |
| — |
| (1,006,625) |
Other income (expenses), net | 554,126 |
| 56,176 |
| 34,876 |
| (19,278) |
| (554,126) |
| — |
| 71,774 |
Interest in earnings of associates | (88,323) |
| — |
| — |
| 1,043,984 |
| 88,323 |
| (1,028,270) |
| 15,714 |
Interest in earnings of joint venture | (87,567) |
| — |
| — |
| 583,001 |
| 87,567 |
| — |
| 583,001 |
Finance results, net | (1,431,267) |
| (282,772) |
| (129,342) |
| (850,448) |
| 1,431,267 |
| — |
| (1,262,562) |
Finance expense | (2,345,771) |
| (374,252) |
| (30,910) |
| (1,274,590) |
| 2,345,771 |
| — |
| (1,679,752) |
Finance income | 690,678 |
| 72,500 |
| 20,086 |
| 135,339 |
| (690,678) |
| — |
| 227,925 |
Foreign exchange, net | (3,821,462) |
| (150,227) |
| (161,636) |
| (1,300,662) |
| 3,821,462 |
| — |
| (1,612,525) |
Derivatives | 4,045,288 |
| 169,207 |
| 43,118 |
| 1,589,465 |
| (4,045,288) |
| — |
| 1,801,790 |
Income tax (expense)benefit | (537,004) |
| (460,312) |
| (87,941) |
| 290,402 |
| 537,004 |
| — |
| (257,851) |
Profit for the year | 1,130,700 |
| 940,467 |
| 151,363 |
| 845,254 |
| (1,130,700) |
| (1,028,270) |
| 908,814 |
Profit (loss) attributable to: |
|
|
|
|
|
|
|
|
|
|
|
|
|
Owners of the Company | 1,081,176 |
| 923,421 |
| 104,570 |
| 851,855 |
| (1,081,176) |
| (1,027,988) |
| 851,858 |
Non-controlling interests | 49,524 |
| 17,046 |
| 46,793 |
| (6,601) |
| (49,524) |
| (282) |
| 56,956 |
| 1,130,700 |
| 940,467 |
| 151,363 |
| 845,254 |
| (1,130,700) |
| (1,028,270) |
| 908,814 |
Other select data |
|
|
|
|
|
|
|
|
|
|
|
|
|
Depreciation and amortization | 5,059,239 |
| 500,714 |
| 108,687 |
| 13,683 |
| (5,059,239) |
| — |
| 623,084 |
EBITDA | 8,158,210 |
| 2,184,265 |
| 477,333 |
| 1,418,983 |
| (8,158,210) |
| (1,028,270) |
| 3,052,311 |
Additions to PP&E, intangible and contract assets | 3,159,415 |
| 1,006,881 |
| 29,658 |
| 15,963 |
| (3,159,415) |
| — |
| 1,052,502 |
|
|
|
|
|
|
|
|
|
|
|
|
|
|
Reconciliation of EBITDA |
|
|
|
|
|
|
|
|
|
|
|
|
|
Profit for the year | 1,130,700 |
| 940,467 |
| 151,363 |
| 845,254 |
| (1,130,700) |
| (1,028,270) |
| 908,814 |
Income tax and (expense) benefit | 537,004 |
| 460,312 |
| 87,941 |
| (290,402) |
| (537,004) |
| — |
| 257,851 |
Finance results, net | 1,431,267 |
| 282,772 |
| 129,342 |
| 850,448 |
| (1,431,267) |
| — |
| 1,262,562 |
Depreciation and amortization | 5,059,239 |
| 500,714 |
| 108,687 |
| 13,683 |
| (5,059,239) |
| — |
| 623,084 |
EBITDA | 8,158,210 |
| 2,184,265 |
| 477,333 |
| 1,418,983 |
| (8,158,210) |
| (1,028,270) |
| 3,052,311 |
(i) Domestic markets: sales within the countries where each entity is located; external markets: sales export.
Notes to the financial statements
(In thousands of Brazilian Reais - R$, unless otherwise stated)
| December 31, 2021 | ||||||||||||||||
| Reported segments |
| Reconciliation | Consolidated | |||||||||||||
| Raízen |
| Gas and Energy |
| Moove |
| Logistics |
| Cosan Investments |
| Cosan Corporate |
| Deconsolidated effects |
| Segments eliminations |
| |
|
|
|
|
|
|
|
|
| |||||||||
Statement of financial position: |
|
|
|
|
|
|
|
|
|
|
|
|
|
|
|
|
|
Cash and cash equivalents | 5,034,788 |
| 3,562,358 |
| 1,059,866 |
| 9,448,193 |
| 7,468 |
| 2,096,245 |
| (5,034,788) |
| — |
| 16,174,130 |
Marketable securities | 154,052 |
| 1,876,006 |
| 129,390 |
| 1,425,897 |
| 46,094 |
| 910,620 |
| (154,052) |
| — |
| 4,388,007 |
Trade receivables | 7,618,176 |
| 1,427,720 |
| 605,928 |
| 503,316 |
| 207,761 |
| 1,128 |
| (7,618,176) |
| — |
| 2,745,853 |
Derivative financial instruments | 11,805,548 |
| 358,456 |
| 26,513 |
| 1,674,821 |
| — |
| 2,673,136 |
| (11,805,548) |
| — |
| 4,732,926 |
Inventories | 14,297,068 |
| 129,554 |
| 790,825 |
| 228,923 |
| — |
| 2 |
| (14,297,068) |
| — |
| 1,149,304 |
Sectorial financial assets | — |
| 558,310 |
| — |
| — |
| — |
| — |
| — |
| — |
| 558,310 |
Other financial assets | 261,412 |
| — |
| 466 |
| — |
| 319,728 |
| (1) |
| (261,412) |
| — |
| 320,193 |
Other current assets | 12,545,650 |
| 340,909 |
| 298,004 |
| 747,308 |
| 13,470 |
| 1,599,793 |
| (12,545,650) |
| (668,152) |
| 2,331,332 |
Other non-current assets | 8,562,180 |
| 1,370,964 |
| 246,934 |
| 3,197,105 |
| 354 |
| 2,180,558 |
| (8,562,180) |
| (240,675) |
| 6,755,240 |
Investments in associates | — |
| — |
| — |
| 57,844 |
| — |
| 14,518,340 |
| — |
| (13,796,117) |
| 780,067 |
Investments in joint venture | 1,317,720 |
| — |
| — |
| — |
| — |
| 10,936,663 |
| (1,317,720) |
| — |
| 10,936,663 |
Biological assets | 3,106,744 |
| — |
| — |
| — |
| — |
| — |
| (3,106,744) |
| — |
| — |
Investment properties | — |
| — |
| — |
| — |
| 3,886,696 |
| — |
| — |
| — |
| 3,886,696 |
Derivative financial instruments | 2,941,390 |
| 684,970 |
| 21,011 |
| 1 |
| — |
| — |
| (2,941,390) |
| — |
| 705,982 |
Right-of-use assets | 10,758,442 |
| 73,220 |
| 51,458 |
| 7,784,941 |
| 3,203 |
| 34,445 |
| (10,758,442) |
| — |
| 7,947,267 |
Property, plant and equipment | 22,506,160 |
| 271,490 |
| 334,065 |
| 15,974,562 |
| 31 |
| 68,405 |
| (22,506,160) |
| — |
| 16,648,553 |
Intangible assets and goodwill | 9,226,852 |
| 9,328,654 |
| 1,285,884 |
| 7,131,645 |
| — |
| 35,315 |
| (9,226,852) |
| — |
| 17,781,498 |
Loans, borrowings and debentures | (26,967,092) |
| (7,667,987) |
| (831,148) |
| (21,178,748) |
| — |
| (15,981,153) |
| 26,967,092 |
| — |
| (45,659,036) |
Derivative financial instruments | (12,377,276) |
| (357,932) |
| — |
| (576,749) |
| — |
| (141,480) |
| 12,377,276 |
| — |
| (1,076,161) |
Trade payables | (15,678,442) |
| (1,798,977) |
| (828,690) |
| (618,658) |
| (1,006) |
| (6,173) |
| 15,678,442 |
| — |
| (3,253,504) |
Employee benefits payable | (788,948) |
| (104,404) |
| (132,158) |
| (255,963) |
| — |
| (60,466) |
| 788,948 |
| — |
| (552,991) |
Sectorial financial liabilities | — |
| (1,372,283) |
| — |
| — |
| — |
| — |
| — |
| — |
| (1,372,283) |
Other current liabilities | (9,591,918) |
| (472,592) |
| (349,967) |
| (1,384,611) |
| (48,739) |
| (1,384,091) |
| 9,591,918 |
| 148,171 |
| (3,491,829) |
Leases | (10,685,524) |
| (63,752) |
| (53,436) |
| (3,106,883) |
| (3,253) |
| (40,358) |
| 10,685,524 |
| — |
| (3,267,682) |
Other non-current liabilities | (8,647,572) |
| (1,771,568) |
| (368,788) |
| (6,034,881) |
| (193,601) |
| (2,691,341) |
| 8,647,572 |
| 761,666 |
| (10,298,513) |
Total assets (net of liabilities) allocated by segment | 25,399,410 |
| 6,373,116 |
| 2,286,157 |
| 15,018,063 |
| 4,238,206 |
| 14,749,587 |
| (25,399,410) |
| (13,795,107) |
| 28,870,022 |
Total assets | 110,136,182 |
| 19,982,611 |
| 4,850,344 |
| 48,174,556 |
| 4,484,805 |
| 35,054,649 |
| (110,136,182) |
| (14,704,944) |
| 97,842,021 |
|
|
|
|
|
|
|
|
|
|
|
|
|
|
|
|
|
|
Shareholders' equity attributable to: |
|
|
|
|
|
|
|
|
|
|
|
|
|
|
|
|
|
Equity attributable to owners of the Company | 23,870,251 |
| 5,585,768 |
| 1,599,949 |
| 4,479,944 |
| 2,119,104 |
| 14,751,279 |
| (23,870,251) |
| (13,795,107) |
| 14,740,937 |
Non-controlling interests | 1,529,159 |
| 787,348 |
| 686,208 |
| 10,538,119 |
| 2,119,102 |
| (1,692) |
| (1,529,159) |
| — |
| 14,129,085 |
Total shareholders' equity | 25,399,410 |
| 6,373,116 |
| 2,286,157 |
| 15,018,063 |
| 4,238,206 |
| 14,749,587 |
| (25,399,410) |
| (13,795,107) |
| 28,870,022 |
Notes to the financial statements
(In thousands of Brazilian Reais - R$, unless otherwise stated)
| December 31, 2020 (restated) | ||||||||||||
| Reported segments |
| Reconciliation | Consolidated | |||||||||
| Raízen |
| Gas and Energy |
| Moove |
| Cosan Corporate |
| Deconsolidated effects |
| Segments eliminations |
| |
|
|
|
|
|
|
| |||||||
Statement of financial position: |
|
|
|
|
|
|
|
|
|
|
|
|
|
Cash and cash equivalents | 3,422,828 |
| 1,899,533 |
| 936,345 |
| 1,778,175 |
| (3,422,828) |
| — |
| 4,614,053 |
Marketable securities | 19,086 |
| 1,188,625 |
| 168,066 |
| 914,879 |
| (19,086) |
| — |
| 2,271,570 |
Trade receivables | 4,265,294 |
| 1,121,612 |
| 483,227 |
| — |
| (4,265,294) |
| — |
| 1,604,839 |
Derivative financial instruments | 6,064,604 |
| 517,181 |
| 28,463 |
| 2,581,774 |
| (6,064,604) |
| — |
| 3,127,418 |
Inventories | 8,317,566 |
| 121,064 |
| 564,836 |
| — |
| (8,317,566) |
| — |
| 685,900 |
Sectorial financial assets | — |
| 241,749 |
| — |
| — |
| — |
| — |
| 241,749 |
Other financial assets | 160,600 |
| — |
| 69,126 |
| 779,695 |
| (160,600) |
| — |
| 848,821 |
Other current assets | 5,761,106 |
| 276,139 |
| 146,166 |
| 1,211,108 |
| (5,761,106) |
| (601,024) |
| 1,032,389 |
Other non-current assets | 5,225,978 |
| 169,905 |
| 398,796 |
| 1,566,400 |
| (5,225,978) |
| (365,383) |
| 1,769,718 |
Investments in associates | — |
| — |
| — |
| 4,989,472 |
| — |
| (4,655,767) |
| 333,705 |
Investments in joint venture | 1,305,790 |
| — |
| — |
| 7,988,208 |
| (1,305,790) |
| — |
| 7,988,208 |
Biological assets | 1,073,582 |
| — |
| — |
| — |
| (1,073,582) |
| — |
| — |
Derivative financial instruments | 2,860,658 |
| 686,690 |
| 9,248 |
| — |
| (2,860,658) |
| — |
| 695,938 |
Right-of-use assets | 5,210,366 |
| 19,865 |
| 39,550 |
| 24,809 |
| (5,210,366) |
| — |
| 84,224 |
Property, plant and equipment | 18,165,518 |
| 15,326 |
| 327,535 |
| 74,135 |
| (18,165,518) |
| — |
| 416,996 |
Intangible assets and goodwill | 6,089,034 |
| 8,769,986 |
| 1,268,095 |
| 7,215 |
| (6,089,034) |
| — |
| 10,045,296 |
Loans, borrowings and debentures | (24,557,518) |
| (7,043,909) |
| (802,938) |
| (7,580,380) |
| 24,557,518 |
| — |
| (15,427,227) |
Derivative financial instruments | (3,088,300) |
| (286,018) |
| (348) |
| (131,461) |
| 3,088,300 |
| — |
| (417,827) |
Trade payables | (9,311,282) |
| (1,182,111) |
| (688,139) |
| (4,942) |
| 9,311,282 |
| — |
| (1,875,192) |
Employee benefits payable | (534,376) |
| (74,543) |
| (96,192) |
| (25,146) |
| 534,376 |
| — |
| (195,881) |
Sectorial financial liabilities | — |
| (565,911) |
| — |
| — |
| — |
| — |
| (565,911) |
Other current liabilities | (4,094,274) |
| (662,779) |
| (290,827) |
| (673,340) |
| 4,094,274 |
| 40,998 |
| (1,585,948) |
Preferred shareholders payable in subsidiaries | — |
| — |
| — |
| (387,044) |
| — |
| — |
| (387,044) |
Leases | (4,734,766) |
| (10,320) |
| (41,299) |
| (28,144) |
| 4,734,766 |
| — |
| (79,763) |
Other non-current liabilities | (5,208,482) |
| (1,856,161) |
| (554,141) |
| (2,235,324) |
| 5,208,482 |
| 925,409 |
| (3,720,217) |
Total assets (net of liabilities) allocated by segment | 16,413,012 |
| 3,345,923 |
| 1,965,569 |
| 10,850,089 |
| (16,413,012) |
| (4,655,767) |
| 11,505,814 |
Total assets | 67,942,010 |
| 15,027,675 |
| 4,439,453 |
| 21,915,870 |
| (67,942,010) |
| (5,622,174) |
| 35,760,824 |
|
|
|
|
|
|
|
|
|
|
|
|
|
|
Shareholders' equity attributable to: |
|
|
|
|
|
|
|
|
|
|
|
|
|
Equity attributable to owners of the Company | 16,129,497 |
| 3,288,315 |
| 1,367,157 |
| 10,847,666 |
| (16,129,497) |
| (4,655,473) |
| 10,847,665 |
Non-controlling interests | 283,515 |
| 57,608 |
| 598,412 |
| 2,423 |
| (283,515) |
| (294) |
| 658,149 |
Total shareholders' equity | 16,413,012 |
| 3,345,923 |
| 1,965,569 |
| 10,850,089 |
| (16,413,012) |
| (4,655,767) |
| 11,505,814 |
Notes to the financial statements
(In thousands of Brazilian Reais - R$, unless otherwise stated)
4.1 Net revenue by segment
| December 31, 2021 |
| December 31, 2020 (restated) |
Reported segment |
|
|
|
|
|
|
|
Raízen |
|
|
|
Ethanol | 27,464,271 |
| 19,625,060 |
Sugar | 13,946,480 |
| 10,241,141 |
Gas | 55,158,035 |
| 36,127,017 |
Diesel | 71,828,092 |
| 46,967,219 |
Cogeneration | 3,968,947 |
| 2,282,158 |
Other | 7,288,547 |
| 2,807,127 |
Intercompany elimination (i) | (4,607,102) |
| — |
| 175,047,270 |
| 118,049,722 |
Gas and Energy |
|
|
|
Natural gas distribution |
|
|
|
Industrial | 7,386,258 |
| 5,030,738 |
Residential | 1,610,286 |
| 1,381,597 |
Cogeneration | 637,489 |
| 389,732 |
Automotive | 364,664 |
| 220,130 |
Commercial | 448,615 |
| 350,760 |
Construction revenue | 1,020,176 |
| 885,630 |
Other | 242,226 |
| 59,104 |
| 11,709,714 |
| 8,317,691 |
|
|
|
|
Electricity trading | 620,495 |
| 775,479 |
|
|
|
|
Moove |
|
|
|
Finished goods | 5,088,102 |
| 3,891,551 |
Base oil | 457,991 |
| 392,153 |
Services | 566,364 |
| 131,871 |
| 6,112,457 |
| 4,415,575 |
Logistics |
|
|
|
North operations | 4,518,982 |
| — |
South operations | 1,624,084 |
| — |
Container operations | 335,965 |
| — |
| 6,479,031 |
| — |
Cosan Investments |
|
|
|
Land lease | 31,502 |
| — |
| 31,502 |
| — |
Reconciliation |
|
|
|
Cosan Corporate | 4,489 |
| 42 |
Deconsolidated effects and eliminations | (175,097,808) |
| (118,049,722) |
Total | 24,907,150 |
| 13,508,787 |
Notes to the financial statements
(In thousands of Brazilian Reais - R$, unless otherwise stated)
| (i) | On June 1st, 2021, as detailed in the corporate reorganization Note (1.2.8), Raízen S.A. started to consolidate Raízen Energia and, therefore, the balances between the entities are presented net. |
4.2 Information on geographical area
| Net sales |
| Other non-current assets | ||||
| December 31, 2021 |
| December 31, 2020 |
| December 31, 2021 |
| December 31, 2020 |
|
|
|
|
|
|
|
|
Brazil | 21,571,783 |
| 11,170,964 |
| 12,551,261 |
| 5,321,148 |
Europe (i) | 2,551,739 |
| 1,867,284 |
| 10,515 |
| 11,401 |
Latin America (ii) | 632,235 |
| 360,798 |
| 6,320 |
| 24,684 |
North America | 81,384 |
| 62,760 |
| — |
| — |
Asia and other | 70,009 |
| 46,981 |
| — |
| — |
Total | 24,907,150 |
| 13,508,787 |
| 12,568,096 |
| 5,357,233 |
Main countries:
i. England, France, Spain and Portugal; and
ii. Argentina, Bolivia, Uruguay and Paraguay.
4.3 Major Customers
Most of the cargo that Rumo S.A. transports is for the agricultural commodity industry, mainly corn, sugar, soy and their derivatives. Rumo's main clients are the exporting companies that participate in this market. As of December 31, 2021, net revenue from Rumo's five largest customers represented R$2,486,527, or 37.78% of Rumo’s total net operating revenue.
5 Financial assets and liabilities
Accounting policy The Company initially measures a financial asset at its fair value plus, in the case of a financial asset not measured at fair value through profit or loss, transaction costs, except those measured at amortized cost maintained within a business model with the objective to obtain contractual cash flows that meet the criteria of principal and interest only. Debt financial instruments are subsequently measured at fair value through profit or loss, amortized cost or fair value through other comprehensive income.
The classification is based on two criteria: (i) the Company’s business model for managing assets; and (ii) whether the contractual cash flows of the instruments represent only payments of principal and interest on the principal amount outstanding.
The Company recognizes its financial assets at amortized cost for financial assets that are maintained within a business model in order to obtain contractual cash flows that meet the “Principal and Interest” criteria. This category includes trade receivables, cash and cash equivalents, receivables from related parties, other financial assets and dividends and interest on capital receivable.
Purchases or sales of financial assets that require the delivery of assets within a period established by regulation or convention in the market (regular trading) are recognized on the trade date, that is, the date on which the Company commits to buy or sell the asset. No remeasurement of financial assets was carried out. |
Notes to the financial statements
(In thousands of Brazilian Reais - R$, unless otherwise stated)
Financial assets are derecognized when the rights to receive cash flows from the financial assets have expired or have been transferred and the Company has transferred substantially all the risks and rewards of ownership. Financial liabilities are classified as measured at amortized cost or at fair value through profit or loss. A financial liability is classified as at fair value through profit or loss if it is classified as held-for-sale, it is a derivative or it is designated as such on initial recognition. Financial liabilities at fair value through profit or loss are measured at fair value and net gains and losses, including any interest expense, are recognized in profit or loss. Other financial liabilities are subsequently measured at amortized cost using the effective interest method. Interest expense and foreign exchange gains and losses are recognized in profit or loss. The Company derecognizes a financial liability when its contractual obligations are discharged or cancelled or expire. The Company also derecognizes a financial liability when its terms are modified, and the cash flows of the modified liability are substantially different, in which case a new financial liability based on the modified terms is recognized at fair value. Any gain or loss on derecognition is also recognized in profit or loss. |
Financial assets and liabilities are as following:
|
|
| Parent Company |
| Consolidated | ||||
| Note |
| December 31, 2021 |
| December 31, 2020 |
| December 31, 2021 |
| December 31, 2020 |
Assets |
|
|
|
|
|
|
|
|
|
Fair value through profit or loss |
|
|
|
|
|
|
|
|
|
Cash and cash equivalents | 5.1 |
| 683,036 |
| 1,148,860 |
| 8,103,713 |
| 2,154,257 |
Marketable securities | 5.2 |
| 893,087 |
| 788,965 |
| 4,388,007 |
| 2,271,570 |
Other financial assets | 5.4 |
| — |
| 779,695 |
| 320,193 |
| 848,821 |
Derivate financial instruments | 5.10 |
| 2,562,856 |
| 2,457,604 |
| 4,732,926 |
| 3,127,418 |
|
|
| 4,138,979 |
| 5,175,124 |
| 17,544,839 |
| 8,402,066 |
Amortized cost |
|
|
|
|
|
|
|
|
|
Cash and cash equivalents | 5.1 |
| 1,035,041 |
| 407 |
| 8,070,417 |
| 2,459,796 |
Trade receivables | 5.3 |
| — |
| — |
| 2,745,853 |
| 1,604,839 |
Restricted cash | 5.2 |
| 31,181 |
| — |
| 58,990 |
| — |
Receivables from related parties | 5.5 |
| 529,364 |
| 760,342 |
| 416,491 |
| 271,766 |
Sector financial assets | 5.9 |
| — |
| — |
| 558,310 |
| 241,749 |
Dividends receivable | 16 |
| 540,091 |
| 160,694 |
| 519,965 |
| 77,561 |
|
|
| 2,135,677 |
| 921,443 |
| 12,370,026 |
| 4,655,711 |
Total |
|
| 6,274,656 |
| 6,096,567 |
| 29,914,865 |
| 13,057,777 |
Liabilities |
|
|
|
|
|
|
|
|
|
Amortized cost |
|
|
|
|
|
|
|
|
|
Loans, borrowings and debentures | 5.6 |
| (8,164,256) |
| — |
| (25,444,437) |
| (8,590,199) |
Trade payables | 5.7 |
| (4,506) |
| (4,066) |
| (3,253,504) |
| (1,875,192) |
Consideration payable |
|
| — |
| — |
| (234,960) |
| (224,787) |
Other financial liabilities (i) |
|
| — |
| — |
| (726,423) |
| (149,293) |
Leases | 5.8 |
| (40,047) |
| (28,145) |
| (3,267,678) |
| (79,763) |
Railroad concession payable | 12 |
| — |
| — |
| (3,054,248) |
| — |
Payables to related parties | 5.5 |
| (7,700,429) |
| (7,374,879) |
| (287,609) |
| (150,484) |
Preferred shareholders payable in subsidiaries |
|
| — |
| (387,044) |
| — |
| (387,044) |
Dividends payable | 16 |
| (754,282) |
| (216,929) |
| (799,634) |
| (285,177) |
Sector financial liabilities | 5.9 |
| — |
| — |
| (1,372,283) |
| (565,911) |
Tax installments - REFIS | 13 |
| (194,228) |
| (193,353) |
| (200,664) |
| (199,586) |
|
|
| (16,857,748) |
| (8,204,416) |
| (38,641,440) |
| (12,507,436) |
Fair value through profit or loss |
|
|
|
|
|
|
|
|
|
Loans, borrowings and debentures | 5.6 |
| — |
| — |
| (20,214,600) |
| (6,837,028) |
Derivative financial instruments | 5.10 |
| (141,480) |
| (131,462) |
| (1,076,161) |
| (417,827) |
|
|
| (141,480) |
| (131,462) |
| (21,290,761) |
| (7,254,855) |
Total |
|
| (16,999,228) |
| (8,335,878) |
| (59,932,201) |
| (19,762,291) |
Notes to the financial statements
(In thousands of Brazilian Reais - R$, unless otherwise stated)
| (i) | The balance substantially presented comes from the subsidiary Rumo, and refers to amounts that were advanced by its suppliers with financial institutions. As of December 31, the balance was R$576,786 (R$413,470 as of December 31, 2020). These operations had Banco Itaú and Banco Bradesco as counterparties, at an average rate of 10.60% p.a. (3.00% p.a. on December 31, 2020). The average payment term of these operations, is around 90 days. |
5.1 Cash and cash equivalents
Accounting policy Cash and cash equivalents comprise cash balances, call deposits and highly liquid short-term investments with maturities of three months or less from the acquisition date that are subject to an insignificant risk of change in their fair value. |
| Parent Company |
| Consolidated | ||||
| December 31, 2021 |
| December 31, 2020 |
| December 31, 2021 |
| December 31, 2020 |
Cash and bank accounts | 258 |
| 255 |
| 98,116 |
| 75,160 |
Savings account | 525,249 |
| — |
| 2,594,723 |
| 986,379 |
Financial investments | 1,192,570 |
| 1,149,012 |
| 13,481,291 |
| 3,552,514 |
| 1,718,077 |
| 1,149,267 |
| 16,174,130 |
| 4,614,053 |
Financial investments include the following:
|
| Parent company |
| Consolidated | ||||
|
| December 31, 2021 |
| December 31, 2020 |
| December 31, 2021 |
| December 31, 2020 |
Investment fund |
|
|
|
|
|
|
|
|
Repurchase agreements |
| 683,036 |
| 856,078 |
| 1,680,328 |
| 1,671,802 |
Bank deposits certificates |
| — |
| 292,782 |
| 6,423,385 |
| 474,910 |
Other |
| — |
| — |
| — |
| 7,545 |
|
| 683,036 |
| 1,148,860 |
| 8,103,713 |
| 2,154,257 |
Bank investments |
|
|
|
|
|
|
|
|
Repurchase agreements |
| — |
| — |
| 974,494 |
| 1,293,833 |
Bank deposits certificates |
| 509,376 |
| — |
| 2,321,614 |
| 104,272 |
Other (i) |
| 158 |
| 152 |
| 2,081,470 |
| 152 |
|
| 509,534 |
| 152 |
| 5,377,578 |
| 1,398,257 |
|
| 1,192,570 |
| 1,149,012 |
| 13,481,291 |
| 3,552,514 |
| (i) | It substantially refers to investments in time deposits at Bradesco Cayman and Banco do Brasil London for the amounts of Rumo Luxemburgo, for the raising of Senior Notes (Bond) maturing in 2032, with weighted remuneration of 49 bps (0.47% per annum) on December 31, 2021.Itaú and Banco Bradesco as counterparties, at an average rate of 10.60% p.a. (3.00% p.a. on December 31, 2020). The average payment term of these operations, is around 90 days. |
Notes to the financial statements
(In thousands of Brazilian Reais - R$, unless otherwise stated)
The onshore financial investments are remunerated at rates around 100% of the interbank deposit certificate (Certificados de Depósitos Interbancários, or “CDI”) on December 31, 2021 (97% of CDI in December 31,2020) and offshore financial investments are remunerated at rates around 100% of Fed funds. See note 5.12 for more details regarding the sensitivity analysis on interest rate.
5.2 Marketable securities and restricted cash
Accounting policy Marketable securities are measured and classified at fair value through profit or loss. The securities include all equity securities with a readily determinable fair value. Fair values for equity securities are deemed readily determinable if the securities are listed or if a current market value or fair value is available even without a direct listing (e.g. prices for shares in investment funds).
Restricted cash are measured and classified at amortized cost, both with the average maturity of government bonds between two and five years, however they can be promptly redeemed and are subject to an insignificant risk of change in value. |
| Parent company |
| Consolidated | ||||
| December 31, 2021 |
| December 31, 2020 |
| December 31, 2021 |
| December 31, 2020 |
Marketable securities |
|
|
|
|
|
|
|
Government security (i) | 893,087 |
| 788,965 |
| 4,371,645 |
| 2,271,570 |
Bank deposits certificates | — |
| — |
| 1,051 |
| — |
ESG Funds (ii) | — |
| — |
| 15,311 |
| — |
| 893,087 |
| 788,965 |
| 4,388,007 |
| 2,271,570 |
|
|
|
|
|
|
|
|
Current | 893,087 |
| 788,965 |
| 4,372,696 |
| 2,271,570 |
Non-current | — |
| — |
| 15,311 |
| — |
Total | 893,087 |
| 788,965 |
| 4,388,007 |
| 2,271,570 |
|
|
|
|
|
|
|
|
Restricted cash |
|
|
|
|
|
|
|
Securities pledged as collateral | 31,181 |
| — |
| 58,990 |
| — |
| 31,181 |
| — |
| 58,990 |
| — |
(In thousands of Brazilian Reais - R$, unless otherwise stated)
| (i) | Government securities have stated interest connected to Special System for Settlement and Custody (Sistema Especial de Liquidação e de Custódia), or “SELIC”, with a return of approximately 100% of the CDI. | |
| (ii) | On October 6, 2021, the Company invested in the Fifth Wall Climate Tech Fund, from the United States, as an investor and partner in a business that also gives preferential access to investments in startups developing carbon solutions. The investment is measured at fair value through profit or loss maturing in 5 years. |
5.3 Trade receivables
Accounting policy Trade receivables are recognized initially at the amount of consideration that is unconditional unless they contain significant financing components, when they are recognized at fair value. The Company holds the trade receivables with the objective to collect the contractual cash flows and therefore measures them subsequently at amortized cost using the effective interest method.
To measure the expected credit losses, trade receivables have been grouped based on credit risk characteristics and days overdue. A loss allowance for expected credit losses is recognized in selling expense.
Expected loss rates are based on corresponding historical credit losses suffered in the period. Historical loss rates may be adjusted to reflect current and forward-looking information regarding macroeconomic factors that affect the customers’ ability to settle the receivables. The Company identified the interest rate implied in the agreement as the most relevant factor, and consequently adjusts historical loss rates based on the expected changes in this factor. |
1
|
| Consolidated | ||
|
| December 31, 2021 |
| December 31, 2020 |
Domestic - Brazilian reais |
| 1,810,867 |
| 1,049,890 |
Unbilled receivables (i) |
| 975,588 |
| 667,793 |
Export – foreign currency |
| 74,450 |
| 17,502 |
|
| 2,860,905 |
| 1,735,185 |
|
|
|
|
|
Expected credit losses |
| (115,052) |
| (130,346) |
|
| 2,745,853 |
| 1,604,839 |
|
|
|
|
|
Current |
| 2,580,776 |
| 1,585,708 |
Non-current |
| 165,077 |
| 19,131 |
|
| 2,745,853 |
| 1,604,839 |
| (i) | Unbilled revenue refers to the part of the gas supply in the month, whose measurement and billing has not yet been carried out. |
Notes to the financial statements
(In thousands of Brazilian Reais - R$, unless otherwise stated)
The aging of trade receivables is as follows:
|
| Consolidated | ||
|
| December 31, 2021 |
| December 31, 2020 |
Not overdue |
| 2,484,633 |
| 1,531,532 |
Overdue: |
|
|
|
|
From 1 to 30 days |
| 206,244 |
| 55,303 |
From 31 to 60 days |
| 21,130 |
| 13,893 |
From 61 to 90 days |
| 22,351 |
| 5,250 |
More than 90 days |
| 126,547 |
| 129,207 |
Expected credit losses |
| (115,052) |
| (130,346) |
|
| 2,745,853 |
| 1,604,839 |
Changes in the expected credit losses are as follows:
| Consolidated |
At January 1, 2020 | (114,921) |
Provision / reversal | (31,910) |
Write-off | 16,485 |
At December 31, 2020 | (130,346) |
Corporate reorganization (Note 1.1) | (5,446) |
Provision / reversal | (10,994) |
Reversal | (340) |
Write-off | 32,074 |
At December 31, 2021 | (115,052) |
(In thousands of Brazilian Reais - R$, unless otherwise stated)
5.4 Other financial assets
Accounting policy Investments in shares are measured at fair value through profit or loss and are equity instruments whose objective is to hold for trading.
Available-for-sale financial assets are non-derivative financial assets that are designated as available-for-sale or are not classified in any of the above categories. Available-for-sale financial assets are initially recorded at fair value plus any directly attributable transaction costs.
After initial recognition, these are measured at fair value and changes other than impairment losses and foreign currency differences on available-for-sale debt instruments are recognized in other comprehensive income and presented within equity. When an investment is written off, the result accumulated in other comprehensive income is transferred to income.
The Company's investments in equity securities and certain debt securities are classified as available-for-sale financial assets. |
The balance of other financial assets is composed as following:
|
|
| Parent Company |
| Consolidated | ||||
|
|
| December 31, 2021 |
| December 31, 2020 |
| December 31, 2021 |
| December 31, 2020 |
Rumo S.A. shares (i) |
|
| — |
| 770,862 |
| — |
| 770,862 |
Cosan Logística S.A. shares (i) |
|
| — |
| 8,833 |
| — |
| 8,833 |
Tellus and Janus shares (ii) |
|
| — |
| — |
| 319,727 |
| — |
Other financial assets (iii) |
|
| — |
| — |
| 466 |
| 69,126 |
|
|
| — |
| 779,695 |
| 320,193 |
| 848,821 |
|
|
|
|
|
|
|
|
|
|
Current |
|
| — |
| 779,695 |
| 466 |
| 848,821 |
Non-current |
|
| — |
| — |
| 319,727 |
| — |
|
|
| — |
| 779,695 |
| 320,193 |
| 848,821 |
Notes to the financial statements
(In thousands of Brazilian Reais - R$, unless otherwise stated)
| (i) | With the corporate reorganization (Note 1.1), Cosan merged with Cosan Logística and started to consolidate Rumo, and the balances of shares previously recorded as financial assets started to be classified as investments in the individual financial statements as per Note 1.1.2(b). | |
| (ii) | The subsidiary Radar Propriedades Agrícola S.A. holds investments in preferred shares issued by its related parties Tellus Brasil Participações S.A. (“Tellus”) and Janus Brasil Participações S.A. (“Janus”), which also buy, sell and rent investment properties. These investments represent 5% of the preferred shares issued by the Tellus and Janus companies. The Company and the other shareholders are entitled to receive 90% of the proposed annual dividends. Investments are redeemable when the entities sell the investment properties, which are valued on a quarterly basis, according to fair market value. Securities are classified as available-for-sale financial instruments at fair value through other comprehensive income. | |
| (iii) | On March 31, 2020, Cosan Lubes Investments Limited (“CLI”) received R$ 65,478 due to the satisfaction of the precedent conditions on December 31, 2019, as provided for in the investment agreement between the Company and CVC Fund VII (“CVC”). On April 15, 2021, the updated amount of R$ 69,155 was liquidated, according to the line “Receipt of consideration asset” in the cash flow. |
5.5 Related parties
Accounting policy Commercial operations, involving related parties, are carried out at normal market prices. Financial and corporate transactions are carried out in accordance with the contracts established between the parties. Outstanding balances at year end are not guaranteed, are not subject to interest and are settled in cash. There were no guarantees given or received on any accounts receivable or payable involving related parties. At the end of each period, an analysis of the recovery of amounts and receivables is carried out and in this year no provision was recognized. |
(In thousands of Brazilian Reais - R$, unless otherwise stated)
a) Accounts receivable and payable with related parties
|
| Parent Company |
| Consolidated | ||||
|
| December 31, 2021 |
| December 31, 2020 |
| December 31, 2021 |
| December 31, 2020 |
Current asset |
|
|
|
|
|
|
|
|
Commercial operations |
|
|
|
|
|
|
|
|
Raízen Energia S.A. (i) |
| 6,434 |
| 23,274 |
| 38,710 |
| 29,485 |
Rumo S.A. |
| 3,930 |
| 4,289 |
| — |
| 8,388 |
Termag - Terminal Marítimo de Guarujá S.A. |
| — |
| — |
| 14,286 |
| — |
Aguassanta Participações S.A. |
| 2,956 |
| 837 |
| 2,956 |
| 837 |
Cosan Lubrificantes e Especialidades S.A. |
| 12,007 |
| 5,741 |
| — |
| — |
Compass Gás e Energia S.A. |
| 2,164 |
| 3,732 |
| — |
| — |
Payly Soluções de Pagamentos S.A |
| 1,078 |
| 2,390 |
| — |
| — |
Raízen S.A. (i) |
| 3,947 |
| 644 |
| 15,489 |
| 1,448 |
Other |
| 2,492 |
| 9,190 |
| 361 |
| 8,601 |
|
| 35,008 |
| 50,097 |
| 71,802 |
| 48,759 |
Financial operations |
|
|
|
|
|
|
|
|
Raízen Energia S.A. (i) |
| 8,933 |
| 21,141 |
| 8,933 |
| 21,141 |
Raízen S.A. (i) |
| 45 |
| — |
| 45 |
| — |
Rio Minas Mineração S.A. |
| — |
| 1,883 |
| 17,500 |
| 1,883 |
Cosan Lubrificantes e Especialidades S.A. (ii) |
| 91,938 |
| 213,872 |
| — |
| — |
|
| 100,916 |
| 236,896 |
| 26,478 |
| 23,024 |
Total current assets |
| 135,924 |
| 286,993 |
| 98,280 |
| 71,783 |
|
|
|
|
|
|
|
|
|
Non-current assets |
|
|
|
|
|
|
|
|
Commercial operations |
|
|
|
|
|
|
|
|
Raízen S.A. (i) |
| — |
| — |
| 47,732 |
| — |
Termag - Terminal Marítimo de Guarujá S.A. |
| — |
| — |
| 64,286 |
| — |
|
| — |
| — |
| 112,018 |
| — |
Corporate and financial operations |
|
|
|
|
|
|
|
|
Raízen Energia S.A. (i) |
| 205,957 |
| 155,175 |
| 205,958 |
| 155,175 |
Cosan Lubrificantes e Especialidades S.A. (ii) |
| 187,483 |
| 318,174 |
| — |
| — |
Other |
| — |
| — |
| 235 |
| 44,808 |
|
| 393,440 |
| 473,349 |
| 206,193 |
| 199,983 |
Total non-current assets |
| 393,440 |
| 473,349 |
| 318,211 |
| 199,983 |
Total assets |
| 529,364 |
| 760,342 |
| 416,491 |
| 271,766 |
(In thousands of Brazilian Reais - R$, unless otherwise stated)
|
| Parent Company |
| Consolidated | ||||
|
| December 31, 2021 |
| December 31, 2020 |
| December 31, 2021 |
| December 31, 2020 |
Current liabilities |
|
|
|
|
|
|
|
|
Commercial operations |
|
|
|
|
|
|
|
|
Raízen Energia S.A. (i) |
| 21,173 |
| 30,447 |
| 50,289 |
| 42,709 |
Raízen S.A. (i) |
| — |
| — |
| 171,084 |
| — |
Rumo S.A. |
| 295 |
| 571 |
| — |
| 704 |
Payly Soluções de Pagamentos S.A. |
| 509 |
| 213 |
| — |
| — |
Other |
| 1,475 |
| 45 |
| 6,365 |
| 53 |
|
| 23,452 |
| 31,276 |
| 227,738 |
| 43,466 |
|
|
|
|
|
|
|
|
|
Corporate / financial operations |
|
|
|
|
|
|
|
|
Raízen S.A. (i) |
| 11,959 |
| 11,386 |
| 11,959 |
| 11,387 |
Cosan Lubrificantes e Especialidades S.A. (ii) |
| 13,146 |
| 8,059 |
| — |
| — |
Cosan Overseas Limited |
| 36,059 |
| 33,579 |
| — |
| — |
Cosan Luxembourg S.A. |
| 131,797 |
| 103,643 |
| — |
| — |
Aldwych Temple Venture Capital Limited |
| 39,975 |
| — |
| — |
| — |
Raízen Energia S.A. (i) |
| 46,219 |
| 90,797 |
| 47,912 |
| 95,631 |
|
| 279,155 |
| 247,464 |
| 59,871 |
| 107,018 |
Total current liabilities |
| 302,607 |
| 278,740 |
| 287,609 |
| 150,484 |
|
|
|
|
|
|
|
|
|
Non-current liabilities |
|
|
|
|
|
|
|
|
Corporate / financial operations |
|
|
|
|
|
|
|
|
Cosan Lubrificantes e Especialidades S.A. (ii) |
| 709,275 |
| 875,690 |
| — |
| — |
Cosan Luxembourg S.A. (iii) |
| 3,870,077 |
| 3,603,911 |
| — |
| — |
Aldwych Temple Venture Capital Limited |
| 8,688 |
| — |
| — |
| — |
Cosan Overseas Limited (iii) |
| 2,809,782 |
| 2,616,538 |
| — |
| — |
Total non-current liabilities |
| 7,397,822 |
| 7,096,139 |
| — |
| — |
Total liabilities |
| 7,700,429 |
| 7,374,879 |
| 287,609 |
| 150,484 |
| (i) | Current and non-current assets receivable from Raízen Energia and Raizen S.A. are, substantially, tax credits which will be reimbursed to the Company when realized. The preferred shares are used to Raízen reimburse Cosan, with preferential dividends, when the net operating loss is consumed in Raízen. | |
| Current liabilities represent amounts owed to Raízen Energia and Raízen S.A. related to expenses regarding legal disputes and other liabilities, generated before the formation of joint venture, which are responsibility of Cosan S.A. | ||
| (ii) | On December 31, 2018, a contract for the assumption of rights and obligations between the Company and the subsidiary CLE was signed and assets and liabilities related to the fuel business were transferred from the acquisition of Esso Brasileira de Petróleo Ltda. (“Esso”) in 2008, which were not contributed to the formation of Raízen, a fact that generated an increase in the active and passive accounts of related parties of the Company in that year and which has been moved as the transactions are settled. This transfer of assets and liabilities does not impact the consolidated position of Company. nor the information by segment. | |
| (iii) | These operations serve as a vehicle for the transfer of resources from the Company to the subsidiaries, which are the bondholders and who are responsible for honoring their obligations. The increases observed in these liability balances refer to the exchange rate variation, which affected the PPE (Export Prepayment) operations that we have today between the Companies and the subsidiaries Cosan Luxembourg S.A. and Cosan Overseas Limited. |
Notes to the financial statements
(In thousands of Brazilian Reais - R$, unless otherwise stated)
b) Related party transactions
| Parent Company |
| Consolidated | |||||
| December 31, 2021 |
|
| December 31, 2020 |
| December 31, 2021 |
| December 31, 2020 |
Revenue |
|
|
|
|
|
|
|
|
Rumo S.A. (i) | — |
|
| — |
| 10,636 |
| 37,887 |
Raízen Energia S.A. | — |
|
| — |
| 340,314 |
| 27,779 |
Raízen S.A | — |
|
| — |
| 178,291 |
| 35,410 |
Biosev S.A. | — |
|
| — |
| 1,143 |
| — |
Shell Energy do Brasil Ltda. | — |
|
| — |
| 23,605 |
| — |
| — |
|
| — |
| 553,989 |
| 101,076 |
Purchase of goods / inputs / services |
|
|
|
|
|
|
|
|
Raízen Energia S.A. | (15) |
|
| — |
| (31,494) |
| (5,296) |
Raízen S.A. (ii) | (14) |
|
| (10) |
| (1,233,017) |
| (2,052) |
| (29) |
|
| (10) |
| (1,264,511) |
| (7,348) |
Shared (expenses) income |
|
|
|
|
|
|
|
|
Rumo S.A (i) | 3,593 |
|
| 4,870 |
| 842 |
| 4,870 |
Cosan Lubrificantes e Especialidades S.A. | 3,374 |
|
| 3,823 |
| — |
| — |
Payly Soluções de Pagamentos S.A. | 191 |
|
| — |
| — |
| — |
Compass Gas e Energia S.A. | 1,581 |
|
| — |
| — |
| — |
Companhia de Gás de São Paulo - COMGÁS | 689 |
|
| — |
| — |
| — |
Trizy - Sinlog Tec. em Logistica S.A. | 175 |
|
| — |
| 175 |
| — |
Raízen Energia S.A. | (4,810) |
|
| (2,760) |
| (67,738) |
| (48,890) |
| 4,793 |
|
| 5,933 |
| (66,721) |
| (44,020) |
|
|
|
|
|
|
|
|
|
Financial result |
|
|
|
|
|
|
|
|
Cosan Limited (i) | 82 |
|
| 286 |
| 168 |
| 1,368 |
Cosan Luxembourg S.A. | (439,705) |
|
| (957,279) |
| — |
| — |
Cosan Overseas Limited | (420,016) |
|
| (809,305) |
| — |
| — |
Raízen S.A. | 4,803 |
|
| 6,341 |
| 4,798 |
| 6,341 |
Aldwych Temple Venture Capital Limited | (893) |
|
| — |
| — |
| — |
Other | 4 |
|
| — |
| 41 |
| — |
| (855,725) |
|
| (1,759,957) |
| 5,007 |
| 7,709 |
Total | (850,961) |
|
| (1,754,034) |
| (772,236) |
| 57,417 |
| (i) | Balances related to the months before the date of the corporate restructuring 1.1. | |
| (ii) | The amount is related to the sale of fuel to the logistics segment. |
Notes to the financial statements
(In thousands of Brazilian Reais - R$, unless otherwise stated)
c) Officers’ and directors’ compensation
The Company has a compensation policy approved by the Board of Directors. Compensation of the Company’s key management personnel includes salaries, contributions to a post-employment defined benefit plan and share-based payment. We present below the Parent Company balance on December 31, 2021, as follows:
| December 31, 2021 |
| December 31, 2020 |
Short-term benefits to officers and directors | 38,034 |
| 26,643 |
Share-based payment transactions | 36,777 |
| 6,105 |
| 74,811 |
| 32,748 |
5.6 Loans, borrowings and debentures
Accounting policy Borrowings are initially recognized at fair value, net of transaction costs. Borrowings are subsequently measured at amortized cost. Borrowings are derecognized when the obligation specified in the contract is discharged, canceled or expires. The difference between the carrying amount of a financial liability that has been extinguished or transferred to another party and the consideration paid, including any non-cash assets transferred or liabilities assumed, is recognized in profit or loss as other income or finance costs.
Borrowings are classified as current liabilities unless the Company has an unconditional right to defer settlement of the liability for at least 12 months after the reporting exercise.
Financial guarantee contracts issued by the Business are initially measured at their fair values and, if not designated as at fair value through profit or loss, are subsequently measured at the higher of:
|
The terms and conditions of outstanding loans are as follows:
|
|
|
| Parent Company |
|
|
|
| ||||
Description |
| Index |
| Annual interest rate |
| December 31, 2021 |
| December 31, 2020 |
| Maturity |
| Objective |
Unsecured |
|
|
|
|
|
|
|
|
|
|
|
|
Senior Notes Due 2029 |
| Fixed 5.50% |
| 5.50% |
| 4,226,142 |
| — |
| Sep-29 |
| Acquisition |
Debentures |
| CDI + 2,65 |
| 12.04% |
| 1,858,837 |
| — |
| Aug-25 |
| Investment |
|
| CDI + 1.65% |
| 7.90% |
| 774,215 |
| — |
| Aug-28 |
| Working capital |
|
| CDI + 2.00% |
| 11.33% |
| 930,301 |
| — |
| Aug-31 |
| Working capital |
|
| IPCA + 5.75% |
| 16.35% |
| 374,761 |
| — |
| Aug-31 |
| Working capital |
Total |
|
|
|
|
| 8,164,256 |
| — |
|
|
|
|
|
|
|
|
|
|
|
|
|
|
|
|
|
Current |
|
|
|
|
| 269,793 |
| — |
|
|
|
|
Non-current |
|
|
|
|
| 7,894,463 |
| — |
|
|
|
|
Notes to the financial statements
(In thousands of Brazilian Reais - R$, unless otherwise stated)
|
| Interest |
| Consolidated |
|
|
|
| ||||
Description |
| Index |
| Annual interest rate |
| December 31, 2021 |
| December 31, 2020 |
| Maturity |
| Objective |
Secured |
|
|
|
|
|
|
|
|
|
|
|
|
BNDES |
| URTJLP |
| 7.49% |
| 2,598,623 |
| — |
| Dec-29 |
| Investment |
|
| Fixed |
| 5.69% |
| 461,756 |
| — |
| Jan-25 |
| Investment |
|
| IPCA |
| 11.08% |
| 646,624 |
| — |
| Jan-48 |
| Investment |
|
| Fixed |
| 3.50% |
| 727 |
| — |
| Jan-24 |
| Investment |
|
| IPCA + 3.25% |
| 13.60% |
| 945,663 |
| 807,438 |
| Apr-29 |
| Investment |
|
| IPCA + 4.10% |
| 14.53% |
| 154,843 |
| 175,374 |
| Apr-29 |
| Investment |
Export credit agreement |
| CDI + 1.03% |
| 10.79% |
| 86,707 |
| — |
| Feb-23 |
| Investment |
|
| CDI + 2.25% |
| 12.28% |
| 60,700 |
| — |
| May-26 |
| Investment |
|
| CDI + 0.80% |
| 10.02% |
| 515,928 |
| — |
| Dec-23 |
| Investment |
Resolution 4131 |
| USD |
| 0.90% |
| 148,932 |
| — |
| Nov-22 |
| Working capital |
Debentures |
| CDI + 1.79% |
| 11.10% |
| 753,770 |
| — |
| Jun-27 |
| Investment |
|
| CDI + 1.30% |
| 10.57% |
| 746,725 |
| — |
| Oct-27 |
| Investment |
|
| IPCA + 4.77% |
| 15.27% |
| 694,898 |
| — |
| Jun-31 |
| Investment |
Export credit agreement |
| Euribor + 0.58% |
| 0.58% |
| 95,460 |
| — |
| Sep-26 |
| Investment |
European investment bank (EIB) |
| USD + Libor 6M + 0.54% |
| 0.80% |
| — |
| 30,817 |
| May-21 |
| Investment |
|
| USD + Libor 6M + 0.61% |
| 0.80% |
| — |
| 57,813 |
| Sep-21 |
| Investment |
|
|
|
|
|
| 7,911,356 |
| 1,071,442 |
|
|
|
|
Unsecured |
|
|
|
|
|
|
|
|
|
|
|
|
Foreign loans |
| GBP+Libor 06 + 1.50% Base 365 |
| 1.40% |
| — |
| 143,039 |
| Jul-21 |
| Working capital |
|
| GBP - Fixed |
| 1.40% |
| 37,674 |
| 35,556 |
| Nov-22 |
| Working capital |
|
| GBP+Libor-06 + 1.10% Base 360 |
| 1.17% |
| — |
| 142,091 |
| Dec-21 |
| Acquisition |
|
| GBP+Libor-06 + 1.50% Base 360 |
| 1.92% |
| 263,501 |
| 248,666 |
| Dec-22 |
| Acquisition |
|
| EUR - Fixed |
| 4.42% |
| 857 |
| 2,095 |
| Sep-22 |
| Investment |
|
| GBP - Pré-fixado |
| 1.90% |
| 150,649 |
| — |
| Dec-23 |
| Investment |
|
| USD + 3.67% |
| 3.67% |
| 438,823 |
| 415,232 |
| May-23 |
| Investment |
|
| USD + 1.59% |
| 1.59% |
| — |
| 388,912 |
| Apr-21 |
| Investment |
|
| USD + 1.36% |
| 1.36% |
| 414,378 |
| — |
| Feb-24 |
| Investment |
Perpetual Notes |
| USD |
| 8.25% |
| 2,825,420 |
| 2,631,100 |
| Nov-40 |
| Acquisition |
Senior Notes Due 2023 |
| USD |
| 5.00% |
| 685,550 |
| 569,466 |
| Mar-23 |
| Acquisition |
Senior Notes Due 2025 |
| USD |
| 5.88% |
| 2,981,335 |
| — |
| Jan-25 |
| Acquisition |
Senior Notes Due 2027 |
| USD |
| 7.00% |
| 4,305,928 |
| 4,379,812 |
| Jan-27 |
| Acquisition |
Senior Notes Due 2028 |
| USD |
| 5.25% |
| 2,700,621 |
| — |
| Jan-28 |
| Acquisition |
Senior Notes Due 2029 |
| Fixed 5.50% |
| 5.50% |
| 4,226,142 |
| — |
| Sep-29 |
| Acquisition |
Senior Notes Due 2032 |
| USD |
| 4.20% |
| 2,800,716 |
| — |
| Jan-32 |
| Acquisition |
Prepayment |
| 100% Libor-03 - 3.50% base 360 |
| 5.57% |
| — |
| 27,129 |
| Mar-21 |
| Working capital |
|
| 100% Libor-03 - 1% base 360 |
| 1.59% |
| 111,955 |
| 104,318 |
| Oct-23 |
| Working capital |
|
| 1,27% Base 360 |
| 1.27% |
| 166,355 |
| — |
| Jul-23 |
| Working capital |
Notes to the financial statements
(In thousands of Brazilian Reais - R$, unless otherwise stated)
Debentures |
| IPCA + 4.68% |
| 15.17% |
| 543,752 |
| — |
| Feb-26 |
| Investment |
|
| IPCA + 4.50% |
| 14.97% |
| 1,483,873 |
| — |
| Feb-29 |
| Investment |
|
| IPCA + 3.60% |
| 11.53% |
| 361,862 |
| — |
| Dec-30 |
| Working capital |
|
| CDI + 2.65 |
| 12.04% |
| 1,858,837 |
| — |
| Aug-25 |
| Investment |
|
| IPCA + 6.80% |
| 17.50% |
| 891,972 |
| — |
| Apr-30 |
| Investment |
|
| IPCA + 3.90% |
| 14.31% |
| 1,018,844 |
| — |
| Oct-29 |
| Investment |
|
| IPCA + 5.73% |
| 16.33% |
| 505,584 |
| — |
| Oct-33 |
| Investment |
|
| IPCA + 4.00% |
| 14.42% |
| 952,671 |
| — |
| Dec-35 |
| Investment |
|
| IPCA + 4.54% |
| 15.02% |
| 126,668 |
| — |
| Jun-36 |
| Investment |
|
| IPCA + 7.48% |
| 18.25% |
| 165,478 |
| 299,524 |
| Dec-22 |
| Investment |
|
| IPCA + 7.36% |
| 18.12% |
| 108,451 |
| 97,956 |
| Dec-25 |
| Investment |
|
| IPCA + 5.87% |
| 16.48% |
| 873,474 |
| 890,658 |
| Dec-23 |
| Investment |
|
| IPCA + 4.33% |
| 14.79% |
| 501,278 |
| 452,457 |
| Oct-24 |
| Investment |
|
| IGPM + 6.10% |
| 12.11% |
| 352,235 |
| 298,706 |
| May-28 |
| Investment |
|
| CDI +0.50% |
| 9.70% |
| 2,033,161 |
| 2,007,849 |
| Oct-22 |
| Investment |
|
| CDI + 1.95% |
| 11.28% |
| 717,651 |
| — |
| Aug-24 |
| Investment |
|
| IPCA + 5.12% |
| 15.66% |
| 484,974 |
| — |
| Aug-31 |
| Investment |
|
| IPCA + 5.22% |
| 15.77% |
| 477,578 |
| — |
| Aug-36 |
| Investment |
|
| CDI + 1.65% |
| 7.90% |
| 774,215 |
| — |
| Aug-28 |
| Working capital |
|
| CDI + 2.00% |
| 11.33% |
| 930,301 |
| — |
| Aug-31 |
| Working capital |
|
| IPCA + 5.75% |
| 16.35% |
| 374,761 |
| — |
| Aug-31 |
| Working capital |
Working capital |
| 100% CDI - 2.75% |
| 10.90% |
| 100,157 |
| 100,045 |
| Jun-22 |
| Working capital |
Promissory notes |
| 100% CDI - 3.00% |
| 12.33% |
| — |
| 601,058 |
| Apr-21 |
| Investment |
|
| 100% CDI - 3.40% |
| 12.73% |
| — |
| 520,116 |
| Apr-21 |
| Investment |
|
|
|
|
|
| 37,747,681 |
| 14,355,785 |
|
|
|
|
Total |
|
|
|
|
| 45,659,037 |
| 15,427,227 |
|
|
|
|
|
|
|
|
|
|
|
|
|
|
|
|
|
Current |
|
|
|
|
| 4,241,368 |
| 2,352,057 |
|
|
|
|
Non-current |
|
|
|
|
| 41,417,669 |
| 13,075,170 |
|
|
|
|
Notes to the financial statements
(In thousands of Brazilian Reais - R$, unless otherwise stated)
The Company used to calculate the average rates, on an annual basis, the annual interbank deposit certificate (Certificado de Depósito Interbancário or “CDI”) rate of 9.15% and the long-term interest rate (Taxa de Juros de Longo Prazo or “TJLP”) of 5.32% .
Non-current borrowings are scheduled to fall due as follows:
|
| Parent Company |
| Consolidated | ||||
|
| December 31, 2021 |
| December 31, 2020 |
| December 31, 2021 |
| December 31, 2020 |
13 to 24 months |
| 569,676 |
| — |
| 4,339,743 |
| 2,605,687 |
25 to 36 months |
| 569,676 |
| — |
| 2,968,458 |
| 2,039,863 |
37 to 48 months |
| 571,582 |
| — |
| 4,029,690 |
| 623,971 |
49 to 60 months |
| — |
| — |
| 984,015 |
| 171,794 |
61 to 72 months |
| 365,786 |
| — |
| 6,902,914 |
| 238,050 |
73 to 84 months |
| 370,455 |
| — |
| 4,701,952 |
| 4,512,773 |
85 to 96 months |
| 4,604,494 |
| — |
| 6,595,854 |
| 238,095 |
Over 97 months |
| 842,794 |
| — |
| 10,895,043 |
| 2,644,937 |
|
| 7,894,463 |
| — |
| 41,417,669 |
| 13,075,170 |
The carrying amounts of loans, borrowings and debentures are denominated in the following currencies:
|
| Parent Company |
| Consolidated | ||||
|
| December 31, 2021 |
| December 31, 2020 |
| December 31, 2021 |
| December 31, 2020 |
Brazilian reais |
| 3,938,114 |
| — |
| 23,304,742 |
| 6,251,180 |
U.S. dollar |
| 4,226,142 |
| — |
| 21,806,154 |
| 8,604,600 |
British pound |
| — |
| — |
| 451,824 |
| 569,352 |
Euro |
| — |
| — |
| 96,317 |
| 2,095 |
|
| 8,164,256 |
| — |
| 45,659,037 |
| 15,427,227 |
All debts denominated in U.S. dollar have currency risk protection through derivative financial instruments (Note 5.11), except for perpetual notes.
(In thousands of Brazilian Reais - R$, unless otherwise stated)
Below are the movements in loans, borrowings and debentures occurred for the year ended December 31, 2021:
|
| Parent Company |
| Consolidated |
December 31, 2019 |
| 1,727,460 |
| 13,357,050 |
Raised |
| — |
| 2,443,732 |
Repayment of principal |
| (1,700,000) |
| (2,739,416) |
Payment of interest |
| (35,203) |
| (796,040) |
Interest, exchange rate and fair value |
| 7,743 |
| 3,161,901 |
December 31, 2020 |
| — |
| 15,427,227 |
Corporate reorganization (Note 1.1) |
| 5,982,343 |
| 26,817,519 |
Raised |
| 1,986,070 |
| 11,390,562 |
Repayment of principal |
| (5,427) |
| (8,612,361) |
Payment of interest |
| (262,407) |
| (1,916,413) |
Interest, exchange rate and fair value |
| 463,677 |
| 2,552,503 |
December 31, 2021 |
| 8,164,256 |
| 45,659,037 |
a) Guarantees
Until September 2021, financing contracts with the European Investment Bank (“EIB”), intended for investments, were guaranteed by a bank guarantee, in accordance with each contract. On September 15, 2021, these bank guarantees were settled, due to the expiration of the loan term. On December 31, 2021, the balance of bank guarantees contracted was R$79,020 (R$133,000 on December 31, 2020).
Some financing agreements with the Brazilian National Economic and Social Development Bank (Banco Nacional de Desenvolvimento Econômico e Social), or “BNDES,” intended for investments, are also guaranteed, according to each agreement, by bank guarantees with an average cost of 0.82% p.a. or by real guarantees (assets) and escrow account. On December 31, 2021, the balance of bank guarantees contracted was R$3,328,076 (R$3,687,323 on December 31, 2020).
To calculate the average rates, the annual average CDI of 9.15% (2.78% as of December 31, 2020) and TJLP of 5.32% (4.87% as of December 31, 2020) were considered on an annual basis.
Notes to the financial statements
(In thousands of Brazilian Reais - R$, unless otherwise stated)
b) Available credit line
As of December 31, 2021, the Company had credit lines in banks with AA rating, which were not used, in the total amount of R$ 250,000 (R$ 250,000 on December 31, 2020), R$ 898,023 (R$ 487,378 as of December 31, 2020), to Rumo S.A. and R$ 2,500,000 to Comgás.
The use of these credit lines is subject to certain contractual conditions.
c) Financial covenants
Under the terms of the major borrowing facilities, the Company and its subsidiaries are required to comply with the following financial covenants:
Debt | Company | Triggers | Ratios |
Debenture of 4th issue | Comgás S.A. | Short-term indebtedness/ Total indebtedness (iii) cannot exceed 0.6 | 0.34 |
Debenture 4th to 9th issues | Comgás S.A. | Net debt (i) / EBITDA (ii) cannot exceed 4.00 | 1.59 |
BNDES | Comgás S.A. | ||
Resolution 4131 | Comgás S.A. | ||
Debenture 1st issue - Cosan Logística (vi) | Cosan S.A. | 2.26 | |
Senior Notes Due 2027 | Cosan S.A. | Net debt proforma (iv) / EBITDA proforma (ii) | (iv) not higher than or equal to 3.5 | 2.11 |
Senior Notes Due 2029 | Cosan S.A. | ||
Senior Notes Due 2025 | Rumo S.A. | Net debt (i) / EBITDA (ii) not higher than or equal to 3.3 | 2.79 |
BNDES | Rumo S.A. | EBITDA (ii) / Consolidated financial result (v) higher or equal 2.0x | 4.91 |
| (i) | Net debt consists of current and non-current debt, net of cash and cash equivalents and marketable securities. Net debt is a non-GAAP measure. | |
| (ii) | Corresponds to the accumulated EBITDA of the last twelve months. | |
| (iii) | Indebtedness means the sum of current and noncurrent loans, financing and debentures, leases and current and noncurrent derivative financial instruments. | |
| (iv) | Net debt and EBITDA pro forma, including joint venture financial information. Net debt and EBITDA pro forma are a non-GAAP measure. |
Notes to the financial statements
(In thousands of Brazilian Reais - R$, unless otherwise stated)
| (v) | The financial result of the net debt is represented by the cost of the net debt. | |
| (vi) | This is the 1st Issuance of Debentures made by Cosan Logística S.A. and which became owned by Cosan after the corporate reorganization, as detailed in Note 1.1. | |
| (vii) | Senior Notes 2028 was the first Green issuance by the freight rail industry in Latin America. The subsidiary is committed to using the funds to fully or partially finance ongoing and future projects that contribute to the promotion of a low-carbon transport sector with efficient use of resources in Brazil. Eligible projects are distributed in the areas of “Acquisition, replacement and upgrade of rolling stock”, “Infrastructure for duplication of railway sections, new yards and yard extensions”, and “Modernization of the railroad”. The company annually issues a report showing the progress of the projects, which can be accessed directly on the investor relations page. | |
| Senior Notes 2032 was an issue in Sustainability-Linked Bonds (SLBs), with the following sustainable targets: reduction of 17.6% by 2026 and 21.6% by 2030 of greenhouse gas emissions per ton of useful kilometer (TKU), starting with the base date of December 2020. Rumo is subject to a step-up of 25 basis points if it does not reach these targets, which would increase the interest rate to 4.45% p.a.. |
For the other loans, borrowings and debentures of the Company there are no debt financial covenants.
On December 31, 2021, the Company and its subsidiaries were in compliance with all debt financial and non-financial covenants.
The terms of loans included cross-default provisions.
Notes to the financial statements
(In thousands of Brazilian Reais - R$, unless otherwise stated)
d) Fair value and exposure to financial risk
The fair value of the loans is based on the discounted cash flow using its implicit discount rate. They are classified as a level 2 fair value in the hierarchy (Note 5.10) due to the use of unobservable data, including own credit risk.
The details of the Company’s exposure to risks arising from loans are shown in Note 5.12.
5.7 Trade payables
Accounting policy
The carrying amounts of trade payables are the same as their fair values, due to their short-term nature. Trade payables are generally paid within 30 days of recognition. |
The carrying amounts of trade payables and other payables are the same as their fair values, due to their short-term nature.
|
| Parent Company |
| Consolidated | ||||
|
| December 31, 2021 |
| December 31, 2020 |
| December 31, 2021 |
| December 31, 2020 |
Materials and service suppliers |
| 4,506 |
| 4,066 |
| 1,891,023 |
| 1,095,051 |
Natural gas/ transport and logistics suppliers |
| — |
| — |
| 1,362,481 |
| 780,141 |
|
| 4,506 |
| 4,066 |
| 3,253,504 |
| 1,875,192 |
The subsidiary Comgás has contracts for the acquisition of natural gas with Petrobras Brasileiro Distribuidora S.A. (“Petrobras”) and Gás Brasiliano Distribuidora S.A. (“Gás”), under the following conditions:
| (i) | Contract with Petrobras in the Firm modality, started in January 2020, valid until December 2023 with a daily quantity of national gas contract of 6.80 millions of m³/day of December, called National Firm (Firme Nacional); | |
| (ii) | Contract with Petrobras in the Firm modality, started in June 1999, effective until December 2021 and contractual daily amount of Bolivian gas of 8.10 million m³/day, called TCQ (“Transportation Capacity Quantity”); |
Notes to the financial statements
(In thousands of Brazilian Reais - R$, unless otherwise stated)
| (iii) | Gas contract entered in the Thermoelectric Priority Program, (Programa Prioritário de Termeletricidade or “PPT”) with Petrobras, for the supply of 0.3 million m³/day with Ingredion Brasil Industriais Ltda., until March 31, 2023. | |
| (iv) | Contract with Gás Brasiliano in the Firm modality, started in April 2008, effective until March 26, 2022, and average monthly contracted volume of 1.44 million m³ and annual contracted volume of 17.52 million m³. |
In December 2021, a new contract was signed with Petrobras in the firm modality, valid from January 2022, indexed to the American currency, effective until December 2023 and contractual daily quantity of 6.40 million m³/day, called TC. The price is composed of two installments: one indexed to Brent in the international market and adjusted quarterly; and the other adjusted annually based on local inflation.
The natural gas supply contracts, Firme Nacional and TCQ, have prices composed of two components: one indexed to a basket of fuel oils in the international market and adjusted quarterly; and the other adjusted annually based on local inflation rates. Both contracts are indexed to the US currency.
Notes to the financial statements
(In thousands of Brazilian Reais - R$, unless otherwise stated)
5.8 Leases
Accounting policy At the beginning or in the modification of a contract, the Company assesses whether a contract is or contains a lease.
The lease liability is initially measured at the present value of lease payments that are not made on the start date, discounted at the interest rate implicit in the lease or, if that rate cannot be determined immediately, by the Company’s incremental loan rate. The Company generally uses its incremental loan rate as a discount rate.
Assets and liabilities arising from a lease are initially measured on a present value basis. The lease payments included in the measurement of the lease liability comprise the following: i. fixed payments, including fixed payments in essence; ii. variable lease payments that depend on index or rate, initially measured using the index or rate on the start date; iii. amounts expected to be paid by the lessee, in accordance with the residual value guarantees; and iv. the exercise price of the call option if the lessee is reasonably certain to exercise that option, and payment of fines for terminating the lease, if the lease term reflects the lessee exercising the option to terminate the lease.
To determine the incremental borrowing rate, the Company: i. where possible, uses recent third-party financing received by the individual lessee as a starting point, adjusted to reflect changes in financing conditions since third party financing was received; ii. uses a build-up approach that starts with a risk-free interest rate adjusted for credit risk for leases held by the Company, which does not have recent third-part financing; and iii. makes adjustments specific to the lease, e.g. term, country, currency and security.
The Company is exposed to potential future increases in variable lease payments based on an index or rate, which are not included in the lease liability until they take effect. When adjustments to lease payments based on an index or rate take effect, the lease liability is reassessed and adjusted against the right-of-use asset.
Lease payments are allocated between principal and finance cost. The finance cost is charged to profit or loss over the lease period so as to produce a constant periodic rate of interest on the remaining balance of the liability for each period.
Payments associated with short-term leases of equipment and vehicles and all leases of low-value assets are recognized on a straight-line basis as an expense in profit or loss. Short-term leases are leases with a lease term of 12 months or less. Low-value assets comprise IT equipment and small items of office furniture. |
Notes to the financial statements
(In thousands of Brazilian Reais - R$, unless otherwise stated)
In determining the lease term, the Company considers all facts and circumstances that create an economic incentive to exercise an extension option, or not exercise a termination option. Extension options (or periods after termination options) are only included in the lease term if the lease is reasonably certain to be extended (or not terminated).
For leases of warehouses, retail stores and equipment, the following factors are normally the most relevant:
• If there are significant penalties to terminate (or not extend), the group is typically reasonably certain to extend (or not terminate). • If any leasehold improvements are expected to have a significant remaining value, the Company is typically reasonably certain to extend (or not terminate). • Otherwise, the Company considers other factors including historical lease durations and the costs and business disruption required to replace the leased asset.
Most extension options in offices and vehicles leases have not been included in the lease liability, because the Company could replace the assets without significant cost or business disruption.
Subsequent valuation of the lease liability is at amortized cost, using the effective interest method. It is remeasured when there is a change in future lease payments resulting from a change in index or rate, if there is a change in the amounts that are expected to be paid according to the residual value guarantee, if the Company changes its valuation, an option will be exercised purchase, extension or termination or if there is an essentially fixed revised lease payment. |
Notes to the financial statements
(In thousands of Brazilian Reais - R$, unless otherwise stated)
| Consolidated |
| Total |
At January 1, 2021 | 79,763 |
Corporate reorganization (Note 1.1) | 2,950,960 |
Business combination (note 8.2.1) | 3,281 |
Additions | 142,105 |
Interest | 359,400 |
Repayments of principal | (421,394) |
Payments of interest | (142,484) |
Monetary adjustment | 338,659 |
Transfers between liabilities (i) | (42,612) |
At December 31, 2021 | 3,267,678 |
|
|
Current | 405,820 |
Non-current | 2,861,858 |
| 3,267,678 |
(i) Transfer of railroad concession payable to lease (Note 12).
The lease agreements have different terms, with the last due to expire in December 2058. The amounts are updated annually by inflation rates, as measured by the General Market Price Index (Índice Geral de Preços - Mercado, or “IGP-M”) or Extended National Consumer Price Index (Índice Nacional de Preços ao Consumidor Amplo, or “IPCA,”) or may incur interest calculated based on the TJLP or CDI and some of the contracts have renewal or purchase options that were considered in determining the term and classification as finance lease.
Notes to the financial statements
(In thousands of Brazilian Reais - R$, unless otherwise stated)
In addition to the amortization and appropriation of interest and exchange variation highlighted in the previous tables, the following impacts on income were recorded for the other lease contracts that were not included in the measurement of lease liabilities:
| December 31, 2021 |
|
Variable lease payments not included in the measurement of lease liabilities | 35,482 |
|
Expenses relating to short-term leases | 30,507 |
|
Expenses relating to leases of low-value assets, excluding short-term leases | 978 |
|
| 66,967 |
|
Additional Information
The subsidiaries, in full compliance with the rules, in the measurement and remeasurement of its lease liabilities and the right-of-use, proceeded to discount the present value of future lease installments without considering future projected inflation in the installments to be discounted.
The incremental interest rate (nominal) used by Rumo was determined based on the interest rates to which the subsidiaries have access, adjusted to the Brazilian market and the terms of its contracts. Rates between 10.9% and 14.2% have been used, according to the term of each contract.
In compliance with CVM Instruction Circular Official Letter 2/2019, if, in transactions where the incremental rate is used, the measurement was made at the present value of expected installments plus projected future inflation, the balances of lease liabilities, right of use, financial expense and depreciation expense for the year ended December 31, 2021, would be those presented in the “Official note” column:
Notes to the financial statements
(In thousands of Brazilian Reais - R$, unless otherwise stated)
|
| December 31, 2021 | ||||
Accounts |
| Registered |
| Official note |
| % Variation |
Lease liabilities |
| (2,121,577) |
| (2,287,777) |
| 8% |
Residual right of use |
| 6,743,631 |
| 6,755,661 |
| 0% |
Financial expense |
| (253,446) |
| (265,511) |
| 5% |
Depreciation expense |
| (280,462) |
| (285,462) |
| 2% |
The balances recorded by the subsidiaries include the Malha Central contract and the renewal of addendum Malha Paulista contract, which have an implicit rate identified so that their appreciation does not generate distortions in the liabilities and usage rights covered by the CVM Circular. As of December 31, 2021, the lease liability of these contracts was R$ 1,185,207.
Rumo recorded lease liabilities at the present value of the installments due, this means the inclusion of any tax credits to which it will be entitled at the time of the lease payments. The potential PIS / COFINS credit included in liabilities on December 31, 2021, is R$ 6,154.
Notes to the financial statements
(In thousands of Brazilian Reais - R$, unless otherwise stated)
5.9 Sector financial asset and liability
Accounting policy Sector financial assets and liabilities aim to offset the economic impacts on profit or loss of subsidiary Comgás, due to the difference between the cost of gas and the tax rates provided for by the administrative rulings issued by Sanitation and Energy Regulatory Agency for the state of São Paulo (Agência Reguladora de Energia de São Paulo), or “ARSESP”, and those effectively provided for by the tariff, upon each tariff adjustment/review.
These differences between actual cost and cost considered in the tariff adjustments generate a right to the extent that the realized cost is higher than that per the tariff, or an obligation, when the costs are lower than those per the tariff. The differences are considered by ARSESP in the subsequent tariff adjustment and are included in the Company’s tariff adjustment index. As provided in Resolution No. 1010, any balances in the memorandum accounts existing at the end of the concession period shall be indemnified to subsidiary Comgás or returned to users within the period of 12 months before the end of the concession period. The balance consists of: (i) the previous cycle (under amortization), which represents the balance approved by ARSESP already included in the tariff and (ii) the cycle being constituted, which includes the differences to be approved by ARSESP in the next tariff adjustment.
In addition, this resolution covered the balance contained in the current account of taxes, which accumulated amounts related to tax credits used by Comgás, but which essentially are part of the tariff composition and must be subsequently transferred in the tariff. |
Notes to the financial statements
(In thousands of Brazilian Reais - R$, unless otherwise stated)
The changes in net sector financial asset (liability) for the year ended December 31, 2021, were as follows:
| Sectorial assets |
| Sectorial liabilities |
| Total |
January 01, 2020 | - |
| - |
| - |
Cost of gas (i) | 201,346 |
| - |
| 201,346 |
Credits of taxes (ii) | - |
| (565,911) |
| (565,911) |
Monetary variations (iii) | 13,458 |
| - |
| 13,458 |
Non-operating income | 26,945 |
| - |
| 26,945 |
December 31, 2020 | 241,749 |
| (565,911) |
| (324,162) |
Cost of gas (i) | 228,153 |
| - |
| 228,153 |
Credits of taxes (ii) | - |
| (167,397) |
| (167,397) |
Monetary variations (iii) | 19,699 |
| (263,410) |
| (243,711) |
Extemporaneous credits (iv) | - |
| (375,565) |
| (375,565) |
Deferral of IPG-M (v) | 68,709 |
| - |
| 68,709 |
December 31, 2021 | 558,310 |
| (1,372,283) |
| (813,973) |
|
|
|
|
|
|
Current | 489,601 |
| (85,866) |
| 403,735 |
Non-current | 68,709 |
| (1,286,417) |
| (1,217,708) |
| 558,310 |
| (1,372,283) |
| (813,973) |
| (i) | Refers to the cost of gas purchased higher than that contained in the tariffs, 100% classified in current assets, since ARSESP's resolution provides for tariff recovery on a quarterly basis for the industrial segment, which is a substantial part of the volume of gas distributed by the subsidiary Comgás. |
| (ii) | Credits, mainly, from the exclusion of ICMS from the PIS and COFINS calculation basis, which will be returned to consumers when the lawsuit is final, and which should be discussed with ARSESP regarding the mechanisms and criteria for reimbursement. |
| (iii) | Monetary update on the gas current account and extemporaneous credit, based on the SELIC rate. |
| (iv) | Credit for the exclusion of ICMS from the PIS and COFINS calculation basis, see details in note 6. |
| (v) | Appropriation of the IGP-M deferral, referring to June to December 2021, for the residential and commercial segments. |
Notes to the financial statements
(In thousands of Brazilian Reais - R$, unless otherwise stated)
5.10 Derivative financial instruments
Accounting policy
Derivatives are initially recognized at fair value on the date a derivative contract is entered into and are subsequently remeasured to their fair value at the end of each reporting period. The accounting for subsequent changes in fair value depends on whether the derivative is designated as a hedging instrument, and if so, the nature of the item being hedged. The Company designates certain derivatives as either:
i hedges of the fair value of recognized assets or liabilities or a firm commitment (fair value hedges); or ii hedges of a particular risk associated with the cash flows of recognized assets and liabilities and highly probable forecast transactions (cash flow hedges).
At inception of the hedge relationship, the Company documents the economic relationship between hedging instruments and hedged items including whether changes in the cash flows of the hedging instruments are expected to offset changes in the cash flows of hedged items. The Company documents its risk management objective and strategy for undertaking its hedge transactions. Changes in the fair value of any derivative instrument that does not qualify for hedge accounting are recognized immediately in profit or loss and are included in other gains / (losses). The fair values of derivative financial instruments designated in hedge relationships are disclosed below. The full fair value of a hedging derivative is classified as a non-current asset or liability when the remaining maturity of the hedged item is more than 12 months; it is classified as a current asset or liability when the remaining maturity of the hedged item is less than 12 months.
The Company makes an assessment, both at the inception of the hedge relationship as well as on an ongoing basis, of whether the hedging instruments are expected to be highly effective in offsetting the changes in the fair value or cash flows of the respective hedged items attributable to the hedged risk, and whether the actual results of each hedge are within a range of 60% to 140%.
The Company has a portfolio of energy contracts (purchase and sale) aimed at meeting energy supply and demand requirements. There is also a portfolio of contracts that comprises forward positions, generally of short term. For this portfolio there is no purchase commitment with a sale contract.
The Company has flexibility to manage the contracts in this portfolio in order to obtain gains due to variations in market prices, considering its risk policies and limits. Contracts in this portfolio may be settled in cash or in another financial instrument (for example: by entering into an offset contract with a counterparty; or “undoing its position” of the contract before its exercise or expiration; or shortly after the purchase, making a sale in order to generate profit from short-term fluctuations in the price or gain with resale margin. |
Notes to the financial statements
(In thousands of Brazilian Reais - R$, unless otherwise stated)
These energy purchase and sale transactions are carried out in an active market and meet the definition of financial instruments due to the fact that they are settled in cash and are readily convertible into money. These contracts are accounted for as derivatives and are recognized in the statement of financial position at fair value at the date a derivative contract is entered into and are remeasured to fair value at the end of the reporting period.
Financial assets and financial liabilities are offset and the net amount presented in the statement of financial position when the Company currently has a legally enforceable right to set off the recognized amounts and it intends either to settle them on a net basis or to realize the asset and settle the liability simultaneously. The legally enforceable rights must not be contingent on future events and must be enforceable in the normal course of business and in the event of default, insolvency or bankruptcy of the company or counterparty.
The fair value of these derivatives is estimated partly based on price quotations published in active markets, to the extent that such observable market data exist, and partly through the use of valuation techniques which consider: (i) prices established in recent purchase and sale transactions, (ii) risk margin in supply, and (iii) forecast market price in the availability period. Whenever the fair value on initial recognition for these contracts differs from the transaction price, a fair vale gain or fair value loss is recognized at the end of the reporting date. |
Notes to the financial statements
(In thousands of Brazilian Reais - R$, unless otherwise stated)
| Notional |
| Fair value | ||||
| December 31, 2021 |
| December 31, 2020 |
| December 31, 2021 |
| December 31, 2020 |
Exchange rate derivatives |
|
|
|
|
|
|
|
Forward agreements (i) | 3,313,428 |
| 345,144 |
| 21,305 |
| (509) |
|
|
|
|
|
|
|
|
Electricity derivatives |
|
|
|
|
|
|
|
Forward agreements (ii) | 1,407,476 |
| 1,354,967 |
| (248,123) |
| (189,423) |
|
|
|
|
|
|
|
|
Fuel derivatives |
|
|
|
|
|
|
|
Forward agreements | — |
| 13,422 |
| — |
| (348) |
| 1,407,476 |
| 1,368,389 |
| (248,123) |
| (189,771) |
Interest rate and exchange rate risk |
|
|
|
|
|
|
|
Swap agreements (shares) (iii) - (parent company) | 1,074,113 |
| — |
| 270,462 |
| — |
Swap agreements (interest rate and inflation) (iv) | 6,590,408 |
| — |
| 77,913 |
| — |
Swap agreements (interest rate) (v) | 3,019,917 |
| 1,170,861 |
| 154,654 |
| 346,488 |
Swap agreements (exchange and interest rate) (iv) | 13,223,981 |
| 4,281,071 |
| 3,380,554 |
| 2,553,383 |
| 23,908,419 |
| 5,451,932 |
| 3,883,583 |
| 2,899,871 |
|
|
|
|
|
|
|
|
Total financial instruments |
| 3,656,765 |
| 2,709,591 | |||
|
|
|
|
|
|
|
|
Current assets |
|
|
|
| 194,878 |
| 156,208 |
Non-current assets |
|
|
|
| 4,538,048 |
| 2,971,210 |
Current liabilities |
|
|
|
| (925,650) |
| (293,656) |
Non-current liabilities |
|
|
|
| (150,511) |
| (124,171) |
Total |
|
|
|
| 3,656,765 |
| 2,709,591 |
| (i) | The Company and its subsidiaries TRSP and Moove have forward foreign exchange contracts to hedge exposures and expenses in foreign currency. |
| (ii) | The subsidiary Compass Gás e Energia has a portfolio of energy contracts (purchase and sale) aimed at meeting demands and offers for consumption or supply of energy. In addition, there is a portfolio of contracts that comprises forward positions, usually short-term. For this portfolio, there is no purchase commitment with a sales contract. |
| (iii) | The Company entered into derivative negotiations, or Total Return Swap, with commercial banks. Under the Total Return Swap, which will have financial settlement, Cosan will receive the return on the variation in the price of CSAN3 shares adjusted by the dividends for the period and will pay annual interest referenced to CDI + Spread. The contracted value of CSAN3 shares with total return swap was 61,983,012 shares and the total initial value is R$1,074,112. Part of these operations are guaranteed by RAIL3 shares of its subsidiary Rumo S.A.. On December 31, the mark-to-market income, recorded in the Company's financial income line, was R$57,704. |
Notes to the financial statements
(In thousands of Brazilian Reais - R$, unless otherwise stated)
| (iv) | The subsidiary Rumo contracted interest and exchange swap operations, in order to be assets in USD + fixed interest and liabilities as a percentage of CDI. In the interest and inflation swap operations, the Company is active in IPCA + fixed interest and passive in a percentage of the CDI. |
| (v) | US dollar notional amounts are converted into reais at the exchange rate on the date of contracting. On July 22, 2021, the subsidiary TRSP contracted a SWAP with a notional of R$700,000 and a future start date of August 13, 2021, with the objective of passive indexing the exchange variation +3.20%, no longer being active in CDI +1.95%. In the year ended December 31, 2021, the derivative has a credit value of R$40,233 recorded in current liabilities. |
Derivatives are only used for economic hedging purposes and not as speculative investments.
Fair value hedge
The Company adopts fair value hedge accounting for some of its operations, both hedge instruments and hedge-protected items are measured and recognized at fair value through profit or loss.
There is an economic relationship between the hedged item and the hedge instrument, since the terms of the interest rate and foreign exchange swap correspond to the terms of the fixed rate loan, that is, notional amount, term and payment. The Company established a 1:1 hedge ratio for hedge relationships since the underlying risk of the interest rate and exchange rate swap is identical to the hedged risk component. To test the effectiveness of the hedge, the Company uses the discounted cash flow method and compares the changes in the fair value of the hedge instrument with the changes in the fair value of the hedged item attributable to the hedged risk. The sources of hedge ineffectiveness that are expected to affect the hedging relationship during its term evaluated by the Company are mainly: (i) reduction or modification of the hedged item; and (ii) a change in the credit risk of the Company or the counterparty of the contracted swaps. The amounts related to the items designated as hedge instruments were as following:
Notes to the financial statements
(In thousands of Brazilian Reais - R$, unless otherwise stated)
|
|
| Book value |
| Accumulated fair value adjustment | ||||
| Notional |
| December 31, 2021 |
| December 31, 2020 |
| December 31, 2021 |
| December 31, 2020 |
Exchange rate hedge |
|
|
|
|
|
|
|
|
|
Designated items |
|
|
|
|
|
|
|
|
|
Senior notes 2025 (Rumo Luxembourg) | (1,740,550) |
| — |
| — |
| 259,866 |
| — |
Senior notes 2028 (Rumo Luxembourg) | (2,791,600) |
| (2,700,621) |
| — |
| 43,154 |
| — |
Senior notes 2032 (Rumo Luxembourg) | (2,758,400) |
| (2,938,939) |
| — |
| (679,564) |
| — |
Total debt | (7,290,550) |
| (5,639,560) |
| — |
| (376,544) |
| — |
|
|
|
|
|
|
|
|
|
|
Derivative financial instruments |
|
|
|
|
|
|
|
|
|
|
|
|
|
|
|
|
|
|
|
Senior Swaps Notes 2025 (Rumo Luxembourg) | — |
| — |
| — |
| (120,326) |
| — |
Senior Swaps Notes 2028 (Rumo Luxembourg) | 2,791,600 |
| 266,526 |
| — |
| 277,542 |
| — |
Senior Notes 2032 (Rumo Luxembourg) | 2,259,375 |
| 675,572 |
| — |
| 675,572 |
| — |
Derivative total | 5,050,975 |
| 942,098 |
| — |
| 832,788 |
| — |
|
|
|
|
|
|
|
|
|
|
Total | (2,239,575) |
| (4,697,462) |
| — |
| 456,244 |
| — |
|
|
|
|
|
|
|
|
|
|
|
|
| Book value |
| Accumulated fair value adjustment | ||||
| Notional |
| December 31, 2021 |
| December 31, 2020 |
| December 31, 2021 |
| December 31, 2020 |
Interest rate hedge |
|
|
|
|
|
|
|
|
|
|
|
|
|
|
|
|
|
|
|
Designated items |
|
|
|
|
|
|
|
|
|
Senior Notes 2023 (Cosan Luxembourg) | — |
| — |
| (569,466) |
| (188,083) |
| (237,050) |
Debenture 3rd issue - 3rd series (Comgás) | — |
| — |
| — |
| — |
| 575 |
Debenture 5th issue - single series (Comgás) | (684,501) |
| (873,474) |
| (890,658) |
| 17,184 |
| (22,040) |
Debenture 9rd issue - 1rd series (Comgás) | (500,000) |
| (484,974) |
| — |
| (484,974) |
| — |
Debenture 9rd issue - 2rd series (Comgás) | (500,000) |
| (477,578) |
| — |
| (477,578) |
| — |
BNDES Project VIII (i) | (1,000,000) |
| (921,949) |
| — |
| (921,949) |
| — |
Debenture (Rumo) | (5,530,408) |
| (5,359,574) |
| — |
| 149,491 |
| — |
Total debt | (8,214,909) |
| (8,117,549) |
| (1,460,124) |
| (1,905,909) |
| (258,515) |
|
|
|
|
|
|
|
|
|
|
Derivative financial instruments |
|
|
|
|
|
|
|
|
|
|
|
|
|
|
|
|
|
|
|
Swaps Notes 2023 (Cosan Luxembourg) | — |
| — |
| 392,899 |
| 10,057 |
| (42,532) |
Debenture 3rd issue - 3rd series (Comgás) | — |
| — |
| — |
| — |
| 862 |
Debenture 5th issue - single series (Comgás) | 684,501 |
| (189,928) |
| 211,741 |
| (401,669) |
| 10,731 |
Debenture 9rd issue - 1rd series (Comgás) | 500,000 |
| 5,776 |
| — |
| 5,776 |
| — |
Debenture 9rd issue - 2rd series (Comgás) | 500,000 |
| 12,939 |
| — |
| 12,939 |
| — |
BNDES Project VIII | 1,000,000 |
| 51,220 |
| — |
| 51,220 |
| — |
Swaps Debenture (Rumo) | 5,556,236 |
| (75,806) |
| — |
| (196,959) |
| — |
Derivative total | 8,240,737 |
| (195,799) |
| 604,640 |
| (518,636) |
| (30,939) |
|
|
|
|
|
|
|
|
|
|
Total | 25,828 |
| (8,313,348) |
| (855,484) |
| (2,424,545) |
| (289,454) |
(i) In the subsidiary Comgás, the exposure of the BNDES Project VIII debt is substantially protected by the hedge contracted in July 2021, with a portion of less than 3% not protected and for practical purposes its segregation at amortized cost becomes irrelevant.
Notes to the financial statements
(In thousands of Brazilian Reais - R$, unless otherwise stated)
Fair value option
Certain derivative instruments have not been linked to documented hedge structures.
The Company chose to designate the protected liabilities (hedge objects) to record at fair value through the income. Considering that derivative instruments are always accounted for at fair value through income, the accounting effects are the same as those obtained through a hedging documentation:
|
|
|
|
| Book value |
| Accumulated fair value adjustment | ||||
|
|
| Notional |
| December 31, 2021 |
| December 31, 2020 |
| December 31, 2021 |
| December 31, 2020 |
Exchange rate |
|
|
|
|
|
|
|
|
|
|
|
Objects |
|
|
|
|
|
|
|
|
|
|
|
Senior Notes 2027 | USD+7.0% |
| (3,627,325) |
| (4,305,928) |
| (4,379,812) |
| 313,052 |
| (349,181) |
Export Credit Agreement | EUR + 0.58% |
| (100,198) |
| (95,460) |
| — |
| 15,827 |
| — |
Resolution 4,131 (Rumo) | USD + 2.20% |
| (220,000) |
| (148,932) |
| — |
| 9,185 |
| — |
EIB 3ª Tranche | US$ + LIBOR6M + 0.54% |
| — |
| — |
| (30,817) |
| — |
| 156 |
EIB 4ª Tranche | US$ + LIBOR6M + 0.61% |
| — |
| — |
| (57,813) |
| — |
| 308 |
Resolution 4,131 (Comgás - 2018) | US$ + 3.67% |
| (268,125) |
| (438,823) |
| (415,232) |
| (18,230) |
| (24,247) |
Resolution 4,131 (Comgás - 2020) | US$ + 1.59% |
| — |
| — |
| (388,912) |
| — |
| 1,967 |
Resolution 4,131 (Comgás - 2021) | US$ + 1.36% |
| (407,250) |
| (414,378) |
| — |
| 5,526 |
| — |
Total |
|
| (4,622,898) |
| (5,403,521) |
| (5,272,586) |
| 325,360 |
| (370,997) |
|
|
|
|
|
|
|
|
|
|
|
|
Derivative instruments |
|
|
|
|
|
|
|
|
|
|
|
Swap Notes 2027 | BRL + 126.85% do CDI |
| 3,627,325 |
| 2,047,237 |
| 2,272,648 |
| 45,181 |
| 1,320,629 |
Inflation and interest rate swaps | BRL + 107% do CDI |
| 100,198 |
| 30,535 |
| — |
| (10,658) |
| — |
Inflation and interest rate swaps | BRL + 118% do CDI |
| 220,000 |
| 47,527 |
| — |
| (15,874) |
| — |
EIB 3rd Tranche | BRL + 88.5% do CDI |
| — |
| — |
| 21,176 |
| 844 |
| 24,927 |
EIB 4th Tranche | BRL + 81.1% do CDI |
| — |
| — |
| 39,256 |
| 2,583 |
| 26,219 |
Resolution 4,131 (Comgás - 2018) | BRL + 107.9% do CDI |
| 268,125 |
| 168,358 |
| 154,627 |
| 20,794 |
| 117,080 |
Resolution 4,131 (Comgás - 2020) | BRL + CDI + 2.75% |
| — |
| — |
| (6,214) |
| 15,711 |
| (12,904) |
Resolution 4,131 (Comgás - 2021) | BRL + CDI + 1.25% |
| 407,250 |
| (514) |
| — |
| (6,628) |
| — |
Derivative total |
|
| 4,622,898 |
| 2,293,143 |
| 2,481,493 |
| 51,953 |
| 1,475,951 |
|
|
|
|
|
|
|
|
|
|
|
|
Total |
|
| — |
| (3,110,378) |
| (2,791,093) |
| 377,313 |
| 1,104,954 |
Notes to the financial statements
(In thousands of Brazilian Reais - R$, unless otherwise stated)
|
|
|
|
|
|
|
|
|
|
|
|
|
|
|
|
| Book value |
| Accumulated fair value adjustment | ||||
|
|
| Notional |
| December 31, 2021 |
| December 31, 2020 |
| December 31, 2021 |
| December 31, 2020 |
Interest rate |
|
|
|
|
|
|
|
|
|
|
|
Objects |
|
|
|
|
|
|
|
|
|
|
|
Debenture (Rumo) | IPCA + 4,68% |
| (500,000) |
| (543,752) |
| — |
| (59,494) |
| — |
Debenture (Rumo) | IPCA + 4,50% |
| (600,000) |
| (676,798) |
| — |
| (9,264) |
| — |
Total |
|
| (1,100,000) |
| (1,220,550) |
| — |
| (68,758) |
| — |
|
|
|
|
|
|
|
|
|
|
|
|
Derivative instruments |
|
|
|
|
|
|
|
|
|
|
|
FX and interest swap | 107% CDI |
| 500,000 |
| 71,375 |
| — |
| 11,772 |
| — |
FX and interest swap | 105% CDI |
| 600,000 |
| 82,344 |
| — |
| (1,789) |
| — |
Derivative total |
|
| 1,100,000 |
| 153,719 |
| — |
| 9,983 |
| — |
|
|
|
|
|
|
|
|
|
|
|
|
Total |
|
| — |
| (1,066,831) |
| — |
| (58,775) |
| — |
5.11 Recognized fair value measurements
Accounting policy When the fair value of financial assets and financial liabilities cannot be derived from active markets, their fair value is determined using valuation techniques, including the discounted cash flow model. Inputs to these models are obtained from observable markets, when possible, but when this is not feasible, a degree of judgment is required to determine fair values. Judgment is needed in determining data such as liquidity risk, credit risk and volatility. Changes in these variables could affect the reported fair value of financial instruments.
Specific valuation techniques used to value financial instruments include:
All resulting fair value estimates are included in level 2, when fair values have been determined based on present values and the discount rates used have been adjusted for counterparty or own credit risk. |
Notes to the financial statements
(In thousands of Brazilian Reais - R$, unless otherwise stated)
The Company has an established control structure in relation to the measurement of fair values.
Management regularly reviews significant unobservable inputs and valuation adjustments. If information from third parties, such as quotes from brokers or pricing services, is used to measure fair values, the treasury assesses evidence obtained from third parties to support the conclusion that these assessments meet the requirements of the Company's policy, including the level in the market.
Significant valuation issues are reported to the Board of Directors. When measuring the fair value of an asset or liability, the Company uses observable market data as much as possible. Fair values are categorized at different levels in a fair value hierarchy based on inputs used in valuation techniques as follows:
• Level 1: Entries represent unadjusted quoted prices for identical instruments traded in active markets.
• Level 2: Inputs include directly or indirectly observable inputs (except Level 1) such as quoted prices for similar financial instruments traded in active markets, quoted prices for identical or similar financial instruments traded in inactive markets and other observable market inputs. The fair value of most of the Company's investments in securities, derivative contracts and bonds.
• Level 3: inputs for the asset or liability that are not based on observable market data (unobservable inputs). Management is required to use its own assumptions about unobservable inputs, as there is little market activity in these instruments or related observable data that can be corroborated at the measurement date. |
Notes to the financial statements
(In thousands of Brazilian Reais - R$, unless otherwise stated)
If the inputs used to measure the fair value of an asset or liability fall into different levels of the fair value hierarchy, then the fair value measurement is categorized in its entirety at the same level of the fair value hierarchy as the lowest-level entry that is significant to the entire measurement. Specific valuation techniques used to value financial instruments include: i. use of quoted market prices ii. fair value is calculated as the present value of estimated future cash flows. Estimates of floating rate future cash flows are based on quoted swap rates, futures prices and interbank lending rates. Estimated cash flows are discounted using a yield curve constructed from similar sources and which reflects the relevant benchmark interbank rate used by market participants for this purpose when pricing interest rate swaps. The fair value estimate is subject to a credit risk adjustment that reflects the credit risk of the Company and its counterparty; this is calculated based on the credit spreads derived from the current credit default swap; and iii. for other financial instruments, we analyze the discounted cash flow |
The market values of the Senior Notes are listed on the Luxembourg Stock Exchange (Note 5.6) is based on their quoted market price are as follows:
|
| Company |
| December 31, 2021 |
| December 31, 2020 |
Senior Notes 2023 |
| Cosan Luxembourg S.A. |
| 100.26% |
| 101.02% |
Senior Notes 2025 |
| Rumo Luxembourg S.à r.l. |
| 103.04% |
| — |
Senior Notes 2027 |
| Cosan Luxembourg S.A. |
| 103.79% |
| 108.20% |
Senior Notes 2028 |
| Rumo Luxembourg S.à r.l. |
| 103.42% |
| — |
Senior Notes 2029 |
| Cosan S.A. |
| 104.39% |
| — |
Senior Notes 2032 |
| Rumo Luxembourg S.à r.l. |
| 94.34% |
| — |
Perpetual Notes |
| Cosan Overseas Limited |
| 102.17% |
| 102.88% |
All the resulting fair value estimates are included in level 2 except for a contingent consideration payable where the fair values have been determined based on present values and the discount rates used were adjusted for counterparty or own credit risk.
The carrying amounts and fair value of assets and liabilities are as follows:
Notes to the financial statements
(In thousands of Brazilian Reais - R$, unless otherwise stated)
|
|
| Carrying amount | Assets and liabilities measured at fair value | |||||||||||||
|
|
| December 31, 2021 |
| December 31, 2020 |
| December 31, 2021 | December 31, 2020 | |||||||||
| Note |
|
|
|
|
| Level 2 |
| Level 3 |
| Level 1 |
| Level 2 | ||||
Assets |
|
|
|
|
|
|
|
|
|
|
|
|
| ||||
Investment funds | 5.1 |
| 8,103,713 |
| 2,154,257 |
| 8,103,713 |
| — |
| — |
| 2,154,257 | ||||
Marketable securities | 5.2 |
| 4,388,007 |
| 2,271,570 |
| 4,388,007 |
| — |
| — |
| 2,271,570 | ||||
Other financial assets | 5.4 |
| 320,193 |
| 848,821 |
| 320,193 |
| — |
| 848,821 |
| — | ||||
Investment properties | 10.5 |
| 3,886,696 |
| — |
| — |
| 3,886,696 |
| — |
| — | ||||
Derivate financial instruments | 5.10 |
| 4,732,926 |
| 3,127,418 |
| 4,732,926 |
| — |
| — |
| 3,127,418 | ||||
Total |
|
| 21,431,535 |
| 8,402,066 |
| 17,544,839 |
| 3,886,696 |
| 848,821 |
| 7,553,245 | ||||
|
|
|
|
|
|
|
|
|
|
|
|
|
| ||||
Liabilities |
|
|
|
|
|
|
|
|
|
|
|
|
| ||||
Loans, borrowings and debentures | 5.6 |
| (20,214,600) |
| (6,837,028) |
| (20,214,600) |
| — |
| — |
| (6,837,028) | ||||
Derivative financial instruments | 5.10 |
| (1,076,161) |
| (417,827) |
| (1,076,161) |
| — |
| — |
| (417,827) | ||||
Total |
|
| (21,290,761) |
| (7,254,855) |
| (21,290,761) |
| — |
| — |
| (7,254,855) | ||||
5.12 Financial risk management
This note explains the Company’s exposure to financial risks and how these risks could affect the group’s future financial performance. Current year profit and loss information has been included where relevant to add further context.
Risk | Exposure arising from | Measurement | Management |
Market risk – foreign exchange | (i) Future commercial transactions. (ii) Recognized financial assets and liabilities not denominated in Brazilian reais. | (i) Cash flow forecasting (ii) Sensitivity analysis | Foreign currency forwards. |
Market risk – interest rate | Cash and cash equivalents, marketable securities, loans, borrowings and debentures, leases and derivative. | (i) Sensitivity analysis | Interest rate Swap. |
Market risk – prices | Future commercial transactions. | (i) Cash flow forecasting (ii) Sensitivity analysis | Future electric energy price (purchase and sale). |
Credit risk | Cash and cash equivalents, marketable securities trade receivables, derivatives, receivables from related parties, dividends e investment properties. | (i) Ageing analysis (ii) Credit ratings | Diversification of bank deposits, credit limits and letters of credit. |
Liquidity risk | Loans, borrowings and debentures, trade payables, other financial liabilities, REFIS, leases, derivative, payables to related parties and dividends. | (i) Rolling cash flow forecasts | Availability of committed credit lines and borrowing facilities. |
Notes to the financial statements
(In thousands of Brazilian Reais - R$, unless otherwise stated)
The Company's Management identifies, evaluates and hedges financial risks in close cooperation with the operating units. The Board of Directors provides written principles for managing global risk as well as policies covering specific areas such as currency risk, interest rate risk, credit risk, use of derivative financial instruments and non-derivative financial instruments and excess investment of liquidity.
Where all relevant criteria are met, hedge accounting is applied to remove the accounting mismatch between the hedging instrument and the hedged item. This will effectively result in recognizing interest expense at a fixed interest rate for the hedged floating rate loans and inventory at the fixed foreign currency rate for the hedged purchases.
The Company may opt for the formal designation of new debt operations for which it has swap-type derivative financial instruments for exchange variation and interest, as measured at fair value. The option for fair value (“Fair Value Option”) is intended to eliminate or inconsistencies in the result arising from differences between the measurement credits of certain liabilities and their hedging instruments. Thus, both the swaps and the respective debts are now measured at fair value. Such option is irrevocable and must only be made in the initial accounting record of the operation.
The Company’s policy is to maintain capital base to promote the confidence of investors, creditors and the market, and to ensure the future development of the business. Management monitors that the return on capital is adequate for each of its businesses.
The usage of financial instruments in order to protect against these areas of volatility is determined through an analysis of the risk exposure that management intends to cover.
Notes to the financial statements
(In thousands of Brazilian Reais - R$, unless otherwise stated)
a) Market risk
The objective of market risk management is to manage and control market risk exposures within acceptable parameters, while optimizing the return.
The Company uses derivatives to manage market risks. All such transactions are carried out within the guidelines set by the risk management committee. Generally, the Company seeks to apply hedge accounting to manage volatility in profit or loss.
| i | Foreign exchange risk |
On December 31, 2021 and December 31, 2020, the Company had the following net exposure to the exchange rate variations on assets and liabilities denominated in U.S. Dollar (U.S.$.) and Euro:
| December 31, 2021 |
| December 31, 2020 |
Cash and cash equivalents | 3,811,598 |
| 143,676 |
Trade receivables | 93,326 |
| 17,502 |
Trade payables | (4,721) |
| (174,178) |
Loans, borrowings and debentures | (19,640,300) |
| (8,007,493) |
Leases | (108,365) |
| — |
Contingent consideration | (234,960) |
| (224,787) |
Derivative financial instruments (notional) | 21,105,358 |
| 5,453,252 |
Foreign exchange exposure, net | 5,021,936 |
| (2,792,028) |
The sensitivity of profit or loss to changes in the exchange rates arises mainly from U.S. dollar and Euro denominated financial instruments and the impact on other components of equity arises from foreign forward exchange contracts designated as cash flow hedges.
Notes to the financial statements
(In thousands of Brazilian Reais - R$, unless otherwise stated)
A reasonably possible strengthening (weakening) of the Brazilian reais to U.S. dollar and Euro as of December 31, 2021, would have affected the measurement of financial instruments denominated in a foreign currency and affected equity and profit or loss by the amounts shown below. This analysis assumes that all other variables, in particular interest rates, remain constant and ignores any impact of forecast sales and purchases. Stressed scenarios (positive and negative effects, before tax effects) were defined based on changes of a 25% and 50% to the U.S. dollar and Euro exchange rate used in the probable scenario. The Company’s exposure to foreign currency changes for all other currencies is not material:
|
|
|
|
|
| Variation scenario | ||||||
Instrument |
| Risk factor |
| Probable |
| 25% |
| 50% |
| -25% |
| -50% |
Cash and cash equivalents |
| Currency fluctuation |
| 81,621 |
| 1,054,926 |
| 2,028,231 |
| (891,684) |
| (1,864,989) |
Trade receivables |
| Currency fluctuation |
| 76,502 |
| 100,347 |
| 124,191 |
| 52,658 |
| 28,813 |
Trade payables |
| Currency fluctuation |
| (1,414) |
| (926) |
| (438) |
| (1,902) |
| (2,389) |
Derivative financial instruments |
| Currency fluctuation |
| 2,457,838 |
| 3,676,786 |
| 6,946,953 |
| (2,863,548) |
| (6,133,715) |
Loans, borrowings and debentures |
| Currency fluctuation |
| (424,712) |
| (7,017,875) |
| (13,489,738) |
| 5,925,849 |
| 12,397,712 |
Leases |
| Currency fluctuation |
| (2,321) |
| (29,992) |
| (57,663) |
| 23,351 |
| 53,022 |
Consideration payable |
| Currency fluctuation |
| 239,993 |
| 299,901 |
| 359,989 |
| 179,995 |
| 119,997 |
Impacts on profit or loss |
|
|
| 2,427,507 |
| (1,916,743) |
| (4,088,474) |
| 2,424,719 |
| 4,598,450 |
The probable scenario considers the estimated exchange rates, made by a specialized third part, at the due date of the transactions for the companies with functional currency Brazilian reais (positive and negative, before tax effects), as follows:
|
| Exchange rate sensitivity analysis | ||||||||||
|
| December 31, 2021 |
| Scenario | ||||||||
|
|
| Probable |
| 25% |
| 50% |
| -25% |
| -50% | |
U.S.$ |
| 5.5805 |
| 5.7000 |
| 7.1250 |
| 8.5500 |
| 4.2750 |
| 2.8500 |
Euro |
| 6.3210 |
| 6.5550 |
| 8.1938 |
| 9.8325 |
| 4.9163 |
| 3.2775 |
GBP |
| 7.5242 |
| 7.9230 |
| 9.9038 |
| 11.8845 |
| 5.9423 |
| 3.9615 |
| ii | Foreign exchange risk |
Notes to the financial statements
(In thousands of Brazilian Reais - R$, unless otherwise stated)
The Company and its subsidiaries monitor the fluctuations in variable interest rates in connection with their borrowings and uses derivative instruments in order to minimize variable interest rate fluctuation risks.
A sensitivity analysis on the interest rates on loans and borrowings in compensation for the CDI investments with pre-tax increases and decreases of 25% and 50% is presented below:
|
|
|
| Variation scenario | ||||||
Exposure interest rate |
| Probable |
| 25% |
| 50% |
| -25% |
| -50% |
Cash and cash equivalents |
| 1,623,771 |
| 1,995,927 |
| 2,385,014 |
| 1,423,642 |
| 1,116,070 |
Marketable securities |
| 487,145 |
| 598,464 |
| 714,627 |
| 430,749 |
| 340,218 |
Lease and concession in installments |
| (121,902) |
| (152,377) |
| (182,853) |
| (91,426) |
| (60,951) |
Leases |
| (371,433) |
| (371,433) |
| (371,433) |
| (371,433) |
| (371,433) |
Derivative financial instruments |
| 1,327,786 |
| (1,365,311) |
| (2,073,012) |
| 223,066 |
| 1,124,171 |
Loans, borrowings and debentures |
| (2,244,669) |
| (2,760,945) |
| (3,184,050) |
| (1,914,734) |
| (1,491,629) |
Other financial liabilities |
| (71,996) |
| (88,073) |
| (104,151) |
| (55,918) |
| (39,840) |
Impacts on profit or loss |
| 628,702 |
| (2,143,748) |
| (2,815,858) |
| (356,054) |
| 616,606 |
The probable scenario considers the estimated interest rate, made by a specialized third party and Central Bank of Brazil (Banco Central do Brasil), or “BACEN,” as follows:
|
| Probable |
| 25% |
| 50% |
| -25% |
| -50% |
SELIC |
| 11.15% |
| 13.94% |
| 16.73% |
| 8.36% |
| 5.58% |
CDI |
| 11.15% |
| 13.94% |
| 16.73% |
| 8.36% |
| 5.58% |
TJLP462 (TJLP + 1% p.a.) |
| 7.60% |
| 9.25% |
| 10.90% |
| 5.95% |
| 4.30% |
TJLP |
| 6.60% |
| 8.25% |
| 9.90% |
| 4.95% |
| 3.30% |
IPCA |
| 4.61% |
| 5.76% |
| 6.91% |
| 3.46% |
| 2.30% |
IGPM |
| 5.19% |
| 6.48% |
| 7.78% |
| 3.89% |
| 2.59% |
Libor |
| 1.16% |
| 1.45% |
| 1.74% |
| 0.87% |
| 0.58% |
Fed Funds |
| 0.90% |
| 1.13% |
| 1.35% |
| 0.68% |
| 0.45% |
| iii | Price risk |
- Financial position and unrealized gains (loss) on electricity trading operations, net
Notes to the financial statements
(In thousands of Brazilian Reais - R$, unless otherwise stated)
Electricity trading operations are carried out in an active market and recognized at fair value through profit or loss, based on the difference between the contracted price and the market price of open contracts at the reporting date.
This fair value is estimated, to a large extent, in the price quotations used in the active over-the-counter market, to the extent that such observable market data exist, and, to a lesser extent, by the use of valuation techniques that consider prices established in the operations of purchase and sale and market prices projected by specialized entities, in the period of availability of this information, which may not be confirmed in the future.
Statement of financial position balances referring to outstanding energy trading operations are as follows:
|
|
|
|
|
| December 31, 2021 |
|
|
|
|
| December 31, 2020 |
|
| Assets |
| Liabilities |
| Net loss |
| Assets |
| Liabilities |
| Net loss |
Trading operations |
| 69,576 |
| (317,699) |
| (248,123) |
| 96,595 |
| (286,018) |
| (189,423) |
The main risk factor that impacts the pricing of energy trading operations is the exposure to market energy prices. The scenarios for sensitivity analysis considering this factor are prepared using market data and specialized sources, considering future prices, applied to the market curves as of December 31, 2021, as follows:
|
|
|
| Variation scenario | ||||||
|
| Probable |
| 25% |
| 50% |
| -25% |
| -50% |
Unrealized loss on trading operations |
| (248,123) |
| (244,212) |
| (240,302) |
| (252,034) |
| (255,942) |
|
| (248,123) |
| (244,212) |
| (240,302) |
| (252,034) |
| (255,942) |
Notes to the financial statements
(In thousands of Brazilian Reais - R$, unless otherwise stated)
The projection of settlement of positions, at nominal value, follows the schedule below:
|
| 2022 |
| 2023 |
| 2024 |
| Above 2025 |
Positions to be settled |
| (248,115) |
| (13,822) |
| 1,093 |
| 12,721 |
b) Credit risk
The Company’s regular operations expose it to potential defaults when customers, suppliers and counterparties are unable to comply with their financial or other commitments. The Company seeks to mitigate this risk by entering into transactions with a diverse pool of counterparties. However, the Company continues to remain subject to unexpected third-party financial failures that could disrupt its operations. The exposure to credit risk was as follows:
| December 31, 2021 |
| December 31, 2020 |
Cash and cash equivalents | 16,174,130 |
| 4,614,053 |
Trade receivables | 2,745,853 |
| 1,604,839 |
Marketable securities | 4,388,007 |
| 2,271,570 |
Restricted cash | 58,990 |
| — |
Derivative financial instruments | 4,732,926 |
| 3,127,418 |
Receivables from related parties | 416,491 |
| 271,766 |
Dividends receivable and interest on equity receivables | 519,965 |
| 77,561 |
Other financial assets | 320,193 |
| 68,838 |
| 29,356,555 |
| 12,036,045 |
The Company is also exposed to risks in connection with its cash management activities and temporary investments.
Net assets are invested primarily in government security and other investments in Banks with a minimum grade of “A.” Credit risk from balances with banks and financial institutions is managed by the Company’s treasury department in accordance with the Company’s policy.
Notes to the financial statements
(In thousands of Brazilian Reais - R$, unless otherwise stated)
The credit risk of lease receivables is classified into two categories of customers: (i) Level 1 and (ii) Level 2. Most investment properties of subsidiaries are leased to customers classified as Level 1, with no history of late payment or default and with a sound financial situation. To mitigate the credit risk related to lease receivables, the Company's policy limits its exposure to Level 2 customers to a minimum. For accounts receivable related to the sale of investment properties, the risk is mitigated by granting ownership of land to the customer only when a down payment for the transaction is received. In addition, title to ownership is transferred only upon receipt of outstanding payments in full.
Investments of surplus funds are made only with approved counterparties and within credit limits assigned to each counterparty. Counterparty credit limits are reviewed on an annual basis and may be updated throughout the period. The limits are set to minimize the concentration of risks and therefore mitigate financial loss through potential counterparty’s failure to make payments. The credit risk on cash and cash equivalents, marketable securities, restricted cash and derivative financial instruments are determined by rating instruments widely accepted by the market and are arranged as follows:
| December 31, 2021 |
| December 31, 2020 |
AAA | 23,080,390 |
| 8,997,661 |
AA | 2,239,266 |
| 1,015,380 |
BBB | 34,397 |
| — |
| 25,354,053 |
| 10,013,041 |
c) Liquidity risk
The Company’s approach to managing liquidity is to ensure, as far as possible, that it will have sufficient liquidity to meet its liabilities when they are due, under both normal and stressed conditions, without incurring unacceptable losses or risking damage to the Company’s reputation.
Notes to the financial statements
(In thousands of Brazilian Reais - R$, unless otherwise stated)
The financial liabilities of the Company sorted by due dates (based on undiscounted cash flows contracted) are as follows:
| December 31, 2021 |
| December 31, 2020 | ||||||||
| Up to 1 year |
| 1 - 2 years |
| 3 - 5 years |
| More than 5 years |
| Total |
| Total |
Loans, borrowings and debentures | (5,845,774) |
| (6,628,072) |
| (12,124,037) |
| (32,777,404) |
| (57,375,287) |
| (20,543,616) |
Trade payables | (3,253,504) |
| — |
| — |
| — |
| (3,253,504) |
| (1,875,192) |
Other financial liabilities | (726,423) |
| — |
| — |
| — |
| (726,423) |
| (149,293) |
Tax installments - REFIS | (52,805) |
| (3,453) |
| (1,395) |
| (143,011) |
| (200,664) |
| (193,353) |
Leases | (413,310) |
| (413,692) |
| (1,133,476) |
| (13,671,334) |
| (15,631,812) |
| (107,451) |
Lease and concession instalments | (187,972) |
| (201,876) |
| (198,532) |
| (596,696) |
| (1,185,076) |
| — |
Payables to related parties | (287,609) |
| — |
| — |
| — |
| (287,609) |
| (150,484) |
Dividends payable | (799,634) |
| — |
| — |
| — |
| (799,634) |
| (16,301) |
Derivative financial instruments | (1,064,207) |
| (1,078) |
| 1,380,014 |
| 5,998,479 |
| 6,313,208 |
| 4,087,083 |
| (12,631,238) |
| (7,248,171) |
| (12,077,426) |
| (41,189,966) |
| (73,146,801) |
| (18,948,607) |
d) Capital management risk
The Company's policy is to maintain a solid capital base to promote the trust of its parent companies, creditors and the market, and to ensure the future development of the business. Management monitors the return on capital, which is defined by the Company as the result of its operating activities divided by the total shareholders' equity, so that it is adequate for each of its businesses.
6 Other tax receivables
Accounting policy Tax assets are measured at cost and primarily include (i) tax effects which are recognized when the asset is sold to a third party or recovered through amortization of the asset’s remaining economic life; and (ii) income tax receivables that are expected to be recovered either as refunds from taxing authorities or as a reduction to future tax obligations. |
Notes to the financial statements
(In thousands of Brazilian Reais - R$, unless otherwise stated)
|
| Parent Company |
| Consolidated | ||||
|
| December 31, 2021 |
| December 31, 2020 |
| December 31, 2021 |
| December 31, 2020 |
COFINS - Revenue tax (iii) |
| 28,696 |
| 26,952 |
| 1,333,868 |
| 322,500 |
ICMS - State VAT (i) |
| 10 |
| — |
| 873,203 |
| 159,299 |
ICMS CIAP - State VAT (ii) |
| — |
| — |
| 106,250 |
| 17,763 |
PIS - Revenue tax (iii) |
| 1,968 |
| 2,785 |
| 299,610 |
| 20,071 |
Credit installment |
| 42,932 |
| 42,138 |
| 42,932 |
| 42,138 |
Other |
| 2,942 |
| 1,165 |
| 145,304 |
| 39,933 |
|
| 76,548 |
| 73,040 |
| 2,801,167 |
| 601,704 |
|
|
|
|
|
|
|
|
|
Current |
| 33,616 |
| 35,507 |
| 921,472 |
| 434,480 |
Non-current |
| 42,932 |
| 37,533 |
| 1,879,695 |
| 167,224 |
(i) ICMS credit related to the purchase of materials and diesel used in rail transportation, whose balance was added to the consolidated due to the corporate reorganization, note 1.1.
(ii) ICMS credit arising from acquisitions of property, plant and equipment, whose balance was added to the consolidated due to the corporate reorganization, note 1.1.
(iii) At the subsidiary Comgás, on March 15, 2017, the Federal Supreme Court (Supremo tribunal Federal or “STF”) concluded the judgment of Extraordinary Appeal No. 574,706 and, under the general repercussion system, established the thesis that the Tax on Circulation of Goods and Services (Imposto Sobre Circulação de Mercadoria e Prestação de Serviços or “ICMS”) is not part of the calculation basis of the Social Integration Program (Programa de Integração Social or “PIS”) and the Contribution to Social Security Financing (Contribuição para o Financiamento da Seguridade Social or “COFINS”), since this amount does not constitute the Company's revenue/invoicing. That is, taxpayers have the right to exclude the amount related to ICMS highlighted in the invoice from the PIS and COFINS calculation basis.
In 2018, the subsidiary Comgás recognized the credits for the periods after March 2017 based on the decision given at that date by the Supreme Court, maintaining as contingent asset values arising from the action, not yet judged definitively, which went back to July 2008.
At the subsidiary Comgás, on May 13, 2021, the STF concludes the judgment on the modulation of the effects of the decision that excluded ICMS from the PIS and COFINS calculation basis (RE 574.706), as well as confirmed that the ICMS to be considered in the matter is the highlighted, not collected. According to the modulation, the effects of the exclusion are valid from March 15, 2017 – the date on which the ministers decided on the merits in the Plenary of the Court. In the case of Comgás, since its original claim dates from July 2013, in accordance with the legal form of the modulation of the effects, the right to recover the undue amount until July 2008. In this way, all relevant circumstances and, up to then, pending on the subject were overcome and, therefore, from the point of view of IAS 37 / CPC 25, the amounts related to the claim were no longer classified as contingent assets, since their existence was confirmed, and their realization is practically certain. Therefore, the Company recorded, on June 2021, the amount of R$957,663 (R$573,462 principal and R$382,201 monetary restatement), updated on December 31, 2021, total R$956,338 (R$563,175 principal and R$393,213 monetary restatement), related to PIS and COFINS credits in its non-current assets, which includes monetary restatement at the SELIC rate. The total amount is supported by Management based on calculations and supporting documentation, in order to substantiate the accuracy of the calculations. In August 2021, the final and unappealable decision of the individual action filed by the subsidiary Comgás on the subject in 2013 was certified. Eventually, be considered as a component of tariff adjustment within the scope of the economic and financial balance of the concession contract, and such interpretation gained greater clarity after the modulation of the effects by the STF in the judgment of May 13, 2021. Therefore, of the total amount of credits recognized up to December 31, 2021, the subsidiary Comgás provisioned the amount of R$638,975 (R$375,565 principal and R$263,410 monetary restatement), equivalent to the uncertain portion, in its Sectoral Liabilities item, in non-current liabilities (Note 5.9). According to ARSESP Resolution No. 1,254 of December 8, 2021, as of December 10, 2021, tariffs already exclude ICMS from PIS/COFINS calculation basis.
Notes to the financial statements
(In thousands of Brazilian Reais - R$, unless otherwise stated)
7 Inventories
Accounting policy Inventories are stated at the lower of cost and net realizable value (it is the estimated selling price in the normal course of business, less estimated completion costs and estimated costs necessary to make the sale). The cost of finished and under construction products comprises direct materials, direct labor and an adequate proportion of variable and fixed overheads, the latter being allocated based on normal operational capacity. Costs are assigned to individual inventory items based on weighted average costs.
The provision for obsolete inventories is made for the risks associated with the realization and sale of inventories due to obsolescence and measured at the net realizable value or the cost, whichever is lower. |
|
| Consolidated | ||
|
| December 31, 2021 |
| December 31, 2020 |
Finished goods |
| 814,320 |
| 545,529 |
Spare parts and accessories (i) |
| 180,286 |
| — |
Raw material |
| 126,889 |
| 118,319 |
Warehouse and other |
| 27,809 |
| 22,052 |
|
| 1,149,304 |
| 685,900 |
(i) With the corporate reorganization (note 1.1), the consolidated balances of Rumo started to be consolidated in Cosan S.A..
The balances are presented net of the provision for obsolete inventories in the amount of R$ 26,841 on December 31, 2021 (R$ 17,449 on December 31, 2020).
Notes to the financial statements
(In thousands of Brazilian Reais - R$, unless otherwise stated)
8 Investments in associates
8.1 Investments in subsidiaries and associates
Accounting policy i. Subsidiaries Subsidiaries are entities over which the Company has control, all of which are consolidated as of the acquisition date and deconsolidated when control ceases to exist.
Subsidiaries' financial standards are prepared for the same reporting period as the controller's consistent accounting policies. Companies are in the adjusted financials of subsidiaries to adjust their accounting policies to dated accounting transactions.
Related party transactions are eliminated at the meeting. Unrealized gains arising from transactions with investees using the equity method are registered trademarks against the investment in proportion to the Company's share in the investee. Parts not shown are disposed of in the same way, but only to the extent that there is no evidence of impairment.
ii. Associates Associates are those entities in which the Company has significant influence, but not control or joint control, over the financial and operating policies.
Intragroup balances and transactions, and any unrealized income or expenses arising from intragroup transactions, are eliminated in the preparation of the consolidated financial statements.
Under the equity method of accounting, the share attributable to the Company of the profit or loss for the period of such investments is accounted for in the statement of profit or loss, in “Equity in investees.” Unrealized gains and losses arising on transactions between the Company and the investees are eliminated based on the percentage of interest held in such investees. The other comprehensive income of subsidiaries, associates and jointly controlled entities is recorded directly in the Company’s shareholders’ equity, in “Other comprehensive income.” Unrealized gains arising from transactions with equity accounted investees are eliminated against the investment to the extent of the Company’s interest in the investee. Unrealized losses are similarly eliminated, but only to the extent that there is no evidence of impairment. |
Notes to the financial statements
(In thousands of Brazilian Reais - R$, unless otherwise stated)
Cosan’s subsidiaries and associates are listed below:
| December 31, 2021 |
| December 31, 2020 |
Directly owned subsidiaries |
|
|
|
Compass Gás e Energia (i) | 88.00% |
| 99.01% |
Cosan Lubes Investments Limited (CLI) | 70.00% |
| 70.00% |
Cosan Cayman II Limited | 100.00% |
| 100.00% |
Cosan Global Limited | 100.00% |
| 100.00% |
Cosan Investimentos e Participações S.A. | 100.00% |
| 100.00% |
Cosan Luxembourg S.A. (ii) | 100.00% |
| 100.00% |
Cosan Overseas Limited | 100.00% |
| 100.00% |
Pasadena Empreendimentos e Participações S.A. | 100.00% |
| 100.00% |
Atlântico Participações Ltda | 100.00% |
| — |
Payly Soluções de Pagamentos S.A. | 75.00% |
| 75.00% |
Cosan Limited Partners Brasil Consultoria Ltda (iii) | 97.50% |
| — |
Sinlog Tecnologia em Logística S.A. (iii) | 72.25% |
| — |
Rumo S.A. (1.1.2 b) | 30.35% |
| 2.16% |
Cosan Logística S.A. (1.1.2 b) | — |
| 0.10% |
Violeta Fundo de Investimento Multimercado (Note 1.2.19) | 100.00% |
| — |
|
|
|
|
Interest of Compass Gás e Energia in its subsidiaries |
|
|
|
Companhia de Gás de São Paulo - Comgás | 99.15% |
| 99.15% |
Compass Comercialização S.A. | 100.00% |
| 100.00% |
Compass Geração Ltda | — |
| 100.00% |
Compass Energia Ltda | 100.00% |
| 100.00% |
Terminal de Regaseificação de São Paulo - TRSP | 100.00% |
| 100.00% |
Rota 4 Participações S.A. | 100.00% |
| 100.00% |
Edge II - Empresa de Geração de Energia | 100.00% |
| — |
|
|
|
|
Interest of Cosan Lubes Investments Limited in its subsidiaries |
|
|
|
Moove Lubricants Limited | 100.00% |
| 100.00% |
Cosan Cinco S.A. | 100.00% |
| 100.00% |
Airport Energy Limited | 100.00% |
| 100.00% |
Airport Energy Services Limited | 100.00% |
| 100.00% |
Wessex Petroleum Limited | 100.00% |
| 100.00% |
Stanbridge Group Limited | 100.00% |
| 100.00% |
Cosan Lubricants España S.L.U. | 100.00% |
| 100.00% |
Techniques ET Technologies Appliquees SAS - TTA (iv) | 100.00% |
| 75.00% |
Cosan Lubrificantes S.R.L. | 98.00% |
| 98.00% |
Lubrigrupo II - Comércio e Distribuição de Lubrificantes S.A. | 100.00% |
| 100.00% |
Comma Oil & Chemicals Marketing SRL | 100.00% |
| 100.00% |
Comma Otomotiv Yag Ve Kimyasallari | 100.00% |
| 100.00% |
Pazarlama Limited Sirketi | 100.00% |
| 100.00% |
Comma Oil & Chemicals Marketing B | 100.00% |
| 100.00% |
Commercial Lubricants Moove Corp | 100.00% |
| 100.00% |
Cosan Lubrificantes e Especialidades S.A. | 100.00% |
| 100.00% |
Cosan US, Inc | 100.00% |
| 100.00% |
Ilha Terminal Distribuição de Produtos Derivados de Petróleo Ltda. | 100.00% |
| 100.00% |
Zip Lube S.A. | 100.00% |
| 100.00% |
Cosan Paraguay S.A. | 100.00% |
| 100.00% |
Notes to the financial statements
(In thousands of Brazilian Reais - R$, unless otherwise stated)
Interest of Rumo S.A. in its subsidiaries (iii) |
|
|
|
Elevações Portuárias S.A. | 100.00% |
| — |
Rumo Intermodal S.A. | 100.00% |
| — |
Rumo Malha Central S.A. | 100.00% |
| — |
Boswells S.A. | 100.00% |
| — |
Rumo Malha Sul S.A. | 100.00% |
| — |
Rumo Luxembourg Sarl | 100.00% |
| — |
Rumo Malha Paulista S.A. | 100.00% |
| — |
ALL Armazéns Gerais Ltda. | 100.00% |
| — |
Rumo Malha Oeste S.A. | 100.00% |
| — |
ALL Argentina S.A. | 100.00% |
| — |
Portofer Ltda | 100.00% |
| — |
Servicios de Inversión Logística Integrales S.A. | 100.00% |
| — |
Paranaguá S.A. | 99.90% |
| — |
Rumo Malha Norte S.A. | 99.74% |
| — |
Brado Participações S.A. (Note 1.2.15) | 77.65% |
| — |
ALL Central S.A. | 73.55% |
| — |
ALL Mesopotâmica S.A | 70.56% |
| — |
Logispot Armazéns Gerais S.A. | 51.00% |
| — |
Terminal São Simão S.A. | 51.00% |
| — |
|
|
|
|
Interest of Violeta Fundo de Investimento Multimercado in its subsidiaries (Note 1.2.19) |
|
|
|
Verde Pinho Fundo de Investimento em Participações | 100.00% |
| — |
Radar Propriedades Agrícolas S.A. | 50.00% |
| — |
Radar II Propriedades Agrícolas S.A. | 50.00% |
| — |
Nova Agrícola Ponte Alta S.A. | 50.00% |
| — |
Nova Amaralina S.A Propriedades Agrícolas | 50.00% |
| — |
Nova Santa Bárbara Agrícola S.A. | 50.00% |
| — |
Terras da Ponta Alta S.A. | 50.00% |
| — |
Castanheira Propriedades Agrícolas S.A. | 50.00% |
| — |
Manacá Propriedades Agrícolas S.A. | 50.00% |
| — |
Paineira Propriedades Agrícolas S.A. | 50.00% |
| — |
| (i) | The subsidiary Compass Gás e Energia, as described in note 1.2.11, entered into Investment Agreements that resulted in the dilution of the Company's interest. Until December 31, 2021, contributions were made to Compass in the amount of R$2,250,015. The agreement signed with Atmos has a clause that grants the option to sell the shares detailed in the agreement, being insured by the Company, which will need to supplement the price charged by Atmos if it is lower than the base price determined in the agreement. The price supplement provision will be calculated by the difference between the price of the share sold and the base price. On December 31, 2021, no provision was recognized, as the subsidiary's valuation exceeds the base price determined in the contract. This assessment will be carried out quarterly and, if necessary, a provision will be recognized. |
| (ii) | Management has concluded that there are no material uncertainties that cast doubt on the continuity of the subsidiary. Despite presenting on December 31, 2021, the amount with an unsecured liability of R$ 356,442, as shown below, no events or conditions were identified that, individually or collectively, could raise significant doubts as to the ability to maintain their continuity operational. The subsidiaries have the financial support of the Company. |
| (iii) | Movement of equity interest resulting from the corporate reorganization as specified in note 1.1. |
| (iv) | In August 2021, Moove Lubricants Limited acquired 25% of the remaining stake. The cash consideration of R$32,030 was paid to the non-controlling shareholder. |
Set out below are investments in subsidiaries and associates as of December 31, 2021, which are material to the Company:
Notes to the financial statements
(In thousands of Brazilian Reais - R$, unless otherwise stated)
a) Parent company
|
| Shares issued by the associate |
| Shares held by Cosan |
| Cosan ownership interest |
| Economic benefit (%) |
Compass Gás e Energia |
| 714,190,095 |
| 628,487,691 |
| 88.00% |
| 88.00% |
Cosan Global Limited |
| 1 |
| 1 |
| 100.00% |
| 100.00% |
Cosan Luxemburgo S.A. |
| 500,000 |
| 500,000 |
| 100.00% |
| 100.00% |
Tellus Brasil Participações S.A. |
| 120,920,515 |
| 61,359,623 |
| 50.74% |
| 5.00% |
Janus Brasil Participações S.A. |
| 229,689,888 |
| 116,620,166 |
| 50.77% |
| 5.00% |
Cosan Lubes Investment |
| 34,963,764 |
| 24,474,635 |
| 70.00% |
| 70.00% |
Payly Soluções de Pagamentos S.A. |
| 78,527,201 |
| 58,895,877 |
| 75.00% |
| 75.00% |
Pasadena Empreendimentos e Participações S.A. |
| 32,752,251 |
| 32,751,751 |
| 99.99% |
| 99.99% |
Sinlog Tecnologia em Logística S.A. |
| 86,370 |
| 62,403 |
| 72.25% |
| 72.25% |
Rumo S.A. |
| 1,854,158,791 |
| 562,529,490 |
| 30.34% |
| 30.35% |
Violeta Fundo de Investimento Multimercado |
| 2,115,452,842 |
| 2,115,452,842 |
| 100.00% |
| 100.00% |
Cosan Limited Partners Brasil Consultoria Ltda |
| 160,000 |
| 156,000 |
| 97.50% |
| 97.50% |
Notes to the financial statements
(In thousands of Brazilian Reais - R$, unless otherwise stated)
(In thousands of Brazilian Reais - R$, unless otherwise stated)
| At January 1, 2021 | Interest in earnings of subsidiaries | Sales or purchase of interests | Other comprehensive income (loss) | Dividends | Capital increase | Merged assets, net (note 1.1) | Business combination (note 8.2.1) | Other | At December 31, 2021 | |||||||||||
Rumo S.A. |
| — |
| 10,567 |
| (92,686) |
| 5,621 |
| (10,852) |
| — |
| 4,585,932 |
| — |
| (7,795) |
| 4,490,787 |
Cosan Global |
| 132,896 |
| 4,631 |
| — |
| — |
| — |
| — |
| — |
| — |
| — |
| 137,527 |
Compass Gás e Energia |
| 3,288,317 |
| 1,650,628 |
| 1,410,507 |
| 34,261 |
| (895,420) |
| 95,000 |
| — |
| — |
| (78) |
| 5,583,215 |
Cosan Investimentos e Participações S.A. (i) |
| 5,836,793 |
| 4,648,043 |
| — |
| (429,696) |
| (1,026,072) |
| — |
| — |
| — |
| (9,029,068) |
| — |
Atlântico Participações Ltda (ii) |
| — |
| 801 |
| — |
| — |
| (191) |
| 433,005 |
| — |
| — |
| — |
| 433,615 |
Cosan Limited Partners Brasil Consultoria Ltda |
| — |
| (196) |
| 171 |
| — |
| — |
| 150 |
| 430 |
| — |
| — |
| 555 |
Sinlog Tecnologia em Logística S.A. |
| — |
| (10,041) |
| 4,964 |
| — |
| — |
| 12,757 |
| 9,372 |
| — |
| — |
| 17,052 |
Cosan Lubes Investment |
| 1,364,608 |
| 205,141 |
| — |
| 30,421 |
| — |
| — |
| — |
| — |
| — |
| 1,600,170 |
Payly Soluções de Pagamentos S.A. |
| 9,071 |
| (4,714) |
| — |
| — |
| — |
| 5,250 |
| — |
| — |
| — |
| 9,607 |
Radar II Propriedades Agrícolas S.A. |
| 33,209 |
| 12,751 |
| — |
| 1,553 |
| (1,854) |
| — |
| — |
| (45,659) |
| — |
| — |
Radar Propriedades Agrícolas S.A. (iii) |
| 62,391 |
| (1,688) |
| — |
| 1,060 |
| (879) |
| — |
| — |
| (19,565) |
| (41,319) |
| — |
Tellus Brasil Participações S.A. |
| 105,662 |
| 39,938 |
| — |
| — |
| (2,805) |
| — |
| — |
| — |
| — |
| 142,795 |
Pasadena Empreendimentos e Participações S.A. |
| 473 |
| (94) |
| — |
| — |
| — |
| 500 |
| — |
| — |
| — |
| 879 |
Janus Brasil Participações S.A. |
| 130,900 |
| 49,235 |
| — |
| — |
| (1,738) |
| 4,959 |
| — |
| — |
| — |
| 183,356 |
Violeta Fundo de Investimento Multimercado (iv) |
| — |
| 17,032 |
| — |
| (1,253) |
| (10,388) |
| — |
| — |
| — |
| 2,113,752 |
| 2,119,143 |
Other |
| 62,260 |
| 24,014 |
| — |
| 3,935 |
| (2,854) |
| 5 |
| — |
| (59,906) |
| 41,314 |
| 68,768 |
Total investments in associates |
| 11,026,580 |
| 6,646,048 |
| 1,322,956 |
| (354,098) |
| (1,953,053) |
| 551,626 |
| 4,595,734 |
| (125,130) |
| (6,923,194) |
| 14,787,469 |
|
|
|
|
|
|
|
|
|
|
|
|
|
|
|
|
|
|
|
|
|
Cosan Luxemburg S.A. |
| (458,852) |
| 102,410 |
| — |
| — |
| — |
| — |
| — |
| — |
| — |
| (356,442) |
Total provision for uncovered liability of associates |
| (458,852) |
| 102,410 |
| — |
| — |
| — |
| — |
| — |
| — |
| — |
| (356,442) |
|
|
|
|
|
|
|
|
|
|
|
|
|
|
|
|
|
|
|
|
|
Total |
| 10,567,728 |
| 6,748,458 |
| 1,322,956 |
| (354,098) |
| (1,953,053) |
| 551,626 |
| 4,595,734 |
| (125,130) |
| (6,923,194) |
| 14,431,027 |
Notes to the financial statements
(In thousands of Brazilian Reais - R$, unless otherwise stated)
| (i) | The balance presented in “others” is resulting from the merger, the balance of CIP as detailed in note 1.2.18. |
| (ii) | The Company has been making contributions to the subsidiary Atlântico to financially support the acquisitions described in Note 1.2.13. |
| (iii) | The management of Radar Propriedades Agrícolas S.A. (“Radar”) carried out a corporate reorganization on April 30, 2021, in order to optimize the operational management and risk management of its assets. The transaction resulted in a partial spin-off of Radar, so that its operating assets and liabilities were partially spun off and transferred to new entities created under the same corporate structure as Cosan S.A., Mansilla and Radar II Propriedades Agrícolas S.A. (“Radar II”) and in the same shareholding participations Radar's corporate investments were also spun off, these assets being merged by the spun-off entities Nova Agrícola Ponta Alta S.A. (“Nova Agrícola Ponta Alta”), Nova Amaralina S.A. Propriedades Agrícolas (“Nova Amaralina”) , Nova Santa Bárbara Agrícola S.A. (“Nova Santa Bárbara”) and Terras da Ponte Alta S.A. (“Terras da Ponte Alta”), resulting in a reclassification of the Company's investments in the amount of R$41,319, shown in the table below. The corporate reorganization took place so that there was no change in the economic participation of the shareholders in these investments. |
| (iv) | The balance presented in “other” results from the contribution of investments as detailed in note 1.2.19. |
Notes to the financial statements
(In thousands of Brazilian Reais - R$, unless otherwise stated)
|
| At January 1, 2020 |
| Interest in earnings (losses) of subsidiaries |
| Sales or purchase of interests |
| Other comprehensive income (loss) |
| Dividends |
| Increase/reduction of capital |
| Other |
| Overdraft liability reclassification |
| At December 31, 2020 |
Comgás |
| 2,861,936 |
| — |
| — |
| — |
| — |
| (2,861,936) |
| — |
| — |
| — |
Compass Gás e Energia |
| — |
| 923,415 |
| 44,569 |
| 58,707 |
| (598,689) |
| 2,861,936 |
| — |
| (1,621) |
| 3,288,317 |
Cosan Global Limited |
| 103,989 |
| 28,907 |
| — |
| — |
| — |
| — |
| — |
| — |
| 132,896 |
Cosan Investimentos e Participações S.A. |
| 5,849,473 |
| 599,038 |
| — |
| (69,948) |
| (367,543) |
| — |
| (174,227) |
| — |
| 5,836,793 |
Cosan Lubes Investment |
| 1,104,567 |
| 104,352 |
| — |
| 155,689 |
| — |
| — |
| — |
| — |
| 1,364,608 |
Payly Soluções de Pagamentos S.A. |
| 7,075 |
| (18,004) |
| — |
| — |
| — |
| 20,000 |
| — |
| — |
| 9,071 |
Radar II Propriedades Agrícolas S.A. |
| 31,980 |
| 1,747 |
| — |
| 45 |
| (563) |
| — |
| — |
| — |
| 33,209 |
Radar Propriedades Agrícolas S.A. |
| 59,880 |
| 3,512 |
| — |
| 232 |
| (1,233) |
| — |
| — |
| — |
| 62,391 |
Tellus Brasil Participações S.A. |
| 102,339 |
| 6,883 |
| — |
| — |
| (3,560) |
| — |
| — |
| — |
| 105,662 |
Janus Brasil Participações S.A. |
| 126,086 |
| 7,591 |
| — |
| — |
| (3,909) |
| 1,132 |
| — |
| — |
| 130,900 |
Pasadena Empreendimentos e Participações S.A. |
| 555 |
| (82) |
| — |
| — |
| — |
| — |
| — |
| — |
| 473 |
Other |
| 51,785 |
| (2,305) |
| — |
| 12,770 |
| — |
| 10 |
| — |
| — |
| 62,260 |
Total investments in associates |
| 10,299,665 |
| 1,655,054 |
| 44,569 |
| 157,495 |
| (975,497) |
| 21,142 |
| (174,227) |
| (1,621) |
| 11,026,580 |
|
|
|
|
|
|
|
|
|
|
|
|
|
|
|
|
|
|
|
Compass Gás e Energia |
| (1,621) |
| — |
| — |
| — |
| — |
| — |
| — |
| 1,621 |
| — |
Cosan Luxemburgo S.A. |
| (151,206) |
| (307,646) |
| — |
| — |
| — |
| — |
| — |
| — |
| (458,852) |
Total provision for uncovered liability of associates |
| (152,827) |
| (307,646) |
| — |
| — |
| — |
| — |
| — |
| 1,621 |
| (458,852) |
|
|
|
|
|
|
|
|
|
|
|
|
|
|
|
|
|
|
|
Total |
| 10,146,838 |
| 1,347,408 |
| 44,569 |
| 157,495 |
| (975,497) |
| 21,142 |
| (174,227) |
| — |
| 10,567,728 |
Financial information of the subsidiaries and associates:
|
| December 31, 2021 |
| December 31, 2020 | ||||||||||||
|
| Assets |
| Liabilities |
| Shareholders' equity |
| Profit in the year |
| Assets |
| Liabilities |
| Shareholders' equity |
| Profit in the year |
Cosan Lubes Investment |
| 3,273,652 |
| (985,797) |
| 2,287,855 |
| 294,758 |
| 2,941,839 |
| (992,338) |
| 1,949,501 |
| 149,446 |
Radar II Propriedades Agrícolas S.A. |
| 4,484,805 |
| (246,600) |
| 4,238,205 |
| 45,003 |
| — |
| — |
| — |
| — |
Comgás |
| 22,729,115 |
| (7,933,694) |
| 14,795,421 |
| 150,538 |
| — |
| — |
| — |
| — |
Cosan Luxembourg S.A. |
| 4,635,332 |
| (4,991,774) |
| (356,442) |
| 102,410 |
| 4,490,706 |
| (4,949,558) |
| (458,852) |
| (307,646) |
Cosan Global |
| 137,527 |
| — |
| 137,527 |
| 4,631 |
| 132,896 |
| — |
| 132,896 |
| 28,907 |
Tellus Brasil Participações Ltda |
| 3,296,499 |
| (502,734) |
| 2,793,765 |
| 782,220 |
| 2,235,872 |
| (169,779) |
| 2,066,093 |
| 134,441 |
Janus Brasil Participações S.A. |
| 4,261,432 |
| (666,361) |
| 3,595,071 |
| 1,048,514 |
| 2,764,440 |
| (197,906) |
| 2,566,534 |
| 143,432 |
Compass Gás e Energia |
| 6,383,318 |
| (38,671) |
| 6,344,647 |
| 1,725,111 |
| 3,342,271 |
| (21,076) |
| 3,321,195 |
| 931,265 |
Notes to the financial statements
(In thousands of Brazilian Reais - R$, unless otherwise stated)
b) Consolidated
|
| Shares issued by the associate |
| Shares held by Cosan |
| Cosan ownership interest |
| Economic benefit (%) (i) |
Tellus Brasil Participações S.A. |
| 120,920,515 |
| 61,359,623 |
| 50.74% |
| 5.00% |
Janus Brasil Participações S.A. |
| 229,689,888 |
| 116,620,166 |
| 50.77% |
| 5.00% |
Rhall Terminais Ltda |
| 28,580 |
| 8,574 |
| 30.00% |
| 30.00% |
Termag - Terminal Marítimo de Guarujá S.A. |
| 500,000 |
| 99,246 |
| 19.85% |
| 19.85% |
TGG - Terminal de Granéis do Guarujá S.A. |
| 79,747,000 |
| 7,914,609 |
| 9.92% |
| 9.92% |
Terminal XXXIX S.A. |
| 200,000 |
| 99,246 |
| 49.62% |
| 49.62% |
TUP Porto São Luis S.A. |
| 42,635,878 |
| 20,891,583 |
| 49.00% |
| 49.00% |
| (i) | The Company has no significant influence, justifying the criteria to define the measurement of the retained portion of the investment using the equity method, although it does not consolidate due to the shareholders' agreement that inhibits its decision making. |
|
| At January 1, 2021 |
| Interest in earnings of subsidiaries |
| Other comprehensive income (loss) |
| Dividends |
| Capital increase |
| Merged assets, net (note 1.1) |
| Business combination (note 8.2.1) |
| Other |
| At December 31, 2021 |
Tellus Brasil Participações S.A. |
| 105,665 |
| 39,938 |
| — |
| (2,805) |
| — |
| — |
| — |
| — |
| 142,798 |
Janus Brasil Participações S.A. |
| 130,901 |
| 49,235 |
| — |
| (1,738) |
| 4,959 |
| — |
| — |
| — |
| 183,357 |
Radar Propriedades Agrícolas S.A |
| 62,372 |
| (1,688) |
| 1,060 |
| (879) |
| — |
| — |
| (19,565) |
| (41,300) |
| — |
Radar II Propriedades Agrícolas S.A |
| 33,205 |
| 12,751 |
| 1,553 |
| (1,854) |
| — |
| — |
| (45,659) |
| 4 |
| — |
Rhall Terminais Ltda |
| — |
| 1,311 |
| — |
| (1) |
| — |
| 3,597 |
| — |
| — |
| 4,907 |
Termag - Terminal Marítimo de Guarujá S.A. |
| — |
| 1,850 |
| — |
| — |
| — |
| 3,632 |
| — |
| (757) |
| 4,725 |
TGG - Terminal de Granéis do Guarujá S.A. |
| — |
| 3,967 |
| — |
| (3,143) |
| — |
| 16,739 |
| — |
| — |
| 17,563 |
Terminal XXXIX S.A. |
| — |
| 4,664 |
| — |
| — |
| — |
| 25,985 |
| — |
| — |
| 30,649 |
TUP Porto São Luis S.A. |
| — |
| 801 |
| — |
| — |
| 393,579 |
| — |
| — |
| — |
| 394,380 |
Other |
| 1,562 |
| 16,330 |
| 5,243 |
| (2,854) |
| — |
| — |
| (59,906) |
| 41,313 |
| 1,688 |
|
| 333,705 |
| 129,159 |
| 7,856 |
| (13,274) |
| 398,538 |
| 49,953 |
| (125,130) |
| (740) |
| 780,067 |
Notes to the financial statements
(In thousands of Brazilian Reais - R$, unless otherwise stated)
|
| At January 1, 2020 |
| Interest in earnings of subsidiaries |
| Other comprehensive income (loss) |
| Dividends |
| Capital increase |
| Other |
| At December 31, 2020 |
Tellus Brasil Participações S.A. |
| 102,342 |
| 6,883 |
| — |
| (3,560) |
| — |
| — |
| 105,665 |
Janus Brasil Participações S.A. |
| 126,087 |
| 7,591 |
| — |
| (3,909) |
| 1,132 |
| — |
| 130,901 |
Radar Propriedades Agrícolas S.A |
| 59,861 |
| 3,512 |
| 232 |
| (1,233) |
| — |
| — |
| 62,372 |
Radar II Propriedades Agrícolas S.A |
| 31,976 |
| 1,747 |
| 45 |
| (563) |
| — |
| — |
| 33,205 |
Other |
| 5,429 |
| (4,019) |
| (37) |
| — |
| 10 |
| 179 |
| 1,562 |
|
| 325,695 |
| 15,714 |
| 240 |
| (9,265) |
| 1,142 |
| 179 |
| 333,705 |
Financial information of the subsidiaries and associates:
|
| December 31, 2021 |
| December 31, 2020 | ||||||||||||
|
| Assets |
| Liabilities |
| Shareholders' equity |
| Profit in the year |
| Assets |
| Liabilities |
| Shareholders' equity |
| Profit in the year |
Tellus Brasil Participações Ltda |
| 3,296,499 |
| (502,734) |
| 2,793,765 |
| 782,220 |
| 2,235,872 |
| (169,779) |
| 2,066,093 |
| 134,441 |
Janus Brasil Participações S.A. |
| 4,261,432 |
| (666,361) |
| 3,595,071 |
| 1,048,514 |
| 2,764,440 |
| (197,906) |
| 2,566,534 |
| 143,432 |
Rhall Terminais Ltda |
| 31,068 |
| (14,708) |
| 16,360 |
| 4,073 |
| — |
| — |
| — |
| — |
Termag - Terminal Marítimo de Guarujá S.A. |
| 276,284 |
| (252,483) |
| 23,801 |
| 11,726 |
| — |
| — |
| — |
| — |
TGG - Terminal de Granéis do Guarujá S.A. |
| 253,310 |
| (76,257) |
| 177,053 |
| 37,150 |
| — |
| — |
| — |
| — |
Terminal XXXIX S.A. |
| 335,511 |
| (273,747) |
| 61,764 |
| 10,075 |
| — |
| — |
| — |
| — |
TUP Porto São Luis S.A. |
| 455,437 |
| (67,523) |
| 387,914 |
| (7,410) |
| — |
| — |
| — |
| — |
Notes to the financial statements
(In thousands of Brazilian Reais - R$, unless otherwise stated)
8.2 Acquisition of subsidiaries
Accounting policy Business combinations are accounted for using the acquisition method. The consideration transferred in the acquisition is generally measured at fair value, as well as the identifiable net assets acquired and liabilities assumed. Any goodwill that arises is tested for impairment annually. Transaction costs are recorded as incurred in the income statement, except if related to the issuance of debt or equity.
For each business combination, the Company chooses to measure any non-controlling interests in the acquisition:
The consideration transferred does not include amounts related to the settlement of pre-existing relationships. These amounts are generally recognized in the income statement.
Contingent consideration depends on whether an acquired business achieves goals within a fixed period. Estimates of future performance are required to calculate obligations at the time of acquisition and on each subsequent reporting date. In addition, estimates are necessary to assess the assets and liabilities acquired in business combinations. Intangible assets, such as brands, are commonly an essential part of an acquired business, as they allow us to obtain more value than would otherwise be possible.
Measurement of fair values In measuring fair values, valuation techniques were used considering market prices for similar items, discounted cash flow, among others. Since it is a preliminary measurement of fair value, if new information obtained within one year, counting from the acquisition date, about the facts and circumstances that existed on the acquisition date, indicate adjustments in the values mentioned above, or any additional provision that existed on the acquisition date, the acquisition accounting will be revisited. Management's expectation is that only measurements of intangibles could have any impact in relation to this preliminary assessment. |
Notes to the financial statements
(In thousands of Brazilian Reais - R$, unless otherwise stated)
8.2.1 Radar
On November 3, 2021, Cosan acquired a 47% equity interest in agricultural property management companies (“Radar Group” or “Acquired”), increasing from 3% to 50%, as shown below:
Acquired name | Interest acquired | Final participation | |
Direct | Indirect | ||
Radar Propriedades Agrícolas S.A. | 38.94% | 8.06% | 50.00% |
Radar II Propriedades Agrícolas S.A. | 47.00% | - | 50.00% |
Nova Agrícola Ponte Alta S.A. | 38.94% | 8.06% | 50.00% |
Nova Amaralina S.A Propriedades Agrícolas | 38.94% | 8.06% | 50.00% |
Nova Santa Bárbara Agrícola S.A. | 38.94% | 8.06% | 50.00% |
Terras da Ponta Alta S.A. | 38.94% | 8.06% | 50.00% |
Castanheira Propriedades Agrícolas S.A. | 38.94% | 8.06% | 50.00% |
Manacá Propriedades Agrícolas S.A. | 38.94% | 8.06% | 50.00% |
Paineira Propriedades Agrícolas S.A. | 38.94% | 8.06% | 50.00% |
Pursuant to the Shareholders' Agreement, Cosan has the majority of votes in matters of the Executive Board, as well as the power to decide on the activities of the Companies of the Radar Group and, therefore, holds control. The equity interest immediately prior to the acquisition in the Companies of the Radar Group was measured at fair value on the transaction date, therefore, no adjustment was made.
Notes to the financial statements
(In thousands of Brazilian Reais - R$, unless otherwise stated)
The acquired companies are managers of agricultural properties, with the capacity to invest in assets with high productive potential in Brazil. This transaction is in line with Cosan's capital allocation strategy, reinforcing the Company's commitment to the development of Brazilian agribusiness and the creation of value for its stakeholders.
In consideration for the percentage acquired, the price paid for the transaction totaled R$1,572,352, of which R$1,479,404 refers to the principal and R$92,948 to the adjustment of the installments by the IPCA. The consideration will be paid in 4 installments, with the first installment being paid on the 3th of November 2021, in the amount of R$601,856 and the other annual installments of R$295,881, adjusted by the IPCA, with final maturity in September 2024.
The Company, through independent consultants, assessed the fair value of all assets acquired and liabilities assumed in the opening balance sheet. Based on this assessment, no differences were identified between fair value and book value.
On the acquisition date, the consolidated shareholders' equity of the Acquired Companies was R$4,231,107 and its capital stock was composed of two shareholders: Cosan (parent company) and Mansilla (non-parent company). The value of the non-controlling interest is shown below considering Mansilla's proportional interest in the acquiree's assets, which is at fair value.
|
| Participation |
| Shareholders' equity attributable to non-controlling interests |
Mansilla Participações Ltda. |
| 50% |
| 2,115,554 |
a) Identifiable assets acquired and liabilities assumed
The fair value of the assets and liabilities acquired is shown below:
Notes to the financial statements
(In thousands of Brazilian Reais - R$, unless otherwise stated)
| Radar Group |
Cash and cash equivalents | 9,123 |
Marketable securities | 38,675 |
Accounts receivable from customers | 194,715 |
Receivables from related parties | 16,780 |
Taxes to recover | 1,083 |
Other assets | 1,099 |
Deferred income tax and social contribution | 44 |
Judicial deposits | 279 |
Other financial assets | 318,445 |
Investment properties | 3,875,752 |
Fixed assets | 33 |
Right of use | 3,240 |
Trade payable | (992) |
Taxes payable | (11,443) |
Related parts | (2,504) |
Lease | (3,281) |
Advance from customers | (41) |
Other obligations | (16,738) |
Deferred income tax and social contribution | (192,883) |
Provision for contingencies | (279) |
Total net identifiable assets at fair value | 4,231,107 |
Since the acquisition date, the acquired companies contributed to the Company with revenues of R$31,502 and income before taxes of R$49,218. If the business combination had taken place at the beginning of the year, Cosan's revenues would have totaled R$25,221,786, and the profit for the year would have been R$7,744,023.
b) Gain from bargain purchase
The transaction price paid was lower than the shareholders' equity of the acquired companies, generating a gain on bargain purchase shown in the following table:
Transferred consideration | 1,572,352 |
Non-controlling interest measured at fair value | 2,115,554 |
Fair value of Radar's Group pre-existing stake | 126,933 |
Total net identifiable assets at fair value | (4,231,107) |
Earned by bargain purchase | (416,268) |
Notes to the financial statements
(In thousands of Brazilian Reais - R$, unless otherwise stated)
The bargain purchase gain was fiscally realized on December 1, 2021, due to the capital contribution of the investment to FIP Verde Pinho. The Company added the amount to its income tax and social contribution tax base. However, it did not generate a balance of tax payable as there was an accumulated balance of tax losses and a negative basis for CSLL in the current year that absorbed this gain.
8.2.2 Compass
On January 30. 2020. the subsidiary Cosan completed the acquisition of 100% of the capital of the following companies:
Acquired name | Description of the operation | |
Compass Comercializadora de Energia Ltda | Natural gas and electricity trading | |
Compass Geração Ltda | Natural gas and electricity trading | |
Compass Energia Ltda | No operation | |
Black River Participações Ltda | No operation |
Accurate and reliable estimates of the purchase price were made to determine the amount of goodwill paid on the transaction. Goodwill is the difference between the value of the net assets acquired and the price paid for the shares.
The Company, through independent consultants, estimated the fair value of all assets and liabilities of the acquisition date including fixed assets customer portfolios brands and possibly long-term loans. No material differences were identified between fair value and book value and the net price paid was fully allocated to goodwill.
The balances of the acquired entities comprise assets and liabilities measured at fair value and therefore no adjustments to fair value and accounting policies were made.
- Identifiable assets acquired and liabilities assumed
Notes to the financial statements
(In thousands of Brazilian Reais - R$, unless otherwise stated)
The fair value of the assets and liabilities acquired is shown below:
|
| Compass Comercializadora |
| Compass Geração |
| Compass Energia |
| Total |
Cash and cash equivalents | 4.539 | 177 | 37 | 4.753 | ||||
Trade receivables | 12.384 | 149.163 | - | 161.547 | ||||
Advance of suppliers | 15 | - | - | 15 | ||||
Other current tax receivable | 134 | 89 | 31 | 54 | ||||
Derivative financial instruments | 1.377 | - | - | 1.377 | ||||
Investments in associates | 9 | 28 | - | 37 | ||||
Property. plant and equipment | 69 | - | - | 69 | ||||
Trade payables | (13.585) | (83.669) | - | (97.254) | ||||
Other taxes payable | - | (162) | - | (162) | ||||
Other current liabilities | (97) | - | - | (97) | ||||
Other financial liabilities | - | (48.007) | - | (48.007) | ||||
Dividends payable | - | (508) | - | (508) | ||||
Payables to related parties | - | (17.063) | - | (17.063) | ||||
Deferred tax liabilities | (468) | - | - | (468) | ||||
Total identifiable assets, net | 4.377 | 48 | 68 | 4.493 |
- Goodwill
The fair value on the date of acquisition of goodwill consisted of the following:
| Total |
Consideration transferred (i) | 99,385 |
Total net assets acquired and liabilities assumed at fair value | 4,493 |
Goodwill | 94,892 |
(i) Consideration transferred net of acquired cash R$ 94,631.
Information obtained about facts and circumstances existing on the acquisition date may result in adjustments to the allocation of goodwill. The goodwill of R$94,892 comprises the amount of future economic benefits from the acquisition.
Goodwill represents the portion of the purchase price greater than the sum of the net fair value of all assets acquired in the acquisition and liabilities assumed in the process. The useful life of the goodwill is indefinite and the balance of this asset is evaluated annually by the Company. or when there is an indication of impairment using the discounted cash flow method.
Notes to the financial statements
(In thousands of Brazilian Reais - R$, unless otherwise stated)
| Nature |
| Evaluation methodology | Fair value | Useful life | |
Goodwill | Represent the portion of the purchase price that is higher than the sum of the net fair value all of the assets purchased in the acquisition and the liabilities assumed in the process. | Discounted cash flow | 94.892 |
| Indefinite | |
If the acquired subsidiaries had been consolidated since January 1, 2020, the consolidated statement of income for the year ended on December 31, 2020, would have net income of R$13,660,394 and net profit of R$903,166.
8.3 Non-controlling interests in subsidiaries
Accounting policy Transactions with non-controlling interests that do not result in loss of control are accounted for as equity transactions – that is. as transactions with the owners in their capacity as owners. |
Set out below is summarized financial information for each subsidiary that has non-controlling interests that are material to the group. The amounts disclosed for each subsidiary are before inter-company elimination.
| Shares issued by the subsidiary |
| Shares held by non-controlling shareholders |
| Non-controlling interest |
Compass Gás e Energia | 714,190,095 |
| 85,702,404 |
| 12.00% |
Comgás | 132,520,587 |
| 1,139,210 |
| 0.86% |
Cosan Lubes | 34,963,764 |
| 10,489,129 |
| 30.00% |
Payly Soluções de Pagamentos S.A. | 78,527,201 |
| 19,631,324 |
| 25.00% |
Rumo S.A. | 1,854,158,791 |
| 1,291,629,301 |
| 69.65% |
Cosan Limited Partners Brasil Consultoria Ltda | 160,000 |
| 4,000 |
| 2.50% |
Sinlog Tecnologia em Logística S.A. | 86,370 |
| 23,967 |
| 27.75% |
TTA – SAS Techniques et Technologie Appliquées (i) | 10,521 |
| - |
| - |
Radar II Propriedades Agrícolas S.A. | 81,440,221 |
| 40,720,111 |
| 50.00% |
Radar Propriedades Agrícolas S.A. | 1,266,986 |
| 633,493 |
| 50.00% |
Nova Agrícola Ponte Alta S.A. | 160,693,378 |
| 80,346,689 |
| 50.00% |
Terras da Ponte Alta S.A. | 16,066,329 |
| 8,033,165 |
| 50.00% |
Nova Santa Bárbara Agrícola S.A. | 32,336,994 |
| 16,168,497 |
| 50.00% |
Nova Amaralina S.A. | 30,603,159 |
| 15,301,580 |
| 50.00% |
Paineira Propriedades Agrícolas S.A. | 132,667,061 |
| 66,333,531 |
| 50.00% |
Manacá Propriedades Agrícolas S.A. | 128,977,921 |
| 64,488,961 |
| 50.00% |
Castanheira Propriedades Agrícolas S.A. | 83,850,838 |
| 41,925,419 |
| 50.00% |
(i) Acquisition of non-controlling interests. as described in Note 8.1. item (iv).
The following table summarizes the information relating to each of the Company’s subsidiaries that has material non-controlling interests before any intra-group elimination.
Notes to the financial statements
(In thousands of Brazilian Reais - R$, unless otherwise stated)
| At January 1, 2021 | Interest in earnings of subsidiaries | Sales or purchase of interests | Other comprehensive income (loss) | Dividends | Capital increase | Merged assets, net (note 1.1) | Other | At December 31, 2021 | |||||||||
Comgás | 24,729 |
| 17,524 |
| — |
| 625 |
| (14,184) |
| — |
| — |
| (228) |
| 28,466 |
Compass Gás e Energia (i) | 32,880 |
| 74,390 |
| (1,505,311) |
| 7,698 |
| (97,187) |
| 2,250,015 |
| — |
| (1,053) |
| 761,432 |
Rumo S.A. | — |
| 28,534 |
| (318,323) |
| 905 |
| (31,231) |
| — |
| 10,831,204 |
| 16,688 |
| 10,527,777 |
Sinlog Tecnologia em Logística S.A. | — |
| (3,539) |
| 4,904 |
| — |
| — |
| 541 |
| 4,643 |
| — |
| 6,549 |
Cosan Limited Partners Brasil | — |
| (104) |
| (169) |
| — |
| — |
| — |
| 287 |
| — |
| 14 |
Cosan Lubes | 582,283 |
| 87,823 |
| — |
| 13,037 |
| — |
| — |
| — |
| — |
| 683,143 |
TTA | 15,834 |
| 2,001 |
| (16,822) |
| (1,013) |
| — |
| — |
| — |
| — |
| — |
Payly | 2,423 |
| (1,571) |
| — |
| — |
| — |
| 1,750 |
| — |
| — |
| 2,602 |
Violeta Fundo de Investimento Multimercado (Note 8.2.1) | — |
| 22,502 |
| — |
| 900 |
| (19,854) |
| — |
| — |
| 2,115,554 |
| 2,119,102 |
| 658,149 |
| 227,560 |
| (1,835,721) |
| 22,152 |
| (162,456) |
| 2,252,306 |
| 10,836,134 |
| 2,130,961 |
| 14,129,085 |
(i) Sales of interest, as described in Note 8.1, item (i).
| At January 1, 2020 |
| Interest in earnings of subsidiaries |
| Sales or purchase of interests |
| Other comprehensive income |
| Dividends |
|
Capital increase / (decrease) |
| Other |
| At December 31, 2020 |
Comgás | 24,569 |
| 9,200 |
| — |
| 484 |
| (9,535) |
| — |
| 11 |
| 24,729 |
Compass Gás e Energia (i) | — |
| 7,848 |
| 30,431 |
| 552 |
| (5,986) |
| — |
| 35 |
| 32,880 |
CLI | 470,497 |
| 44,816 |
| — |
| 66,970 |
| — |
| — |
| — |
| 582,283 |
TTA | 10,057 |
| 1,694 |
| — |
| 4,083 |
| — |
| — |
| — |
| 15,834 |
Payly | 2,359 |
| (6,602) |
| — |
| — |
| — |
| 6,666 |
| — |
| 2,423 |
| 507,482 |
| 56,956 |
| 30,431 |
| 72,089 |
| (15,521) |
| 6,666 |
| 46 |
| 658,149 |
Notes to the financial statements
(In thousands of Brazilian Reais - R$, unless otherwise stated)
Summarized statement of financial position:
| Compass |
| Comgás |
| CLI |
| Rumo |
| Cosan Investimentos | ||||||||||
| December 31, 2021 |
| December 31, 2020 |
| December 31, 2021 |
| December 31, 2020 |
| December 31, 2021 |
| December 31, 2020 |
| December 31, 2021 |
| December 31, 2020 |
| December 31, 2021 |
| December 31, 2020 |
Current |
|
|
|
|
|
|
|
|
|
|
|
|
|
|
|
|
|
|
|
Assets | 1,929,639 |
| 397,678 |
| 4,148,735 |
| 4,225,788 |
| 1,327,472 |
| 1,047,938 |
| 1,161,027 |
| — |
| 147,662 |
| — |
Liabilities | (28,374) |
| (21,076) |
| (4,538,385) |
| (3,610,144) |
| (755,995) |
| (616,427) |
| (760,522) |
| — |
| (50,038) |
| — |
Net current assets | 1,901,265 |
| 376,602 |
| (389,650) |
| 615,644 |
| 571,477 |
| 431,511 |
| 400,505 |
| — |
| 97,624 |
| — |
|
|
|
|
|
|
|
|
|
|
|
|
|
|
|
|
|
|
|
|
Non-current |
|
|
|
|
|
|
|
|
|
|
|
|
|
|
|
|
|
|
|
Assets | 4,453,679 |
| 2,944,593 |
| 8,122,763 |
| 9,855,557 |
| 1,946,181 |
| 1,893,901 |
| 21,568,088 |
| — |
| 4,337,142 |
| — |
Liabilities | (10,296) |
| — |
| (6,627,895) |
| (7,594,604) |
| (229,802) |
| (360,077) |
| (7,173,172) |
| — |
| (196,562) |
| — |
Net non-current assets | 4,443,383 |
| 2,944,593 |
| 1,494,868 |
| 2,260,953 |
| 1,716,379 |
| 1,533,824 |
| 14,394,916 |
| — |
| 4,140,580 |
| — |
|
|
|
|
|
|
|
|
|
|
|
|
|
|
|
|
|
|
|
|
Equity | 6,344,648 |
| 3,321,195 |
| 1,105,218 |
| 2,876,597 |
| 2,287,856 |
| 1,965,335 |
| 14,795,421 |
| — |
| 4,238,204 |
| — |
Summarized statement of profit or loss and other comprehensive income:
| Compass |
| Comgás |
| CLI |
| Rumo |
| Cosan Investimentos | ||||||||||
| December 31, 2021 |
| December 31, 2020 |
| December 31, 2021 |
| December 31, 2020 |
| December 31, 2021 |
| December 31, 2020 |
| December 31, 2021 |
| December 31, 2020 |
| December 31, 2021 |
| December 31, 2020 |
Net sales | — |
| — |
| 11,709,713 |
| 8,317,691 |
| 2,608,680 |
| 1,911,541 |
| 772,714 |
| — |
| 31,502 |
| — |
Profit before taxes | 1,710,947 |
| 920,426 |
| 2,274,269 |
| 1,597,960 |
| 310,500 |
| 150,930 |
| 198,239 |
| — |
| 49,218 |
| — |
Income tax expenses | 14,164 |
| 10,839 |
| (155,148) |
| (527,812) |
| (15,742) |
| (1,484) |
| (47,701) |
| — |
| (4,215) |
| — |
Profit for the year | 1,725,111 |
| 931,265 |
| 2,119,121 |
| 1,070,148 |
| 294,758 |
| 149,446 |
| 150,538 |
| — |
| 45,003 |
| — |
Other comprehensive income (loss) | — |
| — |
| — |
| — |
| — |
| — |
| — |
| — |
| — |
| — |
Total comprehensive income | 1,725,111 |
| 931,265 |
| 2,119,121 |
| 1,070,148 |
| 294,758 |
| 149,446 |
| 150,538 |
| — |
| 45,003 |
| — |
|
|
|
|
|
|
|
|
|
|
|
|
|
|
|
|
|
|
|
|
Comprehensive income attributable to non-controlling interests | 207,012 |
| 111,751 |
| 18,217 |
| 9,200 |
| 88,427 |
| 44,834 |
| 104,850 |
| — |
| 22,502 |
| — |
Dividends paid | 982,752 |
| 600,000 |
| 1,649,653 |
| 1,135,669 |
| — |
| — |
| — |
| — |
| — |
| — |
Notes to the financial statements
(In thousands of Brazilian Reais - R$, unless otherwise stated)
Summarized statements of cash flows:
| Compass |
| Comgás |
| CLI |
| Rumo |
| Cosan Investimentos | ||||||||||
| December 31, 2021 |
| December 31, 2020 |
| December 31, 2021 |
| December 31, 2020 |
| December 31, 2021 |
| December 31, 2020 |
| December 31, 2021 |
| December 31, 2020 |
| December 31, 2021 |
| December 31, 2020 |
Net cash (used in) generated operating activities | (44,974) |
| (18,045) |
| 2,539,222 |
| 2,111,551 |
| 95,461 |
| 71,654 |
| (15,679) |
| — |
| 21,690 |
| — |
Net cash (used in) generated investing activities | (26,764) |
| 776,872 |
| (1,025,104) |
| (1,768,298) |
| 77,742 |
| (38,910) |
| (1,469,750) |
| — |
| 49,227 |
| — |
Net cash generated (used in) financing activities | 1,265,679 |
| (525,030) |
| (2,202,275) |
| 198,890 |
| (13,766) |
| 14,874 |
| 714,115 |
| — |
| (15,650) |
| — |
Increase (decrease) cash and cash equivalents | 1,193,941 |
| 233,797 |
| (688,157) |
| 542,143 |
| 159,437 |
| 47,618 |
| (771,314) |
| — |
| 55,267 |
| — |
|
|
|
|
|
|
|
|
|
|
|
|
|
|
|
|
|
|
|
|
Cash and cash equivalents at the beginning of year | 232,819 |
| 4 |
| 1,610,548 |
| 1,083,410 |
| 492,619 |
| 319,733 |
| 1,568,667 |
| — |
| — |
| — |
Effect of exchange rate fluctuations on cash held | (13,898) |
| (982) |
| (30,741) |
| (15,005) |
| 109,642 |
| 125,268 |
| (5,551) |
| — |
| — |
| — |
Cash and cash equivalents at the end of year | 1,412,862 |
| 232,819 |
| 891,650 |
| 1,610,548 |
| 761,698 |
| 492,619 |
| 791,802 |
| — |
| 55,267 |
| — |
Notes to the financial statements
(In thousands of Brazilian Reais - R$, unless otherwise stated)
9 Investment in joint venture
Accounting policy A joint venture is a joint arrangement whereby the parties that have joint control of the arrangement have rights to the net assets of the arrangement.
The Company’s investment in joint venture is stated in the statement of financial position at the Company’s share of net assets under the equity method of accounting, less any impairment losses. If applicable, adjustments are made to bring into line any dissimilar accounting policies that may exist. The Company’s share of the results and reserves of joint venture is included in the statement of profit or loss, other comprehensive income and changes in equity, respectively. Unrealized gains and losses resulting from transactions between the Company and it joint venture is eliminated to the extent of the Company investment in the joint venture, except where unrealized losses provide evidence of an impairment of the asset transferred. Goodwill arising from the acquisition of joint venture is included as part of the Company’s investment in joint venture and, when necessary, the entire carrying amount of the investment (including goodwill) is tested for impairment in accordance with CPC 01 / IAS 36 Impairment of Assets as a single asset by comparing its recoverable amount (higher of value in use and fair value less costs of disposal) with it carrying amount.
The Company’s investment in joint venture is treated as non-current assets and are stated at cost less any impairment losses.
When an investment in a joint venture is classified as held for sale, it is accounted for in accordance with CPC 31 / IFRS 5 Non-current Assets Held for Sale and Discontinued Operations. |
Notes to the financial statements
(In thousands of Brazilian Reais - R$, unless otherwise stated)
Changes to investment in joint venture were as follows:
Before the reorganization |
|
|
| ||||
| Raízen Combustíveis S.A. |
| Raízen Energia S.A. |
| Reorganization (Note 1.2.8) |
| Raízen S.A. |
Shares issued by the joint venture | 1,661,418,472 |
| 7,243,283,198 |
| 1,447,807,814 |
| 10,352,509,484 |
Shares held by Cosan | 830,709,236 |
| 3,621,641,599 |
| 105,246,282 |
| 4,557,597,117 |
Cosan ownership interest | 50% |
| 50% |
| -6% |
| 44.02% |
|
|
|
|
|
|
|
|
At January 1, 2020 | 3,212,601 |
| 4,336,359 |
| — |
| 7,548,960 |
Interest in earnings of joint ventures | 332,240 |
| 250,761 |
| — |
| 583,001 |
Other comprehensive (losses) income | 376,053 |
| (446,001) |
| — |
| (69,948) |
Interest on capital | (73,388) |
| — |
| — |
| (73,388) |
Dividends | — |
| (417) |
| — |
| (417) |
At December 31, 2020 | 3,847,506 |
| 4,140,702 |
| — |
| 7,988,208 |
Interest in earnings of joint ventures (i) | 448,124 |
| (72,609) |
| 4,215,116 |
| 4,590,631 |
Other comprehensive (losses) income | 215,787 |
| (491,548) |
| (73,416) |
| (349,177) |
Interest on capital (ii) | (100,318) |
| — |
| (122,480) |
| (222,798) |
Corporate reorganization (Note 1.2.8) | — |
| (3,204,832) |
| 3,204,832 |
| — |
Dividends (ii) | (716,230) |
| (371,713) |
| 17,742 |
| (1,070,201) |
At December 31, 2021 | 3,694,869 |
| — |
| 7,241,794 |
| 10,936,663 |
| (i) | As disclosed in Notes 1.2.9 and 1.2.10, the conclusion of Raízen's IPO and the acquisition of Biosev resulted in two capitalizations in Raízen's equity of R$6,599,987 and R$2,347,281, respectively. Such capitalizations resulted in a dilution of Cosan S.A.'s interest in Raízen without the loss of shared control, keeping the investment classified as a joint venture and, therefore, all resulting gains and losses were recognized in income for the period, as shown below: |
Reduction on previously held interest | (896,817) |
Subscribed cash interest at the IPO | 2,929,872 |
Exercise of subscription bonus - Hédera | 1,043,347 |
Other comprehensive income * | (82,243) |
Gain on dilution | 2,994,159 |
Profit for the year | 1,596,472 |
Interest in earnings | 4,590,631 |
* Reclassification as part of the partial disposal.
(ii) Proposed amount in the period, of which R$819,729 were paid.
According to the terms of the joint venture, the Company is responsible for certain legal proceedings that existed before the formation of Raizen, net of judicial deposits on April 1, 2011, as well as tax installments under the terms of the tax amnesty and Refinancing Program recorded in “Other taxes payable”. In addition, Cosan granted Raizen access to a credit line (stand-by) in the amount of U.S.$350,000 thousand, unused on December 31, 2021.
Notes to the financial statements
(In thousands of Brazilian Reais - R$, unless otherwise stated)
The statement of financial position and statement of profit or loss of the joint venture are disclosed in Note 4 – Segment information.
As of December 31, 2021, the Company was in compliance with the covenants of the contracts that govern the respective joint venture.
10 Property, plant and equipment, intangible assets, goodwill and contract asset
Accounting policy Reduction to recoverable value The recoverable amount is determined based on calculations of the value in use, using the discounted cash flow determined by Management based on budgets that take into account the assumptions related to each business, using information available in the market and previous performance. Discounted cash flows were drawn up over a ten-year period and carried forward in perpetuity without considering a real growth rate. Management understands the use of periods longer than five years in the preparation of discounted cash flows is appropriate for purposes of calculating the recoverable amount, as it reflects the estimated time of use of the asset and the business groups.
The Company performs annually a review of impairment indicators for intangible assets with defined useful lives, property, plant and equipment and right-of-use assets. Also, an impairment test is undertaken for goodwill and intangible assets with indefinite useful lives. Impairment exists when the carrying value of an asset or cash generating unit exceeds its recoverable amount, which is the higher of its fair value less costs to sell and its value in use.
Assumptions used in discounted cash flow projections – estimates of future business performance, cash generation, long term growth and discount rates are used in our assessment of impairment of assets at the statement of financial position date. No reasonably plausible change to a key assumption would cause harm. The main assumptions used to determine the recoverable value of the different cash-generating units to which goodwill is allocated are explained below. |
Notes to the financial statements
(In thousands of Brazilian Reais - R$, unless otherwise stated)
10.1 Property, plant and equipment
Accounting policy Recognition and measurement Items of property, plant and equipment are measured at cost less accumulated depreciation and any accumulated impairment losses.
Subsequent expenditure is capitalized only when it is probable that the future economic benefits associated with the expenditure will flow to the Company. Ongoing repairs and maintenance are expensed as incurred. They are depreciated from the date they are available for use or, in respect of constructed assets, from the date that the asset is completed and ready for use.
Depreciation is calculated on the carrying value of property, plant and equipment less their estimated residual values using the straight-line basis over their estimated useful lives, recognized in profit or loss, unless it is capitalized as part of the cost of another asset. Land is not depreciated.
Depreciation methods, such as useful lives and residual values, are reviewed at the end of each year, or when there is a significant change without an expected consumption pattern, such as a relevant incident and technical obsolescence. Any adjustments are recognized as changes in accounting estimates, if appropriate.
The long duration of useful life calculated linearly over the calculated useful life, as follows: Buildings and improvements 4% - 5% Machinery, equipment and installations 8% - 11% Other 10% - 20% Wagons 2.9% - 6% Locomotives 3.3% - 8% Permanent ways 3% - 4% Furniture and utensils 10% - 15% Computer equipment 20% |
115Notes to the financial statements
(In thousands of Brazilian Reais - R$, unless otherwise stated)
a) Reconciliation of carrying amount
| Consolidated |
| Parent Company | ||||||||||||
| Land, buildings and improvements |
| Machinery, equipment and facilities |
| Railcars and locomotives (i) | (iii) |
| Permanent easement (iii) |
| Construction in progress |
| Other |
| Total |
| Total |
Cost |
|
|
|
|
|
|
|
|
|
|
|
|
|
|
|
At January 1, 2020 | 232,787 |
| 201,787 |
| — |
| — |
| 30,162 |
| 97,070 |
| 561,806 |
| 71,181 |
Additions | — |
| 1,669 |
| — |
| — |
| 52,713 |
| 1,048 |
| 55,430 |
| 10,480 |
Disposals | (64) |
| (2,113) |
| — |
| — |
| — |
| (3,023) |
| (5,200) |
| (132) |
Transfers (iii) | 8,785 |
| 58,065 |
| — |
| — |
| (30,092) |
| 23,521 |
| 60,279 |
| — |
Effect of exchange rate fluctuations | 20,934 |
| 30,444 |
| — |
| — |
| 640 |
| 17,235 |
| 69,253 |
| — |
At December 31, 2020 | 262,442 |
| 289,852 |
| — |
| — |
| 53,423 |
| 135,851 |
| 741,568 |
| 81,529 |
Corporate reorganization (Note 1.1) | 1,357,217 |
| 1,152,944 |
| 6,720,454 |
| 7,530,328 |
| 3,146,532 |
| 374,622 |
| 20,282,097 |
| 4,073 |
Business combination (Note 8.2.1) | — |
| — |
| — |
| — |
| — |
| 41 |
| 41 |
| — |
Additions | 265 |
| 7,678 |
| 743 |
| 6,501 |
| 3,253,054 |
| 797 |
| 3,269,038 |
| 3,175 |
Disposals | (81) |
| (36,189) |
| (111,092) |
| (758) |
| — |
| (86,027) |
| (234,147) |
| (1,721) |
Transfers (ii) | 375,660 |
| 552,617 |
| 1,128,784 |
| 1,218,930 |
| (3,208,495) |
| 12,812 |
| 80,308 |
| (5,650) |
Effect of exchange rate fluctuations | 5,662 |
| 7,712 |
| — |
| — |
| 139 |
| 3,646 |
| 17,159 |
| — |
At December 31, 2021 | 2,001,165 |
| 1,974,614 |
| 7,738,889 |
| 8,755,001 |
| 3,244,653 |
| 441,742 |
| 24,156,064 |
| 81,406 |
|
|
|
|
|
|
|
|
|
|
|
|
|
|
|
|
Depreciation |
|
|
|
|
|
|
|
|
|
|
|
|
|
|
|
At January 1, 2020 | (70,597) |
| (88,281) |
| — |
| — |
| — |
| (22,891) |
| (181,769) |
| (13,865) |
Additions | (16,001) |
| (21,601) |
| — |
| — |
| — |
| (12,112) |
| (49,714) |
| (6,241) |
Disposals | 7 |
| 1,188 |
| — |
| — |
| — |
| 2,367 |
| 3,562 |
| 36 |
Transfers (iii) | (7,333) |
| (38,107) |
| — |
| — |
| — |
| (18,299) |
| (63,739) |
| — |
Effect of exchange rate fluctuations | (8,032) |
| (15,636) |
| — |
| — |
| — |
| (9,244) |
| (32,912) |
| — |
At December 31, 2020 | (101,956) |
| (162,437) |
| — |
| — |
| — |
| (60,179) |
| (324,572) |
| (20,070) |
Corporate reorganization (Note 1.1) | (415,398) |
| (579,129) |
| (2,561,600) |
| (2,647,648) |
| (13,379) |
| (27,699) |
| (6,244,853) |
| (1,349) |
Additions | (78,080) |
| (181,359) |
| (444,431) |
| (465,586) |
| — |
| (27,852) |
| (1,197,308) |
| (7,988) |
Disposals | 3,922 |
| 35,165 |
| 103,360 |
| 196 |
| — |
| 82,574 |
| 225,217 |
| 1,008 |
Transfers (ii) | (24,461) |
| 9,549 |
| 60,621 |
| (2,603) |
| — |
| (176) |
| 42,930 |
| — |
Effect of exchange rate fluctuations | (2,645) |
| (4,331) |
| — |
| — |
| — |
| (1,949) |
| (8,925) |
| — |
At December 31, 2021 | (618,618) |
| (882,542) |
| (2,842,050) |
| (3,115,641) |
| (13,379) |
| (35,281) |
| (7,507,511) |
| (28,399) |
At December 31, 2020 | 160,486 |
| 127,415 |
| — |
| — |
| 53,423 |
| 75,672 |
| 416,996 |
| 61,459 |
At December 31, 2021 | 1,382,547 |
| 1,092,072 |
| 4,896,839 |
| 5,639,360 |
| 3,231,274 |
| 406,461 |
| 16,648,553 |
| 53,007 |
(i) On December 31, 2021, railcars and locomotives in the amount of R$ 745,203 were pledged to guarantee bank loans (Note 5.6).
(ii) Transfers of property, plant and equipment as a result of capitalization and other reclassifications of said assets.
b) Capitalization of borrowing costs
At Rumo, during the year ended December 31, 2021, R$70,609 was capitalized in fixed assets, at a weighted average rate of 11.81% p.a.
In the indirect subsidiary TRSP, during the year ended December 31, 2021, R$7,512 were capitalized in fixed assets, at a weighted average rate of 2.78% p.a.
Notes to the financial statements
(In thousands of Brazilian Reais - R$, unless otherwise stated)
10.2 Intangible assets and goodwill
Accounting policy a) Goodwill Goodwill is initially recognized based on the business combination accounting policy (see note 8.2). Its value is measured at cost, less accumulated impairment losses.
Goodwill acquired in a business combination is allocated to the Company’s cash-generating units (“CGU”), or groups of CGUs, that are expected to benefit from the synergies of the combination.
b) Other intangible assets Other intangible assets that are acquired by the Company and have a short life are measured at cost, less accumulated amortization and any accumulated impairment losses.
c) Customer relationships Costs incurred on development of gas systems for new customers (including pipelines, valves, and general equipment) are recognized as intangible assets and amortized over the contract period. Costs incurred with the customer portfolio and right-of-use and operating agreements are recognized as intangible assets and amortized over the term of the agreement.
d) Concession rights The subsidiary Comgás has a public concession agreement for a gas distribution service in which the Granting Authority controls which services will be provided and the price, in addition to holding a significant interest in the infrastructure at the end of the concession. This concession agreement represents the right to charge users for the supply of gas during the term of the agreement. Therefore, the subsidiary recognizes this right as an intangible asset. Intangible assets comprise: (i) the concession right recognized in the business combination of the subsidiary Comgás, which is being amortized over the concession period on a straight-line basis, considering the extension of distribution services for another twenty years; and (ii) the acquired or constructed assets underlying the concession necessary for the distribution of gas, which is being depreciated to correspond to the period in which the future economic benefits of the asset are expected to revert to the Company, or the final term of the concession , what happens first. This period reflects the economic useful life of each of the underlying assets that make up the concession. This economic useful life is also used by ARSESP to determine the basis for measuring the tariff for the provision of services under the concession. |
Notes to the financial statements
(In thousands of Brazilian Reais - R$, unless otherwise stated)
The amortization of intangible assets reflects the expected pattern for the use of future economic benefits by the Company, which corresponds to the useful life of the assets that make up the infrastructure in accordance with the provisions of ARSESP. Amortization of assets is discontinued when the respective asset is used or written off in full and is no longer included in the calculation basis of the concession service fee, whichever occurs first.
e) Rumo’s concession rights Rumo’s concession rights generated in the business combination of Rumo Malha Norte S.A. (“Rumo Malha Norte”) was fully allocated to Rumo Malha Norte concession and amortized on a straight-line basis.
f) Subsequent expenditure Subsequent expenditures are capitalized only when it increases the future economic benefits embodied in the specific asset to which it relates. All other expenditures are recognized in profit or loss as incurred.
g) Amortization Except for goodwill, intangible assets are amortized on a straight-line basis over their estimated useful lives, from the date they are available for use or acquired. Amortization methods, useful lives and residual values are reviewed at each reporting date and adjusted, if appropriate. |
Notes to the financial statements
(In thousands of Brazilian Reais - R$, unless otherwise stated)
| Consolidated |
| Parent Company | ||||||||||||||
| Goodwill |
| Concession rights |
| Operating license |
| Trademarks |
| Customer relationships |
| Other |
| Total |
| Total | ||
Cost |
|
|
|
|
|
|
|
|
|
|
|
|
|
|
| ||
At January 1, 2020 | 801,731 |
| 10,112,064 |
| — |
| 46,170 |
| 829,091 |
| 252,535 |
| 12,041,591 |
| 15,294 | ||
Additions | — |
| — |
| — |
| — |
| 111,656 |
| 7,704 |
| 119,360 |
| 150 | ||
Disposals | 94,892 |
| — |
| — |
| — |
| — |
| — |
| 94,892 |
| — | ||
Transfers | — |
| (48,442) |
| — |
| — |
| (131) |
| (12,474) |
| (61,047) |
| — | ||
Effect of exchange rate fluctuations | — |
| 695,140 |
| — |
| 3,697 |
| 12,735 |
| 52,949 |
| 764,521 |
| 18 | ||
Discontinued operation | 80,684 |
| — |
| — |
| 13,541 |
| 75,861 |
| 10,848 |
| 180,934 |
| — | ||
At December 31, 2020 | 977,307 |
| 10,758,762 |
| — |
| 63,408 |
| 1,029,212 |
| 311,562 |
| 13,140,251 |
| 15,462 | ||
Corporate reorganization (Note 1.1) | 111,413 |
| 8,017,957 |
| 343,348 |
| — |
| — |
| 235,724 |
| 8,708,442 |
| — | ||
Additions | 24,696 |
| 765 |
| 35,834 |
| — |
| 155,469 |
| 2,286 |
| 219,050 |
| 292 | ||
Disposals (ii) | (224) |
| (169,815) |
| — |
| — |
| (44) |
| (3,828) |
| (173,911) |
| (38) | ||
Transfers (i) | — |
| 1,008,855 |
| — |
| — |
| 394,949 |
| (40,052) |
| 1,363,752 |
| 15 | ||
Effect of exchange rate fluctuations | 19,625 |
| — |
| — |
| 3,232 |
| 24,481 |
| 3,361 |
| 50,699 |
| — | ||
At December 31, 2021 | 1,132,817 |
| 19,616,524 |
| 379,182 |
| 66,640 |
| 1,604,067 |
| 509,053 |
| 23,308,283 |
| 15,731 | ||
|
|
|
|
|
|
|
|
|
|
|
|
|
|
|
| ||
Amortization: |
|
|
|
|
|
|
|
|
|
|
|
|
|
|
| ||
At January 1, 2020 | — |
| (1,982,241) |
| — |
| (9,201) |
| (410,449) |
| (174,019) |
| (2,575,910) |
| (11,995) | ||
Additions | — |
| (368,459) |
| — |
| — |
| (86,162) |
| (69,591) |
| (524,212) |
| (1,258) | ||
Disposals | — |
| 17,030 |
| — |
| — |
| 111 |
| 4,820 |
| 21,961 |
| — | ||
Transfers | — |
| (10) |
| — |
| — |
| 5,181 |
| 867 |
| 6,038 |
| (18) | ||
Effect of exchange rate fluctuations | — |
| — |
| — |
| — |
| (17,978) |
| (4,854) |
| (22,832) |
| — | ||
At December 31, 2020 | — |
| (2,333,680) |
| — |
| (9,201) |
| (509,297) |
| (242,777) |
| (3,094,955) |
| (13,271) | ||
Corporate reorganization (Note 1.1) | — |
| (1,144,572) |
| (157,411) |
| — |
| — |
| (164,684) |
| (1,466,667) |
| — | ||
Additions | — |
| (568,150) |
| (9,876) |
| — |
| (116,860) |
| (35,017) |
| (729,903) |
| (694) | ||
Disposals (ii) | — |
| 152,236 |
| — |
| — |
| 114 |
| 3,828 |
| 156,178 |
| 38 | ||
Transfers | — |
| (16,093) |
| — |
| — |
| (395,202) |
| 30,208 |
| (381,087) |
| — | ||
Effect of exchange rate fluctuations | — |
| — |
| — |
| — |
| (7,363) |
| (2,988) |
| (10,351) |
| — | ||
At December 31, 2021 | — |
| (3,910,259) |
| (167,287) |
| (9,201) |
| (1,028,608) |
| (411,430) |
| (5,526,785) |
| (13,927) | ||
At December 31, 2020 | 977,307 |
| 8,425,082 |
| — |
| 54,207 |
| 519,915 |
| 68,785 |
| 10,045,296 |
| 2,191 | ||
At December 31, 2021 | 1,132,817 |
| 15,706,265 |
| 211,895 |
| 57,439 |
| 575,459 |
| 97,623 |
| 17,781,498 |
| 1,804 | ||
(i) Contract asset transfers, the amount also includes a portion of the intangible asset that was reclassified to the financial asset.
(ii) Includes the amount of R$ 142,316 related to the write-off of fully depreciated assets.
Notes to the financial statements
(In thousands of Brazilian Reais - R$, unless otherwise stated)
a) Amortization methods and useful lives
Intangible assets (excluding goodwill) | Annual rate of amortization |
| December 31, 2021 |
| December 31, 2020 |
Comgás (i) | 2.00% |
| 8,953,495 |
| 8,425,082 |
Rumo(ii) | 1.59% |
| 6,752,770 |
| — |
|
|
| 15,706,265 |
| 8,425,082 |
|
|
|
|
|
|
Operating license for port terminal | 3.70% |
| 211,895 |
| — |
|
|
| 211,895 |
| — |
Trademarks |
|
|
|
|
|
Comma | Undefined |
| 57,439 |
| 54,207 |
|
|
| 57,439 |
| 54,207 |
Customers relationship |
|
|
|
|
|
Comgás | 20.00% |
| 276,811 |
| 210,038 |
Moove | 5% to 20% |
| 297,286 |
| 309,877 |
Other | 20.00% |
| 1,362 |
| — |
|
|
| 575,459 |
| 519,915 |
Other |
|
|
|
|
|
Software license | 20.00% |
| 46,770 |
| 18,478 |
Other | 20.00% |
| 50,853 |
| 50,307 |
|
|
| 97,623 |
| 68,785 |
Total |
|
| 16,648,681 |
| 9,067,989 |
| (i) | Refers to the intangible asset for the public gas distribution service concession, which represents the right to charge users for the supply of gas, comprised of: (i) the concession rights recognized in the business combination and (ii) concession assets. |
| (ii) | Refers to the railroad concession right agreement of Rumo. The amount will be amortized until the end of the concession in 2079. |
Notes to the financial statements
(In thousands of Brazilian Reais - R$, unless otherwise stated)
b) Impairment testing of cash-generating units (“CGU”) goodwill
The combined carrying amounts of goodwill allocated to each cash-generating unit are as follows:
| 31/12/2021 |
| 31/12/2020 |
Cash generating unit – Moove | 916,742 |
| 882,373 |
Cash generating unit – Compass | 94,891 |
| 94,891 |
Cash generating unit – Logística | 100,451 |
| - |
Cash generating unit – Cosan – Other Business | 20,733 |
| 43 |
| 1,132,817 |
| 977,307 |
In general, the Company's future cash flow projections apply growth rates of 3% (3.3% in 2020), which in no case are increasing or exceeding the average long-term growth rates for the industry and country in particular.
Cash flows are discounted at a pre-tax rate to calculate their present value. Discount rates, before tax and expressed in nominal terms, were between 8.3% and 12.2% (between 8.3% and 9.3% in 2020).
The annual impairment test used assumptions of which we list some:
Assumptions |
| % annual |
Risk-free fee (T-Note 10y) |
| 1.46% |
Inflation (BR) |
| 3.00% |
Inflation (US) |
| 2.16% |
Inflation (UK) |
| 2.04% |
Country risk premium (BR) |
| 3.68% |
Country risk premium (UK) |
| 0.51% |
Country risk premium (ARG) |
| 10.21% |
Market risk premium |
| 5.63% |
Tax rate (BR) |
| 34.00% |
Tax rate (UK) |
| 19.00% |
Tax rate (ARG) |
| 30.00% |
On December 31, 2020, the Logistics CGU recorded a provision for impairment in the amount of R$143,987 referring to the concession of Rumo Malha Oeste S.A. (“Rumo Malha Oeste”), of which R$143,018 refers to property, plant and equipment and R$966 refers to up to the right of use. During the year ended December 31, 2021, no changes were identified in the 2020 valuations for a provision revaluation. Additionally, management filed a re-bidding request for Rumo Malha Oeste to extend the concession period and, thus, reinvest in the rail network.
Notes to the financial statements
(In thousands of Brazilian Reais - R$, unless otherwise stated)
As of December 31, 2021, no impairment charge on assets and goodwill was recognized. The determination of the recoverability of the assets depends on certain key assumptions, as described above, which are influenced by the market, technological and economic conditions prevailing when this recovery is tested and, therefore, it is not possible to determine whether further reductions in the recoverable value will occur in the future and, if they occur, whether they would be material.
10.3 Contract asset
Accounting policy Contract assets are measured at acquisition cost, including capitalized borrowing costs. When the assets come into operation, the depreciable values within the concession agreement are transferred to intangible assets. Comgás reassess useful lives, whenever such assessment indicates that amortization period will exceed concession contract term, a portion of the asset is converted into financial asset as it represents an account receivable from the concession authority. Such classification is in accordance with IFRIC 12 “Service Concession Arrangements.” |
| Comgás |
| Moove |
| Total |
Cost: |
|
|
|
|
|
At December 31, 2019 | 594,601 |
| 5,940 |
| 600,541 |
Discontinued operation | 885,631 |
| 571 |
| 886,202 |
Transfers to intangible assets (i) | (793,542) |
| 2,737 |
| (790,805) |
At December 31, 2020 | 686,690 |
| 9,248 |
| 695,938 |
Additions | 1,020,176 |
| 37,203 |
| 1,057,379 |
Disposals | — |
| (25,439) |
| (25,439) |
Transfers to intangible assets (i) | (1,021,896) |
| — |
| (1,021,896) |
At December 31, 2021 | 684,970 |
| 21,012 |
| 705,982 |
(i) The amount of transfers also includes a portion of the intangible asset that was reclassified to a financial asset.
Notes to the financial statements
(In thousands of Brazilian Reais - R$, unless otherwise stated)
a) Capitalization of borrowing costs
During the year ended December 31, 2021, the indirect subsidiary Comgás capitalized R$33,829 at a weighted average rate of 8.45% p.a. (R$36,522 at a weighted average rate of 7.40% p.a. on December 31, 2020).
10.4 Right-of-use
Accounting policy The right-of-use asset is measured initially at cost, which comprises the initial measurement amount of the lease liability, adjusted for any lease payments made through the commencement date, plus any initial direct costs incurred by the lessee and an estimate of the costs to be incurred by the lessee in dismantling and removing the underlying asset, restoring the location in which it is located, or restoring the underlying asset to the condition required by the terms and conditions of the lease, less any lease incentives received.
The right-of-use asset is subsequently depreciated on a straight-line basis from the commencement date to the end of the lease term, unless the lease transfers ownership of the underlying asset to the lessee at the end of the lease term, or if the cost of right-of-use asset reflects that the lessee will exercise the purchase option. In this case, the right-of-use asset will be depreciated over the useful life of the underlying asset, which is determined on the same basis as that of the property, plant and equipment. In addition, the right-of-use asset is periodically reduced by impairment losses, if any, and adjusted for certain remeasurements of the lease liability.
The subsidiary Rumo evaluated its railway concessions within the scope of the IFRIC 12 / CPC 01 Concession Contracts interpretation and, as it did not meet the terms within the scope of this interpretation, it registered its concession contracts as a right of use. |
Notes to the financial statements
(In thousands of Brazilian Reais - R$, unless otherwise stated)
| Consolidated |
| Parent Company | ||||||||||||
| Land, buildings and improvements (i) |
| Machinery, equipment and facilities |
| Freight cars and locomotives |
| Software |
| Vehicles |
| Port and rail infrastructure |
| Total |
| Total |
Cost: |
|
|
|
|
|
|
|
|
|
|
|
|
|
|
|
At January 1, 2020 | 54,715 |
| 6,315 |
| — |
| — |
| — |
| — |
| 61,030 |
| 21,618 |
Additions | 30,023 |
| 10,202 |
| — |
| — |
| — |
| — |
| 40,225 |
| 9,001 |
Contractual adjustments | 1,036 |
| — |
| — |
| — |
| — |
| — |
| 1,036 |
| 1,035 |
Effect of exchange rate fluctuations | 9,197 |
| (707) |
| — |
| — |
| — |
| — |
| 8,490 |
| — |
At December 31, 2020 | 94,971 |
| 15,810 |
| — |
| — |
| — |
| — |
| 110,781 |
| 31,654 |
Corporate reorganization (Note 1.1) | 282,565 |
| 31,857 |
| 937,268 |
| 87,028 |
| 13,925 |
| 7,440,652 |
| 8,793,295 |
| 11,561 |
Business combination (Note 8.2.1) | 3,240 |
| — |
| — |
| — |
| — |
| — |
| 3,240 |
| — |
Additions | 73,039 |
| 47,097 |
| 43 |
| — |
| 15,219 |
| 15,108 |
| 150,506 |
| 6,314 |
Contractual adjustments | 41,663 |
| 47,960 |
| 1,299 |
| — |
| 41 |
| 304,213 |
| 395,176 |
| — |
Disposals | (12,121) |
| (2,836) |
| — |
| — |
| — |
| — |
| (14,957) |
| — |
Transfers | (230,004) |
| — |
| — |
| — |
| — |
| 40,340 |
| (189,664) |
| — |
Effect of exchange rate fluctuations | 1,530 |
| 2,561 |
| — |
| — |
| (86) |
| — |
| 4,005 |
| — |
At December 31, 2021 | 254,883 |
| 142,449 |
| 938,610 |
| 87,028 |
| 29,099 |
| 7,800,313 |
| 9,252,382 |
| 49,529 |
|
|
|
|
|
|
|
|
|
|
|
|
|
|
|
|
Amortization: |
|
|
|
|
|
|
|
|
|
|
|
|
|
|
|
At January 1, 2020 | (8,033) |
| (1,592) |
| — |
| — |
| — |
| — |
| (9,625) |
| (2,933) |
Additions | (6,088) |
| (6,365) |
| — |
| — |
| — |
| — |
| (12,453) |
| — |
Disposals | (3,913) |
| — |
| — |
| — |
| — |
| — |
| (3,913) |
| (3,912) |
Effect of exchange rate fluctuations | (1,072) |
| 506 |
| — |
| — |
| — |
| — |
| (566) |
| — |
At December 31, 2020 | (19,106) |
| (7,451) |
| — |
| — |
| — |
| — |
| (26,557) |
| (6,845) |
Corporate reorganization (Note 1.1) | (100,177) |
| (6,759) |
| (362,498) |
| (13,252) |
| (13,618) |
| (478,741) |
| (975,045) |
| (3,131) |
Additions | (29,561) |
| (15,771) |
| (36,720) |
| (3,707) |
| (1,542) |
| (276,965) |
| (364,266) |
| (5,382) |
Transfers | 77,310 |
| — |
| — |
| — |
| — |
| (20,930) |
| 56,380 |
| — |
Disposals | 3,880 |
| 2,229 |
| — |
| — |
| — |
| — |
| 6,109 |
| — |
Effect of exchange rate fluctuations | (265) |
| (1,506) |
| — |
| — |
| 35 |
| — |
| (1,736) |
| — |
At December 31, 2021 | (67,919) |
| (29,258) |
| (399,218) |
| (16,959) |
| (15,125) |
| (776,636) |
| (1,305,115) |
| (15,358) |
At December 31, 2020 | 75,865 |
| 8,359 |
| — |
| — |
| — |
| — |
| 84,224 |
| 24,809 |
At December 31, 2021 | 186,964 |
| 113,191 |
| 539,392 |
| 70,069 |
| 13,974 |
| 7,023,677 |
| 7,947,267 |
| 34,171 |
(i) On June 16, 2021, the subsidiary Rumo exercised a purchase option on the Rondonópolis Railway Terminal in the amount of R$184,100 (historical cost), which is being leased to the subsidiary Rumo Malha Norte S.A.
Notes to the financial statements
(In thousands of Brazilian Reais - R$, unless otherwise stated)
10.5 Investment properties
Accounting policy Investment properties are initially valued at cost, including transaction costs. After initial recognition, investment properties are measured at fair value, which reflects market conditions at the balance sheet date, with changes recognized in the income statement. Revenue from the sale of agricultural properties is not recognized in income until (i) the sale is completed, (ii) the Company determines that payment by the buyer is probable; (iii) revenue can be measured reliably; and (iv) the Company has transferred the ownership risks to the purchaser, and no longer has any involvement in the property. Gains on the sale of agricultural properties are presented in the income statement as net income and the cost is presented as cost of properties sold.
The fair value of agricultural properties was determined based on the direct comparative method of market data applied to transactions with similar properties (type, location and quality of the property), and to some extent based on sales quotations for potential transactions with comparable assets (level 3). The methodology used to determine fair value takes into account direct comparisons of market information, such as market research, homogenization of values, spot market prices, sales, distances, facilities, access to land, topography and soil, use of land (type of crop) and rainfall, among other data, in line with the standards issued by the Brazilian Association of Technical Standards (ABNT). Significant unobservable inputs range from 6.5% p.a. and 9% p.a. on December 31, 2021.
The portfolio is evaluated annually by external experts, and is periodically reviewed by in-house professionals technically qualified to carry out this type of evaluation. |
Notes to the financial statements
(In thousands of Brazilian Reais - R$, unless otherwise stated)
The balances of investment properties are shown below:
|
|
| Investment properties |
December 31, 2020 |
|
| — |
Subsidiary acquisition (Note 8.2) |
|
| 3,875,752 |
Variation in fair value, net |
|
| 17,116 |
Property Transfer Tax provision |
|
| (6,450) |
Other |
|
| 278 |
December 31, 2021 |
|
| 3,886,696 |
11 Commitments
Commitments to supply contracts
Considering the current gas supply contracts, the subsidiary Comgás has a total financial commitment in an estimated present value of R$7,745,842, whose value includes the minimum established in the contract both in commodities and in transport, with a term until December 2023.
12 Concessions payable and commitments
Accounting policy The balance of lease installments involved in lawsuits with the granting authority is recorded in this account. The initial registration takes place at the amount of the installment at maturity, by transferring the “Leases” account. Subsequently, the values are corrected by Selic.
Balances paid in installments with the Granting Authority are kept in this account. The initial registration is for the amount remaining due from the resolution of the dispute. The values are corrected by Selic until payment.
This account also includes balances payable in connection with the granting of concession rights (“Concessions”), initially recorded as a contra entry to intangible assets (Note 10.2). Subsequent measurement occurs at the effective rate. |
Notes to the financial statements
(In thousands of Brazilian Reais - R$, unless otherwise stated)
.
| December 31, 2021 |
Court discussion: |
|
Rumo Malha Paulista | 55,170 |
Rumo Malha Oeste | 1,747,233 |
| 1,802,403 |
Railroad concession: |
|
Rumo Malha Paulista | 1,145,450 |
| 1,145,450 |
Payables: |
|
Rumo Malha Sul | 85,713 |
Rumo Malha Paulista | 20,682 |
| 106,395 |
Total | 3,054,248 |
|
|
Current | 160,771 |
Non-current | 2,893,477 |
Lease and Court Discussion:
On July 21, 2020, the Company filed with the Brazilian Transportation Authority (Agência Nacional de Transporte Terrestre), or “ANTT,” a request to qualify for a new bidding process to third parties of the object of the Concession Contract signed between Rumo Malha Oeste and the Brazilian government, through the Ministry of Transport (“Re-bidding Process”), according to Federal Law No. 13,448 of June 5, 2017, and regulated by Decree No. 9,957 of August 7, 2019.
Judicial deposits concerning the above claims totaled R$ 22,119.
Notes to the financial statements
(In thousands of Brazilian Reais - R$, unless otherwise stated)
Leases and grants under IFRS16 (Note 5.8)
| December 31, 2021 |
Leases: |
|
Rumo Malha Sul | 623,155 |
Rumo Malha Paulista | 508,169 |
Rumo Malha Oeste | 216,101 |
Elevações Portuárias | 97,046 |
Portofer | 13,921 |
| 1,458,392 |
Grants: |
|
Rumo Malha Paulista (renewal) | 590,594 |
Malha Central | 614,410 |
| 1,205,004 |
Total | 2,663,396 |
Current | 274,774 |
Non-current | 2,388,622 |
Investment commitments
The sub-concession contracts to which Rumo, through its subsidiaries, is a party, often include commitments to execute investments with certain characteristics during the term of the contract. We can highlight:
The amendment to the concession of Rumo Malha Paulista, which foresees the execution long with the concession of a set of investment projects to increase capacity and reduce urban conflicts, estimated by the agency at R$6,100,000 (value updated until December 2017). Of this amount, around R$3,000,000 comprise the obligations, whose physical execution was 16%.
Notes to the financial statements
(In thousands of Brazilian Reais - R$, unless otherwise stated)
Rumo Malha Central sub-concession contract provides for investments with a fixed term (one to three years from the signing of the contract), estimated by ANTT at R$645,573. As of December 31, 2021, the physical execution of the obligation book projects was 65%.
The port elevation concession and lease agreement provide for investments aimed at improving and modernizing the facilities and equipment allocated therein, estimated in the amount of R$340,000. As of December 31, 2021, the subsidiary had made investments at a cost of R$270,629.
13 Other taxes payable
Accounting policy The Company is subject to different taxes and contributions, such as municipal, state and federal taxes, taxes on deposits and withdrawals from bank accounts, taxes on turnover, regulatory fees and income tax, among others, which represent expenses for the Company. It is also subject to other taxes on its activities that generally do not represent an expense. |
|
| Parent Company |
| Consolidated | ||||
|
| December 31, 2021 |
| December 31, 2020 |
| December 31, 2021 |
| December 31, 2020 |
Tax amnesty and refinancing program |
| 194,228 |
| 193,352 |
| 200,664 |
| 199,587 |
ICMS – State VAT |
| — |
| — |
| 278,351 |
| 182,227 |
COFINS – Revenue tax |
| 48,229 |
| 44,428 |
| 88,214 |
| 62,801 |
PIS – Revenue tax |
| 8,530 |
| 12,581 |
| 15,082 |
| 16,264 |
INSS – Social security |
| 22,293 |
| 15,085 |
| 34,215 |
| 19,026 |
Withholding income tax |
| — |
| — |
| 11,024 |
| 5,915 |
Other |
| 3,099 |
| 1,155 |
| 55,559 |
| 28,151 |
|
| 276,379 |
| 266,601 |
| 683,109 |
| 513,971 |
|
|
|
|
|
|
|
|
|
Current |
| 134,956 |
| 125,368 |
| 536,220 |
| 367,076 |
Non-current |
| 141,423 |
| 141,233 |
| 146,889 |
| 146,895 |
|
| 276,379 |
| 266,601 |
| 683,109 |
| 513,971 |
The amounts due in non-current liabilities have the following maturity schedule:
Notes to the financial statements
(In thousands of Brazilian Reais - R$, unless otherwise stated)
| Parent Company |
| Consolidated | |||||
|
| December 31, 2021 |
| December 31, 2020 |
| December 31, 2021 |
| December 31, 2020 |
13 to 24 months |
| 3,654 |
| 4,440 |
| 4,370 |
| 5,131 |
25 to 36 months |
| 798 |
| 2,452 |
| 1,514 |
| 3,143 |
37 to 48 months |
| — |
| 787 |
| 716 |
| 1,478 |
49 to 60 months |
| — |
| — |
| 716 |
| 691 |
61 to 72 months |
| 136,971 |
| 133,554 |
| 137,687 |
| 134,151 |
73 to 84 months |
| — |
| — |
| 716 |
| 691 |
85 to 96 months |
| — |
| — |
| 716 |
| 691 |
Over 96 months |
| — |
| — |
| 454 |
| 919 |
|
| 141,423 |
| 141,233 |
| 146,889 |
| 146,895 |
14 Income tax and social contribution
Accounting policy The income taxes rate is 34%. Current tax and deferred tax are recognized in profit or loss except for some transactions that are recognized directly in equity or in other comprehensive income.
a) Current tax Current tax is the expected tax payable or receivable on the taxable income or loss for the year, using tax rates enacted or substantively enacted at the reporting date, and any adjustment to tax payable in respect of previous years.
b) Deferred tax Deferred tax is recognized in respect of temporary differences between the carrying amounts of assets and liabilities for financial reporting purposes and the amounts used for taxation purposes and tax loss.
The measurement of deferred tax reflects the way the Company expects, at the end of the reporting period, to recover or settle the carrying amount of its assets and liabilities. Deferred tax is measured at the tax rates that are expected to be applied to temporary differences when they reverse, using tax rates enacted or substantively enacted at the reporting date. |
Notes to the financial statements
(In thousands of Brazilian Reais - R$, unless otherwise stated)
Deferred tax assets and liabilities are offset if there is a legally enforceable right to offset current tax liabilities and assets, and they relate to taxes levied by the same tax authority and the same taxable entity.
c) Tax exposure In determining the amount of current and deferred tax, the Company considers the impact of uncertain tax positions and whether additional taxes and interest may be due. This assessment relies on estimates and assumptions and may involve a series of judgments about future events. New information may become available that causes the Company to change its judgment regarding the adequacy of existing tax liabilities; such changes to tax liabilities will impact tax expense in the period that such a determination is made.
d) Recoverability of deferred income tax and social contribution In assessing the recoverability of deferred taxes, management considers the projections of future taxable income and movements of temporary differences. When it is not probable that part or all the taxes will be realized, the tax asset is reversed. There is no expiration date for the use of tax loss carryforwards and negative bases, but the use of these accumulated losses of previous years is limited to 30% of annual taxable income. |
Notes to the financial statements
(In thousands of Brazilian Reais - R$, unless otherwise stated)
a) Reconciliation of income and social contribution tax expenses
|
| Parent Company |
| Consolidated | |||||
|
| December 31, 2021 |
| December 31, 2020 |
|
| December 31, 2021 |
| December 31, 2020 |
|
|
|
|
|
|
|
|
|
|
Profit before taxes |
| 5,495,300 |
| 674,465 |
|
| 5,900,023 |
| 1,166,665 |
Income tax and social contribution nominal rate (34%) |
| (1,868,402) |
| (229,318) |
|
| (2,006,008) |
| (396,666) |
|
|
|
|
|
|
|
|
|
|
Adjustments to determine the effective rate |
|
|
|
|
|
|
|
|
|
Interest in earnings of investees (non-taxable income) (i) |
| 2,364,014 |
| 430,613 |
|
| 1,734,521 |
| 203,491 |
Differences in tax rates on earnings (losses) of overseas companies |
| (7,880) |
| — |
|
| (40,172) |
| (16,020) |
Granted income tax incentive |
| — |
| — |
|
| 134,245 |
| — |
Share-based payment transactions |
| 450 |
| 9,511 |
|
| 450 |
| 9,511 |
Interest on shareholders’ equity |
| (55,052) |
| (9,285) |
|
| (72,804) |
| (24,773) |
Non-deductible expenses (donations, gifts, etc.) |
| — |
| — |
|
| (28,083) |
| (3,687) |
Tax losses not recorded |
| — |
| — |
|
| (160,126) |
| (9,591) |
ICMS benefit - extemporaneous tax credits (ii) |
| — |
| — |
|
| 290,745 |
| — |
ICMS benefit - current period (iii) |
| — |
| — |
|
| 118,107 |
| — |
Rate difference |
| — |
| — |
|
| 5,577 |
| — |
Goodwill amortization effect |
| — |
| — |
|
| 1,059 |
| — |
Amortization of the effects on formation of joint ventures (iv) |
| 402,571 |
| — |
|
| 402,571 |
| — |
Other (v) (vi) |
| (207,785) |
| (24,128) |
|
| 70,671 |
| (20,116) |
Income tax and social contribution (current and deferred) |
| 627,916 |
| 177,393 |
|
| 450,753 |
| (257,851) |
|
|
|
|
|
|
|
|
|
|
Effective rate - % |
| (11.43%) |
| (26.30%) |
|
| (7.64%) |
| 22.10% |
| (i) | Equity, in the amount of R$129,792, referring to the amortization of the surplus value of Raizen, is treated as a temporary difference. |
| (ii) | In the current year, the subsidiary Comgás recognized an extemporaneous credit in the amount of R$ 358,898 (R$ 290,745 principal and R$ 68,152 interest), used through its offset against IRPJ, CSLL, PIS and COFINS payable due in the year , related to the overpayments of Income Taxes (Imposto de Renda Pessoa Jurídica), or “IRPJ,” and Social Contribution on Net Profits (Contribuição Social sobre o Lucro Líquido), or “CSLL”, in the years 2015, 2016 and 2019, when this benefit was not computed in the calculation of the IRPJ and CSLL due by the Company, due to the non-taxation of the benefit of the reduction in the tax base of ICMS in the State of São Paulo from 12% to 15.6% pursuant to art. 8 of Annex II of the ICMS Regulation, approved by State Decree No. 45,900 (“RICMS/SP”), as amended by State Decree No. 62,399/2016. These credits were recognized by the Company based on its best understanding of the subject, substantiated by the opinion of its external legal advisors, which took into account all the jurisprudence applicable to the subject. The Company also took into account all the accounting rules in force, which, after being analyzed together, did not indicate any other accounting effect to be recognized. |
Notes to the financial statements
(In thousands of Brazilian Reais - R$, unless otherwise stated)
| (iii) | After January 1, 2021, the subsidiary Comgás changed its tax procedure, excluding the benefit of the reduction in the ICMS tax base, granted by the State of São Paulo, directly from the calculation of IR and CS for the current year. |
| (iv) | Reversal of deferred income tax and social contribution liabilities on the amortization of fair value related to the gain recorded in the formation of Raízen. |
| (v) | In the year, the Company reversed the deferred IRPJ and CSLL in the amount of R$284,738, on the interest on the put option in the investment transaction, which involved Cosan Investimentos e Participações and the banks, as a result of the settlement of the put option. |
| (vi) | Considering the effects of the judgment of STF RE No. 1,063,187, dated September 24, 2021, it concluded that certain financial effects related to the equity recomposition in the event of repetition of undue taxes should not form the basis of the company's taxable income. Company and its subsidiaries the amount of R$370,564. |
b) Deferred income tax assets and liabilities
The tax effects of temporary differences that give rise to significant portions of the Company’s deferred tax assets and liabilities are presented below:
Notes to the financial statements
(In thousands of Brazilian Reais - R$, unless otherwise stated)
| Parent Company |
| Consolidated | ||||
| December 31, 2021 |
| December 31, 2020 (Restated) |
| December 31, 2021 |
| December 31, 2020 (Restated) |
Assets credit of: |
|
|
|
|
|
|
|
Income tax losses | 529,834 |
| 508,453 |
| 2,987,069 |
| 721,115 |
Social contribution losses | 191,274 |
| 183,576 |
| 1,087,742 |
| 250,209 |
|
|
|
|
|
|
|
|
Temporary differences |
|
|
|
|
|
|
|
Foreign exchange - Loans and borrowings | 1,482,132 |
| 1,312,239 |
| 1,667,500 |
| 1,367,496 |
Provision for legal proceedings | 82,440 |
| 64,407 |
| 374,369 |
| 91,535 |
Loss allowances for impairment (Rumo Malha Oeste) | — |
| — |
| 193,207 |
| — |
Post-employment benefits | — |
| — |
| 160,082 |
| 200,461 |
Allowance for expected credit losses | — |
| — |
| 28,948 |
| 16,664 |
Tax credit losses | 6,985 |
| 6,985 |
| 81,918 |
| 38,684 |
Share-based payment transactions | 17,479 |
| 11,929 |
| 50,114 |
| 16,786 |
Leases | 1,998 |
| — |
| 431,629 |
| (3,245) |
Profit sharing | 17,507 |
| 2,773 |
| 111,931 |
| 32,022 |
Interest on preferred shareholders payable in subsidiaries | — |
| 167,412 |
| — |
| 167,412 |
Miscellaneous expense allowance | 179,449 |
| 190,191 |
| 401,423 |
| 258,269 |
Other (i) | 75,049 |
| — |
| 300,307 |
| 8,076 |
Total | 2,584,147 |
| 2,447,965 |
| 7,876,239 |
| 3,165,484 |
|
|
|
|
|
|
|
|
(-) Deferred taxes assets net not recognized (ii) | — |
| — |
| (2,483,035) |
| (21,133) |
|
|
|
|
|
|
|
|
Liabilities credit of: |
|
|
|
|
|
|
|
Temporary differences |
|
|
|
|
|
|
|
Review of useful life of property, plant and equipment | — |
| — |
| (53,347) |
| (230,098) |
Fair value amortization of the property, plant and equipment | — |
| — |
| (15,976) |
| (37,547) |
Tax goodwill | 44,012 |
| 44,012 |
| (331,404) |
| (300,114) |
Unrealized gains on derivatives instruments | (748,873) |
| (790,888) |
| (1,034,373) |
| (836,629) |
Fair value option in loans | — |
| — |
| (127,318) |
| — |
Marketable securities | — |
| — |
| (62,593) |
| — |
Investment properties | — |
| — |
| (100,197) |
| — |
Income on formation of joint ventures | (668,508) |
| (1,200,871) |
| (668,508) |
| (1,200,871) |
Fair value amortization of the intangible asset | — |
| — |
| (3,551,836) |
| (1,054,417) |
Provision for realization - Goodwill recorded in equity (iii) | (449,153) |
| (449,153) |
| (449,153) |
| (449,153) |
Other | 16,061 |
| 2,967 |
| 235,073 |
| 322,861 |
Total | (1,806,461) |
| (2,393,933) |
| (6,159,632) | — | (3,785,968) |
|
|
|
|
|
|
|
|
Total of deferred taxes recorded, net | 777,686 |
| 54,032 |
| (766,428) |
| (641,617) |
|
|
|
|
|
|
|
|
Deferred tax assets | 777,686 |
| 54,032 |
| 3,051,628 |
| 629,591 |
Deferred tax liabilities | — |
| — |
| (3,818,056) |
| (1,271,208) |
|
|
|
|
|
|
|
|
Total deferred, net | 777,686 |
| 54,032 |
| (766,428) |
| (641,617) |
Notes to the financial statements
(In thousands of Brazilian Reais - R$, unless otherwise stated)
| (i) | Refers mainly to pre-operating expenses added to Rumo Malha Central. |
| (ii) | Refers mainly to tax losses and temporary differences of the Company, Rumo Malha Sul and Rumo Malha Oeste, which, under current conditions, do not meet the requirements for accounting for said income tax and social contribution assets deferred due to the lack of predictability of future generation of tax profits. |
| (iii) | Provision for accounting realization of tax loss recognized in the capital contribution in a subsidiary. |
The Company evaluated the period for offsetting its deferred tax assets on tax losses, negative basis of social contribution and temporary differences through the projection of its taxable income. In the year ended December 31, 2021, the Company continued to monitor the observed impacts of the COVID-19 pandemic and evaluated the impacts of the increase in interest rates and judged that the potential effects should not affect the medium and long-term projections to point of harming the realization of balances. The results projected by the Company generate the following expected realization on December 31, 2021:
|
| Parent Company |
| Consolidated |
Within 1 year |
| 77,769 |
| 266,609 |
From 1 to 2 years |
| 77,769 |
| 277,527 |
From 2 to 3 years |
| 77,769 |
| 322,779 |
From 3 to 4 years |
| 77,769 |
| 329,506 |
From 4 to 5 years |
| 77,769 |
| 350,582 |
From 5 to 8 years |
| 233,305 |
| 976,496 |
From 8 to 10 years |
| 155,536 |
| 528,129 |
Total |
| 777,686 |
| 3,051,628 |
Notes to the financial statements
(In thousands of Brazilian Reais - R$, unless otherwise stated)
c) Analytical movement in deferred tax assets and liabilities
Parent Company | ||||||||||||||
|
| Tax loss and negative basis |
| Post-employment obligations |
| Employee benefits |
| Provisions |
| Leases |
| Other |
| Total |
Assets |
|
|
|
|
|
|
| |||||||
|
|
|
|
|
|
| ||||||||
Balance on January 1, 2020 |
| 250,190 |
| — |
| 4,223 |
| 263,949 |
| — |
| 925,567 |
| 1,443,929 |
Credited to the profit for year |
| 440,791 |
| — |
| (1,450) |
| (24,943) |
| — |
| 80,670 |
| 495,068 |
Other comprehensive income (loss) |
| 1,048 |
| — |
| — |
| 34,506 |
| — |
| — |
| 35,554 |
Exchange differences |
| — |
| — |
| — |
| — |
| — |
| 473,414 |
| 473,414 |
At December 31, 2020 |
| 692,029 |
| — |
| 2,773 |
| 273,512 |
| — |
| 1,479,651 |
| 2,447,965 |
Credited / (charged) to the profit for year |
| 23,201 |
| (9,620) |
| 32,213 |
| (4,706) |
| 1,998 |
| (92,363) |
| (49,277) |
Recognized in equity |
| 5,878 |
| 9,620 |
| — |
| 68 |
| — |
| — |
| 15,566 |
Exchange differences |
| — |
| — |
| — |
| — |
| — |
| 169,893 |
| 169,893 |
At December 31, 2021 |
| 721,108 |
| — |
| 34,986 |
| 268,874 |
| 1,998 |
| 1,557,181 |
| 2,584,147 |
| Parent Company | ||||||
| Effects on the formation of joint ventures |
| Unrealized gains on derivatives |
| Other |
| Total |
Liabilities |
|
|
| ||||
|
|
| |||||
Balance on January 1, 2020 | (1,135,036) |
| (446,024) |
| (21,823) |
| (1,602,883) |
Credited to the profit for year | — |
| (344,864) |
| (446,186) |
| (791,050) |
At December 31, 2020 | (1,135,036) |
| (790,888) |
| (468,009) |
| (2,393,933) |
(Charged) to the profit for year | 466,528 |
| 42,015 |
| (1,555) |
| 506,988 |
Recognized in equity | — |
| — |
| 80,484 |
| 80,484 |
At December 31, 2021 | (668,508) |
| (748,873) |
| (389,080) |
| (1,806,461) |
Notes to the financial statements
(In thousands of Brazilian Reais - R$, unless otherwise stated)
| Consolidated | ||||||||||||
| Tax loss and negative basis |
| Post-employment obligations |
| Employee benefits |
| Provisions |
| Leases |
| Other |
| Total |
Assets |
|
|
|
|
|
| |||||||
|
|
|
|
|
| ||||||||
Balance on January 1, 2020 | 474,815 |
| 214,496 |
| 26,196 |
| 422,216 |
| 243 |
| 994,944 |
| 2,132,910 |
Credited to the profit for year | 495,461 |
| 14,958 |
| 10,683 |
| (39,640) |
| (3,488) |
| (6,108) |
| 471,866 |
Other comprehensive income (loss) | 1,048 |
| (28,993) |
| — |
| 34,505 |
| — |
| 39,931 |
| 46,491 |
Exchange differences | — |
| — |
| — |
| — |
| — |
| 514,217 |
| 514,217 |
At December 31, 2020 | 971,324 |
| 200,461 |
| 36,879 |
| 417,081 |
| (3,245) |
| 1,542,984 |
| 3,165,484 |
Corporate reorganization (Note 1.1) | 2,638,980 |
| — |
| 29,389 |
| 584,013 |
| (18,706) |
| 995,740 |
| 4,229,416 |
Credited / (charged) to the profit for year | 458,585 |
| (12,737) |
| 95,777 |
| 88,832 |
| 453,580 |
| (1,635,166) |
| (551,129) |
Other comprehensive income | — |
| (27,642) |
| — |
| — |
| — |
| 20,107 |
| (7,535) |
Recognized in equity | 5,878 |
| — |
| — |
| 68 |
| — |
| (10,221) |
| (4,275) |
Business combination (Note 8.2.1) | 44 |
| — |
| — |
| (10,129) |
| — |
| — |
| (10,085) |
Exchange differences | — |
| — |
| — |
| — |
| — |
| 1,054,363 |
| 1,054,363 |
At December 31, 2021 | 4,074,811 |
| 160,082 |
| 162,045 |
| 1,079,865 |
| 431,629 |
| 1,967,807 |
| 7,876,239 |
| Consolidated | ||||||||||||||
| Effects on the formation of joint ventures |
| Intangible assets |
| Unrealized gains on derivatives |
| Property, plant and equipment |
| Fair value adjustment |
| Other |
| Unrealized credits |
| Total |
Liabilities |
|
|
|
|
|
|
| ||||||||
|
|
|
|
|
|
| |||||||||
Balance on January 1, 2020 | (1,135,036) |
| (1,089,907) |
| (533,671) |
| (257,436) |
| — |
| (233,865) |
| (8,817) |
| (3,258,732) |
Credited to the profit for year | — |
| 35,490 |
| (303,222) |
| 27,338 |
| — |
| (295,392) |
| (12,316) |
| (548,102) |
Discontinued operation | — |
| — |
| 264 |
| — |
| — |
| — |
| — |
| 264 |
Exchange differences | — |
| — |
| — |
| — |
| — |
| (531) |
| — |
| (531) |
At December 31, 2020 | (1,135,036) |
| (1,054,417) |
| (836,629) |
| (230,098) |
| — |
| (529,788) |
| (21,133) |
| (3,807,101) |
Corporate reorganization (Note 1.1) | — |
| (2,545,467) |
| (801,495) |
| 652,716 |
| 215,862 |
| (66,441) |
| (2,322,732) |
| (4,867,557) |
Credited / (charged) to the profit for year | 466,528 |
| 48,048 |
| 400,200 |
| (456,452) |
| (343,180) |
| 162,557 |
| (139,170) |
| 138,531 |
Other comprehensive income | — |
| — |
| 203,551 |
| — |
| — |
| (127,294) |
| — |
| 76,257 |
Business combination (Note 8.2.1) | — |
| — |
| — |
| (19,513) |
| — |
| (163,284) |
| — |
| (182,797) |
At December 31, 2021 | (668,508) |
| (3,551,836) |
| (1,034,373) |
| (53,347) |
| (127,318) |
| (724,250) |
| (2,483,035) |
| (8,642,667) |
|
|
|
|
|
|
|
|
|
|
|
|
|
|
|
|
Total deferred taxes recorded |
|
|
|
|
|
|
|
|
|
|
|
|
|
| (766,428) |
Notes to the financial statements
(In thousands of Brazilian Reais - R$, unless otherwise stated)
15 Provision for legal proceedings and judicial deposits
Accounting policy Provisions for legal proceedings are recognized as other expenses when the Company has a present legal or constructive obligation as a result of past events; it is probable that an outflow of resources will be required to settle the obligation; and the amount has been reliably estimated.
The assessment of probability loss includes the available evidence, hierarchy of laws, jurisprudence, the most recent court decisions and relevance in the legal system, as well as the opinion of outside counsel. Provisions are reviewed and adjusted according to circumstances, such as limitation period, conclusions of tax inspections or additional exposures identified based on new matters or court decisions.
Provisions for legal proceedings resulting from business combinations are estimated at fair value at acquisition date. |
The Company had provision for legal proceedings and judicial deposits recorded at December 31, 2021 and December 31, 2020 in respect of:
| Provision for legal proceedings | ||||||
| Parent Company |
| Consolidated | ||||
| December 31, 2021 |
| December 31, 2020 |
| December 31, 2021 |
| December 31, 2020 |
Tax | 164,652 |
| 155,610 |
| 647,610 |
| 555,958 |
Civil, environmental and regulatory | 123,420 |
| 75,001 |
| 585,034 |
| 200,597 |
Labor | 73,787 |
| 78,208 |
| 411,417 |
| 131,239 |
| 361,859 |
| 308,819 |
| 1,644,061 |
| 887,794 |
| 143 |
Table of Contents
Notes to the financial statements
(In thousands of Brazilian Reais - R$, unless otherwise stated)
| Judicial deposit | ||||||
| Parent Company |
| Consolidated | ||||
| December 31, 2021 |
| December 31, 2020 |
| December 31, 2021 |
| December 31, 2020 |
Tax | 312,031 |
| 296,223 |
| 500,484 |
| 414,413 |
Civil, environmental and regulatory | 86,192 |
| 50,027 |
| 169,857 |
| 81,420 |
Labor | 33,368 |
| 34,477 |
| 252,720 |
| 48,393 |
| 431,591 |
| 380,727 |
| 923,061 |
| 544,226 |
Changes in provision for legal proceedings:
| Parent Company | ||||||
| Tax |
| Civil, environmental and regulatory |
| Labor |
| Total |
At January 1, 2020 | 163,793 |
| 56,001 |
| 81,584 |
| 301,378 |
Provisions | 1,826 |
| 24,886 |
| 12,653 |
| 39,365 |
Settlement / Write-offs | (8,974) |
| (11,749) |
| (16,930) |
| (37,653) |
Monetary variation (i) | (1,035) |
| 5,863 |
| 901 |
| 5,729 |
At December 31, 2020 | 155,610 |
| 75,001 |
| 78,208 |
| 308,819 |
Provisions | 13,174 |
| 47,580 |
| 9,815 |
| 70,569 |
Settlement / Write-offs | (3,298) |
| (23,047) |
| (17,240) |
| (43,585) |
Monetary variation (i) | (834) |
| 23,886 |
| 3,004 |
| 26,056 |
At December 31, 2021 | 164,652 |
| 123,420 |
| 73,787 |
| 361,859 |
| Consolidated | ||||||
| Tax |
| Civil, environmental and regulatory |
| Labor |
| Total |
At January 1, 2020 | 510,174 |
| 195,446 |
| 167,608 |
| 873,228 |
Provisions | 23,941 |
| 31,345 |
| 18,539 |
| 73,825 |
Settlement / Write-offs | (10,044) |
| (40,171) |
| (40,144) |
| (90,359) |
Monetary variation (i) | 31,887 |
| 13,977 |
| (14,764) |
| 31,100 |
At December 31, 2020 | 555,958 |
| 200,597 |
| 131,239 |
| 887,794 |
Corporate reorganization (Note 1.1) | 79,494 |
| 170,122 |
| 247,958 |
| 497,574 |
Provisions | 24,511 |
| 100,000 |
| 103,115 |
| 227,626 |
Settlement / Write-offs | (15,271) |
| (57,981) |
| (108,410) |
| (181,662) |
Monetary variation (i) | 2,918 |
| 172,296 |
| 37,515 |
| 212,729 |
At December 31, 2021 | 647,610 |
| 585,034 |
| 411,417 |
| 1,644,061 |
Notes to the financial statements
(In thousands of Brazilian Reais - R$, unless otherwise stated)
(i) Includes write-off of interest due to reversals.
The Company’s legal proceedings are secured by assets, cash deposit, bank guarantee or insurance guarantee.
The Company has indemnity actions in addition to those mentioned, which, since they are considered probable, were not recorded because they represent contingent assets.
a) Probable losses
Tax: The principal tax proceedings for which the risk of loss is probable are described below:
| Parent Company |
| Consolidated | ||||
| December 31, 2021 |
| December 31, 2020 |
| December 31, 2021 |
| December 31, 2020 |
Compensation with FINSOCIAL | — |
| — |
| 300,470 |
| 296,445 |
INSS - Social security | 61,439 |
| 63,109 |
| 97,847 |
| 73,835 |
State VAT - ICMS credit | 23,166 |
| 28,440 |
| 85,965 |
| 42,272 |
PIS and COFINS | 26,343 |
| 254 |
| 28,427 |
| 254 |
IPI - Excise tax credit - NT | 43,461 |
| 53,707 |
| 43,461 |
| 53,697 |
Federal income taxes | 1,103 |
| 900 |
| 8,553 |
| 9,508 |
Other | 9,140 |
| 9,200 |
| 82,887 |
| 79,947 |
| 164,652 |
| 155,610 |
| 647,610 |
| 555,958 |
Labor claims: The Company and its subsidiaries are also parties to a number of labor claims filed by former employees and service providers challenging, among other matters, the payment of overtime, night shift premiums and risk premiums, the recognition of employment relationships and the reimbursement of discounts from payroll, such as social contribution and trade union charges. Additionally, we are involved in several labor administrative and judicial proceedings such as labor investigations and class actions filed by the labor prosecutor’s office regarding alleged non-compliance with certain labor regulations, including work and safety rules, labor conditions and work environment, and social assistance plans. Moreover, we entered into certain consent orders (Termos de Ajustamento de Conduta) with Brazilian authorities and, in the event, we fail to comply with such consent orders, we could be subject to fines.
| 145 |
Table of Contents
Notes to the financial statements
(In thousands of Brazilian Reais - R$, unless otherwise stated)
Civil, Environmental and Regulatory Proceedings: The Company and its subsidiaries have several indemnity claims, public civil claims and administrative proceedings that individually are not material, where, in the opinion of its lawyers, the risk of loss is probable.
b) Possible losses
The principal proceedings for which we deem the risk of loss as possible are described below:
| Parent Company |
| Consolidated (i) | ||||
| December 31, 2021 |
| December 31, 2020 |
| December 31, 2021 |
| December 31, 2020 |
Tax | 4,652,106 |
| 4,525,112 |
| 14,647,917 |
| 9,761,688 |
Civil, environmental and regulatory | 900,472 |
| 936,634 |
| 6,939,743 |
| 1,710,495 |
Labor | 22,748 |
| 39,522 |
| 859,830 |
| 77,130 |
| 5,575,326 |
| 5,501,268 |
| 22,447,490 |
| 11,549,313 |
(i) With the corporate reorganization detailed in note 1.1, the processes were merged and are now consolidated.
The main variations in the balances of possible tax contingencies in the period ended December 31, 2021, are due to the corporate reorganization (note 1.1) generated by the subsidiary Rumo and subsidiaries. Below is a description of the main processes related to the merged balances:
Notes to the financial statements
(In thousands of Brazilian Reais - R$, unless otherwise stated)
Civil, environmental and regulatory:
| Parent Company |
| Consolidated | ||||
| December 31, 2021 |
| December 31, 2020 |
| December 31, 2021 |
| December 31, 2020 |
Civil (i) (ii) (iii) (vii) (viii) | 860,971 |
| 889,058 |
| 4,221,797 |
| 1,463,940 |
Environmental (iv) (v) | 39,459 |
| 47,537 |
| 1,472,542 |
| 172,218 |
Regulatory (vi) | 42 |
| 39 |
| 1,245,404 |
| 74,337 |
| 900,472 |
| 936,634 |
| 6,939,743 |
| 1,710,495 |
The Company and its subsidiaries are party to several legal and administrative proceedings in the civil, environmental and regulatory spheres, whose prognosis of loss is possible. In civil, the portfolio of cases is mostly composed of indemnity claims of a contractual and non-contractual nature. In the environmental area, the processes deal with terms of commitment, civil inquiries and public civil actions. With regard to large demands, the following are relevant cases:
| (i) | Rumo Malha Norte, Rumo Malha Sul, Rumo Malha Paulista and Rumo S.A. are parties to a confidential arbitration procedure, the total value of which amounts to R$1,128,164. The proceeding was initiated by the opposing party on the grounds that the Company had given rise to the termination of the rail transport and investment service contract, in view of which it claimed compensation. Rumo filed a counterclaim, through which it intends to recognize the groundlessness of the claims of the opposing party, as well as the liability of the opposing party to bear the losses and damages resulting from its unreasonable termination. There was an arbitration award, which is pending settlement. The Arbitration Proceeding is suspended until the matter relating to the alleged partiality of one of the Arbitrators is resolved. The amounts are classified as a possible contingency. |
| (ii) | Rumo Intermodal, upon taking over the business activities of another Company, not belonging to the Group, assumed the responsibility for payment related to the lawsuit arising from the dispute over the trademark, the amount involved in which is R$167,765. There was an equitable reduction of the amount to R$15,000, with an appeal by both parties. If this third company loses the demand and is obliged to make payment, it may sue Rumo in return, based on such obligation. The lawsuit is in the judgment settlement phase, and a provision has been set up for R$15,237 for the claim. |
| (iii) | Rumo Malha Sul is a party to a conduct adjustment agreement signed with the Federal Public Prosecutor's Office, in which the latter alleges that Rumo would not be carrying out cargo transport in Presidente Prudente region and, as a result, requested the of execution of a daily fine, as well as the increase in the amount of the fine. Rumo, in turn, filed a declaratory action to give the correct interpretation to the TAC (Conduct Adjustment Term), since its commitment was to try to get enough cargo to carry out the transport. Periodically, Rumo Malha Sul holds seminars in the region, but so far it has not been able to attract people interested in providing the services. The claims are in the lower court, awaiting court decision. The total contingency of the case is R$ 103,907, with 50% of the amounts provisioned and the remainder classified as possible. |
Notes to the financial statements
(In thousands of Brazilian Reais - R$, unless otherwise stated)
| (iv) | In November 2021, in the judgment of the administrative proceeding initiated by the representation of a former client, among other points, the Brazilian Antitrust Authority (Conselho Administrativo de Defesa Econômica), or “CADE” sentenced Rumo’s subsidiary to pay a fine in the amount of R$ 247,172, a decision that was upheld in the judgment of the declaration embargoes. The establishment of such amount is contrary to precedents of CADE itself, either in relation to the calculation basis or in relation to the rate used, which is why the subsidiary filed an action for annulment of such decision. Based on the technical analysis of its external legal body, the subsidiary assesses as probable the risk of loss of a portion in the amount of R$ 22,761 (for which it recorded a provision) and classifies the difference as a possible contingency. |
| (v) | Rumo Malha Sul filed a lawsuit against Brazilian Transportation Authority (Agência Nacional de Transporte Terrestre), or “ANTT”, to prevent registration with Information Register of Unpaid Credits of the Federal Public Sector (Cadastro Informativo de Créditos não Quitados do Setor Público Federal) , or “CADIN” due to alleged debts of quarterly installments of the concession agreement, which were not paid due to compensation made with labor debts that were the obligation of the extinct Rede Ferroviária Federal S.A.. There was a decision in favor of Rumo, preventing registration with CADIN, as well as stating that it is possible to offset amounts. Currently, the collection of credits and debits is waited for administrative compensation. The amount involved is R$ 127,820. |
| (vi) | Rumo Malha Sul was assessed, in 2014, by Brazilian Institute for the Environment and Natural Resources (Instituto Brasileiro do Meio Ambiente e dos Recursos Naturais Renováveis), or “IBAMA”, for alleged oil spills in violation of regulations. An administrative appeal was filed and a decision at the administrative level has been awaited since 2015. The amount involved is R$ 140,098. |
| (vii) | The subsidiary Moove was cited last year in the Public Civil Action seeking the payment of compensation for environmental pollution that occurred in the former area of Companhia Usina de Passivos. Several ACPs were filed against different companies and the original value attributed by the Public Ministry is R$288,000. We have filed a Dispute demonstrating that the subsidiary did not use the landfill and, at the moment, the judgment on the merits is awaited. The risk is inestimable, since there is a need to carry out a judgment settlement to verify and define the responsibility of each of the parties involved in the action. |
| (viii) | The Company is litigating in a lawsuit for collection of attorneys' fees filed by Alexandre Saddy Chade and others, where they demand the conviction of the Company and other defendants to pay the alleged attorneys' fees that would be due to the plaintiffs and that would amount to amounts close to R$280,000. On February 5, 2020, a judgment of dismissal was handed down. The proceeding awaits judgment of the Appellate Appeal of the Plaintiffs and the Company's Adhesive Appeal to increase the conviction in sums of loss. |
Civil, Environmental and Regulatory Proceedings: The Company and its subsidiaries have several Indemnity Actions, Public Civil Actions and Administrative Proceedings that individually are not relevant, where, according to the assessment of its lawyers, the risk of loss is possible.
Notes to the financial statements
(In thousands of Brazilian Reais - R$, unless otherwise stated)
Tax:
| Parent Company |
| Consolidated | ||||
| December 31, 2021 |
| December 31, 2020 |
| December 31, 2021 |
| December 31, 2020 |
Capital gain (i) | — |
| — |
| 29,516 |
| — |
Penalties related to tax positions (ii) | — |
| — |
| 461,747 |
| — |
Federal income taxes (iii) / (xii) | 822,039 |
| 632,758 |
| 5,404,264 |
| 3,834,562 |
ICMS - State VAT (iv) | 1,386,895 |
| 1,401,922 |
| 2,877,144 |
| 1,922,374 |
IRRF - Withholding tax (v) | 1,344 |
| 1,331 |
| 1,251,394 |
| 1,093,718 |
PIS and COFINS - Revenue taxes (vi) | 1,242,960 |
| 1,270,095 |
| 2,368,123 |
| 1,314,144 |
Financial transactions on loan (vii) | — |
| — |
| 8,450 |
| — |
MP 470 - Tax installments (viii) | 243,115 |
| 241,224 |
| 398,184 |
| 241,224 |
Stock Option (ix) | — |
| — |
| 65,260 |
| — |
IOF on Mutual (x) | — |
| — |
| 136,286 |
| — |
Compensation with IPI - IN 67/98 | 139,387 |
| 137,976 |
| 186,048 |
| 137,976 |
IPI - Excise tax credit - NT | 347,953 |
| 314,312 |
| 492,025 |
| 455,121 |
INSS - Social security and other | 110,213 |
| 155,143 |
| 180,533 |
| 210,357 |
Other | 358,200 |
| 370,351 |
| 788,943 |
| 552,212 |
| 4,652,106 |
| 4,525,112 |
| 14,647,917 |
| 9,761,688 |
| (i) | Tax assessment notices issued by the Federal Revenue Service (Receita Federal do Brasil) in 2011 and 2013 and 2019 against Rumo related to: a) disallowance of goodwill expense based on future profitability, as well as financial expenses; b) non-taxation of supposed capital gain on the sale of equity interest in a Company of the same economic group; and c) supposed capital gain on the incorporation of shares in companies of the same economic group. In 2019, the subsidiary had definitive success in terms of reducing the capital gain launch base. Contingency adjusted for ultimate success. |
| (ii) | The subsidiary Rumo was assessed for not considering the tax benefits of REPORTO (suspension of PIS and COFINS), under the allegation that the locomotives and wagons acquired in the year 2010 to 2012 were used outside the limits of the port area. Consequently, PIS and COFINS were required, in addition to the isolated fine corresponding to 50% of the value of the acquired assets. |
Notes to the financial statements
(In thousands of Brazilian Reais - R$, unless otherwise stated)
| (iii) | Tax assessment notices requiring IRPJ and CSLL related: (a) Goodwill Malha Norte: Tax assessment notices issued for the collection of IRPJ and CSLL, combined with interest on late payment and official and isolated fines. According to the Federal Revenue, Rumo Malha Norte would have unduly amortized the goodwill from the acquisition of the companies Brasil Ferrovias S.A. and Novoeste Brasil S.A. (b) GIF, TPG and Teaçu premiums. Infraction notices drawn up for the collection of IRPJ and CSLL, combined with an official fine and late payment interest, in addition to an isolated fine, for the following reasons: Deduction, from the actual profit and the CSLL calculation base, from the amount corresponding to the amortization in acquisition of interest in Teaçu Armazéns Gerais S.A.; Deduction, from real profit and CSLL calculation base, of the amount corresponding to the amortization of goodwill paid by the companies TPG Participações S.A. and GIF LOG Participações S.A. on the acquisition of shares issued by Rumo Logística S.A.; (c) Labor provisions: In 2009, under the allegation that the Company would have excluded labor provisions from the calculation of taxable income and the adjusted calculation base of CSLL. In the understanding of the Tax Authorities, the write-offs of the labor provisions were made by the Company without the individualization of the processes (provisions and reversals), which would have an impact on the tax assessment. The likelihood of loss is possible, considering that the occurrence of the decay and that the Company complied with all tax rules related to the addition and exclusion of provisions in the calculation of IRPJ and CSLL; (d) collection arising from the rejection of the request for restitution/compensation of the company's debts due to the alleged insufficiency of the income taxes Negative Balance credit. |
| (iv) | a) Infraction Notices drawn up by the São Paulo State Finance Department (Secretaria da Fazenda de São Paulo), against Rumo Malha Paulista, with the reporting of infractions for alleged lack collection of ICMS in the provision of rail transport services for export; improper credit of ICMS for alleged bookkeeping in the Book of Entries of amounts higher than those found in the Tax Books; improper credit of ICMS for acquisitions supposedly classified as use and consumption. Fines of 50% of the tax amount and 100% of the amount of credit considered undue were also included. b) state tax authorities assessed the charges for non-taxation by ICMS on the invoices for the provision of rail freight services for export. All assessments were challenged, since there is a favorable position for taxpayers consolidated in the higher courts, based on the Federal Constitution and Complementary Law 87/1996 c) the Treasury of the State of Mato Grosso drew up several Terms of Seizure and Deposit (TADs) in order to collect ICMS and a 50% fine on the value of the fined operations, under the mistaken understanding that the goods exit operations destined for export would be cancelled with the DACTEs (Auxiliary Document of Electronic Transport Knowledge), with the supposed characterization of untrue documentation, under the terms of articles 35-A and 35-B of State Law 7098/98. The Company and its subsidiaries contest challenge the assessments and demonstrate to the Tax Authorities that the goods transported were duly covered by suitable tax documentation; d) collection of ICMS, for the years 2018 and 2019, in the acquisition of wagons as a result of the alleged non-exemption provided for by the Tax System for Incentives to the Modernization and Expansion of the Port Structure - REPORTO by the São Paulo tax authorities. |
| (v) | Rumo Malha Paulista had part of its IRPJ credit balance offset partially disallowed by the Federal Revenue Service (Receita Federal do Brasil) based on the argument that the Company would not be entitled to IRRF offset on swap transactions. |
Notes to the financial statements
(In thousands of Brazilian Reais - R$, unless otherwise stated)
| (vi) | The administrative demands for PIS and COFINS in Rumo subsidiary are substantially related to the disallowance of PIS and COFINS credits by the non-cumulative system related to the following items: a) credits launched out of time unaccompanied by prior rectification of tax returns; b) claims on expenses arising from mutual traffic contracts; c) credits related to expenses with services classified as inputs in the activity carried out by the Company that supposedly were not proven during the Inspection; d) credits on expenses with transportation of employees; e) credits related to electricity expenses; f) credits on expenses with machinery rentals and rentals that were not proven in the course of the Inspection; g) credits on expenses on the acquisition of machinery, equipment and other assets incorporated into the subsidiary's fixed assets; and (h) and isolated fine corresponding to 50% of the value of the credits. |
| (vii) | Infraction Notices drawn up in the face of Rumo to demand differences in IRPJ, CSLL, PIS and COFINS, related to the calendar years 2005 to 2008, due to the following alleged a) undue deduction of the Real Profit and the Calculation Base of CSLL of financial expenses arising from loans entered into with financial institutions abroad, b) undue exclusion of CSLL's Real Profit and Calculation Base of financial income from securities issued by the Government of Austria and the Government of Spain, c) no inclusion, in the Real Profit and in the CSLL Calculation Base, of the gains earned in swap operations, and no taxation of the financial income resulting from such contracts by PIS and COFINS, d) undue exclusion of the Real Profit and the Calculation Base of CSLL, carried out as PIS and COFINS credits, e) undue exclusion of Real Profit and the CSLL Calculation Base carried out as deferred CSLL. f) undue exclusion of taxable income and the CSLL calculation basis made as deferred CSLL; and Violation g) insufficient payment of advances of IRPJ and CSLL, which generated the application of an isolated fine at the percentage of 50%, together with the fines of 75%. In 2019, we had definitive success regarding the completeness of the infractions “a”, “b”, “d”, “e” and “f”, as well as part of the infraction “c”, to recognize the possibility of exclusion of the actual profit and the CSLL calculation basis of the revenues arising from the Austrian public debt securities acquired on July 24, 2006 and, as a consequence, of part of the infraction “g”, in the extension of the partial cancellation of the item “c”. Contingency adjusted for ultimate success. The remainder of item “g” remains under administrative discussion. The discussion on the remainder of item “c” ended at the administrative level and continued at the judicial level. |
| (viii) | The Federal Revenue Service (Receita Federal do Brasil) partially rejected the requests for installment payments of federal tax debts made by Rumo Malha Sul and Rumo Intermodal, on the grounds that the tax losses offered by the companies were not sufficient to settle the respective debts. The probability of loss is considered as possible since the losses identified existed and were available for that use. |
| (ix) | Tax assessment notices drawn up against the Company for the collection of social security contributions (20% of the amount paid) of amounts referring to the Stock Option Plan granted to employees, administrators and third parties. The main basis for the assessment is the alleged remuneration. |
| (x) | a) The Federal Treasury intends to enforce the levy of IOF on the current accounts maintained by the parent Company for Rumo and its subsidiaries (most substantial part of the assessment). In the understanding of the tax authorities, the use of an accounting item as advances for expenses to related companies, without a formal loan agreement, characterizes the existence of a current account, and the IOF due must be determined according to the rules specific to revolving credit operations. The tax assessment notices are still being questioned at the administrative level; b) Tax Assessment Notice issued by the Federal Tax Authorities against Rumo Malha Norte for alleged failure to pay IOF in the period 2017 and 2018, relating to the collection of alleged financial transactions between the group companies, essentially on the remittance of amounts arising from mutual traffic between Malha Norte and Malha Paulista, contracts with Raízen and other amounts listed in other accounting accounts. |
Notes to the financial statements
(In thousands of Brazilian Reais - R$, unless otherwise stated)
| (xi) | Rumo Malha Sul transmitted nineteen clearing statements (DCOMP) via the PERD/COMP electronic system, referring to "premium credit", using credit acquired from third parties (Fibra S.A. Indústria e Comércio and others). Such Dcomps for referring to credit of third parties and also to "credit - premium", in accordance with the current legislation, were considered as not declared in Decision Order contained in the administrative process, with awareness to the taxpayer on 09/24/2013, giving rise thus the application of a 75% fine in compliance with art. 18, §4 of Law No. 10,833 / 2003. |
| (xii) | On November 5, 2012, Provence Participações S.A., or “Provence,” a company controlled by Cosan, acquired Comgás from BG Gás São Paulo Investments BV (“BG”) for R$3,400,000 and recorded goodwill of R$2,482,767. On December 19, 2012, Comgás merged Provence and, as a result, Comgás recorded deferred tax assets in the amount of R$844,141, related to the goodwill previously recorded in Provence. In April 2016, Comgás received tax assessment notices from the Brazilian tax authorities, relating to the years ended in 2013 and 2014, referring to the amortization of the goodwill paid for the acquisition in the downstream merger. On February 14, 2020, Comgás received tax assessment notices for the years ended 2015 and 2016, in the amount of R$1,228,416. On September 13, 2021, the subsidiary Comgás was notified of the issuance of a tax assessment notice for the collection of IRPJ and CSL related to the 2017 and 2018 calendar years, plus a qualified fine and interest, in the amount of R$785,366. The Federal Revenue Service of Brazil understood that Comgás had (i) unduly amortized the goodwill paid on its acquisition by Provence Participações S.A; (ii) deducting excess JCP, due to undue amortization of goodwill; and (iii) failed to correctly collect the monthly estimates of IRPJ and CSLL. The Company's lawyers evaluated the probability of loss as: (i) possible for the collection of IRPJ/CSLL, officio fine, isolated fine for failure to pay estimates and interest, and (ii) remote for the qualified fine. |
The Company’s and its subsidiaries attorneys have assessed the likelihood of loss as possible therefore no provision was recorded as per CPC25 / IAS 37.
The Company has not identified effects of IFRIC 23 / ICPC 22 - Uncertain Tax Position that could affect Company’s accounting policies and these interim financial statements.
Labor:
One of Rumo's subsidiaries, Rumo Malha Paulista, is currently a party to a Public Civil Action that is being processed in the Labor Court. This process originated from an inspection carried out against the company MS Teixeira, which was subcontracted by Prumo Engenharia Ltda. (“Prumo Engenharia”) which, in turn, was contracted by Rumo. The inspection alleged that the workers of MS Teixeira worked in degrading conditions analogous to slavery. Prumo Engenharia assumed full responsibility for the condition of these employees, including labor and contractual liabilities, as well as all losses arising from the alleged working conditions instituted by its subcontractors. Prumo Engenharia terminated these workers' employment contracts, which were ratified by the then Ministry of Labor and Employment, noting that Rumo did not participate in these acts. In addition, a criminal investigation was opened against Rumo, which was shelved. Notwithstanding the foregoing, the Labor Public Prosecutor's Office also filed a public civil action (ACP) against Malha Paulista, without including Prumo in the dispute, requesting the payment of compensation for collective pain and suffering in the amount of R$100,000 (among other commitments), judged partially valid, condemning the subsidiary to obligations to do and not to do, as well as collective moral damages of R$15,000. In addition to demonstrating that Rumo did not participate in the practice of irregularities, the subsidiary understands that the action should be filed against Prumo, which is discussed on appeal. The risk of loss is considered possible and the case is awaiting decision by the Superior Labor Court (Tribunal Superior do Trabalho, or “TST”).
Notes to the financial statements
(In thousands of Brazilian Reais - R$, unless otherwise stated)
16 Shareholders’ equity
a) Share capital
Accounting policy Incremental costs directly attributable to the issue of ordinary shares are recognized as a deduction from equity. Income taxes relating to transaction costs of an equity transaction are accounted for in accordance with policy described in Note 14 - Income tax and social contribution. |
The subscribed capital is R$6,365,853 as of December 31, 2021, and R$5,727,478 as of December 31, 2020, fully paid in, is represented by 1,874,070,932 nominative common shares, book-entry and without par value. According to the bylaws, the authorized capital may be increased up to the limit of R$7,000,000.
On May 6, 2021, the Company split the issued shares, in the proportion of 1:4, without changing the share capital. The split of shares was approved at the Annual and Extraordinary General Meeting on April 30, 2021.
At December 31, 2021 the Company’s share capital is composed of the following:
|
| Common shares | ||
Shareholders - Common shares |
| Quantity |
| % |
Controlling group |
| 672,762,132 |
| 35.90% |
Board of directors and executive officers |
| 25,285,335 |
| 1.35% |
Free float |
| 1,170,582,693 |
| 62.46% |
Total shares outstanding |
| 1,868,630,160 |
| 99.71% |
|
|
|
|
|
Treasury shares |
| 5,440,772 |
| 0.29% |
Total |
| 1,874,070,932 |
| 100.00% |
As a consequence of the corporate reorganization detailed in note 1.1, it was deliberate to increase the Company's capital by R$638,375, in addition to the effect of a reduction in the capital reserve in the amount of R$1,400,557.
Notes to the financial statements
(In thousands of Brazilian Reais - R$, unless otherwise stated)
b)�� Treasury shares
Accounting policy Treasury shares represent the stocks that are repurchased by the company and are available for specific and limited intents. For accounting purposes, Cosan hold the shares required to meet the future employee share-based payment plans and the volume is treated in the same manner as treasury shares. |
On December 31, 2021, the Company had 5,440,772 shares in treasury (11,749,038 shares on December 31, 2020), whose market price was R$21,69. This reduction refers to: (i) the cancellations of 10,000,000 shares, equivalent to R$496,916 resulting from the corporate restructuring process as presented in note 1.1, effective on February 2, 2021, (ii) split of shares issued by the Company on April 30, 2021, of 1:4, (iii) repurchase of 60,000 shares equivalent to R$4,778, and (iv) delivery of 1,393,156 shares to members of the share-based compensation plans and (v) sale of 363,263 equivalent to R$4,603 to members of the share-based criteria plans. The amount of cash received of R$8,428 from the executives generated a gain of R$3,825 in the capital reserve item.
On March 26, 2021, the Company approved the common share buyback program, with a maximum of 68,000,000 shares, representing 5.89% of the total shares available on the market, with the deadline until September 25, 2022, for the purpose of keeping in treasury, cancellation or sale.
c) Statutory reserve - special reserve
Accounting policy Its purpose is to reinforce working capital, finance the maintenance, expansion and development of activities that make up the Company's corporate purpose. |
d) Legal Reserve
Accounting policy It is constituted through the appropriation of 5% of the net income for the year up to the limit of 20% of the capital stock, pursuant to Law 6,404. |
Notes to the financial statements
(In thousands of Brazilian Reais - R$, unless otherwise stated)
e) Dividends
Accounting policy The Company's bylaws, at the end of the year, are intended for the minimum mandatory dividend corresponding to 25% of annual net income adjusted by the equity variation of reserves, pursuant to corporate law.
Dividends, allocation of net income for the year and excess profit reserves, as determined in art. 199 of the Brazilian Corporation Law will be the subject of deliberations at the next Annual Shareholders' Meeting. |
- Payable
|
| December 31, 2021 |
Net income for the year |
| 6,123,216 |
Constitution of the legal reserve - 5% |
| (306,160) |
Calculation basis for dividend distribution |
| 5,817,056 |
Minimum mandatory dividends - 25% |
| (1,454,263) |
Statutory Reserve |
| 4,362,793 |
|
|
|
Movement of dividends payable |
|
|
At December 31, 2019 |
| 588,753 |
Dividends for the year |
| 202,316 |
Dividends paid |
| (574,140) |
At December 31, 2020 |
| 216,929 |
Interim dividends current year |
| 412,131 |
Dividends for the year |
| 1,454,263 |
Dividends eliminated in merger (note 1.1) |
| (148,030) |
Dividends paid |
| (1,181,011) |
At December 31, 2021 |
| 754,282 |
Notes to the financial statements
(In thousands of Brazilian Reais - R$, unless otherwise stated)
- Receivable
Parent Company |
| Investments in associates |
| Investments in joint venture |
| Total |
At December 31, 2020 |
| 83,200 |
| 77,494 |
| 160,694 |
Proposed Dividends |
| 782,209 |
| 30,745 |
| 812,954 |
Merged net assets CIP |
| — |
| 808,289 |
| 808,289 |
Interest on capital proposed |
| 52,360 |
| 189,378 |
| 241,738 |
Dividends received |
| (895,022) |
| (588,562) |
| (1,483,584) |
At December 31, 2021 |
| 22,747 |
| 517,344 |
| 540,091 |
|
|
|
|
|
|
|
Consolidated |
| Investments in associates |
| Investments in joint venture |
| Total |
At December 31, 2020 |
| 67 |
| 77,494 |
| 77,561 |
Proposed Dividends |
| 18,980 |
| 1,070,201 |
| 1,089,181 |
Interest on capital proposed |
| — |
| 189,378 |
| 189,378 |
Dividends received |
| (16,426) |
| (819,729) |
| (836,155) |
At December 31, 2021 |
| 2,621 |
| 517,344 |
| 519,965 |
f) Other comprehensive (loss) income
|
| December 31, 2020 |
| Comprehensive (loss) income |
| December 31, 2021 |
Loss on cash flow hedge |
| (761,203) |
| (601,415) |
| (1,362,618) |
Foreign currency translation effects |
| 782,899 |
| 310,467 |
| 1,093,366 |
Actuarial loss on defined benefit plan |
| (363,375) |
| 63,382 |
| (299,993) |
Deferred tax on actuarial losses of defined benefit plan |
| 123,547 |
| (21,550) |
| 101,997 |
Gain on measurement of derivative financial instrument |
| (45,631) |
| — |
| (45,631) |
Change in fair value of financial assets net of tax |
| 26,256 |
| 2,269 |
| 28,525 |
Total |
| (237,507) |
| (246,847) |
| (484,354) |
|
|
|
|
|
|
|
Attributable to: |
|
|
|
|
|
|
Owners of the Company |
| (252,610) |
| (268,999) |
| (521,609) |
Non-controlling interests |
| 15,103 |
| 22,152 |
| 37,255 |
Notes to the financial statements
(In thousands of Brazilian Reais - R$, unless otherwise stated)
|
| December 31, 2019 |
| Comprehensive (loss) income |
| December 31, 2020 |
Loss on cash flow hedge |
| (234,575) |
| (526,628) |
| (761,203) |
Foreign currency translation effects |
| 50,184 |
| 732,715 |
| 782,899 |
Actuarial loss on defined benefit plan |
| (202,444) |
| (37,384) |
| (239,828) |
Gain on measurement of derivative financial instrument |
| (45,631) |
| — |
| (45,631) |
Change in fair value of financial assets net of tax |
| 25,979 |
| 277 |
| 26,256 |
Total |
| (406,487) |
| 168,980 |
| (237,507) |
|
|
|
|
|
|
|
Attributable to: |
|
|
|
|
|
|
Owners of the Company |
| (349,501) |
| 96,891 |
| (252,610) |
Non-controlling interests |
| (56,986) |
| 72,089 |
| 15,103 |
17 Earnings per share
Accounting policy a) Basic earnings per share Basic earnings per share are calculated by dividing:
b) Diluted earnings per share Diluted earnings per share adjusts the values used in determining basic earnings per share to account for:
|
Notes to the financial statements
(In thousands of Brazilian Reais - R$, unless otherwise stated)
Basic earnings per share are calculated by dividing net earnings by the weighted average number of common shares outstanding during the period. The diluted earnings per share are calculated by adjusting the earnings and the number of shares by the impacts of potentially dilutive instruments.
On April 30, 2021, the split of the Company's shares in the proportion of 1:4 was approved at the Annual and Extraordinary General Meeting. Consequently, the weighted average of shares is being adjusted for all periods presented.
The following table sets forth the calculation of earnings per share (in thousands of Brazilian reais, except per share amounts):
|
| December 31, 2021 |
| December 31, 2020 (Restated) |
Profit attributable to the holders of the Company’s common shares used in the calculation of basic earnings per share |
| 6,123,216 |
| 851,858 |
Dilutive effect of the share-based plan of subsidiaries |
| (5,249) |
| (5,611) |
Profit attributable to the holders of the Company’s common shares used in the calculation of diluted earnings per share |
| 6,117,967 |
| 846,247 |
|
|
|
|
|
Weighted-average number of shares outstanding - basic (In thousands of shares) |
|
|
|
|
Basic |
| 1,834,533 |
| 1,542,344 |
Dilutive effect of the share-based plan |
| 4,687 |
| 4,248 |
|
|
|
|
|
Dilutive |
| 1,839,220 |
| 1,546,592 |
|
|
|
|
|
Earnings per share |
|
|
|
|
Basic |
| R$ 3.3378 |
| R$ 0.5523 |
Diluted |
| R$ 3.3264 |
| R$ 0.5472 |
Dilutive instruments
The Company’s subsidiaries have two categories of potential dilutive effects: share options and put options. For the share options, a calculation is done to determine the effect of the dilution in the profit attributable to shareholders of the parent due the exercise of the share options at subsidiaries. For the put option, is assumed to have been converted into ordinary shares, and the profit attributable to shareholders of the parent is adjusted.
Notes to the financial statements
(In thousands of Brazilian Reais - R$, unless otherwise stated)
Anti-dilutive instruments
In the year ended December 31, 2021, 45,765,000 shares related to the Company's share buyback plan were not considered in the diluted earnings per share analysis, as they increase earnings per share.
18 Net sales
Accounting policy The Company recognizes revenues from the following main sources:
The Company recognizes sales revenues upon delivery to the customer as long as revenue and costs can be measured reliably, receipt of the consideration is probable and there is no continuous involvement of management with the products. Delivery is considered to be the moment when the customer accepts the goods, and the risks and benefits related to the property are transferred.
The subsidiary Moove operates in the production and distribution of lubricants including the brands Mobil and Comma. Products are sold in contracts identified with individual customers and in sets, as a package of goods or services. |
Notes to the financial statements
(In thousands of Brazilian Reais - R$, unless otherwise stated)
Some lubricant sales contracts cannot be purchased separately from a package of services. However, the goods and services are clearly distinct in the contracts. This sales modality represents two separate performance obligations and therefore revenue will be recognized for each of these performance obligations when control of the respective goods and services is transferred to the customer. The transaction price be allocated to different performance obligations based on the independent selling price, in which revenues are identified, measured and recorded separately. Trade incentives, including cash incentives, discounts and volume rebates, and free or discounted goods or services, are accounted for as a reduction of revenue.
The Company provides gas distribution services through the subsidiary Comgás. The fair value and selling prices of individual services are broadly similar.
Gas distribution revenue is recognized when its value can be measured reliably, being recognized in the income statement in the same period in which the volumes are delivered to customers based on the monthly measurements made.
Unbilled revenue refers to the portion of gas supplied for which metering and billing to customers have not yet occurred. This amount is estimated based on the period between measurement and the last day of the month.
The actual volume billed may be different from estimates. The Company believes that, based on its historical experience with similar operation, the unbilled estimated amount will not significantly differ from actual amounts.
The construction of the infrastructure necessary for the distribution of gas is considered a construction service provided to the Granting Authority, and the related revenue is recognized over time based on the cost incurred method. The respective costs are recognized in profit or loss when incurred.
Advances received are included in contract liabilities. |
Notes to the financial statements
(In thousands of Brazilian Reais - R$, unless otherwise stated)
Revenue is recognized over time as services are provided. The stage of completion to determine the amount of revenue to be recognized is evaluated based on assessments of progress of work performed.
If services under a single contract occur in different periods, consideration is allocated based on their individual sales prices. The individual selling price is determined on the basis of the list prices at which the Group sells the services in separate transactions.
The Company recognizes revenue from electric energy supply to customers and wholesalers at fair value of the related consideration, for delivery of electric energy in a given period. The volume of electric energy delivered to buyer is determined on a monthly basis. Title to electric energy is transferred to customers when it is consumed by them. Invoices are issued monthly and are usually paid within 30 days from their issue date.
Revenue from energy trading is recorded based on bilateral contracts signed with market agents and duly registered with the Electric Energy Trading Chamber (“CCEE”).
Revenue is recognized based on the energy sold and at prices specified under the supply to customers and wholesalers contracts. The subsidiary Compass Comercialização may sell the energy produced in two environments: (i) in the Free Contracting Environment (Ambiente de Contratação Livre), or “ACL”, where energy trading takes place through free negotiation of prices and conditions between the parties, through bilateral contracts; and (ii) in the Regulated Contracting Environment (Ambiente de Contratação Regulada), or “ACR”, where energy is sold to distribution agents. |
Notes to the financial statements
(In thousands of Brazilian Reais - R$, unless otherwise stated)
a) Spot market The Company recognizes revenue at fair value of the consideration receivable when transactions in the spot market take place. The price of energy in these operations is based on the Price for Settlement of Differences Differences (Preço de Liquidação de Diferenças), or “PLD”.
b) Trading operations Energy trading operations are carried out in an active market and, for accounting measurement purposes, they meet the definition of financial instruments at fair value.
The Company recognizes revenue when energy is delivered to customers at fair value of the related consideration. In addition, unrealized net gains resulting from mark-to-market - difference between contracted and market prices - from open net contracted operations on the date of the financial statements are recognized in revenue.
Revenue from the provision of services is recognized when the subsidiary transfers to the counterparty the significant risks and benefits inherent to the provision of services, when it is probable that the economic benefits associated with the transaction will flow to the subsidiary, as well as when the related amount and costs are incurred. incurred can be measured reliably.
Services are priced based on work orders or contracts. Revenue is basically composed of rail freight, road freight, container transport and port lifting services, which is why the above criteria are normally met as the logistics service is provided.
The Company recognizes revenue when energy is delivered to the customer at the fair value of the consideration. Additionally, net unrealized gains arising from the mark-to-market – the difference between the contracted and market prices – of the net contracted operations outstanding on the date of the financial statements are recognized as revenue. |
Notes to the financial statements
(In thousands of Brazilian Reais - R$, unless otherwise stated)
Rental income is recognized on a straight-line basis over the term of each contract, to the extent that the contracts transfer to customers the right to use the assets for a period in exchange for consideration to the subsidiary, which can be measured reliably.
Revenue comprises the fair value of the consideration received or receivable for the disposal of investment properties in the ordinary course of the subsidiary's activities. Revenues are presented net of taxes, returns, rebates and discounts, and in the consolidated financial statements after eliminating sales within the subsidiary. Revenue is recognized when the subsidiary fulfills all obligations and promises identified in the contract for the transfer of goods to the customer. |
The following is an analysis of the Company’s and its subsidiaries net sales for the year:
|
| Consolidated | ||
|
| December 31, 2021 |
| December 31, 2020 |
Gross revenue from sales of products and services |
| 29,301,594 |
| 16,727,788 |
Construction revenue |
| 1,020,176 |
| 885,630 |
Indirect taxes and deductions |
| (5,414,620) |
| (4,104,631) |
Net sales |
| 24,907,150 |
| 13,508,787 |
Notes to the financial statements
(In thousands of Brazilian Reais - R$, unless otherwise stated)
In the following table, revenue is disaggregated by products and service lines and timing of revenue recognition:
|
| Consolidated | ||
|
| December 31, 2021 |
| December 31, 2020 |
At a point in time |
|
|
|
|
Natural gas distribution |
| 10,447,312 |
| 7,372,957 |
Electricity trading |
| 620,495 |
| 775,479 |
Lubricants and base oil |
| 5,546,093 |
| 4,283,704 |
Other |
| 278,217 |
| 59,146 |
|
| 16,892,117 |
| 12,491,286 |
Over time |
|
|
|
|
Railroad transportation services |
| 6,143,066 |
| — |
Port elevation |
| 335,965 |
| — |
Construction revenue |
| 1,020,176 |
| 885,630 |
Services rendered |
| 566,364 |
| 131,871 |
|
| 8,065,571 |
| 1,017,501 |
Elimination |
| (50,538) |
| — |
Total of net sales |
| 24,907,150 |
| 13,508,787 |
19 Costs and expenses by nature
The costs and expenses are presented in the statement of profit and loss by function. The reconciliation of income by nature/purpose is as follows:
|
| Parent Company |
| Consolidated | ||||
|
| December 31, 2021 |
| December 31, 2020 |
| December 31, 2021 |
| December 31, 2020 |
Raw materials |
| — |
| — |
| (4,610,773) |
| (3,137,178) |
Commodity cost (natural gas) |
| — |
| — |
| (6,137,104) |
| (3,867,044) |
Electricity purchased for resale |
| — |
| — |
| (968,503) |
| (927,913) |
Transportation and elevation expenses |
| — |
| — |
| (1,779,920) |
| — |
Natural gas transport cost |
| — |
| — |
| (1,074,441) |
| (753,603) |
Other transport |
| — |
| — |
| (149,562) |
| (147,813) |
Depreciation and amortization |
| (13,403) |
| (11,411) |
| (2,221,536) |
| (623,084) |
Personnel expenses |
| (168,114) |
| (90,322) |
| (1,851,688) |
| (674,914) |
Construction cost |
| — |
| — |
| (1,020,176) |
| (885,630) |
Expenses with third-party services |
| (34,601) |
| (32,413) |
| (699,808) |
| (310,290) |
Selling expenses |
| — |
| — |
| (23,697) |
| (23,387) |
Other |
| (79,358) |
| (47,272) |
| (800,864) |
| (399,193) |
|
| (295,476) |
| (181,418) |
| (21,338,072) |
| (11,750,049) |
Cost of sales |
| — |
| — |
| (18,568,049) |
| (9,816,078) |
Selling expenses |
| — |
| — |
| (716,210) |
| (927,346) |
General and administrative expenses |
| (295,476) |
| (181,418) |
| (2,053,813) |
| (1,006,625) |
|
| (295,476) |
| (181,418) |
| (21,338,072) |
| (11,750,049) |
Notes to the financial statements
(In thousands of Brazilian Reais - R$, unless otherwise stated)
20 Other income (expenses), net
| Parent company |
| Consolidated | ||||
| December 31, 2021 |
| December 31, 2020 |
| December 31, 2021 |
| December 31, 2020 |
Disposal of credit rights | — |
| (68,311) |
| — |
| (68,311) |
Gain from bargain purchase (Note 8.2.1) | 416,268 |
| — |
| 416,268 |
| — |
Reimbursement of gas losses in the process | — |
| — |
| — |
| 26,945 |
Tax extemporary credits (i) | 14,136 |
| 29,823 |
| 287,013 |
| 29,823 |
Change in fair value of investment properties (note 10.5) | — |
| — |
| 17,116 |
| — |
Gain (loss) on disposal of fixed assets and intangibles | (667) |
| (96) |
| 6,774 |
| (11,961) |
Legal proceedings provision, receivables and tax installments | (93,039) |
| 62,756 |
| (250,109) |
| 59,309 |
Settlement of disputes in the renewal process (ii) | — |
| — |
| 9,242 |
| — |
Other | 44,682 |
| (35,626) |
| (98,864) |
| 35,969 |
| 381,380 |
| (11,454) |
| 387,440 |
| 71,774 |
| (i) | Effect referring to the reversal of lease liabilities in registered litigation, related to labor credits from recourse lawsuits, of the subsidiary Rumo. |
| (ii) | Effect referring to the reversal of lease liabilities in dispute registered, related to labor credits from lawsuits for return, of subsidiary Rumo in the amount of R$52,963; and waiver of administrative and regulatory proceedings contemplated in the 7th Addendum to the Concession Agreement Renewal of the concession agreement of subsidiary Comgás in the amount of (R$43,721). |
21 Finance results
Accounting policy Finance income comprises interest income on funds invested, dividend income, fair value gains on financial assets at fair value through profit or loss, gains on the remeasurement to fair value of any pre-existing interest in an acquire in a business combination, gains on hedging instruments that are recognized in profit or loss and reclassifications of net gains previously recognized in other comprehensive income. Interest income is recognized as it accrues in profit or loss, using the effective interest method. Dividend income is recognized in profit or loss on the date that the Company’s right to receive payment is established, which in the case of quoted securities is normally the ex-dividend date. Finance expense comprise interest expense on borrowings, unwinding of the discount on provisions and deferred consideration, losses on disposal of available-for-sale financial assets, dividends on preference shares classified as liabilities, fair value losses on financial assets at fair value through profit or loss and contingent consideration, impairment losses recognized on financial assets (other than trade receivables), losses on hedging instruments that are recognized in profit or loss and reclassifications of net losses previously recognized in other comprehensive income. Borrowing costs that are not directly attributable to the acquisition, construction or production of a qualifying asset are recognized in profit or loss using the effective interest method.
Foreign exchange gains and losses on financial assets and financial liabilities are reported on a net basis as financial income or financial cost, depending on whether the net foreign currency fluctuations result in a gain or loss position. |
Notes to the financial statements
(In thousands of Brazilian Reais - R$, unless otherwise stated)
Details of finance income and costs are as follows:
| Parent Company |
| Consolidated | |||||
| December 31, 2021 |
| December 31, 2020 |
|
| December 31, 2021 |
| December 31, 2020 |
Cost of gross debt |
|
|
|
|
|
|
|
|
Interest on debt | (417,643) |
| (3,454) |
|
| (2,885,582) |
| (772,858) |
Monetary and exchange rate variation | (38,646) |
| — |
|
| (595,494) |
| (1,720,276) |
Derivatives and fair value measurement | 189,837 |
| 1,606,976 |
|
| 1,021,548 |
| 1,257,297 |
Amortization of borrowing costs | (7,513) |
| (4,412) |
|
| (119,894) |
| (5,916) |
Guarantees and warranties | — |
| — |
|
| (45,988) |
| (19,763) |
| (273,965) |
| 1,599,110 |
|
| (2,625,410) |
| (1,261,516) |
|
|
|
|
|
|
|
|
|
Income from financial investment and exchange rate in cash and cash equivalents | 79,149 |
| 53,049 |
|
| 581,548 |
| 261,218 |
| 79,149 |
| 53,049 |
|
| 581,548 |
| 261,218 |
|
|
|
|
|
|
|
|
|
Cost of debt, net | (194,816) |
| 1,652,159 |
|
| (2,043,862) |
| (1,000,298) |
|
|
|
|
|
|
|
|
|
Other charges and monetary variations |
|
|
|
|
|
|
|
|
Interest on other receivables | 46,355 |
| 59,181 |
|
| 410,499 |
| 173,206 |
Monetary variation of other financial assets | (43,081) |
| (208,901) |
|
| (43,081) |
| (208,901) |
Interest on other payables | (251,361) |
| (16,293) |
|
| (408,932) |
| (38,409) |
Interest on lease liabilities | (4,086) |
| (4,125) |
|
| (353,852) |
| (7,590) |
Interest on shareholders' equity | 116,783 |
| 70,862 |
|
| (8,288) |
| (2,526) |
Interest on contingencies and contracts | (25,799) |
| (30,568) |
|
| (299,132) |
| (131,703) |
Bank charges and other | (27,982) |
| (25,774) |
|
| (63,704) |
| (19,178) |
Exchange variation and non-debt derivatives | (777,858) |
| (1,895,712) |
|
| 34,067 |
| (27,163) |
| (967,029) |
| (2,051,330) |
|
| (732,423) |
| (262,264) |
|
|
|
|
|
|
|
|
|
Finance results, net | (1,161,845) |
| (399,171) |
|
| (2,776,285) |
| (1,262,562) |
|
|
|
|
|
|
|
|
|
Reconciliation |
|
|
|
|
|
|
|
|
Finance expense | (1,130,433) |
| (719,523) |
|
| (3,027,089) |
| (1,679,752) |
Finance income | 208,103 |
| 188,005 |
|
| 1,234,950 |
| 227,925 |
Foreign exchange, net | (500,948) |
| (1,399,682) |
|
| (608,655) |
| (1,612,525) |
Derivatives | 261,433 |
| 1,532,029 |
|
| (375,491) |
| 1,801,790 |
Finance results, net | (1,161,845) |
| (399,171) |
|
| (2,776,285) |
| (1,262,562) |
Notes to the financial statements
(In thousands of Brazilian Reais - R$, unless otherwise stated)
22 Post-employment benefits
Notes to the financial statements
(In thousands of Brazilian Reais - R$, unless otherwise stated)
| Consolidated | ||
| December 31, 2021 |
| December 31, 2020 |
Defined contribution |
|
|
|
Futura II | 190 |
| 129 |
Defined benefit |
|
|
|
Futura | 198,761 |
| 163,972 |
Health Plan | 470,524 |
| 564,576 |
| 669,285 |
| 728,548 |
| 669,475 |
| 728,677 |
a) Defined contribution
During the year ended 31 December 2021, the amount of sponsor contributions to the plans was to R$217 (R$150 as of December 31, 2020).
b) Defined benefit
Futura: The subsidiary CLE sponsors Futura - Entidade de Previdência Complementar ("Futura"), formerly Previd Exxon - Entidade de Previdência Complementar, whose main objective is to provide complementary benefits, within certain limits established in the Regulations of the Retirement Plan. This plan was amended to close it to new participants and approved by the competent authorities on May 5, 2011. During the year ended December 31, 2021, the contribution amounts totaled R$5,166 (R$7,044 for the year ended on December 31, 2020). The weighted average duration of the obligation is 9.6 years. In 2022, the subsidiary expects to make a contribution in the amount of R$60,560 in relation to its defined benefit plan; and
c) Medical plan
Comgás: Obligations related to post-employment benefit plans, which include medical assistance and retirement incentives, sick pay and disability pension.
The defined benefit pension plan is governed by Brazilian labor laws, which require final salary payments to be adjusted to the consumer price index at the time of payment upon retirement. The level of benefits provided depends on the member's length of service and salary at retirement age. During the year ended December 31, 2021, the amounts of contributions totaled R$25,169 (R$26,804 for the year ended December 31, 2020). The weighted average duration of the obligation is 11.7 years (14.9 years in 2020).
The details of the present value of the defined benefit obligation and the fair value of plan assets are as follows:
| December 31, 2021 |
| December 31, 2020 |
Actuarial obligation at beginning of the year | 1,249,156 |
| 1,249,630 |
Current service cost | 487 |
| 540 |
Interest expense | 88,299 |
| 89,253 |
Actuarial gain arising from financial assumptions | (183,159) |
| (58,250) |
Actuarial losses arising from experience adjustment | 77,111 |
| 30,267 |
Actuarial losses arising from adjustments to demographic assumptions | — |
| 14 |
Benefits payment | (70,201) |
| (62,298) |
Actuarial obligation at the end of the year | 1,161,693 |
| 1,249,156 |
|
|
|
|
Fair value of plan assets at the beginning of the year | (520,608) |
| (544,988) |
Interest income | (35,809) |
| (38,452) |
Earnings on assets greater than discount rate | 24,143 |
| 34,370 |
Contributions paid | (30,336) |
| (33,836) |
Benefit payments | 70,202 |
| 62,298 |
Fair value of plan assets at the end of the year | (492,408) |
| (520,608) |
Net defined benefit liability | 669,285 |
| 728,548 |
Notes to the financial statements
(In thousands of Brazilian Reais - R$, unless otherwise stated)
The total expense recognized in profit or loss is as follows:
| December 31, 2021 |
| December 31, 2020 |
Current service cost | (487) |
| (540) |
Interest expense | (52,490) |
| (45,567) |
| (52,977) |
| (46,107) |
Total amount recognized as accumulated other comprehensive income:
| December 31, 2021 |
| December 31, 2020 |
Accumulated at the beginning of the year | 59,898 |
| 66,299 |
Actuarial loss arising from financial assumptions | 183,159 |
| 58,250 |
Actuarial gain (loss) arising from experience adjustment | (77,111) |
| (30,267) |
Actuarial gains and losses arising from adjustments to demographic assumptions | — |
| (14) |
Earnings on assets greater than discount rate | (24,143) |
| (34,370) |
Accumulated at the end of the year | 141,803 |
| 59,898 |
The plan's assets are made up of the following:
| December 31, 2021 |
| December 31, 2020 | ||||
| Amount |
| % |
| Amount |
| % |
Fixed income bonds | 484,847 |
| 99.99% |
| 513,470 |
| 99.96% |
Other | 48 |
| 0.01% |
| 180 |
| 0.04% |
| 484,895 |
| 100.00% |
| 513,650 |
| 100.00% |
The plan's assets are composed of financial assets quoted in active markets and, therefore, are classified as Level 1 and Level 2 in the fair value assessment hierarchy. The overall expected rate of return on plan assets is determined based on market expectations prevailing on that date, applicable to the period during which the obligation is to be settled.
Notes to the financial statements
(In thousands of Brazilian Reais - R$, unless otherwise stated)
The main assumptions used to determine the Company's benefit obligations are as follows:
| Futura |
| Health Plan | ||||
| December 31, 2021 |
| December 31, 2020 |
| December 31, 2021 |
| December 31, 2021 |
Discount rate | 8.64% |
| 7.20% |
| 9.09% |
| 7.43% |
Inflation rate | 3.25% |
| 3.00% |
| 3.50% |
| 3.50% |
Future salary increases | N/A |
| N/A |
| 6.60% |
| 6.60% |
Aging factor | N/A |
| N/A |
| 3.00% |
| 3.00% |
Increase in pension plans | 3.25% |
| 3.00% |
| 3.00% |
| 6.60% |
Overall mortality (segregated by gender) | N/A |
| N/A |
| AT-2000 |
| AT-2000 |
Disable mortality table | N/A |
| N/A |
| IAPB-1957 |
| IAPB-1957 |
Entry into disability (modified) | N/A |
| N/A |
| UP-84 Modified |
| UP-84 Modified |
Turnover | N/A |
| N/A |
| 0,60/(service time+1) |
| 0,60/(service time+1) |
Sensitivity analysis
Changes in the discount rate for the balance sheet date is one of the relevant actuarial assumptions, while maintaining other assumptions, as it affects the defined benefit obligation as shown below:
| Discount rate | ||
| Increase |
| Decrease |
| 0.50% |
| -0.50% |
Futura | (28,170) |
| 30,525 |
COMGAS | (25,019) |
| 27,708 |
There was no change regarding the biometric and demographic assumptions in relation to previous years and the methods adopted in the preparation of the sensitivity analysis.
Notes to the financial statements
(In thousands of Brazilian Reais - R$, unless otherwise stated)
23 Share-based payment
Accounting policy
The fair value of share-based payment benefits at the grant date is recognized as employee benefit expense with a corresponding increase in shareholders’ equity for the period in which employees unconditionally acquire the right to benefits.
The amount recognized as an expense is adjusted to reflect the number of shares for which there is an expectation that the conditions of service and non-market acquisition conditions will be met in such a way that the amount finally recognized as an expense is based on the number of actions that meet the conditions of the service and non-market acquisition conditions on the date the vesting date is acquired. For non-vesting share-based payment benefits, the fair value on the grant date of the share-based payment is measured to reflect such conditions and there is no change to the difference between expected and actual benefits.
The fair value of the amount payable to employees in respect of share appreciation rights, which are settled in cash, is recognized as an expense with a corresponding increase in liabilities, over the period during which the employees become unconditionally entitled to payment. The liability is remeasured at each reporting date and at settlement date based on the fair value of the share appreciation rights. Any changes in the liability are recognized in profit or loss. |
The Company and its subsidiaries have Share-Based Compensation Plans that are settled in cash or equity. For the year ended December 31, 2021, the Group has the following share-based payment arrangements:
Notes to the financial statements
(In thousands of Brazilian Reais - R$, unless otherwise stated)
Plans prior to 2020
(i) Share granting plans (settled in shares), without lock-up, with delivery of shares at the end of the five-year period, conditioned only to the maintenance of the employment relationship (service condition).
(ii) Share-based compensation plan (settled in cash) in which a specific number of units referenced to a theoretical price of shares calculated based on the Group’s EBITDA of each year, is granted nominally to beneficiaries. The units will be paid in cash, upon fulfilment of the contractual conditions and 5 years of vesting period. Payments happen at the end of each cycle (5 years after grant date), based on the referenced converted value of the share at that time.
Plans granted in 2021
Share-based payment plan (Equity-settled)
On December 31, 2021, the Group established the following share-based payment arrangements:
Program |
| Vesting conditions |
Cosan - Investe I |
| 3 years of service from the grant date and achievement of specific metrics that can vary between 0% and 200% (to calculate the fair value, the achievement of 100% was considered). Performance shares will have a specific weight, according to the target established by the Board of Directors.
|
Cosan - Investe II |
| 4 years of service from the grant date and achievement of specific metrics that can vary between 0% and 150% (to calculate the fair value, the achievement of 100% was considered). Performance shares will have a specific weight, according to the target established by the Board of Directors.
|
Cosan - Investe III |
| 5 years of service from the grant date with restricted shares and additional restricted shares being delivered. The restricted shares being equivalent to 25% of the participant's Long-Term Incentive Program and the additional restricted shares transferred as a result of the Company's Matching.
|
Rumo –Special Program 2021 |
| 5 years of service from the grant date and achievement of specific metrics.
|
Rumo - Program 2021 |
| 3 years of service from the grant date and achievement of specific metrics that can vary between 0% and 150% (to calculate the fair value, the achievement of 100% was considered). |
Notes to the financial statements
(In thousands of Brazilian Reais - R$, unless otherwise stated)
In these programs, executives are entitled to shares with consideration of R$0.01 by executives, in which the concession is conditioned to the fulfillment of certain conditions of acquisition rights. The holders of such shares have the same rights as the holders of shares not subject to a vesting condition (e.g. dividends), therefore, the value of the shares granted is equal to the value of the shares acquired.
Share-based payment plan (Cash-settled)
The subsidiary Compass has awarded a phantom share plan that provides for the granting of share appreciation rights (“SARs”) and other cash-based awards to certain employees. SARs provide the opportunity to receive a cash payment equal to the fair market value of the Company's common shares, less the grant price.
The subsidiary Moove granted a Long-Term Incentive Plan (LTIP): “Moove Phantom Shares”. It is a phantom share plan, in which a specific number of units referenced to a theoretical price of shares calculated based on the Group’s EBITDA of each year, is granted nominally to beneficiaries. The units will be paid in cash, upon fulfilment of the contractual conditions and 5 years of vesting period. Payments happen at the end of each cycle (5 years after grant date), based on the referenced converted value of the share at that time.
The payment forecast is being provisioned monthly based on EBITDA projections that are reviewed each quarter. 62
Notes to the financial statements
(In thousands of Brazilian Reais - R$, unless otherwise stated)
(In thousands of Brazilian Reais - R$, unless otherwise stated)
Type of award / Grant date |
| Company |
| Expected life (years) |
| Shares granted |
| Exercised / canceled / transferred |
| Available |
| Fair value at grant date - R$ |
Share-based payment plan |
|
|
|
|
|
|
|
|
|
|
|
|
April 27, 2017 (ii) |
| Cosan S.A. |
| 5 |
| 1,096,000 |
| (954,028) |
| 141,972 |
| 9.25 |
July 31, 2017 |
| Cosan S.A. |
| 5 |
| 1,192,428 |
| (396,848) |
| 795,580 |
| 8.06 |
July 31, 2018 |
| Cosan S.A. |
| 5 |
| 842,408 |
| (107,576) |
| 734,832 |
| 9.65 |
July 31, 2019 |
| Cosan S.A. |
| 5 |
| 229,020 |
| (20,080) |
| 208,940 |
| 12.46 |
July 31, 2020 |
| Cosan S.A. |
| 5 |
| 68,972 |
| (6,704) |
| 62,268 |
| 20.93 |
July 31, 2021 - Invest I |
| Cosan S.A. |
| 3 |
| 424,839 |
| — |
| 424,839 |
| 24.38 |
September 10, 2021 - Invest II |
| Cosan S.A. |
| 4 |
| 5,283,275 |
| (660,410) |
| 4,622,865 |
| 22.24 |
October 11, 2021 - Invest III |
| Cosan S.A. |
| 5 |
| 809,944 |
| — |
| 809,944 |
| 23.20 |
|
|
|
|
|
| 9,946,886 |
| (2,145,646) |
| 7,801,240 |
|
|
|
|
|
|
|
|
|
|
|
|
|
|
|
April 20, 2017 |
| Comgás |
| 5 |
| 61,300 |
| (61,300) |
| — |
| 51.36 |
August 12, 2017 |
| Comgás |
| 5 |
| 97,780 |
| (97,780) |
| — |
| 54.25 |
August 1, 2018 |
| Comgás |
| 5 |
| 96,787 |
| (17,761) |
| 79,026 |
| 59.66 |
July 31, 2019 |
| Comgás |
| 5 |
| 83,683 |
| (14,794) |
| 68,889 |
| 79.00 |
February 01, 2020 |
| Compass Gás e Energia |
| 5 |
| 1,858,969 |
| (1,858,969) |
| — |
| 13.58 |
|
|
|
|
|
| 2,198,519 |
| (2,050,604) |
| 147,915 |
|
|
|
|
|
|
|
|
|
|
|
|
|
|
|
January 02, 2017 |
| Rumo S.A. |
| 5 |
| 1,476,000 |
| (1,476,000) |
| — |
| 6.10 |
September 01, 2017 |
| Rumo S.A. |
| 5 |
| 870,900 |
| (255,250) |
| 615,650 |
| 10.42 |
August 01, 2018 |
| Rumo S.A. |
| 5 |
| 1,149,544 |
| (308,417) |
| 841,127 |
| 13.94 |
August 15, 2019 |
| Rumo S.A. |
| 5 |
| 843,152 |
| (147,214) |
| 695,938 |
| 22.17 |
November 11, 2020 |
| Rumo S.A. |
| 5 |
| 776,142 |
| (115,303) |
| 660,839 |
| 20.01 |
May 05, 2021 |
| Rumo S.A. |
| 5 |
| 1,481,000 |
| (414,702) |
| 1,066,298 |
| 20.85 |
September 15, 2021 |
| Rumo S.A. |
| 3 |
| 1,560,393 |
| (8,422) |
| 1,551,971 |
| 18.20 |
|
|
|
|
|
| 8,157,131 |
| (2,725,308) |
| 5,431,823 |
|
|
Share-based payment plan (modification plans) |
|
|
|
|
|
|
|
|
|
|
|
|
August 18, 2011 (ii) |
| Cosan S.A. |
| 1 to 12 |
| 6,006,504 |
| (6,006,504) |
| — |
| 5.70 |
August 31, 2015 (i) |
| Cosan S.A. |
| 5 to 7 |
| 463,906 |
| (463,906) |
| — |
| 19.96 |
|
|
|
|
|
| 6,470,410 |
| (6,470,410) |
| — |
|
|
Cash-settled transactions |
|
|
|
|
|
|
|
|
|
|
|
|
July 31, 2019 |
| Moove |
| 5 |
| 132,670 |
| — |
| 132,670 |
| 6.74 |
July 31, 2020 |
| Moove |
| 5 |
| 106,952 |
| — |
| 106,952 |
| 13.36 |
July 31, 2021 |
| Moove |
| 3 |
| 80,729 |
| — |
| 80,729 |
| 8.29 |
August 1st, 2021 |
| Compass Gás e Energia |
| 2 |
| 26,625 |
| — |
| 26,625 |
| 27.27 |
August 1st, 2021 |
| Compass Comercialização |
| 2 |
| 31,535 |
| — |
| 31,535 |
| 27.27 |
August 1st, 2021 |
| Compass Gás e Energia |
| 3 |
| 152,770 |
| — |
| 152,770 |
| 27.27 |
August 1st, 2021 |
| TRSP |
| 3 |
| 33,634 |
| — |
| 33,634 |
| 27.27 |
November 1st, 2021 |
| Comgás |
| 3 |
| 172,251 |
| — |
| 172,251 |
| 27.27 |
November 1st, 2021 |
| Compass Gás e Energia |
| 3 |
| 1,474,367 |
| — |
| 1,474,367 |
| 27.27 |
|
|
|
|
|
| 2,211,533 |
| — |
| 2,211,533 |
|
|
Total |
|
|
|
|
| 28,984,479 |
| (13,391,968) |
| 15,592,511 |
|
|
Notes to the financial statements
(In thousands of Brazilian Reais - R$, unless otherwise stated)
(i) On February 02, 2021, 12,987 shares were settled in cash in the amount of R$ 645.
(ii) On September 30, 2021, the Company delivered 1,088,554 shares, equivalent to the amount of R$13,795. On December 31, 2021, it delivered 203,752 shares, equivalent to the amount of R$2,582.
a) Reconciliation of outstanding share options
The movement in the number of awards outstanding and their related weighted-average exercise prices are as follows:
|
| Stock option programs |
At January 1, 2020 |
| 6,311,839 |
Granted |
| 2,241,809 |
Vested |
| (2,549,619) |
At December 31, 2020 |
| 6,004,029 |
Granted |
| 11,531,359 |
Vested |
| (6,200,231) |
Transferred |
| 4,532,761 |
Canceled |
| (275,407) |
At December 31, 2021 |
| 15,592,511 |
b) Measurement of fair values
The weighted average fair value of the programs granted on December 31, 2021 and December 31, 2020 principal assumptions used in applying the Black-Scholes model were as follows:
|
| Share-based payment plan | ||||||||||||
|
| Cosan S.A. |
| Compass |
| Comgás |
| Rumo | ||||||
|
| December 31, 2021 |
| December 31, 2020 |
| December 31, 2021 |
| December 31, 2020 |
| December 31, 2021 |
| December 31, 2020 |
| December 31, 2021 |
Key assumptions: |
|
|
|
|
|
|
|
|
|
|
|
|
|
|
Share price at grant date |
| 23.20 |
| 50.88 |
| 27.27 |
| 13.58 |
| 78.58 |
| 78.58 |
| 18.20 |
Risk-free interest rate |
| 6.82% |
| 6.82% |
| N/A |
| N/A |
| 6.82% |
| 6.82% |
| 6.94% |
Volatility factor |
| 36.50% |
| 36.50% |
| N/A |
| N/A |
| 32.81% |
| 32.80% |
| 26.51% |
c) Expense recognized in profit or loss
Share-based compensation expense included in the statement of profit and loss for the year ended on December 31, 2021 and 2020 were R$ 81,424 and R$ 22,700, respectively. On September 30, 2021, the Company paid the first installment of Invest Cosan II, generating an expense in the amount of R$19,472.
(In thousands of Brazilian Reais - R$, unless otherwise stated)
24 Subsequent events
Subsequent material events that began before the end of the year ended December 31, 2021, and ended after that date were included in explanatory note 1.2 so that users of the financial statements have a better understanding of these events.
25 Recent accounting developments adopted by the Company
Applicable standard | Key requirements | Impact |
Interest Rate Benchmark Reform (Phase 1 and 2)
Amendments to CPC 48 / IFRS 9, CPC 38 / IAS 39 and CPC40 /IFRS 7 |
The amendments modified specific hedge accounting requirements so entities can continue to forecast future cash flows assuming that the interest rate benchmark continue despite ongoing reviews of interest rate benchmark reform. As a result there is no requirement for an entity to discontinue hedge relationships or to reassess the economic relationships between hedged items and hedging instruments as a result of the uncertainties of the interest rate benchmark reform. |
For phase 1 and 2, we do not have significant derivatives that refer to an interest rate benchmark, so these amendments have not had a material impact in the Company. |
COVID-19 − Related Rent Concessions (Amendment to CPC 06 / IFRS 16) |
Under the practical expedient, lessees are not required to assess whether eligible rent concessions are lease modifications, and instead are permitted to account for them as if they were not lease modifications. Rent concessions are eligible for the practical expedient if they occur as a direct consequence of the COVID-19 pandemic and if all of the following criteria are met:
The amendment is effective for annual periods beginning on or after June 1, 2020. |
There has been no change in the consideration for the leases that we are both lessees and lessors. |
All other standards or amendments to standards issued by the Accounting Pronouncements Committee (“CPC”) and the International Accounting Standards Board (“IASB”) and that became effective on January 1, 2021 were not applicable or material to the Company.
Notes to the financial statements
(In thousands of Brazilian Reais - R$, unless otherwise stated)
26 New standards and interpretations not yet effective
The following new standards, interpretations and amendments were issued by the CPC and the IASB, but are not effective for annual periods beginning after January 1, 2021. Early adoption is not permitted. In addition, based on an initial review, the Company currently believes that the adoption of these standards/amendments below will not have a material impact on the Company's consolidated results or financial position.
Applicable standard | Key requirements or changes in accounting policy |
Amendments to CPC 48 / IFRS 9, CPC38 / IAS 39, CPC40 / IFRS 7, CPC11 / IFRS 4 and CPC 06 / IFRS 16
Effective from the year ended 31 December 2021 | The amendments are applicable when an existing interest rate benchmark is replaced by another interest rate benchmark. The amendments provide a practical expedient that modifications to asset and liability values as a direct consequence of the interest rate benchmark reform and made on an economically equivalent basis (i.e. where the basis for determining contractual cash flows is the same), can be accounted for by only updating the effective interest rate.
Additionally, hedge accounting is not discontinued solely because of the replacement of another interest rate benchmark. Hedging relationships (and related documentation) must instead be amended to reflect modifications to the hedged item, hedging instrument and hedged risk. |
IFRS 17 Insurance Contracts
Effective from the year ended December 31, 2023 | This standard introduces a new model for accounting for insurance contracts. Work continues to review existing arrangements to determine the impact on adoption. |
All other standards or amendments to standards issued by the CPC and IASB and that are in effect as of January 1, 2022, are not applicable or relevant to the Company.
SIGNATURES
Pursuant to the requirements of the Securities Exchange Act of 1934, the registrant has duly caused this report to be signed on its behalf by the undersigned, thereunto duly authorized.
Date: February 18, 2022
COSAN S.A. | |
By: | /s/ Ricardo Lewin |
| Name: Ricardo Lewin |
| Title: Chief Financial and Investor Relations Officer |