UNITED STATES
SECURITIES AND EXCHANGE COMMISSION
Washington, D.C. 20549
FORM 6-K
Report of Foreign Issuer
Pursuant To Rule 13a-16 Or 15d-16 of the
Securities Exchange Act of 1934
For the month of August 2024
Commission File Number: 333-251238
|
COSAN S.A.
(Exact name of registrant as specified in its charter)
N/A
(Translation of registrant’s name into English)
|
Av. Brigadeiro Faria Lima, 4100, – 16th floor
São Paulo, SP 04538-132 Brazil
(Address of principal executive offices)
Indicate by check mark whether the registrant files or will file annual reports under cover of Form 20-F or Form 40‑F:
Form 20-F ☒ Form 40-F ☐
Indicate by check mark if the registrant is submitting the Form 6-K in paper as permitted by Regulation S-T Rule 101(b)(1):
Yes ☐ No ☒
Indicate by check mark if the registrant is submitting the Form 6-K in paper as permitted by Regulation S-T Rule 101(b)(7):
Yes ☐ No ☒

CONTENT
| Tel.: 55 11 3848 5880 Fax: + 55 11 3045 7363 www.bdo.com.br | Rua Major Quedinho, 90 Consolacao - Sao Paulo, SP Brasil 01050-030 |

To the
Shareholders, Board Members and Management of
Cosan S.A.
São Paulo - SP
Introduction
We have reviewed the individual and consolidated interim financial information of Cosan S.A. (“Company”), included in the quarterly information, for the quarter ended June 30, 2024, which comprises the individual and consolidated interim statement of financial position as at June 30, 2024, and the respective individual and consolidated interim statements of profit or loss and comprehensive income for the three- and six-month periods then ended, and the of changes in equity and cash flows for the six-month period then ended, including the notes to the financial information.
The Company’s and its controlled companies’ Management is responsible for the preparation of this individual and consolidated interim financial information in accordance with NBC TG 21 (R4) and with International Accounting Standard (IAS) 34 - Interim Financial Reporting, issued by the International Accounting Standards Board (IASB), and for the presentation of this interim financial information in accordance with the standards issued by the Brazilian Securities and Exchange Commission (CVM) applicable to quarterly information. Our responsibility is to express a conclusion on the individual and consolidated interim financial information based on our review.
Scope of the review
We conducted our review in accordance with Brazilian and international standards on review engagements (NBC TR 2410 and ISRE 2410 - Review of Interim Financial Information Performed by the Independent Auditor of the Entity). A review of interim financial information consists principally of applying analytical and other review procedures and making enquiries of and having discussions with persons responsible for financial and accounting matters. An interim review is substantially less in scope than an audit conducted in accordance with auditing standards and does not provide assurance that we would become aware of any or all significant matters that might be identified in an audit. Accordingly, we do not express such an audit opinion.
Conclusion on the individual and consolidated interim financial information
Based on our review, we are not aware of any fact that would leads us to believe that the individual and consolidated interim financial information included in the accompanying Quarterly Information has not been prepared, in all material respects, in accordance with NBC TG 21 (R4) and IAS 34, applicable to the preparation of the Quarterly Information, and presented in accordance with the standards issued by CVM.
| Tel.: 55 11 3848 5880 Fax: + 55 11 3045 7363 www.bdo.com.br | Rua Major Quedinho, 90 Consolacão - São Paulo, SP Brasil 01050-030 |
Other matters
Individual and consolidated interim statements of value added – Supplementary information
The interim financial information referred to above includes the individual and consolidated statements of value added for the six-month period ended June 30, 2024, prepared under the responsibility of the Company's Management and presented as supplementary information for the purposes of IAS 34. These statements were submitted to review procedures executed with the review of the quarterly information, with the purpose of concluding whether they are reconciled with the interim financial information and accounting records, as applicable, and if its form and contents meet the criteria defined in NBC TG 09 – Statement of Value Added. Based on our review, we are not aware of any fact that would lead us to believe that these statements of value added were not prepared, in all material respects, in accordance with the criteria established in this standard and consistently with the individual and consolidated interim financial information taken as a whole.
Interim financial information for the previous quarter reviewed by another independent auditor
The corresponding amounts related to the individual and consolidated interim financial information for the quarter ended June 30, 2023, originally prepared before the reclassifications disclosed in Note 3.1, were reviewed by other independent auditors and their review report issued, without modification, in August 14, 2023. We also reviewed the reclassifications described in Note 3.1 that were carried out to change the corresponding values relating to the individual and consolidated interim financial information for the three and six-month period as of June 30, 2023. In our conclusion, such reclassifications are appropriate and were correctly carried out. We were not engaged to audit, review or apply any other procedures to the Company's individual and consolidated interim financial information for the corresponding three and six-month period ended June 30, 2023 and, therefore, we do not express an opinion or any form of assurance regarding this individual and consolidated interim financial information, taken as a whole.
The accompanying financial information has been translated into English for the convenience of readers outside Brazil.
São Paulo, August 14, 2024.
 |
BDO RCS Auditores Independentes SS Ltda. CRC 2 SP 013846/O-1 |
|
|
Luiz Gustavo Pereira dos Santos |
Accountant CRC 1 SP 258849/O-9 |
(In thousands of Reais)
|
|
| Parent Company |
| Consolidated | ||||
| Note |
| 06/30/2024 |
| 12/31/2023 |
| 06/30/2024 |
| 12/31/2023 |
Assets |
|
|
|
|
|
|
|
|
|
Cash and cash equivalents | 5.2 |
| 1,800,369 |
| 1,769,976 |
| 17,230,061 |
| 14,658,481 |
Restricted cash | 5.3 |
| — |
| — |
| 8,435 |
| 7,860 |
Marketable securities | 5.3 |
| 598,482 |
| 705,777 |
| 3,861,784 |
| 3,407,955 |
Trade receivables | 5.7 |
| — |
| — |
| 4,159,171 |
| 3,330,488 |
Derivative financial instruments | 5.6 |
| 2,437 |
| 54,935 |
| 653,526 |
| 202,399 |
Inventories | 7 |
| — |
| — |
| 2,146,516 |
| 1,792,714 |
Receivables from related parties | 5.8 |
| 52,803 |
| 173,351 |
| 298,632 |
| 251,471 |
Income tax receivable |
|
| 415,141 |
| 508,268 |
| 882,389 |
| 888,942 |
Other recoverable taxes | 6 |
| 5,278 |
| 8,346 |
| 796,915 |
| 745,856 |
Dividend receivable | 17 |
| 179,478 |
| 319,135 |
| 299,249 |
| 255,777 |
Sectorial financial assets | 5.10 |
| — |
| — |
| 167,034 |
| 207,005 |
Other financial assets |
|
| — |
| — |
| 687 |
| 690 |
Other current assets |
|
| 75,293 |
| 177,001 |
| 680,692 |
| 722,386 |
|
|
| 3,129,281 |
| 3,716,789 |
| 31,185,091 |
| 26,472,024 |
Current assets held for sale | 8 |
| 5,045 |
| 2,998 |
| 2,374,980 |
| 2,138,165 |
Current assets |
|
| 3,134,326 |
| 3,719,787 |
| 33,560,071 |
| 28,610,189 |
|
|
|
|
|
|
|
|
|
|
Trade receivables | 5.7 |
| — |
| — |
| 62,755 |
| 114,148 |
Marketable securities | 5.3 |
| — |
| — |
| 111,554 |
| 96,006 |
Restricted cash | 5.3 |
| 41,679 |
| 81,621 |
| 160,299 |
| 195,392 |
Deferred tax assets | 15 |
| 3,448,139 |
| 2,478,911 |
| 6,673,747 |
| 5,609,030 |
Receivables from related parties | 5.8 |
| 262,910 |
| 174,745 |
| 67,004 |
| 88,620 |
Income tax receivable |
|
| — |
| — |
| 424,642 |
| 432,360 |
Other recoverable taxes | 6 |
| 34,414 |
| 33,639 |
| 1,224,932 |
| 1,132,703 |
Judicial deposits | 16 |
| 412,556 |
| 403,489 |
| 1,030,954 |
| 895,901 |
Derivative financial instruments | 5.6 |
| 776,014 |
| 102,881 |
| 2,004,133 |
| 2,344,400 |
Sectorial financial assets | 5.10 |
| — |
| — |
| 422,242 |
| 341,695 |
Other non-current assets |
|
| 101,752 |
| 71,250 |
| 279,335 |
| 216,694 |
Other financial assets |
|
| — |
| — |
| 3,507 |
| 2,423 |
Investments in subsidiaries and associates | 9.1 |
| 39,476,130 |
| 35,741,778 |
| 15,589,218 |
| 17,611,369 |
Investment in joint ventures | 10 |
| 1,328,530 |
| 1,320,592 |
| 11,749,804 |
| 11,742,442 |
Property, plant and equipment | 11.1 |
| 35,959 |
| 39,817 |
| 20,220,255 |
| 21,239,974 |
Intangible assets and goodwill | 11.2 |
| 8,422 |
| 6,863 |
| 23,096,019 |
| 22,650,287 |
Contract assets | 11.3 |
| — |
| — |
| 998,757 |
| 1,052,105 |
Right-of-use assets | 11.4 |
| 19,213 |
| 22,200 |
| 9,854,960 |
| 9,513,518 |
Investment property | 11.5 |
| — |
| — |
| 15,816,095 |
| 15,976,126 |
Non-current assets |
|
| 45,945,718 |
| 40,477,786 |
| 109,790,212 |
| 111,255,193 |
|
|
|
|
|
|
|
|
|
|
Total assets |
|
| 49,080,044 |
| 44,197,573 |
| 143,350,283 |
| 139,865,382 |
The accompanying notes are an integral part of these interim financial statements.
Statement of financial position
(In thousands of Reais)
|
|
| Parent Company |
| Consolidated | ||||
| Note |
| 06/30/2024 |
| 12/31/2023 |
| 06/30/2024 |
| 12/31/2023 |
Liabilities |
|
|
|
|
|
|
|
|
|
Loans, financing and debentures | 5.4 |
| 949,915 |
| 800,987 |
| 6,580,589 |
| 4,882,398 |
Leases | 5.5 |
| 8,939 |
| 8,959 |
| 941,763 |
| 733,063 |
Derivative financial instruments | 5.6 |
| 639,752 |
| 364,747 |
| 1,500,851 |
| 1,250,520 |
Trade payables | 5.9 |
| 1,957 |
| 2,431 |
| 4,438,849 |
| 3,920,273 |
Employee benefits payables |
|
| 28,285 |
| 61,926 |
| 650,405 |
| 829,329 |
Income tax payables |
|
| 1,641 |
| 2,716 |
| 545,882 |
| 445,934 |
Other taxes payable | 14 |
| 120,122 |
| 226,556 |
| 753,363 |
| 673,718 |
Dividends payable | 17 |
| 60,385 |
| 276,065 |
| 289,980 |
| 549,054 |
Concessions payable | 13 |
| — |
| — |
| 154,903 |
| 250,971 |
Related party payables | 5.8 |
| 178,049 |
| 198,899 |
| 497,673 |
| 322,160 |
Sectorial financial liabilities | 5.10 |
| — |
| — |
| 70,405 |
| 70,013 |
Other financial liabilities | 5 |
| — |
| — |
| 433,135 |
| 476,895 |
Other current liabilities |
|
| 631,362 |
| 593,643 |
| 1,654,239 |
| 1,516,084 |
Current liabilities |
|
| 2,620,407 |
| 2,536,929 |
| 18,512,037 |
| 15,920,412 |
Liabilities related to assets held for sale | 8 |
| — |
| — |
| 238,393 |
| 238,393 |
|
|
| 2,620,407 |
| 2,536,929 |
| 18,750,430 |
| 16,158,805 |
Loans, borrowings and debentures | 5.4 |
| 18,129,361 |
| 12,695,337 |
| 55,931,268 |
| 52,022,256 |
Leases | 5.5 |
| 17,441 |
| 20,584 |
| 5,239,241 |
| 4,542,731 |
Derivative financial instruments | 5.6 |
| 79,697 |
| 281,238 |
| 728,620 |
| 2,164,625 |
Trade payables | 5.9 |
| — |
| — |
| 57,506 |
| 264,252 |
Employee benefits payables |
|
| — |
| — |
| 33,263 |
| — |
Other taxes payable | 14 |
| 211,514 |
| 158,857 |
| 225,582 |
| 163,242 |
Provision for legal proceedings | 16 |
| 391,926 |
| 401,093 |
| 1,873,990 |
| 1,714,403 |
Concessions payable | 13 |
| — |
| — |
| 3,612,203 |
| 3,314,402 |
Investments with unsecured liabilities | 9.1 |
| 42,706 |
| 146,276 |
| — |
| — |
Related party payables | 5.8 |
| 7,282,284 |
| 6,449,968 |
| 1,078 |
| 1,078 |
Post-employment benefits | 23 |
| 291 |
| 313 |
| 631,048 |
| 617,647 |
Deferred tax liabilities | 15 |
| — |
| — |
| 5,249,301 |
| 5,225,433 |
Sectorial financial liabilities | 5.10 |
| — |
| — |
| 1,863,679 |
| 1,740,685 |
Deferred revenue |
|
| — |
| — |
| 17,859 |
| 19,129 |
Other non-current liabilities |
|
| 520,103 |
| 551,671 |
| 879,305 |
| 935,514 |
Non-current liabilities |
|
| 26,675,323 |
| 20,705,337 |
| 76,343,943 |
| 72,725,397 |
Total liabilities |
|
| 29,295,730 |
| 23,242,266 |
| 95,094,373 |
| 88,884,202 |
|
|
|
|
|
|
|
|
|
|
Shareholders' equity |
|
|
|
|
|
|
|
|
|
Share capital |
|
| 8,832,544 |
| 8,682,544 |
| 8,832,544 |
| 8,682,544 |
Treasury shares |
|
| (212,413) |
| (93,917) |
| (212,413) |
| (93,917) |
Additional paid-in capital |
|
| 2,475,403 |
| 2,561,964 |
| 2,475,403 |
| 2,561,964 |
Accumulated other comprehensive income |
|
| 334,072 |
| 314,325 |
| 334,072 |
| 314,325 |
Retained earnings |
|
| 8,773,990 |
| 9,490,391 |
| 8,773,990 |
| 9,490,391 |
Accumulated losses |
|
| (419,282) |
| — |
| (419,282) |
| — |
|
|
|
|
|
|
|
|
|
|
Equity attributable to: |
|
|
|
|
|
|
|
|
|
Owners of the Company |
|
| 19,784,314 |
| 20,955,307 |
| 19,784,314 |
| 20,955,307 |
Non-controlling interest | 9.2 |
| — |
| — |
| 28,471,596 |
| 30,025,873 |
Total shareholders' equity |
|
| 19,784,314 |
| 20,955,307 |
| 48,255,910 |
| 50,981,180 |
Total liabilities and shareholders' equity |
|
| 49,080,044 |
| 44,197,573 |
| 143,350,283 |
| 139,865,382 |
The accompanying notes are an integral part of these interim financial statements.
(In thousands of Reais, except earnings per share)
|
|
| Parent Company |
| Consolidated | ||||||||||||
| Note |
| 2Q24 |
| 2Q23 (Restated) (i) |
| 6M24 |
| 6M23 (Restated) (i) |
| 2Q24 |
| 2Q23 (Restated) (i) |
| 6M24 |
| 6M23 (Restated) (i) |
Net sales | 19 |
| — |
| — |
| — |
| — |
| 10,694,008 |
| 10,051,005 |
| 20,536,064 |
| 19,669,159 |
Cost of sales | 20 |
| — |
| — |
| — |
| — |
| (7,137,604) |
| (7,237,251) |
| (14,066,041) |
| (14,415,854) |
Gross profit |
|
| — |
| — |
| — |
| — |
| 3,556,404 |
| 2,813,754 |
| 6,470,023 |
| 5,253,305 |
|
|
|
|
|
|
|
|
|
|
|
|
|
|
|
|
|
|
Selling expenses | 20 |
| — |
| — |
| — |
| — |
| (376,497) |
| (341,507) |
| (737,901) |
| (681,240) |
General and administrative expenses | 20 |
| (111,518) |
| (94,699) |
| (215,201) |
| (181,341) |
| (611,413) |
| (532,690) |
| (1,194,668) |
| (1,023,213) |
Other operating incomes (expenses), net | 21 |
| 28,634 |
| (20,882) |
| 14,395 |
| (2,694) |
| (2,409,043) |
| (56,046) |
| (2,408,282) |
| 305,847 |
Operating expenses |
|
| (82,884) |
| (115,581) |
| (200,806) |
| (184,035) |
| (3,396,953) |
| (930,243) |
| (4,340,851) |
| (1,398,606) |
|
|
|
|
|
|
|
|
|
|
|
|
|
|
|
|
|
|
Loss before equity in earnings of investees finance results and income taxes |
|
| (82,884) |
| (115,581) |
| (200,806) |
| (184,035) |
| 159,451 |
| 1,883,511 |
| 2,129,172 |
| 3,854,699 |
|
|
|
|
|
|
|
|
|
|
|
|
|
|
|
|
|
|
Interest in earnings of associates | 9.1 |
| 753,820 |
| (736,453) |
| 1,577,990 |
| (1,317,521) |
| 833,371 |
| 67,132 |
| 1,294,795 |
| 120,097 |
Interest in earnings of joint ventures | 10 |
| 50,927 |
| 29,870 |
| 5,052 |
| 158,256 |
| 450,974 |
| 263,003 |
| 47,066 |
| 1,393,417 |
Equity in earnings of investees |
|
| 804,747 |
| (706,583) |
| 1,583,042 |
| (1,159,265) |
| 1,284,345 |
| 330,135 |
| 1,341,861 |
| 1,513,514 |
|
|
|
|
|
|
|
|
|
|
|
|
|
|
|
|
|
|
Financial expense |
|
| (625,774) |
| (463,591) |
| (1,155,309) |
| (892,074) |
| (2,130,752) |
| (5,422,219) |
| (3,995,308) |
| (9,677,480) |
Financial income |
|
| 42,188 |
| 81,210 |
| 100,371 |
| 149,684 |
| 726,385 |
| 628,874 |
| 1,341,486 |
| 1,229,537 |
Foreign exchange, net |
|
| (1,514,581) |
| 467,485 |
| (1,852,577) |
| 710,628 |
| (2,442,818) |
| 1,550,338 |
| (2,974,036) |
| 2,135,679 |
Net effect of derivatives |
|
| 652,311 |
| (502,554) |
| 138,950 |
| (1,011,640) |
| 1,325,382 |
| 100,231 |
| 1,326,726 |
| 400,373 |
Financial results, net | 22 |
| (1,445,856) |
| (417,450) |
| (2,768,565) |
| (1,043,402) |
| (2,521,803) |
| (3,142,776) |
| (4,301,132) |
| (5,911,891) |
|
|
|
|
|
|
|
|
|
|
|
|
|
|
|
|
|
|
Loss before income taxes |
|
| (723,993) |
| (1,239,614) |
| (1,386,329) |
| (2,386,702) |
| (1,078,007) |
| (929,130) |
| (830,099) |
| (543,678) |
|
|
|
|
|
|
|
|
|
|
|
|
|
|
|
|
|
|
Income taxes | 15 |
|
|
|
|
|
|
|
|
|
|
|
|
|
|
|
|
Current |
|
| — |
| — |
| (3,849) |
| 30,562 |
| (543,520) |
| (481,640) |
| (827,916) |
| (1,672,822) |
Deferred |
|
| 496,885 |
| 191,430 |
| 970,896 |
| 403,826 |
| 652,042 |
| 948,122 |
| 952,076 |
| 1,335,119 |
|
|
| 496,885 |
| 191,430 |
| 967,047 |
| 434,388 |
| 108,522 |
| 466,482 |
| 124,160 |
| (337,703) |
|
|
|
|
|
|
|
|
|
|
|
|
|
|
|
|
|
|
Loss for the period from continuing operations |
|
| (227,108) |
| (1,048,184) |
| (419,282) |
| (1,952,314) |
| (969,485) |
| (462,648) |
| (705,939) |
| (881,381) |
Profit for the period from discontinued operation, net of tax | 8 |
| — |
| 5,483 |
| — |
| 5,483 |
| — |
| 15,907 |
| — |
| 15,907 |
Loss for the period |
|
| (227,108) |
| (1,042,701) |
| (419,282) |
| (1,946,831) |
| (969,485) |
| (446,741) |
| (705,939) |
| (865,474) |
|
|
|
|
|
|
|
|
|
|
|
|
|
|
|
|
|
|
Profit (loss) attributable to: |
|
|
|
|
|
|
|
|
|
|
|
|
|
|
|
|
|
Owners of the Company |
|
| (227,108) |
| (1,042,701) |
| (419,282) |
| (1,946,831) |
| (227,108) |
| (1,042,701) |
| (419,282) |
| (1,946,831) |
Non-controlling interest |
|
| — |
| — |
| — |
| — |
| (742,377) |
| 595,960 |
| (286,657) |
| 1,081,357 |
|
|
| (227,108) |
| (1,042,701) |
| (419,282) |
| (1,946,831) |
| (969,485) |
| (446,741) |
| (705,939) |
| (865,474) |
|
|
|
|
|
|
|
|
|
|
|
|
|
|
|
|
|
|
Earnings per share | 18 |
|
|
|
|
|
|
|
|
|
|
|
|
|
|
|
|
Basic |
|
|
|
|
|
|
|
|
|
| (R$0.1220) |
| (R$0.5615) |
| (R$0.2250) |
| (R$1.0459) |
Diluted |
|
|
|
|
|
|
|
|
|
| (R$0.1220) |
| (R$0.5647) |
| (R$0.2250) |
| (R$1.0517) |
|
|
|
|
|
|
|
|
|
|
|
|
|
|
|
|
|
|
Earnings per share | 18 |
|
|
|
|
|
|
|
|
|
|
|
|
|
|
|
|
Basic |
|
|
|
|
|
|
|
|
|
| — |
| R$0.0029 |
| — |
| R$0.0029 |
Diluted |
|
|
|
|
|
|
|
|
|
| — |
| R$0.0029 |
| — |
| R$0.0029 |
(i) For additional information see notes 3.1
The accompanying notes are an integral part of these interim financial statements.
(In thousands of Reais)
| Parent Company |
| Consolidated | ||||||||||||
| 2Q24 |
| 2Q23 (Restated) |
| 6M24 |
| 6M23 (Restated) |
| 2Q24 |
| 2Q23 (Restated) |
| 6M24 |
| 6M23 (Restated) |
Loss for the period | (227,108) |
| (1,042,701) |
| (419,282) |
| (1,946,831) |
| (969,485) |
| (446,741) |
| (705,939) |
| (865,474) |
|
|
|
|
|
|
|
|
|
|
|
|
|
|
|
|
Other comprehensive income: |
|
|
|
|
|
|
|
|
|
|
|
|
|
|
|
Items that are or may be reclassified subsequently to profit or loss: |
|
|
|
|
|
|
|
|
|
|
|
|
|
| |
Foreign currency translation differences | 101,317 |
| (235,418) |
| 164,203 |
| (420,171) |
| 131,448 |
| (328,249) |
| 194,502 |
| (569,697) |
Gain (loss) on cash flow hedge | (127,372) |
| (1,078) |
| (159,756) |
| 129 |
| (167,146) |
| 775 |
| (209,710) |
| 2,360 |
| (26,055) |
| (236,496) |
| 4,447 |
| (420,042) |
| (35,698) |
| (327,474) |
| (15,208) |
| (567,337) |
|
|
|
|
|
|
|
|
|
|
|
|
|
|
|
|
Items that will not be reclassified to profit or loss: |
|
|
|
|
|
|
|
|
|
|
|
|
|
|
|
Actuarial gains (losses) with defined benefit plan, net of taxes | 892 |
| 18,394 |
| 15,300 |
| 18,515 |
| 1,278 |
| 38,740 |
| 25,564 |
| 41,935 |
Deferred taxes | — |
| — |
| — |
| — |
| (435) |
| (13,172) |
| (8,692) |
| (14,258) |
| 892 |
| 18,394 |
| 15,300 |
| 18,515 |
| 843 |
| 25,568 |
| 16,872 |
| 27,677 |
|
|
|
|
|
|
|
|
|
|
|
|
|
|
|
|
Comprehensive income from continuing operations | (252,271) |
| (1,266,286) |
| (399,535) |
| (2,353,841) |
| (1,004,340) |
| (764,554) |
| (704,275) |
| (1,421,041) |
Comprehensive income from discontinuing operations | — |
| 5,483 |
| — |
| 5,483 |
| — |
| 15,907 |
| — |
| 15,907 |
Total comprehensive income for the period | (252,271) |
| (1,260,803) |
| (399,535) |
| (2,348,358) |
| (1,004,340) |
| (748,647) |
| (704,275) |
| (1,405,134) |
|
|
|
|
|
|
|
|
|
|
|
|
|
|
|
|
Comprehensive income attributable to: |
|
|
|
|
|
|
|
|
|
|
|
|
|
| |
Owners of the Company | (252,271) |
| (1,260,803) |
| (399,535) |
| (2,348,358) |
| (252,271) |
| (1,260,803) |
| (399,535) |
| (2,348,358) |
Non-controlling interest | — |
| — |
| — |
| — |
| (752,069) |
| 512,156 |
| (304,740) |
| 943,224 |
| (252,271) |
| (1,260,803) |
| (399,535) |
| (2,348,358) |
| (1,004,340) |
| (748,647) |
| (704,275) |
| (1,405,134) |
The accompanying notes are an integral part of these interim financial statements.
(In thousands of Reais)
|
|
|
|
| Capital reserve |
|
|
| Profit reserve |
|
|
|
|
|
|
| ||||||||
|
| Share capital |
| Treasury share |
| Corporate transactions - Law 6404 |
| Capital transactions |
| Accumulated other comprehensive income |
| Legal |
| Statutory reserve |
| Retained earnings |
| Accumulated loss |
| Equity attributable to controlling shareholders |
| Interest of non-controlling shareholders |
| Total equity |
At January 1, 2024 |
| 8,682,544 |
| (93,917) |
| 737 |
| 2,561,227 |
| 314,325 |
| 58,802 |
| 8,610,796 |
| 820,793 |
| — |
| 20,955,307 |
| 30,025,873 |
| 50,981,180 |
|
|
|
|
|
|
|
|
|
|
|
|
|
|
|
|
|
|
|
|
|
|
|
|
|
Loss for the period |
| — |
| — |
| — |
| — |
| — |
| — |
| — |
| — |
| (419,282) |
| (419,282) |
| (286,657) |
| (705,939) |
|
|
|
|
|
|
|
|
|
|
|
|
|
|
|
|
|
|
|
|
|
|
|
|
|
Other comprehensive income (note 17) |
|
|
|
|
|
|
|
|
|
|
|
|
|
|
|
|
|
|
|
|
|
|
|
|
Loss from cash flow hedge accounting |
| — |
| — |
| — |
| — |
| (159,756) |
| — |
| — |
| — |
| — |
| (159,756) |
| (49,954) |
| (209,710) |
Foreign currency translation differences |
| — |
| — |
| — |
| — |
| 164,203 |
| — |
| — |
| — |
| — |
| 164,203 |
| 30,299 |
| 194,502 |
Actuarial gain on defined benefit plan |
| — |
| — |
| — |
| — |
| 15,300 |
| — |
| — |
| — |
| — |
| 15,300 |
| 1,572 |
| 16,872 |
Total comprehensive income (loss) for the period |
| — |
| — |
| — |
| — |
| 19,747 |
| — |
| — |
| — |
| (419,282) |
| (399,535) |
| (304,740) |
| (704,275) |
|
|
|
|
|
|
|
|
|
|
|
|
|
|
|
|
|
|
|
|
|
|
|
|
|
Contributions and distributions to shareholders: |
|
|
|
|
|
|
|
|
|
|
|
|
|
|
|
|
|
|
|
|
|
|
|
|
Capital increase (note 17(a)) |
| 150,000 |
| — |
| — |
| — |
| — |
| — |
| (150,000) |
| — |
| — |
| — |
| — |
| — |
Reduction of capital in subsidiary |
| — |
| — |
| — |
| — |
| — |
|
|
| — |
| — |
| — |
| — |
| (20,629) |
| (20,629) |
Own shares acquired |
| — |
| (162,174) |
| — |
| — |
| — |
| — |
| — |
| — |
| — |
| (162,174) |
| — |
| (162,174) |
Share based payments |
| — |
| 43,678 |
| — |
| (132,064) |
| — |
| — |
| — |
| — |
| — |
| (88,386) |
| 9,700 |
| (78,686) |
Loss in dividend distribution to non-controlling shareholders |
| — |
| — |
| — |
| (420) |
| — |
| — |
| — |
| — |
| — |
| (420) |
| 549 |
| 129 |
Dividends |
| — |
| — |
| — |
| — |
| — |
| — |
| (566,401) |
| — |
| — |
| (566,401) |
| (1,249,678) |
| (1,816,079) |
Employee compensation plan - value of employee services |
| — |
| — |
| — |
| 47,775 |
| — |
| — |
| — |
| — |
| — |
| 47,775 |
| 10,521 |
| 58,296 |
Total contributions and distributions |
| 150,000 |
| (118,496) |
| — |
| (84,709) |
| — |
| — |
| (716,401) |
| — |
| — |
| (769,606) |
| (1,249,537) |
| (2,019,143) |
|
|
|
|
|
|
|
|
|
|
|
|
|
|
|
|
|
|
|
|
|
|
|
|
|
Transactions with shareholders: |
|
|
|
|
|
|
|
|
|
|
|
|
|
|
|
|
|
|
|
|
|
|
|
|
Change of shareholding interest in subsidiary (note 9.1) |
| — |
| — |
| — |
| (1,852) |
| — |
| — |
| — |
| — |
| — |
| (1,852) |
| — |
| (1,852) |
Total transactions with shareholders |
| — |
| — |
| — |
| (1,852) |
| — |
| — |
| — |
| — |
| — |
| (1,852) |
| — |
| (1,852) |
|
|
|
|
|
|
|
|
|
|
|
|
|
|
|
|
|
|
|
|
|
|
|
|
|
Total contributions, distributions and transactions with the Company's shareholders |
| 150,000 |
| (118,496) |
| — |
| (86,561) |
| — |
| — |
| (716,401) |
| — |
| — |
| (771,458) |
| (1,249,537) |
| (2,020,995) |
|
|
|
|
|
|
|
|
|
|
|
|
|
|
|
|
|
|
|
|
|
|
|
|
|
At June 30, 2024 |
| 8,832,544 |
| (212,413) |
| 737 |
| 2,474,666 |
| 334,072 |
| 58,802 |
| 7,894,395 |
| 820,793 |
| (419,282) |
| 19,784,314 |
| 28,471,596 |
| 48,255,910 |
The accompanying notes are an integral part of these interim financial statements.
Statement of changes in equity
(In thousands of Reais)
|
|
|
|
|
| Capital reserve |
|
|
| Profit reserve |
|
|
|
|
|
|
|
| |||||||||
|
| Share capital |
| Treasury share |
| Corporate transactions - Law 6404 |
| Capital transactions |
| Accumulated other comprehensive income |
| Legal |
| Statutory reserve |
| Profit to be realized |
| Retained earnings |
| Accumulated profits |
| Equity attributable to controlling shareholders |
| Non-controlling interest |
| Total equity | |
At January 1, 2023 |
| 8,402,544 |
| (107,140) |
| 737 |
| 2,319,191 |
| 567,546 |
| 58,802 |
| 9,240,466 |
| 171,021 |
| — |
| — |
| 20,653,167 |
| 27,516,232 |
| 48,169,399 | |
Loss for the period |
| — |
| — |
| — |
| — |
| — |
| — |
| — |
| — |
| — |
| (1,946,831) |
| (1,946,831) |
| 1,081,357 |
| (865,474) | |
Other comprehensive income (note 17) |
|
|
|
|
|
|
|
|
|
|
|
|
|
|
|
|
|
|
|
|
|
|
|
|
|
| |
Gain from cash flow hedge accounting |
| — |
| — |
| — |
| — |
| 129 |
| — |
| — |
| — |
| — |
| — |
| 129 |
| 2,231 |
| 2,360 | |
Foreign currency translation differences |
| — |
| — |
| — |
| — |
| (420,171) |
| — |
| — |
| — |
| — |
| — |
| (420,171) |
| (149,526) |
| (569,697) | |
Actuarial gain on defined benefit plan |
| — |
| — |
| — |
| — |
| 18,515 |
| — |
| — |
| — |
| — |
| — |
| 18,515 |
| 9,162 |
| 27,677 | |
Total comprehensive income (loss) for the period |
| — |
| — |
| — |
| — |
| (401,527) |
| — |
| — |
| — |
| — |
| (1,946,831) |
| (2,348,358) |
| 943,224 |
| (1,405,134) | |
Transactions with owners of the Company contributions and distributions: |
|
|
|
|
|
|
|
|
|
|
|
|
|
|
|
|
|
|
|
|
|
|
|
|
|
| |
Capital increase |
| 280,000 |
| — |
| — |
| — |
| — |
| — |
| (280,000) |
| — |
| — |
| — |
| — |
| — |
| — | |
Proceeds from capital increase in subsidiary |
| — |
| — |
| — |
| — |
| — |
| — |
| — |
| — |
| — |
| — |
| — |
| 9,709 |
| 9,709 | |
Gain on capital increase in a subsidiary |
| — |
| — |
| — |
| 55,495 |
| — |
| — |
| — |
| — |
| — |
| — |
| 55,495 |
| 20,110 |
| 75,605 | |
Share based payments |
| — |
| (114) |
| — |
| 1,891 |
| — |
| — |
| — |
| — |
| — |
| — |
| 1,777 |
| — |
| 1,777 | |
Write-off of stake in subsidiary |
| — |
| — |
| — |
| — |
| — |
| — |
| — |
| — |
| — |
| — |
| — |
| (22,280) |
| (22,280) | |
Dividends |
| — |
| — |
| — |
| — |
| — |
| — |
| (349,670) |
| (171,021) |
| — |
| — |
| (520,691) |
| (549,459) |
| (1,070,150) | |
Employee compensation plan - value of employee services |
| — |
| — |
| — |
| 55,326 |
| — |
| — |
| — |
| — |
| — |
| — |
| 55,326 |
| 7,832 |
| 63,158 | |
Total contributions and distributions |
| 280,000 |
| (114) |
| — |
| 112,712 |
| — |
| — |
| (629,670) |
| (171,021) |
| — |
| — |
| (408,093) |
| (534,088) |
| (942,181) | |
|
|
|
|
|
|
|
|
|
|
|
|
|
|
|
|
|
|
|
|
|
|
|
|
|
|
| |
Changes in interest in subsidiaries: |
|
|
|
|
|
|
|
|
|
|
|
|
|
|
|
|
|
|
|
|
|
|
|
|
|
| |
Gain on distribution of dividends in subsidiary |
| — |
| — |
| — |
| 33,456 |
| — |
| — |
| — |
| — |
| — |
| — |
| 33,456 |
| — |
| 33,456 | |
Change of shareholding interest in subsidiary |
| — |
| — |
| — |
| (866) |
| — |
| — |
| — |
| — |
| — |
| — |
| (866) |
| — |
| (866) | |
Total transactions with owners of the Company |
| — |
| — |
| — |
| 32,590 |
| — |
| — |
| — |
| — |
| — |
| — |
| 32,590 |
| — |
| 32,590 | |
Total transactions with owners of the Company |
| 280,000 |
| (114) |
| — |
| 145,302 |
| — |
| — |
| (629,670) |
| (171,021) |
| — |
| — |
| (375,503) |
| (534,088) |
| (909,591) | |
|
|
|
|
|
|
|
|
|
|
|
|
|
|
|
|
|
|
|
|
|
|
|
|
|
|
| |
At June 30, 2023 |
| 8,682,544 |
| (107,254) |
| 737 |
| 2,464,493 |
| 166,019 |
| 58,802 |
| 8,610,796 |
| — |
| — |
| (1,946,831) |
| 17,929,306 |
| 27,925,368 |
| 45,854,674 | |
The accompanying notes are an integral part of these interim financial statements.
(In thousands of Reais)
| Parent Company | Consolidated | ||||||||
| Note | 6M24 | 6M23 (Restated) (i) | 6M24 | 6M23 (Restated) (i) | |||||
Cash flows from operating activities |
|
|
|
|
|
|
|
|
|
Loss before income taxes |
|
| (1,386,329) |
| (2,386,702) |
| (830,099) |
| (543,678) |
Adjustments for: |
|
|
|
|
|
|
|
|
|
Depreciation and amortization | 20 |
| 7,780 |
| 7,027 |
| 1,833,725 |
| 1,610,177 |
Impairment | 21 |
| — |
| — |
| 2,574,817 |
| — |
Interest in earnings of associates | 9.1 |
| (1,577,990) |
| 1,317,521 |
| (1,294,795) |
| (120,097) |
Interest in earnings of joint ventures | 10 |
| (5,052) |
| (158,256) |
| (47,066) |
| (1,393,417) |
Loss (gain) on disposed assets | 21 |
| 7 |
| (13,563) |
| 40,261 |
| 777 |
Share based payment | 24 |
| 32,836 |
| 43,515 |
| 81,258 |
| 83,179 |
Change in fair value of investment properties | 11.5 |
| — |
| — |
| — |
| (82,996) |
Legal proceedings provision | 21 |
| 3,877 |
| 43,524 |
| 149,301 |
| 78,624 |
Interest and foreign exchange, net |
|
| 2,786,747 |
| 1,046,845 |
| 4,994,791 |
| 6,616,525 |
Sectorial financial assets and liabilities, net | 5.10 |
| — |
| — |
| 28,016 |
| (3,526) |
Provisions for employee benefits |
|
| 19,459 |
| 22,215 |
| 190,575 |
| 142,452 |
Allowance for expected credit losses |
|
| — |
| — |
| 23,670 |
| 9,062 |
Profit on sale of investments | 21 |
| — |
| — |
| 383,205 |
| — |
Tax credit recovery |
|
| — |
| — |
| 4,207 |
| (4,225) |
Other |
|
| 611 |
| (49,525) |
| (171,476) |
| (278,598) |
|
|
| (118,054) |
| (127,399) |
| 7,960,390 |
| 6,114,259 |
Variation in: |
|
|
|
|
|
|
|
|
|
Trade receivable |
|
| — |
| — |
| (654,468) |
| 137,272 |
Inventories |
|
| — |
| — |
| (82,238) |
| 25,652 |
Other taxes, net |
|
| (7,974) |
| (10,082) |
| 33,447 |
| 149,741 |
Income tax |
|
| 69,003 |
| 57,760 |
| (697,352) |
| (500,693) |
Related parties, net |
|
| 384 |
| (100,409) |
| 109,994 |
| (152,409) |
Trade payables |
|
| 1,001 |
| (112,225) |
| 122,132 |
| (315,701) |
Employee benefits |
|
| (58,180) |
| (44,235) |
| (347,607) |
| (309,186) |
Provision for legal proceedings |
|
| 1,678 |
| (20,556) |
| (157,302) |
| (219,851) |
Financial instruments derivatives |
|
| — |
| — |
| (18,095) |
| 6,353 |
Other financial liabilities |
|
| — |
| — |
| (31,671) |
| (160,346) |
Judicial deposits |
|
| (3,026) |
| (1,942) |
| (127,925) |
| 22,965 |
Post-employment benefits obligation |
|
| — |
| — |
| (17,659) |
| (16,572) |
Other assets and liabilities, net |
|
| (19,255) |
| (20,129) |
| 22,213 |
| 142,892 |
|
|
| (16,369) |
| (251,818) |
| (1,846,531) |
| (1,189,883) |
|
|
|
|
|
|
|
|
| — |
Net cash (used in) generated from operating activities |
|
| (134,423) |
| (379,217) |
| 6,113,859 |
| 4,924,376 |
|
|
|
|
|
|
|
|
|
|
Cash flows from investing activities |
|
|
|
|
|
|
|
|
|
Capital contribution to associates | 9.1 |
| (4,173,198) |
| (4,000) |
| — |
| — |
Capital contribution in joint ventures | 10 |
| (8,337) |
| — |
| (8,337) |
| — |
Purchase of marketable securities |
|
| 123,223 |
| 209,386 |
| (242,724) |
| (838,963) |
Restricted cash |
|
| 43,048 |
| (2,277) |
| 40,779 |
| (24,131) |
Dividends received from associates | 17 |
| 1,787,186 |
| 618,758 |
| 644,631 |
| 96,301 |
Dividends received from joint venture | 17 |
| 228,342 |
| 46,103 |
| 293,912 |
| 405,926 |
Dividends received from finance investment |
|
| — |
| — |
| — |
| 457,450 |
Acquisition of instruments designated at fair value |
|
| — |
| — |
| (354) |
| (7,072) |
Reduction of capital in subsidiaries | 9.1 |
| 5,227 |
| — |
| — |
| — |
Acquisition of property, plant and equipment, intangible and contract assets |
|
| (2,489) |
| (2,657) |
| (3,207,373) |
| (2,781,817) |
Proceeds from the sale of investments |
|
| 16,847 |
| 15,000 |
| 2,096,475 |
| (5,926) |
Cost of acquiring new business |
|
| — |
| — |
| (17,047) |
| — |
Receipt of derivative financial instruments, except debt |
|
| — |
| 36,718 |
| 132 |
| 40,276 |
Payment of derivative financial instruments, except debt |
|
| (70,503) |
| (116,303) |
| (70,689) |
| (124,208) |
Net cash (used in) generated from investing activities |
|
| (2,050,654) |
| 800,728 |
| (470,595) |
| (2,782,164) |
Statement of cash flow
(In thousands of Reais)
| Parent Company | Consolidated | ||||||||
| Note | 6M24 | 6M23 (Restated) (i) | 6M24 | 6M23 (Restated) (i) | |||||
Cash flows from financing activities |
|
|
|
|
|
|
|
|
|
Proceeds from loans, borrowings and debentures | 5.4 |
| 4,421,447 |
| 1,989,748 |
| 10,799,808 |
| 6,109,999 |
Principal repayment of loans, borrowings and debentures | 5.4 |
| — |
| — |
| (7,772,439) |
| (1,099,528) |
Payment of interest on loans, borrowings and debentures | 5.4 |
| (680,726) |
| (388,427) |
| (2,252,731) |
| (1,594,296) |
Payment of derivative financial instruments |
|
| (355,848) |
| (307,650) |
| (2,111,172) |
| (1,005,403) |
Proceeds from derivative financial instruments |
|
| 14,199 |
| 7,962 |
| 959,656 |
| 94,670 |
Costs of banking operations with derivatives |
|
| — |
| — |
| (29,828) |
| (247,163) |
Principal repayment of leases | 5.5 |
| (3,169) |
| (2,594) |
| (248,175) |
| (239,375) |
Payment of interest on leases | 5.5 |
| (1,604) |
| (1,794) |
| (177,171) |
| (85,145) |
Proceeds from capital contributions by non-controlling shareholders |
|
| — |
| — |
| — |
| 9,709 |
Capital reduction |
|
| — |
| — |
| (20,520) |
| — |
Related parties |
|
| (249,499) |
| (345,367) |
| — |
| — |
Proceeds from the sale of treasury shares |
|
| (164,685) |
| — |
| (164,685) |
| — |
Dividends paid | 17 |
| (782,081) |
| (798,203) |
| (1,537,377) |
| (1,548,921) |
Dividends paid for preferred shares | 17 |
| — |
| — |
| (668,022) |
| — |
Payment of share-based compensation |
|
| — |
| — |
| — |
| (294) |
Net cash generated from (used in) financing activities |
|
| 2,198,034 |
| 153,675 |
| (3,222,656) |
| 394,253 |
|
|
|
|
|
|
|
|
|
|
Increase (decrease) in cash and cash equivalents |
|
| 12,957 |
| 575,186 |
| 2,420,608 |
| 2,536,465 |
|
|
|
|
|
|
|
|
|
|
Cash and cash equivalents at the beginning of the period |
|
| 1,769,976 |
| 1,348,461 |
| 14,658,481 |
| 13,301,716 |
Effect of the foreign exchange rate changes |
|
| 17,436 |
| (12,198) |
| 150,972 |
| (98,891) |
Cash and cash equivalents at the end of the period |
|
| 1,800,369 |
| 1,911,449 |
| 17,230,061 |
| 15,739,290 |
|
|
|
|
|
|
|
|
|
|
Additional information |
|
|
|
|
|
|
|
|
|
Income taxes paid |
|
| — |
| — |
| 498,998 |
| 58,584 |
(i) For additional information see notes 3.1
The accompanying notes are an integral part of these interim financial statements.
Statement of cash flow
(In thousands of Reais)
Non-cash transactions:
The Company presents its statements of cash flows using the indirect method. During the period ended June, 2024, the Company carried out the following transactions that did not involve cash and, therefore, are not reflected in the parent company and consolidated statement of cash flows:
| (i) | Recognition of right-of-use as a counterpart to the lease liability in the amount of R$784,084 (R$100,014 on June 30, 2023), resulting from the application of inflation indexes and new contracts classified under the leasing rule (Note 11.4). |
| (ii) | Acquisition of property, plant and equipment and intangible assets with payment in installments R$759,766 (R$794,602 on June 30, 2023). |
Disclosure of interest and dividends:
Dividends and interest on shareholders' equity are classified as cash flow from investing activities by the Company. Dividends and interest received or paid are classified as cash flow from financing activities.
(In thousands of Reais)
| Parent Company |
| Consolidated | ||||
| 6M24 |
| 6M23 |
| 6M24 |
| 6M23 (Restated)(i) |
Revenue |
|
|
|
|
|
|
|
Net sales | — |
| — |
| 23,650,222 |
| 23,160,634 |
Other income (expense), net | 15,758 |
| (3,845) |
| 721,780 |
| 389,797 |
Impairment gain (loss) on trade receivables | — |
| — |
| 205 |
| (9,062) |
| 15,758 |
| (3,845) |
| 24,372,207 |
| 23,541,369 |
Inputs purchased from third parties |
|
|
|
|
|
|
|
Cost of goods sold and services rendered | — |
| — |
| 13,016,297 |
| 13,678,750 |
Materials, energy, third-party services and other | 66,448 |
| 44,063 |
| 1,107,676 |
| 889,718 |
| 66,448 |
| 44,063 |
| 14,123,973 |
| 14,568,468 |
|
|
|
|
|
|
|
|
Gross value added | (50,690) |
| (47,908) |
| 10,248,234 |
| 8,972,901 |
|
|
|
|
|
|
|
|
Retention |
|
|
|
|
|
|
|
Depreciation, amortization and impairment | 7,780 |
| 7,027 |
| 4,408,542 |
| 1,610,177 |
|
|
|
|
|
|
|
|
Net value added | (58,470) |
| (54,935) |
| 5,839,692 |
| 7,362,724 |
|
|
|
|
|
|
|
|
Value added transferred in |
|
|
|
|
|
|
|
Interest earnings in associates | 1,577,990 |
| (1,317,521) |
| 1,294,795 |
| 120,097 |
Interest earnings in joint ventures | 5,052 |
| 158,256 |
| 47,066 |
| 1,393,417 |
Profit for the period from discontinued operation, net of tax | — |
| 5,483 |
| — |
| 15,907 |
Finance revenue | 100,371 |
| 149,684 |
| 1,341,486 |
| 1,229,537 |
| 1,683,413 |
| (1,004,098) |
| 2,683,347 |
| 2,758,958 |
|
|
|
|
|
|
|
|
Value added to be distributed | 1,624,943 |
| (1,059,033) |
| 8,523,039 |
| 10,121,682 |
|
|
|
|
|
|
|
|
Distribution of value added |
|
|
|
|
|
|
|
Personnel and payroll charges | 111,018 |
| 117,596 |
| 1,289,541 |
| 1,253,719 |
Direct remuneration | 90,869 |
| 109,712 |
| 1,019,285 |
| 1,036,833 |
Benefits | 6,207 |
| 5,337 |
| 204,900 |
| 168,098 |
FGTS and other | 13,942 |
| 2,547 |
| 65,356 |
| 48,788 |
|
|
|
|
|
|
|
|
Taxes, fees and contributions | (935,727) |
| (422,886) |
| 2,231,848 |
| 2,520,254 |
Federal | (951,722) |
| (426,038) |
| 696,163 |
| 1,046,359 |
State | 1 |
| — |
| 1,438,565 |
| 1,390,401 |
Municipal | 15,994 |
| 3,152 |
| 97,120 |
| 83,494 |
|
|
|
|
|
|
|
|
Financial expenses and rents | 2,868,934 |
| 1,193,088 |
| 5,707,589 |
| 7,213,183 |
Interest and foreign exchange variation | 2,853,384 |
| 1,288,580 |
| 5,488,129 |
| 6,873,818 |
Rents | — |
| — |
| 72,019 |
| 83,034 |
Other | 15,550 |
| (95,492) |
| 147,441 |
| 256,331 |
|
|
|
|
|
|
|
|
Equity Remuneration | (419,282) |
| (1,946,831) |
| (705,939) |
| (865,474) |
Non-controlling interests | — |
| — |
| (286,657) |
| 1,081,357 |
Retained losses | (419,282) |
| (1,952,314) |
| (419,282) |
| (1,962,738) |
Profit for the period from discontinued operation, net of tax | — |
| 5,483 |
| — |
| 15,907 |
(i) For more details see notes 3.1.
The accompanying notes are an integral part of these interim financial statements.
Notes to the interim Financial Statements
(In thousands of Reais, except when otherwise indicated)
Cosan S.A. (“Cosan” or “the Company”) is a publicly traded company at B3 S.A. - Brasil, Bolsa, Balcão (“B3”) in the special New Market (Novo Mercado) segment under the symbol “CSAN3”. The Company's American Depositary Shares (“ADSs”) are listed on the New York Stock Exchange, or “NYSE”, and are traded under the symbol “CSAN”. Cosan is a corporation (sociedade anônima) of indefinite term incorporated under the laws of Brazil, with its registered office in the city of São Paulo, state of São Paulo. Mr. Rubens Ometto Silveira Mello is the ultimate controlling shareholder of Cosan.
Corporate Cosan (Corporate segment) It is formed by the following entities:
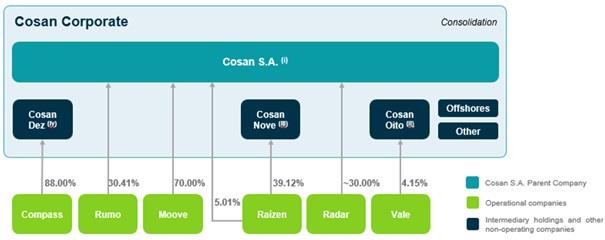
| (i) | Parent company with direct or indirect equity interest in subsidiaries and joint venture. The main effects on its profit or loss are general and administrative expenses, contingencies, equity income and financial results attributed to loans. |
| (ii) | Cosan Oito is a subsidiary of Cosan S.A., which has a significant stake in Vale. |
| (iii) | Cosan Nove has a direct stake in Raízen of 39.12% and preferred shares with Itaú Unibanco S.A. (“Itaú”) which corresponds to an equity interest of 26.91%. |
| (iv) | Cosan Dez has a direct stake in Compass of 88,00% and preferred shares with Bradesco BBI S.A. (“Bradesco”) which corresponds to an equity interest of 23.20%. |
Notes to the interim Financial Statements
(In thousands of Reais, except when otherwise indicated)
INTERNALIZATION OF SENIOR NOTES 2031
On February 16, 2024, the Company internalized the remaining resources arising from the 2031 senior notes, through the issuance of Loan 4131 by Cosan S.A., referenced in US dollars in the amount of equivalent to US$600,000 thousand, equivalent to R$2,982,600, with an annual coupon of 6.6% p.a. for the first four semesters and interest payment of 7.25% p.a. for the others. In return, Cosan Luxembourg contracted a Time Deposit (“TD”) with the same amount and counterparty in US dollars, with semi-annual payment frequency and annual remuneration of 7.25% p.a., which has as its underlying asset the issuance of Loan 4131. For more information see note 5.4 (e).
VALE'S DIVIDEND DISTRIBUTION
On February 22, 2024, Vale's Board of Directors approved the remuneration of shareholders in the amount of R$11,721,894. The amount declared corresponds entirely to dividends in the total amount of R$ 2.738548374 reais per share. The payment took place on March 19, 2024 and the amount received by the subsidiary Cosan Oito was R$577,469.
COMGÁS'S TENTH ISSUANCE OF DEBENTURES
On February 29, 2024, the Board of Directors of the indirect subsidiary Comgás approved the public offering of the 10th issuance of simple debentures, under a firm placement guarantee, non-convertible into shares, of the unsecured type, in a single series. The issuance was in the total amount of R$1,500,000, with semiannual interest at a rate equal to DI plus a spread of 0.80% p.a. and with maturity of the principal on March 15, 2029, with amortization on the maturity date. The net proceeds from the Issuance will be allocated to the ordinary management of the business of the indirect subsidiary Comgás.
RENEWAL OF THE SUDAM TAX BENEFIT
On December 20, 2023, indirect subsidiary Rumo Malha Norte S.A. filed with the Brazilian Federal Revenue Service (RFB) the constitutive report number 143/2023, issued by SUDAM on December 6, 2023, attesting to compliance with the legal conditions and requirements required for the renewal of the tax benefit, for another 10 years. In view of the above, the RFB, through the use of its powers, decided on March 13, 2024, through executive declaratory act number 024213308, to recognize the right to a 75% reduction in income tax and additional taxes referred to in article 1 of Provisional Measure No. 2,199-14, of August 24, 2001, calculated on the basis of the operating profit of the legal entity Rumo Malha Norte.
COMPASS'S THIRD ISSUANCE OF DEBENTURES
On March 15, 2024, the subsidiary Compass Gás e Energia S.A. raised its 3rd issuance of simple and non-convertible debentures, in the amount of R$1,500,000 with remuneration of CDI + 1.08% p.a., semiannual interest and principal maturing on March 15, 2029. The proceeds from the issuance will be used for general purposes and to strengthen working capital.
RESOLUTION OF COMPASS GAS AND ENERGY DIVIDENDS
On March 27, 2024, the Board of Directors of the indirect subsidiary Compass Gas and Energy approved the distribution of dividends in the amount of R$1,500,000. The payment took place on April 12, 2024 and the amount received by the subsidiary Cosan Dez was R$1,320,000.
COMPASS AND TRSP COMMERCIAL NOTES
On March 20, 2024, Compass and its subsidiary TRSP signed the 1st Issuance of Commercial Notes in the amount of R$200,000, with maturity in March 2026 and remuneration at 100% CDI + 1.7% p.a. The agreement was entered into through the depositary Laqus Depositária de Valores Mobiliários S.A. following the market conditions for the respective transaction.
Notes to the interim Financial Statements
(In thousands of Reais, except when otherwise indicated)
COMPASS COMERCIALIZAÇÃO LOAN
On March 21, 2024, Compass and its subsidiary Compass Comercialização signed an "Uncommitted Term Loan Facility Agreement – Loan Agreement" with BNP Paribas S.A., for funding under the terms of Law No. 4,131. On March 22, 2024, the Company concluded the funding in the amount of EUR 78 million, equivalent to R$423,393, maturing in March 2025 and with an interest rate of 4.88% per year.
ISSUANCE OF DEBENTURES RUMO MALHA PAULISTA S.A.
On March 25, 2024, Rumo Malha Paulista raised R$1,200,000 with the 5th issuance of simple, non-convertible debentures, of the unsecured type, divided into two series, the first of which has an amount of R$532,243, with an IPCA rate + 5.7970% p.a., a term of 10 years, semiannual interest payments and bullet amortization, while the second is R$667,757 with an IPCA rate + 5.9284% p.a., a term of 15 years, semiannual interest payments and amortizations in the last three years.
On June 26, 2024, Rumo Malha Paulista raised R$704,000 with the 6th issue of simple debentures, not convertible into shares, of the unsecured type, divided into two series, the first of which has an amount of R$547,950, with a rate of IPCA + 6.42% p.a., term of 10 years, half-yearly interest payments and bullet amortization, while the second is for R$156,050 with a rate of IPCA + 6.5318% p.a., a term of 15 years, half-yearly interest payments and amortization in the last three years.
AGREEMENT FOR THE CONSTRUCTION OF A NEW PORT TERMINAL IN SANTOS
On March 25, 2024, Companhia Rumo S.A. and EMBRAPORT – Empresa Brasileira de Terminais Portuários S.A., signed a binding agreement for the implementation of a new port project (terminal) for grain and fertilizer lifts at the port of Santos. The estimated investment for the construction of the Terminal is R$2,500,000 and will be financed with loans, in addition to the possibility of potential strategic partnerships throughout the course of the Project's implementation. The start of construction is conditional on the fulfillment of customary conditions precedent for this type of operation, including licensing and legal and regulatory approvals. After the fulfillment of all conditions precedent, the period of 30 months for construction is estimated.
UNWIND VALE S.A. OPERATIONS
- Collar Financing
During the first months of 2024, as shown in the table, the Company anticipated the debts linked to Vale's operation, and in April 2024 the settlement of 100% of the debts was concluded, as well as the collar financing derivatives linked to the operation.
|
| Participation Cosan |
| Debt settlement Cashier Effect |
|
| ||||||
Base date |
| Direct |
| Collar-related |
| Total |
| Principal |
| Interest |
| Gain/Loss settlement Collar |
January, 2024 |
| 2.62% |
| 2.03% |
| 4.65% |
| (1,698,606) |
| (49,773) |
| 188,140 |
February, 2024 |
| 3.91% |
| 0.74% |
| 4.65% |
| (2,067,956) |
| (63,689) |
| 303,431 |
April 2024 (i) |
| 3.91% |
| — |
| 3.91% |
| (1,918,773) |
| (65,880) |
| 331,116 |
| (i) | On April 19, 2024, the Company concluded the sale of a further 33,524,185 shares equivalent to a 0.78% stake in Vale's voting share capital, together with the early settlement of the remaining debt. With this last advance payment, the Company settled 100% of the debts linked to the operation and collar derivatives, and now only holds a direct stake in Vale. |
- Call Spread
In May 2024, the Company carried out the early settlement of the first tranche of the Call Spread derivative structure equivalent to 10,786 million shares or 0.24% of the total number of Vale S.A. shares, completely eliminating the maturities in 2024, reducing the economic stake from 1.58% to 1.34%.
|
| Cosan economic participation |
| Settlement gain/loss Call Spread | ||||
Base date |
| % Settled in advance |
| % Remaining |
| Cash effect |
| Result effect |
May, 2024 |
| 0.24% |
| 1.34% |
| 14,499 |
| (82,265) |
| 17 |
Notes to the interim Financial Statements
(In thousands of Reais, except when otherwise indicated)
START OF OPERATIONS OF THE SÃO PAULO REGASIFICATION TERMINAL ("TRSP")
The second quarter of 2024 was marked by the start of operations of the São Paulo Regasification Terminal ("TRSP"), whose operating and service model includes strategic LNG infrastructure and logistics assets.
The start of operations is mainly due to the completion of the liquefied natural gas regasification terminal, located in Santos/SP. As shown in note 16, this asset was transferred from "work in progress" to the respective classes of assets.
The terminal has the capacity to regasify approximately 14 million m3 of LNG per day. And from April to June 2024, during the commissioning period, it regasified approximately 125 million m³ of LNG.
EXCLUSION OF ICMS FROM THE CALCULATION BASIS OF PIS AND COFINS
On April 10, 2024, the jointly controlled subsidiary Raízen S.A., through the indirect subsidiary Blueway, obtained approval from the Brazilian Federal Revenue Service for the request to qualify for a tax credit in the amount of R$1,824,019, determining the exclusion of ICMS from the PIS and COFINS calculation basis.
INCORPORATION OF ELEVAÇÕES PORTUÁRIAS S.A.
On April 30, 2024, CLI SUL S.A. ("CLI SUL") completed the process of incorporating Elevações Portuárias S.A. ("EPSA"), after obtaining the necessary regulatory approvals. As a result of this corporate reorganization, Rumo S.A. ("Rumo") received the amount of R$168,855 from CLI SUL on the same date. This amount refers to the additional acquisition price that CLI SUL undertook to pay to Rumo, under the terms of the share purchase agreement signed between the parties on July 15, 2022, and corresponds to 20% of the outstanding balance of the acquisition financing, plus accrued interest and other charges, less the cash held by CLI SUL.
After the merger, CLI SUL's shareholders became Corredor Logística e Infraestrutura S.A. ("CLI") and Rumo, with the shareholding split remaining at 80% for CLI and 20% for Rumo.
ADDENDUM TO THE RUMO MALHA PAULISTA CONCESSION CONTRACT
On May 28, 2024, the subsidiary Rumo entered into the 6th Amendment to the Concession Agreement of the indirect subsidiary Rumo Malha Paulista with the federal government through ANTT - Agência Nacional de Transportes Terrestres (National Land Transport Agency).
In order to update the Book of Obligations, the indirect subsidiary Malha Paulista will need to restore the economic and financial balance of the contract in an amount estimated at approximately R$1,170,000, of which R$500,000 will be converted into investments in its rail network and the rest will be paid in 4 annual installments of R$167,500. The amount of each annual installment will be adjusted by the accumulated variation of the IPCA between June 2023 and two months prior to the date of actual payment.
Notes to the interim Financial Statements
(In thousands of Reais, except when otherwise indicated)
SALE OF SHARES IN TERMINAL XXXIX
On May 29, 2024, the subsidiary Rumo entered into a share purchase agreement, selling 50% (fifty percent) of its shareholding in Terminal XXXIX de Santos S.A. ("T-XXXIX") to a consortium formed between Bunge Alimentos S.A. and Zen-noh Grain Corporation, as disclosed in a material fact on the same date.
The sale of the stake in T-XXXIX represents a move towards financial discipline and capital recycling, strengthening the Company's cash position so that it can concentrate its efforts on projects that support the ongoing capacity increase program and strengthen the structural competitiveness of the rail modal.
The effectiveness of the operation depends on compliance with the binding conditions set out in the instrument, which has not yet occurred as of June 30, 2024.
MOOVE DIVIDEND RESOLUTION
On June 12, 2024, the Board of Directors of the subsidiary Moove Lubricants Holdings approved the distribution of dividends in the amount of US$116,903 thousand, equivalent to R$630,000. The payment took place on June 21, 2024.
RAISING LOANS FROM THE MOOVE SEGMENT
On June 14, 2024, Cosan Lubrificantes e Especialidades contracted two loans, one in the export prepayment modality and the other in the export credit note modality, with the banks Bank of America and Citibank, respectively, in the amounts of R$536,240 (corresponding to US$100,000 thousand) and R$268,120 (corresponding to US$50,000 thousand), respectively. The export prepayment loan has interest payments every six months and repayments will take place in June 2026 and June 2027, while the export credit loan has annual interest payments with the principal maturing in June 2027.
On June 14, 2024, Moove Lubrificants Limited contracted two loans with the banks Bank of America and Citibank, respectively, in the amounts of R$238,064 (corresponding to £35,000) and R$14,341 (corresponding to £2,500), respectively. For the first loan, interest payments are quarterly, and the principal is due in June 2026, while for the second loan, interest and principal payments are due in August 2024.
EARLY REDEMPTION OF RUMO MALHA PAULISTA S.A. DEBENTURES
On June 26, 2024, the subsidiary Rumo Malha Paulista made the optional early redemption of R$ 757,944, the total amount of the first series of the 2nd issue of simple debentures, not convertible into shares, of the unsecured type.
On the occasion of the optional early redemption, the holders of the debentures, on the date of the optional early redemption, were entitled to payment of: (a) the balance of the nominal unit value of the debentures of the first series; plus (b) the remuneration of the first series, calculated pro rata temporis, from the date of payment of the remuneration of the first series immediately preceding, on June 17, 2024, until the date of the optional early redemption; (c) plus a premium, apartment, levied on the amount of the early redemption, corresponding to 0.25% (twenty-five hundredths) percent multiplied by the remaining term of the debentures of the first series.
Notes to the interim Financial Statements
(In thousands of Reais, except when otherwise indicated)
ISSUE OF DEBENTURES
On June 28, 2024, Cosan issued unsecured debentures, not convertible into shares, in the total amount of R$1,450,000, divided into two series. The first series bears interest at CDI plus 1.0% per year, matures in June 2029, pays interest every six months and amortizes the principal in June 2028 and June 2029. The second series bears interest at CDI plus 1.5% per year, maturing in June 2034, with half-yearly interest payments and principal repayments in June 2032, June 2033 and June 2034.
WRITE-OFF OF ASSETS AND IMPAIRMENT LOSS OF RUMO MALHA SUL
In the 2nd quarter of 2024, Rio Grande do Sul was impacted by extreme weather events. This force majeure event caused damage to the railway infrastructure of indirect subsidiary Rumo Malha Sul.
In this context, in the quarter ended June 30, 2024 and in accordance with Circular Letter No. 01/2024-CVM/SNC/SEP, Management identified the existence of indications that led to the anticipation of the recoverability test of the permanent assets (fixed assets, intangible assets and rights of use) of the cash generating unit of the subsidiary Rumo ("Rumo Malha Sul"), considering the event described above, including with regard to the term of use of the assets, the subsidiary Rumo provisioned the amount of R$2.392,776 as mentioned in note 11.1.
These individual and consolidated interim financial statements were prepared and are being presented in accordance with the technical pronouncement CPC 21 (R1) - Interim Statements and with the international standards IAS 34 - Interim Financial Reporting, issued by the International Accounting Standards Board (IASB), and also based on the provisions contained in the Brazilian Corporation Law, and presented in a manner consistent with the rules issued by the Securities and Exchange Commission, applicable to the preparation of quarterly information - ITR. Interim financial statements do not include all information necessary for a complete set of financial statements prepared in accordance with local standards and IFRS. However, specific explanatory notes are included to explain events and transactions that are significant to an understanding of changes in the Group's financial position and performance since the last annual financial statement.
The presentation of the Statements of Added Value (“DVA”), individual and consolidated, is required by Brazilian corporate legislation and by the accounting practices adopted in Brazil applicable to public companies CPC 09 – Statement of Added Value. IFRS standards do not require the presentation of this statement. As consequence, under IFRS, this statement is presented as supplementary information, without prejudice to the set of interim financial statements.
The information in the explanatory notes that did not undergo significant changes compared to the financial statements as of December 31, 2023, was not presented in full in this quarterly information.
These interim financial statements were prepared following the preparation basis and accounting policies consistent with those adopted in the preparation of the financial statements as of December 31, 2023. All balances have been rounded to the nearest thousand, unless otherwise indicated.
The significant judgments made by Management in applying the Company's accounting policies and the main sources of estimation uncertainty were the same as those described in the last annual financial statements, except for the revaluation of impairment in the indirect subsidiary Rumo Malha Sul.
The relevant information specific to the interim financial statements, and only them, are being disclosed and correspond to that used by Management in its management.
These interim financial statements were authorized for issuance by the Board of Directors on August 14, 2024.
Notes to the interim Financial Statements
(In thousands of Reais, except when otherwise indicated)
3.1. RECLASSIFICATION IN THE INCOME STATEMENT
ARSESP, through resolution 1,205 of August 18, 2021, NTF-044-2021, released a new Regulatory Accounting Manual and Chart of Accounts for the piped gas distribution sector for companies on its regulation with applicability as of fiscal year 2023.
According to the technical note mentioned above, ARSESP determines that the accounting of variations, positive and negative, between the price included in the tariffs and the price actually paid by the concessionaire to the supplier, which are periodically passed on to users through graphical accounts, must be recorded in the net operating revenue group. The accounting policy usually applied by the subsidiary Compass is consistent with the understanding of the essence of the operation, classifying the effects of the Regulatory Current Account ("CCR") on its gross income, but with allocations in the cost group of goods sold and services rendered. In addition, the document also mentions that the classification of expenses and costs may vary in relation to commonly adopted practices in which part of the administrative expenses are also admitted as costs of operations related to piped gas distribution services.
The indirect subsidiary Comgás has voluntarily reassessed the way in which it presents the classification of the effects of CCR and general and administrative expenses, as it understands that such presentation will meet the requirements of ARSESP and OCPC08, providing more consistent information in the consolidations in line with the practices adopted by the group. These reclassifications do not impact the main indicators, such as profit for the year and shareholders' equity, used by the indirect subsidiary Comgás and the other gas distributors of Compass.
The application of the change in the accounting policy generated the following reclassification in the income statement in the comparative period:
|
| Consolidated | ||||
|
| 2Q23 (Originally presented) |
| Reclassification |
| 2Q23 (Restated) |
Net operating revenue |
| 10,010,456 |
| 40,549 |
| 10,051,005 |
Cost of goods sold and services rendered |
| (7,135,119) |
| (102,132) |
| (7,237,251) |
Gross income |
| 2,875,337 |
| (61,583) |
| 2,813,754 |
Sales expenses |
| (341,507) |
| — |
| (341,507) |
General and administrative expenses |
| (594,273) |
| 61,583 |
| (532,690) |
Other operating income, net |
| (56,046) |
| — |
| (56,046) |
Operating results |
| (991,826) |
| 61,583 |
| (930,243) |
Result before equity income and net financial result |
| 1,883,511 |
| — |
| 1,883,511 |
|
| 6M23 (Originally presented) |
| Reclassification |
| 6M23 (Restated) |
Net operating revenue |
| 19,641,783 |
| 27,376 |
| 19,669,159 |
Cost of goods sold and services rendered |
| (14,267,636) |
| (148,218) |
| (14,415,854) |
Gross income |
| 5,374,147 |
| (120,842) |
| 5,253,305 |
Sales expenses |
| (681,240) |
| — |
| (681,240) |
General and administrative expenses |
| (1,144,055) |
| 120,842 |
| (1,023,213) |
Other operating income, net |
| 305,847 |
| — |
| 305,847 |
Operating results |
| (1,519,448) |
| 120,842 |
| (1,398,606) |
Result before equity income and net financial result |
| 3,854,699 |
| — |
| 3,854,699 |
Additionally, the Moove segment reviewed its initial adoption and reclassified revenues to reflect its operational performance more accurately, as detailed bellow:
Notes to the interim Financial Statements
(In thousands of Reais, except when otherwise indicated)
| 2Q23 |
| Reclassification |
| 2Q23 |
| 6M23 |
| Reclassification |
| 6M23 |
Reported segment |
|
|
|
|
|
|
|
|
|
|
|
Moove |
|
|
|
|
|
|
|
|
|
|
|
Finished product | 2,191,377 |
| 65,653 |
| 2,257,030 |
| 4,507,294 |
| 95,767 |
| 4,603,061 |
Base oil | 226,854 |
| (5,190) |
| 221,664 |
| 380,845 |
| (5,191) |
| 375,654 |
Services | 98,887 |
| (60,463) |
| 38,424 |
| 216,152 |
| (90,576) |
| 125,576 |
| 2,517,118 |
| — |
| 2,517,118 |
| 5,104,291 |
| — |
| 5,104,291 |
| 2Q23 |
| Reclassification |
| 2Q23 |
| 6M23 |
| Reclassification |
| 6M23 |
At a point in time |
|
|
|
|
|
|
|
|
|
|
|
Natural gas distribution | 4,077,261 |
| — |
| 4,077,261 |
| 8,126,823 |
| — |
| 8,126,823 |
Lubricants, base oil and other | 2,418,231 |
| 60,463 |
| 2,478,694 |
| 4,888,139 |
| 90,576 |
| 4,978,715 |
Other | 279,811 |
| — |
| 279,811 |
| 600,642 |
| — |
| 600,642 |
| 6,775,303 |
| 60,463 |
| 6,835,766 |
| 13,615,604 |
| 90,576 |
| 13,706,180 |
Over time |
|
|
|
|
|
|
|
|
|
|
|
Railroad transportation services | 2,639,483 |
| — |
| 2,639,483 |
| 4,913,781 |
| — |
| 4,913,781 |
Container operations | 123,629 |
| — |
| 123,629 |
| 233,159 |
| — |
| 233,159 |
Construction revenue | 391,712 |
| — |
| 391,712 |
| 694,620 |
| — |
| 694,620 |
Services rendered | 98,887 |
| (60,463) |
| 38,424 |
| 216,152 |
| (90,576) |
| 125,576 |
| 3,253,711 |
| (60,463) |
| 3,193,248 |
| 6,057,712 |
| (90,576) |
| 5,967,136 |
|
|
|
|
|
|
|
|
|
|
|
|
Eliminations | (18,558) |
| — |
| (18,558) |
| (31,533) |
| — |
| (31,533) |
Total net sales | 10,010,456 |
| — |
| 10,010,456 |
| 19,641,783 |
| — |
| 19,641,783 |
Notes to the interim Financial Statements
(In thousands of Reais, except when otherwise indicated)
The Company's senior management (the Chief Operating Decision Maker) uses segment information to evaluate the performance of operating segments and make resource allocation decisions. Earnings before interest, taxes, depreciation, and amortization ("EBITDA") are used by the Company to evaluate the performance of its operating segments.
Reported segments:
- Raízen: operates in (i) the production, commercialization, origination, and trading of ethanol, (ii) production and commercialization of bioenergy, (iii) resale and trading of electricity, (v) production, marketing, origination and trading of sugar and (iv) distribution and commercialization of fuels and lubricants and operations related to the Shell Select convenience store business and proximity OXXO of the Nós Group, a joint venture with FEMSA Comércio.
- Compass: (i) distribution of piped natural gas throughout Brazil to industrial, residential, commercial, automotive, and cogeneration customers; (ii) commercialization of electricity and natural gas; and (iii) development of infrastructure projects in a regasification terminal and offshore gas pipeline; and (iv) development of thermal generation projects utilizing natural gas.
- Moove: operates in the production, formulation and distribution of high-performance lubricants, base oils and specialties with headquarters in Brazil and operates in 11 countries in South America, North America, and Europe. It blends, distributes, and sells products under Mobil and proprietary brands for different end-markets including industrial, commercial and passenger/cargo vehicles.
- Rumo: logistics services for rail transport, port storage and loading of goods, primarily grains and sugar, leasing of locomotives, wagons, and other railroad equipment, as well as operation of containers.
- Radar: A reference in agricultural property management, Radar invests in a diversified portfolio with high valuation potential, through participation in the companies Radar, Tellus and Janus.
Reconciliation:
- Corporate Cosan: represents the reconciliation of Cosan’s corporate structure, which consists of: (i) senior management and corporate teams, which incur general and administrative expenses and other expenses (operating revenues), including pre-operational investments; (ii) the result of equity of assets, including participation in Vale S.A.; and (iii) financial result attributed to cash and debts of the parent, intermediate holdings (Cosan Oito, Cosan Nove and Cosan Dez) and offshores financial companies, and mining and investment projects at the Climate Tech Fund, fund managed by Fifth Wall, specializing in technological innovation.
Although Raízen S.A. is a joint venture registered under the equity method and is not proportionally consolidated, Management continues to review the information by segment. The reconciliation of these segments is presented in the column “Deconsolidation of jointly owned subsidiary”.
Notes to the interim Financial Statements
(In thousands of Reais, except when otherwise indicated)
In December 2023 the Company re-evaluated its segment structure presented as reconciliation items and added to the Corporate Cosan structure the company Cosan Dez and Cosan Investimentos. Because of this change, we present the comparative period of six and three month ended on June 30, 2023.
| 2Q24 (Restated) | ||||||||||||||||
| Reported segments |
|
| Reconciliation |
| Consolidated | |||||||||||
| Raízen |
| Compass |
| Moove |
| Rumo |
| Radar |
| Cosan Corporate |
| Deconsolidation of Joint Ventures |
| Elimination Between Segments |
| |
Result |
|
|
|
|
|
|
|
|
|
|
|
|
|
|
|
|
|
Net operating revenue | 57,759,456 |
| 4,402,310 |
| 2,580,960 |
| 3,574,737 |
| 153,404 |
| 4 |
| (57,759,456) |
| (17,407) |
| 10,694,008 |
Cost of goods sold and services provided | (55,138,374) |
| (3,510,681) |
| (1,836,776) |
| (1,807,554) |
| — |
| — |
| 55,138,374 |
| 17,407 |
| (7,137,604) |
Gross profit | 2,621,082 |
| 891,629 |
| 744,184 |
| 1,767,183 |
| 153,404 |
| 4 |
| (2,621,082) |
| — |
| 3,556,404 |
Selling expenses | (1,429,874) |
| (43,065) |
| (322,206) |
| (11,226) |
| — |
| — |
| 1,429,874 |
| — |
| (376,497) |
General and administrative expenses | (738,748) |
| (185,423) |
| (152,810) |
| (143,353) |
| (17,950) |
| (111,877) |
| 738,748 |
| — |
| (611,413) |
Other income (expenses), net | 2,336,914 |
| 428,946 |
| 6,480 |
| (2,487,904) |
| (1,994) |
| (354,571) |
| (2,336,914) |
| — |
| (2,409,043) |
Equity in associates’ earnings | (39,196) |
| 28,391 |
| — |
| 19,186 |
| (67) |
| 906,575 |
| 39,196 |
| (120,714) |
| 833,371 |
Equity income in joint ventures | — |
| — |
| — |
| — |
| — |
| 450,974 |
| — |
| — |
| 450,974 |
Financial result | (1,482,052) |
| (251,450) |
| (47,295) |
| (646,594) |
| (59,138) |
| (1,517,326) |
| 1,482,052 |
| — |
| (2,521,803) |
Financial expenses | (1,095,868) |
| (486,016) |
| (33,279) |
| (813,565) |
| (69,004) |
| (728,888) |
| 1,095,868 |
| — |
| (2,130,752) |
Financial revenue | 261,238 |
| 294,755 |
| 12,169 |
| 295,000 |
| 9,866 |
| 114,595 |
| (261,238) |
| — |
| 726,385 |
Foreign exchange variation | (1,848,944) |
| (241,691) |
| (45,441) |
| (629,337) |
| — |
| (1,526,349) |
| 1,848,944 |
| — |
| (2,442,818) |
Derivatives | 1,201,522 |
| 181,502 |
| 19,256 |
| 501,308 |
| — |
| 623,316 |
| (1,201,522) |
| — |
| 1,325,382 |
Income tax and social contribution | (226,022) |
| (269,726) |
| (43,709) |
| (239,888) |
| 3,668 |
| 658,177 |
| 226,022 |
| — |
| 108,522 |
Income for the period | 1,042,104 |
| 599,302 |
| 184,644 |
| (1,742,596) |
| 77,923 |
| 31,956 |
| (1,042,104) |
| (120,714) |
| (969,485) |
Result attributed to: |
|
|
|
|
|
|
|
|
|
|
|
|
|
|
|
|
|
Controlling shareholders | 1,026,612 |
| 492,933 |
| 129,797 |
| (530,486) |
| 28,470 |
| (227,108) |
| (1,026,612) |
| (120,714) |
| (227,108) |
Non-controlling shareholders | 15,492 |
| 106,369 |
| 54,847 |
| (1,212,110) |
| 49,453 |
| 259,064 |
| (15,492) |
| — |
| (742,377) |
| 1,042,104 |
| 599,302 |
| 184,644 |
| (1,742,596) |
| 77,923 |
| 31,956 |
| (1,042,104) |
| (120,714) |
| (969,485) |
Other selected information |
|
|
|
|
|
|
|
|
|
|
|
|
|
|
|
|
|
Depreciation and amortization | 1,960,930 |
| 254,833 |
| 75,042 |
| 592,572 |
| 68 |
| 3,877 |
| (1,960,930) |
| — |
| 926,392 |
EBITDA | 4,711,108 |
| 1,375,311 |
| 350,690 |
| (263,542) |
| 133,461 |
| 894,982 |
| (4,711,108) |
| (120,714) |
| 2,370,188 |
Additions to fixed assets, intangible assets and contract assets | 2,204,630 |
| 437,611 |
| 53,760 |
| 1,175,770 |
| 3,055 |
| 1,329 |
| (2,204,630) |
| — |
| 1,671,525 |
|
|
|
|
|
|
|
|
|
|
|
|
|
|
|
|
| — |
EBITDA reconciliation |
|
|
|
|
|
|
|
|
|
|
|
|
|
|
|
| — |
Income for the period | 1,042,104 |
| 599,302 |
| 184,644 |
| (1,742,596) |
| 77,923 |
| 31,956 |
| (1,042,104) |
| (120,714) |
| (969,485) |
Income taxes and social contribution | 226,022 |
| 269,726 |
| 43,709 |
| 239,888 |
| (3,668) |
| (658,177) |
| (226,022) |
| — |
| (108,522) |
Financial result | 1,482,052 |
| 251,450 |
| 47,295 |
| 646,594 |
| 59,138 |
| 1,517,326 |
| (1,482,052) |
| — |
| 2,521,803 |
Depreciation and amortization | 1,960,930 |
| 254,833 |
| 75,042 |
| 592,572 |
| 68 |
| 3,877 |
| (1,960,930) |
| — |
| 926,392 |
EBITDA | 4,711,108 |
| 1,375,311 |
| 350,690 |
| (263,542) |
| 133,461 |
| 894,982 |
| (4,711,108) |
| (120,714) |
| 2,370,188 |
Notes to the interim Financial Statements
(In thousands of Reais, except when otherwise indicated)
| 2Q23 (Restated) | ||||||||||||||||
| Reported segments |
| Reconciliation | Consolidated | |||||||||||||
| Raízen |
| Compass |
| Moove |
| Rumo |
| Radar |
| Cosan Corporate |
| Deconsolidation of Joint Ventures |
| Elimination Between Segments |
| |
Result |
|
|
|
|
|
|
|
|
|
|
|
|
|
|
|
|
|
Net operating revenue | 48,805,958 |
| 4,625,078 |
| 2,517,118 |
| 2,763,112 |
| 163,779 |
| 476 |
| (48,805,958) |
| (18,558) |
| 10,051,005 |
Cost of goods sold and services provided | (46,046,792) |
| (3,681,199) |
| (1,842,889) |
| (1,691,338) |
| (40,383) |
| — |
| 46,046,792 |
| 18,558 |
| (7,237,251) |
Gross profit | 2,759,166 |
| 943,879 |
| 674,229 |
| 1,071,774 |
| 123,396 |
| 476 |
| (2,759,166) |
| — |
| 2,813,754 |
Selling expenses | (1,325,032) |
| (41,378) |
| (291,034) |
| (9,093) |
| — |
| (2) |
| 1,325,032 |
| — |
| (341,507) |
General and administrative expenses | (703,850) |
| (157,292) |
| (139,454) |
| (120,318) |
| (16,592) |
| (99,034) |
| 703,850 |
| — |
| (532,690) |
Other income (expenses), net | 1,617,004 |
| (51,325) |
| (11,458) |
| (54,353) |
| 81,973 |
| (20,883) |
| (1,617,004) |
| — |
| (56,046) |
Equity in associates’ earnings | (79,136) |
| 45,696 |
| — |
| 21,438 |
| 408 |
| 416,006 |
| 79,136 |
| (416,416) |
| 67,132 |
Equity income in joint ventures | — |
| — |
| — |
| — |
| — |
| 263,003 |
| — |
| — |
| 263,003 |
Financial result | (1,375,764) |
| (234,948) |
| (61,293) |
| (675,897) |
| 7,994 |
| (2,178,632) |
| 1,375,764 |
| — |
| (3,142,776) |
Financial expenses | (1,563,720) |
| (309,703) |
| (40,131) |
| (1,130,297) |
| (1,816) |
| (3,940,272) |
| 1,563,720 |
| — |
| (5,422,219) |
Financial revenue | 226,568 |
| 230,609 |
| 21,498 |
| 267,271 |
| 9,810 |
| 99,686 |
| (226,568) |
| — |
| 628,874 |
Foreign exchange variation | 754,336 |
| 105,151 |
| (21,579) |
| 264,668 |
| — |
| 1,202,098 |
| (754,336) |
| — |
| 1,550,338 |
Derivatives | (792,948) |
| (261,005) |
| (21,081) |
| (77,539) |
| — |
| 459,856 |
| 792,948 |
| — |
| 100,231 |
Income tax and social contribution | (263,606) |
| (174,243) |
| (63,488) |
| (66,349) |
| (20,511) |
| 791,073 |
| 263,606 |
| — |
| 466,482 |
Income for the period | 628,782 |
| 330,389 |
| 107,502 |
| 167,202 |
| 176,668 |
| (827,993) |
| (628,782) |
| (416,416) |
| (462,648) |
Net profit for the period from discontinued operations | — |
| 15,907 |
| — |
| — |
| — |
| 7,140 |
| — |
| (7,140) |
| 15,907 |
Result attributed to: |
|
|
|
|
|
|
|
|
|
|
|
|
|
|
|
|
|
Controlling shareholders | 595,426 |
| 251,097 |
| 75,274 |
| 50,714 |
| 46,471 |
| (1,042,701) |
| (595,426) |
| (423,556) |
| (1,042,701) |
Non-controlling shareholders | 33,356 |
| 95,199 |
| 32,228 |
| 116,488 |
| 130,197 |
| 221,848 |
| (33,356) |
| — |
| 595,960 |
| 628,782 |
| 346,296 |
| 107,502 |
| 167,202 |
| 176,668 |
| (820,853) |
| (628,782) |
| (423,556) |
| (446,741) |
Other selected information |
|
|
|
|
|
|
|
|
|
|
|
|
|
|
|
|
|
Depreciation and amortization | 1,848,848 |
| 212,700 |
| 70,167 |
| 538,335 |
| 69 |
| 3,687 |
| (1,848,848) |
| — |
| 824,958 |
EBITDA | 4,117,000 |
| 952,280 |
| 302,450 |
| 1,447,783 |
| 189,254 |
| 563,253 |
| (4,117,000) |
| (416,416) |
| 3,038,604 |
Additions to fixed assets, intangible assets and contract assets | 1,948,314 |
| 506,618 |
| 43,569 |
| 692,748 |
| 14,023 |
| 16,725 |
| (1,948,314) |
| — |
| 1,273,683 |
|
|
|
|
|
|
|
|
|
|
|
|
|
|
|
|
| — |
EBITDA reconciliation |
|
|
|
|
|
|
|
|
|
|
|
|
|
|
|
| — |
Income for the period | 628,782 |
| 330,389 |
| 107,502 |
| 167,202 |
| 176,668 |
| (827,993) |
| (628,782) |
| (416,416) |
| (462,648) |
Income taxes and social contribution | 263,606 |
| 174,243 |
| 63,488 |
| 66,349 |
| 20,511 |
| (791,073) |
| (263,606) |
| — |
| (466,482) |
Financial result | 1,375,764 |
| 234,948 |
| 61,293 |
| 675,897 |
| (7,994) |
| 2,178,632 |
| (1,375,764) |
| — |
| 3,142,776 |
Depreciation and amortization | 1,848,848 |
| 212,700 |
| 70,167 |
| 538,335 |
| 69 |
| 3,687 |
| (1,848,848) |
| — |
| 824,958 |
EBITDA | 4,117,000 |
| 952,280 |
| 302,450 |
| 1,447,783 |
| 189,254 |
| 563,253 |
| (4,117,000) |
| (416,416) |
| 3,038,604 |
Notes to the interim Financial Statements
(In thousands of Reais, except when otherwise indicated)
6M24 | |||||||||||||||||
| Reported segments |
| Reconciliation |
| |||||||||||||
| Raízen |
| Compass |
| Moove |
| Rumo |
| Radar |
| Cosan Corporate |
| Deconsolidation of Joint Ventures |
| Elimination Between Segments |
| Consolidated |
Result |
|
|
|
|
|
|
|
|
|
|
|
|
|
|
|
|
|
Net operating revenue | 111,416,500 |
| 8,537,477 |
| 5,020,553 |
| 6,720,753 |
| 289,970 |
| 13 |
| (111,416,500) |
| (32,702) |
| 20,536,064 |
Cost of goods sold and services provided | (105,059,426) |
| (6,869,447) |
| (3,595,665) |
| (3,633,588) |
| — |
| (43) |
| 105,059,426 |
| 32,702 |
| (14,066,041) |
Gross profit | 6,357,074 |
| 1,668,030 |
| 1,424,888 |
| 3,087,165 |
| 289,970 |
| (30) |
| (6,357,074) |
| — |
| 6,470,023 |
Selling expenses | (3,009,722) |
| (86,391) |
| (628,695) |
| (22,815) |
| — |
| — |
| 3,009,722 |
| — |
| (737,901) |
General and administrative expenses | (1,669,152) |
| (359,255) |
| (286,979) |
| (295,170) |
| (36,335) |
| (216,929) |
| 1,669,152 |
| — |
| (1,194,668) |
Other income (expenses), net | 2,291,714 |
| 483,472 |
| 25,771 |
| (2,544,555) |
| (4,160) |
| (368,810) |
| (2,291,714) |
| — |
| (2,408,282) |
Equity in associates’ earnings | (105,548) |
| 57,474 |
| — |
| 27,236 |
| 19,882 |
| 1,847,130 |
| 105,548 |
| (656,927) |
| 1,294,795 |
Equity income in joint ventures | — |
| — |
| — |
| (2,422) |
| — |
| 49,488 |
| — |
| — |
| 47,066 |
Financial result | (3,197,184) |
| (455,469) |
| (46,071) |
| (1,267,671) |
| (50,578) |
| (2,481,343) |
| 3,197,184 |
| — |
| (4,301,132) |
Financial expenses | (2,340,890) |
| (889,584) |
| (31,587) |
| (1,604,698) |
| (70,571) |
| (1,398,868) |
| 2,340,890 |
| — |
| (3,995,308) |
Financial revenue | 498,162 |
| 541,697 |
| 34,863 |
| 535,639 |
| 19,993 |
| 209,294 |
| (498,162) |
| — |
| 1,341,486 |
Foreign exchange variation | (2,385,992) |
| (301,483) |
| (68,603) |
| (802,431) |
| — |
| (1,801,519) |
| 2,385,992 |
| — |
| (2,974,036) |
Derivatives | 1,031,536 |
| 193,901 |
| 19,256 |
| 603,819 |
| — |
| 509,750 |
| (1,031,536) |
| — |
| 1,326,726 |
Income tax and social contribution | (532,578) |
| (390,454) |
| (123,610) |
| (356,028) |
| (14,813) |
| 1,009,065 |
| 532,578 |
| — |
| 124,160 |
Income for the period | 134,604 |
| 917,407 |
| 365,304 |
| (1,374,260) |
| 203,966 |
| (161,429) |
| (134,604) |
| (656,927) |
| (705,939) |
Result attributed to: |
|
|
|
|
|
|
|
|
|
|
|
|
|
|
|
|
|
Controlling shareholders | 120,512 |
| 740,414 |
| 256,250 |
| (418,245) |
| 78,508 |
| (419,282) |
| (120,512) |
| (656,927) |
| (419,282) |
Non-controlling shareholders | 14,092 |
| 176,993 |
| 109,054 |
| (956,015) |
| 125,458 |
| 257,853 |
| (14,092) |
| — |
| (286,657) |
| 134,604 |
| 917,407 |
| 365,304 |
| (1,374,260) |
| 203,966 |
| (161,429) |
| (134,604) |
| (656,927) |
| (705,939) |
Depreciation and amortization | 4,726,588 |
| 505,251 |
| 144,648 |
| 1,175,875 |
| 137 |
| 7,814 |
| (4,726,588) |
| — |
| 1,833,725 |
EBITDA | 8,590,954 |
| 2,268,581 |
| 679,633 |
| 1,425,314 |
| 269,494 |
| 1,318,663 |
| (8,590,954) |
| (656,927) |
| 5,304,758 |
Additions to fixed assets, intangible assets and contract assets | 7,221,300 |
| 968,965 |
| 88,248 |
| 2,142,876 |
| 4,795 |
| 2,489 |
| (7,221,300) |
| — |
| 3,207,373 |
EBITDA reconciliation |
|
|
|
|
|
|
|
|
|
|
|
|
|
|
|
|
|
Income for the period | 134,604 |
| 917,407 |
| 365,304 |
| (1,374,260) |
| 203,966 |
| (161,429) |
| (134,604) |
| (656,927) |
| (705,939) |
Income taxes and social contribution | 532,578 |
| 390,454 |
| 123,610 |
| 356,028 |
| 14,813 |
| (1,009,065) |
| (532,578) |
| — |
| (124,160) |
Financial result | 3,197,184 |
| 455,469 |
| 46,071 |
| 1,267,671 |
| 50,578 |
| 2,481,343 |
| (3,197,184) |
| — |
| 4,301,132 |
Depreciation and amortization | 4,726,588 |
| 505,251 |
| 144,648 |
| 1,175,875 |
| 137 |
| 7,814 |
| (4,726,588) |
| — |
| 1,833,725 |
EBITDA | 8,590,954 |
| 2,268,581 |
| 679,633 |
| 1,425,314 |
| 269,494 |
| 1,318,663 |
| (8,590,954) |
| (656,927) |
| 5,304,758 |
Notes to the interim Financial Statements
(In thousands of Reais, except when otherwise indicated)
| 6M23 (Restated) | ||||||||||||||||
| Reported segments |
| Reconciliation |
| |||||||||||||
| Raízen |
| Compass |
| Moove |
| Rumo |
| Radar |
| Cosan Corporate |
| Deconsolidation of Joint Ventures |
| Elimination Between Segments |
| Consolidated |
Result |
|
|
|
|
|
|
|
|
|
|
|
|
|
|
|
|
|
Net operating revenue | 103,757,224 |
| 9,146,908 |
| 5,104,291 |
| 5,146,940 |
| 300,546 |
| 2,007 |
| (103,757,224) |
| (31,533) |
| 19,669,159 |
Cost of goods sold and services provided | (94,053,084) |
| (7,321,888) |
| (3,786,535) |
| (3,294,933) |
| (40,383) |
| (3,648) |
| 94,053,084 |
| 31,533 |
| (14,415,854) |
Gross profit | 9,704,140 |
| 1,825,020 |
| 1,317,756 |
| 1,852,007 |
| 260,163 |
| (1,641) |
| (9,704,140) |
| — |
| 5,253,305 |
Selling expenses | (2,587,540) |
| (80,285) |
| (582,756) |
| (17,643) |
| — |
| (556) |
| 2,587,540 |
| — |
| (681,240) |
General and administrative expenses | (1,546,154) |
| (295,121) |
| (277,104) |
| (223,239) |
| (34,557) |
| (193,192) |
| 1,546,154 |
| — |
| (1,023,213) |
Other income (expenses), net | 2,106,332 |
| (57,033) |
| (22,154) |
| (45,401) |
| 79,934 |
| 350,501 |
| (2,106,332) |
| — |
| 305,847 |
Equity in associates’ earnings | (112,950) |
| 97,831 |
| — |
| 22,267 |
| 21,447 |
| (367,326) |
| 112,950 |
| 345,878 |
| 120,097 |
Equity income in joint ventures | — |
| — |
| — |
| — |
| — |
| 1,393,417 |
| — |
| — |
| 1,393,417 |
Financial result | (2,739,203) |
| (700,436) |
| (141,365) |
| (1,283,297) |
| 14,196 |
| (3,800,989) |
| 2,739,203 |
| — |
| (5,911,891) |
Financial expenses | (2,921,117) |
| (1,069,290) |
| (116,937) |
| (2,074,675) |
| (3,511) |
| (6,413,067) |
| 2,921,117 |
| — |
| (9,677,480) |
Financial revenue | 409,432 |
| 430,465 |
| 44,182 |
| 564,039 |
| 17,707 |
| 173,144 |
| (409,432) |
| — |
| 1,229,537 |
Foreign exchange variation | 1,117,948 |
| 152,748 |
| (31,956) |
| 401,752 |
| — |
| 1,613,135 |
| (1,117,948) |
| — |
| 2,135,679 |
Derivatives | (1,345,466) |
| (214,359) |
| (36,654) |
| (174,413) |
| — |
| 825,799 |
| 1,345,466 |
| — |
| 400,373 |
Income tax and social contribution | (1,568,686) |
| (1,250,837) |
| (357,256) |
| (66,445) |
| (38,405) |
| 1,375,240 |
| 1,568,686 |
| — |
| (337,703) |
Income for the period | 3,255,939 |
| (460,861) |
| (62,879) |
| 238,249 |
| 302,778 |
| (1,244,546) |
| (3,255,939) |
| 345,878 |
| (881,381) |
Net profit for the period from discontinued operations | — |
| 15,907 |
| — |
| — |
| — |
| 7,140 |
| — |
| (7,140) |
| 15,907 |
Result attributed to: |
|
|
|
|
|
|
|
|
|
|
|
|
|
|
|
|
|
Controlling shareholders | 3,154,643 |
| (463,027) |
| (43,975) |
| 73,001 |
| 95,263 |
| (1,946,831) |
| (3,154,643) |
| 338,738 |
| (1,946,831) |
Non-controlling shareholders | 101,296 |
| 18,073 |
| (18,904) |
| 165,248 |
| 207,515 |
| 709,425 |
| (101,296) |
| — |
| 1,081,357 |
| 3,255,939 |
| (444,954) |
| (62,879) |
| 238,249 |
| 302,778 |
| (1,237,406) |
| (3,255,939) |
| 338,738 |
| (865,474) |
Other selected information |
|
|
|
|
|
|
|
|
|
|
|
|
|
|
|
|
|
Depreciation and amortization | 3,367,564 |
| 419,557 |
| 142,249 |
| 1,040,340 |
| 138 |
| 7,893 |
| (3,367,564) |
| — |
| 1,610,177 |
EBITDA | 10,931,392 |
| 1,909,969 |
| 577,991 |
| 2,628,331 |
| 327,125 |
| 1,189,096 |
| (10,931,392) |
| 345,878 |
| 6,978,390 |
Additions to fixed assets, intangible assets and contract assets | 6,086,088 |
| 1,033,647 |
| 77,642 |
| 1,620,607 |
| 25,859 |
| 24,062 |
| (6,086,088) |
| — |
| 2,781,817 |
|
|
|
|
|
|
|
|
|
|
|
|
|
|
|
|
| |
EBITDA reconciliation |
|
|
|
|
|
|
|
|
|
|
|
|
|
|
|
| |
Income for the period | 3,255,939 |
| (460,861) |
| (62,879) |
| 238,249 |
| 302,778 |
| (1,244,546) |
| (3,255,939) |
| 345,878 |
| (881,381) |
Income taxes and social contribution | 1,568,686 |
| 1,250,837 |
| 357,256 |
| 66,445 |
| 38,405 |
| (1,375,240) |
| (1,568,686) |
| — |
| 337,703 |
Financial result | 2,739,203 |
| 700,436 |
| 141,365 |
| 1,283,297 |
| (14,196) |
| 3,800,989 |
| (2,739,203) |
| — |
| 5,911,891 |
Depreciation and amortization | 3,367,564 |
| 419,557 |
| 142,249 |
| 1,040,340 |
| 138 |
| 7,893 |
| (3,367,564) |
| — |
| 1,610,177 |
EBITDA | 10,931,392 |
| 1,909,969 |
| 577,991 |
| 2,628,331 |
| 327,125 |
| 1,189,096 |
| (10,931,392) |
| 345,878 |
| 6,978,390 |
Notes to the interim Financial Statements
(In thousands of Reais, except when otherwise indicated)
| 06/30/2024 | ||||||||||||||||
| Reported segments |
| Reconciliation |
| |||||||||||||
| Raízen |
| Compass |
| Moove |
| Rumo |
| Radar |
| Cosan Corporate |
| Deconsolidation of Joint Ventures |
| Elimination Between Segments |
| Consolidated |
Statement of financial position: |
|
|
|
|
|
|
|
|
|
|
|
|
|
|
|
|
|
Cash and cash equivalents | 8,728,180 |
| 5,538,103 |
| 667,490 |
| 8,028,917 |
| 43,335 |
| 2,952,216 |
| (8,728,180) |
| — |
| 17,230,061 |
Marketable securities | 1,250,598 |
| 941,382 |
| 121,539 |
| 1,373,180 |
| 495,078 |
| 1,042,159 |
| (1,250,598) |
| — |
| 3,973,338 |
Trade receivables | 12,341,914 |
| 1,948,372 |
| 1,389,980 |
| 751,145 |
| 132,429 |
| — |
| (12,341,914) |
| — |
| 4,221,926 |
Derivative financial instruments | 11,994,438 |
| 197,214 |
| 19,256 |
| 1,423,752 |
| — |
| 1,017,437 |
| (11,994,438) |
| — |
| 2,657,659 |
Inventories | 17,981,654 |
| 374,911 |
| 1,503,905 |
| 267,700 |
| — |
| — |
| (17,981,654) |
| — |
| 2,146,516 |
Sectorial financial assets | — |
| 589,276 |
| — |
| — |
| — |
| — |
| — |
| — |
| 589,276 |
Other financial assets | 51,958 |
| 3,507 |
| 687 |
| — |
| — |
| — |
| (51,958) |
| — |
| 4,194 |
Other current assets | 9,830,570 |
| 1,731,043 |
| 304,518 |
| 955,982 |
| 534,926 |
| 2,268,436 |
| (9,830,570) |
| (453,613) |
| 5,341,292 |
Other non-current assets | 17,015,136 |
| 1,347,524 |
| 225,513 |
| 3,557,208 |
| 39,478 |
| 4,972,740 |
| (17,015,136) |
| (281,550) |
| 9,860,913 |
Investments in associates | — |
| 1,563,947 |
| — |
| 241,155 |
| 88,047 |
| 29,887,293 |
| — |
| (16,191,224) |
| 15,589,218 |
Investments in joint ventures | 1,364,200 |
| — |
| — |
| 46,144 |
| — |
| 11,703,660 |
| (1,364,200) |
| — |
| 11,749,804 |
Biological assets | 3,900,048 |
| — |
| — |
| — |
| — |
| — |
| (3,900,048) |
| — |
| — |
investment properties | — |
| — |
| — |
| — |
| 15,816,095 |
| — |
| — |
| — |
| 15,816,095 |
Contract assets | 3,188,028 |
| 987,557 |
| 11,200 |
| — |
| — |
| — |
| (3,188,028) |
| — |
| 998,757 |
Right-of-use assets | 9,794,534 |
| 1,544,594 |
| 260,160 |
| 8,027,807 |
| 3,186 |
| 19,213 |
| (9,794,534) |
| — |
| 9,854,960 |
Fixed assets | 35,336,144 |
| 1,393,111 |
| 839,082 |
| 17,939,337 |
| 21 |
| 48,704 |
| (35,336,144) |
| — |
| 20,220,255 |
Intangible assets | 9,792,966 |
| 13,544,892 |
| 2,947,917 |
| 6,594,788 |
| — |
| 8,422 |
| (9,792,966) |
| — |
| 23,096,019 |
Loans, financing and debentures | (43,729,542) |
| (13,364,237) |
| (3,261,002) |
| (19,625,258) |
| — |
| (26,261,360) |
| 43,729,542 |
| — |
| (62,511,857) |
Derivative financial instruments - liabilities | (9,011,774) |
| (176,536) |
| — |
| (1,333,487) |
| — |
| (719,448) |
| 9,011,774 |
| — |
| (2,229,471) |
Suppliers | (22,855,950) |
| (1,583,675) |
| (1,845,809) |
| (1,005,898) |
| (58,962) |
| (2,011) |
| 22,855,950 |
| — |
| (4,496,355) |
Employee benefits payables | (1,643,678) |
| (293,852) |
| (115,257) |
| (246,305) |
| — |
| (28,254) |
| 1,643,678 |
| — |
| (683,668) |
Sectorial financial liabilities | — |
| (1,934,084) |
| — |
| — |
| — |
| — |
| — |
| — |
| (1,934,084) |
Other current liabilities | (10,470,102) |
| (1,248,015) |
| (376,074) |
| (1,388,476) |
| (501,908) |
| (1,109,556) |
| 10,470,102 |
| 56,461 |
| (4,567,568) |
Lease liabilities | (11,163,804) |
| (1,850,884) |
| (267,700) |
| (4,032,648) |
| (3,391) |
| (26,381) |
| 11,163,804 |
| — |
| (6,181,004) |
Other non-current liabilities | (16,348,334) |
| (2,673,720) |
| (570,507) |
| (7,066,265) |
| (525,736) |
| (2,332,837) |
| 16,348,334 |
| 678,699 |
| (12,490,366) |
Total assets (net of liabilities) allocated by segment | 27,347,184 |
| 8,580,430 |
| 1,854,898 |
| 14,508,778 |
| 16,062,598 |
| 23,440,433 |
| (27,347,184) |
| (16,191,227) |
| 48,255,910 |
Total assets | 142,570,368 |
| 31,705,433 |
| 8,291,247 |
| 49,207,115 |
| 17,152,595 |
| 53,920,280 |
| (142,570,368) |
| (16,926,387) |
| 143,350,283 |
Shareholders’ equity attributable to: |
|
|
|
|
|
|
|
|
|
|
|
|
|
|
|
|
|
Controlling shareholders | 26,566,112 |
| 5,552,680 |
| 1,297,308 |
| 4,352,219 |
| 4,989,020 |
| 19,784,314 |
| (26,566,112) |
| (16,191,227) |
| 19,784,314 |
Non-controlling shareholders | 781,072 |
| 3,027,750 |
| 557,590 |
| 10,156,559 |
| 11,073,578 |
| 3,656,119 |
| (781,072) |
| — |
| 28,471,596 |
Total shareholders’ equity | 27,347,184 |
| 8,580,430 |
| 1,854,898 |
| 14,508,778 |
| 16,062,598 |
| 23,440,433 |
| (27,347,184) |
| (16,191,227) |
| 48,255,910 |
Notes to the interim Financial Statements
(In thousands of Reais, except when otherwise indicated)
| 12/31/2023 | ||||||||||||||||
| Reported segments |
| Reconciliation |
| |||||||||||||
| Raízen |
| Compass |
| Moove |
| Rumo |
| Radar |
| Cosan Corporate |
| Deconsolidation of Joint Ventures |
| Elimination Between Segments |
| Consolidated |
Balance sheet items: |
|
|
|
|
|
|
|
|
|
|
|
|
|
|
|
|
|
Cash and cash equivalents | 7,915,876 |
| 3,931,532 |
| 773,552 |
| 7,233,993 |
| 39,946 |
| 2,679,458 |
| (7,915,876) |
| — |
| 14,658,481 |
Marketable securities | 349,584 |
| 800,267 |
| 77,814 |
| 1,396,107 |
| 239,361 |
| 990,412 |
| (349,584) |
| — |
| 3,503,961 |
Trade receivables | 13,438,430 |
| 1,550,973 |
| 1,101,854 |
| 556,298 |
| 234,801 |
| 710 |
| (13,438,430) |
| — |
| 3,444,636 |
Derivative financial instruments - assets | 10,888,050 |
| 175,655 |
| — |
| 1,561,493 |
| — |
| 809,651 |
| (10,888,050) |
| — |
| 2,546,799 |
Inventories | 17,310,692 |
| 292,335 |
| 1,284,773 |
| 215,605 |
| — |
| 1 |
| (17,310,692) |
| — |
| 1,792,714 |
Sectorial financial assets | — |
| 548,700 |
| — |
| — |
| — |
| — |
| — |
| — |
| 548,700 |
Other financial assets | 103,774 |
| 2,423 |
| 690 |
| — |
| — |
| — |
| (103,774) |
| — |
| 3,113 |
Other current assets | 8,478,292 |
| 1,553,524 |
| 193,836 |
| 841,417 |
| 375,716 |
| 3,152,651 |
| (8,478,292) |
| (1,106,687) |
| 5,010,457 |
Other non-current assets | 13,957,596 |
| 1,166,991 |
| 209,823 |
| 3,528,375 |
| 14,378 |
| 3,832,013 |
| (13,957,596) |
| (180,880) |
| 8,570,700 |
Investments in associates | — |
| 1,630,124 |
| 2 |
| 312,302 |
| 88,656 |
| 32,792,891 |
| — |
| (17,212,606) |
| 17,611,369 |
Investments in joint ventures | 1,321,982 |
| — |
| — |
| 48,566 |
| — |
| 11,693,876 |
| (1,321,982) |
| — |
| 11,742,442 |
Biological assets | 3,818,316 |
| — |
| — |
| — |
| — |
| — |
| (3,818,316) |
| — |
| — |
investment properties | — |
| — |
| — |
| — |
| 15,976,126 |
| — |
| — |
| — |
| 15,976,126 |
Contract assets | 3,108,696 |
| 1,041,421 |
| 10,684 |
| — |
| — |
| — |
| (3,108,696) |
| — |
| 1,052,105 |
Right-of-use assets | 9,645,522 |
| 1,588,292 |
| 195,953 |
| 7,703,754 |
| 3,319 |
| 22,200 |
| (9,645,522) |
| — |
| 9,513,518 |
Fixed assets | 30,144,420 |
| 1,255,012 |
| 755,955 |
| 19,176,386 |
| 24 |
| 52,597 |
| (30,144,420) |
| — |
| 21,239,974 |
Intangible assets | 9,677,254 |
| 13,299,255 |
| 2,679,983 |
| 6,664,143 |
| — |
| 6,906 |
| (9,677,254) |
| — |
| 22,650,287 |
Loans, financing and debentures | (39,634,986) |
| (10,017,150) |
| (2,207,028) |
| (18,964,841) |
| — |
| (25,715,635) |
| 39,634,986 |
| — |
| (56,904,654) |
Derivative financial instruments - liabilities | (7,870,706) |
| (360,784) |
| (742) |
| (1,471,795) |
| — |
| (1,581,824) |
| 7,870,706 |
| — |
| (3,415,145) |
Suppliers | (20,150,654) |
| (1,534,041) |
| (1,494,568) |
| (1,084,931) |
| (68,422) |
| (2,563) |
| 20,150,654 |
| — |
| (4,184,525) |
Employee benefits payables | (966,452) |
| (301,560) |
| (147,313) |
| (318,550) |
| — |
| (61,906) |
| 966,452 |
| — |
| (829,329) |
Sectorial financial liabilities | — |
| (1,810,698) |
| — |
| — |
| — |
| — |
| — |
| — |
| (1,810,698) |
Other current liabilities | (10,642,734) |
| (1,703,128) |
| (336,080) |
| (1,583,216) |
| (182,298) |
| (1,239,688) |
| 10,642,734 |
| 571,201 |
| (4,473,209) |
Lease liabilities | (11,304,874) |
| (1,636,943) |
| (198,964) |
| (3,406,843) |
| (3,502) |
| (29,542) |
| 11,304,874 |
| — |
| (5,275,794) |
Other non-current liabilities | (12,284,662) |
| (2,678,578) |
| (580,103) |
| (6,537,271) |
| (543,490) |
| (2,367,850) |
| 12,284,662 |
| 716,444 |
| (11,990,848) |
Total assets (net of liabilities) allocated by segment | 27,303,416 |
| 8,793,622 |
| 2,320,121 |
| 15,870,992 |
| 16,174,615 |
| 25,034,358 |
| (27,303,416) |
| (17,212,528) |
| 50,981,180 |
Total assets | 130,158,484 |
| 28,836,504 |
| 7,284,919 |
| 49,238,439 |
| 16,972,327 |
| 56,033,366 |
| (130,158,484) |
| (18,500,173) |
| 139,865,382 |
Shareholders’ equity attributable to: |
|
|
|
|
|
|
|
|
|
|
|
|
|
|
|
|
|
Controlling shareholders | 26,561,384 |
| 5,798,294 |
| 1,624,273 |
| 4,766,403 |
| 5,023,574 |
| 20,955,291 |
| (26,561,384) |
| (17,212,528) |
| 20,955,307 |
Non-controlling shareholders | 742,032 |
| 2,995,328 |
| 695,848 |
| 11,104,589 |
| 11,151,041 |
| 4,079,067 |
| (742,032) |
| — |
| 30,025,873 |
Total shareholders’ equity | 27,303,416 |
| 8,793,622 |
| 2,320,121 |
| 15,870,992 |
| 16,174,615 |
| 25,034,358 |
| (27,303,416) |
| (17,212,528) |
| 50,981,180 |
Notes to the interim Financial Statements
(In thousands of Reais, except when otherwise indicated)
4.1 NET SALES BY SEGMENT
| 2Q24 |
| 2Q23 (Restated) (i) |
| 6M24 |
| 6M23 (Restated) (i) |
Reported segment |
|
|
|
|
|
|
|
Raízen |
|
|
|
|
|
|
|
Ethanol | 5,645,291 |
| 4,728,338 |
| 11,254,874 |
| 11,278,031 |
Sugar | 6,458,023 |
| 5,354,928 |
| 14,219,618 |
| 11,321,155 |
Gasoline | 15,814,690 |
| 16,690,119 |
| 31,387,072 |
| 33,352,930 |
Diesel | 26,577,829 |
| 19,027,181 |
| 48,190,169 |
| 41,634,936 |
Cogeneration | 812,020 |
| 734,114 |
| 1,672,619 |
| 1,560,159 |
Other | 2,451,603 |
| 2,271,278 |
| 4,692,148 |
| 4,610,013 |
| 57,759,456 |
| 48,805,958 |
| 111,416,500 |
| 103,757,224 |
Compass |
|
|
|
|
|
|
|
Natural gas distribution |
|
|
|
|
|
|
|
Industrial | 2,893,420 |
| 2,942,385 |
| 5,686,944 |
| 5,896,764 |
Residential | 583,327 |
| 601,953 |
| 1,049,511 |
| 1,107,140 |
Cogeneration | 114,588 |
| 201,628 |
| 252,625 |
| 413,493 |
Automotive | 114,910 |
| 155,476 |
| 235,294 |
| 317,320 |
Commercial | 213,737 |
| 208,602 |
| 407,029 |
| 403,106 |
Construction revenue | 381,153 |
| 391,712 |
| 701,184 |
| 694,620 |
Other | 96,025 |
| 123,322 |
| 199,741 |
| 314,465 |
| 4,397,160 |
| 4,625,078 |
| 8,532,328 |
| 9,146,908 |
Gas marketing | 387,457 |
| — |
| 396,522 |
| — |
Eliminations | (382,307) |
| — |
| (391,373) |
| — |
| 4,402,310 |
| 4,625,078 |
| 8,537,477 |
| 9,146,908 |
Moove |
|
|
|
|
|
|
|
Finished product | 2,210,631 |
| 2,257,030 |
| 4,274,762 |
| 4,603,061 |
Base oil | 149,682 |
| 221,664 |
| 318,623 |
| 375,654 |
Services | 220,647 |
| 38,424 |
| 427,168 |
| 125,576 |
| 2,580,960 |
| 2,517,118 |
| 5,020,553 |
| 5,104,291 |
Rumo |
|
|
|
|
|
|
|
North operations | 2,815,282 |
| 2,085,358 |
| 5,249,914 |
| 3,910,028 |
South operations | 602,283 |
| 554,125 |
| 1,165,414 |
| 1,003,753 |
Container operations | 157,172 |
| 123,629 |
| 305,425 |
| 233,159 |
| 3,574,737 |
| 2,763,112 |
| 6,720,753 |
| 5,146,940 |
Radar |
|
|
|
|
|
|
|
Lease and sale of lands | 153,404 |
| 163,779 |
| 289,970 |
| 300,546 |
Reconciliation |
|
|
|
|
|
|
|
Cosan Corporate | 4 |
| 476 |
| 13 |
| 2,007 |
Deconsolidation of joint venture and eliminations | (57,776,863) |
| (48,824,516) |
| (111,449,202) |
| (103,788,757) |
Total | 10,694,008 |
| 10,051,005 |
| 20,536,064 |
| 19,669,159 |
Notes to the interim Financial Statements
(In thousands of Reais, except when otherwise indicated)
4.2 INFORMATION ON GEOGRAPHICAL AREA
| Net sales | ||||||
| 2Q24 |
| 2Q23 |
| 6M24 |
| 6M23 |
Brazil | 9,234,950 |
| 8,626,560 |
| 17,753,257 |
| 16,719,953 |
Europe (i) | 771,588 |
| 732,654 |
| 1,468,327 |
| 1,546,562 |
Latin America (ii) | 77,335 |
| 71,659 |
| 133,751 |
| 128,844 |
North America (iii) | 610,135 |
| 620,132 |
| 1,180,729 |
| 1,273,800 |
Total | 10,694,008 |
| 10,051,005 |
| 20,536,064 |
| 19,669,159 |
| Other non-current assets |
|
|
|
| ||
| 06/30/2024 |
| 12/31/2023 |
|
|
|
|
Brazil | 13,435,701 |
| 12,584,481 |
|
|
|
|
Europe (i) | 4,358 |
| 3,275 |
|
|
|
|
Latin America (ii) | 9,535 |
| 10,087 |
|
|
|
|
North America (iii) | 13,988 |
| 8,969 |
|
|
|
|
| 13,463,582 |
| 12,606,812 |
|
|
|
|
Main countries:
| (i) | England, France, Spain and Portugal; | |
| (ii) | Argentina, Bolivia, Uruguay and Paraguay, and | |
| (iii) | United States of America. | |
| 31 |
Notes to the interim Financial Statements
(In thousands of Reais, except when otherwise indicated)
Financial assets and liabilities are stated as classified below:
|
|
| Parent Company |
| Consolidated | ||||
| Note |
| 06/30/2024 |
| 12/31/2023 |
| 06/30/2024 |
| 12/31/2023 |
Assets |
|
|
|
|
|
|
|
|
|
Fair value through financial result |
|
|
|
|
|
|
|
|
|
Cash and cash equivalents | 5.2 |
| 1,685,701 |
| 1,667,155 |
| 3,731,612 |
| 3,298,142 |
Marketable securities | 5.3 |
| 598,482 |
| 705,777 |
| 3,973,338 |
| 3,503,961 |
Derivative financial instruments | 5.6 |
| 778,451 |
| 157,816 |
| 2,657,659 |
| 2,546,799 |
Other financial assets |
|
| — |
| — |
| 4,194 |
| 3,113 |
|
|
| 3,062,634 |
| 2,530,748 |
| 10,366,803 |
| 9,352,015 |
Amortized cost |
|
|
|
|
|
|
|
|
|
Cash and cash equivalents | 5.2 |
| 114,668 |
| 102,821 |
| 13,498,449 |
| 11,360,339 |
Trade receivables | 5.7 |
| — |
| — |
| 4,221,926 |
| 3,444,636 |
Restricted cash | 5.3 |
| 41,679 |
| 81,621 |
| 168,734 |
| 203,252 |
Receivables from related parties | 5.8 |
| 315,713 |
| 348,096 |
| 365,636 |
| 340,091 |
Sectorial financial assets | 5.10 |
| — |
| — |
| 589,276 |
| 548,700 |
Dividends and interest on equity receivable | 17 |
| 179,478 |
| 319,135 |
| 299,249 |
| 255,777 |
|
|
| 651,538 |
| 851,673 |
| 19,143,270 |
| 16,152,795 |
Total |
|
| 3,714,172 |
| 3,382,421 |
| 29,510,073 |
| 25,504,810 |
Liabilities |
|
|
|
|
|
|
|
|
|
Amortized cost |
|
|
|
|
|
|
|
|
|
Loans, financings and debentures |
|
| (19,079,276) |
| (13,496,324) |
| (36,047,210) |
| (33,952,162) |
Trade payables | 5.9 |
| (1,957) |
| (2,431) |
| (4,496,355) |
| (4,184,525) |
Consideration payable |
|
| — |
| — |
| (196,188) |
| (203,094) |
Other financial liabilities |
|
| — |
| — |
| (433,135) |
| (476,895) |
Leases | 5.5 |
| (26,380) |
| (29,543) |
| (6,181,004) |
| (5,275,794) |
Railroad concession payable | 13 |
| — |
| — |
| (3,767,106) |
| (3,565,373) |
Related parties payable | 5.8 |
| (7,460,333) |
| (6,648,867) |
| (498,751) |
| (323,238) |
Dividends payable | 17 |
| (60,385) |
| (276,065) |
| (289,980) |
| (549,054) |
Sectorial financial liabilities | 5.10 |
| — |
| — |
| (1,934,084) |
| (1,810,698) |
Installment of tax debts | 14 |
| (215,133) |
| (211,226) |
| (265,179) |
| (217,348) |
|
|
| (26,843,464) |
| (20,664,456) |
| (54,108,992) |
| (50,558,181) |
Fair value through financial result |
|
|
|
|
|
|
|
|
|
Loans, financings and debentures |
|
| — |
| — |
| (26,464,647) |
| (22,952,492) |
Derivative financial instruments | 5.6 |
| (719,449) |
| (645,985) |
| (2,229,471) |
| (3,415,145) |
|
|
| (719,449) |
| (645,985) |
| (28,694,118) |
| (26,367,637) |
Total |
|
| (27,562,913) |
| (21,310,441) |
| (82,803,110) |
| (76,925,818) |
Notes to the interim Financial Statements
(In thousands of Reais, except when otherwise indicated)
Under the terms of the main loan lines, the Company and its subsidiaries are required to comply with the following financial clauses:
Company | Debt | Triggers | Ratios |
Cosan Corporate |
|
|
|
Cosan S.A. | * 1st issue debenture | Net debt (i) / EBITDA (ii) cannot exceed 4.0x | 2.78 |
Cosan Luxembourg S.A. | * Senior Notes 2027 | Proforma net debt (iv) / pro forma EBITDA (iv) cannot exceed 3.5x | 2.46 |
* Senior Notes 2029 | |||
* Senior Notes 2030 | |||
* Senior Notes 2031 | |||
Compass |
|
|
|
Comgás S.A. | * 4th issue debenture | Short-term debt / total debt (iii) cannot exceed 0.6x | 0.24 |
Comgás S.A. | * Debenture 4th to 10th issues | Net debt (i) / EBITDA (ii) cannot exceed 4.0x | 1.60 |
* BNDES | |||
* Loan 4131 | |||
Sulgás | * BNDES | Net debt (i) / EBITDA (ii) cannot exceed 3.5x | 0.60 |
General indebtedness ratio (Total liabilities / Total liabilities + Shareholders' equity) may not exceed 0.8 | 0.69 | ||
Necta | * 1st issue debenture | Net debt (i) / EBITDA (ii) cannot exceed 4.0x | 0.56 |
Moove |
|
|
|
MLH | *Syndicated Loan | Net debt (i) / EBITDA (ii) cannot exceed 3.5x at the end of each quarter | 1.90 |
ICSD (x) cannot be less than 2.5x at the end of each quarter | 5.87 | ||
Rumo |
|
|
|
Rumo S.A. | * Debenture (11th, 12th, 13th and 14th) (viii) | ICJ (ix) = EBITDA(ii) / Financial result(v) cannot be less than 2.0x | 4.95 |
* ECA | |||
Rumo S.A. | * NCE | Net debt (i) / EBITDA (ii) cannot exceed 3.5x | 1.47 |
* ECA | |||
| * Senior Notes 2028(vi) |
|
|
* Senior Notes 2032(vii) | |||
* Debentures (vii) | |||
Brado | * NCE | Net debt (i) / EBITDA (ii) cannot exceed 3.3x | 1.13 |
Notes to the interim Financial Statements
(In thousands of Reais, except when otherwise indicated)
| (i) | Net debt consists of the balance of loans, financing and debentures, obligations to preferred shareholders in subsidiaries ("Gross Debt"), net of cash and cash equivalents, marketable securities and derivative financial instruments on debt. |
| (ii) | Corresponds to the EBITDA accumulated over the previous twelve months. |
| (iii) | Total debt is the sum of current and non-current loans, financing and debentures, leasing, as well as current and non-current derivative financial instruments. |
| (iv) | Net debt and proforma EBITDA, including joint venture financial information. Net Debt and proforma EBITDA are non-GAAP measures. Pro forma EBITDA corresponds to the accumulated period of the last 12 months. For the covenants of the senior notes, the values of the unrestricted subsidiaries are excluded. |
| (v) | The financial result of net debt is represented by the cost of net debt. |
| (vi) | Senior Notes due 2028 was the first Green issuance in the Latin American freight rail sector. The subsidiary Rumo is committed to using the resources to fully or partially finance ongoing and future projects that contribute to the promotion of a resource-efficient, low-carbon transport sector in Brazil. Eligible projects include "acquisition, replacement, and modernization of rolling stock," "Infrastructure for duplication of railway sections, new yards, and yard extensions," and "railway modernization." The subsidiary publishes an annual report detailing the progress of projects, which is available on the investor relations page. |
| (vii) | Senior Notes due 2032 was an issue of Sustainability-Linked Bonds (SLBs), with the following sustainable targets: reduction of 17.6% by 2026 in greenhouse gas emissions per Ton per useful kilometer (“TKU”) with the base date of December 2020 as the starting point. The company is subject to a step-up of 25 basis points from July 2027 if it does not reach this target, which would increase the interest rate to 4.45% p.a. |
| (viii) | The 11th, 12th and 13th issues debentures have a contractual leverage ratio limited to 3.0x. However, they have a prior consent (waiver) that allows the broadcaster to extrapolate this index up to the limit of 3.5x until December 31, 2027. |
| (ix) | Interest Coverage Ratio (Índice de Cobertura de Juros) (“ICJ”). |
| (x) | Debt Service Coverage Ratio (Índice de Cobertura do Serviço da Dívida) (“ICSD”). |
Other ESG (Environmental, Social, and Corporate Governance) commitments
The 2nd debenture of the indirect subsidiary Rumo Malha Paulista is linked to the sustainable goal of reducing greenhouse gas emissions per ton of useful kilometer (TKU) by 15% by 2023, with the base date of December 2019 as the starting point. Compliance with the condition for the rate step down was verified based on Rumo's Annual Sustainability Report ("RAS"), which contains consolidated data for Malha Paulista, for the fiscal year ending December 31, 2023. Therefore, the Company will benefit from a step-down of 25 basis points in each series, which will reduce the rate from the next capitalization period to CDI+ 0.54% in the 1st series and IPCA + 4.52% in the 2nd series.
Notes to the interim Financial Statements
(In thousands of Reais, except when otherwise indicated)
The 17th Debenture of Rumo S.A. is linked to the sustainable goal of reducing (i) 17.6% of tons of direct greenhouse gas emissions per useful kilometer (TKU) by 2026; and (ii) 21.6% by 2030, based on 2020. Rumo is subject to the step-up of 25 basis points in the 1st series and 20 basis points in the 2nd series if the SKPI is not reached in 2026 and an increase of 5 basis points in the 2nd series if the SKPI is not reached in 2030.
As of June 30, 2024, the Company and its subsidiaries were complying with all financial and non-financial restrictive provisions.
The terms of the loans include provisions for cross-default.
| Parent Company |
| Consolidated | ||||
| 06/30/2024 |
| 12/31/2023 |
| 06/30/2024 |
| 12/31/2023 |
Cash and bank accounts | 819 |
| 251 |
| 563,132 |
| 209,479 |
Savings account | 113,658 |
| 102,400 |
| 719,745 |
| 431,011 |
Financial Investments | 1,685,892 |
| 1,667,325 |
| 15,947,184 |
| 14,017,991 |
| 1,800,369 |
| 1,769,976 |
| 17,230,061 |
| 14,658,481 |
Financial investments include the following:
| Parent Company |
| Consolidated | ||||
| 06/30/2024 |
| 12/31/2023 |
| 06/30/2024 |
| 12/31/2023 |
Bank investments |
|
|
|
|
|
|
|
Repurchase Agreements (i) | 1,500,349 |
| 1,667,155 |
| 3,418,184 |
| 3,259,210 |
Certificate of bank deposits - CDB | 185,352 |
| — |
| 313,428 |
| — |
Other investments | — |
| — |
| - |
| 38,932 |
| 1,685,701 |
| 1,667,155 |
| 3,731,612 |
| 3,298,142 |
Repurchase agreements | — |
| — |
| 34,204 |
| 616,633 |
Certificate of bank deposits - CDB | — |
| — |
| 12,167,279 |
| 9,807,983 |
Other | 191 |
| 170 |
| 14,089 |
| 295,233 |
| 191 |
| 170 |
| 12,215,572 |
| 10,719,849 |
| 1,685,892 |
| 1,667,325 |
| 15,947,184 |
| 14,017,991 |
| (i) | The Parent Company’s repo operations are allocated to the WG Fixed Income Private Credit Investment Fund ("WG"), which was constituted as an open condominium and is managed by Itaú Unibanco Asset Management Ltda. ("Itaú Asset"). The fund's portfolio is mainly composed of investments in government securities and repo operations backed by federal government securities. |
| The Company's onshore financial investments bear interest at rates approximating 100% of the Brazilian interbank offered rate (Certificado de Depósito Interbancário, or "CDI") as of Junho 30, 2024 and December 31, 2023. Offshore financial investments are remunerated at rates around 100% of the Fed funds (Federal Reserve System). The sensitivity analysis of interest rate risks is in 5.12. | |
Notes to the interim Financial Statements
(In thousands of Reais, except when otherwise indicated)
| Parent Company |
| Consolidated | ||||
| 06/30/2024 |
| 12/31/2023 |
| 06/30/2024 |
| 12/31/2023 |
Marketable securities |
|
|
|
|
|
|
|
Government securities (ii) | 598,482 |
| 705,777 |
| 3,577,371 |
| 3,107,813 |
Certificate of bank deposits | — |
| — |
| 284,413 |
| 300,142 |
ESG Funds | — |
| — |
| 111,554 |
| 96,006 |
| 598,482 |
| 705,777 |
| 3,973,338 |
| 3,503,961 |
Current | 598,482 |
| 705,777 |
| 3,861,784 |
| 3,407,955 |
Non-current | — |
| — |
| 111,554 |
| 96,006 |
Total | 598,482 |
| 705,777 |
| 3,973,338 |
| 3,503,961 |
Restricted cash |
|
|
|
|
|
|
|
Securities pledged as collateral | 41,679 |
| 81,621 |
| 168,734 |
| 203,252 |
| 41,679 |
| 81,621 |
| 168,734 |
| 203,252 |
|
|
|
|
|
|
|
|
Current | — |
| — |
| 8,435 |
| 7,860 |
Non-current | 41,679 |
| 81,621 |
| 160,299 |
| 195,392 |
Total | 41,679 |
| 81,621 |
| 168,734 |
| 203,252 |
| (i) | The sovereign debt securities declared interest linked to the Special System of Liquidation and Custody (Sistema Especial de Liquidação e Custódia), or “SELIC”, with a yield of approximately 100% of the CDI. |
| 36 |
Notes to the interim Financial Statements
(In thousands of Reais, except when otherwise indicated)
a) Composition
|
| Interest |
|
|
| Parent Company |
|
|
|
| ||||
Description |
| Index |
| Interest Rate |
| Currency |
| 06/30/2024 |
| 12/31/2023 |
| Maturity |
| Objective |
No Warranty |
|
|
|
|
|
|
|
|
|
|
|
|
|
|
Debentures |
| CDI + 2.65% |
| 13.33% |
| Real |
| 1,204,930 |
| 1,208,141 |
| Aug-25 |
| Investments |
|
| CDI + 1.65% |
| 12.22% |
| Real |
| 780,066 |
| 784,475 |
| Aug-28 |
| Capital management |
|
| CDI + 1.50% |
| 12.06% |
| Real |
| 722,226 |
| — |
| Jun-34 |
| Capital management |
|
| CDI + 1.50% |
| 12.06% |
| Real |
| 405,929 |
| 406,471 |
| May-28 |
| Capital management |
|
| CDI + 1.90% |
| 12.50% |
| Real |
| 1,116,348 |
| 1,117,966 |
| May-32 |
| Capital management |
|
| CDI + 2.00% |
| 12.61% |
| Real |
| 936,578 |
| 942,010 |
| Aug-31 |
| Capital management |
|
| CDI + 2.40% |
| 13.05% |
| Real |
| 1,018,426 |
| 1,020,673 |
| Apr-28 |
| Capital management |
|
| CDI + 2.40% |
| 13.05% |
| Real |
| 998,790 |
| 998,542 |
| Jun-28 |
| Capital management |
|
| CDI + 1.80% |
| 12.39% |
| Real |
| 1,339,035 |
| 1,260,684 |
| Jan-31 |
| Capital management |
|
| CDI + 1.00% |
| 11.50% |
| Real |
| 722,226 |
| — |
| Jun-29 |
| Capital management |
|
| IPCA + 5.75% |
| 10.31% |
| Real |
| 424,166 |
| 412,478 |
| Aug-31 |
| Capital management |
|
| 8.02% + exchange rate variation (i) |
| 8.02% |
| Dollar |
| 1,667,479 |
| 1,451,867 |
| Jun-30 |
| Capital management |
|
| 7.52% base 360 |
| 7.52% |
| Dollar |
| 3,391,765 |
| 2,897,097 |
| Sep-29 |
| Capital management |
Commercial bank notes |
| CDI + 1.75% |
| 12.33% |
| Real |
| 547,732 |
| 547,755 |
| Dec-28 |
| Capital management |
|
| CDI + 1.80% |
| 12.39% |
| Real |
| 476,025 |
| 448,165 |
| Jan-31 |
| Capital management |
Loan 4131 |
| Prefixed |
| 6.60% |
| Dollar |
| 3,327,555 |
| — |
| Jun-31 |
| Capital management |
Total |
|
|
|
|
|
|
| 19,079,276 |
| 13,496,324 |
|
|
|
|
Current |
|
|
|
|
|
|
| 949,915 |
| 800,987 |
|
|
|
|
Non-current |
|
|
|
|
|
|
| 18,129,361 |
| 12,695,337 |
|
|
|
|
| (i) | The operation has an interest rate for the first interest flow of 16.04% p.a., while for the other flows it will be 8.02% p.a. |
Notes to the interim Financial Statements
(In thousands of Reais, except when otherwise indicated)
|
| Interest |
| Consolidated |
|
|
|
|
|
| ||||||
Description |
| Index |
| Currency |
| Annual interest rate |
| 06/30/2024 |
| 12/31/2023 |
| Maturity |
| Objective |
| Segments |
With guarantee |
|
|
|
|
|
|
|
|
|
|
|
|
|
|
|
|
Loan 4131 |
| Prefixed |
| Euro |
| 3.20% |
| — |
| 860,658 |
| Oct-25 |
| Investments |
| Cosan Corporate |
|
| Prefixed |
| Yen |
| 0.25% |
| — |
| 602,487 |
| Oct-25 |
| Investments |
| Cosan Corporate |
|
| Prefixed |
| Euro |
| 3.40% |
| — |
| 1,954,022 |
| Oct-26 |
| Investments |
| Cosan Corporate |
|
| Prefixed |
| Yen |
| 0.25% |
| — |
| 1,135,226 |
| Oct-26 |
| Investments |
| Cosan Corporate |
|
| Prefixed |
| Euro |
| 3.56% |
| — |
| 812,496 |
| Oct-27 |
| Investments |
| Cosan Corporate |
|
| Prefixed |
| Yen |
| 0.25% |
| — |
| 470,951 |
| Oct-27 |
| Investments |
| Cosan Corporate |
BNDES |
| URTJLP |
| Real |
| 8.72% |
| 1,992,505 |
| 2,210,390 |
| Jul-31 |
| Investments |
| Rumo |
|
| Prefixed |
| Real |
| 6.00% |
| 64,101 |
| 128,494 |
| Dec-24 |
| Investments |
| Rumo |
|
| Prefixed |
| Real |
| 3.50% |
| — |
| 29 |
| Jan-24 |
| Investments |
| Rumo |
|
| IPCA + 5.74% |
| Real |
| 10.30% |
| 297,622 |
| 295,058 |
| Dec-36 |
| Investments |
| Compass |
|
| IPCA + 6.01% |
| Real |
| 10.58% |
| 306,402 |
| 304,276 |
| Dec-36 |
| Investments |
| Compass |
|
| IPCA + 3.25% |
| Real |
| 7.70% |
| 1,422,905 |
| 1,547,664 |
| Jun-34 |
| Investments |
| Compass |
|
| IPCA + 4.10% |
| Real |
| 8.59% |
| 100,270 |
| 112,946 |
| Apr-29 |
| Investments |
| Compass |
|
| IPCA + 5.74% |
| Real |
| 10.30% |
| 574,519 |
| 598,752 |
| Dec-36 |
| Investments |
| Compass |
|
| IPCA + 4.10% |
| Real |
| 16.48% |
| 143,822 |
| 140,016 |
| Apr-29 |
| Investments |
| Compass |
Export credit note |
| CDI + 2.25% |
| Real |
| 12.88% |
| 73,169 |
| 60,774 |
| Feb-26 |
| Capital management |
| Rumo |
|
| CDI + 2.25% |
| Real |
| 12.88% |
| 51,901 |
| 78,965 |
| May-26 |
| Capital management |
| Rumo |
|
| CDI + 2.20% |
| Real |
| 12.83% |
| 30,274 |
| 30,252 |
| Mar-26 |
| Capital management |
| Rumo |
|
| CDI + 2.07% |
| Real |
| 12.69% |
| 40,464 |
| 52,101 |
| Mar-25 |
| Capital management |
| Rumo |
|
| CDI + 1.29% |
| Real |
| 11.82% |
| 50,267 |
| — |
| May-29 |
| Capital management |
| Rumo |
|
| SOFR + 1.30% |
| Dollar |
| 6.63% |
| 424,914 |
| 487,544 |
| Jan-25 |
| Capital management |
| Rumo |
Bank credit note |
| IPCA |
| Real |
| 5.29% |
| 901,775 |
| 954,205 |
| Jan-48 |
| Investments |
| Rumo |
Debentures |
| CDI + 1.79% |
| Real |
| — |
| — |
| 753,435 |
| — |
| Investments |
| Rumo |
|
| CDI + 1.30% |
| Real |
| 11.84% |
| 758,702 |
| 759,390 |
| Oct-27 |
| Capital management |
| Rumo |
|
| IPCA + 4.52% |
| Real |
| 10.76% |
| 740,794 |
| 773,556 |
| Jun-31 |
| Investments |
| Rumo |
|
| IPCA + 5.80% |
| Real |
| 10.36% |
| 495,376 |
| — |
| Mar-34 |
| Investments |
| Rumo |
|
| IPCA + 5.93% |
| Real |
| 10.50% |
| 601,688 |
| — |
| Mar-39 |
| Investments |
| Rumo |
Export Credit Agency(“ECA”) |
| Euribor + 0.58% |
| Euro |
| 4.49% |
| 45,226 |
| 48,849 |
| Sep-26 |
| Investments |
| Rumo |
|
|
|
|
|
|
|
| 9,116,696 |
| 15,172,536 |
|
|
|
|
|
|
Notes to the interim Financial Statements
(In thousands of Reais, except when otherwise indicated)
|
| Interest |
| Consolidated |
|
|
|
|
|
| ||||||
Description |
| Index |
| Currency |
| Annual interest rate |
| 06/30/2024 |
| 12/31/2023 |
| Maturity |
| Objective |
| Segments |
No Warranty |
|
|
|
|
|
|
|
|
|
|
|
|
|
|
|
|
Loan 4131 |
| Prefixed |
| Dollar |
| 5.50% |
| 25,371 |
| 31,920 |
| Mar-25 |
| Investments |
| Moove |
|
| Prefixed |
| Dollar |
| 2.13% |
| 1,099,689 |
| 943,486 |
| Feb-25 |
| Capital management |
| Compass |
|
| Prefixed |
| Dollar |
| 4.04% |
| 830,290 |
| 734,191 |
| May-26 |
| Capital management |
| Compass |
|
| Prefixed |
| Dollar |
| 1.36% |
| — |
| 362,774 |
| Feb-24 |
| Capital management |
| Compass |
|
| Prefixed |
| Dollar |
| 4.88% |
| 472,820 |
| — |
| Mar-25 |
| Capital management |
| Compass |
Perpetual Notes |
| Prefixed |
| Dollar |
| 8.25% |
| 2,814,481 |
| 2,451,160 |
| Nov-40 |
| Acquisition |
| Cosan Corporate |
Senior Notes Due 2027 |
| Prefixed |
| Dollar |
| 7.00% |
| 2,251,019 |
| 2,016,330 |
| Jan-27 |
| Acquisition |
| Cosan Corporate |
Senior Notes Due 2028 |
| Prefixed |
| Dollar |
| 5.25% |
| 2,417,096 |
| 2,178,449 |
| Jan-28 |
| Investments |
| Rumo |
Senior Notes Due 2029 |
| Prefixed |
| Dollar |
| 5.50% |
| 4,162,115 |
| 3,622,922 |
| Sep-29 |
| Acquisition |
| Cosan Corporate |
Senior Notes Due 2030 |
| Prefixed |
| Dollar |
| 7.50% |
| 3,035,859 |
| 2,642,023 |
| Jun-30 |
| Capital management |
| Cosan Corporate |
Senior Notes Due 2031 |
| Prefixed |
| Dollar |
| 7.25% |
| 3,305,407 |
| — |
| Jun-31 |
| Capital management |
| Cosan Corporate |
Senior Notes Due 2032 |
| Prefixed |
| Dollar |
| 4.20% |
| 2,256,674 |
| 2,066,885 |
| Jan-32 |
| Investments |
| Rumo |
Debentures |
| IPCA + 4.68% |
| Real |
| 9.19% |
| 323,636 |
| 396,201 |
| Feb-26 |
| Investments |
| Rumo |
|
| IPCA + 4.50% |
| Real |
| 9.00% |
| 1,553,058 |
| 1,596,910 |
| Jun-31 |
| Investments |
| Rumo |
|
| IPCA + 3.60% |
| Real |
| 8.07% |
| 400,992 |
| 413,881 |
| Dec-30 |
| Investments |
| Rumo |
|
| IPCA + 6.80% |
| Real |
| 11.40% |
| 969,057 |
| 1,004,762 |
| Apr-30 |
| Investments |
| Rumo |
|
| IPCA + 3.90% |
| Real |
| 8.38% |
| 1,118,587 |
| 1,113,820 |
| Oct-29 |
| Investments |
| Rumo |
|
| IPCA + 5.73% |
| Real |
| 10.29% |
| 513,999 |
| 551,709 |
| Oct-33 |
| Investments |
| Rumo |
|
| IPCA + 4.00% |
| Real |
| 8.48% |
| 1,011,428 |
| 1,077,141 |
| Dec-35 |
| Investments |
| Rumo |
|
| IPCA + 4.54% |
| Real |
| 9.05% |
| 234,350 |
| 254,232 |
| Jun-36 |
| Investments |
| Rumo |
|
| IPCA + 5.99% |
| Real |
| 10.56% |
| 460,003 |
| 470,177 |
| Jun-32 |
| Investments |
| Rumo |
|
| IPCA + 5.76% |
| Real |
| 10.32% |
| 732,647 |
| 753,439 |
| Aug-29 |
| Investments |
| Rumo |
|
| IPCA + 6.42% |
| Real |
| 10.76% |
| 519,004 |
| — |
| Jun-34 |
| Investments |
| Rumo |
|
| IPCA + 6.53% |
| Real |
| 10.76% |
| 144,495 |
| — |
| Jun-39 |
| Investments |
| Rumo |
|
| IPCA + 6.18% |
| Real |
| 10.76% |
| 699,076 |
| 749,252 |
| May-33 |
| Investments |
| Rumo |
|
| IPCA + 4.33% |
| Real |
| 8.83% |
| 583,407 |
| 554,147 |
| Oct-24 |
| Investments |
| Compass |
|
| IGPM + 6.10% |
| Real |
| 8.69% |
| 363,464 |
| 359,639 |
| May-28 |
| Capital management |
| Compass |
|
| CDI + 2.65% |
| Real |
| 13.33% |
| 1,204,930 |
| 1,208,141 |
| Aug-25 |
| Investments |
| Cosan Corporate |
|
| CDI + 1.90% |
| Real |
| 12.50% |
| 1,116,348 |
| 1,117,966 |
| May-32 |
| Investments |
| Cosan Corporate |
|
| CDI + 1.50% |
| Real |
| 12.06% |
| 722,226 |
| — |
| Jun-34 |
| Investments |
| Cosan Corporate |
|
| CDI + 1.50% |
| Real |
| 12.06% |
| 405,929 |
| 406,471 |
| May-28 |
| Investments |
| Cosan Corporate |
|
| CDI + 1.95% |
| Real |
| 12.55% |
| 732,117 |
| 735,565 |
| Aug-24 |
| Investments |
| Compass |
Notes to the interim Financial Statements
(In thousands of Reais, except when otherwise indicated)
|
| Interest |
| Consolidated |
|
|
|
|
|
| ||||||
Description |
| Index |
| Currency |
| Annual interest rate |
| 06/30/2024 |
| 12/31/2023 |
| Maturity |
| Objective |
| Segments |
|
| CDI + 1.45% |
| Real |
| 12.00% |
| 399,773 |
| 399,457 |
| Dec-26 |
| Investments |
| Compass |
|
| CDI + 1.55% |
| Real |
| 12.11% |
| 1,761,329 |
| 1,764,022 |
| Nov-30 |
| Investments |
| Compass |
|
| CDI + 1.55% |
| Real |
| 12.30% |
| 72,928 |
| — |
| Jan-27 |
| Investments |
| Compass |
|
| CDI + 1.08% |
| Real |
| 11.59% |
| 1,542,467 |
| — |
| Mar-29 |
| Investments |
| Compass |
|
| IPCA + 5.12% |
| Real |
| 9.65% |
| 531,258 |
| 550,342 |
| Aug-31 |
| Investments |
| Compass |
|
| 100.00% CDI |
| Real |
| 11.28% |
| 1,546,091 |
| — |
| Mar-29 |
| Capital management |
| Compass |
|
| IPCA + 7.36% |
| Real |
| 11.99% |
| 85,176 |
| 80,960 |
| Dec-25 |
| Investments |
| Compass |
|
| IPCA + 5.22% |
| Real |
| 9.75% |
| 497,889 |
| 533,854 |
| Aug-36 |
| Investments |
| Compass |
|
| CDI + 1.65% |
| Real |
| 12.22% |
| 780,066 |
| 784,475 |
| Aug-28 |
| Capital management |
| Cosan Corporate |
|
| CDI + 2.40% |
| Real |
| 13.05% |
| 1,018,426 |
| 1,020,673 |
| Apr-28 |
| Capital management |
| Cosan Corporate |
|
| CDI + 2.40% |
| Real |
| 13.05% |
| 998,790 |
| 998,542 |
| Jun-28 |
| Capital management |
| Cosan Corporate |
|
| CDI + 2.00% |
| Real |
| 12.61% |
| 936,578 |
| 942,011 |
| Aug-31 |
| Capital management |
| Cosan Corporate |
|
| CDI + 1.80% |
| Real |
| 12.39% |
| 1,339,035 |
| 1,260,684 |
| Jan-31 |
| Capital management |
| Cosan Corporate |
|
| CDI + 1.00% |
| Real |
| 11.50% |
| 722,226 |
| — |
| Jun-29 |
| Capital management |
| Cosan Corporate |
|
| IPCA + 5.75% |
| Real |
| 10.31% |
| 424,166 |
| 412,478 |
| Aug-31 |
| Capital management |
| Cosan Corporate |
Working capital |
| SOFR + 1.50% |
| Dollar |
| 1.50% |
| 2,139,129 |
| 2,175,107 |
| May-27 |
| Acquisition |
| Moove |
Working capital |
| SONIA + 1.65% |
| Euro |
| 1.65% |
| 17,620 |
| — |
| Aug-24 |
| Acquisition |
| Moove |
Working capital |
| SONIA + 1.30% |
| Euro |
| 1.30% |
| 246,642 |
| — |
| Jun-26 |
| Acquisition |
| Moove |
Export Credit Note |
| SOFR+ 1.30% |
| Dollar |
| 6.63% |
| 276,895 |
| — |
| Jun-27 |
| Acquisition |
| Moove |
Export Prepayment |
| SOFR-06 + 1.30% |
| Dollar |
| 6.61% |
| 555,346 |
| — |
| Jun-27 |
| Acquisition |
| Moove |
Commercial bank notes |
| CDI + 1.75% |
| Real |
| 12.33% |
| 547,732 |
| 547,755 |
| Dec-28 |
| Capital management |
| Cosan Corporate |
|
| CDI + 1.80% |
| Real |
| 12.39% |
| 476,025 |
| 448,165 |
| Jan-31 |
| Capital management |
| Cosan Corporate |
|
|
|
|
|
|
|
| 53,395,161 |
| 41,732,118 |
|
|
|
|
|
|
|
|
|
|
|
|
|
|
|
|
|
|
|
|
|
|
|
Total |
|
|
|
|
|
|
| 62,511,857 |
| 56,904,654 |
|
|
|
|
|
|
|
|
|
|
|
|
|
|
|
|
|
|
|
|
|
|
|
Current |
|
|
|
|
|
|
| 6,580,589 |
| 4,882,398 |
|
|
|
|
|
|
Non-current |
|
|
|
|
|
|
| 55,931,268 |
| 52,022,256 |
|
|
|
|
|
|
Notes to the interim Financial Statements
(In thousands of Reais, except when otherwise indicated)
For debts linked to derivatives, the effective rates are shown in the explanatory note 5.6.
To calculate the average rates, on an annual basis, the average annual CDI rate of 10.40% p.a. was considered. (11.65% p.a. on December 31, 2023) and TJLP of 6.67% p.a. (6.55% p.a. on December 31, 2023).
All debts with maturity dates denominate in foreign currency are hedged against foreign exchange risk through derivatives (note 5.6), except for perpetual notes.
Loans, financing and debentures that are classified as non-current have the following maturities:
|
| Parent Company |
| Consolidated | ||||
|
| 06/30/2024 |
| 12/31/2023 |
| 06/30/2024 |
| 12/31/2023 |
1 to 2 years |
| 569,631 |
| 569,067 |
| 3,871,167 |
| 4,800,498 |
2 to 3 years |
| — |
| — |
| 4,889,054 |
| 6,255,752 |
3 to 4 years |
| 3,118,864 |
| 360,698 |
| 8,230,101 |
| 6,626,698 |
4 to 5 years |
| 1,281,326 |
| 3,319,442 |
| 6,886,501 |
| 7,554,468 |
5 to 6 years |
| 6,642,991 |
| 3,327,245 |
| 12,515,319 |
| 8,143,128 |
6 to 7 years |
| 4,987,347 |
| 3,101,714 |
| 6,808,317 |
| 6,777,099 |
7 to 8 years |
| 1,046,423 |
| 1,650,648 |
| 3,769,101 |
| 2,599,593 |
Over 8 years |
| 482,779 |
| 366,523 |
| 8,961,708 |
| 9,265,020 |
|
| 18,129,361 |
| 12,695,337 |
| 55,931,268 |
| 52,022,256 |
b) Movement
|
| Parent Company |
| Consolidated |
Balance as of January 1, 2024 |
| 13,496,324 |
| 56,904,654 |
Funding |
| 4,421,447 |
| 10,799,808 |
Amortization of principal |
| — |
| (7,772,439) |
Interest payment |
| (680,726) |
| (2,252,731) |
Payment of interest on work in progress |
| — |
| (79,894) |
Interest, foreign exchange variation and fair value |
| 1,842,231 |
| 4,912,459 |
Balance as of June 30, 2024 |
| 19,079,276 |
| 62,511,857 |
| 41 |
Notes to the interim Financial Statements
(In thousands of Reais, except when otherwise indicated)
c) Guarantees
The subsidiary Rumo has entered into financing contracts with development banks, intended for investments with a bank guarantee, according to each contract, with an average cost of 0.69% p.a. or by real guarantees (assets) and escrow account. As of June 30, 2024, the balance of bank guarantees contracted was R$2,859,396 (R$3,120,034 as of December 31, 2023).
The subsidiary MLH has a bank guarantee for a loan from Cosan Lubrificantes S.R.L. (“Moove Argentina”), with an average annual cost of 0.18%, and guarantee with top-tier banks for payment to third parties, with an average annual cost of 3.90%. On June 30, 2024, the balance of contracted guarantees was R$20,396 (R$ 31,931 on December 31, 2023).
d) Available credit line
As of June 30, 2024, the Company had credit lines with banks rated AA, which were not used, in the amount of R$2,133,336 (R$2,102,756 as of December 31, 2023). The use of these lines of credit is subject to certain contractual conditions.
e) Offset of assets and liabilities
SENIOR NOTES INTERNALIZATION 2031
On February 16, 2024, the Company interned the remaining funds from the 2031 senior notes, through the issuance of Loan 4131 by Cosan S.A., referenced in U.S. dollars in the amount of equivalent to US$600,000 thousand, equivalent to R$2,982,600, with an annual coupon of 6.6% p.a. for the first four semesters and interest payments of 7.25% p.a. for the others. On the other hand, Cosan Luxembourg contracted a Time Deposit ("TD") with the same amount and counterparty in US dollars, with a frequency of semi-annual payments and an annual remuneration of 7.25% p.a., which has as its underlying asset the issuance of Loan 4131.
|
| Compensation Loan 4131 and Time deposit | ||||
|
| Gross value |
| Compensated amount |
| Net value |
Time deposit (Notional) |
| 3,335,340 |
| (3,335,340) |
| — |
Time deposit (Interest) |
| 2,446 |
| (2,446) |
| — |
|
| 3,337,786 |
| (3,337,786) |
| — |
Loan 4131 (principal and exchange rate variation) (i) |
| (3,335,340) |
| 3,335,340 |
| — |
Loan 4131 (interest) |
| (2,446) |
| 2,446 |
| — |
|
| (3,337,786) |
| 3,337,786 |
| — |
| (i) | The amounts are equivalent to US$600,000 thousand, with the PTAX conversion rate of June 28,2024 being R$5.5589 |
Notes to the interim Financial Statements
(In thousands of Reais, except when otherwise indicated)
|
| Compensation Debenture and TRS | ||||
|
| Gross value |
| Compensated amount |
| Net value |
TRS (Notional) |
| 4,991,892 |
| (4,991,892) |
| — |
TRS (Interest) |
| 71,620 |
| (71,620) |
| — |
|
| 5,063,512 |
| (5,063,512) |
| — |
Debentures principal and exchange rate variation) (i) |
| (4,991,892) |
| 4,991,892 |
| — |
Debentures (interest) |
| (71,620) |
| 71,620 |
| — |
|
| (5,063,512) |
| 5,063,512 |
| — |
| (i) | The amounts are equivalent to US$898,000 thousand, with the PTAX conversion rate of June 28,2024 being R$5.5589. |
Since the Company has the legally enforceable right to offset the amounts and intends to settle them simultaneously, for consolidation purposes, the Company offset the assets related to the TRS contract with the debt liabilities arising from the debentures and the Time Deposit with the Loans 4131, presenting them at net value, as well as their respective impacts on the income statement. Thus, no sensitivity analysis is carried out as both transactions do not pose a risk to the Company.
f) Fair value and exposure to financial risk
The fair value of loans is determined by discounting future cash flows at their implied discount rate. Due to the use of unobservable inputs, including own credit risk, they are classified as fair value at level 2 of the hierarchy (Note 5.11).
Details of the Company's exposure to risks arising from loans are shown in Note 5.12.
| Parent Company |
| Consolidated |
At January 1, 2024 | 29,543 |
| 5,275,794 |
Additions | — |
| 750,637 |
Write-offs | — |
| (4,268) |
Settlement interest and foreign exchange variation | 1,599 |
| 550,664 |
Repayment of principal | (3,169) |
| (248,175) |
Payment of interest | (1,604) |
| (177,171) |
Contractual adjustment | 11 |
| 33,523 |
At June 30, 2024 | 26,380 |
| 6,181,004 |
Current | 8,939 |
| 941,763 |
Non-current | 17,441 |
| 5,239,241 |
| 26,380 |
| 6,181,004 |
Notes to the interim Financial Statements
(In thousands of Reais, except when otherwise indicated)
The lease agreements have different terms, with the last due date occurring in December 2058. The amounts are updated annually by inflation indexes (such as IGPM and IPCA) or may incur interest calculated based on the TJLP or CDI and some of the contracts have renewal or purchase options that were considered in determining the term and classification as finance lease.
In addition to the amortization and appropriation of interest and exchange variation highlighted in the previous tables, the following impacts on income were recorded for the other lease contracts that were not included in the measurement of lease liabilities.
| 2Q24 |
| 2Q23 |
| 6M24 |
| 6M23 |
Variable lease payments not included in the recognition of lease obligations | 13,252 |
| 10,646 |
| 25,248 |
| 21,709 |
Expenses related to short-term leases | 5,264 |
| 3,448 |
| 12,957 |
| 5,593 |
Low asset leasing costs, excluding short-term leases | 2,624 |
| 297 |
| 5,177 |
| 651 |
| 21,140 |
| 14,391 |
| 43,382 |
| 27,953 |
The lease balances recorded by the Company include the contract for the indirect subsidiary Rumo Malha Central and the amendment to renew the contract for the indirect subsidiary Rumo Malha Paulista, which have an identified implicit rate and are, therefore, readily determinable in such cases. In other words, in these cases the valuation does not generate the distortions in the liabilities and right of use object of CVM Circular Letter 2/2019. This particularity of the Company means that the effects on the balances (of lease liabilities, right of use, financial expenses and depreciation expenses) if the measurement were made by the present value of the expected installments plus projected future inflation, would not are relevant to influence users' decisions and, consequently, to be presented in the financial statements.
The Company recorded lease liabilities at the present value of the installments due, that is, including any tax credits to which it will be entitled at the time of payment of the leases. The potential PIS/COFINS credit included in liabilities on June 30, 2024 is R$28,596 (R$32,244 at December 31, 2023).
Notes to the interim Financial Statements
(In thousands of Reais, except when otherwise indicated)
The Company uses swap instruments, whose fair value is determined from discounted cash flows discounted cash flows based on market curves, to hedge the exposure to foreign exchange risk and exposure to foreign exchange risk and interest and inflation risk. The consolidated data are presented below:
| Parent Company |
| Consolidated | ||||||||||||
| Notional |
| Fair value |
| Notional |
| Fair value | ||||||||
| 06/30/2024 |
| 12/31/2023 |
| 06/30/2024 |
| 12/31/2023 |
| 06/30/2024 |
| 12/31/2023 |
| 06/30/2024 |
| 12/31/2023 |
Exchange rate derivatives |
|
|
|
|
|
|
|
|
|
|
|
|
|
|
|
Forward agreements | — |
| — |
| — |
| — |
| 93,306 |
| 6,716 |
| 2,878 |
| (147) |
FX option agreements | — |
| — |
| — |
| — |
| 416,918 |
| 363,098 |
| 9,805 |
| 30,677 |
| — |
| — |
| — |
| — |
| 510,224 |
| 369,814 |
| 12,683 |
| 30,530 |
Commodity derivatives |
|
|
|
|
|
|
|
|
|
|
|
|
|
|
|
Gas options contracts | — |
| — |
| — |
| — |
| 25,424 |
| 28,494 |
| 1,322 |
| 4,333 |
| — |
| — |
| — |
| — |
| 25,424 |
| 28,494 |
| 1,322 |
| 4,333 |
Interest rate and exchange rate risk |
|
|
|
|
|
|
|
|
|
|
|
|
|
|
|
Swap agreements (interest rate) | 252,710 |
| 7,038,443 |
| (4,999) |
| (9,945) |
| 252,710 |
| 7,209,400 |
| (4,999) |
| (10,686) |
Swap agreements (interest and FX) | 15,372,413 |
| 10,434,580 |
| 662,118 |
| (562,802) |
| 23,896,313 |
| 18,260,969 |
| 551,206 |
| (1,546,736) |
Forward agreements (interest and FX) | 278,275 |
| 126,472 |
| 31,662 |
| (3,720) |
| 278,275 |
| 8,985,594 |
| 31,662 |
| (939,559) |
Swap agreements (interest and inflation) | 350,000 |
| — |
| 9,973 |
| — |
| 16,021,896 |
| 14,307,844 |
| 237,080 |
| 853,639 |
| 16,253,398 |
| 17,599,495 |
| 698,754 |
| (576,467) |
| 40,449,194 |
| 48,763,807 |
| 814,949 |
| (1,643,342) |
Share price risk |
|
|
|
|
|
|
|
|
|
|
|
|
|
|
|
Swap agreements - (TRS) | 2,076,288 |
| 1,775,341 |
| (639,752) |
| 88,298 |
| 2,076,288 |
| 1,775,341 |
| (639,752) |
| 88,297 |
Call Spread | — |
| — |
| — |
| — |
| 9,510,160 |
| 5,594,212 |
| 238,986 |
| 366,296 |
Collar (Vale Shares) | — |
| — |
| — |
| — |
| — |
| 13,114,720 |
| — |
| 285,540 |
| 2,076,288 |
| 1,775,341 |
| (639,752) |
| 88,298 |
| 11,586,448 |
| 20,484,273 |
| (400,766) |
| 740,133 |
Total financial instruments |
| 59,002 |
| (488,169) |
|
|
|
|
| 428,188 |
| (868,346) | |||
Current assets |
|
|
|
| 2,437 |
| 54,935 |
|
|
|
|
| 653,526 |
| 202,399 |
Non-current assets |
|
|
|
| 776,014 |
| 102,881 |
|
|
|
|
| 2,004,133 |
| 2,344,400 |
Current liabilities |
|
|
|
| (639,752) |
| (364,747) |
|
|
|
|
| (1,500,851) |
| (1,250,520) |
Non-current liabilities |
|
|
|
| (79,697) |
| (281,238) |
|
|
|
|
| (728,620) |
| (2,164,625) |
Total |
|
|
|
| 59,002 |
| (488,169) |
|
|
|
|
| 428,188 |
| (868,346) |
Below, we demonstrate the opening value of derivative debt and non-debt derivative financial instruments:
| Parent company |
| Consolidated | ||||
| 06/30/2024 |
| 12/31/2023 |
| 06/30/2024 |
| 12/31/2023 |
Derivative financial instruments | 698,754 |
| (576,467) |
| 814,949 |
| (990,764) |
Non-derivative financial instruments | (639,752) |
| 88,298 |
| (386,761) |
| 122,418 |
| 59,002 |
| (488,169) |
| 428,188 |
| (868,346) |
Derivatives are only used for economic hedging purposes and not as speculative investments.
Notes to the interim Financial Statements
(In thousands of Reais, except when otherwise indicated)
a) Fair value hedge
The Company adopts fair value hedge accounting for some of its operations, both the hedging instruments and the hedged items are measured and recognized at fair value through profit or loss.
There is an economic relationship between the hedged item and the hedging instrument as the terms of the interest rate and exchange rate swap correspond to the terms of the fixed rate loan, i.e. notional amount, term and payment. The Company established a 1:1 coverage ratio for the hedging relationships, as the underlying risk of the interest rate and exchange rate swap is identical to the hedged risk component. To test the effectiveness of the hedge, the Company uses the discounted cash flow method and compares changes in the fair value of the hedging instrument with changes in the fair value of the hedged item attributable to the hedged risk. The sources of hedge ineffectiveness that are expected to affect the hedging relationship during its term evaluated by the Company are mainly: (i) reduction or modification of the hedged item; and (ii) a change in the credit risk of the Company or the counterparty of the contracted swaps. The amounts related to the items designated as hedging instruments were as follows:
|
|
| Registered value |
| Accumulated fair value adjustment | ||||
| Notional |
| 06/30/2024 |
| 12/31/2023 |
| 6M24 |
| 6M23 |
FX rate risk hedge |
|
|
|
|
|
|
|
|
|
Designated items |
|
|
|
|
|
|
|
|
|
Pré pagamento de exportação – (“PPE”) 1 (Moove) | — |
| — |
| — |
| — |
| 1,448 |
Pré pagamento de exportação – (“PPE”) 2 (Moove) | — |
| — |
|
|
| — |
| 2,175 |
PPE - (Moove) | (536,300) |
| (557,522) |
| — |
| 2,177 |
| — |
NCE - (Moove) | (269,870) |
| (278,732) |
| — |
| 1,868 |
| — |
Senior notes 2028 (Rumo Luxembourg) | (2,791,600) |
| (2,417,096) |
| (2,178,449) |
| (130,646) |
| 85,727 |
Senior notes 2032 (Rumo Luxembourg) | (2,259,375) |
| (2,256,674) |
| (2,066,885) |
| (175,701) |
| 59,997 |
NCE USD (Rumo Malha Norte) | (362,550) |
| (424,914) |
| (487,544) |
| (1,541) |
| — |
Total debt | (6,219,695) |
| (5,934,938) |
| (4,732,878) |
| (303,843) |
| 149,347 |
Derivative financial instruments |
|
|
|
|
|
|
|
|
|
Swap - PPE 1 (Moove) | — |
| — |
| — |
| — |
| (18,155) |
Swap - PPE 2 (Moove) | — |
| — |
| — |
| — |
| (18,511) |
PPE - (Moove) | 536,300 |
| 13,260 |
| — |
| 13,260 |
| — |
NCE - (Moove) | 269,870 |
| 5,996 |
| — |
| 5,996 |
| — |
Swaps Senior Notes 2028 (Rumo Luxembourg) | 2,791,600 |
| (228,022) |
| (460,939) |
| (232,918) |
| 122,596 |
Swaps Senior Notes 2032 (Rumo Luxembourg) | 2,259,375 |
| (27,305) |
| (239,630) |
| (212,325) |
| 182,956 |
Swap exchange rate and interest (Rumo Malha Norte) | 362,550 |
| 53,340 |
| 5,293 |
| (48,047) |
| — |
Total derivatives | 6,219,695 |
| (182,731) |
| (695,276) |
| (474,034) |
| 268,886 |
Total | — |
| (6,117,669) |
| (5,428,154) |
| (777,877) |
| 418,233 |
Notes to the interim Financial Statements
(In thousands of Reais, except when otherwise indicated)
|
|
| Registered value |
| Accumulated fair value adjustment | ||||
| Notional |
| 06/30/2024 |
| 12/31/2023 |
| 6M24 |
| 6M23 |
Interest rate risk hedge |
|
|
|
|
|
|
|
|
|
Designated items |
|
|
|
|
|
|
|
|
|
Debenture 5th issue - single series (Comgás) | — |
| — |
| — |
| — |
| (50,778) |
BNDES Project VIII (Comgás) | (833,332) |
| (735,555) |
| (803,990) |
| 83,814 |
| 37,220 |
Debenture (Rumo) | (9,389,276) |
| (9,420,685) |
| (7,973,671) |
| (674,383) |
| 390,735 |
Finem (Rumo) | (24,226) |
| (24,226) |
| (36,301) |
| (868) |
| 757 |
CCB (Rumo) | (959,159) |
| (901,775) |
| (954,205) |
| (37,546) |
| (837) |
Total debt | (11,205,993) |
| (11,082,241) |
| (9,768,167) |
| (628,983) |
| 377,097 |
|
|
|
|
|
|
|
|
|
|
Derivative financial instruments |
|
|
|
|
|
|
|
|
|
Debenture 5th issue - single series (Comgás) | — |
| — |
| — |
| — |
| 7,076 |
BNDES Project VIII (Comgás) | 833,332 |
| (84,080) |
| (56,085) |
| (27,996) |
| 15,163 |
Swaps Debenture (Rumo) | 9,389,276 |
| 115,258 |
| 559,964 |
| 444,708 |
| (574,456) |
Finem (Rumo) | 24,226 |
| 1,314 |
| 1,600 |
| 286 |
| (1,755) |
CCB (Rumo) | 959,159 |
| (51,536) |
| (15,221) |
| 36,315 |
| (1,838) |
Derivative total | 11,205,993 |
| (19,044) |
| 490,258 |
| 453,313 |
| (555,810) |
Total | — |
| (11,101,285) |
| (9,277,909) |
| (175,670) |
| (178,713) |
Notes to the interim Financial Statements
(In thousands of Reais, except when otherwise indicated)
b) Fair value option
Certain derivative instruments were not designated to documented hedging structures.
The Company chose to designate the hedged liabilities (hedge objects) to be recorded at fair value through profit or loss. Considering that derivative instruments are always accounted for at fair value through profit or loss, the accounting effects are the same as those that would be obtained through hedging documentation:
|
|
|
|
| Registered Value |
| Accumulated fair value | ||||
|
|
| Notional |
| 06/30/2024 |
| 12/31/2023 |
| 6M24 |
| 6M23 |
FX rate risk |
|
|
|
|
|
|
|
|
|
|
|
Items |
|
|
|
|
|
|
|
|
|
|
|
Senior Notes 2027 (Cosan Luxembourg) | USD+7.0% |
| (2,179,089) |
| (2,251,019) |
| (2,016,330) |
| (1,391,943) |
| 458,666 |
Export Credit Agreement (Rumo) | EUR + 0.58% |
| (31,711) |
| (45,226) |
| (48,849) |
| (113) |
| (1,373) |
Loan 4,131 (Comgás - 2021) | USD + 1.60% |
| — |
| — |
| (362,774) |
| — |
| 14,550 |
Loan 4,131 (Comgás - 2022) | USD + 2.51% |
| (1,097,400) |
| (1,099,689) |
| (943,486) |
| 21,711 |
| 59,959 |
Loan 4,131 (Comgás - 2022) | USD + 4.76% |
| (749,310) |
| (830,290) |
| (734,191) |
| 6,353 |
| 7,027 |
Loan 4,131 (Edge - 2024) | EUR + 5.74% |
| (466,497) |
| (472,820) |
| — |
| (6,322) |
| — |
Total |
|
| (4,524,007) |
| (4,699,044) |
| (4,105,630) |
| (1,370,314) |
| 538,829 |
|
|
|
|
|
|
|
|
|
|
|
|
Derivative instruments |
|
|
|
|
|
|
|
|
|
|
|
Swap Senior Notes 2027 (Cosan Luxembourg) | 114.48% CDI |
| 2,179,089 |
| 156,772 |
| (46,214) |
| 1,394,607 |
| (325,470) |
Inflation and interest rate swaps (Rumo) | 108% CDI |
| 31,711 |
| 12,412 |
| 9,316 |
| (3,096) |
| 5,893 |
Loan 4,131 (Comgás - 2021) | CDI + 1.25% |
| — |
| — |
| (63,184) |
| 63,184 |
| (55,042) |
Loan 4,131 (Comgás - 2022) | CDI + 1.25% |
| 1,097,400 |
| (47,860) |
| (212,180) |
| 164,319 |
| (153,848) |
Loan 4,131 (Comgás - 2023) | CDI + 1.25% |
| 749,310 |
| 74,298 |
| (22,611) |
| 96,909 |
| (40,213) |
Loan 4,131 (Comgás - 2018) | 107,9% + CDI |
| — |
| — |
| — |
| — |
| (28,049) |
Loan 4,131 (Edge - 2024) | CDI + 1.35% |
| 466,497 |
| 32,969 |
| — |
| 50,638 |
| — |
Total derivatives |
|
| 4,524,007 |
| 228,591 |
| (334,873) |
| 1,766,561 |
| (596,729) |
Total |
|
| — |
| (4,470,453) |
| (4,440,503) |
| 396,247 |
| (57,900) |
Notes to the interim Financial Statements
(In thousands of Reais, except when otherwise indicated)
|
|
|
|
| Registered Value |
| Accumulated fair value adjustment | ||||
|
|
| Notional |
| 06/30/2024 |
| 12/31/2023 |
| 6M24 |
| 6M23 |
FX rate risk |
|
|
|
|
|
|
|
|
|
|
|
Items |
|
|
|
|
|
|
|
|
|
|
|
Debenture 4th issue - 3rd series (Comgás) | IPCA + 7.36% |
| (76,545) |
| (85,176) |
| (80,960) |
| 410 |
| (8,266) |
Debenture 6th issue - single series (Comgás) | IPCA + 4.33% |
| (523,993) |
| (583,407) |
| (554,147) |
| 2,592 |
| (25,304) |
Debenture 9th issue – 1st series (Comgás) | IPCA + 5.12% |
| (500,000) |
| (531,258) |
| (550,342) |
| 56,365 |
| (33,362) |
Debenture 9th issue - 2nd series (Comgás) | IPCA + 5.22% |
| (500,000) |
| (497,889) |
| (533,854) |
| 87,953 |
| (41,129) |
BNDES Projects VI and VII (Comgás) | IPCA + 4.10% |
| (113,260) |
| (100,270) |
| (112,946) |
| 2,055 |
| 24,480 |
BNDES Project VIII (Comgás) | IPCA + 3.25% |
| (725,130) |
| (687,350) |
| (743,674) |
| 27,133 |
| 38,360 |
BNDES Project IX (Comgás) | IPCA + 5.74% |
| (565,582) |
| (574,519) |
| (598,752) |
| 21,231 |
| (32,911) |
BNDES Project IX (Comgás) | IPCA + 6.01% |
| (315,186) |
| (306,402) |
| — |
| 6,542 |
| — |
BNDES Project IX (Comgás) | IPCA + 5.74% |
| (306,207) |
| (297,622) |
| — |
| 6,008 |
| — |
Debenture (Rumo) | IPCA + 4.68% |
| (240,000) |
| (323,636) |
| (396,201) |
| (1,167) |
| 5,467 |
Debenture (Rumo) | IPCA + 4.50% |
| (600,000) |
| (764,940) |
| (774,939) |
| (32,333) |
| 32,495 |
Total |
|
| (4,465,903) |
| (4,752,469) |
| (4,345,815) |
| 176,789 |
| (40,170) |
Derivative instruments |
|
|
|
|
|
|
|
|
|
|
|
Debenture 4th issue - 3rd series (Comgás) | 112.49% CDI |
| 76,545 |
| 4,125 |
| 4,567 |
| (442) |
| 408 |
Debenture 6th issue - single series (Comgás) | 89.9% CDI |
| 523,993 |
| 23,713 |
| 20,116 |
| 3,597 |
| (4,253) |
Debenture 9th issue - 1st series (Comgás) | 109.20% CDI |
| 500,000 |
| 25,406 |
| 42,093 |
| (16,687) |
| 29,155 |
Debenture 9th issue - 2nd series (Comgás) | 110.60% CDI |
| 500,000 |
| (6,255) |
| 26,901 |
| (33,156) |
| 37,992 |
BNDES Projects VI and VII (Comgás) | 87.50% CDI |
| 113,260 |
| (2,009) |
| 64 |
| (2,073) |
| 1,248 |
BNDES Project VIII (Comgás) | 82.94% CDI |
| 725,130 |
| (26,939) |
| (6,578) |
| (20,361) |
| 12,752 |
BNDES Project IX (Comgás) | 98.90% CDI |
| 565,582 |
| 22,277 |
| 46,904 |
| (24,627) |
| 29,755 |
BNDES Project IX (Comgás) | 95.55% CDI |
| 315,186 |
| (4,766) |
| — |
| (4,766) |
| — |
BNDES Project IX (Comgás) | 98.49% CDI |
| 306,207 |
| (4,207) |
| — |
| (4,207) |
| — |
Debenture (Rumo) | 107% CDI |
| 240,000 |
| 73,711 |
| 81,885 |
| 8,174 |
| (7,851) |
Debenture (Rumo) | 103% CDI |
| 600,000 |
| 141,095 |
| 147,429 |
| 6,334 |
| (59,007) |
Total derivatives |
|
| 4,465,903 |
| 246,151 |
| 363,381 |
| (88,214) |
| 40,199 |
Total |
|
| — |
| (4,506,318) |
| (3,982,434) |
| 88,575 |
| 29 |
c) Cash flow hedge
Compass
Natural gas purchase and sale contracts
The indirect subsidiary Edge Comercialização S.A. entered into natural gas sale agreements (BRENT risck) with a third party and related party. In order to protect and mitigate the risks arising from fluctuations in natural gas indexes, the subsidiary designated this operation subject to hedge accounting for the respective cash flow protection.
In this contracting, the expected benefits are: reducing the financial risk associated with fluctuations in natural gas prices, avoiding fluctuations in the financial result of hedge instruments, protecting the subsidiary's margins, as well as maintaining predictability in its costs or revenues, ensuring greater stability in operating results.
Notes to the interim Financial Statements
(In thousands of Reais, except when otherwise indicated)
Highly probable revenues in US dollars (Leasing)
The indirect subsidiary TRSP adopted a hedge accounting strategy to protect its results from exposure to variability in cash flows arising from the exchange rate effects of highly probable revenues in US dollars projected for a period of 20 years, through non-derivative hedging instruments – lease liabilities in US dollars already contracted.
On June 30, 2024, an ineffective portion related to Brent was reclassified to the financial result in the amount of R$2,421. The impacts recognized in the TRSP's equity and the estimated realization are as below:
a) Composition
Financial instruments |
| Subsidiary |
| Risk |
| Unit |
| Notional R$ |
| Fair value 06/30/2024 |
| Book value 06/30/2024 |
Future |
| Compass |
| BRENT |
| Barrel |
| 25,424 |
| (15,458) |
| (15,458) |
Leasing |
| Compass |
| FX rate |
| BRL |
| 1,766,508 |
| (246,777) |
| (246,777) |
Effect on balance sheet |
|
|
|
|
|
|
| 1,791,932 |
| (262,235) |
| (262,235) |
b) Movement
Financial instruments | Net operating r evenue |
| Net financial result |
| Comprehensive income (i) |
| Gains or (losses) realized | |
Future (BRENT) | 5,150 |
| (2,421) |
| (15,458) |
| 7,571 | |
Leasing | — |
| — |
| (246,777) |
| — | |
June 30, 2024 | 5,150 |
| (2,421) |
| (262,235) |
| 7,571 |
(i) Effect of deferred income tax and social contribution is R$89,160.
| Consolidated | ||
| 06/30/2024 |
| 12/31/2023 |
Domestic market | 3,375,516 |
| 2,790,623 |
Unbilled receivables (i) | 968,900 |
| 782,813 |
Foreign market - foreign currency | 57,152 |
| 32,308 |
| 4,401,568 |
| 3,605,744 |
Expected credit losses | (179,642) |
| (161,108) |
| 4,221,926 |
| 3,444,636 |
Current | 4,159,171 |
| 3,330,488 |
Non-current | 62,755 |
| 114,148 |
Total | 4,221,926 |
| 3,444,636 |
(i) Unbilled revenue refers to the portion of the monthly gas supply for which measurement and billing have not been completed.
Notes to the interim Financial Statements
(In thousands of Reais, except when otherwise indicated)
a) Accounts receivable and payable with related parties:
| Parent Company |
| Consolidated | |||||||||||||
|
| 06/30/2024 |
| 12/31/2023 |
| 06/30/2024 |
| 12/31/2023 | ||||||||
Current assets |
|
|
|
|
|
|
|
| ||||||||
Commercial operations |
|
|
|
|
|
|
|
| ||||||||
Raízen S.A. |
| 5,267 |
| 7,798 |
| 70,249 |
| 63,004 | ||||||||
Rumo S.A. |
| 1,922 |
| 6,214 |
| — |
| — | ||||||||
CLI Sul S.A. |
| 10 |
| 10 |
| 20,314 |
| 21,633 | ||||||||
Cosan Lubrificantes e Especialidades S.A. |
| 1,758 |
| 5,722 |
| — |
| — | ||||||||
Aguassanta Participações S.A. |
| — |
| 88 |
| — |
| 88 | ||||||||
Compass Gás e Energia S.A. |
| 1,114 |
| 4,253 |
| — |
| — | ||||||||
Termag - Terminal Marítimo de Guarujá S.A. |
| — |
| — |
| 14,286 |
| 9,286 | ||||||||
Associação Gestora da Ferrovia Interna do Porto de Santos (AG-FIPS) |
| — |
| — |
| 25,959 |
| — | ||||||||
Vale S.A |
| — |
| — |
| 196 |
| 5,000 | ||||||||
Radar Gestão de Investimentos S.A. |
| 715 |
| — |
| 715 |
| — | ||||||||
Norgás S.A. |
| — |
| — |
| 20,687 |
| 8,976 | ||||||||
Other |
| 899 |
| 121 |
| 667 |
| 452 | ||||||||
|
| 11,685 |
| 24,206 |
| 153,073 |
| 108,439 | ||||||||
Financial and corporate operations |
|
|
|
|
|
|
|
| ||||||||
Raízen S.A. |
| 38,559 |
| 36,020 |
| 38,559 |
| 36,032 | ||||||||
Cosan Dez Participações S.A. |
| — |
| 111,659 |
| — |
| — | ||||||||
Ligga S.A. |
| — |
| — |
| 107,000 |
| 107,000 | ||||||||
Cosan Lubrificantes e Especialidades S.A. |
| 2 |
| — |
| — |
| — | ||||||||
Other |
| 2,557 |
| 1,466 |
| — |
| — | ||||||||
|
| 41,118 |
| 149,145 |
| 145,559 |
| 143,032 | ||||||||
Total current assets |
| 52,803 |
| 173,351 |
| 298,632 |
| 251,471 | ||||||||
|
|
|
|
|
|
|
|
| ||||||||
Non-current assets |
|
|
|
|
|
|
|
| ||||||||
Commercial operations |
|
|
|
|
|
|
|
| ||||||||
Termag - Terminal Marítimo de Guarujá S.A. |
| — |
| — |
| 28,580 |
| 36,952 | ||||||||
|
| — |
| — |
| 28,580 |
| 36,952 | ||||||||
Financial and corporate operations |
|
|
|
|
|
|
|
| ||||||||
Raízen S.A. |
| 33,666 |
| 46,911 |
| 33,691 |
| 46,935 | ||||||||
Cosan Lubrificantes e Especialidades S.A. |
| 117,559 |
| 127,834 |
| — |
| — | ||||||||
Rumo Malha Paulista S.A |
| 111,685 |
| — |
| — |
| — | ||||||||
Other |
| — |
| — |
| 4,733 |
| 4,733 | ||||||||
|
| 262,910 |
| 174,745 |
| 38,424 |
| 51,668 | ||||||||
Total non-current assets |
| 262,910 |
| 174,745 |
| 67,004 |
| 88,620 | ||||||||
Related parties receivables |
| 315,713 |
| 348,096 |
| 365,636 |
| 340,091 | ||||||||
Notes to the interim Financial Statements
(In thousands of Reais, except when otherwise indicated)
|
| Parent Company |
| Consolidated | |||||||||||||
|
| 06/30/2024 |
| 12/31/2023 |
| 06/30/2024 |
| 12/31/2023 | |||||||||
Current liabilities |
|
|
|
|
|
|
|
| |||||||||
Commercial operations |
|
|
|
|
|
|
|
| |||||||||
Raízen S.A. |
| 7,725 |
| 4,099 |
| 327,700 |
| 232,713 | |||||||||
Termag - Terminal Marítimo de Guarujá S.A. |
| — |
| — |
| 12,608 |
| 10,500 | |||||||||
Associação Gestora da Ferrovia Interna do Porto de Santos (AG-FIPS) |
| — |
| — |
| 33,253 |
| — | |||||||||
Aguassanta Participações S.A. |
| — |
| — |
| — |
| 984 | |||||||||
Cosan Lubrificantes e Especialidades S.A. |
| 5,417 |
| 1,065 |
| — |
| — | |||||||||
Norgás S.A. |
| — |
| — |
| 72,954 |
| 6,816 | |||||||||
Vale S.A |
| — |
| — |
| 2,986 |
| 4,000 | |||||||||
Other |
| 2,123 |
| 6,065 |
| 4,430 |
| 32,726 | |||||||||
|
| 15,265 |
| 11,229 |
| 453,931 |
| 287,739 | |||||||||
Financial and corporate operations |
|
|
|
|
|
|
|
| |||||||||
Raízen S.A. |
| 42,047 |
| 32,405 |
| 43,742 |
| 34,421 | |||||||||
Cosan Overseas Limited |
| 35,919 |
| 31,282 |
| — |
| — | |||||||||
Cosan Luxembourg S.A |
| 84,818 |
| 123,983 |
| — |
| — | |||||||||
|
| 162,784 |
| 187,670 |
| 43,742 |
| 34,421 | |||||||||
Total current liabilities |
| 178,049 |
| 198,899 |
| 497,673 |
| 322,160 | |||||||||
Non-current liabilities |
|
|
|
|
|
|
|
| |||||||||
Financial and corporate operations |
|
|
|
|
|
|
|
| |||||||||
Cosan Lubrificantes e Especialidades S.A. |
| 629,032 |
| 655,683 |
| — |
| — | |||||||||
Cosan Luxembourg S.A |
| 3,853,267 |
| 3,355,612 |
| — |
| — | |||||||||
Cosan Overseas Limited |
| 2,798,906 |
| 2,437,595 |
| — |
| — | |||||||||
Raízen S.A. |
| 1,079 |
| 1,078 |
| 1,078 |
| 1,078 | |||||||||
Total non-current liabilities |
| 7,282,284 |
| 6,449,968 |
| 1,078 |
| 1,078 | |||||||||
Payables to related parties |
| 7,460,333 |
| 6,648,867 |
| 498,751 |
| 323,238 | |||||||||
Notes to the interim Financial Statements
(In thousands of Reais, except when otherwise indicated)
b) Transactions with related parties:
Parent Company | Consolidated | ||||||||||||||
| 2Q24 |
| 2Q23 |
| 6M24 |
| 6M23 |
| 2Q24 |
| 2Q23 |
| 6M24 |
| 6M23 |
Operating income |
|
|
|
|
|
|
|
|
|
|
|
|
|
|
|
Raízen S.A. | — |
| — |
| — |
| — |
| 10,493 |
| 197,571 |
| 265,889 |
| 343,983 |
Elevações Portuárias S.A. | — |
| — |
| — |
| — |
| 3,303 |
| 3,867 |
| 7,649 |
| 7,821 |
Vale S.A. |
|
|
|
| — |
| — |
| — |
| — |
| 196 |
| — |
| — |
| — |
| — |
| — |
| 13,796 |
| 201,438 |
| 273,734 |
| 351,804 |
|
|
|
|
|
|
|
|
|
|
|
|
|
|
| |
Purchase of products / inputs / services |
|
|
|
|
|
|
|
|
|
|
|
|
|
| |
Raízen S.A. | (11) |
| — |
| (15) |
| — |
| (628,399) |
| (548,479) |
| (1,151,114) |
| (1,063,434) |
CLI Sul S.A. | — |
| — |
| — |
| — |
| — |
| (5,915) |
| — |
| (13,203) |
Vale S.A. | — |
| — |
| — |
| — |
| (2,276) |
| — |
| (2,169) |
| — |
| (11) |
| — |
| (15) |
| — |
| (630,675) |
| (554,394) |
| (1,153,283) |
| (1,076,637) |
Shared income (expenses) |
|
|
|
|
|
|
|
|
|
|
|
|
|
|
|
Compass Gás e Energia S.A. | 1,775 |
| 1,694 |
| 10,469 |
| 3,518 |
| — |
| — |
| — |
| — |
Cosan Lubrificantes e Especialidades S.A. | 1,365 |
| 1,057 |
| 2,962 |
| 2,220 |
| — |
| — |
| — |
| — |
Raízen S.A. | (861) |
| (1,503) |
| (1,726) |
| (2,901) |
| (40,330) |
| (18,690) |
| (60,494) |
| (37,553) |
Rumo S.A. | 1,140 |
| 1,265 |
| 2,625 |
| 2,599 |
| — |
| — |
| — |
| — |
Aldwych Temple Venture Capital Limited | — |
| — |
| — |
| 46,191 |
| — |
| — |
| — |
| — |
Other | 68 |
| (8) |
| 52 |
| 129 |
| 68 |
| — |
| 52 |
| — |
| 3,487 |
| 2,505 |
| 14,382 |
| 51,756 |
| (40,262) |
| (18,690) |
| (60,442) |
| (37,553) |
Financial result |
|
|
|
|
|
|
|
|
|
|
|
|
|
|
|
Cosan Luxembourg S.A. | (447,518) |
| 237,011 |
| (603,115) |
| 290,661 |
| — |
| — |
| — |
| — |
Cosan Overseas Limited | (340,601) |
| 80,932 |
| (470,849) |
| 99,129 |
| — |
| — |
| — |
| — |
| (788,119) |
| 317,943 |
| (1,073,964) |
| 389,790 |
| — |
| — |
| — |
| — |
Total | (784,643) |
| 320,448 |
| (1,059,597) |
| 441,546 |
| (657,141) |
| (371,646) |
| (939,991) |
| (762,386) |
Notes to the interim Financial Statements
(In thousands of Reais, except when otherwise indicated)
c) Managers’ and directors’ compensation:
The Company has a compensation policy approved by the Board of Directors. Compensation of the Company's key management personnel includes salaries, contributions to a defined post-employment benefit plan and stock-based compensation. On May 29, 2024, the Annual General Meeting approved the overall annual remuneration of the directors for the 2024 financial year. We present below the result of the Parent Company on June 30, 2024, as follows:
| 2Q24 |
| 2Q23 |
| 6M24 |
| 6M23 |
Short-term benefits to employees and managers | 11,907 |
| 8,248 |
| 20,632 |
| 16,882 |
Share-based compensation | 13,868 |
| 10,739 |
| 27,737 |
| 21,477 |
Post-employment benefits | 158 |
| 127 |
| 287 |
| 252 |
Benefits from termination of employment contract | — |
| — |
| 1,645 |
| — |
| 25,933 |
| 19,114 |
| 50,301 |
| 38,611 |
| Parent Company |
| Consolidated | ||||
| 06/30/2024 |
| 12/31/2023 |
| 06/30/2024 |
| 12/31/2023 |
Material and services suppliers | 1,957 |
| 2,431 |
| 3,428,145 |
| 3,110,114 |
Natural gas/ transport and logistics suppliers | — |
| — |
| 1,068,210 |
| 1,074,411 |
| 1,957 |
| 2,431 |
| 4,496,355 |
| 4,184,525 |
Current | 1,957 |
| 2,431 |
| 4,438,849 |
| 3,920,273 |
Non-current | — |
| — |
| 57,506 |
| 264,252 |
Total | 1,957 |
| 2,431 |
| 4,496,355 |
| 4,184,525 |
| Sectorial Assets |
| Sectorial liabilities |
| Total |
At January 1, 2024 | 548,700 |
| (1,810,698) |
| (1,261,998) |
Cost of gas | (52,879) |
| (16) |
| (52,895) |
Tax credits | — |
| (33,096) |
| (33,096) |
Monetary update | 35,480 |
| (90,274) |
| (54,794) |
Deferral of IGP-M | 57,975 |
| — |
| 57,975 |
At June 30, 2024 | 589,276 |
| (1,934,084) |
| (1,344,808) |
|
|
|
|
|
|
Current | 167,034 |
| (70,405) |
| 96,629 |
Non-current | 422,242 |
| (1,863,679) |
| (1,441,437) |
Total | 589,276 |
| (1,934,084) |
| (1,344,808) |
Notes to the interim Financial Statements
(In thousands of Reais, except when otherwise indicated)
All resulting fair value estimates are included in level 2, except for contingent consideration payables for which fair values have been determined using present values and discount rates adjusted for counterparty or own credit risk.
The carrying amounts and fair value of consolidated assets and liabilities are as follows:
|
|
| Carrying amount |
| Assets and liabilities measured at fair value | ||||||||||||
|
|
| 06/30/2024 |
| 12/31/2023 |
| 06/30/2024 |
| 12/31/2023 | ||||||||
| Note |
|
|
|
|
| Level 1 |
| Level 2 |
| Level 3 |
| Level 1 |
| Level 2 |
| Level 3 |
Assets |
|
|
|
|
|
|
|
|
|
|
|
|
|
|
|
|
|
Investment funds | 5.2 |
| 3,731,612 |
| 3,298,142 |
| — |
| 3,731,612 |
| — |
| — |
| 3,298,142 |
| — |
Marketable securities | 5.3 |
| 3,973,338 |
| 3,503,961 |
| — |
| 3,973,338 |
| — |
| — |
| 3,503,961 |
| — |
Other financial assets |
|
| 4,194 |
| 3,113 |
| 4,194 |
| — |
| — |
| 3,113 |
| — |
| — |
Investment properties (i) | 11.5 |
| 15,816,095 |
| 15,976,126 |
| — |
| — |
| 15,816,095 |
| — |
| — |
| 15,976,126 |
Derivate financial instruments | 5.6 |
| 2,657,659 |
| 2,546,799 |
| — |
| 2,657,659 |
| — |
| — |
| 2,546,799 |
| — |
Total |
|
| 26,182,898 |
| 25,328,141 |
| 4,194 |
| 10,362,609 |
| 15,816,095 |
| 3,113 |
| 9,348,902 |
| 15,976,126 |
Liabilities |
|
|
|
|
|
|
|
|
|
|
|
|
|
|
|
|
|
Loans, financing and debentures | 5.4 |
| (62,511,857) |
| (56,904,654) |
| — |
| (26,464,647) |
| — |
| — |
| (22,952,492) |
| — |
Derivative financial instruments | 5.6 |
| (2,229,471) |
| (3,415,145) |
| — |
| (2,229,471) |
| — |
| — |
| (3,415,145) |
| — |
Total |
|
| (64,741,328) |
| (60,319,799) |
| — |
| (28,694,118) |
| — |
| — |
| (26,367,637) |
| — |
| (i) | The fair value of investment properties was determined using the direct comparative method of market data applied to transactions involving similar properties (type, location, and quality of property) and, to a lesser extent, sales quotes for potential transactions involving comparable assets (level 3). The methodology used to determine fair value incorporates direct comparisons of market information, such as market research, homogenization of values, spot market prices, sales, distances, facilities, access to land, topography and soil, land use (crop type), and rainfall, among other data, in accordance with the standards issued by the Brazilian Association of Technical Standards ("ABNT"). The discount rates used vary between 11.12% p.a. and 11.20% p.a. on June 30, 2024 and on December 31, 2023. |
| (ii) | The fair value of the Company's loans does not differ significantly from their carrying value, except for debts that are assigned to fair value through profit or loss. For debts that have a market value quoted on the Luxembourg Stock Exchange, the fair value measurement is based on the quoted market price as follows: |
Notes to the interim Financial Statements
(In thousands of Reais, except when otherwise indicated)
Debt |
| Company |
| 06/30/2024 |
| 12/31/2023 |
Senior Notes 2028 |
| Rumo Luxembourg S.à r.l. |
| 96.42% |
| 96.41% |
Senior Notes 2032 |
| Rumo Luxembourg S.à r.l. |
| 84.79% |
| 85.65% |
Senior Notes 2027 |
| Cosan Luxembourg S.A. |
| 100.07% |
| 100.92% |
This note describes the group's exposure to financial risks and how these risks may affect future financial performance. To provide more context, current year profit and loss information has been included where applicable:
Risk | Exposure arising from | Measurement | Management |
Market risk - foreign exchange | i. Future commercial transactions. ii.Recognized financial assets and liabilities not denominated in Reais. | i. Cash flow forecasting ii.Sensitivity analysis | Foreign currency |
Market risk - interest | Cash and cash equivalents, securities, loans, financing and debentures, leases and derivative financial instruments. | Sensitivity analysis | Interest rate swap |
Market risk – price | i. Future business transactions ii.Investment in securities | i. Cash flow forecasting ii.Sensitivity analysis | i. Future price of electricity (purchase and sale) ii.Derivative protection for valuation and devaluation of shares |
Credit risk | Cash and cash equivalents, marketable securities, trade receivables, derivatives, receivables from related parties, dividends and investment property | i. Analysis by maturity ii.Credit ratings | Cash and cash equivalents and lines of credit |
Liquidity risk | Loans, financing and debentures, accounts payable to suppliers, other financial liabilities, REFIS, leases, derivatives, payables to related parties and dividends. | Cash flow forecasting | Cash and cash equivalents and lines of credit |
The Company's Management identifies, evaluates, and hedges financial risks in close collaboration with operating units. The Board of Directors provides written principles for managing global risk in addition to policies covering specific areas such as currency risk, interest rate risk, credit risk, use of derivative and non-derivative financial instruments, and excess investment of liquidity.
When all applicable criteria are satisfied, hedge accounting is used to eliminate the accounting mismatch between the hedging instrument and the hedged item. This will result in the effective recognition of interest expense at a fixed interest rate for hedged floating rate loans and inventory at the fixed foreign exchange rate for purchases hedged against foreign exchange risk.
The Company may opt for formal designation of new debt transactions for which it has swap-type derivative hedging instruments for foreign exchange rate variation and interest, as measured at fair value. The Fair Value Option is intended to eliminate inconsistencies caused by disparities between the measurement credits of certain liabilities and their hedging instruments. Consequently, both swaps and respective debts are now valued at fair value. This option is irrevocable and must be exercised upon the operation's initial accounting entry.
The policy of the company is to maintain a sufficient capital base to foster the confidence of investors, creditors, and the market, and to ensure the business's future growth. Each of its businesses' rate of return on capital is monitored by Management.
An analysis of the risk exposure that Management intends to cover determines the use of financial instruments to protect against these areas of volatility.
Notes to the interim Financial Statements
(In thousands of Reais, except when otherwise indicated)
a) Market risk
The objective of market risk management is to manage and control exposures to market risk within acceptable parameters, optimizing returns.
The Company uses derivatives to manage market risks. All these transactions are carried out within the guidelines defined by the Risk Management Committee. Generally, the Company seeks to apply hedge accounting to manage volatility in profit or loss.
i. Foreign exchange riskAs of June 30, 2024 and December 31,2023, the Company had the following net exposure to foreign exchange variation on assets and liabilities denominated in US Dollars, Euros, Yen and Pound Sterling:
| 06/30/2024 |
| 12/31/2023 |
Cash and cash equivalents | 826,357 |
| 284,956 |
Suppliers | (672,733) |
| (441,768) |
Loans, financing and debentures | (18,522,248) |
| (24,861,084) |
Leases | (1,852,363) |
| (1,627,104) |
Consideration payable | (196,188) |
| (203,094) |
Derivative financial instruments | 24,044,414 |
| 14,182,102 |
FX exposure, net | 3,627,239 |
| (12,665,992) |
The probable scenario considers the estimated foreign exchange rates, carried out by a specialized third party, at the maturity of transactions for companies with real functional currency (positive and negative, before tax effects), as follows:
|
|
|
|
|
| Scenarios | ||||||
Instrument |
| Risk factor |
| Probable |
| 25% |
| 50% |
| (25%) |
| (50%) |
Cash and cash equivalents |
| Low FX rate |
| 441,363 |
| 643,901 |
| 846,438 |
| 238,826 |
| 88,766 |
Trade payables |
| High FX rate |
| 11 |
| (36) |
| (83) |
| 58 |
| 105 |
Derivative financial instruments |
| Low FX rate |
| 1,426,926 |
| 8,275,435 |
| 15,857,358 |
| (6,888,421) |
| (14,470,339) |
Loans, borrowings and debentures |
| High FX rate |
| 2,465,744 |
| (8,815,985) |
| (19,224,627) |
| 12,046,301 |
| 22,522,143 |
Leases |
| High FX rate |
| (1,663,575) |
| (2,100,932) |
| (2,538,289) |
| (1,226,217) |
| (788,860) |
Consideration payable |
| High FX rate |
| 10,902 |
| 25,211 |
| 39,519 |
| (3,407) |
| (17,716) |
Impacts on profit or loss before taxes |
|
|
| 2,681,371 |
| (1,972,406) |
| (5,019,684) |
| 4,167,140 |
| 7,334,099 |
Notes to the interim Financial Statements
(In thousands of Reais, except when otherwise indicated)
The probable scenario considers the estimated exchange rates, made by a specialized third party, upon maturity of the transactions for the companies with functional currency Reais (positive and negative, before tax effects), as follows:
| Exchange rate sensitivity analysis | ||||||||||
| 06/30/2024 |
| Scenarios | ||||||||
|
| Probable |
| 25% |
| 50% |
| (25%) |
| (50%) | |
U.S.$ | 5.5589 |
| 5.2500 |
| 6.5625 |
| 7.8750 |
| 3.9375 |
| 2.6250 |
Euro | 5.9547 |
| 5.9325 |
| 7.4156 |
| 8.8988 |
| 4.4494 |
| 2.9663 |
GBP | 7.0259 |
| 6.7725 |
| 8.4656 |
| 10.1588 |
| 5.0794 |
| 3.3863 |
JPY | 0.0346 |
| 0.0357 |
| 0.0446 |
| 0.0536 |
| 0.0268 |
| 0.0179 |
ii. Interest rate risk
The Company and its subsidiaries monitor fluctuations in variable interest rates related to their financing and use derivative instruments to minimize the risk of fluctuations in variable interest rates.
A sensitivity analysis on interest rates on loans and financing to offset investments in CDI with pre-tax increases and decreases of 25% and 50% is presented below:
|
|
|
| Scenarios | ||||||
Interest rate exposure |
| Probable |
| 25% |
| 50% |
| (25%) |
| (50%) |
Cash and cash equivalents |
| 1,658,907 |
| 2,073,634 |
| 2,488,361 |
| 1,244,180 |
| 829,454 |
Marketable securities |
| 330,758 |
| 413,447 |
| 496,137 |
| 248,068 |
| 165,379 |
Restricted cash |
| 16,671 |
| 20,839 |
| 25,007 |
| 12,503 |
| 8,336 |
Lease and concession in installments |
| (418,022) |
| (418,399) |
| (418,778) |
| (417,647) |
| (417,274) |
Leases liabilities |
| (128,120) |
| (147,197) |
| (176,636) |
| (88,318) |
| (58,879) |
Derivative financial instruments |
| (670,956) |
| (1,720,013) |
| (2,082,879) |
| (966,270) |
| (589,205) |
Loans, financing and debentures |
| (2,978,339) |
| (4,310,210) |
| (5,018,081) |
| (2,894,469) |
| (2,186,598) |
Other financial liabilities |
| (36,978) |
| (44,998) |
| (53,018) |
| (28,958) |
| (20,938) |
Impacts on the result before taxes |
| (2,226,079) |
| (4,132,897) |
| (4,739,887) |
| (2,890,911) |
| (2,269,725) |
The probable scenario considers the estimated interest rate, made by a specialized third party and the Central Bank of Brazil (Banco Central do Brasil or “BACEN”) as follows:
|
|
| Scenarios | ||||||
| Probable |
| 25% |
| 50% |
| (25%) |
| (50%) |
SELIC | 10.44% |
| 13.05% |
| 15.66% |
| 7.83% |
| 5.22% |
CDI | 10.34% |
| 12.92% |
| 15.51% |
| 7.75% |
| 5.17% |
TJLP462 (TJLP + 1% p.a.) | 7.80% |
| 9.50% |
| 11.20% |
| 6.10% |
| 4.40% |
TJLP | 6.80% |
| 8.50% |
| 10.20% |
| 5.10% |
| 3.40% |
IPCA | 3.55% |
| 4.44% |
| 5.32% |
| 2.66% |
| 1.77% |
IGPM | 3.74% |
| 4.68% |
| 5.61% |
| 2.81% |
| 1.87% |
Fed Funds | 4.75% |
| 5.94% |
| 7.13% |
| 3.56% |
| 2.38% |
SOFR | 4.57% |
| 5.72% |
| 6.86% |
| 3.43% |
| 2.29% |
Notes to the interim Financial Statements
(In thousands of Reais, except when otherwise indicated)
- Options
We use derivative financial instruments called options to limit our exposure to changes in the value of Vale shares. The widely accepted methodology used to calculate the fair value of options is based on the Black & Scholes pricing model. The values calculated in the sensitivity analysis of the framework mentioned reflect the impacts of the intrinsic values of the options as the shares appreciate or depreciate.
|
|
|
| Scenarios | ||||||||
Instrument |
| Interest |
| Probable |
| 25% |
| 50% |
| (25%) |
| (50%) |
VALE3 (Call Spread) |
| 1.43% |
| 238,986 |
| 534,402 |
| 747,253 |
| 117,251 |
| 31,344 |
- Call Option (“Call”)
The Company has a call option which gives it the right to repurchase all the preferred shares of Cosan Nove and Cosan Dez, which may be exercised as of the third year after the execution of the respective agreements in December 2022.
As of June 30, 2024, the Company measured the fair value of the call option and concluded that it is off price.
- Contingent put option
In the shareholders' agreements entered into between the Company and the banks Itaú and Bradesco regarding the issuance of preferred shares, it was defined that both financial institutions have a contingent put option only when the specific adverse material effects provided for in the contract occur, which are in the Company's control and, therefore, do not constitute a financial obligation.
The prices of the exercise options are calculated based on the initial values of R$4,115,000 and R$4,000,000 adjusted by a weighted average rate of CDI + 1.25% minus the dividends received by non-controlling shareholders in this period, which, as of June 30, 2024, is represented by the amounts of R$4,360,046 and R$3,836,565, respectively.
- Total Return Swap (TRS)
We are exposed to risks linked to CSAN3 share prices. To mitigate such exposures, total return swap derivatives of 113,348,712 shares of CSAN3 were contracted in which the Company receives the variation of the share price and proceeds on the active side and pays CDI + 1.42% on the passive side.
The sensitivity analysis considers the closing share price as shown below:
|
|
|
| Scenarios | ||||||
Instrument |
| Probable |
| 25% |
| 50% |
| (25%) |
| (50%) |
Brent derivatives – options |
| (732,552) |
| 383,685 |
| 767,371 |
| (383,685) |
| (767,371) |
Value of the share (CSAN3) |
| 13.54 |
| 16.93 |
| 20.31 |
| 10.16 |
| 6.77 |
b) Credit risk
The Company's regular operations expose it to the risk of default when customers, suppliers, and counterparties are unable to fulfill their financial commitments or other obligations. The Company seeks to mitigate this risk by conducting transactions with a diverse group of counterparties. However, the Company's operations remain susceptible to the unanticipated financial failures of third parties. The credit risk exposure was as follows:
Notes to the interim Financial Statements
(In thousands of Reais, except when otherwise indicated)
| 06/30/2024 |
| 12/31/2023 |
Cash and cash equivalents | 17,230,061 |
| 14,658,481 |
Trade receivables | 4,221,926 |
| 3,444,636 |
Marketable securities | 3,973,338 |
| 3,503,961 |
Restricted cash | 168,734 |
| 203,252 |
Derivative financial instruments | 2,657,659 |
| 2,546,799 |
Receivables from related parties | 365,636 |
| 340,091 |
Receivable dividends and interest on equity | 299,249 |
| 255,777 |
Other financial assets | 4,194 |
| 3,113 |
| 28,920,797 |
| 24,956,110 |
The Company is exposed to risks related to its cash management activities and temporary investments.
The majority of liquid assets are invested in government bonds and other bank investments. The treasury department manages the credit risk of bank and financial institution balances in accordance with the Company's policy.
The credit risk associated with lease receivables is divided into two customer categories: (i) Level 1 and (ii) Level 2. The majority of subsidiary investment properties are leased to customers classified as Level 1, with no history of late payments or default and a solid financial standing. In order to mitigate the credit risk associated with lease receivables, the Company's policy restricts its exposure to Level 2 customers. The risk associated with accounts receivable related to the sale of investment properties is mitigated by granting land ownership to the customer only after receiving a down payment for the transaction. In addition, the transfer of ownership is contingent upon receipt of all outstanding payments.
Only approved counterparties and within the credit limits assigned to each counterparty may invest surplus funds. Credit limits for counterparties are reviewed annually and may be modified throughout the period. The limits are established to minimize the concentration of risks and, consequently, to mitigate financial loss caused by potential counterparty default. The credit risk of cash and cash equivalents, marketable securities, restricted cash, and derivative financial instruments is determined by widely accepted market rating instruments and is structured as follows:
| 06/30/2024 |
| 12/31/2023 |
AAA | 23,133,257 |
| 20,475,536 |
AA | 201,005 |
| 172,871 |
A | 529,684 |
| 124,932 |
Not rated | 165,846 |
| 139,154 |
| 24,029,792 |
| 20,912,493 |
c) Liquidity risk
The Company's strategy for managing liquidity is to ensure, whenever possible, that it has sufficient liquidity to meet its liabilities when they are due, under normal and stressed conditions, without incurring unacceptable losses or risking reputational harm.
The Company's financial liabilities (based on contracted undiscounted cash flows) are categorized by maturity dates as follows:
Notes to the interim Financial Statements
(In thousands of Reais, except when otherwise indicated)
| 06/30/2024 |
| 12/31/2023 | ||||||||
| Up to 1 year |
| 1 - 2 years |
| 2 - 5 years |
| More than 5 years |
| Total |
| Total |
Loans, financing and debentures | (3,652,787) |
| (2,353,191) |
| (1,836,570) |
| (17,027,674) |
| (24,870,222) |
| (67,935,471) |
Suppliers | (4,438,849) |
| (728,620) |
| — |
| — |
| (5,167,469) |
| (4,184,525) |
Other financial liabilities | (433,135) |
| — |
| — |
| — |
| (433,135) |
| (476,895) |
Installment of tax debts | (4,879) |
| (1,494) |
| (1,871) |
| (212,995) |
| (221,239) |
| (217,267) |
Leases | (677,905) |
| (1,194,244) |
| (843,965) |
| (18,300,037) |
| (21,016,151) |
| (20,874,841) |
Lease and concession in installments | (285,935) |
| (285,935) |
| (571,869) |
| (110,978) |
| (1,254,717) |
| (1,137,295) |
Payables to related parties | (497,673) |
| (1,078) |
| — |
| — |
| (498,751) |
| (322,160) |
Dividends payable | (289,980) |
| — |
| — |
| — |
| (289,980) |
| (549,054) |
Derivative financial instruments | (958,703) |
| (1,321,165) |
| 1,391,895 |
| 5,811,863 |
| 4,923,890 |
| (4,917,895) |
| (11,239,846) |
| (5,885,727) |
| (1,862,380) |
| (29,839,821) |
| (48,827,774) |
| (100,615,403) |
d) Capital management risk
The group manages the capital structure and adjusts it in light of changing economic conditions and financial covenant requirements. In order to maintain or adjust the capital structure, the Group may adjust the payment of dividends to shareholders, return capital to them or issue new shares. The Company monitors capital mainly through the leverage ratio, calculated as net debt to EBITDA. The group's lowest covenant ratio is currently 3.3x.
The Company's policy is to maintain a solid capital base to foster the confidence of its parent companies, creditors, and the market, and to ensure the business's future growth. Management ensures that the return on capital, which the Company defines as the result of its operating activities divided by its total shareholders' equity, is sufficient for each of its businesses.
To achieve this overall objective, the Group's capital management, among other things, aims to ensure compliance with the financial commitments associated with the loans and financing that define the capital structure requirements.
Notes to the interim Financial Statements
(In thousands of Reais, except when otherwise indicated)
| Parent Company |
| Consolidated | ||||
| 06/30/2024 |
| 12/31/2023 |
| 06/30/2024 |
| 12/31/2023 |
COFINS | 3,699 |
| 3,699 |
| 442,759 |
| 487,160 |
PIS | — |
| — |
| 105,519 |
| 110,904 |
Tax credits | 34,414 |
| 33,639 |
| 34,414 |
| 33,639 |
ICMS | — |
| — |
| 1,094,953 |
| 924,180 |
ICMS - CIAP | — |
| — |
| 229,063 |
| 189,813 |
Other | 1,579 |
| 4,647 |
| 115,139 |
| 132,863 |
| 39,692 |
| 41,985 |
| 2,021,847 |
| 1,878,559 |
|
|
|
|
|
|
|
|
Current | 5,278 |
| 8,346 |
| 796,915 |
| 745,856 |
Non-current | 34,414 |
| 33,639 |
| 1,224,932 |
| 1,132,703 |
Total | 39,692 |
| 41,985 |
| 2,021,847 |
| 1,878,559 |
|
| Consolidated | ||
|
| 06/30/2024 |
| 12/31/2023 |
Finished products |
| 1,615,797 |
| 1,254,818 |
Parts and accessories |
| 190,895 |
| 178,260 |
Construction Materials |
| 206,715 |
| 316,370 |
Warehouse and other |
| 133,109 |
| 43,266 |
|
| 2,146,516 |
| 1,792,714 |
The balances are presented net of a provision of R$ 108,026 for obsolete inventories on June 30, 2023 (R$78,709 on December 31, 2023).
Notes to the interim Financial Statements
(In thousands of Reais, except when otherwise indicated)
a) Composition of assets held for sale:
| Properties held for sale |
| Other assets held for sale |
| Total |
At January 1, 2024 | 342,392 |
| 1,795,773 |
| 2,138,165 |
Additions (i) | — |
| 73,308 |
| 73,308 |
Transfers (ii) | 163,507 |
| — |
| 163,507 |
At June 30, 2024 | 505,899 |
| 1,869,081 |
| 2,374,980 |
| (i) | As mentioned in note 2, the balance corresponding to the investment in the associate Terminal XXXIX de Santos S.A. was added to the group of assets held for sale. |
| (ii) | Transfers from the investment property group as per note 11.5. |
| Norgás |
| TUP Porto São Luis S.A |
| Radar |
| Rumo |
| Total |
Cash and cash equivalents | — |
| 48,231 |
| — |
| — |
| 48,231 |
Other current tax receivable | — |
| 3,030 |
| — |
| — |
| 3,030 |
Dividend receivable | 18,646 |
| — |
| — |
| — |
| 18,646 |
Investments in associates | 892,854 |
| — |
| — |
| 73,308 |
| 966,162 |
Property, plant and equipment | — |
| 395,757 |
| — |
| — |
| 395,757 |
Intangible assets and goodwill | — |
| 437,220 |
| — |
| — |
| 437,220 |
Other assets | — |
| 35 |
| — |
| — |
| 35 |
Properties held for sale | — |
| — |
| 505,899 |
| — |
| 505,899 |
Total | 911,500 |
| 884,273 |
| 505,899 |
| 73,308 |
| 2,374,980 |
The balance of R$5,045 in the parent company is composed of accounts receivable from parties related to TUP Porto São Luis S.A
b) Composition of liabilities held for sale:
| Norgás |
| TUP Porto São Luis S.A |
| Total |
Trade payables | — |
| 17,248 |
| 17,248 |
Employee benefits payables | — |
| 1,828 |
| 1,828 |
Other liabilities | — |
| 456 |
| 456 |
Deferred tax liabilities | 152,255 |
| 66,606 |
| 218,861 |
Total | 152,255 |
| 86,138 |
| 238,393 |
c) Discontinued operation result:
| Parent company |
| Consolidated | ||||
| 2Q23 |
| 6M23 |
| 2Q23 |
| 6M23 |
Equity equivalence | 5,483 |
| 5,483 |
| 15,907 |
| 15,907 |
Controlling shareholders | 5,483 |
| 5,483 |
| 5,483 |
| 5,483 |
Non-controlling shareholders | — |
| — |
| 10,424 |
| 10,424 |
Notes to the interim Financial Statements
(In thousands of Reais, except when otherwise indicated)
Comparative balance reclassification: |
| Parent company | ||||||||||
|
| 2Q23 (Originally presented) |
| Reclassification |
| 2Q23 (Restated) |
| 6M23 (Originally presented) |
| Reclassification |
| 6M23 (Restated) |
Loss before equivalence result equity and net financial result patrimonial |
| (115,581) |
| — |
| (115,581) |
| (185,035) |
| — |
| (185,035) |
|
|
|
|
|
|
|
|
|
|
|
|
|
Equity equivalence in associates |
| (730,970) |
| (5,483) |
| (736,453) |
| (1,312,038) |
| (5,483) |
| (1,317,521) |
Equity equivalence of jointly controlled companies |
| 29,870 |
| — |
| 29,870 |
| 158,256 |
| — |
| 158,256 |
Equity equivalence result |
| (701,100) |
| (5,483) |
| (706,583) |
| (1,153,782) |
| (5,483) |
| (1,159,265) |
|
|
|
|
|
|
|
|
|
|
|
|
|
Net financial result |
| (417,450) |
| — |
| (417,450) |
| (1,043,402) |
| — |
| (1,043,402) |
|
|
|
|
|
|
|
|
|
|
|
|
|
Loss before income tax and social contribution |
| (1,234,131) |
| (5,483) |
| (1,239,614) |
| (2,382,219) |
| (5,483) |
| (2,387,702) |
|
|
|
|
|
|
|
|
|
|
|
|
|
Income tax and social contribution |
| 191,430 |
| — |
| 191,430 |
| 434,388 |
| — |
| 434,388 |
|
|
|
|
|
|
|
|
|
|
|
|
|
Loss from operations in continuity |
| (1,042,701) |
| (5,483) |
| (1,048,184) |
| (1,947,831) |
| (5,483) |
| (1,953,314) |
Result of discontinued operations, net of taxes |
| — |
| 5,483 |
| 5,483 |
| — |
| 5,483 |
| 5,483 |
Loss for the period |
| (1,042,701) |
| — |
| (1,042,701) |
| (1,947,831) |
| — |
| (1,947,831) |
|
| Consolidated | ||||||||||
|
| 2Q23 (Originally presented) |
| Reclassification |
| 2Q23 (Restated) |
| 6M23 (Originally presented) |
| Reclassification |
| 6M23 (Restated) |
Profit before equivalence result equity and net financial result patrimonial |
| 1,883,511 |
| — |
| 1,883,511 |
| 3,854,699 |
| — |
| 3,854,699 |
|
|
|
|
|
|
|
|
|
|
|
|
|
Equity equivalence in associates |
| 83,039 |
| (15,907) |
| 67,132 |
| 136,004 |
| (15,907) |
| 120,097 |
Equity equivalence of jointly controlled companies |
| 263,003 |
| — |
| 263,003 |
| 1,393,417 |
| — |
| 1,393,417 |
Equity equivalence result |
| 346,042 |
| (15,907) |
| 330,135 |
| 1,529,421 |
| (15,907) |
| 1,513,514 |
|
|
|
|
|
|
|
|
|
|
|
|
|
Net financial result |
| (3,142,776) |
| — |
| (3,142,776) |
| (5,911,891) |
| — |
| (5,911,891) |
|
|
|
|
|
|
|
|
|
|
|
|
|
Loss before income tax and social contribution |
| (913,223) |
| (15,907) |
| (929,130) |
| (527,771) |
| (15,907) |
| (543,678) |
|
|
|
|
|
|
|
|
|
|
|
|
|
Income tax and social contribution |
| 466,482 |
| — |
| 466,482 |
| (337,703) |
| — |
| (337,703) |
|
|
|
|
|
|
|
|
|
|
|
|
|
Loss from operations in continuity |
| (446,741) |
| (15,907) |
| (462,648) |
| (865,474) |
| (15,907) |
| (881,381) |
Result of discontinued operations, net of taxes |
| — |
| 15,907 |
| 15,907 |
| — |
| 15,907 |
| 15,907 |
Loss for the period |
| (446,741) |
| — |
| (446,741) |
| (865,474) |
| — |
| (865,474) |
Notes to the interim Financial Statements
(In thousands of Reais, except when otherwise indicated)
d) Reclassification of comparative cash flow balance:
|
| Parent company |
| Consolidated | ||||||||
|
| 6M23 (Originally presented) |
| Reclassification |
| 6M23 (Restated) |
| 6M23 (Originally presented) |
| Reclassification |
| 6M23 (Restated) |
Cash flow from operating activities |
|
|
|
|
|
|
|
|
|
|
|
|
Loss before income tax and social contribution |
| (2,381,219) |
| (5,483) |
| (2,386,702) |
| (527,771) |
| (15,907) |
| (543,678) |
Equity equivalence in subsidiaries and associates |
| 1,312,038 |
| 5,483 |
| 1,317,521 |
| (136,004) |
| 15,907 |
| (120,097) |
Other operational activity items |
| 689,964 |
| — |
| 689,964 |
| 5,588,151 |
| — |
| 5,588,151 |
Net cash (used) generated in operational activities |
| (379,217) |
| — |
| (379,217) |
| 4,924,376 |
| — |
| 4,924,376 |
|
|
|
|
|
|
|
|
|
|
|
|
|
Liquid cash (used) generated in investment activities |
| 800,728 |
| — |
| 800,728 |
| (2,782,164) |
| — |
| (2,782,164) |
|
|
|
|
|
|
|
|
|
|
|
|
|
Net cash generated in activities of financing |
| 153,675 |
| — |
| 153,675 |
| 394,253 |
| — |
| 394,253 |
|
|
|
|
|
|
|
|
|
|
|
|
|
Increase in cash and cash equivalents |
| 575,186 |
| — |
| 575,186 |
| 2,536,465 |
| — |
| 2,536,465 |
|
|
|
|
|
|
|
|
|
|
|
|
|
Cash and cash equivalents at the beginning of the period |
| 1,348,461 |
| — |
| 1,348,461 |
| 13,301,716 |
| — |
| 13,301,716 |
Effect of exchange rate variation on the balance of cash and cash equivalents |
| (12,198) |
| — |
| (12,198) |
| (98,891) |
| — |
| (98,891) |
Cash and cash equivalents at the end of the period |
| 1,911,449 |
| — |
| 1,911,449 |
| 15,739,290 |
| — |
| 15,739,290 |
Notes to the interim Financial Statements
(In thousands of Reais, except when otherwise indicated)
The Company's subsidiaries and associates are listed below:
| 06/30/2024 |
| 12/31/2023 |
Directly owned subsidiaries |
|
|
|
Cosan Corporate |
|
|
|
Cosan Corretora de Seguros Ltda | 100.00% |
| 100.00% |
Cosan Nove Participações S.A. | 73.09% |
| 73.09% |
Cosan Luxembourg S.A. (i) | 100.00% |
| 100.00% |
Cosan Overseas Limited | 100.00% |
| 100.00% |
Pasadena Empreendimentos e Participações S.A. | 100.00% |
| 100.00% |
Cosan Limited Partners Brasil Consultoria Ltda. | 98.13% |
| 97.50% |
Barrapar Participaçoes Ltda. | 100.00% |
| 100.00% |
Aldwych Temple | 100.00% |
| 100.00% |
Vale S.A (ii) | 4.15% |
| 4.90% |
Cosan Oito S.A. | 100.00% |
| 100.00% |
Cosan Global Limited | 100.00% |
| 100.00% |
Atlântico Participações Ltda. | 100.00% |
| 100.00% |
Cosan Dez Participações S.A. | 76.80% |
| 76.80% |
Radar |
|
|
|
Radar Propriedades Agrícolas S.A. | 50.00% |
| 50.00% |
Radar II Propriedades Agrícolas S.A. | 50.00% |
| 50.00% |
Nova Agrícola Ponte Alta S.A. | 50.00% |
| 50.00% |
Nova Amaralina S.A Propriedades Agrícolas | 50.00% |
| 50.00% |
Nova Santa Bárbara Agrícola S.A. | 50.00% |
| 50.00% |
Terras da Ponta Alta S.A. | 50.00% |
| 50.00% |
Castanheira Propriedades Agrícolas S.A. | 50.00% |
| 50.00% |
Manacá Propriedades Agrícolas S.A. | 50.00% |
| 50.00% |
Paineira Propriedades Agrícolas S.A. | 50.00% |
| 50.00% |
Tellus Brasil Participações S.A. | 20.00% |
| 20.00% |
Janus Brasil Participações S.A. | 20.00% |
| 20.00% |
Duguetiapar Empreendimentos e Participações S.A. | 20.00% |
| 20.00% |
Gamiovapar Empreendimentos e Participações S.A. | 20.00% |
| 20.00% |
Moove |
|
|
|
Moove Lubricants Holdings | 70.00% |
| 70.00% |
Rumo |
|
|
|
Rumo S.A. | 30.41% |
| 30.42% |
| (i) | Despite presenting an unsecured liability amount of R$42,706 on June 30, 2024, as shown below, no other events or conditions were identified that, individually or collectively, may raise relevant doubts as to the ability to maintenance of its operational continuity. Subsidiaries have financial support from the Company. | |
| (ii) | In April 2024, Cosan sold 33,524,185 shares of Vale, reducing its stake by 0.78%. The value of 4.15% refers to the percentage of participation excluding treasury shares for the calculation of equity and receipt of dividends. |
Notes to the interim Financial Statements
(In thousands of Reais, except when otherwise indicated)
The following are investments in subsidiaries and affiliates as of June 30, 2024, which are material to the Company:
a) Parent company
| Shares issued by the associate |
| Shares held by Cosan |
| Cosan ownership interest |
| Economic benefit (%) |
Cosan Corporate |
|
|
|
|
|
|
|
Cosan Corretora de Seguros Ltda | 5,000 |
| 4,999 |
| 100.00% |
| 100.00% |
Cosan Nove Participações S.A | 7,663,761,735 |
| 5,601,178,095 |
| 73.09% |
| 66.16% |
Cosan Luxembourg S.A. | 500,010 |
| 500,010 |
| 100.00% |
| 100.00% |
Cosan Overseas Limited | 4,850,000 |
| 4,850,000 |
| 100.00% |
| 100.00% |
Pasadena Empreendimentos e Participações S.A. | 41,481,296 |
| 41,481,046 |
| 100.00% |
| 100.00% |
Cosan Limited Partners Brasil Consultoria Ltda | 160,000 |
| 157,000 |
| 98.13% |
| 98.13% |
Cosan Oito S.A. | 14,646,505,000 |
| 14,646,504,999 |
| 100.00% |
| 100.00% |
Cosan Global Limited | 300 |
| 300 |
| 100.00% |
| 100.00% |
Atlântico Participações Ltda. | 928,005,000 |
| 928,004,997 |
| 100.00% |
| 100.00% |
Cosan Dez Participações S.A. | 3,473,458,687 |
| 2,667,494,858 |
| 76.80% |
| 72.00% |
Radar |
|
|
|
|
|
|
|
Radar Propriedades Agrícolas S.A. | 737,500 |
| 305,694 |
| 41.45% |
| 41.45% |
Radar II Propriedades Agrícolas S.A. | 81,440,221 |
| 40,720,111 |
| 50.00% |
| 50.00% |
Nova Agrícola Ponte Alta S.A. | 160,693,378 |
| 66,607,405 |
| 41.45% |
| 41.45% |
Nova Amaralina S.A Propriedades Agrícolas | 30,603,159 |
| 12,685,010 |
| 41.45% |
| 41.45% |
Nova Santa Bárbara Agrícola S.A. | 32,336,994 |
| 13,403,684 |
| 41.45% |
| 41.45% |
Terras da Ponte Alta S.A.l | 16,066,329 |
| 6,659,494 |
| 41.45% |
| 41.45% |
Castanheira Propriedades Agrícolas S.A. | 83,850,938 |
| 34,756,214 |
| 41.45% |
| 41.45% |
Manacá Propriedades Agrícolas S.A. | 128,977,921 |
| 53,461,349 |
| 41.45% |
| 41.45% |
Paineira Propriedade Agrícolas S.A. | 132,667,061 |
| 54,990,497 |
| 41.45% |
| 41.45% |
Tellus Brasil Participações S.A. | 119,063,044 |
| 71,609,945 |
| 61.14% |
| 19.57% |
Janus Brasil Participações S.A. | 286,370,051 |
| 173,464,883 |
| 60.57% |
| 19.57% |
Duguetiapar Empreendimentos e Participações S.A. | 3,573,842 |
| 2,163,979 |
| 60.55% |
| 19.57% |
Gamiovapar Empreendimentos e Participações S.A. | 12,912,970 |
| 7,819,194 |
| 60.55% |
| 19.57% |
Moove |
|
|
|
|
|
|
|
Moove Lubricants Holdings | 34,963,764 |
| 24,474,635 |
| 70.00% |
| 70.00% |
Rumo |
|
|
|
|
|
|
|
Rumo S.A. | 1,854,868,949 |
| 562,529,490 |
| 30.41% |
| 30.41% |
Notes to the interim Financial Statements
(In thousands of Reais, except when otherwise indicated)
| At January 1, 2024 |
| Interest in earnings of subsidiaries |
| Change of equity interest in subsidiary |
| Other comprehensive income |
| Dividends |
| Capital increase (reduction) |
| Other |
| At June 30, 2024 |
| Dividend receivable (i) |
Rumo |
|
|
|
|
|
|
|
|
|
|
|
|
|
|
|
|
|
Rumo S.A. | 4,766,466 |
| (418,174) |
| (1,852) |
| 683 |
| — |
| — |
| 4,123 |
| 4,351,246 |
| — |
Cosan Corporate |
|
|
|
|
|
|
|
|
|
|
|
|
|
|
|
|
|
Cosan Corretora de Seguros Ltda | 1,257 |
| 48 |
| — |
| — |
| — |
| — |
| — |
| 1,305 |
| — |
Cosan Nove Participações S.A. | 7,810,778 |
| 30,077 |
| — |
| 36,165 |
| (127,080) |
| — |
| 10,222 |
| 7,760,162 |
| — |
Cosan Dez Participações S.A. | 5,179,164 |
| 537,559 |
| — |
| (99,035) |
| (798,187) |
| — |
| — |
| 4,819,501 |
| 11,717 |
Pasadena Empreendimentos e Participações S.A. | 1,452 |
| (37) |
| — |
| — |
| — |
| — |
| — |
| 1,415 |
| 127,080 |
Cosan Limited Partners Brasil Consultoria Ltda | 278 |
| (28) |
| — |
| — |
| — |
| — |
| — |
| 250 |
| — |
Other | 25,112 |
| 206 |
| — |
| 1,910 |
| — |
| — |
| — |
| 27,228 |
| — |
Cosan Oito S.A. | 10,376,283 |
| 1,095,014 |
| — |
| (29,085) |
| (210,000) |
| 4,070,000 |
| (26,071) |
| 15,276,141 |
| — |
Atlântico Participações Ltda | 902,421 |
| (9) |
| — |
| — |
| — |
| — |
| — |
| 902,412 |
| 190 |
Cosan Global | 119,355 |
| 18,173 |
| — |
| — |
| — |
| — |
| — |
| 137,528 |
| — |
Radar |
|
|
|
|
|
|
|
|
|
|
|
|
|
|
|
|
|
Radar II Propriedades Agrícolas S.A. | 1,153,530 |
| 14,654 |
| — |
| — |
| (17,675) |
| (238) |
| — |
| 1,150,271 |
| 8,199 |
Radar Propriedades Agrícolas S.A. | 215,346 |
| 4,276 |
| — |
| — |
| (15,096) |
| — |
| — |
| 204,526 |
| — |
Nova Agrícola Ponte Alta S.A. | 441,821 |
| 4,906 |
| — |
| — |
| (4,767) |
| — |
| — |
| 441,960 |
| 1,959 |
Nova Santa Bárbara Agrícola S.A. | 27,948 |
| 263 |
| — |
| — |
| — |
| — |
| — |
| 28,211 |
| 1,712 |
Nova Amaralina S.A. Propriedades Agrícolas | 220,184 |
| 2,492 |
| — |
| — |
| (829) |
| — |
| — |
| 221,847 |
| — |
Terras da Ponte Alta S.A. | 92,122 |
| 324 |
| — |
| — |
| (415) |
| — |
| — |
| 92,031 |
| 11,066 |
Paineira Propriedades Agrícolas S.A. | 210,735 |
| 3,979 |
| — |
| — |
| (5,181) |
| — |
| — |
| 209,533 |
| 4,433 |
Manacá Propriedades Agrícolas S.A. | 209,644 |
| 3,774 |
| — |
| — |
| (6,711) |
| — |
| — |
| 206,707 |
| 2,694 |
Castanheira Propriedades Agrícolas S.A. | 331,453 |
| 2,935 |
| — |
| — |
| (7,047) |
| — |
| — |
| 327,341 |
| 4,863 |
Tellus Brasil Participações S.A. | 774,837 |
| 8,868 |
| — |
| — |
| (19,012) |
| (2,484) |
| — |
| 762,209 |
| 2 |
Janus Brasil Participações S.A. | 1,122,692 |
| 10,853 |
| — |
| — |
| (9,102) |
| — |
| — |
| 1,124,443 |
| 1 |
Duguetiapar Empreendimentos e Participações S.A. | 17,721 |
| 246 |
| — |
| — |
| — |
| (2,505) |
| — |
| 15,462 |
| — |
Gamiovapar Empreendimentos e Participações S.A. | 114,336 |
| 1,528 |
| — |
| — |
| (2,349) |
| — |
| — |
| 113,515 |
| 1 |
Moove |
|
|
|
|
|
|
|
|
|
|
|
|
|
|
|
|
|
Moove Lubricants Holdings | 1,626,216 |
| 255,693 |
| — |
| 35,726 |
| (630,000) |
| — |
| 12,863 |
| 1,300,498 |
| 368 |
Other | 627 |
| (2) |
| — |
| (237) |
| — |
| — |
| — |
| 388 |
| — |
Total investments in associates | 35,741,778 |
| 1,577,618 |
| (1,852) |
| (53,873) |
| (1,853,451) |
| 4,064,773 |
| 1,137 |
| 39,476,130 |
| 174,285 |
Cosan Corporate |
|
|
|
|
|
|
|
|
|
|
|
|
|
|
|
|
|
Cosan Luxembourg S.A. | (146,276) |
| 372 |
| — |
| — |
| — |
| 103,198 |
| — |
| (42,706) |
| — |
Total provision for uncovered liability of associates | (146,276) |
| 372 |
| — |
| — |
| — |
| 103,198 |
| — |
| (42,706) |
| — |
Total | 35,595,502 |
| 1,577,990 |
| (1,852) |
| (53,873) |
| (1,853,451) |
| 4,167,971 |
| 1,137 |
| 39,433,424 |
| 174,285 |
| (i) | Dividends receivable by Cosan S.A. from its subsidiaries. |
Notes to the interim Financial Statements
(In thousands of Reais, except when otherwise indicated)
b) Consolidated
| Shares issued by the associate |
| Shares held by Cosan |
| Cosan ownership interest |
Rumo |
|
|
|
|
|
Rhall Terminais Ltda | 28,580 |
| 8,574 |
| 30.00% |
Termag - Terminal Marítimo de Guarujá S.A. | 500,000 |
| 99,250 |
| 19.85% |
TGG - Terminal de Granéis do Guarujá S.A. | 500,000 |
| 50,000 |
| 10.00% |
CLI Sul S.A. | 543,750,625 |
| 108,750,125 |
| 20.00% |
Compass |
|
|
|
|
|
CEG Rio S.A. | 1,995,022,625 |
| 746,251,086 |
| 37.41% |
Companhia Paranaense de Gás - Compagás | 33,600,000 |
| 8,232,000 |
| 24.50% |
Companhia de Gás de Mato Grosso do Sul - Msgás | 61,610,000 |
| 30,188,900 |
| 49.00% |
Companhia de Gás de Santa Catarina - Scgás | 10,749,497 |
| 4,407,293 |
| 41.00% |
Corporate |
|
|
|
|
|
Vale S.A | 4,539,007,580 |
| 177,342,515 |
| 4.15% |
| At January 1, 2024 |
| Interest in earnings of subsidiaries |
| Dividends | Reclassification to assets held for sale | Write-off related to sale of shareholding |
| Other |
| At June 30, 2024 |
| Dividend receivable (i) | ||
Rumo |
|
|
|
|
|
|
|
|
|
|
|
|
| ||
Rhall Terminais Ltda | 6,170 |
| 1,733 |
| (1,208) | — | — |
| — |
| 6,695 |
| — | ||
Termag - Terminal Marítimo de Guarujá S.A. | 6,018 |
| (4,437) |
| — | — | — |
| — |
| 1,581 |
| — | ||
TGG - Terminal de Granéis do Guarujá S.A. | 15,960 |
| 2,957 |
| (4,500) | — | — |
| — |
| 14,417 |
| — | ||
CLI Sul S.A. | 217,738 |
| 6,224 |
| (5,500) |
|
|
| — |
| 218,462 |
| — | ||
Terminal XXXIX S.A. | 66,415 |
| 20,762 |
| (13,877) | (73,300) | — |
| — |
| — |
| — | ||
Compass |
|
|
|
|
|
|
|
|
|
|
|
|
| ||
Companhia Paranaense de Gás - Compagás | 403,532 |
| 4,701 |
| (18,209) | — | — |
| 292 |
| 390,316 |
| 16,903 | ||
Companhia de Gás de Santa Catarina - Scgás | 640,332 |
| 16,254 |
| (22,759) | — | — |
| — |
| 633,827 |
| 3,377 | ||
CEG Rio S.A. | 288,386 |
| 30,699 |
| (61,829) | — | — |
| — |
| 257,256 |
| 82,537 | ||
Companhia de Gás de Mato Grosso do Sul - Msgás | 297,874 |
| 5,820 |
| (21,146) | — | — |
| — |
| 282,548 |
| 11,732 | ||
Corporate |
|
|
|
|
|
|
|
|
|
|
|
|
| ||
Vale S.A (ii) | 15,662,485 |
| 1,210,102 |
| (577,469) | — | (2,462,833) |
| (55,156) |
| 13,777,129 |
| — | ||
Other | 6,459 |
| (20) |
| — | — | — |
| 548 |
| 6,987 |
| — | ||
| 17,611,369 |
| 1,294,795 |
| (726,497) | (73,300) | (2,462,833) |
| (54,316) |
| 15,589,218 |
| 114,549 |
| (i) | Dividends receivable by the controlling companies of the subsidiaries disclosed in the table, which are consolidated in Cosan S.A. | |
| (ii) | Vale's equity calculation for the second quarter was impacted by the positive amount of R$190,700 related to transactions with non-controlling shareholders that moved the entity's shareholders' equity, which by accounting policy choice the Company brings the effect via equity in the result of the period. |
Notes to the interim Financial Statements
(In thousands of Reais, except when otherwise indicated)
Below is summarized financial information for each subsidiary that has non-controlling interests that are material to the group. The amounts disclosed for each subsidiary are before intercompany eliminations.
| Shares issued by the subsidiary |
| Shares held by non-controlling shareholders |
| Non-controlling interest |
Radar |
|
|
|
|
|
Tellus Brasil Participações S.A. | 119,063,044 |
| 95,250,435 |
| 80.00% |
Janus Brasil Participações S.A. | 286,370,051 |
| 229,096,041 |
| 80.00% |
Duguetiapar Empreendimentos e Participações S.A. | 3,573,842 |
| 2,859,074 |
| 80.00% |
Gamiovapar Empreendimentos e Participações S.A. | 12,912,970 |
| 10,330,376 |
| 80.00% |
Radar Propriedades Agrícolas S.A. | 737,500 |
| 368,750 |
| 50.00% |
Nova Agrícola Ponte Alta S.A. | 160,693,378 |
| 80,346,689 |
| 50.00% |
Terras da Ponte Alta S.A. | 16,066,329 |
| 8,033,165 |
| 50.00% |
Nova Santa Bárbara Agrícola S.A. | 32,336,994 |
| 16,168,497 |
| 50.00% |
Nova Amaralina S.A. | 30,603,159 |
| 15,301,580 |
| 50.00% |
Paineira Propriedades Agrícolas S.A. | 132,667,061 |
| 66,333,531 |
| 50.00% |
Manacá Propriedades Agrícolas S.A. | 128,977,921 |
| 64,488,961 |
| 50.00% |
Castanheira Propriedades Agrícolas S.A. | 83,850,938 |
| 41,925,469 |
| 50.00% |
Radar II Propriedades Agrícolas S.A. | 81,440,221 |
| 40,720,111 |
| 50.00% |
Rumo |
|
|
|
|
|
Rumo S.A. | 1,854,868,949 |
| 1,287,383,261 |
| 69.59% |
Moove |
|
|
|
|
|
Moove Lubricants Holdings | 34,963,764 |
| 10,489,129 |
| 30.00% |
Cosan Corporate |
|
|
|
|
|
Cosan Nove Participações S.A. | 7,663,761,735 |
| 2,062,583,640 |
| 26.91% |
Cosan Limited Partners Brasil Consultoria Ltda. | 160,000 |
| 3,000 |
| 1.88% |
Cosan Dez Participações S.A. | 3,473,458,687 |
| 805,963,829 |
| 23.20% |
Notes to the interim Financial Statements
(In thousands of Reais, except when otherwise indicated)
The following table summarizes information relating to each of the Company's subsidiaries that has material non-controlling interests, prior to any intra-group elimination.
At January 1, 2024 |
| Interest in earnings of subsidiaries |
| Capital reduction |
| Other comprehensive income |
| Dividends |
| Other |
| At June 30, 2024 | |
Compass |
|
|
|
|
|
|
|
|
|
|
|
|
|
Comgás | 32,145 |
| 7,098 |
| — |
| — |
| (9,926) |
| — |
| 29,317 |
Commit Gás S.A. | 1,562,500 |
| 67,830 |
| — |
| — |
| — |
| 143 |
| 1,630,473 |
Norgás S.A. | 372,030 |
| — |
| — |
| — |
| — |
| — |
| 372,030 |
Biometano Verde Paulínia S.A | 237,981 |
| 1,100 |
| — |
| — |
| (331) |
| — |
| 238,750 |
Compass Gás e Energia | 790,672 |
| 100,965 |
| — |
| (17,367) |
| (117,496) |
| 406 |
| 757,180 |
Rumo |
|
|
|
|
|
|
|
|
|
|
|
|
|
Rumo S.A. | 11,104,589 |
| (956,015) |
| — |
| (42) |
| (1,673) |
| 9,700 |
| 10,156,559 |
Moove |
|
|
|
|
|
|
|
|
|
|
|
|
|
Moove Lubricants Holdings | 695,848 |
| 109,055 |
| — |
| 15,804 |
| (270,000) |
| 6,884 |
| 557,591 |
Cosan Corporate |
|
|
|
|
|
|
|
|
|
|
|
|
|
Cosan Limited Partners Brasil | 7 |
| (2) |
| — |
| — |
| — |
| — |
| 5 |
Cosan Nove Participações S.A. | 2,567,019 |
| 15,384 |
| — |
| 13,318 |
| (65,000) |
| 3,764 |
| 2,534,485 |
Cosan Dez Participações S.A. | 1,512,041 |
| 242,471 |
| — |
| (29,796) |
| (603,022) |
| (127) |
| 1,121,567 |
Radar |
|
|
|
|
|
|
|
|
|
|
|
|
|
Janus Brasil Participações S.A. | 4,743,201 |
| 44,358 |
| — |
| — |
| (37,202) |
| — |
| 4,750,357 |
Tellus Brasil Participações S.A. | 3,156,328 |
| 36,245 |
| (10,153) |
| — |
| (77,706) |
| — |
| 3,104,714 |
Gamiovapar Empreendimentos e Participações S.A. | 472,244 |
| 6,245 |
| — |
| — |
| (9,601) |
| — |
| 468,888 |
Duguetiapar Empreendimentos e Participações S.A. | 66,715 |
| 1,005 |
| (10,238) |
| — |
| — |
| — |
| 57,482 |
Radar II Propriedades Agrícolas S.A. | 1,089,154 |
| 14,654 |
| (238) |
| — |
| (17,675) |
| — |
| 1,085,895 |
Radar Propriedades Agrícolas S.A. | 204,444 |
| 4,276 |
| — |
| — |
| (15,096) |
| — |
| 193,624 |
Nova Agrícola Ponte Alta S.A. | 417,013 |
| 4,906 |
| — |
| — |
| (4,767) |
| — |
| 417,152 |
Nova Amaralina S.A. Propriedades Agrícolas | 29,893 |
| 2,492 |
| — |
| — |
| (829) |
| — |
| 31,556 |
Nova Santa Bárbara Agrícola S.A. | 197,833 |
| 263 |
| — |
| — |
| — |
| — |
| 198,096 |
Terras da Ponte Alta S.A. | 84,251 |
| 324 |
| — |
| — |
| (415) |
| — |
| 84,160 |
Paineira Propriedades Agrícolas S.A. | 199,303 |
| 3,979 |
| — |
| — |
| (5,181) |
| — |
| 198,101 |
Manacá Propriedades Agrícolas S.A. | 199,584 |
| 3,774 |
| — |
| — |
| (6,711) |
| — |
| 196,647 |
Castanheira Propriedades Agrícolas S.A. | 291,078 |
| 2,936 |
| — |
| — |
| (7,047) |
| — |
| 286,967 |
| 30,025,873 |
| (286,657) |
| (20,629) |
| (18,083) |
| (1,249,678) |
| 20,770 |
| 28,471,596 |
Notes to the interim Financial Statements
(In thousands of Reais, except when otherwise indicated)
The movements in the investment in subsidiaries jointly in the parent company were as follows:
| Raízen S.A. |
| Radar Gestão de Invest. S.A |
| Total |
Shares issued by the joint venture | 10,352,509,484 |
| 8,800,000 |
|
|
Shares held by Cosan | 517,625,474 |
| 4,400,000 |
|
|
Cosan ownership interest | 5.01% |
| 50.00% |
|
|
At January 1, 2024 | 1,320,592 |
| — |
| 1,320,592 |
Interest in earnings of joint ventures | 5,694 |
| (642) |
| 5,052 |
Other comprehensive (losses) income | 8,132 |
| — |
| 8,132 |
Capital increase | — |
| 8,343 |
| 8,343 |
Dividends | (13,589) |
| — |
| (13,589) |
At June 30, 2024 | 1,320,829 |
| 7,701 |
| 1,328,530 |
The movements in the investment in subsidiaries together in the consolidated were as follows:
| Raízen S.A. |
| Terminal Alvorada S.A |
| Radar Gestão de Invest. S.A |
| Total |
Shares issued by the joint venture | 10,352,509,484 |
| 100,197,076 |
| 8,800,000 |
|
|
Shares held by Cosan | 4,557,597,117 |
| 50,098,538 |
| 4,400,000 |
|
|
Cosan ownership interest | 5.01% |
| 50.00% |
| 50.00% |
|
|
Percentage of indirect indirect (Cosan Nove) | 25.90% |
| — |
| — |
|
|
Total (i) | 30.91% |
| 50.00% |
| 50.00% |
|
|
At January 1, 2024 | 11,693,876 |
| 48,566 |
| — |
| 11,742,442 |
Interest in earnings of joint ventures | 50,131 |
| (2,423) |
| (642) |
| 47,066 |
Other comprehensive (losses) income | 71,600 |
| — |
| — |
| 71,600 |
Capital increase (ii) | — |
| — |
| 8,343 |
| 8,343 |
Dividends | (119,647) |
| — |
| — |
| (119,647) |
At June 30, 2024 | 11,695,960 |
| 46,143 |
| 7,701 |
| 11,749,804 |
Raízen S.A
| (i) | The Company's total interest in Raízen S.A. is made up of 5.01% direct participation and 39.12% indirect participation through Cosan Nove. The disclosed percentage of 25.90% refers to the economic benefit calculated by the result of Cosan S.A's participation in its subsidiary Cosan Nove of 66.16% multiplied by the participation of 39.12%. |
| For the Company's consolidated information, direct and indirect interests are added together and the impact relating to the participation of non-controlling shareholders in Cosan Nove is shown in the result line attributed to non-controlling shareholders. | |
| The balance sheet statement and the income statement of the jointly owned subsidiary Raízen S.A. are disclosed in note 4 – Information by segment. | |
| As of June 30, 2024, the Company was in compliance with the covenants of the agreement governing the joint venture. |
Radar Gestão de Invest. S.A
| (ii) | On March 1, 2024 and June 26, 2024, the Company contributed R$4,343 and R$4,000, respectively, totaling R$8,343 to the formation of the Radar Gestão de Invest joint venture. S.A. with Nuveen Natural Capital Latam Gestora de Ativos Ltda, whose objective is the management and administration of real estate property in the Radar segment. |
Notes to the interim Financial Statements
(In thousands of Reais, except when otherwise indicated)
a) Reconciliation of carrying amount:
| Consolidated |
| Parent Company | ||||||||||||
| Land, buildings and improvements |
| Machines, equipment and installations |
| Wagons and locomotives (i) |
| Permanent easement |
| Construction in progress |
| Other assets |
| Total |
| Total |
Cost |
|
|
|
|
|
|
|
|
|
|
|
|
|
|
|
At January 1, 2024 | 2,217,585 |
| 2,099,263 |
| 8,698,521 |
| 12,852,330 |
| 4,785,955 |
| 738,737 |
| 31,392,391 |
| 83,446 |
Additions | 5,421 |
| 2,301 |
| 577 |
| — |
| 2,358,309 |
| 2,340 |
| 2,368,948 |
| 294 |
Write-offs | (132) |
| (15,581) |
| (490,350) |
| (193,716) |
| (31,939) |
| (5,114) |
| (736,832) |
| (7) |
Transfers (ii) | 269,127 |
| 1,178,032 |
| 747,216 |
| 505,221 |
| (2,675,456) |
| 31,688 |
| 55,828 |
| (16) |
Exchange differences | 28,662 |
| 54,295 |
| — |
| — |
| 3,790 |
| 36,950 |
| 123,697 |
| — |
At June 30, 2024 | 2,520,663 |
| 3,318,310 |
| 8,955,964 |
| 13,163,835 |
| 4,440,659 |
| 804,601 |
| 33,204,032 |
| 83,717 |
Depreciation |
|
|
|
|
|
|
|
|
|
|
|
|
|
|
|
At January 1, 2024 | (626,951) |
| (907,235) |
| (3,866,953) |
| (4,510,495) |
| (13,379) |
| (227,404) |
| (10,152,417) |
| (43,629) |
Additions | (31,609) |
| (100,402) |
| (324,792) |
| (470,478) |
| — |
| (32,834) |
| (960,115) |
| (4,129) |
Write-offs | - |
| 15,041 |
| 444,171 |
| 4,479 |
| — |
| 4,652 |
| 468,343 |
| — |
Transfers (ii) | 5,400 |
| (7,361) |
| (68,337) |
| - |
| — |
| 2,181 |
| (68,117) |
| — |
Exchange differences | (7,732) |
| (21,018) |
| — |
| — |
| — |
| (18,956) |
| (47,706) |
| — |
Impairment | - |
| (213,621) |
| (711,567) |
| (893,360) |
| (401,513) |
| (3,704) |
| (2,223,765) |
| — |
At June 30, 2024 | (660,892) |
| (1,234,596) |
| (4,527,478) |
| (5,869,854) |
| (414,892) |
| (276,065) |
| (12,983,777) |
| (47,758) |
At January 1, 2024 | 1,590,634 |
| 1,192,028 |
| 4,831,568 |
| 8,341,835 |
| 4,772,576 |
| 511,333 |
| 21,239,974 |
| 39,817 |
At June 30, 2024 | 1,859,771 |
| 2,083,714 |
| 4,428,486 |
| 7,293,981 |
| 4,025,767 |
| 528,536 |
| 20,220,255 |
| 35,959 |
| (i) | As of June 30, 2024, assets, mainly wagons and locomotives in the amount of R$1,390,404 (R$1,390,404 as of December 31, 2023), were pledged to guarantee bank loans. | |
| (ii) | Transfers of property, plant and equipment resulting from capitalization and other reclassifications of those assets. |
Notes to the interim Financial Statements
(In thousands of Reais, except when otherwise indicated)
b) Capitalization of borrowing costs
In the period ended June 30, 2024, the borrowing costs capitalized by the subsidiary Rumo were R$29,699 at an average rate of 11.23% (R$25,168 and 12.49% p.a. on June 30, 2023), while in the subsidiary Compass the capitalized costs were R$39,617 at a weighted average rate of 7.36% p.a. (R$53,963 and 8.92% p.a. in the period ended June 30, 2023).
c) Write-off of assets and impairment loss of indirect subsidiary Rumo Malha Sul
As mentioned in note 2 Material events, the subsidiary Rumo identified the residual value of the assets with traffic directly interrupted by the weather events and provisioned the amount of R$2,392,776 (note 21), considering that the assets were destroyed or their use was made impossible for an indefinite period.
The extent of the damage raises uncertainties about the process of renewing the concession, which initially expires in February 2027, although Rumo continues to make its best efforts in this regard.
In this context, in the quarter ended June 30, 2024 and in accordance with Circular Letter No. 01/2024-CVM/SNC/SEP, Management identified the existence of indications that led to the realization of the recoverability test of the non-current assets (fixed assets, intangibles and rights of use) of the cash-generating unit of the subsidiary Rumo ("Rumo Malha Sul"), considering the event described above and the term of use of the assets.
For this assessment, the recoverable value of the unit was determined based on its value in use, obtained by discounted cash flow, based on updated projections approved by management. The main assumptions were:
- Projection period: until February 2027.
- Sales volume: a fall of 2.1% is expected in the indirect subsidiary Malha Sul in 2025, followed by annual growth of 0.9% over the rest of the period, based on management's expectations for market development.
- Selling price: considers the average annual growth rate of 3.1%, and is based on current industry trends and includes inflation forecasts for Brazil.
- Variable costs and maintenance: included according to history and without capacity increases.
- Projected investments: refer to the maintenance of the Concession and are based on the historical experience of the management of the subsidiary Rumo. Investments do not include capacity increases. No incremental revenue or cost savings were considered in the value-in-use model as a result of this expenditure.
- The nominal discount rate of 11.22%, estimated by the weighted average cost of capital.
On June 30, 2024, the value in use of the cash-generating unit of the subsidiary Rumo (R$980,352) is less than the book value of its property, plant and equipment, intangible assets and rights of use by R$2,392,776, and a provision for impairment was recorded, allocated as follows: R$2,223,765 in Property, plant and equipment, R$3,972 in Intangible assets (note 11.2) and R$165,039 in Rights of use (note 11.4).
Notes to the interim Financial Statements
(In thousands of Reais, except when otherwise indicated)
| Consolidated |
| Parent Company | ||||||||||||||
| Goodwill |
| Concession right |
| Licenses |
| Brands and patents |
| Customer relationships |
| Other |
| Supply Agreement |
| Total |
| Total |
Cost |
|
|
|
|
|
|
|
|
|
|
|
|
|
|
|
|
|
At January 1, 2024 | 1,391,974 |
| 24,297,484 |
| 243,044 |
| 155,480 |
| 2,630,947 |
| 635,380 |
| 574,363 |
| 29,928,672 |
| 22,356 |
Additions | — |
| 3,444 |
| — |
| — |
| 37,395 |
| 29,404 |
| — |
| 70,243 |
| 2,196 |
Write-offs | — |
| (125,025) |
| — |
| — |
| (79) |
| — |
| — |
| (125,104) |
| — |
Transfers (i) | — |
| 703,783 |
| (509) |
| — |
| — |
| 13,840 |
| — |
| 717,114 |
| 16 |
Assets held for sale | 97,917 |
| 6,109 |
| — |
| 20,973 |
| 209,164 |
| 13,266 |
| — |
| 347,429 |
| — |
At June 30, 2024 | 1,489,891 |
| 24,885,795 |
| 242,535 |
| 176,453 |
| 2,877,427 |
| 691,890 |
| 574,363 |
| 30,938,354 |
| 24,568 |
|
|
|
|
|
|
|
|
|
|
|
|
|
|
|
|
|
|
Amortization |
|
|
|
|
|
|
|
|
|
|
|
|
|
|
|
|
|
At January 1, 2024 | — |
| (5,476,918) |
| (63,216) |
| (9,201) |
| (1,288,556) |
| (440,494) |
| — |
| (7,278,385) |
| (15,493) |
Additions | — |
| (455,020) |
| (240) |
| — |
| (110,462) |
| (21,196) |
| — |
| (586,918) |
| (653) |
Write-offs | — |
| 77,341 |
| — |
| — |
| — |
| — |
| — |
| 77,341 |
| — |
Transfers (i) | — |
| — |
| — |
| — |
| — |
| (759) |
| — |
| (759) |
| — |
Exchange differences | — |
| (6,108) |
| — |
| — |
| (42,446) |
| (1,088) |
| — |
| (49,642) |
| — |
Impairment | — |
| — |
| — |
| — |
| — |
| (3,972) |
| — |
| (3,972) |
|
|
At June 30, 2024 | — |
| (5,860,705) |
| (63,456) |
| (9,201) |
| (1,441,464) |
| (467,509) |
| — |
| (7,842,335) |
| (16,146) |
At January 1, 2024 | 1,391,974 |
| 18,820,566 |
| 179,828 |
| 146,279 |
| 1,342,391 |
| 194,886 |
| 574,363 |
| 22,650,287 |
| 6,863 |
At June 30, 2024 | 1,489,891 |
| 19,025,090 |
| 179,079 |
| 167,252 |
| 1,435,963 |
| 224,381 |
| 574,363 |
| 23,096,019 |
| 8,422 |
| (i) | The number of transfers also includes a portion of R$50,309 of intangible assets that was reclassified to financial assets (R$78,366, period ended June 30, 2023). |
Notes to the interim Financial Statements
(In thousands of Reais, except when otherwise indicated)
a) Amortization methods and useful lives:
Intangible assets (except goodwill) |
| Annual amortization rate | 06/30/2024 |
| 12/31/2023 | |
Concession rights: |
|
|
|
|
| |
Compass (i) |
| From 3.54% to 4.58% | 12,572,492 |
| 12,307,964 | |
Rumo (ii) |
| 1.59% | 6,452,598 |
| 6,512,602 | |
|
|
| 19,025,090 |
| 18,820,566 | |
Licenses and authorizations |
|
|
|
|
| |
Operating license for port terminal |
| 3.70% | 47,101 |
| 47,610 | |
Moove |
| 5.00% | 131,978 |
| 132,218 | |
|
|
| 179,079 |
| 179,828 | |
Trademarks |
|
|
|
|
| |
Comma |
| Indefinity | 53,636 |
| 47,015 | |
Petrochoice (iii) |
| Indefinity | 111,178 |
| 96,826 | |
Tirreno (iii) |
| Indefinity | 2,438 |
| 2,438 | |
|
|
| 167,252 |
| 146,279 | |
Customers relationship |
|
|
|
|
| |
Compass |
| 20.00% | 249,020 |
| 280,111 | |
Moove (iii) |
| 5% to 30% | 1,186,943 |
| 1,062,280 | |
|
|
| 1,435,963 |
| 1,342,391 | |
Supply Agreement |
|
|
|
|
| |
Compass |
| 5.00% | 574,363 |
| 574,363 | |
|
|
| 574,363 |
| 574,363 | |
Other |
|
|
|
|
| |
Software license |
| 20.00% | 185,677 |
| 90,162 | |
Other |
| 20.00% | 38,704 |
| 104,724 | |
|
|
| 224,381 |
| 194,886 | |
Total |
|
| 21,606,128 |
| 21,258,313 |
| (i) | Intangible asset of the public gas distribution service concession, which represents the right to charge users for the supply of gas, comprising: (i) the concession rights recognized in the business combination and (ii) the assets of the concession; | |
| (ii) | Refers to Rumo's railway concession agreement. The amount will be amortized until the end of the concession in 2079; | |
| (iii) | Authorization for: (i) lubrication and contamination control solutions, (ii) production and commercialization of lubricating oils, additives and fluids. |
| Compass |
| Moove |
| Total |
At January 1, 2024 | 1,041,421 |
| 10,684 |
| 1,052,105 |
Additions | 701,184 |
| 11,834 |
| 713,018 |
Write-offs | — |
| (11,318) |
| (11,318) |
Transfers (i) | (755,048) |
| — |
| (755,048) |
At June 30, 2024 | 987,557 |
| 11,200 |
| 998,757 |
| (i) | The number of transfers also includes a portion of the intangible asset that was reclassified to a financial asset. |
Notes to the interim Financial Statements
(In thousands of Reais, except when otherwise indicated)
During the period ended June 30, 2024, through its subsidiaries, R$60,282 was added related to the capitalization of internally generated labor (R$58,674 in the period ended June 30, 2023), through the capitalization of labor.
a) Capitalization of borrowing costs
During the period ended June 30, 2024, the indirect subsidiary Comgás capitalized R$39,320 at a weighted average rate of 10.32% p.a. (R$39,113 and 12.69% in the period ended June 30, 2023).
During the period ended June 30, 2024, the indirect subsidiary Sulgás capitalized R$929 at a weighted average rate of 9.87% p.a. (R$285 at 5.64% p.a. in the period ended June 30, 2023).
| Consolidated |
| Parent company | ||||||||||||||
| Land, buildings and improvements |
| Machine, equipment, and installations |
| Wagons and locomotives |
| Software |
| Vehicles |
| Floating storage and regasification |
| Railway and port infrastructure |
| Total |
| Total |
Cost |
|
|
|
|
|
|
|
|
|
|
|
|
|
|
|
|
|
At January 1, 2024 | 524,894 |
| 521,120 |
| 943,428 |
| 85,949 |
| 60,164 |
| 1,533,969 |
| 8,096,285 |
| 11,765,809 |
| 42,655 |
Additions | 27,176 |
| 15,189 |
| — |
| — |
| 36,913 |
| — |
| 671,294 |
| 750,572 |
| — |
Contractual readjustments | (541) |
| 768 |
| 9,412 |
| 1,771 |
| 2 |
| — |
| 22,100 |
| 33,512 |
| — |
Write-offs | (2,006) |
| (551) |
| — |
| — |
| (1,617) |
| — |
| (2,624) |
| (6,798) |
| — |
Exchange differences | 32,915 |
| 3,629 |
| — |
| — |
| 5,829 |
| — |
| — |
| 42,373 |
| — |
At June 30, 2024 | 582,438 |
| 540,155 |
| 952,840 |
| 87,720 |
| 101,291 |
| 1,533,969 |
| 8,787,055 |
| 12,585,468 |
| 42,655 |
|
|
|
|
|
|
|
|
|
|
|
|
|
|
|
|
|
|
Amortization |
|
|
|
|
|
|
|
|
|
|
|
|
|
|
|
|
|
At January 1, 2024 | (195,073) |
| (146,748) |
| (468,555) |
| (25,354) |
| (34,737) |
| (38,349) |
| (1,343,475) |
| (2,252,291) |
| (20,455) |
Additions | (38,141) |
| (24,140) |
| (9,412) |
| (1,117) |
| (5,987) |
| (38,349) |
| (180,074) |
| (297,220) |
| (2,987) |
Write-offs | 554 |
| 247 |
| (2,761) |
| — |
| 1,608 |
| — |
| — |
| (352) |
| — |
Exchange differences | (11,835) |
| (2,350) |
| — |
| — |
| (1,421) |
| — |
| — |
| (15,606) |
| — |
Impairment | — |
| — |
| — |
| — |
| — |
| — |
| (165,039) |
| (165,039) |
| — |
At June 30, 2024 | (244,495) |
| (172,991) |
| (480,728) |
| (26,471) |
| (40,537) |
| (76,698) |
| (1,688,588) |
| (2,730,508) |
| (23,442) |
At January 1, 2024 | 329,821 |
| 374,372 |
| 474,873 |
| 60,595 |
| 25,427 |
| 1,495,620 |
| 6,752,810 |
| 9,513,518 |
| 22,200 |
At June 30, 2024 | 337,943 |
| 367,164 |
| 472,112 |
| 61,249 |
| 60,754 |
| 1,457,271 |
| 7,098,467 |
| 9,854,960 |
| 19,213 |
| Investment properties |
At January 1, 2024 | 15,976,126 |
Additions | 3,476 |
Transfers (i) | (163,507) |
At June 30, 2024 | 15,816,095 |
| (i) | Transfer of farm Vista Alegre, from subsidiary Jequitibá Propriedades Agrícolas Ltda, to assets held for sale (Note 8) and subsequently sold on July 19, 2024 as mentioned in note 25. |
Notes to the interim Financial Statements
(In thousands of Reais, except when otherwise indicated)
Considering the current gas supply contracts, the subsidiaries have financial commitment that totaled an estimated present value of R$45,406,822, the amount of which includes the minimum volume established in the contract, both in commodities and in transportation, with a term until December 2034.
The sub-concession agreements for which Rumo, through its subsidiaries, generally include commitments to execute investments with certain characteristics during the term of the agreement. We can highlight:
| (i) | The amendment to renew the Malha Paulista concession, which provides for the execution throughout the concession of a set of investment projects to increase capacity and reduce urban conflicts, estimated by the agency at R$6,100,000 (value updated until December 2017). Of this amount, around R$3,000,000 make up the bond book. | |
| (ii) | The Malha Central sub concession contract provides for investments with a fixed term (from one to three years from the signing of the contract), estimated by ANTT at R$645,573. |
| 06/30/2024 |
| 12/31/2023 |
Court discussion: |
|
|
|
Rumo Malha Oeste S.A. | 2,319,904 |
| 2,206,945 |
| 2,319,904 |
| 2,206,945 |
|
|
|
|
Railroad concession: |
|
|
|
Rumo Malha Paulista S.A. | 1,128,215 |
| 1,067,256 |
| 1,128,215 |
| 1,067,256 |
|
|
|
|
Concessions and grants: |
|
|
|
Rumo Malha Sul S.A. | 72,042 |
| 76,191 |
Rumo Malha Paulista S.A. | 218,382 |
| 190,282 |
Rumo Malha Central S.A. | 28,563 |
| 24,699 |
| 318,987 |
| 291,172 |
|
|
|
|
Total | 3,767,106 |
| 3,565,373 |
|
|
|
|
Current | 154,903 |
| 250,971 |
Non-current | 3,612,203 |
| 3,314,402 |
| 3,767,106 |
| 3,565,373 |
a) Disputed lease and concession:
On July 21, 2020, Rumo filed with the National Land Transport Agency (Agência Nacional de Transportes Terrestres – “ANTT”) a request to participate in a third-party re-bidding process for the Concession Agreement entered into between Malha Oeste and the Federal Government, through the Ministry of Transport ("Rebidding Process"), in accordance with Law No. 13,448 of June 5, 2017 and Decree No. 9,957 of August 8, 2019. An amendment to the concession agreement was signed, and as a result, the economic and financial rebalancing action filed by Rumo Malha Oeste against the Union, which had a decision of origin from the lower court and was awaiting a ruling from the Federal Regional Court, was suspended by joint decision of the parties.
The total amount of judicial deposits related to the aforementioned cases is R$26,951 as of June 30, 2024 (R$26,064 as of December 31, 2023).
Notes to the interim Financial Statements
(In thousands of Reais, except when otherwise indicated)
b) Leases and grants within the scope of CPC 04/IFRS 16
| 06/30/2024 |
| 12/31/2023 |
Leases: |
|
|
|
Rumo Malha Sul S.A. | 375,479 |
| 452,701 |
Rumo Malha Paulista S.A. | 386,960 |
| 422,173 |
Rumo Malha Oeste S.A. | 106,259 |
| 131,038 |
| 868,698 |
| 1,005,912 |
Grants: |
|
|
|
Rumo Malha Paulista S.A. (renewal) | 1,678,669 |
| 919,011 |
Rumo Malha Central S.A. | 985,130 |
| 940,456 |
| 2,663,799 |
| 1,859,467 |
|
|
|
|
Total | 3,532,497 |
| 2,865,379 |
|
|
|
|
Current | 534,949 |
| 358,464 |
Non-current | 2,997,548 |
| 2,506,915 |
| 3,532,497 |
| 2,865,379 |
| Parent Company |
| Consolidated | ||||
| 06/30/2024 |
| 12/31/2023 |
| 06/30/2024 |
| 12/31/2023 |
Tax debts installments | 215,133 |
| 211,226 |
| 265,179 |
| 217,348 |
ICMS | — |
| — |
| 316,472 |
| 190,474 |
COFINS | 52,567 |
| 96,905 |
| 155,669 |
| 177,720 |
PIS | 3,019 |
| 12,951 |
| 23,148 |
| 27,073 |
Social Security charges | 59,796 |
| 62,249 |
| 83,967 |
| 87,214 |
IRRF | — |
| — |
| 11,927 |
| 14,133 |
Other | 1,121 |
| 2,082 |
| 112,602 |
| 122,998 |
Charges on action plan | — |
| — |
| 9,981 |
| — |
| 331,636 |
| 385,413 |
| 978,945 |
| 836,960 |
|
|
|
|
|
|
|
|
Current | 120,122 |
| 226,556 |
| 753,363 |
| 673,718 |
Non-current | 211,514 |
| 158,857 |
| 225,582 |
| 163,242 |
Total | 331,636 |
| 385,413 |
| 978,945 |
| 836,960 |
Notes to the interim Financial Statements
(In thousands of Reais, except when otherwise indicated)
a) Reconciliation of income tax and social contribution expenses:
| Parent Company |
| Consolidated | ||||||||||||
| 2Q24 |
| 2Q23 (Restated) |
| 6M24 |
| 6M23 (Restated) |
| 2Q24 |
| 2Q23 (Restated) |
| 6M24 |
| 6M23 (Restated) |
Income before income tax and social contribution | (723,993) |
| (1,239,614) |
| (1,386,329) |
| (2,386,702) |
| (1,078,007) |
| (929,130) |
| (830,099) |
| (543,678) |
Income tax and social contribution at nominal rate (34%) | 246,158 |
| 421,469 |
| 471,352 |
| 811,478 |
| 366,522 |
| 315,904 |
| 282,234 |
| 184,851 |
Adjustments for calculating the effective rate |
|
|
|
|
|
|
|
|
|
|
|
|
|
|
|
Equity income | 273,614 |
| (240,240) |
| 538,234 |
| (394,150) |
| 439,857 |
| 117,552 |
| 462,593 |
| 483,403 |
Result of companies abroad | (28,470) |
| (11,651) |
| (28,470) |
| (11,651) |
| (29,157) |
| (12,063) |
| (31,001) |
| (28,414) |
Operating profit | — |
| — |
| — |
| — |
| 106,270 |
| 60,937 |
| 197,306 |
| 101,746 |
Interest on equity | — |
| — |
| — |
| — |
| — |
| (1,370) |
| — |
| (1,320) |
Goodwill amortization effect |
|
|
|
| — |
| — |
| 317 |
| — |
| 635 |
| — |
Permanent differences (donations, gifts, etc.) | — |
| — |
| — |
| — |
| (6,892) |
| (1,190) |
| (8,783) |
| (4,983) |
Unrecognized tax losses and temporary differences | — |
| — |
| — |
| — |
| (866,940) |
| (68,356) |
| (934,090) |
| (115,328) |
ICMS benefit - extemporaneous | — |
| — |
| — |
| — |
| 24,635 |
| 597 |
| 25,645 |
| 6,122 |
ICMS benefit - current year | — |
| — |
| — |
| — |
| (5,614) |
| — |
| (521) |
| 68,409 |
Dividend income | — |
| — |
| — |
| — |
| — |
| — |
| — |
| 136,936 |
Provision for non-realization of the benefit of the covenant Federative | — |
| — |
| — |
| — |
| 885 |
| 15,940 |
| 885 |
| (1,171,810) |
Provision for non-realization of the benefit of the covenant Federal - Interest and Fine | — |
| — |
| — |
| — |
| 18,205 |
| (41,155) |
| 25,851 |
| (142,290) |
Selic on indebtedness | 5,913 |
| 2,482 |
| 9,957 |
| 9,501 |
| 17,843 |
| 11,503 |
| 36,984 |
| 53,866 |
Rate differential | — |
| — |
| — |
| — |
| 52,459 |
| 66,412 |
| 52,459 |
| 69,614 |
Benefit Membership Program Zero Litigation | — |
| 19,710 |
| — |
| 19,710 |
| — |
| 23,276 |
| — |
| 23,276 |
Other | (330) |
| (340) |
| (24,026) |
| (500) |
| (9,868) |
| (21,505) |
| 13,963 |
| (1,781) |
Income tax and social contribution (current and deferred) | 496,885 |
| 191,430 |
| 967,047 |
| 434,388 |
| 108,522 |
| 466,482 |
| 124,160 |
| (337,703) |
|
|
|
|
|
|
|
|
|
|
|
|
|
|
|
|
Effective rate - % | (68.63%) |
| (15.44%) |
| (69.76%) |
| (18.20%) |
| (10.07%) |
| (50.21%) |
| (14.96%) |
| 62.11% |
Notes to the interim Financial Statements
(In thousands of Reais, except when otherwise indicated)
b) Deferred income tax assets and liabilities
Parent Company | Consolidated | ||||||
| 06/30/2024 |
| 12/31/2023 |
| 06/30/2024 |
| 12/31/2023 |
Deferred tax assets from: |
|
|
|
|
|
|
|
Income taxes losses | 1,357,267 |
| 945,685 |
| 3,214,345 |
| 2,714,996 |
Negative base of social contribution | 489,151 |
| 340,981 |
| 1,117,678 |
| 929,055 |
Temporary differences |
|
|
|
|
|
|
|
Foreign exchange variation - Loans and financing | 1,796,496 |
| 1,165,734 |
| 2,031,869 |
| 1,292,954 |
Provision for lawsuits | 92,663 |
| 95,780 |
| 253,343 |
| 218,881 |
Impairment provision (Rumo Malha Oeste) | — |
| — |
| 23,961 |
| 27,072 |
Post-employment benefit obligation | — |
| — |
| 152,564 |
| 150,336 |
Provisions for uncertain tax credits and tax losses | — |
| — |
| 39,982 |
| 34,511 |
Provision for non-occurrence of taxes | 2,580 |
| 6,985 |
| 68,502 |
| 73,641 |
Share-based payment transactions | 77,271 |
| 64,065 |
| 185,690 |
| 157,825 |
Lease | 2,437 |
| 2,497 |
| 241,515 |
| 161,840 |
Unrealized loss with derivatives | — |
| 165,978 |
| 537,382 |
| 823,286 |
Provisions for profit sharing | 23,132 |
| 36,020 |
| 95,581 |
| 159,994 |
Business Combination – Intangible | — |
| — |
| 123,981 |
| 124,379 |
Business combination – Fixed assets fixed assets | — |
| — |
| 1,854 |
| 24,795 |
Other provisions | 140,857 |
| — |
| 726,790 |
| 691,162 |
Deferred on pre-operating income | — |
| — |
| 119,985 |
| 87,454 |
Regulatory asset (liability) | — |
| — |
| 7,129 |
| 6,661 |
Other | 48,405 |
| 208,331 |
| 369,555 |
| 391,444 |
Total | 4,030,259 |
| 3,032,056 |
| 9,311,706 |
| 8,070,286 |
|
|
|
|
|
|
|
|
Deferred tax liabilities from: |
|
|
|
|
|
|
|
Temporary differences |
|
|
|
|
|
|
|
Exchange rate variation - Loans and financing | — |
| — |
| (1,764) |
| (195,232) |
Provision for lawsuits | — |
| — |
| (408) |
| (408) |
Useful life review | — |
| — |
| (489,433) |
| (456,093) |
Business combination – fixed assets | — |
| — |
| (154,904) |
| (148,872) |
Tax goodwill | — |
| — |
| (625,427) |
| (618,758) |
Unrealized income with derivatives | (20,061) |
| — |
| (369,469) |
| (299,965) |
Fair value adjustment on debt | — |
| — |
| (533,849) |
| (281,784) |
Marketable securities | — |
| — |
| — |
| (77,437) |
Investment properties | — |
| — |
| (455,880) |
| (455,773) |
Goods intended for sale | — |
| — |
| (10,546) |
| (10,546) |
Effects on the formation of joint ventures | (103,268) |
| (103,992) |
| (168,394) |
| (103,992) |
Business Combination - Intangible | — |
| — |
| (4,363,571) |
| (4,426,881) |
Post-employment obligations | — |
| — |
| (4,641) |
| (4,641) |
Lease | — |
| — |
| (10,213) |
| (10,034) |
Provisions | — |
| — |
| — |
| (449,153) |
Other (i) | (458,791) |
| (449,153) |
| (698,761) |
| (147,120) |
Total | (582,120) |
| (553,145) |
| (7,887,260) |
| (7,686,689) |
Total deferred taxes recorded | 3,448,139 |
| 2,478,911 |
| 1,424,446 |
| 383,597 |
Deferred tax assets | 3,448,139 |
| 2,478,911 |
| 6,673,747 |
| 5,609,030 |
Deferred tax liabilities | — |
| — |
| (5,249,301) |
| (5,225,433) |
Total deferred, net | 3,448,139 |
| 2,478,911 |
| 1,424,446 |
| 383,597 |
Below are presented the tax effects of temporary differences that give rise to significant parts of the company's deferred tax assets and liabilities:
| (i) | Refers mainly to the tax loss recognized on the capital contribution in a controlled company. |
Notes to the interim Financial Statements
(In thousands of Reais, except when otherwise indicated)
Deferred income tax and social contribution inactivated
As of June 30, 2024, the balance of inactivated income tax and social contribution is R$3,531,797 (R$2,678,299 as of December 31, 2023) and refers mainly to tax losses and temporary differences of the subsidiary Rumo S.A, of the indirect subsidiaries Rumo Malha Sul and Rumo Malha Oeste, which under current conditions do not meet the requirements for the accounting of said deferred income tax and social contribution asset due to the lack of predictability of future generation of taxable profits.
c) Changes in deferred tax assets and liabilities:
ASSETS | Parent Company | ||||||||||||
| Tax loss and negative base |
| Employee benefits |
| Unrealized loss with derivatives |
| Provisions |
| Leases |
| Other |
| Total |
At January 1, 2024 | 1,286,666 |
| 100,085 |
| 165,978 |
| 102,765 |
| 2,497 |
| 1,374,065 |
| 3,032,056 |
Credited / charged from income for the period | 559,752 |
| 318 |
| (165,978) |
| 133,335 |
| (60) |
| (159,926) |
| 367,441 |
Foreign exchange differences | — |
| — |
| — |
| — |
| — |
| 630,762 |
| 630,762 |
At June 30, 2024 | 1,846,418 |
| 100,403 |
| — |
| 236,100 |
| 2,437 |
| 1,844,901 |
| 4,030,259 |
LIABILITY | Parent Company |
|
| ||||
| Effects on the formation of joint venture |
| Other |
| Unrealized result with derivatives |
| Total |
At January 1, 2024 | (103,992) |
| (449,153) |
| — |
| (553,145) |
Credited / charged from income for the period | 724 |
| (7,970) |
| (20,061) |
| (27,307) |
Recognized in shareholders' equity | — |
| (1,668) |
| — |
| (1,668) |
At June 30, 2024 | (103,268) |
| (458,791) |
| (20,061) |
| (582,120) |
|
|
|
|
|
|
|
|
Total deferred taxes recognized |
|
|
|
|
| 3,448,139 | |
Assets:
| Consolidated | ||||||||||||||||
| Tax loss and negative basis |
| Post-employment obligations |
| Employee benefits |
| Provisions |
| Leases |
| Unrealized gains on derivatives |
| Intangible assets |
| Other |
| Total |
At January 1, 2024 | 3,644,051 |
| 150,336 |
| 317,819 |
| 1,045,267 |
| 161,840 |
| 823,286 |
| 124,379 |
| 1,803,308 |
| 8,070,286 |
Credited / charged from income for the period | 687,972 |
| 2,228 |
| (36,548) |
| 67,311 |
| 1,915 |
| (290,193) |
| (398) |
| (11,831) |
| 420,456 |
Recognized in shareholders' equity | — |
| — |
| — |
| — |
| 77,760 |
| 4,289 |
| — |
| — |
| 82,049 |
Foreign exchange differences | — |
| — |
| — |
| — |
| — |
| — |
| — |
| 738,915 |
| 738,915 |
At June 30, 2024 | 4,332,023 |
| 152,564 |
| 281,271 |
| 1,112,578 |
| 241,515 |
| 537,382 |
| 123,981 |
| 2,530,392 |
| 9,311,706 |
| 82 |
Notes to the interim Financial Statements
(In thousands of Reais, except when otherwise indicated)
Liabilities:
| Consolidated | ||||||||||||||||||
| Effects on the formation of joint ventures |
| Post-employment obligations |
| Intangible assets |
| Unrealized gains on derivatives |
| Property, plant and equipment |
| Fair value adjustment |
| Leases |
| Provisions |
| Other |
| Total |
At January 1, 2024 | (103,992) |
| (4,641) |
| (4,426,881) |
| (299,965) |
| (456,093) |
| (281,784) |
| (10,034) |
| (449,561) |
| (1,653,738) |
| (7,686,689) |
Credited / charged from income for the period | (64,402) |
| — |
| 63,310 |
| (69,504) |
| (33,340) |
| (252,065) |
| (179) |
| 449,153 |
| (300,268) |
| (207,295) |
Recognized in shareholders' equity | — |
| — |
| — |
| — |
| — |
| — |
| — |
| — |
| 6,724 |
| 6,724 |
At June 30, 2024 | (168,394) |
| (4,641) |
| (4,363,571) |
| (369,469) |
| (489,433) |
| (533,849) |
| (10,213) |
| (408) |
| (1,947,282) |
| (7,887,260) |
|
|
|
|
|
|
|
|
|
|
|
|
|
|
|
|
|
|
|
|
Total deferred taxes recorded |
|
|
|
|
|
|
|
|
|
|
|
|
|
|
|
|
| 1,424,446 | |
As of June 30, 2024 and December 31, 2023, the Corporation had contingent liabilities and judicial deposits pertaining to:
|
| ||||||
| Provision for lawsuits | ||||||
| Parent Company |
| Consolidated | ||||
| 06/30/2024 |
| 12/31/2023 |
| 06/30/2024 |
| 12/31/2023 |
Tax | 257,960 |
| 272,063 |
| 808,246 |
| 813,732 |
Civil, environmental and regulatory (i) | 80,407 |
| 73,744 |
| 600,348 |
| 512,979 |
Labor | 53,559 |
| 55,286 |
| 465,396 |
| 387,692 |
| 391,926 |
| 401,093 |
| 1,873,990 |
| 1,714,403 |
| (i) | In the period ended June 30, 2024, we highlight the judgment in the second instance of a lawsuit inherent to the Public Services Regulatory Agency of the State of São Paulo (ARSESP) in the amount of R$12,583, as well as an agreement entered into with the São Paulo City Hall to resolve administrative/judicial disputes and the second-degree judgments in lawsuits involving the Municipality of São Paulo and the Consumer Protection and Defense Foundation (PROCON-SP), respectively in the amount of R$23,568, offset by write-offs for payments/reversals in the period, through its subsidiary Comgás. |
| Judicial deposit | ||||||
| Parent Company |
| Consolidated | ||||
| 06/30/2024 |
| 12/31/2023 |
| 06/30/2024 |
| 12/31/2023 |
Tax (i) | 383,963 |
| 373,779 |
| 774,878 |
| 652,236 |
Civil, environmental and regulatory | 15,157 |
| 16,126 |
| 128,608 |
| 114,724 |
Labor | 13,436 |
| 13,584 |
| 127,468 |
| 128,941 |
| 412,556 |
| 403,489 |
| 1,030,954 |
| 895,901 |
| (i) | On January 31, 2024, its subsidiary Comgás made judicial deposits in the amount of R$90,410 in a lawsuit to discuss the deductibility, from the IRPJ and CSLL calculation basis, of default interest on tax debts |
Notes to the interim Financial Statements
(In thousands of Reais, except when otherwise indicated)
Changes in provisions for lawsuits:
| Parent Company | ||||||
| Tax |
| Civil, environmental, and regulatory |
| Labor |
| Total |
At December 31, 2023 | 272,063 |
| 73,744 |
| 55,286 |
| 401,093 |
Provisioned in the period | 14,522 |
| 3,228 |
| 618 |
| 18,368 |
Write-offs by reversal / payment | (17,913) |
| (4,154) |
| (2,792) |
| (24,859) |
Interest (i) | (10,712) |
| 7,589 |
| 447 |
| (2,676) |
At June 30, 2024 | 257,960 |
| 80,407 |
| 53,559 |
| 391,926 |
| Consolidated | ||||||
| Tax |
| Civil, environmental, and regulatory |
| Labor |
| Total |
At December 31, 2023 | 813,732 |
| 512,979 |
| 387,692 |
| 1,714,403 |
Provisioned in the period | 21,751 |
| 74,492 |
| 82,145 |
| 178,388 |
Write-offs by reversal / payment | (26,700) |
| (66,908) |
| (62,142) |
| (155,750) |
Interest (i) | (537) |
| 79,785 |
| 57,701 |
| 136,949 |
At June 30, 2024 | 808,246 |
| 600,348 |
| 465,396 |
| 1,873,990 |
(i) Includes write-off of interest due to reversal.
The Company has debts secured by assets or by means of cash deposits, bank guarantees or guarantee insurance.
The Company has probable indemnity lawsuits in addition to those mentioned, and as they represent contingent assets, they were not reported.
a) Probable losses
Tax: The main tax proceedings for which the risk of loss is probable are described below:
| Parent Company |
| Consolidated | ||||
| 06/30/2024 |
| 12/31/2023 |
| 06/30/2024 |
| 12/31/2023 |
Compensation with FINSOCIAL | — |
| — |
| 331,828 |
| 326,220 |
INSS | 79,275 |
| 77,254 |
| 103,281 |
| 100,149 |
ICMS credit | 80,776 |
| 99,864 |
| 149,974 |
| 174,860 |
PIS and COFINS | 33,510 |
| 32,832 |
| 33,843 |
| 33,244 |
IPI | 57,302 |
| 56,638 |
| 64,146 |
| 63,358 |
IRPJ and CSLL | 1,117 |
| 1,102 |
| 7,245 |
| 10,698 |
Other | 5,980 |
| 4,373 |
| 117,929 |
| 105,203 |
| 257,960 |
| 272,063 |
| 808,246 |
| 813,732 |
- Labor claims: The Company and its subsidiaries are parties to labor claims filed by former employees and outsourced service providers claiming among other things, compensation and indemnities. Additionally, the Company has public civil actions filed by the Labor Prosecutor's Office regarding alleged non-compliance with labor standards, working conditions and working environment. For claims deemed to have merit, the Company has signed Conduct Adjustment Agreements with the Brazilian.
- Civil, environmental and regulatory lawsuits: The Company and its subsidiaries are involved in a number of Indemnity Lawsuits, Public Civil Actions, and Administrative Proceedings where, in the opinion of its legal counsel, the risk of loss is probable.
Notes to the interim Financial Statements
(In thousands of Reais, except when otherwise indicated)
b) Possible losses
The main lawsuits for which we anticipate a risk of loss as possible are outlined below:
| Parent Company |
| Consolidated | ||||
| 06/30/2024 |
| 12/31/2023 |
| 06/30/2024 |
| 12/31/2023 |
Tax | 4,961,787 |
| 4,934,309 |
| 15,968,138 |
| 15,703,294 |
Civil, environmental and regulatory | 1,095,502 |
| 1,045,171 |
| 6,417,299 |
| 7,166,011 |
Labor | 11,197 |
| 9,168 |
| 718,181 |
| 805,222 |
| 6,068,486 |
| 5,988,648 |
| 23,103,618 |
| 23,674,527 |
Tax:
| Parent Company |
| Consolidated | ||||
| 06/30/2024 |
| 12/31/2023 |
| 06/30/2024 |
| 12/31/2023 |
Isolated fine - Federal tax | — |
| — |
| 837,964 |
| 792,496 |
IRPJ/CSLL (i) | 1,302,329 |
| 1,280,245 |
| 6,628,552 |
| 6,316,155 |
ICMS -Tax on circulation of goods | 1,197,798 |
| 1,205,621 |
| 2,987,562 |
| 2,962,716 |
IRRF | 229 |
| — |
| 1,114,210 |
| 1,226,223 |
PIS and COFINS | 1,274,236 |
| 1,286,634 |
| 2,139,298 |
| 2,293,933 |
MP 470 installment of debts | 249,112 |
| 232,104 |
| 400,889 |
| 381,060 |
Stock Grant Plan | — |
| — |
| 62,195 |
| 60,863 |
IOF on loans | — |
| — |
| 188,557 |
| 154,606 |
Reward Credit Compensation | 145,221 |
| 143,322 |
| 145,221 |
| 143,322 |
IPI - Tax on industrialized products | 225,196 |
| 233,464 |
| 376,040 |
| 374,471 |
INSS | 87,137 |
| 79,019 |
| 172,369 |
| 159,007 |
Other | 480,529 |
| 473,900 |
| 915,281 |
| 838,442 |
| 4,961,787 |
| 4,934,309 |
| 15,968,138 |
| 15,703,294 |
|
|
|
|
|
|
|
|
| (i) | The Company, through its subsidiary Comgás, has notices of infraction issued by the Brazilian Federal Revenue Service regarding the disallowance of amortization of goodwill expenses based on the expectation of future profitability arising from corporate transactions. |
Except for the effect in note 15.a, related to Provision for non-realization of the benefit of the covenant Federative, we did not identify any effects of IFRIC 23 / ICPC 22 - Uncertainty about Treatment of Income Taxes that could have an impact on the accounting policies of the Company and its subsidiaries or these financial statements.
Notes to the interim Financial Statements
(In thousands of Reais, except when otherwise indicated)
Civil, environmental and regulatory:
| Parent Company |
| Consolidated | ||||
| 06/30/2024 |
| 12/31/2023 |
| 06/30/2024 |
| 12/31/2023 |
Civil | 1,033,734 |
| 983,867 |
| 3,205,251 |
| 3,184,240 |
Environmental (i) | 60,972 |
| 60,549 |
| 1,594,700 |
| 2,330,683 |
Regulatory | 796 |
| 755 |
| 1,617,348 |
| 1,651,088 |
| 1,095,502 |
| 1,045,171 |
| 6,417,299 |
| 7,166,011 |
| (i) | The subsidiary Moove was a defendant in a Public Civil Action ("PCA") aimed at paying compensation for environmental pollution that occurred in the former area of Companhia Usina de Passivos. Several PCA’s were filed in the face of different companies. In February 2024, there was a change in one of the PCAs, in which the value assigned by the Public Prosecutor’s Office was R$365,319 and the action was extinguished and filed. In another PCA, there was delimitation of the responsibility of the company and the value that was of R$441,142 changed to R$2,062. |
Labor:
| Parent Company |
| Consolidated | ||||
| 06/30/2024 |
| 12/31/2023 |
| 06/30/2024 |
| 12/31/2023 |
Labor claims | 11,197 |
| 9,168 |
| 718,181 |
| 805,222 |
| 11,197 |
| 9,168 |
| 718,181 |
| 805,222 |
Notes to the interim Financial Statements
(In thousands of Reais, except when otherwise indicated)
a) Share capital
The subscribed capital on June 30, 2024 is R$8,832,544 (R$8,682,544 on December 31, 2023), fully paid in, represented by 1,874,070,932 registered, book-entry common shares with no par value. According to the statute, the authorized share capital can be increased up to the limit of R$9,000,000.
As of June 30, 2024, the Company's share capital consists of the following:
|
| Ordinary actions | ||
Shareholding structure |
| Amount |
| % |
Controlling shareholders |
| 672,312,942 |
| 35.87% |
Administrators |
| 22,910,997 |
| 1.22% |
Free float |
| 1,165,337,843 |
| 62.18% |
Outstanding shares |
| 1,860,561,782 |
| 99.27% |
Treasury stock |
| 13,509,150 |
| 0.73% |
Total |
| 1,874,070,932 |
| 100.00% |
b) Treasury shares
On August 14, 2023, the Company's Board of Directors approved the new Share Buyback Program of up to 116,000,000 common shares, representing 9.93% of the total shares available on the market, with a term of up to 18 months. The repurchased shares may be used to meet obligations arising from potential exercises of share-based compensation plans, holding in treasury, disposal or cancellations in accordance with applicable legislation.
As of June 30, 2024, the Company had 13,509,150 shares in treasury (6,514,511 shares on December 31, 2023), whose market price was R$13.54.
c) Dividends
- Receivable
Parent Company |
| Investments in associates (i) |
| Investments in joint venture |
| Total |
At January 1, 2024 |
| 99,194 |
| 219,941 |
| 319,135 |
Dividends declared |
| 1,853,451 |
| 13,589 |
| 1,867,040 |
Other |
| 8,831 |
| — |
| 8,831 |
Dividends received |
| (1,787,186) |
| (228,342) |
| (2,015,528) |
At June 30, 2024 |
| 174,290 |
| 5,188 |
| 179,478 |
(i) See composition of the balance in note 9.1.a.
Notes to the interim Financial Statements
(In thousands of Reais, except when otherwise indicated)
Consolidated |
| Investments in associates (ii) |
| Investments in joint venture |
| Total |
At January 1, 2024 |
| 35,836 |
| 219,941 |
| 255,777 |
Dividends declared |
| 726,497 |
| 119,646 |
| 846,143 |
Other |
| 135,872 |
| — |
| 135,872 |
Dividends received |
| (644,631) |
| (293,912) |
| (938,543) |
At June 30, 2024 |
| 253,574 |
| 45,675 |
| 299,249 |
(ii) See composition of the balance in note 9.1.b
ii. Payable
|
|
|
|
|
|
| Parent Company |
| Consolidated |
At January 1, 2024 |
| 276,065 |
| 549,054 |
Dividends declared |
| 566,401 |
| 1,946,325 |
Dividends paid to preferred shareholders |
| — |
| (668,022) |
Dividends paid |
| (782,081) |
| (1,537,377) |
At June 30, 2024 |
| 60,385 |
| 289,980 |
d) Other comprehensive income
|
| 12/31/2023 |
| Comprehensive (loss) income |
| 06/30/2024 |
Cash flow hedge result |
| (1,487,128) |
| (209,710) |
| (1,696,838) |
Exchange rate differences on conversion of operations abroad |
| 1,838,413 |
| 194,502 |
| 2,032,915 |
Actuarial losses of defined benefit plan |
| (291,213) |
| 25,564 |
| (265,649) |
Deferred tax on actuarial losses of defined benefit plan |
| 99,012 |
| (8,692) |
| 90,320 |
Loss on measurement of derivative financial instrument |
| (45,631) |
| — |
| (45,631) |
Change in the fair value of a financial asset |
| 77,152 |
| — |
| 77,152 |
Deferred income tax on financial asset |
| (26,232) |
| — |
| (26,232) |
Total |
| 164,373 |
| 1,664 |
| 166,037 |
|
|
|
|
|
|
|
Attributable to: |
|
|
|
|
|
|
Controlling shareholders |
| 314,325 |
| 19,747 |
| 334,072 |
Non-controlling shareholders |
| (149,952) |
| (18,083) |
| (168,035) |
|
| 12/31/2022 |
| Comprehensive (loss) income |
| 06/30/2023 |
Cash flow hedge result |
| (1,361,895) |
| 2,360 |
| (1,359,535) |
Exchange rate differences on conversion of operations abroad |
| 2,010,914 |
| (569,697) |
| 1,441,217 |
Actuarial losses of defined benefit plan |
| (219,663) |
| 41,935 |
| (177,728) |
Deferred tax on actuarial losses of defined benefit plan |
| 74,685 |
| (14,258) |
| 60,427 |
Loss on measurement of derivative financial instrument |
| (45,631) |
| — |
| (45,631) |
Change in the fair value of a financial asset |
| 77,152 |
| — |
| 77,152 |
Deferred income tax on financial asset |
| (26,232) |
| — |
| (26,232) |
Total |
| 509,330 |
| (539,660) |
| (30,330) |
|
|
|
|
|
|
|
Attributable to: |
|
|
|
|
|
|
Owners of the Company |
| 567,546 |
| (401,527) |
| 166,019 |
Non-controlling interests |
| (58,216) |
| (138,133) |
| (196,349) |
Notes to the interim Financial Statements
(In thousands of Reais, except when otherwise indicated)
Basic earnings per share is calculated by dividing net income by the weighted average number of common shares outstanding during the period. Earnings per share after potentially dilutive instruments is computed by adjusting earnings and the number of shares for the impact of potentially dilutive instruments.
The following table presents the calculation of earnings per share (in thousands of reais, except for amounts per share):
2Q24 |
| 2Q23 (Restated) |
| 6M24 |
| 6M23 (Restated) | |
Loss attributable to holders of common sharesm of Company used in calculating basic earnings per share | (227,108) |
| (1,048,184) |
| (419,282) |
| (1,952,314) |
Diluting effect of the share-based plan of subsidiaries | — |
| (133) |
| — |
| (192) |
Loss attributable to holders of common shares of Company used in the calculation of diluted earnings per share | (227,108) |
| (1,048,317) |
| (419,282) |
| (1,952,506) |
|
|
|
|
|
|
|
|
Weighted average number of common shares outstanding - basic (in thousands of shares) |
|
|
|
|
|
|
|
Basic | 1,861,482 |
| 1,866,630 |
| 1,863,883 |
| 1,866,632 |
Share repurchases | — |
| (10,131) |
| — |
| (10,131) |
Diluted | 1,861,482 |
| 1,856,499 |
| 1,863,883 |
| 1,856,501 |
|
|
|
|
|
|
|
|
Earnings per share |
|
|
|
|
|
|
|
Basic | (R$0.1220) |
| (R$0.5615) |
| (R$0.2250) |
| (R$1.0459) |
Diluted | (R$0.1220) |
| (R$0.5647) |
| (R$0.2250) |
| (R$1.0517) |
|
| 2Q23 (Restated) |
|
| 6M23 (Restated) |
Income attributable to holders of common shares of Company used in calculating basic earnings per share |
| 5,483 |
|
| 5,483 |
Income attributable to holders of common shares of Company used in the calculation of diluted earnings per share |
| 5,483 |
|
| 5,483 |
|
|
|
|
|
|
Weighted average number of common shares outstanding - basic (in thousands of shares) |
|
|
|
|
|
Basic |
| 1,866,630 |
|
| 1,866,632 |
|
|
|
|
|
|
Diluted |
| 1,866,630 |
|
| 1,866,632 |
|
|
|
|
|
|
Earnings per share |
|
|
|
|
|
Basic |
| R$0.0029 |
|
| R$0.0029 |
Diluted |
| R$0.0029 |
|
| R$0.0029 |
Notes to the interim Financial Statements
(In thousands of Reais, except when otherwise indicated)
Diluting instruments
The Company and its subsidiaries have two categories of possible dilutive effects: stock grants and put options. For stock grants, a calculation is performed to determine the impact of dilution on the profit attributable to the Parent Company's shareholders as a result of the exercise of stock grants in subsidiaries. It is assumed that the put option was converted into common stock, and the profit attributable to the Parent Company's shareholders is adjusted accordingly.
Anti-dilution instruments
In the period ended June 30, 2024, 9,143,952 shares related to the Company's stock option plan were not considered in the analysis of diluted earnings per share, as they decrease the loss per share. (6,354,535 shares as of June 30, 2023).
| Consolidated | ||||||
| 2Q24 |
| 2Q23 (Restated) (i) |
| 6M24 |
| 6M23 (Restated) (i) |
Gross revenue from the sale of products and services | 12,227,580 |
| 11,548,650 |
| 23,521,298 |
| 22,710,049 |
Construction revenue | 381,153 |
| 391,712 |
| 701,184 |
| 694,620 |
Indirect taxes and other deductions | (1,914,725) |
| (1,889,357) |
| (3,686,418) |
| (3,735,510) |
Net sales | 10,694,008 |
| 10,051,005 |
| 20,536,064 |
| 19,669,159 |
(i) For more details see note 3.1 |
In the following table, revenue is disaggregated by products and service lines and timing of revenue recognition:
| 2Q24 |
| 2Q23 (Restated) |
| 6M24 |
| 6M23 (Restated) |
At a point in time |
|
|
|
|
|
|
|
Natural gas distribution | 3,919,982 |
| 4,110,044 |
| 7,631,403 |
| 8,137,823 |
Lubricants, base oil and other | 2,360,313 |
| 2,478,694 |
| 4,593,385 |
| 4,978,715 |
Lease and sale of lands | 153,404 |
| 163,779 |
| 289,970 |
| 300,546 |
Other | 101,179 |
| 123,798 |
| 204,903 |
| 316,472 |
| 6,534,878 |
| 6,876,315 |
| 12,719,661 |
| 13,733,556 |
Over time |
|
|
|
|
|
|
|
Railroad transportation services | 3,417,565 |
| 2,639,483 |
| 6,415,328 |
| 4,913,781 |
Container operations | 157,172 |
| 123,629 |
| 305,425 |
| 233,159 |
Construction revenue | 381,153 |
| 391,712 |
| 701,184 |
| 694,620 |
Services rendered | 220,647 |
| 38,424 |
| 427,168 |
| 125,576 |
| 4,176,537 |
| 3,193,248 |
| 7,849,105 |
| 5,967,136 |
Eliminations | (17,407) |
| (18,558) |
| (32,702) |
| (31,533) |
Total net sales | 10,694,008 |
| 10,051,005 |
| 20,536,064 |
| 19,669,159 |
Notes to the interim Financial Statements
(In thousands of Reais, except when otherwise indicated)
The costs and expenses are presented in the statement of profit and loss by function. The reconciliation of costs and expenses by type/purpose is as follows:
| Parent Company |
| Consolidated | ||||||||||||
| 2Q24 |
| 2Q23 |
| 6M24 |
| 6M23 |
| 2Q24 |
| 2Q23 (Restated) (i) |
| 6M24 |
| 6M23 (Restated) (i) |
Raw material and material for use in the provision of services | — |
| — |
| — |
| — |
| (1,828,869) |
| (1,751,960) |
| (3,544,031) |
| (3,681,158) |
Gas and transportation cost | — |
| — |
| — |
| — |
| (2,827,752) |
| (3,071,487) |
| (5,571,285) |
| (6,199,317) |
Railroad transport and port elevation expenses | — |
| — |
| — |
| — |
| (661,346) |
| (684,627) |
| (1,416,070) |
| (1,356,294) |
Other transport | — |
| — |
| — |
| — |
| (106,594) |
| (168,615) |
| (232,128) |
| (288,114) |
Depreciation and amortization | (3,929) |
| (3,605) |
| (7,780) |
| (7,027) |
| (926,461) |
| (824,958) |
| (1,833,725) |
| (1,610,177) |
Personnel expenses | (67,895) |
| (65,347) |
| (134,740) |
| (125,948) |
| (755,384) |
| (703,711) |
| (1,475,852) |
| (1,356,562) |
Construction cost | — |
| — |
| — |
| — |
| (381,154) |
| (391,712) |
| (701,184) |
| (694,620) |
Expenses with third-party services | (10,518) |
| (7,707) |
| (24,035) |
| (13,839) |
| (278,221) |
| (136,549) |
| (530,754) |
| (372,639) |
Business expenses | (24) |
| (4) |
| (39) |
| (4) |
| (9,801) |
| (9,929) |
| (19,748) |
| (20,136) |
Other expenses | (29,152) |
| (18,036) |
| (48,607) |
| (34,523) |
| (349,932) |
| (367,900) |
| (673,833) |
| (541,290) |
| (111,518) |
| (94,699) |
| (215,201) |
| (181,341) |
| (8,125,514) |
| (8,111,448) |
| (15,998,610) |
| (16,120,307) |
|
|
|
|
|
|
|
|
|
|
|
|
|
|
|
|
Cost of goods sold and services rendered | — |
| — |
| — |
| — |
| (7,137,604) |
| (7,237,251) |
| (14,066,041) |
| (14,415,854) |
Selling expenses | — |
| — |
| — |
| — |
| (376,497) |
| (341,507) |
| (737,901) |
| (681,240) |
General and administrative expenses | (111,518) |
| (94,699) |
| (215,201) |
| (181,341) |
| (611,413) |
| (532,690) |
| (1,194,668) |
| (1,023,213) |
| (111,518) |
| (94,699) |
| (215,201) |
| (181,341) |
| (8,125,514) |
| (8,111,448) |
| (15,998,610) |
| (16,120,307) |
(i) For more details see note 3.1
Notes to the interim Financial Statements
(In thousands of Reais, except when otherwise indicated)
| Parent Company |
| Consolidated | ||||||||||||
| 2Q24 |
| 2Q23 |
| 6M24 |
| 6M23 |
| 2Q24 |
| 2Q23 |
| 6M24 |
| 6M23 |
Extemporaneous tax credits | 8,398 |
| — |
| 8,398 |
| — |
| 10,242 |
| — |
| 22,766 |
| 4,225 |
Change in fair value of investment properties | — |
| — |
| — |
| — |
| — |
| 91,822 |
| — |
| 91,822 |
Loss on disposals of non-current assets and intangible assets | — |
| 13,563 |
| (7) |
| 13,563 |
| (38,746) |
| 16 |
| (40,261) |
| (777) |
Loss on sale of investments (i) | — |
| — |
| — |
| — |
| (383,205) |
| — |
| (383,205) |
| — |
Net effect of provisions for legal proceedings | 6,964 |
| (21,061) |
| (3,877) |
| (43,524) |
| (68,041) |
| (14,996) |
| (149,301) |
| (78,624) |
Dividends received from Vale S.A | — |
| — |
| — |
| — |
| — |
| — |
| — |
| 402,752 |
Contractual agreement (ii) | — |
| — |
| — |
| — |
| 189,736 |
| (34,193) |
| 302,412 |
| (34,193) |
Reversal of other provisions (iii) | — |
| — |
| — |
| — |
| 291,032 |
| — |
| 291,032 |
| — |
Other income | 33,071 |
| 4,894 |
| 34,801 |
| 57,407 |
| 132,109 |
| 43,240 |
| 149,979 |
| 76,200 |
Net impairment loss (iv) | — |
| — |
| — |
| — |
| (2,574,817) |
| — |
| (2,574,817) |
| — |
Gain from corporate restructuring (v) | — |
| — |
| — |
| — |
| 168,855 |
| — |
| 168,855 |
| — |
Other | (19,799) |
| (18,278) |
| (24,920) |
| (30,140) |
| (136,208) |
| (141,935) |
| (195,742) |
| (155,558) |
| 28,634 |
| (20,882) |
| 14,395 |
| (2,694) |
| (2,409,043) |
| (56,046) |
| (2,408,282) |
| 305,847 |
| (i) | Net effect of the sale of a stake in Vale S.A., as per note 2. | |
| (ii) | Refers mainly to a commercial agreement with suppliers of the indirect subsidiary Compass. | |
| (iii) | In the second quarter of 2024, the indirect subsidiary Compass in the indirect subsidiary Comgás reassessed and concluded, according to the criteria of CPC 25 / IAS 37, that there is currently no probable outflow of resources for part of the amount then recorded in its balance sheet under “Other liabilities”, thus proceeding with its reversal. | |
| (iv) | Balance includes provision for write-off of the residual value of assets with traffic directly interrupted by the extreme weather events in Rio Grande do Sul, in the amount of R$182,041, and impairment of the indirect subsidiary Rumo Malha Sul S.A, see note 2. | |
| (v) | Amount refers to the additional purchase price that CLI SUL undertook to pay to the subsidiary Rumo, under the terms of the purchase and sale agreement, as per note 2. |
Notes to the interim Financial Statements
(In thousands of Reais, except when otherwise indicated)
The details of revenues and finance costs are as follows:
Parent Company |
| Consolidated | |||||||||||||
| 2Q24 |
| 2Q23 |
| 6M24 |
| 6M23 |
| 2Q24 |
| 2Q23 |
| 6M24 |
| 6M23 |
Gross debt cost |
|
|
|
|
|
|
|
|
|
|
|
|
|
|
|
Interest and monetary variation | (435,267) |
| (218,248) |
| (832,452) |
| (421,635) |
| (1,442,349) |
| (952,304) |
| (2,846,862) |
| (2,270,013) |
Net foreign exchange variation on debts | (853,139) |
| — |
| (1,007,970) |
| — |
| (2,550,103) |
| 1,595,958 |
| (3,061,950) |
| 2,194,771 |
Financial result with derivatives and fair value | 1,023,960 |
| (586,790) |
| 937,501 |
| (930,855) |
| 1,733,569 |
| (344,159) |
| 2,177,978 |
| (173,750) |
Amortization of borrowing costs | (3,677) |
| (2,217) |
| (6,921) |
| (4,224) |
| (28,382) |
| (14,692) |
| (47,056) |
| (29,376) |
Guarantees and warranties | — |
| — |
| — |
| — |
| (8,779) |
| (11,021) |
| (17,402) |
| (19,941) |
| (268,123) |
| (807,255) |
| (909,842) |
| (1,356,714) |
| (2,296,044) |
| 273,782 |
| (3,795,292) |
| (298,309) |
Income from financial investments and exchange rate variation in cash and cash equivalents | 21,755 |
| 48,231 |
| 58,907 |
| 96,705 |
| 502,884 |
| 481,913 |
| 948,223 |
| 931,176 |
Changes in fair value of investments in listed entities | — |
| — |
| — |
| — |
| — |
| (3,464,234) |
| — |
| (5,269,162) |
| 21,755 |
| 48,231 |
| 58,907 |
| 96,705 |
| 502,884 |
| (2,982,321) |
| 948,223 |
| (4,337,986) |
Cost of debt, net | (246,368) |
| (759,024) |
| (850,935) |
| (1,260,009) |
| (1,793,160) |
| (2,708,539) |
| (2,847,069) |
| (4,636,295) |
|
|
|
|
|
|
|
|
|
|
|
|
|
|
|
|
Other charges and monetary variations |
|
|
|
|
|
|
|
|
|
|
|
|
|
|
|
Interest on other receivables | 14,894 |
| 8,741 |
| 28,577 |
| 22,638 |
| 132,311 |
| 125,234 |
| 249,322 |
| 224,790 |
Update of other financial assets | — |
| 1,108 |
| — |
| 1,608 |
| — |
| 1,108 |
| — |
| 1,608 |
Monetary variation on leases and concessions agreements | — |
| — |
| — |
| — |
| (121,557) |
| (125,498) |
| (240,362) |
| (277,860) |
Interest on leases | (776) |
| (909) |
| (1,599) |
| (1,794) |
| (157,544) |
| (82,589) |
| (296,290) |
| (179,462) |
Interest on shareholders’ equity | — |
| (39,534) |
| — |
| (39,534) |
| — |
| (43,175) |
| — |
| (43,175) |
Interest on contingencies and contracts | (49,914) |
| (48,673) |
| (62,679) |
| (87,670) |
| (290,895) |
| (274,809) |
| (382,623) |
| (693,108) |
Interest on sectoral assets and liabilities | — |
| — |
| — |
| — |
| (35,066) |
| (21,742) |
| (55,825) |
| (41,697) |
Bank charges and other | (15,034) |
| (8,101) |
| (21,684) |
| (18,612) |
| 30,886 |
| (51,017) |
| 21,673 |
| (47,425) |
Foreign exchange, net | (1,148,658) |
| 428,942 |
| (1,860,245) |
| 339,971 |
| (286,779) |
| 38,251 |
| (749,958) |
| (219,267) |
| (1,199,488) |
| 341,574 |
| (1,917,630) |
| 216,607 |
| (728,644) |
| (434,237) |
| (1,454,063) |
| (1,275,596) |
Financial result, net | (1,445,856) |
| (417,450) |
| (2,768,565) |
| (1,043,402) |
| (2,521,804) |
| (3,142,776) |
| (4,301,132) |
| (5,911,891) |
|
|
|
|
|
|
|
|
|
|
|
|
|
|
|
|
Reconciliation |
|
|
|
|
|
|
|
|
|
|
|
|
|
|
|
Financial expenses | (625,774) |
| (463,591) |
| (1,155,309) |
| (892,074) |
| (2,130,752) |
| (5,422,219) |
| (3,995,308) |
| (9,677,480) |
Financial income | 42,188 |
| 81,210 |
| 100,371 |
| 149,684 |
| 726,385 |
| 628,874 |
| 1,341,486 |
| 1,229,537 |
Exchange variation | (1,514,581) |
| 467,485 |
| (1,852,577) |
| 710,628 |
| (2,442,818) |
| 1,550,338 |
| (2,974,036) |
| 2,135,679 |
Net effect of derivatives | 652,311 |
| (502,554) |
| 138,950 |
| (1,011,640) |
| 1,325,382 |
| 100,231 |
| 1,326,726 |
| 400,373 |
Financial result, net | (1,445,856) |
| (417,450) |
| (2,768,565) |
| (1,043,402) |
| (2,521,803) |
| (3,142,776) |
| (4,301,132) |
| (5,911,891) |
Notes to the interim Financial Statements
(In thousands of Reais, except when otherwise indicated)
| Consolidated | ||
| 06/30/2024 |
| 12/31/2023 |
Defined contribution |
|
|
|
Futura II | 365 |
| 333 |
Defined benefit |
|
|
|
Futura | 181,967 |
| 175,150 |
Health Insurance | 448,716 |
| 442,164 |
| 630,683 |
| 617,314 |
Total | 631,048 |
| 617,647 |
The Company and its subsidiaries have Share-Based Plans that are settled in shares and cash. As of 30 June 2024, the Group has the following share-based payment arrangements:
Grants made in 2024
- Share grant program (liquidated in shares)
In the period ended of June 30, 2024, the following Grant Program was established:
| Program | Conditions for vesting |
Cosan Invest Partners | Grant January 30, 2024. The incentive program is conditioned on service time (service condition) and performance goals (performance conditions). Of the total actions of the program, 60% are related to service time for the period of 5 years and the actions are granted annually. The rest, equivalent to 40% of the program, are related to performance goals being necessary to achieve specific metrics that can vary between 0% and 110% (to calculate the fair value was considered the achievement of 100%). Shares are in lock-up for one year. The 2024 grant refers only to the portion granted annually, which is linked to service condition. (vesting period of 12 months). |
Notes to the interim Financial Statements
(In thousands of Reais, except when otherwise indicated)
Award Type / Award Date |
| Company |
| Life expectancy (years) |
| Grants under plans |
| Exercised / Canceled / Transferred |
| Available |
| Fair value as of grant date - R$ |
Share grant program |
|
|
|
|
|
|
|
|
|
| ||
07/31/2019 |
| Cosan S.A. |
| 60 |
| 229,020 |
| (146,614) |
| 82,406 |
| 13.44 |
07/31/2020 |
| Cosan S.A. |
| 60 |
| 68,972 |
| (6,704) |
| 62,268 |
| 20.93 |
07/31/2021 - Invest I |
| Cosan S.A. |
| 36 |
| 424,839 |
| (52,366) |
| 372,473 |
| 24.38 |
09/10/2021 - Invest II |
| Cosan S.A. |
| 48 |
| 5,283,275 |
| (2,243,521) |
| 3,039,754 |
| 22.24 |
10/11/2021 - Invest III |
| Cosan S.A. |
| 60 |
| 806,752 |
| (166,141) |
| 640,611 |
| 23.20 |
07/31/2022 - Invest I |
| Cosan S.A. |
| 36 |
| 846,506 |
| (271,766) |
| 574,740 |
| 18.74 |
11/22/2022 - Invest Partners |
| Cosan S.A. |
| 60 |
| 377,173 |
| — |
| 377,173 |
| 17.14 |
01/30/2023 - Invest Partners |
| Cosan S.A. |
| 36 |
| 12,472,325 |
| (6,365,611) |
| 6,106,714 |
| 15.26 |
07/31/2023 - Invest Cosan I - Regular |
| Cosan S.A. |
| 36 |
| 1,047,845 |
| (382,256) |
| 665,589 |
| 17.53 |
12/01/2023 - Invest Cosan III - Associates |
| Cosan S.A. |
| 60 |
| 546,734 |
| — |
| 546,734 |
| 17.68 |
01/30/2024 - Invest Partners |
| Cosan S.A. |
| 12 |
| 2,322,324 |
| (787,110) |
| 1,535,214 |
| 18.18 |
|
|
|
|
|
| 24,425,765 |
| (10,422,089) |
| 14,003,676 |
|
|
|
|
|
|
|
|
|
|
|
|
|
|
|
07/01/2023 - Program SOP A |
| Moove |
| 72 |
| 699,276 |
| — |
| 699,276 |
| 142.62 |
07/01/2023 - Program SOP B |
| Moove |
| 72 |
| 279,710 |
| — |
| 279,710 |
| 88.32 |
07/01/2023 - Program SOP C |
| Moove |
| 72 |
| 223,768 |
| — |
| 223,768 |
| 76.54 |
07/01/2023 - Program SOP D |
| Moove |
| 72 |
| 139,855 |
| — |
| 139,855 |
| 71.45 |
|
|
|
|
|
| 1,342,609 |
| — |
| 1,342,609 |
|
|
|
|
|
|
|
|
|
|
|
|
|
|
|
08/15/2019 |
| Rumo S.A. |
| 60 |
| 843,152 |
| (313,122) |
| 530,030 |
| 22.17 |
11/11/2020 |
| Rumo S.A. |
| 60 |
| 776,142 |
| (299,921) |
| 476,221 |
| 20.01 |
05/05/2021 |
| Rumo S.A. |
| 60 |
| 1,481,000 |
| (1,285,227) |
| 195,773 |
| 20.84 |
09/15/2021 |
| Rumo S.A. |
| 36 |
| 1,560,393 |
| (393,137) |
| 1,167,256 |
| 18.19 |
09/01/2022 |
| Rumo S.A. |
| 36 |
| 1,781,640 |
| (103,814) |
| 1,677,826 |
| 20.36 |
09/01/2023 |
| Rumo S.A. |
| 36 |
| 1,724,867 |
| (21,552) |
| 1,703,315 |
| 21.86 |
|
|
|
|
|
| 8,167,194 |
| (2,416,773) |
| 5,750,421 |
|
|
Notes to the interim Financial Statements
(In thousands of Reais, except when otherwise indicated)
Share-based compensation plan (settled in cash) |
|
|
|
|
|
|
|
| ||||
07/31/2019 - Invest I |
| Moove |
| 60 |
| 132,670 |
| (26,285) |
| 106,385 |
| 50.79 |
07/31/2020 - Invest II |
| Moove |
| 60 |
| 106,952 |
| (17,695) |
| 89,257 |
| 61.89 |
07/31/2021 - Invest III |
| Moove |
| 36 |
| 80,729 |
| (14,115) |
| 66,614 |
| 102.73 |
07/31/2022 - Invest IV |
| Moove |
| 36 |
| 77,967 |
| (4,853) |
| 73,114 |
| 135.05 |
07/31/2023 - Invest V |
| Moove |
| 36 |
| 82,204 |
| (1,391) |
| 80,813 |
| 150.98 |
08/01/2021 |
| Compass Comercialização |
| 36 |
| 35,242 |
| (28,922) |
| 6,320 |
| 25.46 |
08/01/2021 |
| Compass Gás e Energia |
| 36 |
| 174,677 |
| (22,296) |
| 152,381 |
| 25.46 |
08/01/2021 |
| Compass Gás e Energia |
| 36 |
| 38,374 |
| (7,999) |
| 30,375 |
| 25.46 |
11/01/2021 |
| Compass Gás e Energia |
| 32 |
| 197,631 |
| — |
| 197,631 |
| 25.46 |
11/01/2021 |
| Compass Gás e Energia |
| 32 |
| 1,689,412 |
| (82,506) |
| 1,606,906 |
| 25.46 |
02/01/2022 |
| Compass Gás e Energia |
| 29 |
| 95,679 |
| — |
| 95,679 |
| 25.59 |
08/01/2022 |
| Compass Gás e Energia |
| 36 |
| 894,554 |
| (69,853) |
| 824,701 |
| 25.59 |
08/01/2022 |
| Compass |
| 36 |
| 31,032 |
| (25,531) |
| 5,501 |
| 25.59 |
08/01/2022 |
| TRSP |
| 36 |
| 33,651 |
| (5,120) |
| 28,531 |
| 25.59 |
08/01/2023 |
| Compass Gás e Energia |
| 36 |
| 257,545 |
| (12,550) |
| 244,995 |
| 34.12 |
08/01/2023 |
| Compass |
| 36 |
| 26,290 |
| (16,740) |
| 9,550 |
| 34.12 |
08/01/2023 |
| TRSP |
| 36 |
| 24,417 |
| — |
| 24,417 |
| 34.12 |
|
|
|
|
|
| 3,979,026 |
| (335,856) |
| 3,643,170 |
|
|
Total |
|
|
|
|
| 37,914,594 |
| (13,174,718) |
| 24,739,876 |
|
|
Notes to the interim Financial Statements
(In thousands of Reais, except when otherwise indicated)
a) Reconciliation of outstanding share grants
The change in outstanding share grants is as follows:
|
| Parent company |
| Consolidated |
At January 1, 2024 |
| 20,036,862 |
| 31,557,498 |
Granted |
| 2,322,324 |
| 1,757,801 |
Addition of shares (i) |
| — |
| 135,074 |
Exercised/cancels/other |
| (8,355,510) |
| (8,710,497) |
At June 30, 2024 |
| 14,003,676 |
| 24,739,876 |
| (i) | Total shares accrued corresponding to the proportional number of dividends, interest on equity and reduction of equity eventually paid or credited by the subsidiary Compass to its shareholders between the date of the grant and the end of said vesting exercise. |
b) Fair value measurement
The weighted average fair value of the programs granted during June 30, 2024 and December 31, 2023 and the main assumptions used in applying the Black-Scholes and Binominal model were as follows:
|
| Average market price on the grant date |
| Interest rate |
| Volatility |
Cosan S.A | 06/30/2024 | 18.18 |
| N/A |
| N/A |
12/31/2023 | 16.82 |
| N/A |
| N/A | |
|
|
|
|
|
|
|
Compass | 06/30/2024 | 38.36 |
| N/A |
| N/A |
12/31/2023 | 42.21 |
| N/A |
| N/A | |
|
|
|
|
|
|
|
TRSP | 06/30/2024 | 38.36 |
| N/A |
| N/A |
12/31/2023 | 42.21 |
| N/A |
| N/A | |
|
|
|
|
|
|
|
Rumo (i) | 06/30/2024 | 21.87 |
| 10.41% |
| 25.84% |
12/31/2023 | 21.87 |
| 10.41% |
| 25.84% | |
|
|
|
|
|
|
|
Moove (ii) | 06/30/2024 | 105.98 |
| 4.05% |
| 42.85% |
| 12/31/2023 | 105.98 |
| 4.05% |
| 42.85% |
| (i) | Volatility was determined based on the historical volatility of the share price in the last thirty days prior to the grant date. |
| (ii) | Volatility was determined based on the historical volatility of the parent company's share price, since Moove is not yet publicly traded, taking as a measure the period proportional to the term of the plan. |
c) Expense recognized in profit or loss
Share-based compensation expenses included in the income statement for the periods ended June 30, 2024 and 2023 were R$81,258 and R$83,179, respectively.
Notes to the interim Financial Statements
(In thousands of Reais, except when otherwise indicated)
SIGNING OF A SHARE PURCHASE AGREEMENT WITH COMPANHIA PARANAENSE DE GÁS - COMPAGAS
As disclosed to the market in a Material Fact on July 10, 2024, the indirect subsidiary Compass Dois LTDA ("Compass Dois") entered into a Share Purchase Agreement to acquire a 51% stake and, consequently, control of Companhia Paranaense de Gás ("Compagas").
Compagas is the distributor of piped natural gas in the state of Paraná and operates this service exclusively under a concession contract valid until June 2054. Its distribution network totals approximately 880 km of pipelines, serving more than 54,000 customers in 16 municipalities, with a distributed volume of 821,000 m3/day of natural gas.
The amount negotiated for this acquisition is R$906,000, which will be paid by 2026. On July 11, 2024, Compass Dois paid R$47,270 as an advance.
Completion of the transaction is subject to the fulfillment of certain conditions, which include, but are not limited to, compliance with the deadline for exercising the preemptive rights of other Compagas shareholders and approval by the competent bodies.
FILING OF FORM F-1 BY MOOVE WITH THE SEC
On July 10, 2024, subsidiary Moove Lubricants Holdings ("MLH") confidentially filed a draft registration statement on Form F-1 with the U.S. Securities and Exchange Commission ("SEC") relating to the proposed initial public offering of Moove's common stock ("IPO"). The IPO is expected to occur after the SEC completes its review process, subject to market and other conditions.
The number of shares of common stock to be sold and the price range of the proposed offering have not yet been determined.
ELEVENTH ISSUE OF COMGÁS DEBENTURES
On July 16, 2024, the Board of Directors of the indirect subsidiary Comgás approved the public offering of the 11th issue of simple debentures, under a firm placement guarantee, not convertible into shares, of the unsecured type, in two series. The issue will be in the total amount of R$1,500,000, bearing interest every six months and at a rate corresponding to (i) the internal rate of return of the IPCA+ Treasury with Semiannual Interest (NTN-B), maturing on May 15, 2033, for the debentures of the 1st series; and (ii) the rate corresponding to the internal rate of return of the IPCA+ Treasury with Semiannual Interest (NTN-B), maturing on May 15, 2035, plus a spread of 0.10% p.a., for the 2nd series debentures. The debentures have a term of 10 years (1st series) and 15 years (2nd series) and the net proceeds from the Issue will be used for "Comgás investment projects". Derivative financial instruments (interest rate swaps) were contracted for both series, with the 1st Series at a rate of 99.05% of the CDI and the 2nd Series at a rate of 99.95% of the CDI.
SALE OF AGRICULTURAL PROPERTY
On July 19, 2024, the indirect subsidiary Jequitibá Propriedades Agrícolas Ltda signed a contract for the sale of the rural property called Fazenda Vista Alegre, located in the region of Araçatuba, in the northwest of the state of São Paulo, with a total registered area of 3,124.35 hectares and suitable for growing sugar cane. The sale price is R$213,000, to be received in installments until January 2029.
CAPITAL REDUCTION OF COSAN OITO S.A.
On May 23, 2024, the Ordinary and Extraordinary General Meeting (AGOE) approved the capital reduction of the subsidiary Cosan Oito S.A. in the amount of R$750,000, without the cancellation of shares or changes in the Company’s ownership structure.
After observing the 60-day period for creditor opposition, the transaction was completed on July 24, 2024, with the full amount returned to the Company.
Notes to the interim Financial Statements
(In thousands of Reais, except when otherwise indicated)
COMPASS AND TRSP COMMERCIAL NOTES
On July 25, 2024, the indirect subsidiary TRSP raised R$750,000 through Commercial Notes subscribed by Compass Gás e Energia, with bullet remuneration equivalent to CDI + 1.2% p.a. and maturity on January 15, 2025. The contract was signed through the depositary Laqus Depositária de Valores Mobiliários S.A., following the market conditions for the respective transaction. The funds obtained from the issue will be used to settle short-term debt.
DISTRIBUTION OF INTEREST ON EQUITY OF VALE S.A.
On July 25, 2024, Vale's Board of Directors approved the distribution of interest on equity ("JCP") in the amount of R$8,940,158. The amount declared corresponds entirely to dividends in the total amount of R$2.093798142 reais per share. Payment will take place in September 2024.
DISTRIBUTION OF DIVIDENDS RAÍZEN S.A.
The subsidiary together with Raízen S.A. approved on July 30, 2024 the distribution of additional dividends in the amount of R$103,488. The amount declared corresponds entirely to dividends in the total amount of R$0.01001412421 reais per share, disregarding treasury shares. The additional dividends declared herein will be paid by the Company in a single installment by the end of the fiscal year ending March 31, 2025.
NEW JOINT VENTURE BETWEEN RUMO AND CHS FOR NEW TERMINAL IN SANTOS
According to a material fact communicated to the market, on August 7, 2024, the subsidiary Rumo entered into a strategic partnership in the context of the development of the new port terminal for grain and fertilizer operations in Santos ("Terminal").
The subsidiary Rumo and CHS Agronegócio - Indústria e Comércio Ltda., a subsidiary of CHS INC, entered into a binding agreement to create a joint venture with shared control, which will implement the new Terminal, located in the area of EMBRAPORT - Empresa Brasileira de Terminais Portuários S.A., a company part of DP World Group.
The Terminal will have the capacity to handle up to 12.5 million tons a year, of which 9 million tons will be grain and 3.5 million tons fertilizer. The start of construction of the Terminal is subject to compliance with the usual conditions precedent for this type of operation, including environmental licensing and legal and regulatory approvals.
APPROVAL TO CANCEL TREASURY SHARES
On August 9, 2024, the Board of Directors approved the cancellation of 7,500,000 treasury shares by Cosan S.A., with no definition date to conclude.
SIGNATURES
Pursuant to the requirements of the Securities Exchange Act of 1934, the registrant has duly caused this report to be signed on its behalf by the undersigned, thereunto duly authorized.
Date: August 14, 2024
COSAN S.A. | ||
By: | /s/ Rodrigo Araujo Alves | |
| Name: Rodrigo Araujo Alves | |
| Title: Chief Financial Officer | |