Table of Contents
As filed with the Securities and Exchange Commission on August 20, 2008
Registration No. 333-150638
UNITED STATES
SECURITIES AND EXCHANGE COMMISSION
Washington, D.C. 20549
AMENDMENT NO. 2
TO
REGISTRATION STATEMENT ON FORM S-1
UNDER
THE SECURITIES ACT OF 1933
NEWPAGE GROUP INC.
(Registrant)
(Exact name of registrant as specified in its charter)
| Delaware | 26-1292456 | |
| (State of Incorporation) | (I.R.S. Employee I.D. No.) |
8540 Gander Creek Drive
Miamisburg, Ohio 45342
(877) 855-7243
(Address, including zip code, and telephone number, including area code, of registrant’s principal executive offices)
Douglas K. Cooper
General Counsel
8540 Gander Creek Drive
Miamisburg, Ohio 45342
(877) 855-7243
(Name, Address, Including Zip Code, and Telephone Number, Including Area Code, of Agent For Service)
Copies to:
| Stuart D. Freedman, Esq. | Kirk A. Davenport, Esq. | |
| Michael R. Littenberg, Esq. | Senet S. Bischoff, Esq. | |
| Schulte Roth & Zabel LLP | Latham & Watkins LLP | |
| 919 Third Avenue | 885 Third Avenue | |
| New York, NY 10022 | New York, NY 10022 | |
| Ph: (212) 756-2000 | Ph: (212) 906-1200 | |
| Fax: (212) 593-5955 | Fax: (212) 751-4864 |
Approximate date of commencement of proposed sale to the public:
As promptly as practicable after the effective date of this Registration Statement.
If any of the securities being registered on this Form are to be offered on a delayed or continuous basis pursuant to Rule 415 under the Securities Act of 1933, other than securities offered only in connection with dividend or interest reinvestment plans, check the following box. ¨
If the only securities being registered on this Form are being offered pursuant to dividend or interest reinvestment plans, please check the following box. ¨
If this Form is filed to register additional securities for an offering pursuant to Rule 462(b) under the Securities Act, please check the following box and list the Securities Act registration statement number of the earlier effective registration statement for the same offering. ¨
If this Form is a post-effective amendment filed pursuant to Rule 462(c) under the Securities Act, check the following box and list the Securities Act registration statement number of the earlier effective registration statement for the same offering. ¨
Indicate by check mark whether the registrant is a large accelerated filer, an accelerated filer, a non-accelerated filer, or a smaller reporting company. See definitions of “large accelerated filer,” “accelerated filer,” and “smaller reporting company” in Rule 12b-2 of the Exchange Act. (Check one):
| Large accelerated filer ¨ | Accelerated filer ¨ | |
| Non-accelerated filer x | Smaller reporting company ¨ | |
| (Do not check if a smaller reporting company) |
The Registrant hereby amends this Registration Statement on such date or dates as may be necessary to delay its effective date until the Registrant shall file a further amendment which specifically states that the Registration Statement shall thereafter become effective in accordance with Section 8(a) of the Securities Act of 1933 or until the Registration Statement shall become effective on such date as the Commission, acting pursuant to said Section 8(a), may determine.
Table of Contents
The information in this preliminary prospectus is not complete and may be changed. These securities may not be sold until the registration statement filed with the Securities and Exchange Commission is effective. This preliminary prospectus is not an offer to sell nor does it seek an offer to buy these securities in any jurisdiction where the offer or sale is not permitted.
Subject to Completion. Dated August 20, 2008.
Shares

NewPage Group Inc.
Common Stock
This is an initial public offering of shares of common stock of NewPage Group Inc.
NewPage Group Inc. is offering shares in this offering. The selling stockholders identified in this prospectus are offering an additional shares of our common stock. NewPage Group Inc. will not receive any of the proceeds from the sale of shares of common stock being sold by the selling stockholders.
Prior to this offering, there has been no public market for the common stock. It is currently estimated that the initial public offering price per share will be between $ and $ per share. NewPage Group Inc. intends to apply to the New York Stock Exchange for listing of its common stock under the symbol “NWP”.
See “Risk Factors” on page 18 to read about factors you should consider before buying shares of the common stock.
Neither the Securities and Exchange Commission nor any other regulatory body has approved or disapproved of these securities or passed upon the accuracy or adequacy of this prospectus. Any representation to the contrary is a criminal offense.
| Per Share | Total | |||||
Initial public offering price | $ | $ | ||||
Underwriting discount | $ | $ | ||||
Proceeds, before expenses, to NewPage Group Inc. | $ | $ | ||||
Proceeds, before expenses, to the Selling Stockholders | $ | $ | ||||
To the extent that the underwriter sells more than shares of common stock, the underwriter has the option to purchase up to an additional shares from the selling stockholders at the initial public offering price less the underwriting discount.
The underwriter expects to deliver the shares against payment in New York, New York on , 2008.
Goldman, Sachs & Co.
Prospectus dated , 2008.
Table of Contents

Table of Contents
Prospectus
| Page | ||
| 1 | ||
| 18 | ||
| 34 | ||
| 34 | ||
| 35 | ||
| 36 | ||
| 37 | ||
| 38 | ||
| 40 | ||
| 46 | ||
Management’s Discussion and Analysis of Financial Condition and Results of Operations | 50 | |
| 50 | ||
| 76 | ||
| 94 | ||
| 116 | ||
| 118 | ||
| 124 | ||
| 127 | ||
| 129 | ||
Certain Material U.S. Federal Income and Estate Tax Considerations | 135 | |
| 138 | ||
| 142 | ||
| 142 | ||
| 142 | ||
| F-1 |
Through and including , 2008 (the 25th day after the date of this prospectus), all dealers effecting transactions in these securities, whether or not participating in this offering, may be required to deliver a prospectus. This is in addition to a dealer’s obligation to deliver a prospectus when acting as an underwriter and with respect to an unsold allotment or subscription.
No dealer, salesperson or other person is authorized to give any information or to represent anything not contained in this prospectus. You must not rely on any unauthorized information or representations. This prospectus is an offer to sell only the shares offered hereby, but only under circumstances and in jurisdictions where it is lawful to do so. The information contained in this prospectus is current only as of its date.
i
Table of Contents
This summary highlights information contained elsewhere in this prospectus. This summary is not complete and may not contain all of the information that is important to you. We urge you to read this entire prospectus, including the “Risk Factors” section and the financial statements.
In this prospectus, unless otherwise noted or the context otherwise requires, (i) the terms “we,” “our,” “ours,” “us,” “NewPage” and “Company” refer collectively to NewPage Group Inc. and its consolidated subsidiaries, (ii) the term “NewPage Group” refers to NewPage Group Inc., (iii) the term “NewPage Holding” refers to NewPage Holding Corporation, our direct wholly-owned subsidiary, (iv) the term “NewPage Corporation” refers to NewPage Corporation, our indirect wholly-owned subsidiary, (v) the term “predecessor” refers to the printing and writing papers business of MeadWestvaco Corporation prior to its acquisition by NewPage Corporation, and (vi) the term “SENA” refers to Stora Enso North America Inc. All references to the “Acquisition” refer to the acquisition of SENA by us on December 21, 2007. Following the Acquisition, SENA changed its name to NewPage Consolidated Papers Inc., or “NPCP.” References to each of SENA and NPCP are to the acquired business.
Except where we state otherwise, the information we present in this prospectus assumes no exercise by the underwriter of the option granted by us to purchase additional shares in this offering and has been adjusted to reflect a split of common stock to occur prior to the closing of this Offering.
Our Company
We believe that we are the largest coated paper manufacturer in North America based on production capacity. Coated paper is used primarily in media and marketing applications, such as corporate annual reports, high-end advertising brochures, direct mail advertising, coated labels, magazines, magazine covers and inserts and catalogs. For 2007, after giving effect to our acquisition of SENA and this offering, we had pro forma net sales of $4.7 billion, pro forma EBITDA of $487 million and pro forma income (loss) from continuing operations of $ million. For the six months ended June 30, 2008, we had net sales of $2.3 billion, and, after giving effect to this offering, pro forma EBITDA of $261 million and pro forma income (loss) from continuing operations of $ million.
After giving effect to the announced closure of our Kimberly, Wisconsin mill at the end of August 2008, we will operate 20 paper machines at ten mills located in Kentucky, Maine, Maryland, Michigan, Minnesota, Nova Scotia and Wisconsin. These mills and our distribution centers are strategically located near major print markets, such as New York, Chicago, Minneapolis and Atlanta. We are one of the most efficient coated paper manufacturers in North America. Based on data from Resource Information Systems, Inc., or “RISI”, as of the first quarter of 2008, on a pro forma basis after giving effect to the Acquisition Transactions (as defined in “Management’s Discussion and Analysis of Financial Condition and Results of Operations—Overview—The SENA Acquisition and Related Transactions”) and the closure of our Niagara and Kimberly, Wisconsin mills, we believe that all of our non-specialty coated paper machines were in the top 25% of efficiency of all non-specialty coated paper machines in North America, Europe and Asia based on the cash cost of delivered product to Chicago. Industry information in this prospectus is, unless otherwise expressly noted, derived from RISI data. “North American” data included in this prospectus that has been derived from RISI only includes data from the United States and Canada. RISI U.S. industry pricing data represents pricing from the eastern United States only (as defined by RISI). Any reference in industry statistics to grade No. 3, grade No. 4 or grade No. 5 coated paper or SC-A paper relates to 60 lb. weight, 50 lb. weight, 40 lb. weight and 35 lb. weight, respectively.
1
Table of Contents
Our mills have a total annual production capacity of approximately 4.5 million short tons of paper, including approximately 3.3 million short tons of coated paper, approximately 900,000 short tons of uncoated paper and approximately 300,000 short tons of specialty paper, after taking into account our announced restructuring and closure plans discussed in this prospectus.
We have long-standing relationships with many leading publishers, commercial printers, retailers and paper merchants. Our key customers include Condé Nast Publications, Hearst Corporation, The McGraw-Hill Companies, Meredith Corporation, Pearson Education and Time Inc. in publishing; Quad/ Graphics, Quebecor World Inc. and R.R. Donnelley & Sons Company in commercial printing; J.C. Penney Company, Inc., Target Corporation and Williams-Sonoma, Inc. in retailing; and paper merchants PaperlinX Limited, Unisource Worldwide, Inc. and xpedx, a division of International Paper Company. Key customers for specialty paper products include Avery Dennison Corporation and Vacumet Corp.
Our History
Our business is the result of two significant acquisitions, the acquisition of the printing and writing papers business of MeadWestvaco Corporation in May 2005, and the acquisition of SENA from Stora Enso Oyj, or “SEO,” in December 2007.
From MeadWestvaco, we acquired four coated paper mills with a total manufacturing capacity of approximately 2.2 million short tons of coated paper. The acquired business was the result of the larger 2002 combination of Mead Corporation and Westvaco Corporation. Following that combination and our acquisition of the MeadWestvaco printing and writing papers business, we have significantly reduced our costs through rationalization of facilities and purchasing, development of integrated marketing strategies, coordination of information and manufacturing systems and consolidation of grades at our mills. Our strategy has been to implement best practices across our mill system and to focus on increasing our overall profitability, rather than on a mill-by-mill basis.
Our acquisition of SENA more than doubled our production capacity and broadened our product line. The acquisition added SENA’s eight mills to NewPage’s existing group of mills and enhanced our market position by expanding our paper offerings to include light-weight and ultra light-weight coated paper and added complementary supercalendered paper and specialty paper products. We subsequently closed one of the acquired mills in June 2008 and announced the closure of a second mill at the end of August 2008. SEO acquired a 19.9% equity interest in NewPage Group at the time of the Acquisition.
Since 2000, significant investments have been made in our mills to improve productivity and reduce costs. We have also implemented Lean Six Sigma and other initiatives focused on reducing costs and improving operational performance. We believe that these initiatives, combined with the synergies and business strategy discussed below will enable us to further enhance our operating efficiency and profitability.
2
Table of Contents
Synergies of the SENA Acquisition and Integration of the Business
We expect to generate annualized synergies as a result of the SENA acquisition of approximately $265 million by June 2009. These synergies are expected to come from optimizing paper production, reducing input costs and reducing selling, general and administrative expenses. On January 16, 2008, we announced restructuring plans that include the shutdown of four of our less efficient, higher cash cost paper machines, which we expect to occur during 2008, as well as selected headcount reductions.
The synergies resulting from the SENA acquisition expand upon the significant investments made in our business over the last several years and involve the implementation of many of the same strategies that were successfully employed in the combination of Mead and Westvaco and following the NewPage acquisition. We intend to continue to implement best practices across our combined mill system and focus on increasing our overall profitability, rather than independently at each individual mill. We believe that the synergies resulting from the SENA acquisition will further improve productivity and reduce costs, which we believe will enhance our competitive position and enable us to serve our customers more efficiently.
The following table sets forth the principal steps we have taken and intend to take to seek to realize the expected synergies from the SENA acquisition:
Optimize Production (expected annualized synergies of approximately $145 million) | • | Reallocate production of paper grades across our combined machine base, resulting in operation of machines in narrower ranges around their peak production. |
• | Shut down or idle certain of our less efficient, highest cash cost machines. |
| • | Permanently closed one paper machine in Rumford, Maine in February 2008, one paper machine in Kimberly, Wisconsin in May 2008, and the pulp mill and two paper machines in Niagara, Wisconsin in June 2008. |
• | Use substantially all of our excess pulp production internally to reduce the amount of pulp purchased from third parties. |
Reduce Input Costs (expected annualized synergies of approximately $80 million) | • | Lower prices of key raw materials through volume purchases. |
• | Realize cost reductions from improved logistics; through reallocation of production among our combined mills, we expect to produce more product in greater proximity to customers, lowering freight rates. |
| • | Permanently close our Chillicothe, Ohio converting facility by the end of November 2008 after transferring the work to other existing facilities. |
Reduce Selling, General and Administrative Expenses (expected annualized synergies of approximately $40 million) | • | Eliminate duplicative sales, marketing, research and customer service personnel. |
• | Centralize corporate administration, management, finance, information technology and human resource functions, achieving headcount reductions and reduction of associated support costs. |
• | Lower benefit costs by freezing defined benefit pension plans and reducing retiree medical benefits for salaried employees. |
3
Table of Contents
For a description of certain risks relating to the achievement of the synergies described above, see “Risk Factors—Risks Relating to our Business—Even if we are able to successfully integrate the business of NPCP into our operations, we may not realize the anticipated synergies of the Acquisition on the timetable currently contemplated, or at all.”
On July 30, 2008, we announced that we intend to permanently close the Kimberly, Wisconsin mill by the end of August 2008. The closure will enable us to further reduce costs and is intended to better balance supply and customer demand.
Our Industry
Since 2000, the North American coated paper industry has experienced substantial consolidation. According to RISI, in 2000, 80% of the coated paper capacity in North America was attributable to eleven manufacturers. By 2008, this number had decreased to six manufacturers. According to RISI, over the same time period, there was an overall reduction in North American coated paper production capacity of more than 1.1 million short tons and, from 2004 to 2007, North American coated paper production capacity has declined by 757,000 short tons. In January 2008, we announced a further capacity reduction of 430,000 short tons of coated paper. In addition, we will close our Kimberly, Wisconsin mill at the end of August 2008, which will further reduce North American coated paper production capacity. The Kimberly mill currently produces approximately 500,000 short tons of coated paper annually.
In North America, coated paper supply is determined by both local production and imports, principally from Europe and Asia. From 2004 through the end of 2006, imports of coated paper grew at a slower pace than from 2000 through 2003. We believe that this was largely due to an increase in demand in Asian markets and a reduction of supply in Europe combined with an increase in European demand and less favorable exchange rates for European producers. In 2007, total coated paper imports into North America declined to 19%, compared to 20% of total coated paper purchases in 2006, due in part to less favorable exchange rates for foreign producers, higher ocean-going freight costs and lower U.S. demand, according to RISI. RISI projects coated paper imports into North America to be 18% of total coated paper purchases in 2008, 19% of total coated paper purchases in 2009 and 21% of total coated paper purchases for 2010 to 2013.
Operating rates for North American coated paper manufacturers, which are a function of North American supply and demand, are expected to remain favorable through 2013 because demand is expected to continue to exceed North American capacity. Historically, high operating rates have resulted in higher prices for coated paper. According to RISI, the average operating rate for North American coated paper manufacturers, which measures the ratio of shipments from producers in a particular region to capacity of producers in the same region, rose from 86% in 2001 to 97% in 2007, as shipments increased more than capacity during this time period. RISI projects the average coated paper operating rate to be 95% in 2008 and remain above 92% through 2013.
Since mid-2004, coated paper prices in the United States have generally risen due to a combination of demand and decreased North American capacity resulting from capacity rationalization. Our weighted-average coated paper prices rose from $797 per ton in 2004 to $988 per ton for the second quarter of 2008.
As a result of the expiration of annual customer price caps and price increases announced in the fourth quarter of 2007, U.S. market prices increased approximately $95 per ton for coated groundwood paper and $60 per ton for coated freesheet paper from December 2007 through June 2008. In May 2008, we announced a $60 per ton price increase on most coated and supercalendered paper grades,
4
Table of Contents
effective beginning in July 2008. When coated paper manufacturers announce price increases, they generally take effect over time. Whether a price increase is successful depends on supply, demand and other competitive factors in the marketplace.
According to RISI, in the first half of 2008, North American coated paper demand declined by 5.9%, compared to the same period in 2007, as a result of decreased advertising spending and magazine and catalog circulation. North American coated paper demand is projected by RISI to decline by 10% for the second half of 2008 compared to the second half of 2007.
Notwithstanding the decline in demand, primarily as a result of capacity reductions, RISI forecasts the average price of grade no. 3 coated paper to increase to $1,063 per ton in 2008 from $928 per ton in 2007 and the average price of grade no. 4 coated paper to increase to $1,048 per ton in 2008 from $878 per ton in 2007. RISI forecasts the average prices of both grades to be above $1,000 per ton through 2013.
We believe that we are well positioned to benefit from the strengthening pricing environment for coated paper as result of our business strategy and strengths described below.
Business Strategy
The key elements of our strategy include the following:
Maintain core focus on coated paper business. We believe that our focus on producing coated paper provides us with a significant competitive advantage by enabling us to lower production costs per ton due to greater economies of scale, reduce delivery costs as a result of larger shipment sizes and provide a higher level of customer service. With the acquisition of SENA, we extended our product breadth into light-weight and ultra light-weight coated groundwood papers and added volume to our existing coated paper grades. The Acquisition also added capacity of supercalendered uncoated groundwood papers, a complementary lower cost alternative to coated paper, primarily for magazine and catalog use.
Continue to reduce costs through synergies and further productivity improvements. We expect to generate annualized synergies as a result of the Acquisition of approximately $265 million to be achieved by June 2009. For a further discussion of these plans, see “—Synergies of the SENA Acquisition.” Since January 2000, we have significantly reduced our costs through rationalization of facilities and purchasing, development of integrated marketing strategies, coordination of information and manufacturing systems and consolidation of grade lines. In addition, since 2000, we have implemented best practices across our mill system and have focused on maximizing overall profitability, rather than independently at each individual mill. Without giving effect to the Acquisition or expected synergies, according to RISI, the cash cost per ton excluding delivery of the four original NewPage mills improved from an 8%, or $47 per ton, advantage over the North American average in 2002 to a 15%, or $98 per ton, advantage over the North American average in the fourth quarter of 2007. For the first quarter of 2008, on a combined basis after giving effect to the Acquisition but without giving effect to our announced restructuring and closure plans discussed in this prospectus, according to RISI, our cash cost per ton excluding delivery represented an advantage of 7%, or $48 per ton, over the North American average. We will continue to implement additional measures, including the use of Lean Six Sigma initiatives, to enhance our operating efficiency and productivity. We believe that the synergies resulting from the Acquisition and these additional measures will enhance our ability to further decrease production costs per ton and to increase operating cash flow and margins.
Enhance product mix to improve margins and earnings. We continue to seek opportunities to increase sales of higher-margin grades of coated paper, such as higher-end grades of coated papers and ultra light-weight coated groundwood papers. We intend to continue to do so through
5
Table of Contents
increased sales to our existing customers as well as to new customers, in particular printers, publishers and paper merchants. For example, as part of our initiative to enhance product mix, from 2005 to 2007, we increased net sales of our caliper papers, which are higher-end grades of coated paper used largely in direct mail applications, by approximately 35%. We also seek to increase our margins by focusing on more profitable customer categories, such as corporate end users, and expanding our relationships with these customers.
Further improve cash flow and return on capital. Since the inception of our company, we have focused on increasing our cash flow and our return on capital, including through the strategy initiatives discussed above. We also adopted and have continued to implement a capital expenditure plan that is focused on attractive investment projects. In addition, we believe, based on our current business plans, capital structure, tax position and current tax law, that we will not be required to pay material U.S. federal income taxes until 2010. We believe that our current productivity initiatives and the synergies and closure described herein, coupled with favorable pricing trends for coated paper, will enhance our ability to generate cash flow and improve our return on capital. We intend to use our cash flow to repay debt and finance continued improvements in our operations. In addition, we may use our cash flow to return capital to shareholders through dividends and/or share repurchases and to selectively pursue synergistic acquisitions and/or strategic partnerships.
Business Strengths
We believe that our core strengths include the following:
Largest North American manufacturer of coated paper products. Our mills have a total annual production capacity of approximately 3.3 million short tons of coated paper, after taking into account our announced restructuring and closure plans discussed in this prospectus. Our production capacity represents approximately 26% of 2008 North American production capacity and net North American imports of coated paper, according to RISI. The SENA acquisition enhanced our market position by expanding our paper offerings to include light-weight and ultra light-weight coated paper and added complementary offerings in supercalendered paper and specialty paper products. We believe that our broad product portfolio, well-known brands and service will help us to remain a leading supplier of coated paper products.
Well positioned to benefit from strengthening pricing environment. We believe that we are well positioned to benefit from price increases in the coated paper industry as a result of our product breadth and long-standing customer relationships. Since June 2004, North American coated paper prices have generally risen due to a combination of demand and decreased North American capacity resulting from capacity rationalization. From 2000 to 2007, North American production capacity for coated paper declined by over 1.1 million short tons, and production capacity declined by 757,000 short tons from 2004 to 2007, according to RISI. In addition, in 2008, we shut down machines and announced mill closures that will result in the permanent reduction of approximately 930,000 tons of coated paper capacity. We believe that North American and U.S. coated paper demand will continue to exceed North American capacity for the foreseeable future. The strengthening pricing environment has enabled us to successfully raise prices to improve profitability.
Attractive cost position coupled with further profit improvement initiatives. As of the first quarter of 2008, on a pro forma basis after giving effect to the Acquisition Transactions and our announced restructuring and closure plans discussed in this prospectus, we believe that all of our non-specialty coated paper machines were in the top 25% of efficiency of all non-specialty coated paper
6
Table of Contents
machines in North America, Europe and Asia based on the cash cost of delivered product to Chicago, based on RISI data. Since 2000, over $500 million has been invested in the original NewPage mills to maintain or improve a cost advantage over our competitors. In addition, since January 2000, we have significantly reduced our costs through rationalization of facilities and purchasing, development of integrated marketing strategies, coordination of information and manufacturing systems and consolidation of grade lines at our mills by implementing best practices across our mill system and focusing on increasing overall profitability, rather than on a mill-by-mill basis. From 2000 until the Acquisition, SENA invested over $700 million in its business, including several major capital projects involving the rebuilding of paper machines at the Biron, Wisconsin Rapids and Whiting mills. We believe that we will be able to further enhance our operating efficiency and profitability as a result of the initiatives described above, the synergies we anticipate in connection with the SENA acquisition, the closures of the Kimberly and Niagara, Wisconsin mills, our ability to generate a substantial portion of our energy needs and to adjust in part our mix of externally and internally sourced energy and our production of low cost pulp through our integrated pulp operations.
Strong relationships with key customers. We have long-standing relationships with leading publishers, paper merchants, commercial printers and retailers. We believe our sales strategy, which includes both direct sales to our larger customers and sales to merchants, who then resell our products, has reduced sales costs and enhanced customer service. Our relationships with our five largest customers, which contributed approximately 39% of our pro forma net sales for 2007, average over 38 years. We seek to continue to enhance our relationships with our key customers by providing them with a high level of value-added customer service.
Efficient and integrated supply chain. We believe that the location of our mills and distribution centers near major print markets, such as New York, Chicago, Minneapolis and Atlanta, affords us the ability to more quickly and cost-effectively deliver our products to those markets. In addition, we believe that our fully-implemented integrated ERP system enables us to run our operations more cost-effectively through better planning of manufacturing runs and tracking of costs and inventory and will better enable us to realize some of the anticipated synergies of the Acquisition. Our ERP system also enhances our customer service, because it gives many of our customers the ability to order products and to track the real-time progress of their orders online. As part of the reorganization plan associated with the SENA acquisition, we are in the process of migrating the SENA mills to our existing ERP system and integrating SENA’s order management, purchasing, inventory and finance information systems with our existing systems.
Experienced management team with proven track record. Our senior management team averages approximately 12 years of experience in the paper and forest products industry, and several members of our management team were responsible for the successful integration of Mead and Westvaco into a stand-alone business, which has resulted in improved cost structure and meaningful cash flow. Our chairman and chief executive officer, Mark A. Suwyn, was chairman and chief executive officer of Louisiana-Pacific Corporation, a building product materials manufacturing company. Mr. Suwyn headed Louisiana-Pacific from 1996 to 2004. Prior to Louisiana-Pacific, Mr. Suwyn served as an executive vice president at International Paper. Our chief operating officer, Richard D. Willett, Jr., had 13 years of broad management experience with General Electric Company followed by three years with Teleglobe International Holdings, where he was chief financial officer and subsequently chief operating officer. At Teleglobe, Mr. Willett led a major restructuring, cost reduction and acquisition effort. In addition to strong general management skills, Mr. Willett brings extensive leadership experience in disciplined cost management and process management initiatives such as Lean Six Sigma.
7
Table of Contents
Our Sponsor
Founded in 1992, Cerberus Capital Management, L.P. and its affiliated management companies, which we collectively refer to as “Cerberus,” comprise one of the largest private investment firms in the world with in excess of $27 billion of capital under management in funds and accounts. Cerberus currently has majority or significant minority investments in companies around the world. In aggregate, these companies generate more than $100 billion in annual revenues and employ over 250,000 people. Cerberus invests in divestitures, turnarounds, recapitalizations, financial restructurings, public-to-privates and management buyouts in a variety of sectors. Cerberus formed NewPage in 2005 to effect the acquisition of the coated paper operations of MeadWestvaco Corporation.
Our Corporate Information
NewPage Group is a Delaware corporation. Our principal executive offices are located at 8540 Gander Creek Drive, Miamisburg, Ohio 45342, and our telephone number at those offices is (877) 855-7243. Our website address is www.newpagecorp.com. The information contained on our website does not constitute part of, nor is it incorporated into, this prospectus.
8
Table of Contents
Organizational Structure
The following chart shows our organizational structure immediately after giving effect to the consummation of this offering. All of the direct and indirect subsidiaries of NewPage Group are wholly-owned.
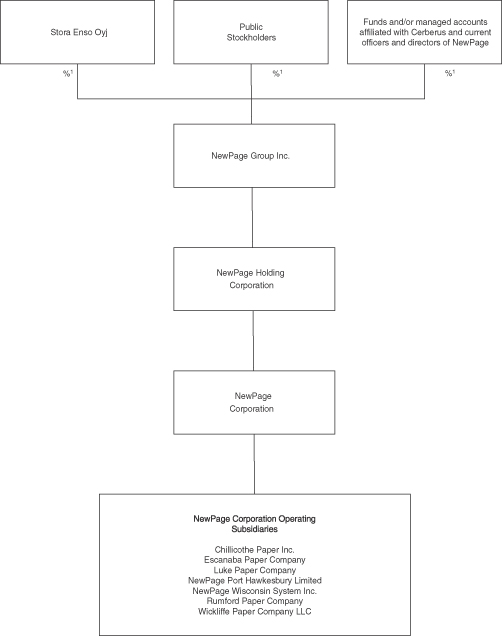
1 | Assumes no exercise by the underwriter of the option to purchase an additional shares from the selling stockholders to cover over-allotments and does not take into account up to shares that may be issued upon the exercise of options under the NewPage Group Inc. 2008 Incentive Plan, or “NewPage Group Incentive Plan.” Also assumes the sale of shares of common stock in this offering at an assumed initial public offering price of $ per share, the midpoint of the range set forth on the cover page of this prospectus. |
9
Table of Contents
THE OFFERING
Common stock offered by us | shares |
Common stock offered by the selling stockholders | shares |
Common stock to be outstanding immediately after this offering | shares |
Use of proceeds | We will receive net proceeds from the offering of approximately $ million. |
| We intend to use the net proceeds from this offering as follows: |
• | approximately $ million to redeem in full the outstanding NewPage Holding floating rate senior unsecured PIK Notes due 2013, or “NewPage Holding PIK Notes”; and |
• | approximately $ million to redeem in full the outstanding NewPage Group floating rate senior unsecured PIK Notes due 2015, or “NewPage Group PIK Notes.” |
| We will not receive any of the proceeds from the common stock sold by the selling stockholders in this offering. |
| The number of shares to be sold by us will be adjusted upwards or downwards, to the extent applicable, to maintain constant net proceeds to us of approximately $ million, and the aggregate number of shares to be sold by the selling stockholders will be adjusted downwards or upwards by an equal amount. |
| See “Use of Proceeds.” |
Dividend policy | We do not intend to pay cash dividends on our common stock for the foreseeable future. |
Proposed New York Stock Exchange symbol | “NWP” |
Risk factors | For a discussion of risks relating to our company, our business and an investment in our common stock, see “Risk Factors” and all other information set forth in this prospectus before investing in our common stock. |
Unless we specifically state otherwise, the information in this prospectus:
| Ÿ | assumes a - for- split of our common stock prior to the closing of this offering, |
| Ÿ | assumes the sale of common stock in this offering at an assumed initial public offering price of $ per share, the midpoint of the range set forth on the cover page of this prospectus, |
| Ÿ | excludes the sale of up to shares of common stock by the selling stockholders, which the underwriter has the option to purchase to cover over-allotments, and |
| Ÿ | excludes up to additional shares issuable upon exercise of options outstanding under the NewPage Group Incentive Plan. |
10
Table of Contents
Summary Historical and Pro Forma Consolidated Financial Data
The following tables, as indicated below, set forth historical combined predecessor and successor financial data for the year ended December 31, 2005, consisting of the printing and writing papers business of MeadWestvaco for the four months ended April 30, 2005 (predecessor) and NewPage Group and its subsidiaries for the eight months ended December 31, 2005 (successor), and historical consolidated financial data for NewPage Group and its subsidiaries for the years ended December 31, 2006 and 2007. We have derived the historical consolidated financial data for the years ended December 31, 2006 and 2007 from the audited consolidated financial statements of NewPage Group and its subsidiaries included elsewhere in this prospectus. We have derived the historical combined predecessor and successor financial data for the year ended December 31, 2005 in part from the audited consolidated financial statements of NewPage Group and its subsidiaries and in part from the audited combined financial statements of the printing and writing paper business of MeadWestvaco, in each case, included elsewhere in this prospectus. We have derived the historical consolidated financial data for NewPage Group and its subsidiaries as of June 30, 2008 and for the six months ended June 30, 2007 and 2008 from the unaudited consolidated financial statements of NewPage Group and its subsidiaries included elsewhere in this prospectus, which reflect all adjustments (consisting only of normal recurring adjustments) which are, in the opinion of management, necessary for a fair presentation of that information for the periods presented.
The following tables, as indicated below, set forth historical financial data for SENA for the periods indicated. We have derived the financial data for SENA for the years ended December 31, 2005 and 2006 from the audited financial statements of SENA included elsewhere in this prospectus. We have derived the financial data for SENA for the nine months ended September 30, 2006 and 2007 from the unaudited financial statements of SENA included elsewhere in this prospectus, which reflect all adjustments (consisting only of normal recurring adjustments) which are, in the opinion of management, necessary for a fair presentation of that information for the periods presented.
The pro forma statement of operations data gives effect to the Acquisition Transactions and this offering as if they had occurred on January 1, 2007. The unaudited pro forma consolidated balance sheet at June 30, 2008 gives effect to this offering as if it had occurred on June 30, 2008. The pro forma consolidated financial data are unaudited, are for informational purposes only and are not necessarily indicative of what our financial position or results of operations would have been had the Acquisition Transactions and this offering been completed as of such dates and do not purport to represent what our financial position, results of operations or cash flows might be for any future period. The pro forma data assumes that the common stock is offered at $ per share, the midpoint of the range set forth on the cover page of this prospectus, and after deducting the estimated underwriting discount on the shares offered by us and our estimated expenses of the offering.
The Acquisition has been accounted for using the purchase method of accounting. Under purchase accounting, the total Acquisition consideration was allocated to the assets and liabilities of SENA based upon the fair value of assets being acquired and liabilities being assumed. The June 30, 2008 balance sheet data reflects management’s preliminary valuation of assets being acquired and liabilities being assumed. The final allocation of the Acquisition consideration will be based upon management’s consideration of final valuations and adjustments relating to the finalization of the restructuring plan and uncertain and deferred tax positions. Any adjustments based on that final valuation may change the allocations of the Acquisition consideration, which could affect the fair value assigned to the assets and liabilities and could result in a material change to the June 30, 2008 balance sheet data.
11
Table of Contents
The following summary historical and pro forma consolidated financial data should be read in conjunction with “Unaudited Pro Forma Consolidated Financial Data,” “Selected Financial Information and Other Data,” “Management’s Discussion and Analysis of Financial Condition and Results of Operations” and the financial statements, and the accompanying notes thereto, of each of NewPage and SENA included elsewhere in this prospectus.
12
Table of Contents
NewPage Group and Pro Forma for the Acquisition and this Offering
| Non-GAAP(1) | Successor | |||||||||||||||||||||||||||
| Combined Predecessor and Successor Year Ended December 31, 2005 | Year Ended December 31, 2006 | Year Ended December 31, 2007 | Six Months Ended June 30, 2007 | Six Months Ended June 30, 2008 | Pro Forma Year Ended December 31, 2007 | Pro Forma Six Months Ended June 30, 2008 | ||||||||||||||||||||||
| (dollars in millions, except per share amounts and price per ton) | ||||||||||||||||||||||||||||
Statement of Operations Data: | ||||||||||||||||||||||||||||
Net sales | $ | 1,863 | $ | 2,038 | $ | 2,168 | $ | 971 | $ | 2,253 | $ | $ | �� | |||||||||||||||
Cost of sales | 1,690 | 1,825 | 1,895 | 877 | 2,032 | |||||||||||||||||||||||
Selling, general and administrative expenses | 100 | 112 | 127 | 52 | 117 | |||||||||||||||||||||||
Interest expense | 142 | 165 | 176 | 75 | 160 | |||||||||||||||||||||||
Other (income) expense net | 16 | (25 | ) | (1 | ) | — | (8 | ) | ||||||||||||||||||||
Income (loss) from continuing operations before income taxes | (85 | ) | (39 | ) | (29 | ) | (33 | ) | (48 | ) | ||||||||||||||||||
Income tax (benefit) | (10 | ) | (3 | ) | (6 | ) | (1 | ) | (13 | ) | ||||||||||||||||||
Income (loss) from continuing operations | (75 | ) | (36 | ) | (23 | ) | (32 | ) | (35 | ) | ||||||||||||||||||
Income (loss) from discontinued operations | — | (16 | ) | — | — | — | — | |||||||||||||||||||||
Net income (loss) | $ | (75 | ) | $ | (52 | ) | $ | (23 | ) | $ | (32 | ) | $ | (35 | ) | $ | $ | |||||||||||
Income (loss) per share-basic and diluted: | ||||||||||||||||||||||||||||
Income (loss) from continuing operations | $ | (1.67 | ) | $ | (0.80 | ) | $ | (0.51 | ) | $ | (0.70 | ) | $ | (0.63 | ) | $ | $ | |||||||||||
Income (loss) from discontinued operations | — | (0.35 | ) | — | — | — | — | |||||||||||||||||||||
Net income (loss) | $ | (1.67 | ) | $ | (1.15 | ) | $ | (0.51 | ) | $ | (0.70 | ) | $ | (0.63 | ) | $ | $ | |||||||||||
Weighted-average number of common shares outstanding (in thousands) | ||||||||||||||||||||||||||||
Basic | 45,056 | 45,056 | 45,395 | 45,288 | 56,073 | |||||||||||||||||||||||
Diluted | 45,056 | 45,056 | 45,395 | 45,288 | 56,073 | |||||||||||||||||||||||
Income (loss) per share assuming the stock split contemplated by this offering—basic and diluted: | ||||||||||||||||||||||||||||
Income (loss) from continuing operations | $ | $ | $ | $ | $ | $ | $ | |||||||||||||||||||||
Income (loss) from discontinued operations | ||||||||||||||||||||||||||||
Net income (loss) | $ | $ | $ | $ | $ | $ | (3) | $ | (3) | |||||||||||||||||||
Weighted-average number of common shares outstanding assuming the stock split contemplated by this offering (in thousands) | ||||||||||||||||||||||||||||
Basic | ||||||||||||||||||||||||||||
Diluted | ||||||||||||||||||||||||||||
Other Financial Data: | ||||||||||||||||||||||||||||
EBITDA(2) | $ | 231 | $ | 262 | $ | 281 | $ | 109 | $ | 261 | $ | 487 | $ | 261 | ||||||||||||||
Capital expenditures | 76 | 88 | 102 | 34 | 71 | 152 | 71 | |||||||||||||||||||||
Selected Operations Data: | ||||||||||||||||||||||||||||
Coated paper volume sold (in thousands of short tons) | 2,032 | 2,116 | 2,261 | 1,025 | 1,912 | 4,342 | 1,912 | |||||||||||||||||||||
Weighted-average coated paper price per ton | $ | 872 | $ | 893 | $ | 886 | $ | 875 | $ | 969 | $ | 900 | $ | 969 | ||||||||||||||
13
Table of Contents
| Actual | Pro Forma | |||||
| As of June 30, 2008 | ||||||
| (dollars in millions) | ||||||
Balance Sheet Data: | ||||||
Cash and cash equivalents | $ | 41 | $ | |||
Working capital(4) | 509 | |||||
Total assets | 4,841 | |||||
Long-term debt | 3,293 | |||||
SENA
| Year Ended December 31, 2005 (Restated) | Year Ended December 31, 2006 (Restated) | Nine Months Ended September 30, 2006 (Restated) | Nine Months Ended September 30, 2007 (Restated) | |||||||||||||
| (dollars in millions, except price per ton) | ||||||||||||||||
Statement of Operations Data: | ||||||||||||||||
Net sales | $ | 2,374 | $ | 2,176 | $ | 1,584 | $ | 1,864 | ||||||||
Cost of sales | 2,303 | 2,135 | 1,552 | 1,846 | ||||||||||||
Selling, general and administrative expenses | 113 | 108 | 81 | 67 | ||||||||||||
Goodwill impairment | 162 | — | — | — | ||||||||||||
Property, plant and equipment impairment | — | 113 | — | — | ||||||||||||
Interest expense | 75 | 92 | 68 | 61 | ||||||||||||
Other (income) expense net | (4 | ) | (1 | ) | (1 | ) | (1 | ) | ||||||||
Income (loss) before income taxes | (275 | ) | (271 | ) | (116 | ) | (109 | ) | ||||||||
Income tax (benefit) | 7 | (28 | ) | (14 | ) | (25 | ) | |||||||||
Net income (loss) | $ | (282 | ) | $ | (243 | ) | $ | (102 | ) | $ | (84 | ) | ||||
Other Financial Data: | ||||||||||||||||
EBITDA(2) | $ | 92 | $ | 88 | $ | 153 | $ | 142 | ||||||||
Capital expenditures | 83 | 60 | 42 | 38 | ||||||||||||
Selected Operating Data: | ||||||||||||||||
Coated paper volume sold (in thousands of short tons) | 1,933 | 1,999 | 1,506 | 1,601 | ||||||||||||
Weighted-average coated paper price per ton | $ | 911 | $ | 927 | $ | 929 | $ | 904 | ||||||||
| (1) | For comparison purposes, we have presented the results of operations for 2005 on a combined basis, consisting of the historical results of our predecessor for the four months ended April 30, 2005 and the historical results of operations of the successor for the eight months ended December 31, 2005. For a presentation of these periods on a predecessor and successor basis, see “Selected Financial Information and Other Data.” The presentation of the operations of our predecessor during the periods prior to our acquisition of the printing and writing paper business of MeadWestvaco do not reflect the significant effect that the accounting for that acquisition and related transactions has had on the reporting of our financial condition and results of operations. We believe that this presentation is beneficial to the reader by providing an easier-to-read discussion of results of operations and provides the reader with information from which to analyze our financial results that is consistent with the manner that management reviews and analyzes results of operations. Furthermore, disclosures regarding sales volumes, spending and other operational measures are determined on a comparable basis for all periods presented. The |
14
Table of Contents
discussion is provided for comparative purposes only, but the value of such a comparison may be limited. Some of the factors that limit the usefulness of this presentation include the combination of results based on different accounting bases for predecessor and successor periods, differences in capitalization and the effects resulting from the change from a division of a larger entity to a stand-alone company. |
| (2) | EBITDA is defined as net income (loss) before interest expense, income taxes, depreciation and amortization. |
| EBITDA is not a measure of our performance under GAAP and not intended to represent net income (loss), as defined under GAAP, and should not be used as an alternative to net income (loss) as an indicator of performance. EBITDA is included in this prospectus because it is a primary component of certain covenants under our senior secured credit facilities and is a basis upon which our management assesses performance. For a more detailed discussion of the covenants, see “Description of Certain Indebtedness.” In addition, our management believes EBITDA is useful to investors because it and similar measures are frequently used by securities analysts, investors and other interested parties in the evaluation of companies with substantial financial leverage. |
| The use of EBITDA instead of net income (loss) has limitations as an analytical tool, and you should not consider it in isolation, or as a substitute for analysis of our results as reported under GAAP. Some of these limitations are: |
| • | EBITDA does not reflect our current cash expenditure requirements, or future requirements, for capital expenditures or contractual commitments; |
| • | EBITDA does not reflect changes in, or cash requirements for, our working capital needs; |
| • | EBITDA does not reflect the significant interest expense, or the cash requirements necessary to service interest or principal payments, on our debt; |
| • | although depreciation and amortization are non-cash charges, the assets being depreciated and amortized often will have to be replaced in the future, and EBITDA does not reflect any cash requirements for such replacements; and |
| • | our measure of EBITDA is not necessarily comparable to other similarly titled captions of other companies due to potential inconsistencies in the methods of calculation. |
Because of these limitations, EBITDA should not be considered as discretionary cash available to us to reinvest in the growth of our business.
15
Table of Contents
The following table presents a reconciliation of NewPage Group’s net income (loss) to EBITDA:
| Non-GAAP | Successor | |||||||||||||||||||||||||||
| Combined Predecessor and Successor Year Ended December 31, 2005 | Year Ended December 31, 2006 | Year Ended December 31, 2007 | Six Months Ended June 30, 2007 | Six Months Ended June 30, 2008 | Pro Forma Year Ended December 31, 2007 | Pro Forma Six Months Ended June 30, 2008 | ||||||||||||||||||||||
| (dollars in millions) | ||||||||||||||||||||||||||||
Net income (loss) | $ | (75 | ) | $ | (52 | ) | $ | (23 | ) | $ | (32 | ) | $ | (35 | ) | $ | $ | |||||||||||
Income tax provision (benefit) (including amount in discontinued operations) | (11 | ) | (3 | ) | (6 | ) | (1 | ) | (13 | ) | ||||||||||||||||||
Interest expense | 142 | 165 | 176 | 75 | 160 | |||||||||||||||||||||||
Depreciation and amortization | 175 | 152 | 134 | 67 | 149 | |||||||||||||||||||||||
EBITDA | $ | 231 | $ | 262 | $ | 281 | $ | 109 | $ | 261 | $ | $ | ||||||||||||||||
The following items included in NewPage Group’s results of operations are excluded under the definition of “consolidated adjusted EBITDA” used to calculate compliance with the financial covenants in our senior secured credit facilities. See “Description of Certain Indebtedness—Senior Secured Credit Facilities—Covenants” for a description of these covenants and the definition of “consolidated adjusted EBITDA.” Pro forma information for the six months ended June 30, 2008 is not presented because it would be the same as the historical information presented for the six months ended June 30, 2008.
| Non-GAAP | Successor | ||||||||||||||||||||
| Combined Predecessor and Successor Year Ended December 31, 2005 | Year Ended December 31, 2006 | Year Ended December 31, 2007 | Six Months Ended June 30, 2007 | Six Months Ended June 30, 2008 | Pro Forma Year Ended December 31, 2007 | ||||||||||||||||
| (dollars in millions) | |||||||||||||||||||||
Equity awards(a) | $ | 1 | $ | 11 | $ | 14 | $ | 1 | $ | 15 | $ | 14 | |||||||||
LIFO effect(b) | 10 | (2 | ) | 1 | 4 | 14 | 1 | ||||||||||||||
(Gain) loss on the sales of business/assets(c) | — | (63 | ) | 3 | 1 | 2 | 9 | ||||||||||||||
Unrealized (gain) loss on commodity basket option(d) | 25 | 47 | — | — | — | — | |||||||||||||||
Pension loss/OPEB curtailment loss | — | — | 1 | 1 | — | 4 | |||||||||||||||
Transition costs(e) | 14 | 8 | — | — | — | — | |||||||||||||||
Discontinued operations(f) | — | 19 | — | — | — | — | |||||||||||||||
Closure/restructuring(g) | — | 6 | — | — | — | 8 | |||||||||||||||
Integration-related costs(h) | — | — | 5 | — | 24 | 5 | |||||||||||||||
Other adjustments(i) | — | — | 3 | 3 | — | 10 | |||||||||||||||
Total | $ | 50 | $ | 26 | $ | 27 | $ | 10 | $ | 55 | $ | 51 | |||||||||
| (a) | Represents the non-cash charge for equity awards granted to certain members of management. |
| (b) | Represents the difference in accounting treatment for LIFO methodology compared to FIFO methodology for inventory. |
| (c) | Represents the non-cash (gain) loss on the sale of assets. The gain for the year ended December 31, 2006 is primarily from the sale of the hydroelectric generating facilities in Maine. |
| (d) | Represents a non-cash loss based on the mark-to-market value of the commodity basket option contract. |
| (e) | Represents transitional costs incurred relating to the setup of our business as a stand-alone business, including professional services and consulting costs related to information technology, human resources and finance. |
| (f) | Represents the loss from the sale of our carbonless paper business, including curtailment and settlement costs related to the employee benefit plans. |
| (g) | Represents machine closure costs and costs for severance and the restructuring charge taken in connection with fixed cost reduction efforts and contract settlements. |
16
Table of Contents
| (h) | Represents costs related to the integration of SENA and NewPage, including severance and benefits for duplicative sales and administration positions. |
| (i) | Represents expenses of SENA for periods prior to the Acquisition that are no longer incurred. Expenses include costs allocated to SENA from SEO that did not continue after the Acquisition, costs for legal matters that were retained by SEO and costs expensed for information technology investments. |
The following table presents a reconciliation of SENA’s net income (loss) to EBITDA:
| Year Ended December 31, 2005 (Restated) | Year Ended December 31, 2006 (Restated) | Nine Months Ended September 30, 2006 (Restated) | Nine Months Ended September 30, 2007 (Restated) | |||||||||||||
| (dollars in millions) | ||||||||||||||||
Net income (loss) | $ | (282 | ) | $ | (243 | ) | $ | (102 | ) | $ | (84 | ) | ||||
Depreciation and amortization | 292 | 267 | 201 | 190 | ||||||||||||
Income tax (benefit) | 7 | (28 | ) | (14 | ) | (25 | ) | |||||||||
Interest expense | 75 | 92 | 68 | 61 | ||||||||||||
EBITDA | $ | 92 | $ | 88 | $ | 153 | $ | 142 | ||||||||
The following items included in SENA’s results of operations are excluded under the definition of “consolidated adjusted EBITDA” used to calculate compliance with the financial covenants in our senior secured credit facilities. See “Description of Certain Indebtedness—Senior Secured Credit Facilities—Covenants” for a description of these covenants and the definition of “consolidated adjusted EBITDA.”
| Year Ended December 31, 2005 | Year Ended December 31, 2006 | Nine Months Ended September 30, 2006 | Nine Months Ended September 30, 2007 | |||||||||
| (dollars in millions) | ||||||||||||
Port Hawkesbury lockout(a) | $ | — | $ | 41 | $ | 41 | $ | — | ||||
Goodwill impairment | 162 | — | — | — | ||||||||
Property, plant and equipment impairment | — | 113 | — | — | ||||||||
Loss on sale of assets | 13 | 3 | 1 | 3 | ||||||||
Pension/OPEB curtailment loss | — | 14 | 14 | 3 | ||||||||
Closures/restructuring(b) | 15 | — | — | 8 | ||||||||
Other adjustments(c) | 9 | 15 | 10 | 11 | ||||||||
Total | $ | 199 | $ | 186 | $ | 66 | $ | 25 | ||||
| (a) | Represents the costs incurred that were not absorbed because of lost production during the closure of the Port Hawkesbury mill from December 2005 until October 2006 due to a labor dispute. SENA continued to incur the same types of costs following the reopening of the mill. |
| (b) | Represents machine closure costs and costs for severance and the restructuring charge taken in connection with fixed cost reduction efforts and contract settlements. |
| (c) | Represents expenses of SENA for periods prior to the Acquisition that are no longer incurred. Expenses include costs allocated to SENA from SEO that did not continue after the Acquisition, costs for legal matters that were retained by SEO and costs expensed for information technology investments. |
| (3) | A $1 increase in the assumed initial public offering price would increase our pro forma net income (loss) per share for the year ended December 31, 2007 by approximately $ per share and for the six months ended June 30, 2008 by approximately $ per share. A $1 decrease in the assumed initial public offering price would decrease our pro forma net income (loss) per share for the year ended December 31, 2007 by approximately $ per share and for the six months ended June 30, 2008 by approximately $ per share. |
| (4) | “Working capital” is defined as current assets net of current liabilities. |
17
Table of Contents
An investment in our common stock involves a high degree of risk. You should carefully consider the risk factors discussed below as well as the other information contained in this prospectus before buying shares of our common stock. If any of the following risks or uncertainties occurs, our business, financial condition and operating results could be materially and adversely affected. As a result, the trading price of our common stock could decline and you may lose all or a part of the money you paid to buy our common stock.
Risks Relating to our Business
We may not realize the anticipated benefits of the Acquisition.
We completed the Acquisition on December 21, 2007. Although we expect to realize strategic, operational and financial benefits as a result of the Acquisition, we cannot predict whether and to what extent these benefits will be achieved. Successful integration of NewPage and NPCP will depend on management’s ability to manage the combined operations effectively and to benefit from cost savings and operating efficiencies. There are significant challenges to integrating the NPCP operations into our business, including:
| Ÿ | integrating the senior management and key personnel of NewPage and NPCP; |
| Ÿ | potential disruptions of both companies’ businesses caused by the Acquisition; |
| Ÿ | successfully managing the operations, manufacturing facilities and supply chain of NPCP and integrating them with our existing business; |
| Ÿ | maintaining the customer base for NewPage and NPCP products; |
| Ÿ | the diversion of management’s and other’s attention; |
| Ÿ | maintaining effective internal control procedures for the combined company; and |
| Ÿ | integrating management information, inventory, accounting and sales systems of NewPage and NPCP. |
In addition, the Acquisition created a significantly larger combined company, which may increase the challenge of integrating the NPCP operations into our business.
If we are not able to successfully integrate the NPCP business, the anticipated synergies and cost savings may not be achieved. In addition, our failure to successfully integrate and operate the NPCP business, and to realize the anticipated benefits of the Acquisition, could adversely affect our operating performance and financial results.
Even if we are able to successfully integrate the business of NPCP into our operations, we may not realize the anticipated synergies of the Acquisition on the timetable currently contemplated, or at all.
We expect to generate annualized synergies as a result of the Acquisition of approximately $265 million by June 2009. We cannot assure you that these synergies will be achieved on the timetable contemplated and in the amounts expected, or at all. In connection with achieving these synergies, we expect to make capital expenditures of approximately $35 million in 2008. In connection with achieving these synergies, we also expect to incur expenses and restructuring charges in 2008 and to a lesser extent in 2009 of up to approximately $50 million in the aggregate, which relate to severance and early retirement benefits, costs of relocating employees and assets and costs of integrating the two businesses, including investments in information systems. In addition, we expect to record up to
18
Table of Contents
approximately $45 million in the aggregate as a liability in the initial purchase price allocation in connection with achieving these synergies, which relates to cash payments that we expect to make in 2008 and to a lesser extent in 2009 in connection with severance and early retirement benefits of NPCP employees, costs of relocating employees of NPCP and contract termination costs. Additional adjustments to these estimates are likely to occur as we finalize union negotiations and severance arrangements and finalize the restructuring plan, including the effects of sales or dispositions of assets and facilities.
Achieving the expected synergies, as well as the costs of achieving them, is subject to a number of uncertainties, including our ability to negotiate lower raw material prices from suppliers and transportation providers, to make necessary investments in information systems and equipment to rebalance production in a timely and cost efficient manner and to avoid unexpected downtime resulting from changing production on machines or at mills. If we encounter difficulties in achieving the expected synergies, incur significantly greater costs related to these synergies than we anticipate or activities related to these synergies have unintended consequences, our business, financial condition and results of operations could be adversely affected.
The pro forma financial information that is contained in this prospectus is not necessarily indicative of our future financial condition or performance.
The pro forma financial information of NewPage Group giving effect to the Acquisition Transactions and this offering is intended to provide information regarding how NewPage Group might have looked if the Acquisition and this offering had occurred as of the dates indicated in that information. The pro forma information is based on the historical results of each of NewPage Group and SENA and therefore may not be indicative of our actual results for periods when the two businesses are operated together. Moreover, the pro forma information does not reflect all of the changes that may result from the Acquisition, including, for example, transition and integration costs; challenges of achieving anticipated synergies; ability to retain qualified employees; maintaining satisfactory relationships with represented employees and customers; or the shutdown or divestiture of less efficient or less profitable mills or machines. The pro forma adjustments to the statement of operations represent management’s best estimates based on information available at the time the pro forma information was prepared and may differ from the adjustments that may actually be required. Accordingly, the pro forma financial information should not be relied upon as being indicative of the historical results that would have been realized had the Acquisition Transactions and this offering occurred as of the dates indicated or that may be achieved in the future.
We have a history of net losses and we may not generate net income in the future.
We incurred a net loss in each of the five years ended December 31, 2007 and for the six months ended June 30, 2008. As of June 30, 2008, our accumulated deficit was $(177) million. In addition, SENA incurred a net loss in each of the years ended December 31, 2004, 2005 and 2006 and the nine months ended September 30, 2007. Our ability to pay future dividends, if any, will be limited by the amount of net income that we generate. See “—Risks Related to the Offering—We do not currently intend to pay dividends on our common stock and the instruments governing our indebtedness contain various covenants that limit our ability to pay dividends.” Furthermore, if we are unable to generate net income in satisfactory amounts or at all, this may adversely affect our business and the price of our common stock.
We have limited ability to pass through increases in our costs. Increases in our costs or decreases in our paper prices could adversely affect our business, financial condition and results of operations.
Our earnings are sensitive to changes in the prices of our paper products. Fluctuations in paper prices, and coated paper prices in particular, historically have had a direct effect on our net income (loss) and EBITDA for several reasons:
| Ÿ | Market prices for paper products are a function of supply and demand, factors over which we have limited influence. We therefore have limited ability to control the pricing of our products. |
19
Table of Contents
Market prices of grade No. 3 coated paper, 60 lb weight, which is an industry benchmark for coated freesheet paper pricing, have fluctuated since 2000 from a high of $1,040 per ton to a low of $705 per ton. Market prices of grade No. 4 coated paper, 50 lb. weight, which is an industry benchmark for coated groundwood paper pricing, and grade SC-A, 35 lb. weight, which is an industry benchmark for supercalendered paper pricing, have generally followed a similar trend. Because market conditions determine the price for our paper products, the price for our products could fall below our production costs. |
| Ÿ | Market prices for paper products typically are not directly affected by raw material costs or other costs of sales, and consequently we have limited ability to pass through increases in our costs to our customers absent increases in the market price. Thus, even though our costs may increase, our customers may not accept price increases for our products, or the prices for our products may decline. |
| Ÿ | Paper manufacturing is highly capital-intensive and a large portion of our and our competitors’ operating costs are fixed. Additionally, paper machines are large, complex systems that operate more efficiently when operated continuously. Consequently, both we and our competitors typically continue to run our machines whenever marginal sales exceed the marginal costs. |
Our ability to achieve acceptable margins is, therefore, principally dependent on managing our cost structure and managing changes in raw materials prices, which represent a large component of our operating costs and fluctuate based upon factors beyond our control. If the prices of our products decline, or if our raw material costs increase, or both, it could have a material adverse effect on our business, financial condition and results of operations. As a result of a slowdown in demand and higher raw material and transportation costs driven by oil and natural gas prices, we announced the closure of our Kimberly, Wisconsin mill at the end of August 2008 in order to better balance supply and customer demand and to further reduce costs. For a further discussion of the variability of our paper prices and our costs and expenses, see “Management’s Discussion and Analysis of Financial Condition and Results of Operations—Selected Factors That Affect Our Operating Results.”
Over the last five years, the U.S. dollar has decreased significantly in value relative to the Canadian dollar. Most of the raw material, labor and other cost of sales at our Port Hawkesbury mill are denominated in Canadian dollars. Because North American sales prices for the products produced at Port Hawkesbury are determined primarily by the U.S. dollar price per ton charged by U.S. producers, the weaker U.S. dollar has impaired the ability of the Port Hawkesbury mill to profitably compete in the U.S. market.
The paper industry is cyclical. Fluctuations in supply and demand for our products could materially adversely affect our business, financial condition and results of operations.
The paper industry is a commodity market and is subject to cyclical market pressures. North American demand for printing paper products tends to decline during a weak U.S. economy. Accordingly, deteriorating general economic conditions may have a material adverse effect on the demand for our products, which could have a material adverse effect on our business, financial condition and results of operations. North American coated paper demand is primarily driven by advertising and print media usage. In particular, the demand for certain grades of coated paper is affected by spending on catalog and promotional materials by retailers and spending on magazine advertising, which affects the number of printed pages in magazines. According to RISI, in the first half of 2008, North American coated paper demand declined by 5.9%, compared to the same period in 2007, as a result of decreased advertising spending and magazine and catalog circulation. North American coated paper demand is projected by RISI to decline by 10% for the second half of 2008 compared to the second half of 2007. In response to this reduction in coated paper demand, we
20
Table of Contents
accelerated our previously announced closure of two paper machines in Niagara, Wisconsin and announced the closure of the Kimberly, Wisconsin mill. We also took 18,000 tons of coated paper market-related downtime during the second quarter of 2008 and we intend to take an additional 41,000 tons of coated paper market-related downtime during the third quarter of 2008. Currency fluctuations can also have a significant effect on the supply of printing paper products in North America. If the U.S. dollar strengthens, imports may increase, which, in turn, would cause the supply of paper products available in the North American market to increase. An increased supply of paper in North America could put downward pressure on prices and cause us to lose sales to competitors, either of which could have a material adverse effect on our business, financial condition and results of operations.
The markets in which we operate are highly competitive and imports could materially adversely affect our business, financial condition and results of operations.
Our business is highly competitive. Competition is based largely on price. We compete with numerous North American paper manufacturers. We also face competition from foreign producers, some of which we believe are lower cost producers than we are. Foreign overcapacity could result in an increase in the supply of paper products available in the North American market. Asian producers, in particular, have significantly increased imports to the U.S. in recent years, and we believe that producers in China, Indonesia and South Korea are selling in our markets at less than fair value and are being subsidized by their governments. We filed petitions seeking antidumping and countervailing duties on imports of coated freesheet paper from China, Indonesia and South Korea. The U.S. Department of Commerce determined that several producers in these countries were subsidized and engaged in dumping. However, the U.S. International Trade Commission determined that no material injury to the domestic industry has occurred and, as a result of that determination, no antidumping and countervailing duties will be imposed on imports of coated freesheet paper from these countries.
Our non-U.S. competitors may develop a competitive advantage over us and other U.S. producers if the U.S. dollar strengthens in comparison to the home currency of those competitors, if the home currency of those competitors (particularly in China) is maintained by their governments at a low value compared to the U.S. dollar, if those competitors receive governmental subsidies or incentives or if ocean shipping rates decrease. If the U.S. dollar strengthens, if foreign currencies are maintained at low values, if shipping rates decrease, if foreign producers receive governmental subsidies or incentives or if overseas supply exceeds demand, imports may increase, which, in turn, would cause the supply of paper products available in the North American market to increase. An increased supply of paper could cause us to lower our prices or lose sales to competitors, either of which could have a material adverse effect on our business, financial condition and results of operations.
In addition, the following factors will affect our ability to compete:
| Ÿ | product availability; |
| Ÿ | the quality of our products; |
| Ÿ | our breadth of product offerings; |
| Ÿ | our ability to maintain plant efficiencies and high operating rates and thus lower our average manufacturing costs per ton; |
| Ÿ | our ability to provide customer service that meets customer requirements and our ability to distribute our products on time; |
| Ÿ | costs to comply with environmental laws and regulations; |
21
Table of Contents
| Ÿ | our ability to produce products that meet customer requirements for the use of sustainable forestry principles, recycled content and environmentally friendly energy sources; and |
| Ÿ | the availability or cost of chemicals, wood, energy and other raw materials and labor. |
Furthermore, some of our competitors have greater financial and other resources than we do or may be better positioned than we are to compete for certain opportunities.
If we are unable to obtain raw materials, including petroleum-based chemicals, at favorable prices, or at all, it could adversely affect our business, financial condition and results of operations.
We have no significant timber holdings and purchase wood, chemicals and other raw materials from third parties. We may experience shortages of raw materials or be forced to seek alternative sources of supply. If we are forced to seek alternative sources of supply, we may not be able to do so on terms as favorable as our current terms or at all. The prices for many chemicals, especially petroleum-based chemicals, have increased over the last few years, including substantial increases during 2008. Chemical prices have historically been and are expected to continue to be volatile. In addition, chemical suppliers that use petroleum-based products in the manufacture of their chemicals may, due to a supply shortage, ration the amount of chemicals available to us or we may not be able to obtain the chemicals we need at favorable prices, if at all. Chemical suppliers also may be adversely affected by, among other things, hurricanes and other natural disasters. Certain specialty chemicals that we purchase are available only from a small number of suppliers. As a result of announced merger and acquisition activity among our major chemical suppliers, we may experience additional cost pressures if these transactions are consummated. If any of these suppliers were to cease operations or cease doing business with us, we may be unable to obtain these chemicals at favorable prices, if at all.
In addition, wood prices are dictated largely by demand. The primary source for wood fiber is timber. Environmental litigation and regulatory developments have caused, and may cause in the future, significant reductions in the amount of timber available for commercial harvest in Canada and the United States. In addition, future domestic or foreign legislation, litigation advanced by aboriginal groups, litigation concerning the use of timberlands, the protection of threatened or endangered species, the promotion of forest biodiversity and the response to and prevention of catastrophic wildfires and campaigns or other measures by environmental activists could also affect timber supplies. Availability of harvested timber may further be limited by factors such as fire and fire prevention, insect infestation, disease, ice and wind storms, drought, floods and other natural and man-made causes, thereby reducing supply and increasing prices.
Any disruption in the supply of chemicals, wood or other inputs could affect our ability to meet customer demand in a timely manner and could harm our reputation. As we have limited ability to pass through increases in our costs to our customers absent increases in market prices for our products, material increases in the cost of our raw materials could have a material adverse effect on our business, financial condition and results of operations.
We are involved in continuous manufacturing processes with a high degree of fixed costs. Any interruption in the operations of our manufacturing facilities may affect our operating performance.
We seek to run our paper machines and pulp mills on a nearly continuous basis for maximum efficiency. Any unplanned plant downtime at any of our paper mills results in unabsorbed fixed costs that negatively affect our results of operations for the period in which we experience the downtime. Due
22
Table of Contents
to the extreme operating conditions inherent in some of our manufacturing processes, we may incur unplanned business interruptions from time to time and, as a result, we may not generate sufficient cash flow to satisfy our operational needs. In addition, many of the geographic areas where our production is located and where we conduct our business may be affected by natural disasters, including snow storms, tornadoes, forest fires and flooding. These natural disasters could disrupt the operation of our mills, which could have a material adverse effect on our business, financial condition and results of operations. Furthermore, during periods of weak demand for paper products or periods of rising costs, we may need to schedule market-related downtime, which could have a material adverse effect on our financial condition and results of operations. We took 18,000 tons of market-related downtime of coated paper during the second quarter of 2008 and have announced that we intend to take an additional 41,000 tons of market-related downtime of coated paper in the third quarter of 2008.
Our operations require substantial ongoing capital expenditures, and we may not have adequate capital resources to fund all of our required capital expenditures.
Our business is capital intensive, and we incur capital expenditures on an ongoing basis to maintain our equipment and comply with environmental laws and regulations, as well as to enhance the efficiency of our operations. We expect to spend approximately $190 million and $165 million on capital expenditures during 2008 and 2009, respectively. Capital expenditures in 2008 are expected to include approximately $35 million for integration-related capital expenditures, $45 million for maintenance capital expenditures and $2 million for environmental capital expenditures and the remainder are expected to relate primarily to improvements in machinery and equipment efficiency or cost-effectiveness. We anticipate that cash generated from operations will be sufficient to fund our operating needs and capital expenditures for the foreseeable future. However, if we require additional funds to fund our capital expenditures, we may not be able to obtain them on favorable terms, or at all. If we cannot maintain or upgrade our facilities and equipment as we require or to ensure environmental compliance, it could have a material adverse effect on our business, financial condition and results of operations.
Rising energy or chemical prices or supply shortages could adversely affect our business, financial condition and results of operations.
Although a significant portion of our energy requirements are satisfied by steam produced as a byproduct of our manufacturing process, we purchase natural gas, coal and electricity to run our mills. Energy costs increased during 2007 and 2008 year to date and are expected to remain high throughout the year and beyond. In addition, energy suppliers and chemical suppliers that use petroleum-based products in the manufacture of their chemicals may, due to supply shortages, ration the amount of energy or chemicals available to us and we may not be able to obtain the energy or chemicals we need to operate our business at acceptable prices or at all. Any significant energy or chemical shortage or significant increase in our energy or chemical costs in circumstances where we cannot raise the price of our products due to market conditions could have a material adverse effect on our business, financial condition and results of operations. We estimate that for each $1 increase in the cost of a barrel of crude oil, our direct energy costs, other than electricity, and indirect costs, such as costs for transportation and petroleum-derived chemicals, increase approximately $6 million annually. See “Management’s Discussion and Analysis of Financial Condition and Results of Operations—Selected Factors That Affect Our Operating Results—Cost of Sales.” Furthermore, we are required to post letters of credit or other financial assurance obligations with certain of our energy and other suppliers, which could limit our financial flexibility. Additionally, due to increased fuel costs, suppliers, distributors and freight carriers have charged fuel surcharges, which have increased over the last several months. If fuel surcharges continue to increase significantly, and we are not able to pass these costs through to our customers, fuel surcharges could have a material adverse effect on our business, financial condition and results of operations.
23
Table of Contents
In addition, an outbreak or escalation of hostilities between the United States and any foreign power and, in particular, events in the Middle East, or weather events such as hurricanes, could result in a real or perceived shortage of oil or natural gas, which could result in an increase in energy or chemical prices.
We depend on a small number of customers for a significant portion of our business.
Our largest customer, xpedx, a division of International Paper Company, accounted for approximately 20% of 2007 pro forma net sales. Our ten largest customers (including xpedx) accounted for approximately 50% of 2007 pro forma net sales. The loss of, or significant reduction in orders from, any of these customers or other customers could have a material adverse effect on our business, financial condition and results of operations, as could significant customer disputes regarding shipments, price, quality or other matters.
Furthermore, we extend trade credit to certain of our customers to facilitate the purchase of our products, and rely on their creditworthiness. Accordingly, a bankruptcy or a significant deterioration in the financial condition of any of our significant customers could have a material adverse effect on our business, financial condition and results of operations, due to a reduction in purchases, a longer collection cycle or an inability to collect accounts receivable.
Litigation could be costly and harmful to our business.
We are involved in various claims and lawsuits from time to time. For example, in 1998 and 1999, the U.S. Environmental Protection Agency, or EPA, issued Notices of Violation, or NOV, to eight paper industry facilities, including our Luke, Maryland mill, alleging violation of certain Prevention of Significant Deterioration, or PSD, regulations under the Clean Air Act. In 2000, an enforcement action was brought in Federal District Court in Maryland against the predecessor of MeadWestvaco, asserting that the predecessor did not obtain PSD permits or install required pollution controls in connection with capital projects carried out in the 1980s at the Luke mill. The complaint sought penalties of up to $27,500 per day for each claimed violation together with the installation of additional air pollution control equipment. MeadWestvaco has agreed to indemnify us for certain liability under these claims to the extent reserves were not previously established or the liability exceeds amounts budgeted by MeadWestvaco in connection with these matters. However, if we incur liability for this lawsuit and we are unable to obtain indemnification from MeadWestvaco, we may incur substantial costs, which may include costs in connection with the penalties and the installation of additional pollution control equipment.
In March 2000, the EPA issued a NOV and a Finding of Violation, or FOV, to SENA’s Wisconsin Rapids Pulp mill alleging violation of the PSD regulations and the New Source Performance Standard, or NSPS, requirements under the Clean Air Act arising from projects implemented at the mill between 1983 and 1991. The EPA is seeking the installation of additional air pollution control equipment and an $8 million penalty. The matter has been referred to the Department of Justice. In July 2002, the EPA issued a NOV and a FOV to SENA’s Niagara mill alleging PSD and NSPS violations relating to projects implemented at the mill from 1995 to 1997. SENA is defending these NOVs and FOVs. SEO has agreed to indemnify us for 75% of certain expenses relating to these matters, including losses arising from the design and installation of air pollution control equipment and for 75% of air compliance penalties, provided the expenses and penalties are incurred within a five-year period following closing of the Acquisition and that SEO’s obligations with respect to the boiler Maximum Achievable Control Technology rule is limited to 50% of the initial $35 million of certain compliance costs. If we incur liability for these actions and we are unable to obtain indemnification from SEO, we may incur substantial costs in connection with penalties and the installation of additional pollution control equipment.
24
Table of Contents
In April 2008, NewPage Wisconsin System Inc. (formerly Stora Enso North America Corp. and the successor by merger to Consolidated Papers, Inc.), along with several other defendants, was served with a summons and complaint seeking to allocate among the defendants the cleanup costs and natural resource damages associated with the remediation of PCB contamination in the Lower Fox River and to require the defendants and the other responsible parties to pay for the upcoming remedial work and natural resource damages. The complaint does not specify our alleged allocable share of these costs and damages. We do not believe that we are responsible for any PCB contamination in the Lower Fox River. We have submitted the claim to SEO, which is required to defend and indemnify us for 75% of any environmental liability associated with the Lower Fox River, provided the liabilities are incurred within the five-year period following closing of the Acquisition. We cannot assure you that we will not be held responsible for PCB contamination in the Lower Fox River or that SEO will satisfy any indemnification obligation to us.
In addition, we may be involved in various other claims and legal actions that arise in the ordinary course of business, including claims and legal actions related to environmental laws and regulations. Any of these claims or legal actions could materially adversely affect our business, results of operations and financial condition.
See “Business—Legal Proceedings” for further information concerning pending legal proceedings.
Rising postal costs could weaken demand for our paper products.
A significant portion of paper is used in periodicals, catalogs, fliers and other promotional materials. Many of these materials are distributed through the mail. Future increases in the cost of postage could reduce the frequency of mailings, reduce the number of pages in advertising materials or cause advertisers to use alternate methods to distribute their advertising materials. Any of the foregoing could decrease the demand for our products, which could materially adversely affect our business, financial condition and results of operations.
Developments in alternative media could adversely affect the demand for our products.
Trends in advertising, electronic data transmission and storage and the internet could have adverse effects on traditional print media, including our products and those of our customers, but neither the timing nor the extent of those trends can be predicted with certainty. Our magazine and catalog publishing customers may increasingly use, and compete with businesses that use, other forms of media and advertising and electronic data transmission and storage, particularly the internet, instead of paper made by us. As the use of these alternatives grows, demand for our paper products could decline.
The failure of our information technology and other business support systems could have a material adverse effect on our business, financial condition and results of operations.
Our ability to effectively monitor and control our operations depends to a large extent on the proper functioning of our information technology and other business support systems. We are a party to a service agreement that provides all of the information technology services through December 31, 2017 and human resources services through January 31, 2013 necessary to support our operations. If the service agreement is terminated, we will need to either perform these functions internally or obtain these services from third parties. We may not be able to do so on a cost-effective basis. If our information technology and other business support systems were to fail or the service provider were to fail to perform under the service agreement, it could have a material adverse effect on our business, financial condition and results of operations.
25
Table of Contents
Our business may suffer if we do not retain our senior management.
We depend on our senior management. The loss of services of members of our senior management team could adversely affect our business until suitable replacements can be found. There may be a limited number of persons with the requisite skills to serve in these positions and we may be unable to locate or employ qualified personnel on acceptable terms. In addition, our future success requires us to continue to attract and retain competent personnel. We may experience an increase in turnover among senior personnel as a result of the Acquisition.
A large percentage of our employees are unionized. Wage increases or work stoppages by our unionized employees may have a material adverse effect on our business, financial condition and results of operations.
As of June 30, 2008, we had approximately 8,500 employees. Approximately 75% of our employees were represented by labor unions. We have 17 collective bargaining agreements expiring at various times between December 1, 2008 and November 30, 2010, with one collective bargaining agreement covering approximately 700 employees expiring before December 31, 2008. Two contracts expired June 1, 2008 and one contract expired July 1, 2008. These contracts cover an aggregate of approximately 900 employees at the Escanaba mill and are currently under renegotiation. Our Port Hawkesbury, Nova Scotia mill was closed from December 2005 until October 2006, before our ownership of the mill, due to a labor dispute.
We may become subject to material cost increases or additional work rules imposed by agreements with labor unions. This could increase expenses in absolute terms and as a percentage of net sales. In addition, work stoppages or other labor disturbances may occur in the future. Any of these factors could negatively affect our business, financial condition and results of operations.
We depend on third parties for certain transportation services.
We rely primarily on third parties for transportation of our products to our customers and transportation of our raw materials to us, in particular, by truck and train. If any of our third-party transportation providers fail to deliver our products in a timely manner, we may be unable to sell them at full value. Similarly, if any of our transportation providers fail to deliver raw materials to us in a timely manner, we may be unable to manufacture our products on a timely basis. Shipments of products and raw materials may be delayed due to weather conditions, strikes or other events. Any failure of a third- party transportation provider to deliver raw materials or products in a timely manner could harm our reputation, negatively affect our customer relationships and have a material adverse effect on our business, financial condition and results of operations. In addition, our ability to deliver our products on a timely basis could be adversely affected by the lack of adequate availability of transportation services, especially rail capacity, whether because of work stoppages or otherwise. Additionally, due to increased fuel costs, suppliers, distributors and freight carriers have charged fuel surcharges, which have increased over the last several months. If fuel surcharges continue to increase significantly, and we are not able to pass these costs through to our customers, fuel surcharges could have a material adverse effect on our business, financial condition and results of operations.
We are subject to various laws and regulations that could impose substantial costs upon us and may adversely affect our operating performance.
Our operations are subject to a wide range of federal, state, provincial and local general and industry-specific environmental, health and safety laws and regulations, including those relating to air emissions, wastewater discharges, solid and hazardous waste management and disposal and site remediation. Compliance with these laws and regulations is a significant factor in our business. We have made, and will continue to make, significant expenditures to comply with these requirements. Significant expenditures also could be required for compliance with any future laws or regulations
26
Table of Contents
relating to greenhouse gas or other emissions. In addition, we handle and dispose of wastes arising from our mill operations and operate a number of landfills to handle that waste. While we believe, based upon current information, that we are currently in substantial compliance with all applicable environmental laws and regulations, we could be subject to potentially significant fines, penalties or criminal sanctions for failure to comply, including with respect to the matters discussed in “—Litigation could be costly and harmful to our business.” Moreover, under certain environmental laws, a current or previous owner or operator of real property, and parties that generate or transport hazardous substances that are disposed of at real property, may be held liable for the cost to investigate or clean up that real property and for related damages to natural resources. We may be subject to liability, including liability for investigation and cleanup costs, if contamination is discovered at one of our paper mills or other locations where we have disposed of, or arranged for the disposal of, wastes. MeadWestvaco and SEO have separately agreed to indemnify us, subject to certain limitations, for certain environmental liabilities. There can be no assurance that MeadWestvaco or SEO will perform under any of their respective environmental indemnity obligations or that the indemnity will adequately cover us in the event of any environmental liabilities, which could have a material adverse effect on our financial condition and results of operations. Furthermore, we agreed to indemnify the purchaser of our carbonless paper business for certain environmental liabilities, subject to certain limitations. We also could be subject to claims brought pursuant to applicable laws, rules or regulations for property damage or personal injury resulting from the environmental impact of our operations, including due to human exposure to hazardous substances. Increasingly stringent environmental requirements, more aggressive enforcement actions or policies, the discovery of unknown conditions or the bringing of future claims may cause our expenditures for environmental matters to increase, and we may incur material costs associated with these matters.
Some of our operations are subject to Canadian government regulation and we are subject to foreign currency risk.
Our business includes a mill in Port Hawkesbury, Nova Scotia and management of woodlands in Canada. Our operations in Canada are subject to Canadian laws and regulations, as well as foreign currency risk. The Canadian dollar has strengthened dramatically versus the U.S. dollar, which makes imports to the United States of paper products made in our Port Hawkesbury, Nova Scotia mill unprofitable. We cannot assure you we will be able to manage our Canadian operations profitably.
If we fail to achieve and maintain effective internal controls, it could have a material adverse effect on our business in the future.
As of December 31, 2007, we became subject to the requirements of Section 404 of the Sarbanes-Oxley Act. The SENA business, as operated by SEO, used SEO’s internal control procedures. Integration of NewPage and the SENA business may require substantial modifications to the internal control procedures of the SENA business that may be costly and time consuming. Our failure to maintain an effective internal control environment could have a material adverse effect on our business and our ability to access capital markets.
Risks Relating to our Indebtedness
Our substantial level of indebtedness could adversely affect our business, financial condition or results of operations and adversely affect the price of our common stock.
We have substantial indebtedness. As of June 30, 2008, after giving effect to the use of proceeds of this offering, we had $2,970 million of total indebtedness (excluding $72 million in outstanding letters of credit). In addition, subject to restrictions in our debt instruments, we may incur additional indebtedness. If new debt is added to our and our subsidiaries’ current debt levels, the related risks
27
Table of Contents
that we now face could intensify. On a pro forma basis, after giving effect to the Acquisition Transactions and this offering, as applicable, our earnings would have been deficient to meet fixed charges by $ million for the year ended December 31, 2007 and by $ million for the six months ended June 30, 2008.
Our substantial indebtedness could have important consequences to you, including the following:
| Ÿ | it may adversely affect the price of our common stock; |
| Ÿ | our ability to obtain additional financing for working capital, debt service requirements, general corporate or other purposes may be impaired; |
| Ÿ | we must use a substantial portion of our cash flow to pay interest and principal on our indebtedness, which will reduce the funds available to us for other purposes; |
| Ÿ | we are more vulnerable to economic downturns and adverse industry conditions; |
| Ÿ | our ability to capitalize on business opportunities and to react to competitive pressures and changes in our industry as compared to our competitors may be compromised due to our high level of indebtedness; and |
| Ÿ | our ability to refinance our indebtedness may be limited. |
In addition, we cannot assure you that we will be able to refinance any of our debt or that we will be able to refinance on commercially reasonable terms. If we were unable to make payments or refinance our debt or obtain new financing under these circumstances, we would have to consider other options, such as:
| Ÿ | sales of assets; |
| Ÿ | sales of equity; or |
| Ÿ | negotiations with our lenders to restructure the applicable debt. |
Our debt instruments may restrict, or market or business conditions may limit, our ability to use some of our options.
A substantial portion of our debt bears interest at variable rates. If market interest rates increase, it could adversely affect our cash flow.
As of June 30, 2008, after giving effect to the use of proceeds of this offering, $1,817 million of our debt consisted of borrowings that bear interest at variable rates. If market interest rates increase, variable-rate debt will create higher debt service requirements, which could adversely affect our cash flow and compliance with our debt covenants. As of June 30, 2008, weighted-average interest rates were 7.8% on borrowings under our senior secured term loan due 2014 and 9.1% on the NewPage Corporation floating rate senior secured notes due 2012. Each one-eighth percentage-point change in LIBOR would result in a $2.0 million change in annual interest expense on the senior secured term loan, a $0.3 million change in annual interest expense on the NewPage Corporation floating rate senior secured notes due in 2012 and, assuming the entire revolving loan were drawn, a $0.6 million change in interest expense on the revolving loan, in each case, without taking into account any interest rate derivative agreements. While we may enter into agreements limiting our exposure to higher market interest rates, these agreements may not offer complete protection from this risk.
Our debt instruments impose significant operating and financial restrictions on us.
The indentures and other agreements governing the NewPage Corporation floating rate senior secured notes due 2012, 10% senior secured notes due 2012 and 12% senior subordinated notes due
28
Table of Contents
2013, which we refer to collectively as the “NewPage Corporation Notes”, and our senior secured credit facilities impose significant operating and financial restrictions on us. These restrictions limit our ability to, among other things:
| Ÿ | incur additional indebtedness or guarantee obligations; |
| Ÿ | repay indebtedness prior to stated maturities; |
| Ÿ | pay dividends or make certain other restricted payments; |
| Ÿ | make investments or acquisitions; |
| Ÿ | create liens or other encumbrances; |
| Ÿ | transfer or sell certain assets or merge or consolidate with another entity; |
| Ÿ | engage in transactions with affiliates; and |
| Ÿ | engage in certain business activities. |
In addition to the covenants listed above, the senior secured credit facilities require us to meet specified financial ratios and tests and restrict our ability to make capital expenditures. Any of these restrictions could limit our ability to plan for or react to market conditions or meet extraordinary capital needs and could otherwise restrict corporate activities. See “Description of Certain Indebtedness.”
Our ability to comply with these covenants may be affected by events beyond our control, and an adverse development affecting our business could require us to seek waivers or amendments of covenants, alternative or additional sources of financing or reductions in expenditures. We cannot assure you that these waivers, amendments or alternative or additional financings could be obtained, or if obtained, would be on terms acceptable to us.
A breach of any of the covenants or restrictions contained in any of our existing or future financing agreements, including our inability to comply with the required financial covenants in our senior secured credit facilities, could result in an event of default under those agreements. Our default could allow the lenders under our financing agreements, if the agreements so provide, to discontinue lending, to accelerate the related debt as well as any other debt to which a cross acceleration or cross default provision applies, and to declare all borrowings outstanding under our financing arrangements to be due and payable. In addition, the lenders could terminate any commitments they had made to supply us with further funds. If the lenders require immediate repayments, we will not be able to repay them in full.
Substantially all of our assets are pledged as collateral under our senior secured credit facilities and the NewPage Senior Secured Notes.
As of June 30, 2008, there was $1,592 million of senior secured indebtedness outstanding under the senior secured credit facilities (excluding $72 million in outstanding letters of credit) and $1,031 million in aggregate principal amount of senior secured indebtedness outstanding under NewPage’s floating rate senior secured notes due 2012 and 10% senior secured notes due 2012, which we refer to as the “NewPage Senior Secured Notes.” Substantially all of our assets are pledged as collateral for these borrowings. As of June 30, 2008, the senior secured credit facilities permitted additional borrowings of up to a maximum of $425 million under the revolving portion of the facility under the borrowing base as of that date. Furthermore, NewPage Holding and most of the subsidiaries of NewPage are guarantors of NewPage’s senior secured credit facilities and most of the subsidiaries of NewPage are guarantors of the NewPage Senior Secured Notes. Substantially all of our assets are pledged as collateral for the guarantees. If we are unable to repay all secured borrowings when due, whether at maturity or if declared due and payable following a default, the lenders would have the right
29
Table of Contents
to proceed against the collateral pledged to the indebtedness and may sell the assets pledged as collateral in order to repay those borrowings, which could have a material adverse effect on our cash flow and our business.
Risks Related to the Offering
There is no existing market for our common stock, and we do not know if one will develop to provide you with adequate liquidity. If the stock price fluctuates after this offering, you could lose a significant part of your investment.
Prior to this offering, there has not been a public market for our common stock. We cannot predict the extent to which investor interest in our company will lead to the development of an active trading market on the New York Stock Exchange or otherwise or how liquid that market might become. If an active trading market does not develop, you may have difficulty selling any of our common stock that you buy. The initial public offering price for the shares will be determined by negotiations between us, the selling stockholders and the underwriter and may not be indicative of prices that will prevail in the open market following this offering. The market price of our common stock may be influenced by many factors, some of which are beyond our control, including:
| Ÿ | changes in demand, supply or pricing in our industry; |
| Ÿ | general economic conditions, including raw material and energy prices; |
| Ÿ | the activities of competitors; |
| Ÿ | our quarterly or annual earnings or those of other companies in our industry; |
| Ÿ | investor perceptions of us and the coated paper industry; |
| Ÿ | the failure of securities analysts to cover our common stock after this offering or changes in financial estimates by analysts; |
| Ÿ | the public’s reaction to our press releases, our other public announcements and our filings with the Securities and Exchange Commission, or SEC; |
| Ÿ | future sales of our common stock; and |
| Ÿ | the other factors described under “Risk Factors.” |
As a result of these factors, you may not be able to resell your shares at or above the initial offering price. In addition, the stock market experiences extreme price and volume fluctuations that have often been unrelated or disproportionate to the operating performance of a particular company. These broad market fluctuations and industry factors may materially reduce the market price of our common stock, regardless of our operating performance.
Affiliates of Cerberus control us and may have conflicts of interest with other stockholders in the future.
Immediately after the offering, Cerberus, our controlling stockholder, will control approximately % (approximately % if the underwriter’s option to purchase additional shares to cover over- allotments is exercised in full) of our common stock. As a result, subject to certain specified consent rights of SEO under the securityholders agreement, Cerberus will continue to be able to control the election of our directors, determine our corporate and management policies and determine, without the consent of our other stockholders, the outcome of any corporate transaction or other matter submitted to our stockholders for approval, including potential mergers or acquisitions, asset sales and other significant corporate transactions. Our controlling stockholder will also have sufficient voting power to amend our organizational documents. We cannot assure you that the interests of our controlling
30
Table of Contents
stockholder will coincide with the interests of other holders of our common stock. Additionally, our controlling stockholder is in the business of making investments in companies and may, from time to time, acquire and hold interests in businesses that compete directly or indirectly with us. Our controlling stockholder may also pursue, for its own account, acquisition opportunities that may be complementary to our business, and as a result, those acquisition opportunities may not be available to us. So long as our controlling stockholder continues to own a significant amount of the outstanding shares of our common stock, it will continue to be able to strongly influence or effectively control our decisions, including potential mergers or acquisitions, asset sales and other significant corporate transactions.
We are a “controlled company” within the meaning of the New York Stock Exchange rules and, as a result, will qualify for, and intend to rely on, exemptions from certain corporate governance requirements. You will not have the same protections afforded to stockholders of companies that are subject to such requirements.
Upon completion of this offering, Cerberus or its affiliated management companies will continue to control a majority of our outstanding common stock. As a result, we are a “controlled company” within the meaning of the New York Stock Exchange corporate governance standards. Under the New York Stock Exchange rules, a company of which more than 50% of the voting power is held by an individual, group or another company is a “controlled company” and may elect not to comply with certain New York Stock Exchange corporate governance requirements, including:
| Ÿ | the requirement that a majority of the board of directors consist of independent directors; |
| Ÿ | the requirement that we have a nominating/corporate governance committee that is composed entirely of independent directors with a written charter addressing the committee’s purpose and responsibilities; |
| Ÿ | the requirement that we have a compensation committee that is composed entirely of independent directors with a written charter addressing the committee’s purpose and responsibilities; and |
| Ÿ | the requirement for an annual performance evaluation of the nominating/corporate governance and compensation committees. |
Following this offering, we intend to utilize these exemptions. As a result, we will not have a majority of independent directors nor will our nominating/corporate governance and compensation committees consist entirely of independent directors. Accordingly, you will not have the same protections afforded to stockholders of companies that are subject to all of the New York Stock Exchange corporate governance requirements.
Even if Cerberus no longer controls us in the future, certain provisions of our charter documents and agreements and Delaware law could discourage, delay or prevent a merger or acquisition at a premium price.
Our amended and restated certificate of incorporation and amended and restated bylaws contain provisions that:
| Ÿ | permit us to issue, without any further vote or action by our stockholders, up to shares of preferred stock in one or more series and, with respect to each series, to fix the number of shares constituting the series and the designation of the series, the voting powers (if any) of the shares of such series, and the preferences and other special rights, if any, and any qualifications, limitations or restrictions of the shares of the series; |
| Ÿ | only permit special meetings to be called by order of our board of directors; |
| Ÿ | do not permit stockholders to act by written consent; |
31
Table of Contents
| Ÿ | require advance notice for nominations for election to the board and for stockholder proposals; and |
| Ÿ | require us to obtain SEO’s written consent, so long as SEO and its affiliates continue to beneficially own in the aggregate 75% of the common stock acquired by SEO on December 21, 2007, or shares after giving effect to this offering, prior to taking any of the following actions: |
| • | amending our organizational documents in a manner inconsistent with SEO’s rights under our amended and restated certificate of incorporation; and |
| • | effecting a change of control transaction in which the common stock held by SEO is not entitled to participate on the same terms as that of Cerberus. |
These provisions may discourage, delay or prevent a merger or acquisition at a premium price.
In addition, we are subject to Section 203 of the General Corporation Law of the State of Delaware, or the DGCL, which also imposes certain restrictions on mergers and other business combinations between us and any holder of 15% or more of the common stock. In addition, certain of our incentive plans may provide for vesting of stock options and/or payments to be made to employees in connection with a change of control, which could discourage, delay or prevent a merger or acquisition at a premium price.
If a substantial number of shares becomes available for sale and are sold in a short period of time, the market price of our common stock could decline.
If our existing stockholders sell substantial amounts of our common stock in the public market following this offering, the market price of our common stock could decrease significantly. The perception in the public market that our existing stockholders might sell shares of common stock could also depress our market price. Upon completion of this offering, we will have shares of common stock outstanding, of which shares will be held by persons who were our stockholders prior to this offering. Prior to this offering, we and our current stockholders will have agreed with the underwriter to a “lock-up” period, meaning that such parties may not, subject to certain exceptions, sell any of their existing shares of our common stock without the prior written consent of Goldman, Sachs & Co. for at least 180 days after the date of this prospectus. In addition, all of our current stockholders will be subject to the Rule 144 holding period requirement described in “Shares Eligible for Future Sale.” When the lock-up agreements expire, these shares and the shares underlying the options will become eligible for sale, in some cases subject to the requirements of Rule 144. In addition, Cerberus and SEO have substantial demand and incidental registration rights and SEO has a one-time right, exercisable after 180 days following consummation of this offering, to distribute pro rata all of our common stock then owned by SEO to SEO’s stockholders, as described in “Certain Relationships and Related Party Transactions—SEO Arrangements—Securityholders Agreement.” The market price for shares of our common stock may drop significantly when the restrictions on resale by our existing stockholders lapse. A decline in the price of shares of our common stock might impede our ability to raise capital through the issuance of additional shares of our common stock or other equity securities.
We do not currently intend to pay dividends on our common stock and the instruments governing our indebtedness contain various covenants that limit our ability to pay dividends.
We do not currently intend to declare and pay dividends on our common stock. Any decision to declare and pay dividends in the future will be made at the discretion of our board of directors and will depend on, among other things, our results of operations, financial condition, cash requirements, contractual restrictions, provisions of applicable law and other factors that our board of directors may deem relevant.
32
Table of Contents
In addition, we are a holding company that does not conduct any business operations of our own, and, therefore, we are dependent upon cash dividends and other transfers from our subsidiaries to make dividend payments on our common stock. The amounts available to NewPage Group to pay cash dividends are restricted by our subsidiaries’ existing debt agreements and may be restricted by our or our subsidiaries’ future debt agreements. The indentures governing the NewPage Corporation Notes and our senior secured credit facilities limit distributions by NewPage Corporation to NewPage Group, which, in turn, may limit NewPage Group’s ability to pay dividends to holders of common stock. Subject to certain limited exceptions described in the indentures, the indentures permit NewPage Corporation to pay dividends to NewPage Group only if: (i) no event of default exists under any of the indentures relating to the NewPage Corporation Notes; (ii) NewPage Corporation would be permitted to incur at least $1.00 of additional indebtedness under the consolidated coverage ratio tests contained in such indentures; and (iii) the aggregate amount of restricted payments made by NewPage Corporation since May 2, 2005 is less than the sum of (A) 50% of the cumulative consolidated net income of NewPage Corporation, (B) proceeds received from the issuance, sale, conversion or exchange of any securities by NewPage Corporation and (C) certain other amounts as set forth in the indentures. Under our senior secured credit facilities, if NewPage Corporation’s total leverage ratio (as described in “Description of Certain Indebtedness”) is equal to or less than a specified ratio for each of the most recent quarter and excess availability (as defined in our senior secured credit facilities) is at least $75 million, then NewPage Corporation will be permitted to pay dividends to NewPage Group so long as the amount of dividends, distributions and other restricted payments during the fiscal year do not exceed 50% of its consolidated excess cash flow (as defined in our senior secured credit facilities) for the immediately preceding fiscal year.
In addition, under Delaware law, our board of directors may declare dividends only to the extent of our “surplus” (which is defined as total assets at fair market value minus total liabilities, minus statutory capital), or if there is no surplus, out of our net profits for the then current and/or immediately preceding fiscal year.
If you purchase shares of common stock sold in this offering, you will experience immediate and substantial dilution.
If you purchase shares of our common stock in this offering, you will experience immediate and substantial dilution of $ in net tangible book value per share, because the price that you pay will be substantially greater than the pro forma net tangible book value per share of the shares you acquire, based on the net tangible book value per share as of June 30, 2008 after giving effect to this offering. This dilution is due in large part to the fact that our earlier investors paid substantially less than the initial public offering price when they purchased their shares. You will experience additional dilution upon the exercise of options to purchase common stock that have or may be granted to employees or directors under the NewPage Group Incentive Plan. See “Dilution.”
33
Table of Contents
MARKET SHARE, RANKING AND OTHER DATA
Information in this prospectus concerning the paper and forest products industry and our relative position in the industry is based on independent industry analyses, management estimates and competitor announcements. Although we believe the third party market data is from reliable sources, we cannot guarantee the accuracy or completeness of the information and have not independently verified it. Industry information in this prospectus is, unless otherwise expressly noted, derived from RISI data. “North American” data included in this prospectus that has been derived from RISI only includes data from the United States and Canada. RISI U.S. industry pricing data represents pricing from the eastern United States only (as defined by RISI). Any reference in industry statistics to grade No. 3, grade No. 4 or grade No. 5 coated paper or SC-A paper relates to 60 lb. weight, 50 lb. weight, 40 lb. weight and 35 lb. weight, respectively. The RISI data included in this prospectus has been derived from the following RISI publications: RISI World Graphic Paper forecast, April 2008; RISI North American Graphic Paper 5 Year forecast, July 2008; RISI Paper Trader: A Monthly Monitor of the North American Graphic Paper Market, July 2008; and RISI, Cornerstone 2008-1Q database.
This prospectus contains “forward-looking statements.” All statements other than statements of historical fact are “forward-looking statements” for purposes of federal and state securities laws. Forward-looking statements may include the words “may,” “plans,” “estimates,” “anticipates,” “believes,” “expects,” “intends” and similar expressions. Although we believe that these statements are based on reasonable assumptions, they are subject to numerous factors, risks and uncertainties that could cause actual outcomes and results to be materially different from those projected or assumed in our forward-looking statements. These factors, risks and uncertainties include, among others, the following:
| Ÿ | our ability to realize the anticipated benefits of the acquisition of SENA, including anticipated synergies; |
| Ÿ | our substantial level of indebtedness; |
| Ÿ | changes in the supply of, demand for, or prices of our products; |
| Ÿ | the activities of competitors, including those that may be engaged in unfair trade practices; |
| Ÿ | changes in significant operating expenses, including raw material and energy costs; |
| Ÿ | changes in currency exchange rates; |
| Ÿ | changes in the availability of capital; |
| Ÿ | general economic and business conditions in the United States and Canada and elsewhere; |
| Ÿ | changes in the regulatory environment, including requirements for enhanced environmental compliance; and |
| Ÿ | the other factors described herein under “Risk Factors.” |
Given these risks and uncertainties, we caution you not to place undue reliance on forward-looking statements. We undertake no obligation to update or revise any forward-looking statements, either to reflect new developments, or for any other reason, except as required by law.
34
Table of Contents
We will receive net proceeds from the offering of approximately $ million, after deducting the estimated underwriting discount on the shares offered by us and our estimated expenses of the offering.
We intend to use the net proceeds from this offering as follows:
| Ÿ | approximately $ million to redeem in full the outstanding NewPage Holding PIK Notes; and |
| Ÿ | approximately $ million to redeem in full the outstanding NewPage Group PIK Notes, all of which are owned by SEO. |
We will not receive any of the proceeds from the common stock sold by selling stockholders in this offering.
To the extent that the initial public offering price is greater or less than $ per share, the midpoint of the range set forth on the cover page of this prospectus, the number of shares to be sold by us will be adjusted upwards or downwards, as applicable, to maintain constant net proceeds to us of approximately $ million, and the aggregate number of shares to be sold by the selling stockholders will be adjusted downwards or upwards by an equal amount. The following table indicates the number of shares that would be sold by each of us and the selling stockholders at the high, low and midpoint of the range set forth on the cover page of this prospectus:
Price per Share | Shares to be Sold by | Shares to be | ||
As of June 30, 2008, the interest rate on the NewPage Holding PIK Notes was 10.0% per annum and the notes had a maturity date of November 1, 2013. As of June 30, 2008, the interest rate on the NewPage Group PIK Notes was 10.0% per annum and the notes had a maturity date of December 21, 2015. The amounts above reflect accretion of $ million on the NewPage Holding PIK Notes and $ million on the NewPage Group PIK Notes from July 1, 2008 to , 2008.
As further discussed under “Management’s Discussion and Analysis of Financial Condition and Results of Operations—Overview—The SENA Acquisition and Related Transactions,” the NewPage Group PIK Notes were issued as part of the consideration for the Acquisition.
35
Table of Contents
We do not intend to pay cash dividends to the holders of our common stock for the foreseeable future. Any decision to declare and pay dividends in the future will be made at the discretion of our board of directors and will depend on, among other things, our results of operations, cash requirements, financial condition, contractual restrictions and other factors that our board of directors may deem relevant.
We are a holding company that does not conduct any business operations of our own. As a result, we are dependent upon cash dividends and distributions and other transfers from our subsidiaries to make dividend payments on our common stock. The amounts available to us to pay cash dividends are restricted by our subsidiaries’ existing debt agreements and may be restricted by our or our subsidiaries’ future debt agreements and applicable laws. See “Risk Factors—Risks Related to the Offering—We do not currently intend to pay dividends on our common stock and the instruments governing our indebtedness contain various covenants that limit our ability to pay dividends.”
36
Table of Contents
The following table sets forth our cash and cash equivalents and capitalization as of June 30, 2008 on an actual basis and pro forma as adjusted to give effect to this offering. For additional information regarding our indebtedness, see “Management’s Discussion and Analysis of Financial Condition and Results of Operations—Our Liquidity and Capital Resources” and “Description of Certain Indebtedness.” This table should be read in conjunction with “Use of Proceeds,” “Unaudited Pro Forma Consolidated Financial Data,” “Management’s Discussion and Analysis of Financial Condition and Results of Operations” and the consolidated financial statements and related notes included elsewhere in this prospectus.
| As of June 30, 2008 | ||||||||
| Actual | Pro Forma | |||||||
| (dollars in millions) | ||||||||
Cash and cash equivalents | $ | 41 | $ | |||||
Long-term debt, including current portion: | ||||||||
Revolving senior secured credit facility | $ | — | (1) | $ | ||||
Term loan senior secured credit facility | 1,546 | (2) | ||||||
NewPage Corporation Notes: | ||||||||
Floating rate senior secured notes due 2012 | 225 | |||||||
10% senior secured notes due 2012 | 804 | (3) | ||||||
12% senior subordinated notes due 2013 | 198 | (4) | ||||||
Capital lease | 147 | |||||||
NewPage Holding PIK notes | 171 | (5) | ||||||
NewPage Group PIK Notes | 218 | (6) | ||||||
Total long-term debt, including current portion | 3,309 | |||||||
Stockholders’ equity: | ||||||||
Preferred stock: $0.01 par value, actual: shares authorized and no shares issued and outstanding; as adjusted: authorized and no shares issued and outstanding | — | |||||||
Common stock: $0.01 par value, actual: shares authorized and shares issued and outstanding; as adjusted: shares authorized and shares issued and outstanding | 1 | (7) | ||||||
Additional paid-in capital | 442 | |||||||
Accumulated deficit | (177 | ) | ||||||
Accumulated other comprehensive income | 25 | |||||||
Total stockholders’ equity | 291 | |||||||
Total capitalization | $ | 3,600 | $ | |||||
| (1) | Excludes $72 million of outstanding letters of credit. |
| (2) | Reflects the book amount of the $1,592 million term loan senior secured credit facility. |
| (3) | Reflects the book amount of the $806 million in aggregate principal amount of 10% senior secured notes due 2012. |
| (4) | Reflects the book amount of the $200 million in aggregate principal amount of 12% senior subordinated notes due 2013. |
| (5) | Reflects the book amount of the $180 million in aggregate principal amount of NewPage Holding PIK Notes. Does not reflect accretion of $ million from July 1, 2008 to , 2008. |
| (6) | Reflects the book amount of the $212 million in aggregate principal amount of NewPage Group PIK Notes. Does not reflect accretion of $ million from July 1, 2008 to , 2008. |
| (7) | To the extent that the initial public offering price is greater or less than the midpoint of the range set forth on the cover page of this prospectus, the number of shares to be sold by us will be adjusted upwards or downwards to maintain constant net proceeds to us of approximately $ million, and the aggregate number of shares to be sold by the selling stockholders will be adjusted downwards or upwards by an equal amount. See “Use of Proceeds.” |
37
Table of Contents
Our net tangible book value as of June 30, 2008 was $ million, or $ per share of common stock assuming the stock split in connection with this offering. Net tangible book value per share represents the amount of our total tangible assets less total liabilities, divided by the total number of shares of common stock outstanding.
After giving effect to the sale of shares of common stock offered in this offering at an assumed initial public offering price of $ per share, the midpoint of the range set forth on the cover page of this prospectus, and after deducting the estimated underwriting discount and estimated offering expenses payable by us, our pro forma net tangible book value as of June 30, 2008 would have been $ million, or $ per share of common stock. This represents an immediate increase in net tangible book value of $ per share to the existing stockholders who will hold shares after this offering and an immediate dilution of $ per share to new investors purchasing our common stock in this offering. The following table illustrates this per share dilution to the new investors:
Assumed initial public offering price | $ | |||||
Net tangible book value per share as of June 30, 2008 | $ | |||||
Increase in net tangible book value per share attributable to this offering | ||||||
Net tangible book value per share after this offering | ||||||
Dilution per share to new investors in this offering | $ | |||||
To the extent that the initial public offering price is greater or less than the midpoint of the range set forth on the cover page of this prospectus, the number of shares to be sold by us will be adjusted upwards or downwards to maintain constant net proceeds to us of approximately $ million, and the aggregate number of shares to be sold by the selling stockholders will be adjusted downwards or upwards by an equal amount. See “Use of Proceeds.”
A $1.00 increase in the assumed initial public offering price of $ per share would increase the net tangible book value per share after this offering by $ per share and would decrease the dilution to new investors in this offering by $ per share, assuming no other change to the net proceeds to us as set forth in “Use of Proceeds.” A $1.00 decrease in the assumed initial public offering price of $ per share would decrease the net tangible book value per share after this offering by $ per share and would increase the dilution to new investors in this offering by $ per share, assuming no other change to the net proceeds to us as set forth in “Use of Proceeds.”
If the underwriter exercises its option to purchase additional shares of our common stock from the selling stockholders in full in this offering, the adjusted net tangible book value per share, net tangible book value per share to the existing stockholders who will hold shares after this offering and the dilution per share to new investors purchasing shares in this offering would be unaffected.
38
Table of Contents
The following table summarizes, as of June 30, 2008, the differences between the number of shares of common stock purchased from us, the total consideration and the average price per share paid by the existing stockholders and by the new investors, based on the assumed initial public offering price of $ per share, the midpoint of the range set forth on the cover of this prospectus, before deducting the estimated underwriting discount and estimated offering expenses payable by us:
| Shares Purchased | Total Consideration | Average Price Per Share | |||||||||
| Number | Percent | Amount | Percent | ||||||||
| (dollars in millions) | |||||||||||
Existing stockholders | % | $ | % | $ | |||||||
New investors | |||||||||||
Total | 100.0% | $ | 100.0% | ||||||||
A $1.00 increase (decrease) in the assumed initial public offering price of $ per share would increase (decrease) the total consideration paid by new investors by $ million, the total consideration paid by all stockholders by $ million and the average price per share paid by all stockholders by $ per share.
If the underwriter exercises the option to purchase additional shares of our common stock in full in this offering, the number of shares held by new investors will increase to shares, or % of the total number of shares of our common stock outstanding after this offering.
39
Table of Contents
UNAUDITED PRO FORMA CONSOLIDATED FINANCIAL DATA
The unaudited pro forma consolidated statement of operations data gives effect to the Acquisition Transactions and this offering as if they had occurred on January 1, 2007. The unaudited pro forma consolidated balance sheet as of June 30, 2008 gives effect to this offering as if it had occurred on June 30, 2008. The unaudited pro forma consolidated financial data are unaudited, are for informational purposes only and are not necessarily indicative of what our financial position or results of operations would have been had the Acquisition Transactions and this offering been completed as of such dates and do not purport to represent what our financial position, results of operations or cash flows might be for any future period. The pro forma data assumes that the common stock is offered at $ per share, the midpoint of the range set forth on the cover page of this prospectus, and after deducting the estimated underwriting discount on the shares offered by us and our estimated expenses of the offering.
The Acquisition has been accounted for using the purchase method of accounting. Under purchase accounting, the total Acquisition consideration will be allocated to the assets and liabilities of SENA based upon the fair value of assets being acquired and liabilities being assumed. The unaudited pro forma consolidated financial data reflects management’s preliminary valuation of assets being acquired and liabilities being assumed. The final allocation of the Acquisition consideration will be based upon management’s consideration of final valuations, and adjustments relating to the finalization of the restructuring plan and uncertain and deferred tax positions. Any adjustments based on that final valuation may change the allocations of the Acquisition consideration, which could affect the fair value assigned to the assets and liabilities and could result in a material change to the unaudited pro forma consolidated financial data.
The unaudited pro forma consolidated financial data is presented for informational purposes only and should be read in conjunction with “Use of Proceeds,” “Selected Financial Information and Other Data,” “Management’s Discussion and Analysis of Financial Condition and Results of Operations” and our historical consolidated financial statements including the notes thereto included elsewhere in this prospectus.
40
Table of Contents
UNAUDITED PRO FORMA CONSOLIDATED BALANCE SHEET AT JUNE 30, 2008
| June 30, 2008 | Offering Adjustments | Pro Forma NewPage Group | |||||||||
ASSETS | |||||||||||
Cash and cash equivalents | $ | 41 | $ | $ | |||||||
Accounts receivable, net | 338 | ||||||||||
Inventories | 688 | ||||||||||
Other current assets | 45 | ||||||||||
Total current assets | 1,112 | ||||||||||
Property, plant and equipment, net | 3,461 | ||||||||||
Other assets | 268 | (1) | |||||||||
TOTAL ASSETS | $ | 4,841 | $ | $ | |||||||
LIABILITIES AND STOCKHOLDERS’ EQUITY | |||||||||||
Accounts payable | $ | 324 | $ | $ | |||||||
Accrued expenses | 263 | ||||||||||
Current maturities of long-term debt | 16 | ||||||||||
Total current liabilities | 603 | ||||||||||
Long-term debt | 3,293 | (1) | |||||||||
Other long-term obligations | 339 | ||||||||||
Deferred income taxes | 286 | ||||||||||
Minority interest | 29 | ||||||||||
STOCKHOLDERS’ EQUITY | |||||||||||
Preferred stock: $0.01 par value actual: shares authorized and no shares issued and outstanding; as adjusted: authorized and no shares issued and outstanding | — | ||||||||||
Common stock: $0.01 par value: shares authorized and shares issued and outstanding; as adjusted shares authorized and shares issued and outstanding | 1 | ||||||||||
Additional paid-in capital | 442 | (2) | |||||||||
Accumulated deficit | (177 | ) | (2) | ||||||||
Accumulated other comprehensive income | 25 | ||||||||||
Total stockholders’ equity | 291 | ||||||||||
TOTAL LIABILITIES AND STOCKHOLDERS’ EQUITY | $ | 4,841 | $ | $ | |||||||
41
Table of Contents
NOTES TO UNAUDITED PRO FORMA CONSOLIDATED BALANCE SHEET
(dollars in millions)
| (1) | Reflects the extinguishment of debt and related costs for write-off of deferred financing costs and unamortized debt discounts/premiums. We intend to use a portion of the net proceeds from this offering to repay $180 million in aggregate principal amount of our outstanding NewPage Holding PIK Notes and $212 million in aggregate principal amount of our outstanding NewPage Group PIK Notes, which in each case includes accretion through June 30, 2008 due upon consummation of this offering in connection with such repayment by redemption under the terms of the respective indentures. A summary of the expected extinguishment is as follows: |
| Debt Balance | Write-off Unamortized Discount (Premium) | |||||||
NewPage Holding PIK Notes | $ | (180 | ) | $ | 9 | |||
NewPage Group PIK Notes | (212 | ) | (6 | ) | ||||
Total | $ | (392 | ) | $ | 3 | |||
In addition, we expect that we will write-off deferred financing costs of approximately $1.
| (2) | Reflects the additional stock compensation recognized for the accelerated vesting resulting from this offering. |
42
Table of Contents
UNAUDITED PRO FORMA CONSOLIDATED STATEMENT OF OPERATIONS
FOR THE SIX MONTHS ENDED JUNE 30, 2008
| NewPage Group | Offering Adjustments | Pro Forma NewPage Group | |||||||||
| (dollars in millions, except per share amounts) | |||||||||||
Net sales | $ | 2,253 | $ | $ | |||||||
Cost of sales | 2,032 | ||||||||||
Selling, general and administrative expenses | 117 | ||||||||||
Interest expense | 160 | (1) | |||||||||
Other (income) expense, net | (8 | ) | |||||||||
Income (loss) from continuing operations before income taxes | (48 | ) | |||||||||
Income tax (benefit) | (13 | ) | (2) | ||||||||
Income (loss) from continuing operations | $ | (35 | ) | $ | $ | ||||||
Income (loss) from continuing operations per share—basic and diluted | $ | (0.63 | ) | — | $ | ||||||
Basic and diluted weighted-average number of common shares outstanding (in thousands) | 56,073 | ||||||||||
43
Table of Contents
UNAUDITED PRO FORMA CONSOLIDATED STATEMENT OF OPERATIONS
FOR THE YEAR ENDED DECEMBER 31, 2007
| NewPage Group | Stora Enso North America(3) | Acquisition Adjustments | Pro Forma Before Offering | Offering Adjustments | Pro Forma NewPage Group | ||||||||||||||||||
| (dollars in millions, except per share amounts) | |||||||||||||||||||||||
Net sales | $ | 2,168 | $ | 2,491 | $ | — | $ | 4,659 | $ | $ | |||||||||||||
Cost of sales | 1,895 | 2,445 | (100 | )(4) | 4,240 | ||||||||||||||||||
Selling, general and administrative expenses | 127 | 87 | — | 214 | |||||||||||||||||||
Interest expense | 176 | 135 | 37 | (5) | 348 | (1) | |||||||||||||||||
Other (income) expense, net | (1 | ) | (2 | ) | — | (3 | ) | ||||||||||||||||
Income (loss) from continuing operations before income taxes | (29 | ) | (174 | ) | 63 | (140 | ) | ||||||||||||||||
Income tax (benefit) | (6 | ) | (15 | ) | 5 | (2) | (16 | ) | (2) | ||||||||||||||
Income (loss) from continuing operations | $ | (23 | ) | $ | (159 | ) | $ | 58 | $ | (124 | ) | $ | $ | ||||||||||
Income (loss) from continuing operations per share—basic and diluted | $ | (0.51 | ) | — | — | $ | (2.20 | ) | — | $ | |||||||||||||
Basic and diluted weighted-average number of common shares outstanding (in thousands) | 45,395 | — | — | 56,307 | — | ||||||||||||||||||
44
Table of Contents
NOTES TO UNAUDITED PRO FORMA CONSOLIDATED STATEMENTS OF OPERATIONS
(dollars in millions)
| (1) | Reflects the reduction in interest expense as a result of the repayment of debt with proceeds from this offering. |
| (2) | Reflects the income tax effect of the above pro forma adjustments using the effective tax rate appropriate in each of the taxing jurisdictions to which the adjustments would apply, except for Canada where there is no tax benefit as a result of a full valuation allowance on deferred tax assets. |
| (3) | Results of operations for SENA include amounts related to the period from January 1, 2007 through December 20, 2007, prior to the Acquisition on December 21, 2007. Net sales and cost of sales have been restated to correct an error related to the presentation of shipping and handling costs. This change in treatment resulted in an increase in net sales and an increase in the same amount in cost of sales. The results of operations for the acquired business for the period from December 21, 2007 through December 31, 2007 are included under the column titled “NewPage Group.” |
| (4) | Reflects a decrease for estimated annual depreciation and amortization associated primarily with an increase in remaining useful lives for property, plant and equipment from a weighted-average basis of approximately 9 years to approximately 15 years, based on the preliminary estimates of the allocation of the estimated purchase price for SENA. |
| (5) | Reflects the reduction of interest on SENA’s pre-Acquisition long-term debt that was repaid by SENA or SEO prior to the consummation of the Acquisition. Also reflects our pro forma interest expense and the amortization of financing costs over the terms of the corresponding debt. A summary follows: |
| Year Ended Dec. 31, 2007 | ||||
Pro forma interest expense(a) | $ | 205 | ||
Elimination of SENA historical interest expense | (126 | ) | ||
Elimination of NewPage historical interest expense on the then existing term loan | (35 | ) | ||
Elimination of write-off of financing costs related to the issuance of the current term loan and unused bridge financing costs(b) | (17 | ) | ||
Amortization of deferred financing fees and original issue discount(c) | 10 | |||
Net increase in interest expense | $ | 37 | ||
| (a) | Represents pro forma interest expense calculated using interest rates as of December 31, 2007 for (i) assumed commitment fees for the estimated increase in letters of credit and the increase in the unused balance related to the senior secured revolving credit facility, (ii) 8.7% on the $1,600 senior secured term loan, (iii) 10% on $456 of senior secured notes due 2012 and (iv) 11.8% on $200 of floating rate senior unsecured NewPage Group PIK Notes. Each one-eighth of one percent change in interest rates would result in (i) a $0.6 change in the annual interest expense on the revolving senior secured credit facility, assuming the entire revolving loan were drawn, (ii) a $2 change in the annual interest expense on the senior secured term loan facility and (iii) a $0.3 change in the annual interest expense on the NewPage Group PIK Notes. |
| (b) | Upon consummation of the Acquisition, we incurred charges of $11 in connection with entering into the senior secured credit facility and $6 of fees for other financing commitments related to the Acquisition. |
| (c) | Deferred financing fees and debt discount/premium are amortized over the life of the various debt instruments. |
45
Table of Contents
SELECTED FINANCIAL INFORMATION AND OTHER DATA
The following tables set forth selected historical combined financial data for our predecessor for the periods ended on and prior to April 30, 2005 and for us for the eight months ended December 31, 2005, and the years ended December 31, 2006 and 2007. We have derived the historical consolidated financial data as of December 31, 2006 and December 31, 2007 and for the eight months ended December 31, 2005 and the years ended December 31, 2006 and 2007 from the audited consolidated financial statements of NewPage Group and subsidiaries included elsewhere in this prospectus. We have derived the historical consolidated financial data as of December 31, 2005 from the audited consolidated financial statements of NewPage Group and its subsidiaries, which are not included in this prospectus. We have derived the historical combined financial data for the four months ended April 30, 2005 from the audited combined financial statements of the printing and writing paper business of MeadWestvaco included elsewhere in this prospectus. We have derived the historical combined data as of December 31, 2003 and 2004 and for the years ended December 31, 2003 and 2004 from the audited combined financial statements of the printing and writing paper business of MeadWestvaco, which are not included in this prospectus. We have derived the historical consolidated financial data for NewPage Group and its subsidiaries as of June 30, 2008 and for the six months ended June 30, 2008 from the unaudited consolidated financial statements of NewPage Group and its subsidiaries included elsewhere in this prospectus, which reflect all adjustments (consisting only of normal recurring adjustments) which are, in the opinion of management, necessary for a fair presentation of that information for the periods presented.
The following tables set forth selected historical combined financial data for SENA for the years ended December 31, 2004, 2005 and 2006, and the nine months ended September 30, 2006 and 2007. We have derived the historical combined financial data for the years ended December 31, 2004, 2005 and 2006 from the audited combined financial statements of SENA included elsewhere in this prospectus. We have derived the historical combined financial data for the nine months ended September 30, 2006 and 2007 from the unaudited financial statements of SENA included elsewhere in this prospectus, which reflect all adjustments (consisting only of normal recurring adjustments) which are, in the opinion of management, necessary for a fair presentation of that information for the periods presented.
The information set forth below should be read in conjunction with “Capitalization,” “Unaudited Pro Forma Consolidated Financial Data,” “Management’s Discussion and Analysis of Financial Condition and Results of Operations” and the financial statements, and the accompanying notes thereto, of each of NewPage Group and SENA included elsewhere in this prospectus.
46
Table of Contents
NewPage Group
| Predecessor | Successor | |||||||||||||||||||||||||||||||||
| Year Ended December 31, 2003 | Year Ended December 31, 2004 | Four Months Ended April 30, 2005 | Eight Months Ended December 31, 2005 | Year Ended December 31, 2006 | Year Ended December 31, 2007 | Six Months Ended June 30, 2007 | Six Months Ended June 30, 2008 | |||||||||||||||||||||||||||
| (dollars in millions, except per share amounts and price per ton) | ||||||||||||||||||||||||||||||||||
Statement of Operations Data: | ||||||||||||||||||||||||||||||||||
Net sales | $ | 1,603 | $ | 1,779 | $ | 582 | $ | 1,281 | $ | 2,038 | $ | 2,168 | $ | 971 | $ | 2,253 | ||||||||||||||||||
Cost of sales | 1,603 | 1,746 | 538 | 1,152 | 1,825 | 1,895 | 877 | 2,032 | ||||||||||||||||||||||||||
Selling general and administrative expenses | 113 | 97 | 31 | 69 | 112 | 127 | 52 | 117 | ||||||||||||||||||||||||||
Goodwill impairment | — | 238 | — | — | — | — | — | — | ||||||||||||||||||||||||||
Interest expense | 10 | 9 | 21 | 121 | 165 | 176 | 75 | 160 | ||||||||||||||||||||||||||
Other (income) expense, net | (7 | ) | (6 | ) | (2 | ) | 18 | (25 | ) | (1 | ) | — | (8 | ) | ||||||||||||||||||||
Income (loss) from continuing operations before income taxes | (116 | ) | (305 | ) | (6 | ) | (79 | ) | (39 | ) | (29 | ) | (33 | ) | (48 | ) | ||||||||||||||||||
Income tax (benefit) | (39 | ) | (24 | ) | (3 | ) | (7 | ) | (3 | ) | (6 | ) | (1 | ) | (13 | ) | ||||||||||||||||||
Income (loss) from continuing operations | (77 | ) | (281 | ) | (3 | ) | (72 | ) | (36 | ) | (23 | ) | (32 | ) | (35 | ) | ||||||||||||||||||
Income (loss) from discontinued operations | (17 | ) | (20 | ) | (5 | ) | 5 | (16 | ) | — | — | — | ||||||||||||||||||||||
Net income (loss) | $ | (94 | ) | $ | (301 | ) | $ | (8 | ) | $ | (67 | ) | $ | (52 | ) | $ | (23 | ) | $ | (32 | ) | $ | (35 | ) | ||||||||||
Income (loss) per share-basic and diluted (in millions of dollars): | ||||||||||||||||||||||||||||||||||
Income (loss) from continuing operations | $ | (1.70 | ) | $ | (6.24 | ) | $ | (0.07 | ) | $ | (1.60 | ) | $ | (0.80 | ) | $ | (0.51 | ) | $ | (0.70 | ) | $ | (0.63 | ) | ||||||||||
Income (loss) from discontinued operations | (0.38 | ) | (0.44 | ) | (0.10 | ) | 0.11 | (0.35 | ) | — | — | — | ||||||||||||||||||||||
Net income (loss) | $ | (2.08 | ) | $ | (6.68 | ) | $ | (0.17 | ) | $ | (1.49 | ) | $ | (1.15 | ) | $ | (0.51 | ) | $ | (0.70 | ) | $ | (0.63 | ) | ||||||||||
Weighted average number of common shares outstanding (in thousands): | ||||||||||||||||||||||||||||||||||
Basic | 45,056 | 45,056 | 45,056 | 45,056 | 45,056 | 45,395 | 45,288 | 56,073 | ||||||||||||||||||||||||||
Diluted | 45,056 | 45,056 | 45,056 | 45,056 | 45,056 | 45,395 | 45,288 | 56,073 | ||||||||||||||||||||||||||
Cash Flow Data: | ||||||||||||||||||||||||||||||||||
Net cash provided by (used in) operating activities | $ | 50 | $ | 240 | $ | 2 | $ | 169 | $ | 180 | $ | 277 | $ | 25 | $ | (11 | ) | |||||||||||||||||
Net cash provided by (used in) investing activities | (76 | ) | (87 | ) | (17 | ) | (2,114 | ) | 140 | (1,588 | ) | (34 | ) | (72 | ) | |||||||||||||||||||
Net cash provided by (used in) financing activities | 26 | (153 | ) | 15 | 1,946 | (287 | ) | 1,410 | (17 | ) | (18 | ) | ||||||||||||||||||||||
47
Table of Contents
| Predecessor | Successor | |||||||||||||||||||||||||
| Year Ended December 31, 2003 | Year Ended December 31, 2004 | Four Months Ended April 30, 2005 | Eight Months Ended December 31, 2005 | Year Ended December 31, 2006 | Year Ended December 31, 2007 | Six Months Ended June 30, 2007 | Six Months Ended June 30, 2008 | |||||||||||||||||||
| (dollars in millions, except per share amounts and price per ton) | ||||||||||||||||||||||||||
Other Financial Data: | ||||||||||||||||||||||||||
Capital expenditures | $ | 66 | $ | 66 | $ | 14 | $ | 62 | $ | 88 | $ | 102 | $ | 34 | $ | 71 | ||||||||||
Balance Sheet Data(1): | ||||||||||||||||||||||||||
Working capital(2) | $ | 333 | $ | 274 | $ | 369 | $ | 276 | $ | 477 | $ | 284 | $ | 509 | ||||||||||||
Property, plant and equipment, net | 1,839 | 1,724 | 1,408 | 1,309 | 3,564 | 1,277 | 3,461 | |||||||||||||||||||
Total assets | 3,097 | 2,647 | 2,304 | 1,985 | 4,885 | 1,952 | 4,841 | |||||||||||||||||||
Long-term debt | 145 | 145 | 1,677 | 1,429 | 3,277 | 1,432 | 3,293 | |||||||||||||||||||
Other long-term obligations | 9 | 9 | 46 | 42 | 351 | 68 | 339 | |||||||||||||||||||
Total equity | 2,128 | 1,713 | 227 | 194 | 307 | 161 | 291 | |||||||||||||||||||
| Predecessor | Combined Predecessor and Successor | Successor | |||||||||||||||||||||||
| Year Ended December 31, 2003 | Year Ended December 31, 2004 | Year Ended December 31, 2005 | Year Ended December 31, 2006 | Year Ended December 31, 2007 | Six Months Ended June 30, 2007 | Six Months Ended June 30, 2008 | |||||||||||||||||||
Selected Operating Data: | |||||||||||||||||||||||||
Weighted-average coated paper price per ton | $ | 789 | $ | 797 | $ | 872 | $ | 893 | $ | 886 | $ | 875 | $ | 969 | |||||||||||
Coated paper volume sold (in thousands of short tons) | 1,919 | 2,112 | 2,032 | 2,116 | 2,261 | 1,025 | 1,912 | ||||||||||||||||||
| SENA
| ||||||||||||||||||||
| Year Ended December 31, 2004 | Year Ended December 31, 2005 | Year Ended December 31, 2006 | Nine Months Ended September 30, 2006 | Nine Months Ended September 30, 2007 | ||||||||||||||||
| (dollars in millions, except price per ton) | ||||||||||||||||||||
Statement of Operations Data: | ||||||||||||||||||||
Net sales | $ | 2,076 | $ | 2,374 | $ | 2,176 | $ | 1,584 | $ | 1,864 | ||||||||||
Cost of sales | 2,129 | 2,303 | 2,135 | 1,552 | 1,846 | |||||||||||||||
Selling general and administrative expenses | 111 | 113 | 108 | 81 | 67 | |||||||||||||||
Goodwill and asset impairment | 520 | 162 | 113 | — | — | |||||||||||||||
Interest expense | 63 | 75 | 92 | 68 | 61 | |||||||||||||||
Other (income) expense, net | (6 | ) | (4 | ) | (1 | ) | (1 | ) | (1 | ) | ||||||||||
Income (loss) income taxes | (741 | ) | (275 | ) | (271 | ) | (116 | ) | (109 | ) | ||||||||||
Income tax (benefit) | (84 | ) | 7 | (28 | ) | (14 | ) | (25 | ) | |||||||||||
Net income (loss) | $ | (657 | ) | $ | (282 | ) | $ | (243 | ) | $ | (102 | ) | $ | (84 | ) | |||||
Cash Flow Data: | ||||||||||||||||||||
Net cash provided by (used in) operating activities | $ | (43 | ) | $ | 175 | $ | 169 | $ | 30 | $ | 24 | |||||||||
Net cash used in investing activities | (188 | ) | (82 | ) | (60 | ) | (42 | ) | (37 | ) | ||||||||||
Net cash provided by (used in) financing activities | (304 | ) | (39 | ) | 4 | 1 | 51 | |||||||||||||
48
Table of Contents
| Year Ended December 31, 2004 | Year Ended December 31, 2005 | Year Ended December 31, 2006 | Nine Months Ended September 30, 2006 | Nine Months Ended September 30, 2007 | |||||||||||
| (dollars in millions, except price per ton) | |||||||||||||||
Other Financial Data: | |||||||||||||||
Capital expenditures | $ | 206 | $ | 83 | $ | 60 | $ | 42 | $ | 38 | |||||
Selected Operating Data: | |||||||||||||||
Weighted-average coated paper price per ton | $ | 834 | $ | 911 | $ | 927 | $ | 929 | $ | 904 | |||||
Coated paper volume sold (in thousands of short tons) | 1,897 | 1,933 | 1,999 | 1,506 | 1,601 | ||||||||||
| December 31, 2005 | December 31, 2006 | September 30, 2007 | ||||||||
| (dollars in millions) | ||||||||||
Balance Sheet Data(1): | ||||||||||
Working capital(2) | $ | 257 | $ | 273 | $ | (1,007 | ) | |||
Property, plant and equipment, net | 2,792 | 2,479 | 2,386 | |||||||
Total assets | 3,956 | 3,521 | 3,517 | |||||||
Long-term debt | 1,542 | 1,446 | 132 | |||||||
Other long-term obligations | 413 | 482 | 328 | |||||||
Owner’s investment | 1,437 | 1,017 | 1,071 | |||||||
| (1) | Balance sheet data is as of the end of the applicable period. |
| (2) | “Working capital” is defined as current assets net of current liabilities. |
49
Table of Contents
MANAGEMENT’S DISCUSSION AND ANALYSIS OF
FINANCIAL CONDITION AND RESULTS OF OPERATIONS
You should read the following discussion together with the sections entitled “Unaudited Pro Forma Consolidated Financial Data,” “Selected Financial Information and Other Data” and the historical financial statements, including the related notes, appearing elsewhere in this prospectus. The following discussion and analysis of our financial condition and results of operations does not describe the effects and significance of the Acquisition and historical financial information for periods prior to the Acquisition may not be indicative of our financial condition and performance for future periods. In addition, the discussion below covers certain periods prior to our acquisition of the printing and writing paper business of MeadWestvaco. Statements in the discussion and analysis regarding our expectations regarding the performance of our business and any forward-looking statements are subject to numerous risks and uncertainties, including, but not limited to, the risks and uncertainties described in “Forward-Looking Statements” and “Risk Factors.” Our actual results may differ materially from those contained in or implied by any forward-looking statements.
Company Background
We believe that we are the largest coated paper manufacturer in North America based on production capacity. Coated paper is used primarily in media and marketing applications such as corporate annual reports, high-end advertising brochures, direct mail advertising, coated labels, magazines, magazine covers and inserts and catalogs. After giving effect to the announced closure of our Kimberly, Wisconsin mill at the end of August 2008, we will operate 20 paper machines at ten mills located in Kentucky, Maine, Maryland, Michigan, Minnesota, Nova Scotia and Wisconsin.
Trends in our Business
North American coated paper demand is primarily driven by advertising and print media usage. In particular, the demand for certain grades of coated paper is affected by spending on catalog and promotional materials by retailers and spending on magazine advertising, which affects the number of printed pages in magazines. According to RISI, in the first half of 2008, North American coated paper demand declined by 5.9%, compared to the same period in 2007, as a result of decreased advertising spending and magazine and catalog circulation. North American coated paper demand is projected to decline by 10% for the second half of 2008, compared to the second half of 2007. In response to this reduction in coated paper demand, we accelerated our previously announced closure of two paper machines in Niagara, Wisconsin to June 2008 and, on July 30, 2008, announced the closure of the Kimberly, Wisconsin mill and its two remaining paper machines by the end of August 2008. These actions will result in the permanent closure of an aggregate of approximately 700,000 tons of coated paper capacity. We also took 18,000 tons of coated paper market-related downtime during the second quarter of 2008 and we intend to take an additional 41,000 tons of coated paper market-related downtime during the third quarter of 2008. We will consider the need for additional market-related downtime from time to time based on market conditions.
North American supply has declined more than demand in 2007 and this trend is expected by RISI to continue throughout 2008 as a result of North American capacity closures, which consist primarily of our capacity closures, and a reduction in imports into North America. We believe imports have been lower because of greater demand in home markets, non-North American capacity closures and unfavorable exchange rates and higher transportation costs for foreign producers. As a result of these factors and inflationary pressures on import costs, coated paper prices have continued to
50
Table of Contents
increase during 2008. In May 2008, we announced a further price increase of $60 per ton on most coated paper grades, effective beginning in July 2008. When coated paper manufacturers announce price increases, they generally take effect over time. Whether a price increase is successful depends on supply, demand and other competitive factors in the marketplace.
We are experiencing significant increases in our input costs due to substantially higher prices for chemicals, natural gas, coal and electricity. In particular, the cost of certain petroleum-based chemicals and transportation costs have increased substantially during 2008. As a result of announced merger and acquisition activity among our major chemical suppliers, we may experience additional cost pressures if these transactions are consummated. To the extent that these costs remain high and we are unable to offset them by price increases or productivity improvements, they will have a negative effect on our gross margins. The effects of rising energy prices have only slightly affected our total direct energy costs because we internally produce a substantial portion of our energy and are able to switch among various types of fuels for a portion of our energy needs. North American prices for coated paper products historically have been determined by North American supply and demand, rather than directly by raw material costs or other costs of sales. We therefore have limited ability to increase prices in response to increases in our costs if demand does not remain strong.
We have substantial indebtedness. As of June 30, 2008, after giving effect to the use of proceeds of this offering, we had $2,970 million of pro forma total indebtedness (excluding $72 million in outstanding letters of credit). After giving effect to this offering, $1,817 million of our debt at June 30, 2008 consisted of borrowings that bear interest at variable rates. We expect our pro forma cash interest expense for 2008 on our pro forma indebtedness at June 30, 2008 will be approximately $250 million. Our interest expense and the covenants contained in our debt instruments impose significant operating and financial restrictions on us, which may adversely affect our business, financial condition and results of operations and the price of our common stock. See “—Our Liquidity and Capital Resources—Indebtedness” and “—Contractual Commitments” for a description of our indebtedness and debt service requirements. See also “Risk Factor—Risks Relating to our Indebtedness” for a discussion of certain risks presented by our indebtedness. Based on our current level of operations, we believe that our cash flows from operations, available borrowings under our revolving senior secured credit facility and cash and cash equivalents will be sufficient to meet our liquidity needs for at least the next twelve months.
See also “—Selected Factors That Affect Our Operating Results” for additional information concerning the factors that affect our financial performance.
Acquisition of Printing and Writing Papers Business of MeadWestvaco
On May 2, 2005, we acquired the printing and writing papers business of MeadWestvaco Corporation, or MeadWestvaco, which was deemed to have been completed on April 30, 2005. For comparison purposes, we have presented the results of operations for the year ended December 31, 2005 on a combined basis, consisting of the historical results of our predecessor for the four months ended April 30, 2005, and the historical results of operations of the successor for the eight months ended December 31, 2005. Accordingly, the discussion and analysis of historical operations of our predecessor during the periods prior to that acquisition from MeadWestvaco do not reflect the significant effect that the accounting for the acquisition and related transactions has had on the reporting of our financial condition and results of operations. We believe that this presentation is beneficial to the reader by providing an easier-to-read discussion of results of operations and provides the reader with information from which to analyze our financial results that is consistent with the manner that management reviews and analyzes results of operations. Furthermore, disclosures regarding sales volumes, spending and other operational measures are determined on a comparable basis for all periods presented. The discussion is provided for comparative purposes only, but the
51
Table of Contents
value of such a comparison may be limited. Some of the factors that limit the usefulness of this presentation include the combination of results based on different accounting bases for predecessor and successor periods, differences in capitalization and the effects resulting from the change from a division of a larger entity to a stand-alone company.
The SENA Acquisition and Related Transactions
On December 21, 2007, we acquired all of the issued and outstanding common stock of SENA from SEO. The SENA acquisition more than doubled our production capacity and broadened our product line.
In connection with the closing of the Acquisition:
| Ÿ | We acquired all of the issued and outstanding common stock of SENA and, in exchange, SEO received: |
| Ÿ | $1,522 million in cash (after the final working capital adjustment); |
| Ÿ | shares of common stock representing 19.9% of our outstanding common stock at the closing of the Acquisition (not taking into account the potential dilution from equity awards issued to management from and after closing of the Acquisition pursuant to the NewPage Group Incentive Plan); and |
| Ÿ | $200 million in aggregate principal amount of NewPage Group PIK Notes. |
| Ÿ | We entered into the senior secured credit facilities, consisting of (a) $1,600 million under a senior secured term loan facility and (b) $500 million under a senior secured revolving credit facility and applied the proceeds from the term loan to finance a portion of the Acquisition, repay our prior senior secured credit facilities and pay related expenses; |
| Ÿ | We repaid $450 million of term debt outstanding under our credit facility in place immediately prior to consummation of the Acquisition; and |
| Ÿ | We issued $456 million of NewPage Corporation 10% senior secured notes due 2012. |
Prior to the closing of the Acquisition, we engaged in a pre-closing reorganization:
| Ÿ | Escanaba Timber LLC, or “Escanaba Timber,” which was previously the immediate parent entity of NewPage Holding, contributed all of the then outstanding shares of capital stock of NewPage Holding to NewPage Group in exchange for shares of common stock of NewPage Group; |
| Ÿ | Escanaba Timber distributed to Maple Timber Acquisition LLC, or “Maple Timber,” Escanaba Timber’s immediate parent entity, all of the then outstanding shares of capital stock of NewPage Group; and |
| Ÿ | Maple Timber distributed all of the then outstanding shares of capital stock of NewPage Group to the members of Maple Timber. |
As a result of this pre-closing reorganization, NewPage Group became the direct parent entity of NewPage Holding, and Cerberus and the other equity owners of Maple Timber were the sole shareholders of NewPage Group prior to the closing of the Acquisition.
We refer to the events described above collectively as the “Acquisition Transactions.”
The reorganization that occurred in connection with the Acquisition represented a transfer of equity interests between entities under common control. As a result, NewPage Group recognized the assets and liabilities transferred at their historical carrying amounts, similar to the pooling-of-interests
52
Table of Contents
method. Because NewPage Group had no operations prior to the Acquisition, for periods prior to the Acquisition, the consolidated financial statements of NewPage Group consist of the historical financial results of NewPage Holding.
Anticipated Synergies of the Acquisition and Integration of the Business
We expect to generate annualized synergies as a result of the Acquisition of approximately $265 million by June 2009. These synergies are expected to come from optimizing paper production, reducing input costs and reducing selling, general and administrative expenses.
These expected synergies are described below.
| Ÿ | Approximately $145 million from optimizing production. We intend to reallocate production of paper grades across our combined machine base, resulting in operation of machines in narrower ranges around their peak production. We believe the increase in production from our largest, most efficient machines will allow us to shut down or idle some of our less efficient, highest cash cost machines. We also intend to use substantially all of our excess market pulp production internally to reduce the amount of pulp purchased from third parties. This should reduce both input costs and cost of sales, the latter due to the reduction in freight costs associated with current NewPage pulp sales. |
| Ÿ | Approximately $80 million from reducing input costs. We will seek to lower prices of key raw materials through volume purchases. We also intend to realize cost reductions from improved logistics. Through reallocation of production among our combined mills, we will produce more product in greater proximity to customers, lowering freight rates. We also intend to continue to implement best practices across our combined mill system and focus on increasing our overall profitability, rather than independently at each individual mill. |
| Ÿ | Approximately $40 million from reducing selling, general and administrative expenses. Through the elimination of duplicative sales, marketing, research and customer service personnel and centralization of corporate administration, management, finance, information technology and human resource functions, we intend to achieve headcount reductions and reduction of associated support costs. Furthermore, we intend to lower benefit costs by freezing defined benefit pension plans and reducing retiree medical benefits for salaried employees. |
On January 16, 2008, we announced the initial actions to integrate NewPage’s operations and the former SENA facilities and services. These actions are intended to create a single business platform, enable us to remain competitive in the marketplace, serve our customers more efficiently and deliver on the synergies we seek to achieve.
The specific restructuring actions announced on January 16, 2008 are as follows:
| Ÿ | Permanently close the No. 11 paper machine in Rumford, Maine in February 2008. Approximately 60 employees were affected by the shutdown. |
| Ÿ | Permanently close the pulp mill and both paper machines in Niagara, Wisconsin in June 2008. Approximately 320 employees were affected by the shutdown. |
| Ÿ | Permanently close the No. 95 paper machine in Kimberly, Wisconsin in May 2008. Approximately 125 employees were affected by the shutdown. |
| Ÿ | Permanently close the Chillicothe, Ohio converting facility by the end of November 2008. Approximately 160 employees will be affected by the shutdown. |
| Ÿ | Reduce personnel in other areas, including sales, finance and other support functions. Approximately 200 to 250 employees are expected to be affected by this action. |
53
Table of Contents
On July 30, 2008, we announced an additional restructuring action to further reduce costs and better balance supply and customer demand. The action was as follows:
| Ÿ | Permanently close the Kimberly, Wisconsin mill and both remaining paper machines, Nos. 96 and 97, by the end of August 2008. Approximately 475 employees will be affected by the shutdown. |
As a result of the initial actions announced in January 2008, during the first half ended June 30, 2008, we incurred total charges of $17 million, including $12 million in accelerated depreciation and inventory write-offs recorded in cost of sales and $5 million of employee-related costs, of which $4 million was recorded in cost of sales and $1 million was recorded in selling, general and administrative expenses. In addition, as of June 30, 2008, we recorded $25 million of employee-related costs for former SENA employees as a liability in the purchase price allocation.
In connection with achieving the synergies described above, we expect to make capital expenditures of approximately $35 million during 2008. In addition, in the second half of 2008 we expect to recognize up to an additional $45 million in the aggregate as a liability in the purchase price allocation for the actions described above announced in January and July 2008 related to the acquired operations. We also expect to incur expenses and restructuring charges in 2008 and to a lesser extent in 2009 of up to an additional $50 million in the aggregate relating to severance and early retirement benefits, costs of relocating employees and assets and costs of integrating the two businesses, including investments in information systems. We also expect to recognize an additional $3 million in accelerated depreciation during the second half of 2008 and expect to incur additional charges in the second half of 2008 of up to $15 million for the write-off of inventory, primarily stores and supplies related to the Kimberly, Wisconsin mill. Additional adjustments to these estimates are likely to occur as we finalize union negotiations and severance arrangements and finalize the restructuring plan, including the effects of sales or dispositions of assets and facilities.
For a description of certain risks relating to the achievement of the synergies described above, see “Risk Factors—Risks Relating to our Business—Even if we are able to successfully integrate the business of NPCP into our operations, we may not realize the anticipated synergies of the Acquisition on the timetable currently contemplated, or at all.”
Shutdown of No. 7 Paper Machine at Luke, Maryland
On October 31, 2006, our management committed to a plan to permanently shut down the No. 7 paper machine and related activities and to reduce headcount by approximately 130 employees at our Luke, Maryland operation largely as a result of the growing influx of low-priced imported paper, particularly from China, Indonesia and South Korea. The decision to permanently shut down the No. 7 paper machine was made in order to continue to improve our cost position and financial performance and better align our capacity with market demand.
During the fourth quarter of 2006, we recorded total pretax charges of $17 million for costs associated with this plan. These charges include $15 million for accelerated depreciation and inventory write-offs, and $2 million for severance and early retirement benefits. We incurred an additional $1 million for severance and early retirement benefits under this plan during the first half of 2007.
Sale of Carbonless Paper Business and Hydroelectric Generating Facilities
Effective April 1, 2006, we completed the sale of our carbonless paper business, including our paper mill in Chillicothe, Ohio and a converting facility in Fremont, Ohio, to P. H. Glatfelter Company for a cash sales price of $84 million. The carbonless paper business has been presented as a discontinued operation for all periods presented.
54
Table of Contents
On June 8, 2006, Rumford Falls Power Company, an indirect wholly-owned subsidiary of NewPage, completed the sale of two hydroelectric generating facilities located on the Androscoggin River in Rumford, Maine to Brookfield Power Inc. for a cash sales price of $144 million.
Selected Factors That Affect Our Operating Results
Net Sales
Our net sales are a function of the number of tons of paper that we sell and the price at which we sell our paper. Demand for printing paper is cyclical, which results in changes in both volume and price. Paper prices historically have been a function of macroeconomic factors, such as the strength of the United States economy and import levels, that are largely out of our control. Price has historically been substantially more variable than volume and can change significantly over relatively short time periods. Coated freesheet paper purchases typically are made by customers pursuant to purchase orders on an as-needed basis, and generally are not made under contracts that provide for fixed prices or minimum volume commitments. Coated groundwood and supercalendered paper are typically sold to customers under contracts that provide for fixed prices and minimum volume commitments. Historically, we sold excess pulp to third parties, but, following the Acquisition, we now use substantially all of our excess pulp production internally to reduce the amount of pulp purchased from third parties. Uncoated paper and pulp prices have not historically had a material effect on our operating results because uncoated paper and pulp do not comprise a material portion of our net sales. As a result of the broadening of our product mix following the Acquisition, our operating results are more affected by the demand for and prices of a broader range of paper types than in the past.
Our earnings are sensitive to price changes for our principal products, with price changes in coated paper having the greatest effect. Fluctuations in paper prices historically have had a direct effect on our results for several reasons:
| Ÿ | Market prices for paper products are a function of supply and demand, factors over which we have limited influence. |
| Ÿ | Market prices for paper products typically are not directly affected by raw material costs or other costs of sales, and consequently there is limited ability to pass through increases in costs to customers absent increases in the market price. |
| Ÿ | The manufacturing of paper is highly capital-intensive and a large portion of operating costs is fixed. Additionally, paper machines are large, complex systems that operate more efficiently when operated continuously. Consequently, both we and our competitors typically continue to run our machines whenever marginal sales exceed the marginal costs. |
See “Business—Industry Overview” for a discussion of factors that have historically affected pricing.
Cost of Sales
The principal components of our cost of sales are chemicals, wood, energy, labor, maintenance and depreciation and amortization. Costs for commodities, including chemicals, wood and energy, are the most variable component of cost of sales because the prices of many of the commodities that we use can fluctuate substantially, sometimes within a relatively short period of time. In addition, commodity purchases fluctuate based on the volume of paper that is produced. We do not track wood, energy or chemicals on a cost of sales basis, but instead track these costs on a cost of production basis. Cost of production is calculated using the cost for the number of tons of paper produced instead
55
Table of Contents
of the cost for the number of tons of paper sold. For a description of some of the actions we have taken and intend to take to lower costs, see “Overview—Anticipated Synergies of the Acquisition and Integration of the Business.”
Wood. Our costs to purchase wood are affected directly by market costs of wood in our regional markets and indirectly by the effect of higher fuel costs on logging and transportation of timber to our facilities. While we have in place fiber supply agreements that ensure a portion of our wood requirements, purchases under these agreements are typically at market rates.
Purchased pulp. The NPCP mills have historically been a net purchaser of market pulp. Following the Acquisition, we now use substantially all of our excess pulp production internally, thus reducing the amount of pulp purchased from third parties. In 2007, on a combined basis and without consideration of the anticipated synergies associated with the Acquisition, we produced approximately 80% of our pulp requirements, with the remainder supplied through open market purchases and supply agreements. After taking into account our announced restructuring and closure plans discussed in this prospectus, we expect to produce approximately 92% of our pulp requirements for 2008, which excludes our sales of market pulp. The price of market pulp has fluctuated significantly. Pulp prices fluctuate due to changes in worldwide consumption of pulp, pulp capacity additions, expansions or curtailments affecting the supply of pulp, changes in inventory levels by pulp consumers, which affect short-term demand, and pulp producer cost changes related to wood availability and environmental issues.
Chemicals. Certain chemicals used in the papermaking process are petroleum-based and fluctuate with the price of crude oil. The price for latex, the largest component of our chemical costs, has historically been volatile. The price of latex increased significantly during 2007 and the first half of 2008 as compared to 2006, and we expect the price of latex to remain volatile.
Energy. We produce a large portion of our energy requirements, historically generating approximately 50% of our energy needs prior to the Acquisition. On a combined basis, we and SENA produced approximately 40% of our energy requirements in 2007 from steam produced during the pulp manufacturing process. After taking into account our announced restructuring and closure plans discussed in this prospectus, we expect to generate approximately 45% of our energy requirements in 2008. The energy we purchase from third party suppliers consists of electricity and fuel used by us, primarily consisting of natural gas and coal, to generate some of our own energy. We expect crude oil and energy costs to remain volatile for the foreseeable future. As prices fluctuate, we have the ability to switch between certain energy sources, within constraints, in order to minimize costs.
In June 2006, we consummated the sale of two hydroelectric generating facilities located on the Androscoggin River in Rumford, Maine. Between the hydroelectric generating facilities and the cogeneration facility operated by Rumford Cogeneration Company L.P., we historically generated more electricity than the Rumford paper mill could utilize and sold excess electricity to third parties. As a result of the sale of the hydroelectric generating facilities, we believe that our power generation and usage at that location are more closely aligned. However, our energy costs have increased after the sale of the hydroelectric generating facilities as a result of the loss of sales of excess electricity and the need to replace electricity generated from the hydroelectric generating facilities with electricity generated from our cogeneration partnership at higher rates.
Our wholly-owned subsidiary, CWPCo, provides electric energy to our mills in central Wisconsin. CWPCo has 33.3 megawatts of generating capacity on 39 generators located in five hydroelectric plants on the Wisconsin River. CWPCo is a regulated public utility and also provides electricity to a small number of residential, light commercial and light industrial customers.
56
Table of Contents
Labor costs. Labor costs include wages, salary and benefit expenses attributable to mill personnel. Mill employees at a non-managerial level are compensated on an hourly basis in accordance with the terms of union contracts and management employees are compensated on a salaried basis. Wages, salary and benefit expenses included in cost of sales do not vary significantly over the short term. We expect the size of our salaried and hourly headcount to decline over time as we complete our integration of NPCP with our existing business. In July 2008, we announced the closure of our Kimberly, Wisconsin mill that will affect an aggregate of 475 employees. See “Overview—Anticipated Synergies of the Acquisition and Integration of the Business.” We have not experienced significant labor shortages, although our Port Hawkesbury, Nova Scotia, mill was closed from December 2005 until October 2006, before our ownership of the mill, due to a labor dispute. In connection with the Acquisition, we plan to lower benefit costs by freezing defined benefit pension plans and reducing retiree medical benefits for salaried employees.
Maintenance. Maintenance expense includes day-to-day maintenance, equipment repairs and larger maintenance projects, such as paper machine shutdowns for annual maintenance. Day-to-day maintenance expenses have not varied significantly from year to year. Larger maintenance projects and equipment expenses can produce year-to-year fluctuations in our maintenance expenses. In conjunction with our annual maintenance shutdowns, we incur incremental costs that are primarily comprised of unabsorbed fixed costs from lower production volumes and other incremental costs for purchased materials and energy that would otherwise be produced as part of normal operations of our mills.
Depreciation and amortization. Depreciation and amortization expense for assets associated with our mill and converting operations is included in cost of sales. Under purchase accounting, the total Acquisition consideration was allocated to our assets and liabilities based upon management’s estimates of fair value. The final allocation of the Acquisition consideration will be based upon management’s consideration of final valuations, adjustments relating to the finalization of the restructuring plan, and for uncertain and deferred tax positions. Any final adjustments may change the allocations of the Acquisition consideration, which could affect the fair value assigned to the assets and liabilities and could result in a change in our financial data.
Foreign currency. We are exposed to changes in foreign currency exchange rates because most of the raw material, labor and other cost of sales at our Port Hawkesbury mill are denominated in Canadian dollars, while North American sales prices for the products produced at Port Hawkesbury are in U.S. dollars (to the extent shipped into the United States) or determined primarily by the U.S. dollar price per ton charged by U.S. producers. A stronger Canadian dollar relative to the U.S. dollar increases our costs of sales. Over the last five years, the Canadian dollar has strengthened significantly in value relative to the U.S. dollar.
Selling, General and Administrative (SG&A) Expenses
The principal components of our SG&A expenses are wages, salaries and benefits for our sales personnel and office personnel at our headquarters, travel and entertainment expenses, advertising expenses, expenses relating to our information technology systems and research and development expenses. Our SG&A expenses have not historically fluctuated significantly from year to year. As a result of the Acquisition, we intend to lower benefits costs by freezing defined benefit pension plans and reducing retiree medical benefits for salaried employees. In addition, we are eliminating duplicative sales, marketing and customer service personnel and centralization of corporate administration, management, finance and human resource functions. See “Overview—Anticipated Synergies of the Acquisition and Integration of the Business.”
57
Table of Contents
Interest
Our interest expense is substantially higher after the Acquisition as a result of the indebtedness incurred to partially finance the cash portion of the Acquisition consideration and transaction costs. Our interest expense will be reduced as a result of the repayment of some of our indebtedness in connection with this offering. See “Use of Proceeds” and “Unaudited Pro Forma Consolidated Financial Data”.
Effects of Inflation
While inflationary increases in certain costs, such as energy, wood and chemical costs, have had a significant effect on our operating results over the past three years, changes in general inflation have had a minimal effect on our operating results in each of the last three years. Sales prices and volumes have historically been more strongly influenced by supply and demand factors in specific markets than by inflationary factors.
Certain of our costs, including the prices of energy, wood and chemicals that we purchase, can fluctuate substantially, sometimes within a relatively short period of time, and can have a significant effect on our business, financial condition and results of operations. For example, we estimate that for each $1 increase in the cost of a barrel of crude oil, our direct energy costs, other than electricity, and indirect costs, such as costs for transportation and petroleum-derived chemicals, increase approximately $6 million annually. Energy, wood and chemical costs increased during 2007 and 2008 year-to-date and are expected to remain high throughout the year and beyond.
Seasonality
We are exposed to fluctuations in quarterly sales volumes and expenses due to seasonal factors common in the paper industry. Typically, the first two quarters are our slowest quarters due to lower demand for coated paper during this period. Our third quarter is typically our strongest sales quarter, reflecting an increase in sales volume as printers prepare for year-end holiday catalogs and advertising. Our accounts receivable and payable generally peak in the third quarter, while inventory generally peaks in the second quarter in anticipation of the third quarter season. Announced price increases and the general economic environment can affect historical seasonal patterns.
58
Table of Contents
Our Results of Operations
The following table sets forth our historical results of operations for the periods indicated below. For comparison purposes, we have presented the results of operations for the year ended December 31, 2005 on a combined basis, consisting of the historical results of our predecessor for the four months ended April 30, 2005, and the historical results of operations of the successor for the eight months ended December 31, 2005. The discussion is provided for comparative purposes only, but the value of such a comparison may be limited.
The following discussion of our financial condition and results of operations does not describe the effects and significance of the Acquisition and should be read in conjunction with our consolidated financial statements and notes thereto included elsewhere in this prospectus and the section entitled “Unaudited Pro Forma Consolidated Financial Data.”
| Non-GAAP | ||||||||||||||||||||||||||||||||||||||||||||
| Combined Predecessor and Successor Year Ended Dec. 31, 2005 | Predecessor Four Months Ended April 30, 2005 | Successor | ||||||||||||||||||||||||||||||||||||||||||
| Eight Months Ended Dec. 31, 2005 | Year Ended Dec, 31 2006 | Year Ended Dec. 31, 2007 | Six Months Ended June 30, 2007 | Six Months Ended June 30, 2008 | ||||||||||||||||||||||||||||||||||||||||
| (dollars in millions) | ||||||||||||||||||||||||||||||||||||||||||||
| $ | % | $ | % | $ | % | $ | % | $ | % | $ | % | $ | % | |||||||||||||||||||||||||||||||
Net sales | 1,863 | 100.0 | 582 | 100.0 | 1,281 | 100.0 | 2,038 | 100.0 | 2,168 | 100.0 | 971 | 100.0 | 2,253 | 100.0 | ||||||||||||||||||||||||||||||
Cost of sales | 1,690 | 90.8 | 538 | 92.6 | 1,152 | 89.9 | 1,825 | 89.5 | 1,895 | 87.4 | 877 | 90.3 | 2,032 | 90.2 | ||||||||||||||||||||||||||||||
Selling, general and administrative expense | 100 | 5.4 | 31 | 5.3 | 69 | 5.4 | 112 | 5.5 | 127 | 5.9 | 52 | 5.3 | 117 | 5.2 | ||||||||||||||||||||||||||||||
Interest expense | 142 | 7.6 | 21 | 3.5 | 121 | 9.4 | 165 | 8.1 | 176 | 8.1 | 75 | 7.8 | 160 | 7.1 | ||||||||||||||||||||||||||||||
Other (income) expense | 16 | 0.8 | (2 | ) | (0.4 | ) | 18 | 1.5 | (25 | ) | (1.2 | ) | (1 | ) | (0.1 | ) | — | 0.0 | (8 | ) | (0.3 | ) | ||||||||||||||||||||||
Income (loss) from continuing operations before income taxes | (85 | ) | (4.6 | ) | (6 | ) | (1.0 | ) | (79 | ) | (6.2 | ) | (39 | ) | (1.9 | ) | (29 | ) | (1.3 | ) | (33 | ) | (3.4 | ) | (48 | ) | (2.2 | ) | ||||||||||||||||
Income tax (benefit) | (10 | ) | (0.6 | ) | (3 | ) | (0.5 | ) | (7 | ) | (0.6 | ) | (3 | ) | (0.2 | ) | (6 | ) | (0.3 | ) | (1 | ) | (0.1 | ) | (13 | ) | (0.6 | ) | ||||||||||||||||
Income (loss) from continuing operations | (75 | ) | (4.0 | ) | (3 | ) | (0.5 | ) | (72 | ) | (5.6 | ) | (36 | ) | (1.7 | ) | (23 | ) | (1.0 | ) | (32 | ) | (3.3 | ) | (35 | ) | (1.6 | ) | ||||||||||||||||
Income (loss) from discontinued operations | — | 0.0 | (5 | ) | (0.8 | ) | 5 | 0.3 | (16 | ) | (0.8 | ) | — | 0.0 | — | 0.0 | — | 0.0 | ||||||||||||||||||||||||||
Net income (loss) | (75 | ) | (4.0 | ) | (8 | ) | (1.3 | ) | (67 | ) | (5.3 | ) | (52 | ) | (2.5 | ) | (23 | ) | (1.0 | ) | (32 | ) | (3.3 | ) | (35 | ) | (1.6 | ) | ||||||||||||||||
First Half 2008 Compared to First Half 2007
Net sales for the first half of 2008 were $2,253 million compared to $971 million for the first half of 2007, an increase of $1,282 million or 132%. The increase was primarily a result of the Acquisition of
59
Table of Contents
SENA, which had net sales of $1,227 million in the first half of 2007. In addition, net sales increased in the first half of 2008 as a result of higher average coated paper prices ($180 million), partly offset by lower sales volume of coated paper on a combined basis ($139 million). Average coated paper prices increased to $969 per ton in the first half of 2008 compared to $875 per ton in the first half of 2007. Coated paper sales volume increased to 1,912,000 tons in the first half of 2008 compared to 1,025,000 tons in the first half of 2007. The volume increase was primarily from the acquired operations and was partially offset by a decline in coated paper demand resulting primarily from lower demand for catalog and promotional materials by retailers and lower spending on magazine advertising. We took 18,000 tons of market-related downtime for coated paper during the first half of 2008. During the first half of 2007, we took 27,000 tons of market-related downtime for coated paper and SENA took 27,000 tons of market-related downtime, primarily with respect to coated paper and supercalendered paper. We have announced that we intend to take an additional 41,000 tons of market-related downtime of coated paper in the third quarter of 2008. We will consider the need for downtime from time to time based on market conditions.
Cost of sales for the first half of 2008 was $2,032 million compared to $877 million for the first half of 2007. The increase was primarily a result of the Acquisition of SENA, which had cost of sales of $1,227 million in the first half of 2007. In addition, we had higher costs of production in the first half of 2008, primarily as a result of inflation in wood, energy, chemicals and transportation costs ($89 million) and restructuring charges ($4 million). These were partially offset by the effect on cost of sales of lower coated paper sales volume on a combined basis ($115 million). Depreciation and amortization expense related to the fixed assets acquired in the Acquisition was $50 million lower in the first half of 2008 than in the first half of 2007 as a result of the purchase price allocation. As a result of the foregoing, gross margin for the first half of 2008 increased slightly to 9.8% compared to 9.7% for the first half of 2007. Included in cost of sales for the first half of 2008 was $12 million for accelerated depreciation and $4 million of employee-related costs associated with our restructuring plan announced in January 2008. Maintenance expense at our mills totaled $183 million and $80 million in the first half of 2008 and 2007. The increase in maintenance expense was driven primarily as a result of the Acquisition.
Selling, general and administrative expenses were $117 million for the first half of 2008 compared to $52 million for the first half of 2007. This increase in 2008 was primarily as a result of the Acquisition of SENA, which had $45 million of selling, general and administrative expenses in the first half of 2007, higher stock compensation expense of $14 million related to the stock option plan approved in December 2007 and $1 million of restructuring charges. During the first half of 2007, NewPage Holding expensed $3 million of costs related to its canceled initial public offering. As a percentage of net sales, selling, general and administrative expenses decreased slightly in the first half of 2008 to 5.2% from 5.3% in the first half of 2007.
Interest expense for the first half of 2008 was $160 million compared to $75 million for the first half of 2007. The increase was primarily a result of higher outstanding debt balances resulting from the financing for the Acquisition.
Income tax expense (benefit) for the first half of 2008 and 2007 was $(13) million and $(1) million. The disproportionate effective tax rates for the first half ended June 30, 2008 were primarily the result of the relationship of permanent items to projected net income (loss) for the year. For the first half ended June 30, 2007, we recorded a valuation allowance against our net deferred tax benefit for federal income taxes and for certain states as it was more likely than not that we would not realize those benefits, as defined in SFAS No. 109, as a result of the negative evidence at that time presented by our and our predecessor’s history of losses.
Net income (loss) was $(35) million in the first half of 2008 compared to net income (loss) of $(32) million in the first half of 2007. The change was primarily driven by the Acquisition and the effects of lower customer demand and inflation on input costs, partially offset by higher sales prices.
60
Table of Contents
2007 Compared to 2006
Net sales for 2007 were $2,168 million compared to $2,038 million for 2006. The increase was driven by higher coated paper sales volume ($84 million) and the incremental increase in net sales from NPCP subsequent to the Acquisition ($60 million), offset in part by lower average coated paper prices ($16 million). Average coated paper prices decreased to $886 per ton in 2007 from $893 per ton in 2006 as a result of lower demand for coated groundwood paper and due to the continuing negative effects of low-priced imports of coated freesheet paper from China, Indonesia and South Korea. Coated paper sales volume increased to 2,261,000 tons in 2007 from 2,116,000 tons in 2006. We took 27,000 tons of market-related downtime for coated paper during 2007 and did not take any market-related downtime for coated paper during 2006. Pro forma net sales for 2007 were $4,659 million.
Cost of sales for 2007 was $1,895 million compared to $1,825 million for 2006. The increase was driven primarily by higher coated paper sales volume ($61 million) and the incremental increase in cost of sales from NPCP subsequent to the Acquisition ($46 million). These increases were partly offset by lower costs of production, primarily a result of productivity improvements ($13 million), the absence in 2007 of nonrecurring charges incurred during 2006 relating to the shutdown of our No. 7 paper machine at our Luke mill ($6 million) and lower depreciation and amortization expense ($18 million). As a result, gross margin for 2007 improved to 12.6%, compared to 10.5% for 2006. Pro forma cost of sales for 2007 was $4,240 million.
Maintenance expense at our mills totaled $169 million in 2007 compared to $168 million in 2006. In conjunction with our annual maintenance shutdowns, we also had incremental costs of approximately $30 million in 2007 and approximately $20 million in 2006 that were primarily comprised of unabsorbed fixed costs from lower production volumes and other incremental costs for purchased materials and energy that would otherwise be produced as part of normal operations of our mills.
Selling, general and administrative expenses were $127 million for 2007 compared to $112 million for 2006. The increase in selling, general and administrative expenses was primarily a result of an increase in legal fees of $8 million largely related to antidumping and countervailing duties petitions that we filed, $3 million of costs for activities related to the withdrawn initial public offering of NewPage Holding’s common stock, higher equity compensation of $3 million and SG&A costs of $4 million for NPCP subsequent to the Acquisition, partly offset by the absence of transitional costs of $8 million that were incurred in 2006 relating to the setup of our business as a stand-alone business. During 2007, we recognized $14 million in equity compensation, of which $8 million was for the vesting of Maple Timber equity interests in connection with our reorganization prior to the Acquisition and $4 million was for the repurchase of unvested equity interests granted to former executive officers. During 2006, we recognized equity compensation expense of $11 million, primarily for former executive officers. As a percentage of net sales, selling, general and administrative expenses increased in 2007 to 5.9% from 5.5% in 2006. Pro forma SG&A for 2007 was $214 million.
Interest expense for 2007 was $176 million compared to $165 million for 2006. The increase was primarily driven by the write off of $17 million in deferred financing costs in December 2007 as a result of the debt refinancing effected in connection with the Acquisition, offset by lower overall outstanding debt balances prior to the Acquisition and a lower interest rate spread on our pre-Acquisition term loan. Pro forma interest expense for 2007 was $ million.
Other (income) expense for 2006 primarily consisted of a gain of $65 million on the sale of two hydroelectric generating facilities and an unrealized non-cash loss of $47 million on our basket option contract.
61
Table of Contents
Income tax expense (benefit) for 2007 and 2006 was $(6) million and $(3) million. We adopted the provisions of FASB Interpretation No. 48,Accounting for Uncertainty in Income Taxes, on January 1, 2007. As a result of the implementation of Interpretation 48, we recognized a $1 million reduction in deferred tax assets and a corresponding decrease in the valuation allowance. As of January 1, 2007, the implementation had no effect on the beginning balance of accumulated deficit. Pro forma income tax expense for 2007 was $ million.
Net income (loss) was $(23) million in 2007 compared to net income (loss) of $(52) million in 2006. Significant items in 2007 include a $17 million write off of deferred financing costs in connection with the debt refinancing associated with the Acquisition, $14 million in equity compensation and $3 million of costs for activities related to the withdrawn initial public offering of NewPage Holding’s common stock. Significant items in 2006 included a $65 million gain on the sale of the hydroelectric generating facilities, a charge of $17 million associated with the shutdown of our No. 7 paper machine in Luke, $47 million of unrealized non-cash losses on the basket option contract and maintenance and incremental costs primarily attributable to the planned shutdown which took place at our Escanaba operations for improvements to one of our paper machines, certain coated equipment and other maintenance-related items.
2006 Successor Compared to 2005 Combined Successor and Predecessor
Net sales for 2006 were $2,038 million compared to $1,863 million for 2005, an increase of 9.4%. The increase was driven by higher coated paper sales volume ($73 million), higher average coated paper prices ($46 million) and increased sales of uncoated paper ($57 million). Average coated paper prices increased from $872 per ton in 2005 to $893 per ton in 2006 and coated paper sales volume increased from 2,032,000 tons in 2005 to 2,116,000 tons in 2006. During 2006, we did not take market-related downtime with respect to coated paper, compared to 57,000 tons of market-related downtime in 2005.
Cost of sales for 2006 was $1,825 million compared to $1,690 million for 2005, an increase of 8.0%. Cost of sales was higher as a result of higher sales volumes ($116 million), higher costs of production, primarily as a result of inflation in wood, energy and chemicals costs ($21 million), and costs related to the shutdown of a paper machine ($6 million). These were partly offset by lower depreciation and amortization expense ($8 million). As a result, gross margin for 2006 improved to 10.5%, compared to 9.2% for 2005.
Depreciation and amortization expense decreased to $152 million in 2006 from $160 million in 2005 as a result of lower asset bases and longer average remaining useful lives assigned to property, plant and equipment after the acquisition of our predecessor. This decrease in depreciation and amortization expense was partially offset by $11 million in accelerated depreciation expense associated with the permanent shutdown of our No. 7 paper machine at our Luke, Maryland facility, during the fourth quarter of 2006.
Wood costs increased due to higher logistics costs for deliveries to the mills and logging expenses, caused primarily from higher fuel costs. Energy costs in 2006 increased sharply over 2005 as a result of higher costs for refined petroleum products. Increases in the price of crude oil also affected the cost of certain papermaking chemicals, purchased energy, and logistics and distribution. The cost of chemicals in 2006 increased slightly over 2005, primarily as a result of increases in latex and starch prices.
We recorded a charge in cost of sales in the fourth quarter of 2006 totaling $17 million, including $11 million of accelerated depreciation expense, resulting from the shutdown of our No. 7 paper machine at our Luke mill.
62
Table of Contents
Maintenance expense at our mills totaled $168 million and $173 million in 2006 and 2005. In conjunction with our annual maintenance shutdowns, we had incremental costs for 2006 and 2005 of $20 million and $7 million that were primarily comprised of unabsorbed fixed costs from lower production volumes and other incremental costs for purchased materials and energy that would otherwise be produced as part of normal operations of our mills. The $13 million increase in incremental costs from 2005 to 2006 was primarily attributable to the planned shutdown which took place at our Escanaba operations for improvements to one of our paper machines and certain coating equipment and other maintenance-related items during the third quarter of 2006.
Selling, general and administrative expenses were $112 million for 2006 compared to $100 million for 2005. Included in SG&A for 2006 were equity compensation expense of $11 million, primarily for former executive officers and transitional costs of $8 million relating to the setup of our business as a stand-alone business, including professional services and consulting costs related to information technology, human resources and finance. Included in SG&A for 2005 were transitional costs of $14 million relating to the setup of our business as a stand-alone business, including professional services and consulting costs related to information technology, human resources and finance. As a percentage of net sales, selling, general and administrative expenses increased slightly in 2006 to 5.5% from 5.4% in 2005.
Interest expense for 2006 was $165 million compared to $142 million for 2005, primarily as a result of the interest expense incurred on the debt issued to finance the acquisition of our predecessor. For periods prior to the acquisition of our predecessor, interest expense relates to long-term debt specifically related to certain mill facilities.
Other (income) expense primarily consisted of a gain of $65 million on the sale of the two hydroelectric generating facilities in 2006 and a non-cash loss of $47 million and $25 million in 2006 and 2005, determined based on the mark-to-market value of the basket option contract.
The income tax expense (benefit) for 2006 and 2005 was $(3) million and $(10) million. For the periods subsequent to the acquisition of our predecessor, we have recorded a valuation allowance against our net deferred tax assets for federal and certain state income taxes as it was more likely than not that we would not realize these benefits, as defined in SFAS No. 109, as a result of the negative evidence presented by our history and our predecessor’s history of losses over the past three years. In 2005, in accordance with SFAS No. 109, we allocated $3 million of tax expense to other comprehensive income and $3 million of tax expense to income from discontinued operations and treated the corresponding offsets as an allocation to tax benefit from continuing operations.
Net income (loss) was $(52) million in 2006 compared to net income (loss) of $(75) million in 2005. Significant items in 2006 included a $65 million gain on the sale of the hydroelectric generating facilities, a charge of $17 million associated with the announced shutdown of our No. 7 paper machine at Luke, a $47 million non-cash loss for the basket option contract, higher interest expense of $23 million and $13 million of higher incremental costs primarily attributable to the planned shutdown which took place at our Escanaba operations for improvements to one of our paper machines and certain coated equipment and other maintenance-related items. Significant items in 2005 included a non-cash loss of $25 million for the basket option contract and $14 million of expenses for transition costs.
In July 2005, the Emerging Issues Task Force issued EITF Issue 04-5,Investor’s Accounting for an Investment in a Limited Partnership When the Investor Is the Sole General Partner and the Limited Partners Have Certain Rights. This issue clarifies and changes the accounting for investments by general partners in limited partnerships and states that general partners are presumed to control the partnership absent certain rights of the limited parties. This issue affects the accounting for our minority
63
Table of Contents
ownership interest in Rumford Cogeneration Company L.P., a limited partnership created to generate power for us and for third-party sale, for which we are the general partner. Prior to January 1, 2006, we accounted for this investment using the equity method of accounting. As of January 1, 2006, we consolidated the limited partnership. The consolidation did not have a material effect on our financial position, results of operations or compliance with our debt covenants.
Carbonless Paper Business
Net sales for our former carbonless paper segment were $106 million and $418 million in 2006 and 2005. Net sales in 2006 include the three months of activity prior to the sale of the business, effective April 1, 2006.
The former carbonless paper segment incurred a loss before taxes of $16 million and $1 million in 2006 and 2005. The loss for 2006 includes a $19 million loss on sale of the business which was offset by lower depreciation and amortization expense of $16 million.
Pre-Acquisition SENA Historical Results of Operations
The following discussion and analysis of SENA’s historical financial condition and results of operations covers periods prior to the Acquisition and therefore does not reflect the significant effects that the Acquisition has had on the SENA business. SENA was a wholly-owned subsidiary of SEO for the periods presented below. The following discussion should be read in conjunction with “Prospectus Summary—Summary Historical and Pro Forma Consolidated Financial Data,” “Selected Financial information and Other Data,” “Unaudited Pro Forma Consolidated Financial Data” and the SENA combined financial statements, including the notes related thereto, included elsewhere in this prospectus.
Overview
Basis of Presentation
SENA’s results of operations presented below have been prepared on a carve-out basis in accordance with U.S. GAAP. The combined financial statements of SENA from which the results presented below are derived include all assets, liabilities, equity, revenues and expenses of Stora Enso Port Hawkesbury Limited and of Stora Enso North America Corp. and its subsidiaries, excluding a 38.8% interest in Thiele Kaolin Company and SEO’s paper and timber import businesses, which were not acquired by NewPage. Significant inter-company transactions and accounts have been eliminated.
Corporate Allocations
SEO allocated costs to SENA on a cost plus basis.
Port Hawkesbury Lockout
The Port Hawkesbury mill, which produces all of SENA’s newsprint and the majority of SENA’s supercalendered paper, was closed from December 2005 until October 2006 due to a labor dispute. The lockout negatively affected net sales of newsprint, which declined from $85 million in 2005 to $6 million in 2006, and supercalendered paper, which declined from $417 million in 2005 to $228 million in 2006.
64
Table of Contents
Closure and Restructuring
In the periods presented, SENA reduced its workforce as a result of fixed cost reduction initiatives and recorded charges of $11 million in 2004 and $15 million in 2005 for employment termination benefits and machine closure costs. The charges were included in cost of sales and in selling, general and administrative expenses.
Impairment Charges
SEO recognized goodwill of $2,128 million upon the acquisition of Consolidated Papers, Inc. in August of 2000. Goodwill amortization in the amount of $144 million was recognized by SEO prior to the adoption of SFAS No. 142,Goodwill and Other Intangible Assets, (“SFAS 142”) and, since then, goodwill has been tested for impairment on an annual basis. A total of $1,704 million of impairment losses have been recorded, of which $1,022 million was recorded prior to 2004, $520 million was recorded in 2004 and $162 million was recorded in 2005 due to deterioration in market conditions for newsprint paper and increased costs. Because of deteriorating market conditions for newsprint paper and increasing costs, SENA’s fixed assets used to make newsprint paper were tested for impairment in 2006, which resulted in an impairment charge of $113 million.
Results of Operations
The following table sets forth SENA’s historical results of operations for the periods presented below:
| Year Ended December 31, 2004 (Restated) | Year Ended December 31, 2005 (Restated) | Year Ended December 31, 2006 (Restated) | Nine Months Ended September 30, 2006 (Restated) | Nine Months Ended September 30, 2007 (Restated) | ||||||||||||||||||||||||||
| $ | % | $ | % | $ | % | $ | % | $ | % | |||||||||||||||||||||
(dollars in millions) | ||||||||||||||||||||||||||||||
Net sales | 2,076 | 100.0 | 2,374 | 100.0 | 2,176 | 100.0 | 1,584 | 100.0 | 1,864 | 100.0 | ||||||||||||||||||||
Cost of sales | 2,129 | 102.6 | 2,303 | 97.0 | 2,135 | 98.1 | 1,552 | 98.0 | 1,846 | 99.0 | ||||||||||||||||||||
Selling, general and administrative expense | 111 | 5.3 | 113 | 4.8 | 108 | 5.0 | 81 | 5.1 | 67 | 3.6 | ||||||||||||||||||||
Goodwill impairment | 520 | 25.0 | 162 | 6.8 | — | 0.0 | — | 0.0 | — | 0.0 | ||||||||||||||||||||
Property, plant and equipment impairment | — | 0.0 | — | 0.0 | 113 | 5.2 | — | 0.0 | — | 0.0 | ||||||||||||||||||||
Interest expense | 63 | 3.0 | 75 | 3.2 | 92 | 4.3 | 68 | 4.3 | 61 | 3.3 | ||||||||||||||||||||
Other (income) expense | (6 | ) | (0.3 | ) | (4 | ) | (0.2 | ) | (1 | ) | (0.1 | ) | (1 | ) | (0.1 | ) | (1 | ) | (0.1 | ) | ||||||||||
Income (loss) before income taxes | (741 | ) | (35.6 | ) | (275 | ) | (11.6 | ) | (271 | ) | (12.5 | ) | (116 | ) | (7.3 | ) | (109 | ) | (5.8 | ) | ||||||||||
Income tax (benefit) | (84 | ) | (4.0 | ) | 7 | 0.3 | (28 | ) | (1.3 | ) | (14 | ) | (0.9 | ) | (25 | ) | (1.3 | ) | ||||||||||||
Net income (loss) | (657 | ) | (31.6 | ) | (282 | ) | (11.9 | ) | (243 | ) | (11.2 | ) | (102 | ) | (6.4 | ) | (84 | ) | (4.5 | ) | ||||||||||
Nine Months Ended September 30, 2007 Compared to Nine Months Ended September 30, 2006
Net sales for the first nine months of 2007 were $1,864 million, compared to $1,584 million for the first nine months of 2006, an increase of 17.7%. The increase was primarily due to increased sales of supercalendered paper and newsprint resulting from the Port Hawkesbury mill resuming operations in October 2006, offset in part by lower prices for coated groundwood paper. Port Hawkesbury sold 394,000 tons of supercalendered paper and newsprint during the first nine months of 2007, compared to 25,000 tons of supercalendered paper and newsprint out of inventories in the first nine months of 2006. Sales volumes of light-weight coated groundwood paper increased by 51,000 tons and sales of coated freesheet paper increased by 26,000 tons due to stronger demand. During the first nine months
65
Table of Contents
of 2007, SENA took 30,000 tons of market-related downtime, primarily with respect to light-weight coated groundwood paper and supercalendered paper, compared to 30,000 tons of market-related downtime during the first nine months of 2006, primarily with respect to light-weight coated groundwood paper.
Cost of sales for the first nine months of 2007 was $1,846 million, compared to $1,552 million for the first nine months of 2006, an increase of 18.9%. The increase in cost of sales was driven by the Port Hawkesbury mill resuming operations, including the effect of the strengthening of the Canadian dollar relative to U.S. dollar. Excluding the effect of the Port Hawkesbury mill resuming operations, cost of sales increased by $90 million, or 5.5%. Higher costs for purchased pulp and other paper making materials were offset by lower wood costs and lower benefit costs associated with new labor contracts entered into at SENA’s central Wisconsin mills. Wood costs decreased due to lower market prices of wood. Energy costs increased slightly in the first nine months of 2007 compared to the first nine months of 2006 as a result of higher delivery costs for coal. The cost of chemicals in the first nine months of 2007 increased over the first nine months of 2006, primarily as a result of increases in latex and starch prices. SENA’s gross margin for the first nine months of 2007 declined to 1.0%, compared to 2.0% for the first nine months of 2006. Gross margins decreased primarily due to increases in input costs and lower selling prices for coated groundwood paper.
Selling, general and administrative expenses were $67 million for the first nine months of 2007, compared to $81 million for the first nine months of 2006. Included in 2006 were $3 million of costs of implementing a procurement and supply chain improvement project. Benefit costs were lower in the first nine months of 2007 by $5 million as a result of new labor contracts entered into at SENA’s central Wisconsin mills. As a percentage of net sales, selling, general and administrative expenses decreased in the first nine months of 2007 to 3.6% from 5.1% in the first nine months of 2006.
Interest expense for the first nine months of 2007 decreased to $61 million from $68 million for the first nine months of 2006, primarily as a result of lower interest rates in 2007.
The income tax expense (benefit) for the first nine months of 2007 and 2006 was $(25) million and $(14) million, respectively. SENA recorded a valuation allowance against its Canadian net deferred tax assets as it determined that it is more likely than not that SENA will not realize these benefits, as defined in SFAS No. 109. SENA recorded a $1 million valuation allowance against state net deferred tax assets in the first nine months of 2007.
Net income (loss) was $(84) million for the first nine months of 2007 compared to net income (loss) of $(102) million for the first nine months of 2006. In 2007, net loss was lower primarily as a result of higher selling volumes related to the resumption of operations at the Port Hawkesbury mill, lower benefit costs associated with new labor contracts entered into at SENA’s central Wisconsin mills, decreased interest expense, increased income tax benefit and lower wood costs. These items were partially offset by higher costs for purchased pulp, chemicals and energy, as well as the effect of the strengthening of the Canadian dollar relative to the U.S. dollar on Port Hawkesbury’s results and lower selling prices of coated groundwood paper.
2006 Compared to 2005
Net sales for 2006 were $2,176 million, compared to $2,374 million for 2005, a decrease of 8.3%. The decrease was primarily due to lower sales of supercalendered paper and newsprint caused by the Port Hawkesbury lockout and, to a lesser extent, market-related down time. This decrease was offset in part by increased volume of coated freesheet products. Port Hawkesbury lost production of 529,000 tons of supercalendered paper and newsprint during the lockout, 517,000 tons of which were in 2006 and 12,000 tons of which were in 2005. During 2006, SENA took 71,000 tons of market-related downtime, compared to 23,000 tons of market-related downtime in 2005.
66
Table of Contents
Cost of sales for 2006 was $2,135 million, compared to $2,303 million for 2005, a decrease of 7.3%. The decline in cost of sales was driven by the Port Hawkesbury lockout. In addition, in 2005, cost of sales included $13 million relating to employment termination benefits and machine closure costs compared to none in 2006. This decline was offset in part by higher wood, energy and chemical costs and costs relating to new labor contracts entered into at SENA’s central Wisconsin mills. Wood costs increased due to increased demand and higher logistics costs for deliveries to the mills and higher logging expenses, both caused primarily by higher fuel costs. Energy costs in 2006 increased sharply over 2005 as a result of higher costs for refined petroleum products. Increases in the price of crude oil also affected the cost of certain papermaking chemicals and purchased energy. The cost of chemicals in 2006 increased slightly over 2005, primarily as a result of increases in latex and starch prices. SENA’s gross margin for 2006 declined to 1.9%, compared to 3.0% for 2005. Gross margin decreased primarily due to increases in input costs and unabsorbed fixed costs relating to the Port Hawkesbury location, partially offset by productivity gains due to a shift toward more specialized machines to make specialty paper products.
Selling, general and administrative expenses were $108 million for 2006, compared to $113 million for 2005. Of the 2006 amount, $5 million of selling, general and administrative expenses were due to the costs of implementing a procurement and supply chain improvement project. In 2005, selling, general and administrative expenses included $2 million compared to none in 2006, relating to employment termination benefits. As a percentage of net sales, selling, general and administrative expenses increased slightly in 2006 to 5.0% from 4.8% in 2005, as selling, general and administrative expenses remained relatively constant as sales declined.
Goodwill impairment of $162 million was recorded in 2005. Goodwill was tested and an impairment loss was recorded due to a deterioration in market conditions for newsprint paper and increased costs. Because of deteriorating market conditions for newsprint paper and increasing costs, SENA’s fixed assets used to make newsprint paper were tested for impairment in 2006, which resulted in a property, plant and equipment impairment charge of $113 million.
Interest expense for 2006 increased to $92 million from $75 million for 2005, primarily as a result of higher interest rates in 2006.
The income tax expense (benefit) for 2006 and 2005 was $(28) million and $7 million, respectively. SENA recorded a valuation allowance against its Canadian net deferred tax assets as it determined that is more likely than not that SENA will not realize these benefits, as defined in SFAS No. 109.
Net income (loss) was $(243) million in 2006 compared to net income (loss) of $(282) million in 2005. In 2006, net loss was lower primarily as a result of increased volumes of coated freesheet products and a reduction in expenses relating to fixed cost reduction initiatives and productivity improvements. These items were partially offset by the impairment charge relating to fixed assets used to make newsprint paper, higher costs for chemicals, wood and energy, unabsorbed fixed costs relating to the Port Hawkesbury lockout and increased interest expense and reduced tax benefit.
2005 Compared to 2004
Net sales for 2005 were $2,374 million, compared to $2,076 million for 2004, an increase of 14.4%. The increase was largely the result of an increase in sales volume following completion of machine rebuilds at the Wisconsin Rapids and Kimberly mills, which resulted in 34,000 tons of lost production during 2004. During 2005, SENA took 23,000 tons of market related downtime compared to 8,000 tons of market-related downtime in 2004.
67
Table of Contents
Cost of sales for 2005 was $2,303 million, compared to $2,129 million for 2004, an increase of 8.2%. Cost of sales increased due to volume increases and increases in wood, energy and chemical costs and unabsorbed fixed costs relating to the Port Hawkesbury lockout. Wood costs increased due to higher logistics costs for deliveries to the mills and logging expenses, caused primarily by higher fuel costs. Energy costs in 2005 increased sharply over 2004 as a result of lower industry supply of natural gas and refined petroleum products. The increase in the cost of chemicals was primarily driven by increases in latex prices, which historically have been volatile, fluctuating with the price of crude oil. SENA’s gross margin for 2005 improved to 3.0%, compared to a loss on gross margin of (2.6)% for 2004. The gross margin increase was due to an increase in sales volumes, offset in part by higher input costs.
Selling, general and administrative expenses were $113 million for 2005 compared to $111 million for 2004, an increase of 1.8%. The increase was a result of an increase in employment termination benefits. As a percentage of net sales, selling, general and administrative expenses decreased in 2005 to 4.8% from 5.3% in 2004. The decrease was primarily due to fixed cost reduction efforts.
Goodwill impairment of $162 million was recorded in 2005, compared to goodwill impairment of $520 million in 2004. Goodwill is tested for impairment on an annual basis. In each period, the impairment losses were due to deterioration in market conditions for newsprint paper and increased costs.
Interest expense for 2005 was $75 million, compared to $63 million for 2004. The increase was primarily due to higher interest rates.
Income tax provision (benefit) for 2005 was $7 million, compared to $(84) million for 2004. SENA recorded a valuation allowance against its Canadian net deferred tax assets as it is more likely than not that SENA will not realize these benefits, as defined in SFAS No. 109.
Net income (loss) was $(282) million in 2005, compared to net income (loss) of $(657) million in 2004. Net loss decreased primarily due to lower goodwill impairment losses and margin improvements in 2005.
Our Liquidity and Capital Resources
We had outstanding aggregate indebtedness at June 30, 2008 of $3,362 million. Our pro forma aggregate indebtedness at June 30, 2008, after giving effect to this offering and the use of proceeds therefrom, was $2,970 million. Beginning in 2011, our debt service requirements substantially increase as a result of scheduled payments of our indebtedness. We anticipate that we will refinance these borrowings prior to that time or retire portions of the indebtedness with issuances of equity securities or proceeds from the sale of assets. Our ability to operate our business, service our debt requirements and reduce our total debt will depend upon our future operating performance, which will be affected by prevailing economic conditions and financial, business and other factors, certain of which are beyond our control, as well as the availability of revolving credit borrowings and borrowings to refinance our existing indebtedness.
We expect that cash generated from operating activities and availability under our revolving senior secured credit facility will be our principal sources of liquidity, in addition to our existing cash balances. As of June 30, 2008, we had $425 million available for borrowing under the revolving senior secured credit facility, after reduction for $72 million in letters of credit, and there were no borrowings outstanding under the revolving senior secured credit facility as of that date. Our cash and cash equivalents were $41 million at June 30, 2008. Based on our current level of operations, we believe our
68
Table of Contents
cash flow from operations, available borrowings under our revolving senior secured credit facility and cash and cash equivalents will be adequate to meet our liquidity needs for at least the next twelve months. We cannot assure you, however, that our business will generate sufficient cash flows from operations, or that future borrowings will be available to us under our senior secured credit facilities in an amount sufficient to enable us to repay our indebtedness, or to fund our other liquidity needs. See “Risk Factors—Risks Relating to our Indebtedness—Our substantial level of indebtedness could adversely affect our business, financial condition or results of operations and adversely affect the price of our common stock.”
Cash Flows
Cash provided by (used in) operating activities was $(11) million during the first half of 2008 compared to $25 million during the first half of 2007. The decrease was primarily the result of increased investments in inventory, partially offset by increased cash flows, primarily generated by the NPCP operations. The increase in inventory was caused both by a decline in sales demand and our normal seasonal build. In response to these challenges, we accelerated the closures of our Niagara, Wisconsin operations, our converting facilities in Chillicothe, Ohio, and took coated paper market-related downtime at other locations. In addition, on July 30, 2008, we announced that we will close our Kimberly, Wisconsin mill by the end of August 2008. We intend to monitor North American paper demand in order to match our production to customer needs, and may take additional market-related downtime based on market conditions. During the first half of 2008, for investing activities we used $71 million for capital expenditures. Financing activities in the first half of 2008 included outflows of $6 million for a share repurchase and $8 million in payments on our long-term debt. Cash and cash equivalents decreased by $102 million during the first half of 2008 to a balance of $41 million at June 30, 2008.
Cash provided by operating activities was $277 million during 2007 compared to $180 million during 2006. The change was largely a result of strong sales demand during the second half of 2007 that resulted in a reduction in inventories and an increase in accrued expenses for sales-related costs during 2007. During 2007, for investing activities we used $102 million for capital expenditures and $1.5 billion for the Acquisition. Financing activities in 2007 included $2 billion in proceeds from the issuance of debt in connection with the Acquisition, offset by $62 million in payments of deferred financing costs and $524 million in payments on the long term debt. We increased our cash and cash equivalents at the end of the period by $99 million to a balance of $143 million as of December 31, 2007.
Cash provided by operating activities was $180 million during 2006 compared to $171 million during 2005 (combined predecessor and successor). The increase was largely a result of better management of inventory and accounts payable after the acquisition of our predecessor in 2005, offset in part by a decrease in cash flows from the discontinued carbonless business. During 2006, we had cash provided by investing activities of $140 million, consisting of proceeds from the sale of assets of $229 million offset by capital expenditures of $88 million. We used the proceeds from the sale of assets and cash generated from operating activities to fund capital expenditures, to pay down long-term debt by $270 million and to increase cash and cash equivalents on hand by $43 million.
Indebtedness
NewPage Holding has outstanding $176 million of floating rate senior unsecured PIK Notes due 2013 and NewPage Group has outstanding $207 million of floating rate senior unsecured PIK Notes due 2015. The interest rate on each of the NewPage Holding PIK Notes and the NewPage Group PIK Notes is equal to LIBOR plus 7%, reset semi-annually. As of June 30, 2008, the interest rate on each of the NewPage Holding PIK Notes and the NewPage Group PIK Notes was 10.0%. We will redeem in full all of the outstanding NewPage Holding PIK Notes and the NewPage Group PIK Notes with a portion of the proceeds of this offering.
69
Table of Contents
The senior secured credit facilities under which NewPage Corporation is the borrower include a $1,600 million term loan facility, with a stated maturity of 2014, and up to $500 million in available revolving loan borrowings, with a stated maturity of 2012. The revolving loan and term loan facilities mature on the earlier of (i) the stated maturity date and (ii) the date that is 181 days prior to the scheduled maturity date of the existing senior secured notes, the senior subordinated notes, and any refinancing thereof. The maturity date of the senior secured credit facilities may be accelerated if we are unable to refinance our notes prior to their maturity. The weighted-average interest rate on the outstanding balance of the term loan facility at June 30, 2008 was 7.8%. The senior secured credit facilities contain customary financial and other covenants, including minimum interest coverage and fixed charge coverage ratios and maximum total debt and senior debt to EBITDA ratios.See “Description of Certain Indebtedness—Senior Secured Credit Facilities—Covenants” for a description of these covenants. As of June 30, 2008, we were in compliance with all financial covenants under our senior secured credit facilities. Below are the required financial covenant levels and the actual levels as of June 30, 2008:
| Covenant | Actual | |||
Maximum Leverage Ratio | 6.00 | 4.67 | ||
Maximum Senior Leverage Ratio | 3.50 | 2.47 | ||
Minimum Interest Coverage Ratio | 1.75 | 2.45 | ||
Minimum Fixed Charge Coverage Ratio | 1.00 | 1.51 |
The senior secured credit facilities also limit our annual capital expenditures to less than $300 million for 2008 and less than $250 million for 2009 and each year thereafter. The difference between our maximum permitted capital expenditures and actual permitted capital expenditures in any given year is carried over to the following year. If at the end of any fiscal quarter NewPage Corporation’s leverage ratio is 3:50 to 1:00 or less, then there is no cap on our capital expenditures under the senior secured credit facilities.
The revolving senior secured term loan facility has a first lien on the cash, deposit accounts, accounts receivable, inventory of NewPage Corporation and intercompany debt owed to NewPage Holding, NewPage Corporation and its guarantor subsidiaries. The term loan has a first lien on the capital stock of NewPage Corporation, the capital stock of its guarantor subsidiaries, and all of its assets and the assets of its guarantor subsidiaries, other than cash, deposit accounts, accounts receivable, inventory and intercompany debt owed to NewPage Holding, NewPage Corporation and its guarantor subsidiaries. The term loan also has a second lien on NewPage Corporation’s and its guarantor subsidiaries’ cash, deposit accounts, accounts receivable, inventory, and intercompany debt owed to NewPage Holding, NewPage Corporation and its guarantor subsidiaries. The senior secured notes have a second lien on all of NewPage Corporation’s assets and the assets of its guarantor subsidiaries other than the capital stock of its guarantor subsidiaries, intercompany debt owed to NewPage Holding, NewPage Corporation and its guarantor subsidiaries, cash, deposit accounts, accounts receivable and inventory.
NewPage Corporation has issued $225 million of floating-rate senior secured notes due 2012, $806 million of 10% senior secured notes due 2012 (which includes $456 million of notes issued in connection with the Acquisition) and $200 million of 12% senior subordinated notes due 2013. The 2012 senior secured notes and the related subsidiary guarantees are secured equally and ratably by second priority liens on substantially all of the assets of NewPage Corporation and its subsidiaries, other than cash deposit accounts, accounts receivables, inventory, the stock of NewPage Corporation’s subsidiaries and intercompany debt. The indentures governing these notes contain customary financial and other covenants. See “Description of Certain Indebtedness” for a discussion of the senior secured credit facilities and these notes.
70
Table of Contents
We have an outstanding capital lease for a paper machine that was acquired as part of the Acquisition with a balance of $147 million as of June 30, 2008. The lease requires payments of approximately $7 million per year and has a basic lease term which expires in 2014. At the end of the basic lease term, we have the option to purchase the machine or the lessor can require us to renew the lease through 2025. The lease contains purchase options at amounts approximating fair market value in 2010 and at lease termination.
As of June 30, 2008, we had outstanding interest rate swaps totaling $1,350 million, expiring from June 2009 through December 2012. We receive amounts based on LIBOR and pay amounts at a weighted-average fixed rate of 3.7%.
We do not have any off-balance sheet arrangements.
Capital Expenditures
Capital expenditures were $71 million and $34 million for the first half ended June 30, 2008 and 2007, respectively. Capital expenditures were $102 million for the year ended December 31, 2007 and, on a pro forma basis, after giving effect to the Acquisition, were $152 million for that year. Capital expenditures for 2008 are expected to be approximately $190 million and are expected to consist of approximately $35 million for capital expenditures associated with achieving the synergies of the Acquisition, approximately $45 million for maintenance capital projects, approximately $2 million for environmental projects and the remainder are expected to relate primarily to improvements in machinery and equipment efficiency or cost-effectiveness. We expect capital expenditures to be approximately $165 million in 2009. We expect to fund our capital expenditures from cash flows from operations and our revolving senior secured credit facility.
Compliance with environmental laws and regulations is a significant factor in our business. We have made, and will continue to make, significant expenditures to comply with these requirements. We incurred capital expenditures of $18 million in 2007, and we expect to incur capital expenditures of approximately $2 million in each of 2008 and 2009, in order to maintain compliance with applicable environmental laws and regulations and to meet new regulatory requirements. We anticipate that environmental compliance will continue to require increased capital expenditures over time as environmental laws or regulations, or interpretations thereof, change or the nature of our operations require us to make significant additional capital expenditures.
71
Table of Contents
Contractual Commitments
The following table reflects our contractual commitments associated with our debt and other obligations as of December 31, 2007:
| (in millions) | Total | 2008 | 2009-10 | 2011-12 | Thereafter | ||||||||||
Contractual Obligations | |||||||||||||||
Long-term debt(1) | $ | 3,349 | $ | 16 | $ | 32 | $ | 1,063 | $ | 2,238 | |||||
Interest expense(2) | 2,083 | 279 | 554 | 504 | 746 | ||||||||||
Operating leases | 31 | 7 | 10 | 7 | 7 | ||||||||||
Fiber supply agreements(3) | 1,532 | 431 | 496 | 318 | 287 | ||||||||||
Purchase obligations | 371 | 120 | 140 | 87 | 24 | ||||||||||
Pension/postretirement plans | 309 | — | 82 | 82 | 145 | ||||||||||
Other long-term obligations | 42 | — | 13 | 4 | 25 | ||||||||||
Total | $ | 7,717 | $ | 853 | $ | 1,327 | $ | 2,065 | $ | 3,472 | |||||
Other Commercial Commitments | |||||||||||||||
Standby letters of credit(4) | $ | 74 | $ | 74 | $ | — | $ | — | $ | — | |||||
Total | $ | 74 | $ | 74 | $ | — | $ | — | $ | — | |||||
| (1) | Amounts shown represent scheduled maturities and do not take into account any acceleration of indebtedness resulting from mandatory payments required for events such as asset sales or under the excess cash flows provisions of our financing instruments. On a pro forma basis after giving effect to this offering and the use of proceeds therefrom, these amounts are $2,977, $16, $32, $1,063 and $1,866 for Total, 2008, 2009-10, 2011-12 and thereafter, respectively. See “Use of Proceeds.” |
| (2) | Amounts include contractual interest payments using the interest rates as of December 31, 2007 applicable to our variable-rate debt and stated fixed interest rate for fixed-rate debt. On a pro forma basis after giving effect to this offering and the use of proceeds therefrom, these amounts are $1,636, $279, $554, $504, and $209 for Total, 2008, 2009-10, 2011-12 and thereafter, respectively. See “Use of Proceeds.” |
| (3) | The contractual commitments consist of the minimum required expenditures to be made pursuant to the fiber supply agreements. |
| (4) | We are required to post letters of credit or other financial assurance obligations with certain of our energy and other suppliers. |
Quantitative And Qualitative Disclosures About Market Risk
Interest Rate Risk. As of June 30, 2008 and December 31, 2007 and 2006, $2,210 million, $2,197 million and $889 million, respectively, of our debt consisted of borrowings with variable interest rates. As of June 30, 2008, our pro forma variable interest rate indebtedness, after giving effect to this offering and the use of proceeds therefrom, was $1,817 million. If market interest rates increase, variable-rate debt will create higher debt service requirements, which could adversely affect our cash flow or compliance with our debt covenants. The potential annual increase in interest expense resulting from a 100 basis point increase in quoted interest rates on our debt balances outstanding at June 30, 2008 and December 31, 2007 and 2006 would be $22 million, $22 million and $9 million without taking into account any interest rate derivative agreements. The increased exposure to interest rate risk at June 30, 2008 and December 31, 2007 relates to the additional indebtedness incurred in connection with the Acquisition.
While we may enter into agreements limiting our exposure to higher interest rates, these agreements may not offer complete protection from this risk. As of June 30, 2008 and December 31,
72
Table of Contents
2007 and 2006, we were a party to interest rate derivative agreements to hedge the variability of cash flows on $1,350 million, $450 million and $450 million of our floating-rate debt. Taking into account our interest rate derivative agreements and rates in effect at June 30, 2008 and December 31, 2007 and 2006, a 100 basis point increase in quoted interest rates would result in an increase in interest expense of $9 million, $17 million and $4 million, respectively.
Foreign Currency Risk. We are subject to exposure from fluctuations in foreign currency exchange rates, primarily the Canadian dollar. Foreign currency exchange contracts are used from time to time to hedge the variability in cash flows from the forecasted payment or receipt of currencies other than our functional currency, the U.S. dollar. In April 2008, we entered into foreign currency forward contracts aggregating $40 million of contract value, expiring monthly through December 2008, to hedge the variability of cash flows on anticipated U.S. dollar-denominated transactions with our Port Hawkesbury mill. As of June 30, 2008, the fair values of these contracts were less than $1 million.
Critical Accounting Estimates
Our principal accounting policies are described in the Summary of Significant Accounting Policies in the notes to consolidated financial statements filed with the accompanying consolidated financial statements. The preparation of consolidated financial statements in accordance with accounting principles generally accepted in the United States, or GAAP, requires management to make estimates and assumptions that affect the reported amounts of some assets and liabilities and, in some instances, the reported amounts of revenues and expenses during the reporting period. Actual results could differ from these estimates. Management believes the accounting estimates discussed below represent those accounting estimates requiring the exercise of judgment where a different set of judgments could result in the greatest changes to reported results.
Income taxes. Income taxes are accounted for in accordance with Statement of Financial Accounting Standard (SFAS) No. 109,Accounting for Income Taxes, which recognizes deferred tax assets and liabilities based on the estimated future tax effects of differences between the financial statement and tax bases of assets and liabilities given the enacted tax laws.
We adopted the provisions of FASB Interpretation No. 48,Accounting for Uncertainty in Income Taxes, (FIN 48) on January 1, 2007. FIN 48 clarifies when tax benefits should be recorded in the financial statements and provides measurement criteria for valuing such benefits. In order for us to recognize benefits, our tax position must be more likely than not to be sustained upon audit. The amount we recognize is measured as the largest amount of benefit that is greater than 50 percent likely of being realized upon ultimate settlement.
We have tax filing requirements in many states and are subject to audit in these states, as well as at the federal level in both the U.S. and Canada. Tax audits by their nature are often complex and can require several years to resolve. In the preparation of our consolidated financial statements, management exercises judgments in estimating the potential exposure to unresolved tax matters. While actual results could vary, in management’s judgment we have adequate accruals with respect to the ultimate outcome of these unresolved tax matters.
We evaluate the need for a deferred tax asset valuation allowance by assessing whether it is more likely than not that we will realize our deferred tax assets in the future. The assessment of whether or not a valuation allowance is required often requires significant judgment, including the forecast of future taxable income and the evaluation of tax planning initiatives. Adjustments to the deferred tax valuation allowance are made to earnings in the period when the assessment is made.
Pension and other postretirement benefits. We provide retirement benefits for certain employees through employer- and employee-funded defined benefit plans. Benefits earned are a
73
Table of Contents
function of years worked and average final earnings during an employee’s pensionable service. Certain of the pension benefits are provided in accordance with collective bargaining agreements.
Assumptions used in the determination of defined benefit pension expense and other postretirement benefit expense, including the discount rate, the long-term expected rate of return on plan assets and increases in future medical costs, are evaluated by management, reviewed with the plans’ actuaries annually and updated as appropriate. Actual asset returns and medical costs that are more favorable than assumptions can have the effect of lowering expense and future cash contributions, and conversely, actual results that are less favorable than assumptions could increase expense and future cash contributions. In accordance with GAAP, actual results that differ from assumptions are accumulated and amortized over future periods and, therefore, affect expense in the future periods. Unrecognized prior service cost and actuarial gains and losses in the defined benefit pension and other postretirement benefit plans subject to amortization are amortized over the average remaining service of the participants.
Our assumptions used in determining defined benefit pension and other postretirement benefit expense are important in determining the costs of our plans. A 0.5 percentage-point decrease in our weighted-average long-term expected rate of return on plan assets would increase 2008 net pension expense by approximately $7 million. Likewise, a 0.5 percentage-point increase in our weighted-average long-term expected rate of return on plan assets would decrease 2008 net pension expense by approximately $7 million. The effect on other postretirement benefit expense would be negligible from such changes in the long-term expected rate of return on plan assets.
A 0.5 percentage-point decrease in our weighted-average discount rates would increase 2008 net pension expense by approximately $1 million and would decrease 2008 net other postretirement benefit expense by approximately $1 million. Likewise, a 0.5 percentage-point increase in our weighted-average discount rates would decrease 2008 net pension expense by approximately $1 million and would increase 2008 net other postretirement benefit expense by approximately $1 million. With respect to benefit obligations, a 0.5 percentage-point decrease in our weighted-average discount rates would increase pension benefit obligations by approximately $81 million and would increase other postretirement benefit obligations by approximately $11 million. Likewise, a 0.5 percentage-point increase in our weighted-average discount rates would decrease pension benefit obligations by approximately $75 million and would decrease other postretirement benefit obligations by approximately $10 million.
Equity compensation. We use the Black-Scholes option pricing model to determine the fair value of stock options. The determination of the fair value of stock-based payment awards on the date of grant using an option-pricing model is affected by the stock price as well as assumptions regarding a number of other variables. These variables include expected stock price volatility over the term of the awards and projected employee stock option exercise behaviors (term of option).
We estimate the expected term of options granted by incorporating the contractual term of the options and employees’ expected exercise behaviors. We estimate the volatility of our common stock by considering volatility of appropriate peer companies and adjusting for factors unique to our stock, including the effect of debt leverage.
Derivative financial instruments. Derivative financial instruments are accounted for in accordance with SFAS No. 133,Accounting for Derivative Instruments and Hedging Activities. We recognize the unwind value of derivative financial instruments as the fair value. This means that the fair value for purchased contracts is based on the amount we could receive from the counterparty to settle the contract. Fair value at any point in time is based upon periodic confirmation of values received from the counterparty.
74
Table of Contents
Environmental and legal liabilities. We record accruals for estimated environmental liabilities when remedial efforts are probable and the costs can be reasonably estimated. These estimates reflect assumptions and judgments as to the probable nature, magnitude and timing of required investigation, remediation and monitoring activities as well as availability of insurance coverage and contribution by other potentially responsible parties. Due to the numerous uncertainties and variables associated with these assumptions and judgments, and changes in governmental regulations and environmental technologies, accruals are subject to substantial uncertainties, and actual costs could be materially greater or less than the estimated amounts. We record accruals for other legal contingencies, which are also subject to numerous uncertainties and variables associated with assumptions and judgments, when the contingency is probable of occurring and reasonably estimable.
Recently Issued Accounting Standards
In December 2007, the Financial Accounting Standards Board (FASB) issued SFAS No. 141 (revised 2007),Business Combinations (SFAS No. 141R), which replaces SFAS No. 141. SFAS No. 141R establishes principles and requirements for how an acquirer recognizes and measures in its financial statements identifiable assets acquired, liabilities assumed, any noncontrolling interest in the acquiree and goodwill acquired. The Statement also establishes disclosure requirements, which will enable users to evaluate the nature and financial effects of the business combination. SFAS No. 141R is effective for us as of January 1, 2009; early adoption is prohibited. We are currently evaluating the potential effect, if any, of the adoption of SFAS No. 141R on our consolidated financial position, results of operations and cash flows.
In December 2007, the FASB issued SFAS No. 160,Noncontrolling Interests in Consolidated Financial Statements—an amendment of Accounting Research Bulletin No. 51 (SFAS No. 160), which establishes accounting and reporting standards for ownership interests in subsidiaries held by parties other than the parent, the amount of consolidated net income attributable to the parent and to the noncontrolling interest, changes in a parent’s ownership interest and the valuation of retained noncontrolling equity investments when a subsidiary is deconsolidated. The Statement also establishes reporting requirements that provide sufficient disclosures that clearly identify and distinguish between the interests of the parent and the interests of the noncontrolling owners. SFAS No. 160 is effective for us as of January 1, 2009; early adoption is prohibited. The adoption of SFAS No. 160 will result in the reclassification of minority interests to shareholders’ equity. We are currently evaluating further effects, if any, of this standard on our consolidated financial position, results of operations and cash flows.
In September 2006, the FASB issued SFAS No. 157,Fair Value Measurements (SFAS No. 157). SFAS No. 157 defines fair value, establishes a framework for measuring fair value and expands disclosures about fair value measurements. In February 2008, the FASB issued FSP FAS 157-2, which delays the effective date of SFAS No. 157 by one year for nonfinancial assets and liabilities that are recognized or disclosed at fair value in the financial statements on a nonrecurring basis. For items covered by FSP FAS 157-2, SFAS No. 157 will now go into effect for us as of January 1, 2009. The adoption of SFAS No. 157 for financial related items did not have a material effect on our consolidated financial position, results of operations or cash flows. We are still evaluating the potential effect of adoption of SFAS No. 157 for non-financial items.
In March 2008, FASB issued SFAS No. 161,Disclosures about Derivative Instruments and Hedging Activities—an amendment of FASB Statement No. 133(SFAS No. 161). SFAS No. 161 gives financial statement users better information about the reporting entity’s hedges by providing for qualitative disclosures about the objectives and strategies for using derivatives, quantitative data about the fair value of and gains and losses on derivative contracts, and details of credit-risk-related contingent features in their hedged positions. SFAS No. 161 is effective for us as of January 1, 2009 with early application encouraged. We are currently evaluating the disclosure requirements of this statement.
75
Table of Contents
We believe that we are the largest coated paper manufacturer in North America, based on production capacity. Coated paper is used primarily in media and marketing applications, such as corporate annual reports, high-end advertising brochures, direct mail advertising, coated labels, magazines, magazine covers and inserts and catalogs. For 2007, after giving effect to the Acquisition Transactions and this offering, we had pro forma net sales of $4.7 billion and pro forma income (loss) from continuing operations of $ million. For the six months ended June 30, 2008, we had net sales of $2.3 billion, and, after giving effect to this offering, pro forma EBITDA of $261 million and pro forma income (loss) from continuing operations of $ million.
After giving effect to the announced closure of our Kimberly, Wisconsin mill at the end of August 2008, we will operate 20 paper machines at ten paper mills located in Kentucky, Maine, Maryland, Michigan, Minnesota, Nova Scotia and Wisconsin. These mills and our distribution centers, are strategically located near major print markets, such as New York, Chicago, Minneapolis and Atlanta. We are one of the most efficient coated paper manufacturers in North America. Based on RISI data, as of the first quarter of 2008, on a pro forma basis after giving effect to the Acquisition Transactions and the closure of our Niagara and Kimberly, Wisconsin mills, we believe that all of our non-specialty coated paper machines were in the top 25% of efficiency of all non-specialty coated paper machines in North America, Europe and Asia based on the cash cost of delivered product to Chicago. Our mills have a total annual production capacity of approximately 4.5 million short tons of paper, including approximately 3.3 million short tons of coated paper, approximately 900,000 short tons of uncoated paper and approximately 300,000 short tons of specialty paper, after taking into account our announced restructuring and closure plans discussed in this prospectus.
We have long-standing relationships with many leading publishers, commercial printers, retailers and paper merchants. Our key customers include Condé Nast Publications, Hearst Corporation, The McGraw-Hill Companies, Meredith Corporation, Pearson Education and Time Inc. in publishing; Quad/Graphics, Quebecor World Inc. and R.R. Donnelley & Sons Company in commercial printing; J.C. Penney Company, Inc., Target Corporation and Williams-Sonoma, Inc. in retailing; and paper merchants PaperlinX Limited, Unisource Worldwide, Inc. and xpedx, a division of International Paper Company. Key customers for specialty paper products include Avery Dennison Corporation and Vacumet Corp.
NewPage Group is a Delaware corporation. Our principal executive offices are located at 8540 Gander Creek Drive, Miamisburg, Ohio 45342, and our telephone number at those offices is (877) 855-7243. Our website address is www.newpagecorp.com. The information contained on our website does not constitute part of, nor is it incorporated into, this prospectus.
76
Table of Contents
Industry Overview
The North American paper industry is cyclical and, like other cyclical industries, is largely affected by the interplay of demand and supply. Demand and supply factors affecting our principal paper products, as well as historical price trends, are discussed below.
Coated Paper
Consumption/Demand. According to RISI, North American customers purchased approximately 13 million tons of coated paper in 2007. North American coated paper demand is primarily driven by advertising and print media usage. In particular, the demand for certain grades of coated paper is affected by spending on catalog and promotional materials by retailers and spending on magazine advertising, which affects the number of printed pages in magazines. Advertising spending and magazine and catalog circulation tend to rise when GDP in the United States is robust and typically decline in a sluggish economy. According to RISI, in the first half of 2008, North American coated paper demand declined by 5.9%, compared to the same period in 2007, as a result of decreased advertising spending and magazine and catalog circulation. North American coated paper demand is projected by RISI to decline by 10% for the second half of 2008 compared to the second half of 2007.
Production/Supply. In North America and the United States, supply is determined by both local coated paper production and imports from sources outside North America or the United States, principally Europe and Asia. Imports have become a structural part of the North American coated paper marketplace. The volume of coated paper imports from Europe and Asia is a function of worldwide supply and demand for coated paper, the exchange rate of the U.S. dollar relative to other currencies, especially the Euro, market prices in North America and other markets and the cost of ocean-going freight. According to RISI, North American and U.S. coated paper demand exceeded North American capacity in 2007 by 14% and 18% respectively. We believe that North American and U.S. coated paper demand will continue to exceed North American capacity for the foreseeable future.
Since 2000, the North American coated paper industry has experienced consolidation. In addition, coated paper manufacturers have rationalized capacity resulting in higher operating rates, which measure the ratio of shipments from producers in a particular region to capacity of producers in the same region. According to RISI, in 2000, 80% of the coated paper capacity in North America was attributable to eleven manufacturers. By 2008, this number had decreased to six manufacturers. According to RISI, over the same time period, there was an overall reduction in North American coated paper production capacity of more than 1.1 million short tons and, from 2004 to 2007, North American coated paper production capacity has declined by 757,000 short tons. In January 2008, we announced a further capacity reduction of 430,000 short tons of coated paper. In addition, we will close our Kimberly, Wisconsin mill at the end of August 2008, which will result in a further reduction in North American coated paper production capacity. The Kimberly mill currently produces approximately 500,000 short tons of coated paper annually.
From 2000 to 2007, coated paper imports into North America increased from 13% to 19% of total coated paper purchases and coated paper imports into the United States increased from 22% to 27% of total coated paper purchases, according to RISI. From 2004 through the end of 2006, imports of coated paper grew at a slower pace than from 2000 through 2003. We believe that this was largely due to an increase in demand in Asian markets and a reduction of supply in Europe combined with an increase in European demand and less favorable exchange rates for European producers. In 2007, total coated paper imports into North America declined to 19%, compared to 20% of total coated paper
77
Table of Contents
purchases in 2006, due in part to less favorable exchange rates for foreign producers, higher ocean-going freight costs and lower U.S. demand, according to RISI. RISI projects coated paper imports into North America to be 18% of total coated paper purchases in 2008, 19% of total coated paper purchases in 2009 and 21% of total coated paper purchases for 2010 to 2013.
Operating Rates. Operating rates of North American coated paper manufacturers are a function of North American supply and demand. Historically, high operating rates have resulted in higher prices for coated paper. According to RISI, the average operating rate for North American coated paper manufacturers rose from 86% in 2001 to 97% in 2007, as shipments increased more than capacity during this time period. RISI projects the average coated paper operating rate to be 95% in 2008 and remain above 92% through 2013 because demand is expected to grow faster than North American capacity. We took 18,000 tons of market-related downtime of coated paper during the second quarter of 2008 and have announced that we intend to take an additional 41,000 tons of market-related downtime of coated paper in the third quarter of 2008.
The following chart shows historical and projected North American demand, capacity and operating rates for coated paper:
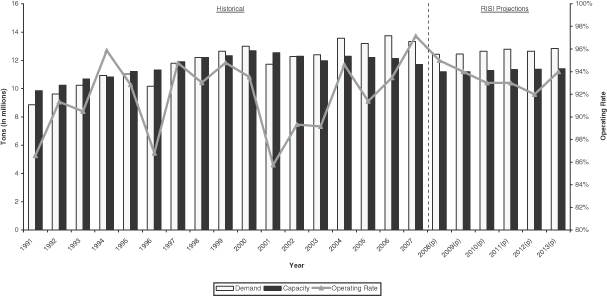
Source: RISI
Pricing. U.S. pricing for grade No. 3 coated paper, 60 lb. weight, which is an industry benchmark for coated freesheet pricing, reached a peak in 1995, with a price of approximately $1,240 per ton, according to RISI. Between 1991 and 1999, U.S. prices for grade No. 3 coated paper, 60 lb. weight fluctuated between $840 per ton and $1,240 per ton, according to RISI. From 2000 to 2003, prices fell to a 20-year low of $705 per ton, corresponding to a decrease in North American coated paper demand and an increase in coated paper imports, according to RISI. Since June 2004, prices for grade No. 3 coated paper, 60 lb. weight have generally increased due to capacity reductions and slower import growth.
Pricing for grade No. 4 coated paper, 50 lb. weight, which is an industry benchmark for coated groundwood paper pricing, generally followed a similar trend to coated paper grade No. 3, 60 lb. weight pricing until March 2006. Coated groundwood paper prices declined from March 2006 until June 2007, primarily due to increased capacity from the resumption in August 2005 of operations at UPM’s
78
Table of Contents
Miramichi mill in Canada after an eight month strike and increased European imports into the United States. Since June 2007, coated groundwood paper prices have increased as a result of announced capacity closures by North American producers, including us and the shutdown of UPM’s Miramichi mill, and a lower volume of European imports into the United States.
Notwithstanding the decline in demand, primarily as a result of capacity reductions, RISI forecasts the average price of grade no. 3 coated paper to increase to $1,063 per ton in 2008 from $928 per ton in 2007 and the average price of grade no. 4 coated paper to increase to $1,048 per ton in 2008 from $878 per ton in 2007. RISI forecasts the average prices of both grades to be above $1,000 per ton through 2013.
The following table shows historical and projected U.S. prices per ton for grade No. 3 coated paper, 60 lb. weight and No. 4 coated paper, 50 lb. weight for the periods indicated below:
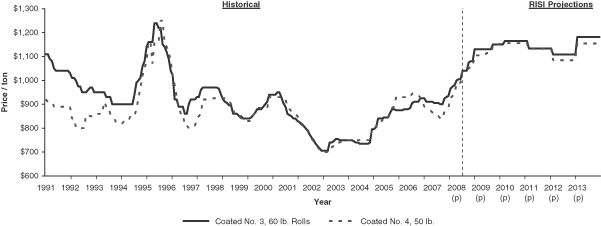
Source: RISI
As a result of the expiration of annual customer price caps and price increases announced in the fourth quarter of 2007, U.S. market prices increased approximately $95 per ton for coated groundwood paper and $60 per ton for coated freesheet paper from December 2007 through June 2008. In May 2008, we announced a $60 per ton price increase on most coated and supercalendered paper grades, effective beginning in July 2008. When coated paper manufacturers announce price increases, they generally take effect over time. Whether a price increase is successful depends on supply, demand and other competitive factors in the marketplace.
Supercalendered Paper
Consumption/Demand. Supercalendered paper customers in the United States purchased approximately 3 million tons of supercalendered paper in 2007. Similar to coated paper demand, demand for supercalendered paper is primarily driven by advertising and print media usage. High end supercalendered paper is often considered a substitute for light-weight coated groundwood paper grades. Therefore, supercalendered paper demand is also affected by changes in ultra light-weight coated paper prices.
Pricing. U.S. pricing for SC-A paper, 35 lb. weight, which is an industry benchmark for supercalendered paper pricing, reached a peak in 1995, with a price of approximately $1,030 per ton. Between 1991 and 1999, U.S. prices fluctuated between $670 and $1,030 per ton, according to RISI. From 2000 to 2003, prices fell to a low of $655 per ton, corresponding to increases in domestic capacity despite relatively flat demand, according to RISI. Prices gradually recovered by November 2006, reflecting higher demand resulting from GDP growth in the United States and improved
79
Table of Contents
operating rates. Prices declined slightly from November 2006 through September 2007 due to increased supply and customers switching to light-weight coated paper as a result of price declines for light-weight coated paper. Prices began to increase again beginning in September 2007 due to announced capacity closures and increased demand.
The following table shows historical and projected U.S. prices per ton for SC-A paper, 35 lb. weight for the periods indicated below:
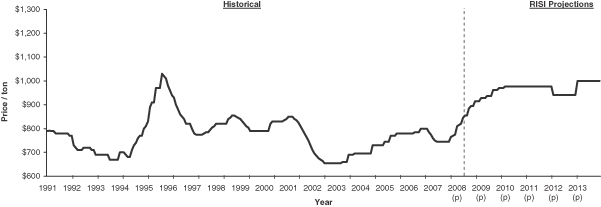
Source: RISI
Newsprint
Newsprint is primarily used in newspaper in North America. It is also used, secondarily, in inserts, magazines and direct mail applications.
Specialty Paper
Specialty papers cover a wide variety of products. They range from technical papers, including self-adhesive labels, release liner base and direct thermal base, to packaging papers for flexible packaging, bottle labels and gift wrap. Flexible packaging, pressure sensitive labels and bottle labels are among the largest specialty paper end uses.
Business Strategy
The key elements of our strategy include the following:
Maintain core focus on coated paper business. We believe that our focus on producing coated paper provides us with a significant competitive advantage by enabling us to lower production costs per ton due to greater economies of scale, reduce delivery costs as a result of larger shipment sizes and provide a higher level of customer service. With the acquisition of SENA, we extended our product breadth into light-weight and ultra light-weight coated groundwood papers and added volume to our existing coated paper grades. The Acquisition also added capacity of supercalendered uncoated groundwood papers, a complementary lower cost alternative to coated paper, primarily for magazine and catalog use.
Continue to reduce costs through synergies and further productivity improvements. We expect to generate annualized synergies as a result of the Acquisition of approximately $265 million to be achieved by June 2009. For a further discussion of these plans, see “Management’s Discussion and Analysis of Financial Condition and Results of Operations—Overview—Anticipated Synergies of the
80
Table of Contents
Acquisition and Integration of the Business.” Since January 2000, we have significantly reduced our costs through rationalization of facilities and purchasing, development of integrated marketing strategies, coordination of information and manufacturing systems and consolidation of grade lines. In addition, since 2000, we have implemented best practices across our mill system and have focused on maximizing overall profitability, rather than independently at each individual mill. Without giving effect to the Acquisition or expected synergies, according to RISI, the cash cost per ton excluding delivery of the four original NewPage mills improved from an 8%, or $47 per ton, advantage over the North American average in 2002 to a 15%, or $98 per ton, advantage over the North American average in the fourth quarter of 2007. For the first quarter of 2008, on a combined basis after giving effect to the Acquisition but without giving effect to our announced restructuring and closure plans discussed in this prospectus, according to RISI, our cash cost per ton excluding delivery represented an advantage of 7%, or $48 per ton, over the North American average. We will continue to implement additional measures, including the use of Lean Six Sigma initiatives, to enhance our operating efficiency and productivity. We believe that the synergies resulting from the Acquisition and these additional measures will enhance our ability to further decrease production costs per ton and to increase operating cash flow and margins.
Enhance product mix to improve margins and earnings. We continue to seek opportunities to increase sales of higher-margin grades of coated paper, such as higher-end grades of coated papers and ultra light-weight coated groundwood papers. We intend to continue to do so through increased sales to our existing customers as well as to new customers, in particular printers, publishers and paper merchants. For example, as part of our initiative to enhance product mix, from 2005 to 2007, we increased net sales of our caliper papers, which are higher-end grades of coated paper used largely in direct mail applications, by approximately 35%. We also seek to increase our margins by focusing on more profitable customer categories, such as corporate end users, and expanding our relationships with these customers.
Further improve cash flow and return on capital. Since the inception of our company, we have focused on increasing our cash flow and our return on capital, including through the strategy initiatives discussed above. We also adopted and have continued to implement a capital expenditure plan that is focused on attractive investment projects. In addition, we believe, based on our current business plans, capital structure, tax position and current tax law, that we will not be required to pay material U.S. federal income taxes until 2010. We believe that our current productivity initiatives and the synergies and closure described herein, coupled with favorable pricing trends for coated paper, will enhance our ability to generate cash flow and improve our return on capital. We intend to use our cash flow to repay debt and finance continued improvements in our operations. In addition, we may use our cash flow to return capital to shareholders through dividends and/or share repurchases and to selectively pursue synergistic acquisitions and/or strategic partnerships.
Business Strengths
We believe that our core strengths include the following:
Largest North American manufacturer of coated paper products. Our mills have a total annual production capacity of approximately 3.3 million short tons of coated paper, after taking into account our announced restructuring and closure plans discussed in this prospectus. Our production capacity represents approximately 26% of 2008 North American production capacity and net North American imports of coated paper, according to RISI. The SENA acquisition enhanced our market position by expanding our paper offerings to include light-weight and ultra light-weight coated paper and added complementary offerings in supercalendered paper and specialty paper products. We believe that our broad product portfolio, well-known brands and service will help us to remain a leading supplier of coated paper products.
81
Table of Contents
Well positioned to benefit from strengthening pricing environment. We believe that we are well positioned to benefit from price increases in the coated paper industry as a result of our product breadth and long-standing customer relationships. Since June 2004, North American coated paper prices have generally risen due to a combination of demand and decreased North American capacity resulting from capacity rationalization. From 2000 to 2007, North American production capacity for coated paper declined by over 1.1 million short tons, and production capacity declined by 757,000 short tons from 2004 to 2007, according to RISI. In addition, in 2008, we shut down machines and announced mill closures that will result in the permanent reduction of approximately 930,000 tons of coated paper capacity. We believe that North American and U.S. coated paper demand will continue to exceed North American capacity for the foreseeable future. The strengthening pricing environment has enabled us to successfully raise prices to improve profitability.
Attractive cost position coupled with further profit improvement initiatives. As of the first quarter of 2008, on a pro forma basis after giving effect to the Acquisition Transactions and our announced restructuring and closure plans discussed in this prospectus, we believe that all of our non-specialty coated paper machines were in the top 25% of efficiency of all non-specialty coated paper machines in North America, Europe and Asia based on the cash cost of delivered product to Chicago, based on RISI data. Since 2000, over $500 million has been invested in the original NewPage mills to maintain or improve a cost advantage over our competitors. In addition, since January 2000, we have significantly reduced our costs through rationalization of facilities and purchasing, development of integrated marketing strategies, coordination of information and manufacturing systems and consolidation of grade lines at our mills by implementing best practices across our mill system and focusing on increasing overall profitability, rather than on a mill-by-mill basis. From 2000 until the Acquisition, SENA invested over $700 million in its business, including several major capital projects involving the rebuilding of paper machines at the Biron, Wisconsin Rapids and Whiting mills. We believe that we will be able to further enhance our operating efficiency and profitability as a result of the initiatives described above, the synergies we anticipate in connection with the SENA acquisition, the closures of the Kimberly and Niagara, Wisconsin mills, our ability to generate a substantial portion of our energy needs and to adjust in part our mix of externally and internally sourced energy and our production of low cost pulp through our integrated pulp operations.
Strong relationships with key customers. We have long-standing relationships with leading publishers, paper merchants, commercial printers and retailers. We believe our sales strategy, which includes both direct sales to our larger customers and sales to merchants, who then resell our products, has reduced sales costs and enhanced customer service. Our relationships with our five largest customers, which contributed approximately 39% of our pro forma net sales for 2007, average over 38 years. We seek to continue to enhance our relationships with our key customers by providing them with a high level of value-added customer service.
Efficient and integrated supply chain. We believe that the location of our mills and distribution centers near major print markets, such as New York, Chicago, Minneapolis and Atlanta, affords us the ability to more quickly and cost-effectively deliver our products to those markets. In addition, we believe that our fully-implemented integrated ERP system enables us to run our operations more cost-effectively through better planning of manufacturing runs and tracking of costs and inventory and will better enable us to realize some of the anticipated synergies of the Acquisition. Our ERP system also enhances our customer service, because it gives many of our customers the ability to order products and to track the real-time progress of their orders online. As part of the reorganization plan associated with the SENA acquisition, we are in the process of migrating the SENA mills to our existing ERP system and integrating SENA’s order management, purchasing, inventory and finance information systems with our existing systems.
82
Table of Contents
Experienced management team with proven track record. Our senior management team averages approximately 12 years of experience in the paper and forest products industry, and several members of our management team were responsible for the successful integration of Mead and Westvaco into a stand-alone business, which has resulted in improved cost structure and meaningful cash flow. Our chairman and chief executive officer, Mark A. Suwyn, was chairman and chief executive officer of Louisiana-Pacific Corporation, a building product materials manufacturing company. Mr. Suwyn headed Louisiana-Pacific from 1996 to 2004. Prior to Louisiana-Pacific, Mr. Suwyn served as an executive vice president at International Paper. Our chief operating officer, Richard D. Willett, Jr., had 13 years of broad management experience with General Electric Company followed by three years with Teleglobe International Holdings, where he was chief financial officer and subsequently chief operating officer. At Teleglobe, Mr. Willett led a major restructuring, cost reduction and acquisition effort. In addition to strong general management skills, Mr. Willett brings extensive leadership experience in disciplined cost management and process management initiatives such as Lean Six Sigma.
Products
Our portfolio of paper products includes coated freesheet, coated groundwood, supercalendered, newsprint and specialty paper; the latter consisting primarily of paper products used in labels and packaging. We offer the broadest coated paper product selection of any North American paper manufacturer. We also sell uncoated paper and market pulp. Our brands are some of the most recognized brands in the industry. Substantially all of our 2007 sales were within North America and approximately 90% of them were within the United States. Our principal product is coated paper, which represented 84% of our 2007 pro forma net sales.
The following charts set forth our pro forma 2007 paper and pulp volume by type of grade and end-use after taking into account the Acquisition but not our announced restructuring and closure plans discussed in this prospectus:
| Pro Forma 2007 Short Tons Sold by Grade | Pro Forma 2007 Short Tons Sold by End Use | |
 | ||
Coated Paper
We believe that we are the largest coated paper manufacturer in North America based on production capacity. Our mills have a total annual production capacity of approximately 3.3 million short tons of coated paper, after taking into account our announced restructuring and closure plans discussed in this prospectus, which represents approximately 26% of 2008 North American production capacity and net North American imports of coated paper, according to RISI. Coated paper is used primarily in media and marketing applications, including corporate annual reports, high-end advertising
83
Table of Contents
brochures, magazines, catalogs and direct mail advertising. Coated paper has a higher level of smoothness than uncoated paper. Increased smoothness is typically achieved by applying a clay-based coating on the surface of the paper and processing that paper under heat and pressure. As a result, coated paper achieves higher reprographic quality and printability.
Coated paper consists of both coated freesheet and coated groundwood, which generally differ in price and quality. The chemically-treated pulp used in freesheet applications produces brighter and smoother paper than the mechanical pulp used in groundwood papers. On a pro forma basis, after taking into account the Acquisition but not our announced restructuring and closure plans discussed in this prospectus, coated freesheet papers comprised 57% of the coated paper we produced in 2007. Based on this 2007 pro forma production capacity, we believe that we are one of the largest producers of coated freesheet papers in North America, accounting for approximately 39% of North American production capacity in 2007 and net North American imports of coated freesheet paper. We produce coated freesheet papers in No. 1, No. 2 and No. 3 grades for higher-end uses such as corporate annual reports and high-end advertising, as well as coated label paper with our C1S (coated one-side) paper line, which is used primarily for label and specialty applications.
Coated groundwood papers, which represented 43% of the coated paper we produced in 2007 on a pro forma basis, after taking into account the Acquisition but not our announced restructuring and closure plans discussed in this prospectus, are typically lighter and less expensive than our coated freesheet products. We produce coated groundwood papers in No. 3, No. 4 and No. 5 grades for use in applications requiring lighter paper stock such as magazines, catalogs and inserts.
Each of the paper grades that we manufacture are produced in a variety of weights, sizes and finishes that can be gloss, dull or matte. The coating process changes the gloss, ink absorption qualities, texture and opacity of the paper to meet each customer’s performance requirements. Most of the coated paper that we manufacture is shipped in rolls with the rest cut into sheets.
Supercalendered Paper
Supercalendered paper is uncoated paper with pigment filler passed through a supercalendering process in which alternating steel and cotton covered rolls “iron” the paper, giving it a gloss and smoothness that resembles coated paper. Our supercalendered paper is primarily used for magazines, catalogs, advertisements, inserts and fliers. Based on 2007 pro forma production capacity, after taking into account the Acquisition but not our announced restructuring and closure plans discussed in this prospectus, we believe we are one of the largest producers of supercalendered paper in North America, accounting for approximately 16% of North American production capacity and net North American imports of supercalendered paper into North America. We produce supercalendered paper in SC-A and SC-A+ grades.
Newsprint Paper
Newsprint paper is uncoated groundwood paper used primarily for printing daily newspapers and other publications. We are a niche supplier of newsprint paper serving the North American and select international markets in the publishing and printing industry for major end-uses such as newspapers and inserts/fliers for retail customers.
Specialty Paper
Specialty paper consists of both coated and uncoated paper designed and produced to meet the specific packaging, printing and labeling needs of customers with diverse and specialized paper needs. Specialty papers consist of two primary product lines: technical paper and packaging papers.
84
Table of Contents
Technical papers consist of face papers, thermal transfer, direct thermal base papers and release liners for use in self-adhesive labels. Packaging papers are designed to protect, transport and identify a wide range of products. Flexible packaging papers are often used as part of a multilayer package construction, in combination with film, foil, extruded coatings, board and other materials. For example, flexible packaging papers are used in pouch, lidding, bag, tobacco packaging and spiral can applications.
Other Products
We also produce uncoated paper to enhance our manufacturing efficiency by filling unused capacity, such as when we have excess capacity on a paper machine but not on a coater. Uncoated paper does not contain the other types of coatings present on coated paper. It typically is used for business forms and stationery, general printing paper and photocopy paper. We primarily sell uncoated paper to business forms manufacturers and converters.
Manufacturing
After giving effect to the announced closure of our Kimberly, Wisconsin mill at the end of August 2008, we will operate 20 paper machines at ten mills located in Kentucky, Maine, Maryland, Michigan, Minnesota, Nova Scotia and Wisconsin. All of these paper mills are at least partially-integrated mills, meaning that they produce paper, pulp and energy. Most of the energy produced at these mills is for internal use. Our mills have a total annual production capacity of approximately 4.5 million short tons of paper, including approximately 3.3 million short tons of coated paper, approximately 900,000 short tons of uncoated paper and approximately 300,000 short tons of specialty paper, after taking into account our announced restructuring and closure plans discussed in this prospectus. With the exception of our Port Hawkesbury, Nova Scotia, mill, substantially all of our long-lived assets are located within the U.S. The following table lists the paper products produced at each of our mills, as well as each mill’s approximate annual paper capacity, taking into account the announced restructuring and closure plans described below:
Mill Location | Products | Paper Capacity (short tons/year) | ||
Biron, Wisconsin | Coated paper | 400,000 | ||
Duluth, Minnesota | Supercalendered paper | 250,000 | ||
Escanaba, Michigan | Coated and uncoated paper | 790,000 | ||
Luke, Maryland | Coated paper and specialty paper | 580,000 | ||
Port Hawkesbury, Nova Scotia | Supercalendered paper and newsprint | 580,000 | ||
Rumford, Maine | Coated paper and specialty paper | 570,000 | ||
Stevens Point, Wisconsin | Specialty paper | 170,000 | ||
Whiting, Wisconsin | Coated paper | 240,000 | ||
Wickliffe, Kentucky | Coated, specialty and uncoated paper | 340,000 | ||
Wisconsin Rapids, Wisconsin | Coated paper | 520,000 |
On January 16, 2008, we announced restructuring plans that include the shutdown of four of our less efficient, higher cash cost paper machines. We closed the No. 11 paper machine in Rumford, Maine in February 2008, the No. 95 paper machine in Kimberly, Wisconsin in May 2008 and the Niagara, Wisconsin paper mill, which includes two paper machines, in June 2008. We also plan to shut down the Chillicothe, Ohio converting facility by the end of November 2008. On July 30, 2008, we announced that we will close the Kimberly, Wisconsin mill at the end of August 2008. We intend to reallocate production of paper grades across our remaining combined machine base, resulting in the operation of machines in narrower ranges of paper grades around their peak production. Actual changes in production capacity from that reflected in the table above will depend on how we re-allocate
85
Table of Contents
production of paper grades across our remaining machine base in connection with our announced restructuring and closure plans. For a further discussion of these plans, see “Management’s Discussion and Analysis of Financial Condition and Results of Operations—Overview—Anticipated Synergies of the Acquisition and Integration of the Business.”
We also intend to realize cost reductions from improved logistics. Through reallocation of production among our combined mills, we expect to produce more products in greater proximity to customers, lowering freight costs. In addition, we intend to continue to implement best practices across our combined mill system and focus on increasing our overall profitability, rather than independently at each individual mill.
Over $1.4 billion of capital expenditures have been invested in our paper mills since 2000, to build, maintain and update facilities and equipment, enhance product mix, lower costs and meet environmental requirements. Since 2000, over $500 million has been invested in the original NewPage mills to maintain or improve a cost advantage over our competitors. These upgrades also included an upgrade of our papermaking technology to support our high-end coated grade lines. From 2000 until the Acquisition, SENA invested over $700 million in its business, including several major capital projects involving the rebuilding of paper machines at the Biron, Wisconsin Rapids and Whiting mills.
Over the last several years, we have significantly reduced our costs by consolidating operations and focusing on operational efficiency. We reduced our salaried headcount by approximately 28% and our hourly headcount by approximately 20% from 2002 up until the time of the Acquisition. From January 2002 up until the time of the Acquisition, we shut down six of our paper machines, closed one paper mill and reduced our maintenance costs by improving our annual maintenance shutdown procedures. From August 2000 up until the time of the Acquisition, SENA reduced salaried headcount by approximately 38% and hourly headcount by approximately 40%. We expect the size of our salaried and hourly headcount to further decline over time as we complete our integration of the two businesses. On January 16, 2008, we announced actions being taken in furtherance of achieving certain synergies relating to the Acquisition, including the shutdown of paper machines and further headcount reductions. In addition, we will close our Kimberly, Wisconsin mill at the end of August 2008. See “Management’s Discussion and Analysis of Financial Condition and Results of Operations—Overview—Anticipated Synergies of the Acquisition and Integration of the Business.”
The first step in the production of paper is to produce pulp from wood. Pulp for groundwood and supercalendered paper is produced using a mechanical or thermo-mechanical process. Pulp for freesheet paper is produced by placing wood chips that are mixed with various chemicals into digester “cooking” vessels. The pulp is then washed and bleached. To turn the pulp into paper, it is processed through a paper machine. Hardwood and softwood pulp is blended based on the desired paper characteristics.
To produce coated paper, uncoated paper is put through a coating process. Our mills have both on-machine coaters, which are integrated with the paper machines, and separate off-machine coaters. On-machine coaters generally are considered to be more efficient, while off-machine coaters generally are considered to have more flexibility. After the coating process is complete, the coated paper is slit and wound into rolls to be sold to customers. We also have converting facilities at which we convert some of these rolls into sheets.
Paper machines are large, complex systems that operate more efficiently when operated continuously. Paper machine production and yield decline when a machine is stopped for any reason. Therefore, we organize our manufacturing processes so that our paper machines and most of our
86
Table of Contents
paper coaters run almost continuously throughout the year. Some of our paper machines also offer the flexibility to change the type of paper produced on the machine, which allows easier matching of production schedules and seasonal and geographic demand swings.
Paper production is energy intensive. On a combined basis, we and SENA produced approximately 40% of our energy requirements in 2007 from steam produced during the pulp manufacturing process. After taking into account our announced restructuring and closure plans discussed in this prospectus, we expect to generate approximately 45% of our energy requirements in 2008. The energy we purchase from third-party suppliers consists of electricity and fuel, primarily natural gas and coal, some of which is used to generate energy for our operations. We purchase substantial portions of our coal needs under long-term supply contracts, most of which relate to a specific mill and are with a single provider. Most of our contracts have pricing mechanisms that adjust or set prices based on current market prices.
Our wholly-owned subsidiary, CWPCo, provides energy to our mills in central Wisconsin. CWPCo has 33.3 megawatts of generating capacity on 39 generators located in five hydroelectric plants on the Wisconsin River. CWPCo is a regulated public utility and also provides electricity to a small number of other residential, light commercial and light industrial customers.
We also are the general partner and have a 30% investment in Rumford Cogeneration Company L.P., a joint venture created to generate power for us at our Rumford mill and for public sale. We have an option through 2014 to purchase all of our co-investors’ interests in the partnership.
Raw Materials and Suppliers
Pulp and wood fiber are the primary raw materials used in making paper. Pulp is the generic term that describes the cellulose fiber derived from wood. These fibers may be separated by mechanical, thermo-mechanical or chemical processes. The processes we use at our mills to produce pulp for freesheet paper involve removing the glues, which bind the wood fibers, to leave cellulose fibers. Our papermaking operations have historically consumed most of the pulp that we produced, and we have sold our excess hardwood pulp, which we refer to as market pulp, to third parties in the United States and internationally. The former SENA mills have historically been a net purchaser of market pulp. We intend to use substantially all of our excess pulp production internally to reduce the amount of pulp purchased from third parties.
The primary sources of wood fiber are timber and its byproducts, such as wood chips. We are a party to various fiber supply agreements to supply our mills with hardwood, softwood, aspen pulpwood and wood chips. These agreements require the counterparty to sell to the mills, and require the mills to purchase, a designated minimum number of tons of pulpwood and wood chips during the specified terms of the arrangement, which have various expiration dates from December 31, 2008 to December 31, 2053. The annual purchase requirement under these agreements is approximately 3 million tons per year from 2008 to 2009, approximately 2 million tons per year from 2010 to 2015, approximately 1 million tons per year from 2016 to 2020 and approximately 300,000 tons per year from 2021 to 2026. In 2019, all of the agreements terminate with the exception of the agreement with respect to the Rumford mill, which terminates in 2053. For all of the pulpwood agreements, we may purchase a substantial portion of any additional pulpwood harvested by the counterparty during each year. The prices to be paid under these agreements are determined by formulas based upon market prices in the relevant regions and are subject to periodic adjustments based on procedures stipulated in each agreement. The amount of timber we receive under these agreements has varied, and is expected to continue to vary, according to the price and supply of wood fiber for sale on the open market and the harvest levels the timberland owners deem appropriate in the management of the timberlands.
87
Table of Contents
Our Port Hawkesbury, Nova Scotia mill operates a woodlands unit which manages approximately 1,500,000 acres of land leased from the Province of Nova Scotia and 59,000 acres of land we own in Nova Scotia. All wood harvested from the licensed lands must be used in our Port Hawkesbury mill unless otherwise agreed to by the Province of Nova Scotia. The license currently expires in July 2051 and may be terminated by the Province of Nova Scotia if the Port Hawkesbury mill is not operational for a continuous period of two years.
We seek to fulfill substantially all of our wood needs with timber that is harvested by professional loggers trained in certification programs that are designed to promote sustainable forestry. We do not accept wood from old growth forests, forests of exceptional conservation value or rainforests. We do not accept illegally harvested or stolen wood. We have formally notified our outside wood chip suppliers that we expect their wood supply will be produced by trained loggers in compliance with sustainable forestry principles. Our goal is to ensure that sustainable forestry-trained loggers are used to supply essentially all of the wood to our mills. We oppose and, through our participation in the American Forest and Paper Association and other industry organizations, are working to stop illegal logging in the United States and worldwide.
Chemicals used in the production of paper include latex and starch, which are used to affix coatings to paper; calcium carbonate, which brightens paper; titanium, which makes paper opaque; and other chemicals used to bleach or color paper. We purchase these chemicals from various suppliers and are not dependent on a single supplier for any of these chemicals, although some specialty chemicals are available only from a small number of suppliers.
Customers
We have long-standing relationships with leading publishers, paper merchants, commercial printers and retailers, representing a diversified customer base. Our ten largest customers accounted for approximately half of our pro forma annual net sales for 2007. Our key customers include Condé Nast Publications, Hearst Corporation, The McGraw-Hill Companies, Meredith Corporation, Pearson Education and Time Inc. in publishing; Quad/Graphics, Quebecor World Inc. and R.R. Donnelley & Sons Company in commercial printing; J.C. Penney Company, Inc., Target Corporation and Williams-Sonoma, Inc. in retailing; and paper merchants PaperlinX Limited, Unisource Worldwide, Inc. and xpedx, a division of International Paper Company. Key customers for specialty paper products include Avery Dennison Corporation and Vacumet Corp.
During 2007, xpedx accounted for 20% of our pro forma net sales. No other customer accounted for more than 10% of our 2007 pro forma net sales.
Sales, Marketing and Distribution
We sell our paper products primarily in the United States and Canada, using three sales channels: direct sales, which consist of sales made directly to end-use customers, primarily large companies such as publishers, printers and retailers; merchant sales, which consist of sales made to paper merchants, who in turn sell to end-use customers; and specialty sales, which consist of sales made to packaging and label manufacturers.
Across the three channels of our sales network, sales professionals are compensated with a salary and bonus plan based on account profitability and individual assignments. As part of our customer service, we seek to provide value-added services to customers. For example, within the merchant channel, we work closely with customers to meet specifications and to utilize joint marketing efforts when appropriate.
88
Table of Contents
We also emphasize technical support as part of our commitment to customers. We seek to enhance efficiency for customers by enabling them to interact with us online, including through order access, planning, customer data exchange and consumption estimation tools.
The locations of our paper mills and distribution centers also provide certain logistical advantages as a result of their close proximity to several major print markets, including New York, Chicago, Minneapolis and Atlanta, which affords us the ability to more quickly and cost-effectively deliver our products to those markets. We have seven major distribution facilities, three located in the Chicago area and the remainder located in Bedford, Roaring Springs and Allentown, Pennsylvania and La Mirada, California. In total, we own two warehouses and lease space in approximately 55 warehouses owned by third parties. Paper merchants also provide warehouse and distributions systems to service the needs of commercial print customers. We use third parties to ship our products by truck and rail. In addition, we utilize integrated tracking systems that track all of our products through the distribution process. Customers can access order tracking information over the internet. Most of our products are delivered directly to printers or converters, regardless of sales channel.
We intend to realize cost reductions from improved logistics. Through reallocation of production among our combined mills, we expect to produce more products in greater proximity to customers, lowering freight costs. See “Management’s Discussion and Analysis of Financial Condition and Results of Operations—Overview—Anticipated Synergies of the Acquisition and Integration of the Business.”
Competition
The North American paper industry is highly competitive. We compete based on a number of factors, including price, product availability, quality, breadth of product offerings, customer service and distribution capabilities.
Our primary competitors for coated paper are AbitibiBowater Inc., Sappi Limited, UPM-Kymmene Corporation and Verso Paper, Inc. Our primary competitors for supercalendered paper are AbitibiBowater Inc., Catalyst Paper Corporation and Irving Paper Ltd. Our primary competitor for newsprint is AbitibiBowater Inc.
The competition in the specialty paper category is diverse and highly fragmented, varying by product end use. Our primary competitors for specialty paper products are Appleton Coated LLC, Boise Cascade LLC, Dunn Paper Inc., Fraser Papers Inc., International Paper Company, UPM-Kymmene Corporation and Wausau Paper Corp.
Some of our competitors have greater financial and other resources than we do or may be better positioned than we are to compete for certain opportunities. We also believe that our competitors in China, Indonesia and South Korea are selling their products in our markets at less than fair value and are being subsidized by their governments.
Information Technology Systems
We use integrated information technology systems that help us manage our product pricing, customer order processing, customer billing, raw material purchasing, inventory management, production controls and shipping management, as well as our human resources management and financial management. Our information technology systems utilize principally third-party software. As part of the reorganization plan associated with the Acquisition, we are in the process of migrating the acquired mills to our existing ERP system and integrating NPCP’s order management, purchasing, inventory and finance information systems with our existing systems.
89
Table of Contents
We are a party to a Master Services Agreement with Accenture LLP. Under that agreement, Accenture will provide information technology services through December 31, 2017 and human resources services through January 31, 2013 necessary to support our operations at specified monthly base prices (with incremental charges for additional services provided) plus transition charges. The information technology services include development, maintenance and support of our software, mainframe, server, managed network and application management systems. Accenture also supports and maintains third-party software and hardware currently used in our operations. Accenture’s human resource services include maintenance and support of employee benefits, payroll and tax services. Accenture may immediately terminate the agreement if we materially breach our obligations under the agreement and fail to cure the breach within 30 days. In addition, if Accenture fails to perform its services at or above fixed service levels, we have the ability to terminate the information technology services portion of the Master Services Agreement.
Intellectual Property
In general, paper production does not rely on proprietary processes or formulas, except in highly specialized or custom grades. We hold foreign and domestic patents as a result of our research and product development efforts and also have the right to use certain other patents and inventions in connection with our business. We also own registered trademarks for some of our products. Although, in the aggregate, our patents and trademarks are important to our business, financial condition and results of operations, we believe that the loss of any one or any related group of intellectual property rights would not have a material adverse effect on our business, financial condition or results of operations.
Employees
As of June 30, 2008, we had approximately 8,500 employees. Approximately 75% of our employees were represented by labor unions, principally by the United Steelworkers, the International Brotherhood of Electrical Workers, CEP, the International Association of Machinists and Aerospace Workers and the United Association of Journeymen and Apprentices of the Plumbing and Pipefitting Industry of the United States and Canada.
We have 17 collective bargaining agreements expiring at various times between December 1, 2008 and November 30, 2010, with one collective bargaining agreement covering approximately 700 employees expiring before December 31, 2008. Two contracts expired June 1, 2008 and one contract expired July 1, 2008. These contracts cover an aggregate of approximately 900 employees at the Escanaba mill and are currently under renegotiation.
We have not experienced any significant work stoppages or employee-related problems that had a material effect on our operations over the last five years. We consider our employee relations to be good. Our Port Hawkesbury, Nova Scotia, mill was closed from December 2005 until October 2006, before our ownership of the mill, due to a labor dispute. We expect the size of our combined salaried and hourly labor force will continue to decline as a result of our announced restructuring and closure plans as we complete our integration of the two businesses.
Environmental and Other Governmental Regulations
Our operations are subject to federal, state, provincial and local environmental laws and regulations in the United States and Canada, such as the Federal Water Pollution Control Act of 1972, the Federal Clean Air Act, the Federal Resource Conservation and Recovery Act, and the Comprehensive Environmental Response, Compensation and Liability Act of 1980, as amended, or
90
Table of Contents
CERCLA. Among the activities subject to environmental regulation are the emissions of air pollutants; discharges of wastewater and stormwater; generation, use, storage, treatment and disposal of, or exposure to, materials and waste; remediation of soil, surface water and ground water contamination; and liability for damages to natural resources. In addition, we are required to obtain and maintain environmental permits and approvals in connection with our operations. Many environmental laws and regulations provide for substantial fines or penalties and criminal sanctions for failure to comply with orders and directives requiring that certain measures or actions be taken to address environmental issues. See “—Legal Proceedings.”
Certain of these environmental laws, such as CERCLA and analogous state and foreign laws, provide for strict liability, and under certain circumstances joint and several liability, for investigation and remediation of releases of hazardous substances into the environment, including soil and groundwater. These laws may apply to properties presently or formerly owned or operated by or presently or formerly under the charge, management or control of an entity or its predecessors, as well as to conditions at properties at which wastes attributable to an entity or its predecessors were disposed. Under these environmental laws, a current or previous owner or operator of real property or a party formerly or previously in charge, management or control of real property, and parties that generate or transport hazardous substances that are disposed of at real property, may be held liable for the cost to investigate or clean up that real property and for related damages to natural resources.
We handle and dispose of wastes arising from our mill operations, including by the operation of a number of landfills. We may be subject to liability, including liability for investigation and cleanup costs, if contamination is discovered at one of these mills, landfills, or at another location where we have disposed of, or arranged for the disposal of, waste. While we believe, based upon current information, that we are in substantial compliance with applicable environmental laws and regulations, we could be subject to potentially significant fines or penalties for failing to comply with environmental laws and regulations. Each of MeadWestvaco and SEO have separately agreed to indemnify us for certain environmental liabilities related to the properties acquired from them, subject to certain limitations. We agreed to indemnify the purchaser of our carbonless paper business for certain environmental liabilities, subject to certain limitations.
Compliance with environmental laws and regulations is a significant factor in our business. We have made, and will continue to make, significant expenditures to comply with these requirements. We incurred capital expenditures of $18 million in 2007, and we expect to incur capital expenditures of approximately $2 million in each of 2008 and 2009 in order to maintain compliance with applicable environmental laws and regulations and to meet new regulatory requirements. We anticipate that environmental compliance will continue to require significant capital expenditures over time as environmental laws or regulations, or interpretation thereof, change or the nature of our operations require us to make significant additional capital expenditures.
Our operations also are subject to a variety of worker safety laws in the United States and Canada. The Occupational Safety and Health Act, U.S. Department of Labor Occupational Safety and Health Administration regulations and analogous state and provincial laws and regulations mandate general requirements for safe workplaces for all employees. We believe that we are operating in material compliance with applicable employee health and safety laws.
Properties and Facilities
Our headquarters is located in Miamisburg, Ohio. We own the mills where we produce our paper products and the converting facilities where we convert rolls of paper to sheets. We believe that we have sufficient capacity at our manufacturing facilities to meet our production needs for the foreseeable future. In addition, we lease space or have third-party arrangements to utilize space in approximately
91
Table of Contents
55 distribution facilities. All of our owned facilities (except those owned by Consolidated Water Power Company, or “CWPCo”) are pledged as collateral under our various debt agreements. The following table lists the purpose of each of our significant facilities, as well as whether the facility is owned or leased:
Location | Purpose | Owned or Leased/Expiration | ||
Biron, Wisconsin | Paper Mill | Owned | ||
Chillicothe, Ohio | Warehouse & Converting | Owned | ||
Duluth, Minnesota | Paper Mill | Owned | ||
Escanaba, Michigan | Paper Mill | Owned | ||
Kimberly, Wisconsin | Paper Mill | Owned | ||
Luke, Maryland | Paper Mill | Owned | ||
Luke, Maryland | Warehouse & Converting | Owned | ||
Miamisburg, Ohio | Corporate Headquarters | Leased/2017 | ||
Port Hawkesbury, Nova Scotia | Paper Mill | Owned | ||
Rumford, Maine | Paper Mill | Owned | ||
Stevens Point, Wisconsin | Paper Mill | Owned | ||
Whiting, Wisconsin | Paper Mill | Owned | ||
Wickliffe, Kentucky | Paper Mill | Owned | ||
Wisconsin Rapids, Wisconsin | Paper Mill, Warehouse & Converting | Owned |
On January 16, 2008, we announced restructuring plans that include the shutdown of the Chillicothe, Ohio converting facility by the end of November 2008. In addition, we will close our Kimberly, Wisconsin mill at the end of August 2008. For a further discussion of these plans, see “Management’s Discussion and Analysis of Financial Condition and Results of Operations—Overview—Anticipated Synergies of the Acquisition and Integration of the Business.”
Legal Proceedings
In 1998 and 1999, the EPA issued Notices of Violation, or NOVs, to eight paper industry facilities, including our Luke, Maryland mill, alleging, among other things, violation of certain Prevention of Significant Deterioration, or PSD, regulations under the Clean Air Act. In 2000, an enforcement action was brought in Federal District Court in Maryland against the predecessor of MeadWestvaco, asserting that the predecessor did not obtain PSD permits or install required pollution controls in connection with capital projects carried out in the 1980s at the Luke mill. The complaint sought penalties of up to $27,500 per day for each claimed violation together with the installation of additional air pollution control equipment. During 2001, the court granted MeadWestvaco’s motion for partial dismissal and dismissed the EPA’s claims for civil penalties under the major counts of the complaint. In October 2005, the parties made their closing arguments on Phase I of this case, and each has filed for summary judgment in its favor. The court has not ruled on these motions. MeadWestvaco has agreed to indemnify us for certain liabilities under these claims. MeadWestvaco will not indemnify us for litigation losses arising from the design, installation or construction of a scrubber-compliant baghouse, to the extent these costs constitute capital spending under the agreement pursuant to which we acquired the printing and papers business from MeadWestvaco. In addition, MeadWestvaco will not indemnify us for litigation losses resulting from any increased operation costs at our Luke mill unless those costs exceed $2 million annually within five years after resolution of the claims. If we incur liability for this lawsuit and we are unable to obtain indemnification from MeadWestvaco, we may incur substantial costs, which may include costs in connection with the penalties and the installation of additional pollution control equipment.
In March 2000, the EPA issued a NOV and a Finding of Violation, or FOV, to SENA’s Wisconsin Rapids pulp mill alleging violation of the PSD regulations and the New Source Performance Standard,
92
Table of Contents
or NSPS, requirements under the Clean Air Act arising from projects implemented at the mill between 1983 and 1991. The EPA is seeking the installation of additional air pollution control equipment and an $8 million penalty. The matter has been referred to the Department of Justice. In July 2002, the EPA issued a NOV and a FOV to SENA’s Niagara mill alleging PSD and NSPS violations relating to projects implemented at the mill from 1995 to 1997. SENA is defending these NOVs and FOVs. SEO has agreed to indemnify us for 75% of certain expenses relating to these matters, including losses arising from the design and installation of air pollution control equipment and for 75% of air compliance penalties, provided the expenses and penalties are incurred within a five-year period following closing of the Acquisition and that SEO’s obligations with respect to the boiler Maximum Achievable Control Technology rule is limited to 50% of the initial $35 million of certain compliance costs. If we incur liability for these actions and we are unable to obtain indemnification from SEO, we may incur substantial costs in connection with penalties and the installation of additional pollution control equipment.
In April 2008, NewPage Wisconsin System Inc. (formerly Stora Enso North America Corp. and the successor by merger to Consolidated Papers, Inc.), along with several other defendants, was named as a defendant inAppleton Papers, Inc., et al. v. George A. Whiting Paper Co., et al (08-CV-00016-WCG) in the United States District Court for the Eastern District of Wisconsin, Green Bay Division. The plaintiffs are seeking to allocate among the defendants the cleanup costs and natural resource damages associated with the remediation of PCB contamination in the Lower Fox River and to require the defendants and the other responsible parties to pay for the upcoming remedial work and natural resource damages. The complaint does not specify our alleged allocable share of these costs and damages. We do not believe that we are responsible for any PCB contamination in the Lower Fox River. We have submitted the claim to SEO, which is required to defend and indemnify us for 75% of any environmental liability associated with the Lower Fox River, provided the liabilities are incurred within the five-year period following the closing of the Acquisition.
A number of plaintiffs have filed purported class actions on behalf of direct and indirect purchasers of publication paper in various U.S. federal and state courts. These class actions allege that certain manufacturers of publication paper, including SENA, participated in a price-fixing conspiracy from 1993 to present. The cases filed in federal court assert a violation of the federal antitrust laws, while the cases filed in the state court allege violations of state antitrust and consumer protection statutes. These lawsuits seek treble damages, injunctive relief and other costs associated with the litigation but do not specify a dollar amount. The federal cases were consolidated for pre-trial purposes in December 2004 and all of the state court cases except one were removed to federal court and consolidated asIn Re Publication Paper Antitrust LitigationCase No. 3-04-MD-1631 (SRU) in the U.S. Federal Court for the District of Connecticut. Pre-trial proceedings have begun in the consolidated federal case. The lone state court case,The Harman Press, et al. v. International Paper Co., et al., Case No. CGC-04-432167, filed in June 2004, which is pending in the Superior Court of California, County of San Francisco, has been stayed pending the outcome of the consolidated federal cases, although discovery in the state case is being coordinated with discovery in the federal cases. Theplaintiffs are seeking treble damages under the California antitrust statute, restitution, interest and attorney’s fees. The complaint does not specify a dollar amount of damages. SEO has agreed to defend and indemnify us for all liabilities under these claims.
We are involved in various other litigation and administrative proceedings that arise in the ordinary course of business. Although the ultimate outcome of these matters cannot be predicted with certainty, we do not believe that the currently expected outcome of any matter, lawsuit or claim that is pending or threatened, or all of them combined, will have a material adverse effect on our financial condition, results of operations or liquidity.
93
Table of Contents
The following are the names, ages and a brief account of the business experience for at least the last five years of our directors and executive officers as of the date of this prospectus.
Name | Age | Position | ||
Mark A. Suwyn | 66 | Chairman of the Board and Chief Executive Officer | ||
Robert M. Armstrong | 69 | Director | ||
David J. Prystash | 46 | Director | ||
Charles E. Long | 68 | Director | ||
James R. Renna | 37 | Director | ||
John W. Sheridan | 53 | Director | ||
Lenard B. Tessler | 56 | Director | ||
Michael S. Williams | 59 | Director | ||
Alexander M. Wolf | 34 | Director | ||
George J. Zahringer, III | 55 | Director | ||
Jason W. Bixby | 37 | Senior Vice President and Chief Financial Officer | ||
Daniel A. Clark | 49 | Chief Information Officer and Senior Vice President, Business Excellence | ||
Douglas K. Cooper | 61 | Vice President, General Counsel and Secretary | ||
Michael T. Edicola | 50 | Vice President, Human Resources | ||
George F. Martin | 51 | Senior Vice President, Operations | ||
Michael L. Marziale | 51 | Senior Vice President, Marketing Strategy and General Management | ||
Barry R. Nelson | 43 | Senior Vice President, Sales | ||
Richard D. Willett, Jr. | 38 | President and Chief Operating Officer |
Mark A. Suwyn has been our chief executive officer since April 2006 and acted in that capacity on an interim basis from March 2006 to April 2006. Mr. Suwyn has been the chairman of our board of directors since October 2007 and has been chairman of the boards of directors of NewPage Holding and NewPage Corporation since May 2005. From November 2004 to May 2005, Mr. Suwyn served as a consultant for Cerberus Capital Management through Marsuw, LLP, a company for which he was the founder and president. Mr. Suwyn was chairman and chief executive officer of Louisiana-Pacific Corporation from 1996 until October 2004. Mr. Suwyn serves as a board member of Ballard Power Systems Inc. and BlueLinx Holdings, Inc.
Robert M. Armstrong has been a member of our board of directors since October 2007 and a member of the board of directors of NewPage Holding and NewPage Corporation since April 2006. Mr. Armstrong serves on the board and audit committee of the Quantitative Group of Mutual Funds. Mr. Armstrong has been a private consultant since 1998.
Charles E. Long has been a member of our board of directors since December 2007 and a member of the board of directors of NewPage Holding and NewPage Corporation since March 2008. Mr. Long is a former vice chairman of Citicorp and its principal subsidiary, Citibank. Mr. Long held various positions during his career with Citicorp, which began in 1972 and from which he retired in 1998. Mr. Long is also a director of The Drummond Company and Introgen Therapeutics, Inc.
David J. Prystash has been a member of our board of directors since October 2007 and a member of the board of directors of NewPage Holding and NewPage Corporation since April 2006. Mr. Prystash has been controller, global product development at Ford Motor Company from January 2005 to the present. From June 2003 to December 2004, he was executive director, vehicle remarketing at Ford. From July 2001 to May 2003, he served as controller, North American product programs at Ford.
94
Table of Contents
James R. Renna has been a member of our board of directors and the board of directors of NewPage Holding and NewPage Corporation since April 2008. Mr. Renna has been an financial executive with Cerberus Operations Inc., since May 2006. Prior to that he was a corporate vice president of MCI Communications from December 2002 to March 2006.
John W. Sheridan has been a member of our board of directors since October 2007 and a member of the board of directors of NewPage Holding and NewPage Corporation since August 2005. In February 2006, Mr. Sheridan was appointed president and chief executive officer of Ballard Power Systems, Inc., a fuel cell manufacturer, after serving as interim chief executive officer since October 2005. Mr. Sheridan has served on the board of Ballard Power Systems, Inc. since May 2001, serving as chairman of the board from June 2004 until February 2006. Mr. Sheridan served as the president and chief operating officer of Bell Canada from 2002 to November 2003.
Lenard B. Tessler has been a member of our board of directors since October 2007 and a member of the board of directors of NewPage Holding and NewPage Corporation since May 2005. Mr. Tessler has been a managing director of Cerberus Capital Management, L.P. since May 2001 to the present. Mr. Tessler serves as a member of the board of directors of Chrysler LLC, LNR Property Corp. and GMAC LLC.
Michael S. Williams has been a member of our board of directors since October 2007 and a member of the board of directors of NewPage Holding and NewPage Corporation since August 2005. Mr. Williams has been chairman and chief executive officer of IAP Worldwide Services Inc. since January 2008. Prior to that, he was an employee of Cerberus Capital Operations Inc. from January 2007 to January 2008. Prior to that he was president of Madoc LLC and served as a consultant for Cerberus Capital Management, L.P. since October 2004. Mr. Williams was the president and chief executive officer of Netco Government Services Inc., an enterprise network integration solution provider, from February 2002 through October 2004.
Alexander M. Wolf has been a member of our board of directors since October 2007 and a member of the board of directors of NewPage Holding and NewPage Corporation since May 2005. Mr. Wolf has been a managing director of Cerberus Capital Management, L.P. since March 2006, a senior vice president from April 2004 through February 2006 and a vice president from December 2001 through March 2004.
George J. Zahringer, IIIhas been a member of our board of directors since October 2007 and a member of the board of directors of NewPage Holding and NewPage Corporation since May 2007. Since June 2008, Mr. Zahringer has been a managing director and client advisor at Deutsche Bank Securities Inc. Prior to that, Mr. Zahringer was a senior managing director of Bear Stearns & Co., Inc. and served in its Private Client Services Division since 1979. Mr. Zahringer serves as a member of the board of directors of Remington Arms Company, Inc. and Chrysler LLC.
Jason W. Bixbyhas been our senior vice president and chief financial officer since December 2007 and prior to that was our vice president and chief financial officer since December 2006. Prior to that, Mr. Bixby was an operations executive with Cerberus Capital Management, LLC from March 2004 to December 2006. In this role, he provided operational, financial, turnaround, acquisition and due diligence services to Cerberus and certain of its portfolio companies. From July 2002 through March 2004, Mr. Bixby was a finance director for Medtronic, Inc.
Daniel A. Clark has been our senior vice president, business excellence and chief information officer since December 2007. Prior to that, Mr. Clark was our chief information officer and vice president of order management since May 2005. Prior to that, Mr. Clark was employed by MeadWestvaco Papers Group as vice president of order management from January 2002 to May 2005.
95
Table of Contents
Douglas K. Cooper has been our vice president, general counsel and secretary since November 2005. Prior to that, Mr. Cooper was counsel with Arent Fox PLLC, a law firm, from September 2004 through October 2005. Mr. Cooper was in private law practice from September 2003 to September 2004. From September 2001 to September 2003, Mr. Cooper was senior vice president, general counsel and secretary for GDX Automotive, an automotive component supplier.
Michael T. Edicolahas been our vice president, human resources since November 2007. Prior to that, Mr. Edicola served as vice president, human resources for Baxter International Corporation from July 2004 through December 2006. From September 1999 to April 2004, he served as vice president, human resources for Zebra Technologies Corporation.
George F. Martinhas been our senior vice president, operations since December 2007. Prior to that Mr. Martin was our vice president, operations since April 2006. Prior to that, Mr. Martin served as our vice president, coated operations from May 2005 to March 2006. From February 2003 through April 2005, Mr. Martin was vice president of operations at the Escanaba mill of MeadWestvaco’s printing and writing papers group. From January 2002 to February 2003, he was director of integration for MeadWestvaco’s Papers Group.
Michael L. Marziale has been our senior vice president, marketing strategy and general management since December 2007. Prior to that, Mr. Marziale was our vice president of business development and chief technology officer from August 2006 to December 2007. Mr. Marziale was our vice president and general manager, carbonless systems and chief technology officer from May 2005 through July 2006. Prior to that, he was general manager, carbonless systems of MeadWestvaco’s Papers Group since September 2002.
Barry R. Nelsonhas been our senior vice president, sales since January 2008. Prior to that, Mr. Nelson was our vice president, printing sales since May 2005. Prior to that, Mr. Nelson was vice president, printing sales of MeadWestvaco Papers Group from August 2002 to May 2005.
Richard D. Willett, Jr. has been our president and chief operating officer since April 2006. Prior to that, Mr. Willett was executive vice president and chief operating officer of Teleglobe International Holdings Ltd. since January 2005. Prior to that, he was chief financial officer and executive vice president since June 2004 and chief financial officer and vice president of operations of Teleglobe Canada ULC and Teleglobe America Inc. since June 2003. Mr. Willett served as a consultant to Cerberus with respect to the acquisition of the core businesses of Teleglobe Inc. and its subsidiaries by TLGB Acquisition, an affiliate of Cerberus, from October 2002 until May 2003.
96
Table of Contents
Compensation Discussion and Analysis
General Philosophy
The compensation committee has responsibility for establishing, monitoring and implementing our compensation philosophy. We compensate our executive officers named in the Summary Compensation Table, who we refer to as the “Executives,” through a combination of base salary, bonus plan awards, equity ownership, stock options and various other benefits, all designed to be competitive with comparable employers and to align each Executive’s compensation with the long-term interests of our stockholders. Base salary and bonus plan awards are determined and paid annually and are designed to reward current performance. Through various vesting and lock-up restrictions, equity investments and stock options are designed to reward longer-term performance. We may also use discretionary executive bonus awards for special situations. Our process for setting annual Executive compensation consists of the compensation committee establishing overall compensation targets for each Executive and allocating that compensation between base salary and annual bonus compensation. Executive bonus compensation is designed as “at-risk” pay to be earned based on the achievement of company-wide performance objectives, personal performance objectives, the Executive’s demonstrated adherence to our core values and other factors deemed relevant by the compensation committee. The same compensation policies apply to all Executives. Any differences in the level of compensation are as a result of the Executive’s position in the company, individual performance and external market considerations for the position.
Targeted Overall Cash Compensation
Under our compensation structure, the mix of base salary and annual bonus compensation for each Executive varies depending upon his position with the company. The estimated allocation between base salary and bonus award at target levels is as follows:
| Base Salary | Target Bonus Award | |||
Chairman & Chief Executive Officer and President & Chief Operating Officer | 50% | 50% | ||
Other Executives | 60 – 70% | 30 – 40% |
In allocating cash compensation between these elements, we believe that a significant portion of the compensation of our Executives—the level of management having the greatest ability to influence our performance—should be performance-based and therefore “at risk.” In making this allocation, we relied in part upon the advice of Frederick W. Cook & Co, which we refer to as “Cook”, and its survey findings and analysis, which validate this approach.
Compensation-Setting Process
The compensation committee approves all compensation and awards to Executives, as well as the rest of our senior leadership team, and has retained Cook as its compensation advisor. Generally, the compensation committee reviews data from Cook regarding compensation for our chief executive officer, his performance and then-current compensation and, following discussions with him, establishes his compensation levels. For the remaining Executives, our chief executive officer makes recommendations to the compensation committee based on individual performance during the prior year and competitive data from surveys, from available public information and from Cook.
Each year Cook prepares a study for the compensation committee that compares the compensation of individual Executives to the compensation of similar positions at the following peer group companies, or Peer Group, in the forest products industry having market capitalizations comparable to what we believe our market capitalization would have been as a public company at the beginning of that year, as presented in proxy statements filed during the prior year: Bemis Company,
97
Table of Contents
Inc., Bowater Incorporated, Buckeye Technologies, Inc., Caraustar Industries, Inc., Graphic Packaging Corporation, Greif, Inc., Neenah Paper, Inc., Packaging Corporation of America, P. H. Glatfelter Company, Potlatch Corporation, Rock-Tenn Company, Sonoco Products Company and Wausau Paper Corp. For 2007, the Cook study also compared the compensation of individual Executives to 2006 national survey data gathered by three independent compensation consultants; Hewitt, the Stanton Group and Towers Perrin. The Stanton Group survey, called the Forest Products Industry Compensation Association Survey, is specific to the forest products industry and surveyed 54 participating companies. The Hewitt and Towers Perrin surveys each covered in excess of one hundred companies participating across all industries. The compensation committee did not review the individual surveys used by Cook to prepare its study nor did it know the names of the companies included in the surveys. The Cook study was used by management and the compensation committee to help determine appropriate compensation levels for all Executives for 2007. The compensation committee reviews total, short-term and long-term compensation annually with a view to aligning it with the 50th percentile of the selected Peer Group.
For 2007 each Executive was reviewed against his contribution to key initiatives involving our business as well as overall company performance. Key initiatives that arose during the year for all Executives included the following:
| Ÿ | completing the Acquisition and pursuing multiple acquisition and divestiture opportunities; |
| Ÿ | accelerating and achieving productivity initiatives and associated cost savings; |
| Ÿ | filing and pursuing anti-dumping claims against foreign imports; and |
| Ÿ | installing and refining financial reporting and forecasting processes and systems. |
Each Executive was also reviewed for performance against company values, including safety, integrity, results, teamwork, communication, judgment and change. No specific dollar amount or percentage of compensation was ascribed to any of the performance metrics described above or to any of the individual achievements of the Executives discussed below.
MARK A. SUWYN. The compensation committee discussed and assessed the performance of the chief executive officer. The committee noted the successful negotiation and completion of the Acquisition, which more than doubled our size and established a framework to reduce costs and achieve scale. The compensation committee also considered the improvement to EBITDA and debt reduction year over year despite weak markets in the first half of 2007. The compensation committee felt that achieving these results while attending to the Acquisition was a significant accomplishment. The committee also noted improvements in financial reporting. Finally, the committee noted Mr. Suwyn’s leadership in initiating actions with the Department of Commerce to impose duties on importers of coated paper who received illegal subsidies and sold their products in the United States at less than fair value.
Mr. Suwyn led the assessment with the compensation committee of each other Executive’s individual performance against company opportunities, our overall performance, and the specific responsibilities of the Executive’s position. The other Executives did not play a role in the determination of their own compensation, other than discussing with the chief executive officer their individual performance.
RICHARD D. WILLETT, JR. Mr. Willett played an active and important role in the Acquisition analysis, negotiations, and preparations for closing and integration in the fourth quarter of 2007. He also led the creation and implementation of our Lean Six Sigma effort that has taken significant costs out of our operations. Mill operations, which report to Mr. Willett, ran very well during the year, with capital funds employed efficiently in projects completed on time and under budget. Furthermore,
98
Table of Contents
Mr. Willett played a key role in developing and communicating our vision, values and operating model to our employees throughout the year.
JASON W. BIXBY. Mr. Bixby led our efforts to significantly enhance our ability to forecast key business elements, complete timely financial closings, and achieve compliance with Sarbanes-Oxley reporting requirements. Under Mr. Bixby’s leadership, the finance organization also played a key role in due diligence and completion of the Acquisition. All of these tasks were accomplished without adding significant staff or costs. Mr. Bixby was also a key participant in our bank and bond financing, which enabled us to complete the Acquisition, including responsibility for communicating financial information to the investment community. Mr. Bixby also enhanced the talent that reports to him through effective recruiting and structural changes in the finance organization.
MICHAEL L. MARZIALE. Mr. Marziale led the group that provided strategy development, due diligence, valuation analysis, business perspective and analysis on the Acquisition and other potential acquisition and divestiture opportunities. These activities required substantial effort and time commitment in excess of normal expectations. While leading these activities, Mr. Marziale also created and implemented a new business management structure that includes general managers responsible for development of discrete product categories. Mr. Marziale was also responsible for leading our research and development efforts and led our generation of competitive information and insight, which we use throughout our company.
GEORGE F. MARTIN. Mr. Martin was responsible for all paper mills, purchasing and engineering. The operations under Mr. Martin’s supervision ran well and exceeded 2006 performance and most standards set for 2007. Mr. Martin played a key role in implementing Lean Six Sigma programs across all operations. These efforts significantly reduced our costs in 2007, with over 1,000 employees trained in these initiatives. Labor relations at the mills under Mr. Martin also were positive and showed improvement throughout the year. Furthermore, Mr. Martin initiated measures to add talented personnel in key positions in his group.
JAMES C. TYRONE. Mr. Tyrone led the development and implementation of a new sales compensation plan for our sales organization. This plan has significantly improved the effectiveness of our sales organization. Mr. Tyrone’s group exceeded the market in terms of margin (volume and price). Mr. Tyrone also helped us to maintain strong relationships with our key customers in a challenging and changing market.
Base Salaries
We have established an annual base salary for each Executive that is designed to be competitive by position relative to the marketplace. Base salary compensates each Executive for the primary responsibilities of his position. Base salary is set at levels that we believe enable us to attract and retain talent. Pursuant to each Executive’s employment agreement, his base salary may be increased periodically but may not be decreased. The compensation committee reviews each element of compensation separately but also reviews the effect of any change in base salary on the target percentages relative to total annual compensation. Base salary differences among individual Executives reflect their differing roles in the company and the market pay for those roles.
Base salaries for Messrs. Suwyn, Martin, Marziale, Tyrone and Willett, were reviewed and increased effective February 1, 2007 by 3.3%, 13.6%, 1.9%, 2.8% and 3.3%, respectively. Increases were based on the compensation committee’s evaluation of each Executive’s individual performance in 2006 and his position relative to comparable executives in Peer Group companies. Base levels were set taking into account our approach to the mix between base salary and bonus awards, as outlined in “—Targeted Overall Cash Compensation” above. Mr. Bixby joined our company in December 2006 and did not receive a base salary increase in 2007.
99
Table of Contents
Annual Bonus Compensation
Annual bonus compensation for each Executive is established by the compensation committee in its sole discretion. Our practice is to pay cash bonus awards based upon the achievement of our annual financial performance goals, our strategic performance initiatives and individual performance objectives. Each Executive’s employment agreement designates an individual bonus target for that Executive, expressed as a percentage of base salary. The compensation committee reviews these bonus targets annually, and may increase a bonus target in its discretion as part of its overall evaluation of compensation. Pursuant to each Executive’s employment agreement, his bonus target may be increased periodically but may not be decreased.
For the 2007 plan year, the compensation committee approved changes to our bonus program, which now consists of a profit sharing plan and a performance excellence plan, discussed below. This approach is intended to afford broad participation in rewards through the profit sharing plan based on achievement of our financial performance goals, while making additional bonus compensation available through the performance excellence plan to a more limited group of senior managers who can help determine and are responsible for implementing our overall business strategy.
The profit sharing plan includes all of the Executives and all other exempt salaried employees. Each year the Compensation Committee establishes minimum, target and maximum percentages of salary to be awarded if the compensation committee determines that our financial performance objectives for the year are met, along with any other criteria established at the discretion of the compensation committee. These financial performance objectives consist of EBITDA, Debt Reduction and Return on Invested Capital, or “ROIC”. We define “EBITDA” for these purposes as net earnings plus interest, taxes, depreciation and amortization, as adjusted for non-cash items and other items that are allowed at the discretion of the compensation committee. We define “Debt Reduction” as the change in our total indebtedness minus available cash balances. We define “ROIC” as our return divided by our invested capital, where “return” is our EBITDA less depreciation and amortization, adjusted for taxes at an assumed tax rate, and “invested capital” is our total assets less cash, current accounts payable and accrued expenses. The compensation committee selected these objectives as guidelines because they were the primary financial metrics by which our Executives were evaluated by our principal stockholder. For 2007, EBITDA was weighted at 50%, Debt Reduction was weighted at 30% and ROIC was weighted at 20%. The weightings were based on their relative importance to our company.
Each objective is measured separately against a threshold, target and maximum goal. For 2007, these goals were as follows:
| Threshold | Target | Maximum | ||||||||||
EBITDA (dollars in millions) | $ | 305 | $ | 340 | $ | 370 | ||||||
Debt Reduction (dollars in millions) | $ | 100 | $ | 106 | $ | 115 | ||||||
ROIC | 6.5 | % | 7.8 | % | 8.8 | % | ||||||
The actual results are used by the compensation committee as a general guideline to determine the funding for the plan. If the compensation committee determines that the threshold goals are met or exceeded, funding will generally range from 50% to 150% of target for each objective, depending on results achieved. Generally, no funding will occur for any objective as to which the threshold goal has not been met. After consideration of these factors, the compensation committee, at its discretion, determines the funding level to be used for the year. All participants receive the same percentage of their base salary in any distribution under the plan. Applying these guidelines, the compensation committee evaluated our overall 2007 performance and approved funding at 80% of the target funding level. In 2007, the compensation committee awarded a bonus of 5.6% of base salary.
100
Table of Contents
Each of the Executives and a select group of our salaried employees participated in the performance excellence plan in 2007. The compensation committee first determines the aggregate amount available under the plan. The committee then selects from the group of eligible participants those individuals who will receive a bonus. Finally, the committee determines the amount of the bonus award for each of the individuals selected.
The targeted annual bonus pool under this plan is based on the aggregate targets for the plan participants as a group, determined by reference to the participants’ base compensation. For 2007, the target funding level was $6 million, which represented 17% of the base salaries of employees eligible to participate in the plan. One half of the annual bonus pool is funded without regard to the financial performance objectives. The other half of funding is then determined by the compensation committee in its discretion based on the achievement of the same financial objectives as under the profit sharing plan and using the same weighting and the same threshold, target and maximum levels as in that plan. Applying these guidelines, the compensation committee evaluated our overall 2007 performance and approved funding under our performance excellence plan at 90% of the target funding level.
The compensation committee in its discretion, after consulting with the chief executive officer, selects Executives who will receive bonus awards and individual bonus awards for those Executives selected, based on the Executive’s individual performance goals and his adherence to our core values described above. There is no minimum or maximum limit on any individual award. The compensation committee evaluated the performance of each of our Executives, determined individual bonus award for our chief executive officer and approved the recommendations of our chief executive officer regarding bonus awards for our other Executives, in each case based on individual performance and adherence to core values, consistent with our general compensation philosophy. Additional consideration was given to the successful completion of the Acquisition as well as other strategic initiatives during the year.
For 2008, the compensation committee established financial performance objectives consisting of EBITDA, Debt Reduction and the achievement of annualized synergies as a result of the Acquisition. We are experiencing higher input costs than expected resulting from higher energy and chemicals costs and lower demand due to a weaker economy and economic outlook. Therefore, we believe that it will be a challenge to achieve the target financial goals in 2008 for funding of both the profit sharing and performance excellence plans at their target funding levels. The maximum financial goals were designed to be difficult to achieve, and we believe that they will be.
For 2006, Mr. Marziale received a bonus upon completion of the sale of our former carbonless business. The bonus was paid according to the terms of an employment agreement negotiated with Mr. Marziale in May 2005.
Equity Ownership
We believe that it is a customary and competitive practice to include an equity-based element of compensation in the overall compensation package extended to executives in similarly-situated companies. Equity ownership is intended to motivate Executives to make stronger business decisions, improve financial performance, focus on both short-term and long-term objectives and encourage behaviors that protect and enhance the corporate interest.
Each Executive originally acquired equity interests in Maple Timber. As part of the equity reorganization on December 21, 2007, these interests became fully vested and were converted to shares of our common stock. These equity grants were made in May 2005, upon the founding of our company, for Messrs. Suwyn, Marziale and Tyrone. Equity grants for Messrs. Willett and Bixby were
101
Table of Contents
made when they joined us in April and December 2006, respectively. Each of these grants was converted into our common stock at the closing of the Acquisition. No additional equity grants (other than options as described below) have been made to the Executives.
In addition, on December 21, 2007, the compensation committee granted non-qualified stock options to each Executive under the NewPage Group Incentive Plan to reflect their increased responsibilities operating a much larger organization following the Acquisition. The amount of each individual stock option award was determined by the compensation committee based on a number of factors, including the expected contribution of each Executive to the future success of our company, the other compensation, including options, being earned and held by that Executive and the amount of our common stock owned by that Executive. We may also grant additional annual stock options or performance shares to Executives and other senior managers in the future pursuant to the NewPage Group Incentive Plan, subject to prior review and approval by the compensation committee.
Further information on equity ownership can be found in “—Equity Awards” and “Principal and selling stockholders.”
Severance and Change in Control Benefits
We may terminate an Executive’s employment without “cause” at any time, and an Executive may resign for “good reason,” each as defined in the Executive’s employment agreement. We believe that in these situations we should provide reasonable severance benefits to assist the Executive with this transition, recognizing that it may take time for an Executive to find comparable employment elsewhere.
Additionally, recognizing that Executives and other employees are responsible for our success, we believe it is important to protect them in the event of a change in control. A “change in control” refers generally to a sale or disposition of all or substantially all of our equity, business or assets to an unrelated third party. This approach also helps align the interests of our Executives with the interests of our stockholders by providing additional compensation for completing a change in control transaction that may be in the best interests of our stockholders but might otherwise be detrimental to the Executive.
Accordingly, each Executive’s employment agreement provides for severance and change in control benefits in these situations. The amount and type of severance and change in control benefits available to our Executives is described in “Employment Agreements—Termination Benefits Summary.”
Other Benefits
Our Executives participate in a tax-qualified defined contribution plan, which includes individual and employer matching contributions, as well as various health and welfare benefit plans, all on the same basis as other salaried employees. Our objective is to offer all salaried employees, including our Executives, a benefits package that is competitive within our industry and labor markets.
102
Table of Contents
Compensation Summary
The following table sets forth information concerning the compensation for our chief executive officer, our chief financial officer, and our other three most highly compensated executive officers at the end of 2007. Mr. Tyrone is included because he would have been one of our other three most highly compensated executive officers but for the fact that Mr. Tyrone was not serving as an executive officer at the end of 2007.
Summary Compensation Table
Name and Principal Position | Year | Salary(1) | Bonus(2) | Stock Awards(3)(4) | Option Awards(4) | Non-Equity Incentive Plan Compen- sation | All Other Compen- sation(5) | Total | |||||||||||||||
Mark A. Suwyn | 2007 | $ | 772,916 | $ | — | $ | 3,480,532 | $ | 82,352 | $ | 600,000 | $ | 82,504 | $ | 5,018,304 | ||||||||
Chief Executive Officer | 2006 | 537,500 | — | 240,216 | — | 223,000 | 205,724 | 1,206,440 | |||||||||||||||
Jason W. Bixby | 2007 | 300,000 | — | 406,699 | 79,204 | 300,000 | 47,270 | 1,133,173 | |||||||||||||||
Senior Vice President and Chief Financial Officer | 2006 | 11,905 | — | — | — | — | 476 | 12,381 | |||||||||||||||
Richard D. Willett, Jr. | 2007 | 463,750 | — | 1,886,926 | 196,849 | 800,000 | 40,061 | 3,387,586 | |||||||||||||||
President and Chief Operating Officer | 2006 | 322,500 | — | 1,095,620 | — | 135,000 | 39,612 | 1,592,732 | |||||||||||||||
Michael L. Marziale | 2007 | 241,618 | 50,000 | 812,792 | 22,667 | 400,000 | 52,512 | 1,579,589 | |||||||||||||||
Senior Vice President, Marketing, Strategy and General Management | 2006 | 233,960 | 237,420 | 56,050 | — | 68,000 | 25,546 | 620,976 | |||||||||||||||
George F. Martin | 2007 | 272,253 | — | 812,792 | 22,667 | 300,000 | 32,142 | 1,439,854 | |||||||||||||||
Senior Vice President, Operations | 2006 | 241,453 | — | 56,050 | — | 83,000 | 27,665 | 408,168 | |||||||||||||||
James C. Tyrone(6) | 2007 | 324,267 | — | 3,738,503 | — | 297,380 | 876,153 | 5,236,303 | |||||||||||||||
Former Senior Vice President, Sales and Marketing | 2006 | 315,683 | — | 92,083 | — | 80,000 | 38,685 | 526,451 | |||||||||||||||
| (1) | Represents base salary actually earned during the year. |
| (2) | For Mr. Marziale, the amount for 2007 represents a bonus paid for his efforts in connection with the acquisition of SENA and other strategic initiatives, and the amount for 2006 represents a bonus paid upon completion of the sale of our carbonless paper business. |
| (3) | Represents the amount of equity compensation expensed during the year in accordance with SFAS No. 123R. See also “—Equity Awards” for more information. |
| (4) | Represents the amount of equity compensation expensed during the year in accordance with SFAS No. 123R, based on the fair values of stock options granted under the NewPage Group Incentive Plan. See the notes to the financial statements for the assumptions used in the valuation of the options. Does not include performance-based options, see “—Equity Incentive Plan.” See also “—Equity Awards” for more information. |
| (5) | See the following table, which provides further details about All Other Compensation. |
| (6) | Mr. Tyrone’s employment with us terminated on January 2, 2008. |
103
Table of Contents
All Other Compensation
Name | Year | Company Contributions to Retirement Savings Plan | Relocation(1) | Severance(2) | Other(3) | Total All Other Compensation | |||||||||||
Mark A. Suwyn | 2007 | $ | 11,250 | $ | — | $ | — | $ | 71,254 | $ | 82,504 | ||||||
| 2006 | 8,800 | — | — | 196,924 | 205,724 | ||||||||||||
Jason W. Bixby | 2007 | 20,250 | 23,270 | — | 3,750 | 47,270 | |||||||||||
| 2006 | 476 | — | — | — | 476 | ||||||||||||
Richard D. Willett, Jr. | 2007 | 11,250 | 16,873 | — | 11,938 | 40,061 | |||||||||||
| 2006 | 8,800 | 26,023 | — | 4,789 | 39,612 | ||||||||||||
Michael L. Marziale | 2007 | 26,070 | 25,030 | — | 1,412 | 52,512 | |||||||||||
| 2006 | 23,759 | — | — | 1,787 | 25,546 | ||||||||||||
George F. Martin | 2007 | 28,125 | — | — | 4,017 | 32,142 | |||||||||||
| 2006 | 25,300 | — | — | 2,365 | 27,665 | ||||||||||||
James C. Tyrone | 2007 | 30,375 | — | 835,355 | 10,423 | 876,153 | |||||||||||
| 2006 | 28,022 | — | — | 10,663 | 38,685 | ||||||||||||
| (1) | Relocation expense includes tax gross-ups of $10,279, $7,472 and $7,150 for Mr. Bixby, Mr. Marziale and Mr. Willett in 2007 and $5,343 for Mr. Willett in 2006. |
| (2) | For Mr. Tyrone, “Severance” consists of cash severance of $765,123, accrued vacation of $37,500, continued welfare benefits for 24 months after termination of approximately $22,232, and one year of outplacement service of approximately $10,500. See “Employment Agreements—Severance Benefits for Former Executive Officer” for more information. |
| (3) | For all Executives, “Other” consists of cash compensation for contributions calculated under the tax-qualified defined contribution plan that would be in excess of allowable IRS contribution limits for the plan. For Mr. Suwyn, “Other” in 2007 also consists of (i) $43,858 paid to him in reimbursement of personal travel expenses to and from our Dayton headquarters and temporary living expenses in Dayton, as negotiated in conjunction with Mr. Suwyn’s acceptance of employment as our chief executive officer. “Other” for Mr. Suwyn in 2006 includes director’s fees of $141,667 paid to him for his service as chairman prior to his employment as chief executive officer. |
104
Table of Contents
Equity Awards
Grants Of Plan-Based Awards
Name | Grant Date | Estimated Possible Payments Under Non-Equity Incentive Plan Awards(1) | All Other Option Awards: Number of Securities of Underlying Options (#)(2) | Exercise or Base Price of Option Awards ($/sh)(2) | Grant Date Fair Value of Option Awards(3) | |||||||||||||||||
| Threshold | Target | Maximum | ||||||||||||||||||||
Mark A. Suwyn | 12/21/2007 | 364,146 | $ | 21.22 | $ | 4,471,497 | ||||||||||||||||
| $
| 27,125 — | (4)
| $
| 54,250 720,750 | (4) (5) | $
| 81,375 None | (4) (6) | ||||||||||||||
Jason W. Bixby | 12/21/2007 | 350,230 | 21.22 | 4,300,611 | ||||||||||||||||||
|
| 10,500 — | (4)
|
| 21,000 174,000 | (4) (5) |
| 31,500 None | (4) (6) | ||||||||||||||
Richard D. Willett, Jr. | 12/21/2007 | 870,430 | 21.22 | 10,688,365 | ||||||||||||||||||
|
| 16,275 — | (4)
|
| 32,550 432,450 | (4) (5) |
| 48,825 None | (4) (6) | ||||||||||||||
Michael D. Marziale | 12/21/2007 | 100,229 | 21.22 | 1,230,747 | ||||||||||||||||||
|
| 8,470 — | (4)
|
| 16,940 91,960 | (4) (5) |
| 25,410 None | (4) (6) | ||||||||||||||
George F. Martin | 12/21/2007 | 100,229 | 21.22 | 1,230,747 | ||||||||||||||||||
|
| 9,625 — | (4)
|
| 19,250 118,250 | (4) (5) |
| 28,875 None | (4) (6) | ||||||||||||||
James C. Tyrone | ||||||||||||||||||||||
|
| 11,375 — | (4)
|
| 22,750 188,500 | (4) (5) |
| 34,125 None | (4) (6) | ||||||||||||||
| (1) | The amounts shown represent the estimated possible payment at the time of grant. The actual payout was fixed and paid in 2008 and the actual amounts paid are included in the summary compensation table. |
| (2) | The number of shares of common stock (and the per share exercise price in respect thereof) underlying options does not give effect to the -for- stock split that we intend to effect prior to the closing of this offering. |
| (3) | The “grant date fair value” of the options was determined in accordance with SFAS No. 123R and will be recognized over the three-year vesting period. See the notes to the financial statements for information on the material terms of the awards and the assumptions used in determining the grant date fair value. |
| (4) | Amounts represent the estimated range of payout under the profit sharing plan. See “Compensation Discussion and Analysis—Annual Bonus Compensation” for more information about the plan. |
| (5) | Amounts represent the estimated range of payout under the performance excellence plan. See “Compensation Discussion and Analysis—Annual Bonus Compensation” for more information about the plan. |
| (6) | There is no limit on the maximum amount that could be awarded to any one Executive, subject to the aggregate amount approved under the plan for all participants. See “Compensation Discussion and Analysis—Annual Bonus Compensation” for more information about the plan. |
105
Table of Contents
Outstanding Equity Awards At Fiscal Year-End
Name | Number of Securities Underlying Unexercised Options (#) Unexercisable(1) | Option Exercise Price ($)(1) | Option Expiration Date | ||||
Mark A. Suwyn | 364,146 | $ | 21.22 | 12/21/2017 | |||
Jason W. Bixby | 350,230 | 21.22 | 12/21/2017 | ||||
Richard D. Willett, Jr. | 870,430 | 21.22 | 12/21/2017 | ||||
Michael D. Marziale | 100,229 | 21.22 | 12/21/2017 | ||||
George F. Martin | 100,229 | 21.22 | 12/21/2017 | ||||
| (1) | Represents options to acquire common stock that vest in three equal annual installments beginning on December 21, 2008. All of these options will vest upon consummation of this offering. The number of shares of common stock (and the per share exercise price in respect thereof) underlying options does not give effect to the -for- stock split that we intend to effect prior to the closing of this offering. |
Stock Vested
Name | Number of Shares Acquired on Vesting(1) | Value Realized on Vesting(2) | |||
Mark A. Suwyn | 470,521 | $ | 9,870,044 | ||
Jason W. Bixby | 76,239 | 1,599,265 | |||
Richard D. Willett, Jr. | 206,278 | 4,327,064 | |||
Michael D. Marziale | 109,877 | 2,304,881 | |||
George F. Martin | 109,877 | 2,304,881 | |||
James C. Tyrone(3) | 180,411 | 3,784,453 | |||
| (1) | All unvested interests in Maple Timber were immediately vested and converted to shares of our common stock as of December 21, 2007. The number of shares of common stock does not give effect to the -for- stock split that we intend to effect prior to the closing of this offering. The number of shares presented represents the equivalent number of shares of our common stock. |
| (2) | The value received on vesting was determined based on the estimated fair value of NewPage Group as of December 21, 2007. Each Executive has entered into a five-year lock-up agreement with us, subject to certain limited exceptions. |
| (3) | We repurchased all of Mr. Tyrone’s stock for $5.5 million on January 18, 2008. See “Employment Agreements—Severance Benefits for Former Executive Officer” for more information. |
Employment Agreements
Pursuant to Mr. Suwyn’s employment agreement, he began serving a three year term as our chairman and chief executive officer on April 13, 2006. His current annual base salary is $775,000 and bonus target is equal to 100% of his base salary, each subject to increase by the compensation committee from time to time. At any time on or after the first anniversary of the effective date of his employment agreement and prior to the end of the term, our board of directors may request that Mr. Suwyn retire as chief executive officer but remain as chairman of the board, in which case Mr. Suwyn will receive an annual consulting fee of $500,000. Under a prior consulting agreement with our principal stockholder, he received an annual fee of $500,000 as compensation for serving as our chairman prior to April 2006.
Each of Messrs. Bixby, Martin, Marziale and Willett is party to an employment agreement under which each is entitled to a minimum annual base salary and each is assigned a minimum bonus target, expressed as a percentage of base salary. Pursuant to his employment agreement, Mr. Bixby began
106
Table of Contents
serving a three-year term as our chief financial officer on December 15, 2006. His current annual base salary is $336,000. Pursuant to his employment agreement, Mr. Willett began serving a three-year term as our chief operating officer on April 13, 2006. His current annual base salary is $500,000. Messrs. Martin and Marziale’s employment agreements continue until terminated by us or the Executive and provide for annual base salaries currently at $296,000 and $288,000, respectively. For 2007, bonus targets for Messrs. Bixby, Martin, Marziale and Willett were 65%, 50%, 45% and 100%, respectively.
Severance Benefits
Severance benefits are specified in each Executive’s employment agreement. If we terminate an Executive’s employment without “cause” or if the Executive resigns for “good reason,” the Executive will continue to receive base salary and benefits to the date of termination and will receive the following additional benefits after executing, and not revoking, a general release:
| Ÿ | For Mr. Suwyn, a cash amount equal to one times his base salary and for Messrs. Bixby and Willett, a cash amount equal to two times their base salary. For Messrs. Martin and Marziale, a cash amount equal to (a) twice their base salary less the initial purchase price of their Maple Timber interests, which were converted to shares of our common stock, or (b) three times their base salary less the initial purchase price of their Maple Timber interests if the termination of employment occurs within 12 months after a change in control. In addition, for Messrs. Martin and Marziale, if at the time of termination the fair market value of our common stock they received in respect of their Maple Timber Interests is less than the initial purchase price they paid for the Maple Timber interests they will also receive a payment equal to that difference. |
| Ÿ | The pro rata portion of his annual bonus award for the year of termination. This would be paid at the time of termination based on (a) the bonus award from the prior year if the date of termination is prior to June 1, or (b) what his bonus award would have been had he not been terminated if the date of termination is on or after June 1. |
| Ÿ | Continuation of health and welfare benefits for 24 months after the termination date. |
| Ÿ | Payment for unused accrued vacation time for the year in which termination occurs. |
| Ÿ | Outplacement services for 12 months, except for Mr. Suwyn. |
As defined in the employment agreements, “cause” includes commission of a felony, willful and fraudulent conduct, dishonesty resulting in personal gain, and other serious misconduct, and “good reason” includes reduction of base salary or bonus target, required relocation farther than 50 miles and other significant adverse employer actions.
If an Executive’s termination is caused by death or disability, the Executive or his estate will receive the pro rata portion of his annual bonus award and payment of unused accrued vacation time. If an Executive termination is initiated by us for cause or by the Executive without good reason, the Executive will not be entitled to any severance payments other than salary and benefits accrued through the termination date.
If the board requests that Mr. Suwyn resign as our chief executive officer and remain as chairman of the board, Mr. Suwyn will be entitled to receive a prorated bonus award for the year of termination based on the number of days worked during that year, but not less than half of the annual bonus award amount.
Mr. Tyrone ceased serving as an executive officer in 2007 and his employment with us terminated on January 2, 2008. A summary of his compensation and severance arrangement is included in the Summary Compensation Table and under “—Severance Benefits for Former Executive Officer.”
107
Table of Contents
Non-Competition and Non-Solicitation Provisions
Each Executive is subject to certain non-competition and non-solicitation restrictions following termination of employment for any reason. For Messrs. Willett and Bixby these restrictions run for two years and for the remaining Executives these restrictions run for one year following termination.
Equity Ownership Implications upon Termination
If any of the Executives is terminated without cause or resigns for good reason (each as defined in his employment agreement), we or Cerberus must, upon request, purchase his vested common stock for fair market value. If any of the Executives is terminated with cause, we or Cerberus may, but are not required to, repurchase his vested common stock at fair market value.
108
Table of Contents
Termination Benefits Summary
Below is the summary of the estimated termination benefits that would have been paid to each current Executive as of December 31, 2007 in the various circumstances listed:
Termination Benefits
Name | Termination With Cause(1) | Termination Without Cause(2) | Death or Disability | Change In Control(3) | ||||||||
Mark A. Suwyn(4) | ||||||||||||
Cash severance(5) | $ | 59,615 | $ | 1,062,109 | $ | 834,615 | $ | 1,062,109 | ||||
Health and welfare benefits | — | 8,926 | — | 8,926 | ||||||||
Purchase of stock | — | 14,100,064 | — | 14,100,064 | ||||||||
Total | 59,615 | 15,171,099 | 834,615 | 15,171,099 | ||||||||
Jason W. Bixby | ||||||||||||
Cash severance(5) | 23,077 | 818,077 | 218,077 | 818,077 | ||||||||
Health and welfare benefits | — | 21,945 | — | 21,945 | ||||||||
Outplacement benefits | — | 10,500 | — | 10,500 | ||||||||
Purchase of stock | — | 1,599,265 | — | 1,599,265 | ||||||||
Total | 23,077 | 2,449,787 | 218,077 | 2,449,787 | ||||||||
Richard D. Willett, Jr. | ||||||||||||
Cash severance(5) | 35,769 | 1,430,769 | 500,769 | 1,430,769 | ||||||||
Health and welfare benefits | — | 23,838 | — | 23,838 | ||||||||
Outplacement benefits | — | 10,500 | — | 10,500 | ||||||||
Purchase of stock | — | 4,327,064 | — | 4,327,064 | ||||||||
Total | 35,769 | 5,792,171 | 500,769 | 5,792,171 | ||||||||
Michael L. Marziale | ||||||||||||
Cash severance(5) | 27,923 | 493,072 | 136,823 | 735,072 | ||||||||
Health and welfare benefits | — | 21,280 | — | 21,280 | ||||||||
Outplacement benefits | — | 10,500 | — | 10,500 | ||||||||
Purchase of stock | — | 3,292,688 | — | 3,292,688 | ||||||||
Total | 27,923 | 3,817,540 | 136,823 | 4,059,540 | ||||||||
George F. Martin | ||||||||||||
Cash severance(6) | 26,442 | 586,191 | 163,942 | 861,191 | ||||||||
Health and welfare benefits | — | 21,658 | — | 21,658 | ||||||||
Outplacement benefits | — | 10,500 | — | 10,500 | ||||||||
Purchase of stock | — | | 3,292,688 | — | 3,292,688 | |||||||
Total | 26,442 | | 3,911,037 | 163,942 | 4,186,037 | |||||||
| (1) | Includes termination by us for cause and resignation by the Executive without good reason. |
| (2) | Includes termination by us without cause and resignation by the Executive with good reason. For purposes of this column, we have assumed that the Executive would elect to require NewPage Group to repurchase the common stock, which is valued at fair value at December 31, 2007. |
| (3) | Includes termination by us without cause and resignation by the Executive with good reason, in each case within 12 months following a change in control. |
| (4) | Amounts shown for Mr. Suwyn assume that a termination includes the termination of his position as our chairman. If the board requests that Mr. Suwyn resign as our chief executive officer, but remain as our chairman, he would be entitled to payment for unused accrued vacation time and his annual bonus award for the year of termination, totaling $834,615. |
109
Table of Contents
| (5) | Cash severance includes payment for unused accrued vacation time and the annual bonus award for the year of termination. For purposes of this table, we have assumed that each Executive would receive a full year of his annual vacation pay. |
Severance Benefits for Former Executive Officer
Mr. Tyrone’s employment with us terminated on January 2, 2008. Under Mr. Tyrone’s separation agreement and in accordance with his employment agreement, he received a severance payment equal to $765,123, payment for accrued but unused vacation in 2008 equal to $37,500, continued health and welfare benefits through January 2, 2010 (comprised of medical, dental, life insurance and accidental death and dismemberment insurance benefits with a total aggregate cost to us of approximately $22,232), and up to one year of outplacement services (approximately $10,500). Under a related repurchase agreement between us and Mr. Tyrone, we repurchased all of Mr. Tyrone’s common stock for $5,500,000 on January 18, 2008. Mr. Tyrone remains subject to certain non-competition and non-solicitation restrictions through January 2, 2009.
Board of Directors
Committees
Our board of directors has established an audit, compensation and compliance committee.
Our audit committee consists of Robert M. Armstrong, David J. Prystash and John W. Sheridan. All of the audit committee members are independent directors. Mr. Sheridan serves as the chairman of the audit committee. Duties of the audit committee include:
| Ÿ | appointing or replacing independent accountants; |
| Ÿ | meeting with our independent accountants to discuss the planned scope of their examinations, the adequacy of our internal controls and our financial reporting; |
| Ÿ | reviewing the results of the annual examination of our consolidated financial statements and periodic internal audit examinations; |
| Ÿ | reviewing and approving the services and fees of our independent accountants; |
| Ÿ | monitoring and reviewing our compliance with applicable legal requirements; and |
| Ÿ | performing any other duties or functions deemed appropriate by our board of directors. |
Our board of directors has designated Mr. Armstrong as our audit committee financial expert.
Our compensation committee consists of Charles E. Long, Michael S. Williams and Alexander M. Wolf. Mr. Williams serves as the chairman of the compensation committee. Duties of the compensation committee include administration of our stock option plans and approval of compensation arrangements for our executive officers.
Our compliance committee consists of James R. Renna, Mark A. Suwyn and George J. Zahringer, III. Mr. Zahringer serves as the chairman of the compliance committee. Duties of the compliance committee include the oversight of our policies, programs and procedures to ensure compliance with relevant laws.
Because we are a “controlled company” within the meaning of New York Stock Exchange rules, we qualify for and intend to rely on exemptions from certain corporate governance requirements. See “Risk Factors—Risks Related to the Offering—We are a “controlled company” within the meaning of
110
Table of Contents
New York Stock Exchange rules and, as a result, will qualify for, and intend to rely on, exemptions from certain corporate governance requirements. You will not have the same protections afforded to stockholders of companies that are subject to such requirements.”
Compensation Committee Interlocks and Insider Participation
Our compensation committee consists of Michael S. Williams, Charles E. Long and Alexander M. Wolf. None of our executive officers has a relationship that would constitute an interlocking relationship with executive officers or directors of another entity or insider participation in compensation decisions.
SEO Designee
Under our amended and restated certificate of incorporation and the securityholders agreement, SEO has the right, so long as SEO and its affiliates continue to beneficially own in the aggregate 75% of the common stock owned by SEO on December 21, 2007, or shares after giving effect to this offering, to select, remove and replace one member of our board of directors, so long as such appointee is not an employee, officer or director of SEO or any of its subsidiaries and is reasonably acceptable to Cerberus.
Compensation of Directors
Our directors who are not our employees or employees of Cerberus or a Cerberus affiliate receive an annual retainer of $50,000 plus $1,250 for attending each board or committee meeting and $10,000 per year for serving as a member and $20,000 per year for serving as a chairman of a committee. In addition, on December 21, 2007 these directors and Mr. Williams each received an award of options to purchase 46,259 shares of our common stock on the same terms as the Executives. See “—Equity Incentive Plan.” Except as set forth in the table below, no director received compensation for their services as our director.
2007 Director Compensation
Name | Fees Earned or Paid in Cash | Option Awards(1) | All Other Compensation | Total | ||||||||
Robert M. Armstrong | $ | 72,500 | $ | 5,231 | $ | — | $ | 77,731 | ||||
David J. Prystash | 72,500 | 5,231 | — | 77,731 | ||||||||
John W. Sheridan | 92,500 | 5,231 | — | 97,731 | ||||||||
Robert S. Silberman(2) | 100,000 | 5,231 | — | 105,231 | ||||||||
Michael S. Williams | — | 5,231 | — | 5,231 | ||||||||
George J. Zahringer, III | 48,750 | 5,231 | — | 53,981 | ||||||||
| (1) | Of the 46,259 option shares granted to each director as of December 31, 2007, 23,130 time-based options were deemed granted for accounting purposes pursuant to SFAS 123R. The time-based options currently vest in three equal annual installments beginning on December 21, 2008. All of the time-based options will vest upon consummation of this offering. Because the performance targets are determined annually by the compensation committee, we have not considered the 23,129 performance-based stock options as being granted. The performance-based stock options will be considered granted when the compensation committee sets the performance targets for the applicable year. The grant date fair value of the time-based stock options was $284,107 for each director. The grant date fair value of these options was determined in accordance with SFAS No. 123R and will be recognized over the three-year vesting period. See “—Equity Incentive Plan” for information on vesting of the awards. See the notes to the financial statements for information on the material terms of the awards and the assumptions used in determining the grant date fair value. All of the outstanding options were unexercisable as of December 31, 2007. |
| (2) | Mr. Silberman resigned as a director in March 2008. |
111
Table of Contents
Equity Incentive Plan
We have adopted the NewPage Group Incentive Plan. The purpose of the NewPage Group Incentive Plan is to aid us in attracting and retaining key employees, directors and consultants of outstanding ability and to motivate them to use their best efforts on our and our affiliates’ behalf. As of December 31, 2007, we have granted options to acquire shares of common stock under the NewPage Group Incentive Plan.
On December 21, 2007, each Executive and director who is not our employee or an employee of Cerberus or a Cerberus affiliate and Mr. Williams was granted options under the NewPage Group Incentive Plan to purchase our common stock. Vesting of one-half of these stock options is time-based and the other half is performance-based. Time-based options and the performance-based options that would have vested on the next performance vesting date will vest upon consummation of this offering. In the aggregate, options to purchase shares of our common stock held by Executives and directors will vest upon consummation of this offering.
The remaining performance-based options will vest in two equal annual installments commencing December 31, 2009, but only if annual performance targets, as established by the compensation committee, are met. In addition, upon a change of control, a portion of the stock options will vest upon the change of control. Finally, the stock options will vest on each vesting date only if the Executive remains employed by us on that vesting date. Because the performance targets are determined annually by the compensation committee, for accounting purposes, only the time-based stock options are considered to be granted. The performance-based stock options will be considered granted for accounting purposes when the compensation committee sets the performance targets for the applicable year.
Each Executive is subject to a five-year lock-up agreement with us with respect to his vested options and the underlying shares of common stock, subject to certain limited exceptions. Following the consummation of this offering, upon a termination of employment for cause, the shares underlying the options are subject to repurchase by us at fair market value.
Awards. The NewPage Group Incentive Plan provides for the grant of stock options, stock appreciation rights, restricted stock, performance awards (including cash performance awards) and other equity-based awards.
Shares Subject to the Incentive Plan. Subject to adjustment as provided in the next paragraph, the aggregate number of shares of our common stock that may be delivered pursuant to awards granted under the NewPage Group Incentive Plan will be shares. If an award granted under the NewPage Group Incentive Plan terminates, is forfeited, is settled in cash or otherwise does not result in the issuance of shares, as applicable, then the shares covered by the termination, forfeiture, cash settlement or non-issuance of the award will again be available to be granted.
In the event of any change affecting the outstanding shares of our common stock by reason of, among other things, a share dividend or split, reorganization, recapitalization, merger, consolidation or any transaction similar to the foregoing (other than a cash dividend), the compensation committee, in its discretion, may make such substitution or adjustment as it deems equitable including, to (1) the number or kind of shares or other securities issued or reserved for issuance pursuant to the NewPage Group Incentive Plan or pursuant to outstanding awards and/or (2) the option price or exercise price of any stock appreciation right.
Plan Administration. The NewPage Group Incentive Plan is administered by the compensation committee of our board of directors or a subcommittee. Our board of directors and the plan administrator also have the authority to take any action delegated to the compensation committee
112
Table of Contents
under the NewPage Group Incentive Plan as it may deem necessary. Awards may, in the discretion of the compensation committee, be made under the NewPage Group Incentive Plan in assumption of, or in substitution for, outstanding awards previously granted by us or our affiliates. The number of shares underlying such substitute awards will not be counted against the aggregate number of shares available for awards under the NewPage Group Incentive Plan. The compensation committee has the authority to (1) select NewPage Group Incentive Plan participants, (2) interpret the NewPage Group Incentive Plan, (3) establish, amend and rescind any rules and regulations relating to the NewPage Group Incentive Plan and to make any other determinations deemed necessary or desirable for the administration of the NewPage Group Incentive Plan, (4) correct any defect or supply any omission or reconcile any inconsistency in the NewPage Group Incentive Plan in the manner and to the extent deemed necessary or desirable and (5) establish the terms and conditions of any award consistent with the provisions of the NewPage Group Incentive Plan and to waive any such terms and conditions at any time (including, without limitation, accelerating or waiving any vesting conditions). Any decision in respect of the interpretation and administration of the NewPage Group Incentive Plan lies within the sole and absolute discretion of the compensation committee.
Eligibility. Any employee or director of us or any of our affiliates are eligible to participate in the NewPage Group Incentive Plan. In each case, the compensation committee will select the actual grantees.
Limitations. No award may be granted under the NewPage Group Incentive Plan after the tenth anniversary of its commencement. Awards granted prior to the termination may extend beyond the termination date of the NewPage Group Incentive Plan.
Options. Under the NewPage Group Incentive Plan, the compensation committee may grant both incentive stock options intended to conform to the provisions of Section 422 of the Internal Revenue Code and non-qualified stock options. Other than in connection with substitute awards, the exercise price for options will be determined by the compensation committee, but the exercise price cannot be less than 100% of the fair market value (as defined in the NewPage Group Incentive Plan) of our common stock on the grant date. In the case of incentive stock options granted to an employee who, at the time of the grant of an option, owns stock representing more than 10% of the voting power of all classes of our common stock or the common stock of any of our subsidiaries, the exercise price cannot be less than 110% of the fair market value of a share of our common stock on the grant date and the incentive stock option will terminate on a date not later than the day preceding the fifth anniversary of the date on which such incentive stock option was granted.
The compensation committee will determine when, and upon what terms and conditions, options granted under the NewPage Group Incentive Plan will be exercisable, except that no option will be exercisable more than 10 years after the date on which it was granted. The exercise price may be paid (1) with cash (or its equivalent), (2) with shares of our common stock that have a fair market value equal to the aggregate option exercise price, (3) with the consent of the compensation committee, by delivery of other consideration having a fair market value on the exercise date equal to the total purchase price, (4) with the consent of the compensation committee, withholding shares otherwise issuable, (5) with the consent of the compensation committee, any combination of the foregoing or (6) such other method approved by the compensation committee.
Stock Appreciation Rights. The compensation committee may grant stock appreciation rights under the NewPage Group Incentive Plan either independently or, in connection with an option, or portion thereof or in connection with an award other than an option, or portion thereof. Stock appreciation rights granted in connection with an option, or other award or portion thereof, will be granted either at the same time as the option or other award or at any time prior to the exercise or cancellation of the related option or other award and will be subject to terms and conditions determined
113
Table of Contents
by the compensation committee as well as any additional limitations contemplated by the NewPage Group Incentive Plan or that the compensation committee may impose, in its discretion, including conditions upon the exercisability or transferability of stock appreciation rights.
The exercise price of each share covered by a stock appreciation right will be determined by the compensation committee, but the exercise price cannot be less than the greater of the fair market value of our common stock on the date the stock appreciation right was granted or, in the case of a stock appreciation right granted in connection with an option, or a portion thereof, the option price of the related option. Each stock appreciation right granted independent of an option will entitle an NewPage Group Incentive Plan participant upon exercise of such right to an amount equal to (1) the excess of (a) the fair market value on the exercise date of one share of common stock over (b) the exercise price per share, times (2) the number of shares covered by the stock appreciation right. Each stock appreciation right granted in connection with an option, or a portion thereof, will entitle an NewPage Group Incentive Plan participant to surrender to us the unexercised option, or any portion thereof, and to receive from us in exchange an amount equal to (1) the excess of (a) the fair market value on the exercise date of one share or such other amount as the compensation committee will determine at any time during a specified period before the date of exercise over (b) the option price per share, times (2) the number of shares covered by the option, or portion thereof, which is surrendered.
Restricted Stock Awards. The compensation committee may grant restricted stock under the NewPage Group Incentive Plan in the form of restricted stock awards or as payment of performance awards and other earned cash-based incentive compensation. The terms and conditions of any restricted stock award, including any purchase price requirement and vesting provisions, will be determined by the compensation committee.
Other Stock-Based Awards. The compensation committee may grant awards of shares, restricted shares and other awards that are valued in whole or in part by reference to, or are otherwise based on the fair market value of, shares of common stock. We refer to such awards as other stock-based awards. Other stock-based awards may be granted alone or in addition to any other awards granted under the NewPage Group Incentive Plan.
Performance Awards. The compensation committee may grant performance awards in the form of performance cash, performance shares or performance units under the NewPage Group Incentive Plan. The terms and conditions of performance awards, including the performance criteria and performance period, will be determined by the compensation committee. Performance awards may be paid in cash, shares, other property or a combination thereof.
Change of Control. The NewPage Group Incentive Plan provides that, in the event of a change in control, as defined below, the compensation committee may, in its sole discretion, provide for:
| Ÿ | termination of an award upon the consummation of the change in control, but only if the award has vested and been paid out or the NewPage Group Incentive Plan participant has been permitted to exercise the award in full for a period of not less than 20 days prior to the change in control; |
| Ÿ | acceleration of all or any portion or an award; |
| Ÿ | payment of any amount (in cash or, in the discretion of the compensation committee, in the form of consideration paid to our stockholders in connection with the change of control) in exchange for the cancellation of such award; and/or |
| Ÿ | issuance of substitute awards that will substantially preserve the otherwise applicable terms of any affected awards. |
114
Table of Contents
A change in control is defined to mean the occurrence of any of the following events:
| Ÿ | any person who is not an affiliate of us becoming a beneficial owner of securities representing fifty percent or more of the combined voting power of our then outstanding securities generally entitled to vote for the election of members of our board of directors; or |
| Ÿ | the sale, transfer or other disposition of all or substantially all of our business and assets to a person other an affiliate of Cerberus; or |
| Ÿ | our dissolution or liquidation. |
Amendment and Termination. Our board of directors may amend, alter or terminate the NewPage Group Incentive Plan at any time, but no amendment may impair rights of a participant under any awards previously granted, without his or her written consent.
115
Table of Contents
PRINCIPAL AND SELLING STOCKHOLDERS
The following table sets forth information with respect to the beneficial ownership of NewPage Group as of , 2008 by:
| Ÿ | each person who is known by us to beneficially own 5% or more of our common stock; |
| Ÿ | each member of our board of directors; |
| Ÿ | each of the executive officers named in the table under “Management—Compensation Summary—Summary Compensation Table;” |
| Ÿ | all of our directors and executive officers as a group; and |
| Ÿ | each selling stockholder in this offering. |
Beneficial ownership is determined in accordance with the rules of the SEC. To our knowledge, each of the holders listed below has sole voting and investment power as to the common stock owned unless otherwise noted.
As of August 15, 2008, there were 17 stockholders of record of our common stock.
The table below assumes the sale of shares of common stock in this offering at an assumed public offering price of $ per share, the midpoint of the range set forth on the cover page of this prospectus. To the extent that the initial public offering price is greater or less than the midpoint of the range set forth on the cover page of this prospectus, the number of shares to be sold by us will be adjusted upwards or downwards to maintain constant net proceeds to us of approximately $ million, and the aggregate number of shares to be sold by the selling stockholders will be adjusted downwards or upwards by an equal amount. See “Use of Proceeds.”
Name and Address of Beneficial Owner | Shares of Common Stock to be Sold in this Offering Assuming No Exercise of Over-Allotment Option | Shares of Common Stock to be Sold in this Offering Assuming Full Exercise of Over-Allotment Option | Shares of Common Stock Beneficially Owned After Offering Assuming No Exercise of Over-Allotment Option | Shares of Common Stock Beneficially Owned After Offering Assuming Full Exercise of Over-Allotment Option | ||||||||
| Number | Percent | Number | Percent | |||||||||
5% Stockholders and Selling Stockholders | ||||||||||||
Ahab Partners, L.P.(1) | ||||||||||||
NewPage Investments LLC(2) | ||||||||||||
Cerberus Partners, L.P.(2) | ||||||||||||
Gabriel Assets, LLC(2) | ||||||||||||
Cerberus Series Two Holdings LLC(2) | ||||||||||||
Cerberus Series Three Holdings LLC(2) | ||||||||||||
Cerberus America Series One Holdings LLC(2) | ||||||||||||
Cerberus America Series Two Holdings LLC(2) | ||||||||||||
Stora Enso Oyj(3) | ||||||||||||
| Shares of Common Stock Beneficially Owned Prior to Offering | Shares of Common Stock Beneficially Owned After this Offering | |||||||||||
| Name of Beneficial Owner | Number | Percent | Number | Percent | ||||||||
Executive Officers and Directors | ||||||||||||
Jason W. Bixby | ||||||||||||
George F. Martin | ||||||||||||
Michael L. Marziale | ||||||||||||
Mark A. Suwyn | ||||||||||||
Richard D. Willett, Jr. | ||||||||||||
Robert M. Armstrong | ||||||||||||
Charles E. Long | ||||||||||||
David J. Prystash | ||||||||||||
James R. Renna | ||||||||||||
John W. Sheridan | ||||||||||||
Lenard B. Tessler | ||||||||||||
Michael S. Williams | ||||||||||||
Alexander M. Wolf | ||||||||||||
George J. Zahringer, III | ||||||||||||
Directors and executive officers as a group (18 persons) | ||||||||||||
116
Table of Contents
| * | Denotes beneficial ownership of less than 1%. |
| (1) | Jonathan Gallen exercises sole voting and investment authority over all shares of our common stock owned by Ahab Partners, L.P. Thus, pursuant to Rule 13d-3 under the Exchange Act, Jonathan Gallen is deemed to beneficially own all of the shares of our common stock owned by Ahab Partners, L.P. |
| (2) | Stephen Feinberg exercises sole voting and investment authority over all shares of our common stock owned by the Cerberus funds and accounts listed above. Thus, pursuant to Rule 13d-3 under the Exchange Act, Stephen Feinberg is deemed to beneficially own all of the shares of our common stock owned by Cerberus. Stephen Feinberg’s business address is c/o Cerberus Capital Management, L.P., 299 Park Avenue, 22nd floor, New York, New York 10171. |
| (3) | The address for SEO is Kanavaranta 1 P.O. Box 309 00101, Helsinki, Finland. |
117
Table of Contents
CERTAIN RELATIONSHIPS AND RELATED PARTY TRANSACTIONS
We and our audit committee have adopted written procedures regarding related party transactions. Pursuant to those procedures, any related party transaction that would be required to be reported in accordance with the rules of the SEC in an annual report on Form 10-K, and any material amendment to such a related party transaction, must first be presented to and approved by our chief executive officer, our chief financial officer and our general counsel and then by the audit committee before we make a binding commitment to the related party. For each related party transaction presented for approval, we will consider all relevant factors, including whether the proposed transaction would be entered into in the ordinary course of our business on customary business terms, whether any related party has been or will be involved in the negotiation or administration of the proposed transaction on our behalf, and whether the proposed transaction appears to have been negotiated on an arms-length basis without interference or influence on us by any related party. We may condition our approval on any restrictions we deem appropriate, including receiving assurances from any related party that he or she will refrain from participating in the negotiation of the proposed transaction on our behalf and in the ongoing management of the business relationship on our behalf should the proposed transaction be approved. If after a transaction has been completed we discover that it is a related party transaction, we will promptly advise management and our audit committee. In that case, we may honor the contractual commitment if entered into in good faith by an authorized representative of ours, but we may impose appropriate restrictions on the continued maintenance of the business relationship similar to those described above. If our chief executive officer, chief financial officer, general counsel or any member of our audit committee has a direct or indirect interest in a proposed transaction, that individual must disclose his interest in the proposed transaction and refrain from participating in the approval process.
Consulting Arrangements with Rapid Change Technologies
M. Daniel Suwyn, the son of Mark Suwyn, our chairman and chief executive officer, is the principal owner of Rapid Change Technologies. We paid Rapid Change Technologies $833,000 for consulting and training services in 2007. Rapid Change Technologies developed a training program and a process to improve communication skills, consensus building and problem-solving abilities. Rapid Change Technologies also facilitated the training of our employees on improving communication skills, resolving conflict and developing a process to improve productivity/operations through greater collaboration between hourly employees and supervisors/management. The terms of this arrangement were determined on an arms’-length basis, and we believe that they are comparable to terms that would have been obtained from an unaffiliated third party.
Cerberus Arrangements
Cerberus retains consultants that specialize in operations management and support and who provide Cerberus with consulting advice concerning portfolio companies in which funds and accounts managed by Cerberus or its affiliates have invested. From time to time, Cerberus makes the services of these consultants available to Cerberus portfolio companies. We reimbursed Cerberus $105,000 for these services in 2007. These services were provided at rates not greater than the fees that Cerberus paid to the applicable consultant, together with reimbursement of out-of-pocket expenses incurred by the consultant in providing those services. We believe that the terms of these consulting arrangements are comparable to terms that would have been obtained from an unaffiliated third party. Depending upon the nature of the assignment, consultants retained by us also provided services for Cerberus and other entities affiliated with Cerberus, including other Cerberus portfolio companies, at the same time as they performed consulting services to us, but the consultants’ duty of loyalty in their performance of their consulting services for us was solely to us. Any future consulting services of Cerberus consultants will be subject to the review and approval procedures described above.
118
Table of Contents
Affiliates of Cerberus
During 2007, we maintained commercial arrangements with entities that are or at the time were owned or controlled by Cerberus. These include the following:
| Ÿ | Sales of coated paper to Renaissance Mark, Inc. totaling $8,922,000 in 2007. In addition, in 2005, Renaissance Mark issued a promissory note to us covering past due trade receivables. The note was repaid in January 2007 in accordance with its original terms. Our relationship with Renaissance Mark began prior to the acquisition of our predecessor. Renaissance Mark was acquired by Fort Dearborn Company on June 1, 2007 and is no longer an affiliate of Cerberus. |
| Ÿ | Payments of $163,000 to Hilco Appraisal Services for appraisal services. |
| Ÿ | Reimbursing a total of $142,000 in 2007 to our employees for costs they incurred from National Car Rental and Alamo Rent-a-Car business rentals. Vanguard Car Rental, the parent of National Car Rental and Alamo Rent-a-Car, was acquired by Enterprise Rent-A-Car on August 1, 2007 and is no longer an affiliate of Cerberus. |
| Ÿ | Commercial Finance LLC, an affiliate of GMAC LLC, is one of the lenders under our senior secured revolving credit facility that we entered into on December 21, 2007. They have committed $70 million, of which a portion is currently used to support letters of credit. We expect that amounts paid to them for commitment fees will be less than $1 million per year. We currently have no balances outstanding under the senior secured revolving credit facility. |
| Ÿ | The Acquisition included a capital lease obligation, of which Chrysler Capital is a participant, for the lease of a paper machine. Chrysler Capital may receive proceeds of approximately $57 million in 2014 if the purchase option under the lease agreement is triggered. The lease was originally entered into between Chrysler Capital and SENA prior to the acquisition of Chrysler by Cerberus and prior to our acquisition of SENA. |
These transactions were entered into in the ordinary course of our business. We believe that these transactions were negotiated on an arms’–length basis, on substantially the same terms that could have been obtained from an unrelated party, and are not material to our results of operations or financial position.
SEO Arrangements
We and our affiliates issued equity and debt securities to and entered into several agreements with SEO in connection with the Acquisition. We believe that these transactions were negotiated on an arms’-length basis, on substantially the same terms that could have been obtained from an unrelated party. The agreements are described below to the extent in effect following the consummation of this offering.
Stock Purchase Agreement
Purchase Price. Pursuant to the stock purchase agreement, we acquired SEO’s North American paper business by way of the purchase of all of the issued and outstanding common stock of SENA. In exchange, SEO received:
| Ÿ | $1,522 million in cash from us (after the final working capital adjustment); |
| Ÿ | shares of common stock representing 19.9% of our outstanding common stock at the closing of the Acquisition (not taking into account any potential dilution from equity awards issued to management following the closing of the Acquisition pursuant to the NewPage Group Incentive Plan); and |
| Ÿ | $200 million in aggregate principal amount of NewPage Group PIK Notes. |
119
Table of Contents
Representations and Warranties; Indemnification. The stock purchase agreement contains customary representations, warranties and covenants. For purposes of post-closing indemnification, the representations and warranties generally survive until the earlier of June 21, 2009 and 90 days after completion of our first audited financial statements that include SENA and its subsidiaries on or after the closing of the Acquisition of not less than 9 months. The exceptions to the survival period described above are representations and warranties with respect to tax matters, which survive until 30 days after the expiration of the applicable statute of limitations, employee benefits matters, which survive for five years after the closing of the Acquisition, environmental matters, which survive for two years after the closing of the Acquisition and certain fundamental representations, such as enforceability and ownership of shares, which survive indefinitely.
SEO’s and our obligations to indemnify each other for breaches of representations and warranties (other than for the fundamental representations) are not triggered for breaches resulting in losses less than $100,000 and until the other party suffers losses in the aggregate of more than $22.5 million, and then only to the extent that such losses exceed that amount. SEO’s and our aggregate indemnification obligations in respect of breaches of representations and warranties (other than for the fundamental representations) are capped at $225 million.
In addition to SEO’s indemnification for breaches of the environmental representations, SEO has agreed to indemnify us, subject to certain limitations, for specified environmental liabilities arising from: certain agreed remediation activity (until such remediation is completed), certain air compliance penalties, provided that SEO is only responsible for 75% of such costs and only to the extent paid by us within a five-year period following the closing of the Acquisition, certain air compliance costs, provided that SEO is only responsible for 75% of such costs and only to the extent incurred by us within a five-year period following the closing of the Acquisition and that SEO’s obligations with respect to the boiler Maximum Achievable Control Technology rule is limited to 50% of the initial $35 million of those air compliance costs incurred by us within a five-year period following the closing of the Acquisition and certain other actual or potential environmental matters, provided that SEO is only responsible for 75% of such costs and only to the extent paid by us within a five-year period following the closing. SEO’s liability under the environmental indemnity is subject to the $225 million cap. In order to obtain indemnification for these specified environmental liabilities, we must submit an indemnification claim notice within three years of the closing of the Acquisition.
In respect of tax matters, SEO has agreed to indemnify us, subject to certain exceptions, for all taxes imposed on SENA or its subsidiaries relating to a taxable period (or portion thereof) ending on or before the closing of the Acquisition, any loss arising from any breach of the tax representations and warranties, excluding any loss incurred as a result of any reduction in any net operating loss for any taxable period (or portion thereof) ending on or before the closing of the Acquisition, and any taxes imposed on SENA or any of its subsidiaries to the extent resulting from the recognition of taxable income or gain in connection with the termination of certain intercompany agreements. We have agreed to indemnify SEO in respect of any post-closing taxes imposed on SENA or any of its subsidiaries.
Each of us and SEO has agreed to fully indemnify the other to the extent the applicable party breaches any of its covenants in the stock purchase agreement or any ancillary agreement (subject to any limitations on indemnity set forth in the applicable ancillary agreement). SEO has also agreed to fully indemnify us and our subsidiaries from all liabilities arising from certain antitrust-related litigation and excluded assets.
All post-closing indemnity payments made by us to SEO will be adjusted upwards to take into account SEO’s equity ownership in NewPage Group.
120
Table of Contents
Securityholders Agreement
At the closing, we entered into a securityholders agreement with Cerberus, SEO and certain of our executives, who we refer to as the “Executive Stockholders”.
Restrictions on Transfer. The securityholders agreement contains provisions regarding the ownership of NewPage Group common stock, including the following:
| Ÿ | a prohibition on the private sale by SEO of any of our common stock to any of our competitors, unless we and Cerberus provide our prior written consent, subject to certain exceptions; |
| Ÿ | SEO has a one time right, exercisable after 180 days following consummation of this offering, to distribute pro rata all of our common stock then owned by SEO to SEO’s stockholders, which distribution will count as a demand registration by SEO under, and be subject to, the registration rights provisions discussed below; |
| Ÿ | the right of Cerberus, in connection with any change of control (as defined below) initiated by Cerberus, to require the other parties to the securityholders agreement to sell their common stock in the change of control transaction at the same purchase price and upon the other terms and conditions of the sale (which we refer to as the “Cerberus drag-along right”); and |
| Ÿ | the right of the other parties to the securityholders agreement, subject to the Cerberus drag-along right and certain conditions, to participate on a pro rata basis in non-public sales of common stock by Cerberus representing more than 25% of the shares of the common stock owned by Cerberus on December 21, 2007 (taking into account all prior transactions involving a disposition of our common stock); |
SEO Rights. The securityholders agreement also provides SEO with certain rights regarding us and our subsidiaries, including the following:
| Ÿ | the right of SEO, so long as SEO and its affiliates continue to beneficially own in the aggregate 75% of the common stock owned by SEO on December 21, 2007, or shares after giving effect to this offering, to select, remove and replace one member of our board of directors, so long as such appointee is not an employee, officer or director of SEO or any of its subsidiaries and is reasonably acceptable to Cerberus; and |
| Ÿ | the requirement to obtain SEO’s written consent, so long as SEO and its affiliates continue to beneficially own in the aggregate 75% of the common stock owned by SEO on December 21, 2007, or shares after giving effect to this offering, prior to us taking any of the following actions: |
| • | amending our organizational documents in a manner inconsistent with SEO’s rights under our securityholders agreement; |
| • | converting from a Delaware corporation to another entity form; |
| • | effecting a change of control transaction in which the common stock held by SEO is not entitled to participate on the same terms as that of Cerberus; “change of control” is defined as any transaction pursuant to which a person becomes the beneficial owner of more than 50% of our common stock or the sale or disposition of all or substantially all of our business or assets, whether by merger or otherwise, to a person that is not controlled, directly or indirectly, by Cerberus or its permitted transferees; |
| • | knowingly taking any action that would cause SEO to consolidate us for purposes of U.S. GAAP or international financial reporting standards; or |
| • | entering into certain affiliate transactions. |
121
Table of Contents
Registration Rights. The securityholders agreement also provides for the following registration rights:
| Ÿ | the right of Cerberus and of SEO to cause us to register under the Securities Act common stock held by them, subject to customary blackout periods and underwriter cutback provisions; provided that we are not required to effect demand registrations for offerings with a value of less than $50 million or more than two demand registrations in any twelve month period or more than three demands registrations by SEO; and |
| Ÿ | if we, Cerberus or SEO proposes to register under the Securities Act any common stock, we must provide written notice of the proposed registration to each of the other parties to the securityholders agreement, who have the right to request that any part of their respective registrable shares be included in that registration, subject to customary blackout periods and underwriter cutback provisions. |
Pursuant to the registration rights agreement, we will pay all registration expenses and indemnify each holder of registrable securities with respect to each registration which has been effected.
The Executive Stockholders have separately entered into agreements not to transfer their common stock until the later of May 2, 2010 and the expiration of any lockup agreement with the underwriters in connection with this offering.
Ancillary Agreements
In connection with the signing of the stock purchase agreement, we entered into an intellectual property agreement with SEO. At the closing of the Acquisition, we entered into a pulp supply agreement and other certain ancillary agreements with SEO and/or one of SEO’s subsidiaries. Each of these other agreements and arrangements is described below.
Intellectual Property Agreement. In connection with the stock purchase agreement, SEO and NewPage Holding entered into an intellectual property agreement pursuant to which SEO and SENA have agreed to grant to the other party and its affiliates a non-exclusive, worldwide, irrevocable, perpetual, fully paid-up, royalty-free license to manufacture, sell or import any product, method or service that may be covered by certain patents, patent applications and invention records and subject to certain restrictions, to use and otherwise exploit any trade secrets or copyrights or other non-registrable intellectual property rights of the other party to the extent used in or necessary for the business of the other party or its affiliates as of the closing of the Acquisition. Subject to certain restrictions, SEO has also agreed to grant to SENA and its affiliates a limited non-exclusive, fully paid-up, royalty-free license to use certain trademarks on materials created within 90 days after the closing of the Acquisition until such materials are exhausted and to use certain other specialty brands trademarks on the products on which they were used prior to the closing of the Acquisition, until either party terminates such license right.
Corenso Arrangements. Prior to the closing of the Acquisition, Stora Enso North America Corp., now called NewPage Wisconsin System Inc., or NewPage Wisconsin, and Corenso North America Corp., a wholly-owned subsidiary of SEO that was not part of the Acquisition, which we refer to as “Corenso”, entered into the arrangements described below. Corenso manufactures core boards, cores and tubes for use by manufacturers of paper and board, textile yarn, plastic film, flexible packaging and metal foil.
| Ÿ | Corenso acquired from NewPage Wisconsin certain assets currently used by Corenso in NewPage Wisconsin’s Wisconsin Rapids mill, and Corenso granted NewPage Wisconsin a right of first offer in respect of any future sale or transfer of those assets; |
| Ÿ | NewPage Wisconsin and Corenso entered into property lease agreements with respect to the part of the Wisconsin Rapids mill currently used in Corenso’s operations and NewPage |
122
Table of Contents
Wisconsin is providing steam, process water and process water effluent treatment to Corenso operations at the leased facility; |
| Ÿ | NewPage Wisconsin and Corenso entered into a transition services agreement whereby NewPage Wisconsin will provide information technology and other transition services to Corenso for up to one year from the closing of the Acquisition; |
| Ÿ | NewPage Wisconsin will use commercially reasonable efforts to make available directly or through a specified third party certain logistical services currently being used by both NewPage Wisconsin and Corenso in respect of the Wisconsin Rapids mill; and |
| Ÿ | NewPage Wisconsin and Corenso entered into a supply agreement pursuant to which Corenso will continue to supply cores to NewPage Wisconsin on mutually agreed terms. |
Loans to Maple Timber
During 2007, in connection with the separation from NewPage Holding and NewPage Corporation of Matthew L. Jesch, their former chief financial officer, and Charles J. Aardema, their former vice president, human resources and communications, NewPage Corporation loaned $3 million and $0.9 million to Maple Timber to enable Maple Timber to satisfy its equity repurchase obligations. These loans were retired in connection with pre-closing reorganization of NewPage Holding in connection with the Acquisition as described in “Management’s Discussion and Analysis of Financial Condition and Results of Operations—Overview—The SENA Acquisition and Related Transactions.”
123
Table of Contents
The following summary of certain provisions of our capital stock does not purport to be complete and is subject to, and qualified in its entirety by, our amended and restated certificate of incorporation and amended and restated bylaws and the provisions of applicable law. Copies of our amended and restated certificate of incorporation and amended and restated bylaws have been filed as exhibits to the registration statement of which this prospectus is a part.
General
Our authorized capital stock consists of shares of common stock, par value $0.01 per share, of which shares are issued and outstanding, and shares of preferred stock, par value $0.01 per share, of which none are issued and outstanding.
Common Stock
Upon the consummation of this offering, there will be shares of common stock outstanding.
The holders of our common stock are entitled to one vote per share on all matters submitted to a vote of stockholders. Subject to preferences that may be applicable to any outstanding series of preferred stock, the holders of our common stock will receive ratably any dividends declared by our board of directors. Our board of directors may, at its discretion, modify or repeal our dividend policy. Future dividends, if any, with respect to shares of our common stock will depend on, among other things, our results of operations, cash requirements, financial condition, contractual restrictions, provisions of applicable law and other factors that our board of directors deems relevant. See “Dividend Policy.” In the event of our liquidation, dissolution or winding-up, the holders of our common stock are entitled to share ratably in all assets remaining after payment of liabilities, subject to prior distribution rights of preferred stock, if any, then outstanding.
Preferred Stock
Our board of directors has the authority, by adopting resolutions, to issue shares of preferred stock in one or more series, with the designations and preferences for each series set forth in the adopting resolutions. Our amended and restated certificate of incorporation authorizes our board of directors to determine, among other things, the rights, preferences and limitations pertaining to each series of preferred stock.
Limitations on Directors’ Liability
Our amended and restated certificate of incorporation and amended and restated bylaws indemnify our directors to the fullest extent permitted by the DGCL. The DGCL permits a corporation to limit or eliminate a director’s personal liability to the corporation or the holders of its capital stock for breach of duty. This limitation is generally unavailable for acts or omissions by a director which (i) were in bad faith, (ii) were the result of active and deliberate dishonesty and were material to the cause of action so adjudicated or (iii) involved a financial profit or other advantage to which such director was not legally entitled. The DGCL also prohibits limitations on director liability for acts or omissions which resulted in a violation of a statute prohibiting certain dividend declarations, certain payments to stockholders after dissolution and particular types of loans. The effect of these provisions is to
124
Table of Contents
eliminate the rights of our company and our stockholders (through stockholders’ derivative suits on behalf of our company) to recover monetary damages against a director for breach of fiduciary duty as a director (including breaches resulting from grossly negligent behavior), except in the situations described above. These provisions will not limit the liability of directors under the federal securities laws of the United States.
Transfer Agent and Registrar
The Transfer Agent and Registrar for our common stock is .
Listing
We propose to list our common stock on the New York Stock Exchange, subject to official notice of issuance, under the symbol “NWP.”
Provisions of Our Amended and Restated Certificate of Incorporation and
Amended and Restated Bylaws and Delaware Law That May Have an Anti-Takeover Effect
At such time as Cerberus no longer controls our company, certain provisions of our amended and restated certificate of incorporation and amended and restated bylaws and Delaware law may have an anti-takeover effect. See “Risk Factors—Risks Related to the Offering—Even if Cerberus no longer controls us in the future, certain provisions of our charter documents and agreements and Delaware law could discourage, delay or prevent a merger or acquisition at a premium price.”
Amended and restated certificate of incorporation and amended and restated bylaws. Certain provisions in our amended and restated certificate of incorporation and amended and restated bylaws summarized below may be deemed to have an anti-takeover effect and may delay, deter or prevent a tender offer or takeover attempt that a stockholder might consider to be in its best interests, including attempts that might result in a premium being paid over the market price for the shares held by stockholders.
Our amended and restated certificate of incorporation and amended and restated bylaws contain provisions that:
| Ÿ | permit us to issue, without any further vote or action by our stockholders, shares of preferred stock in one or more series and, with respect to each series, to fix the number of shares constituting the series and the designation of the series, the voting powers (if any) of the shares of such series, and the preferences and other special rights, if any, and any qualifications, limitations or restrictions, of the shares of the series; |
| Ÿ | only permit special meetings to be called by order of our board of directors; |
| Ÿ | do not permit stockholders to act by written consent; |
| Ÿ | require advance notice for nominations for election to the board and for stockholder proposals; |
| Ÿ | require us to obtain SEO’s written consent, so long as SEO and its affiliates continue to beneficially own in the aggregate 75% of the common stock acquired by SEO on December 21, 2007, prior to taking any of the following actions: |
| • | amending our organizational documents in a manner inconsistent with SEO’s rights under our amended and restated certificate of incorporation; |
| • | effecting a change of control transaction in which the common stock held by SEO is not entitled to participate on the same terms as that of Cerberus; and |
125
Table of Contents
| Ÿ | provide SEO the right, so long as SEO and its affiliates continue to beneficially own in the aggregate 75% of the common stock owned by SEO on December 21, 2007, or shares after giving effect to this offering, to select, remove and replace one member of our board of directors, so long as such appointee is not an employee, officer or director of SEO or any of its subsidiaries and is reasonably acceptable to Cerberus. |
“Change of control” is defined as any transaction pursuant to which a person becomes the beneficial owner of more than 50% of our common stock or the sale or disposition of all or substantially all of our business or assets, whether by merger or otherwise, to a person that is not controlled, directly or indirectly, by Cerberus or its permitted transferees.
The foregoing provisions of our amended and restated certificate of incorporation and amended and restated bylaws could discourage potential acquisition proposals and could delay or prevent a change in control. These provisions are intended to enhance the likelihood of continuity and stability in the composition of our board of directors and in the policies formulated by our board of directors and to discourage certain types of transactions that may involve an actual or threatened change of control. These provisions are designed to reduce our vulnerability to an unsolicited acquisition proposal. The provisions also are intended to discourage certain tactics that may be used in proxy fights. However, such provisions could have the effect of discouraging others from making tender offers for our shares and, as a consequence, they also may inhibit fluctuations in the market price of the common stock that could result from actual or rumored takeover attempts. Such provisions also may have the effect of preventing changes in our management. See “Risk Factors—Risks Related to the Offering—Even if Cerberus no longer controls us in the future, certain provisions of our charter documents and agreements and Delaware law could discourage, delay or prevent a merger or acquisition at a premium price.”
Delaware Takeover Statute. We are subject to Section 203 of the DGCL, which, subject to certain exceptions, prohibits a Delaware corporation from engaging in any “business combination” (as defined below) with any “interested stockholder” (as defined below) for a period of three years following the date that such stockholder became an interested stockholder, unless: (i) prior to such date, the board of directors of the corporation approved either the business combination or the transaction that resulted in the stockholder becoming an interested stockholder; (ii) on consummation of the transaction that resulted in the stockholder becoming an interested stockholder, the interested stockholder owned at least 85% of the voting stock of the corporation outstanding at the time the transaction commenced, excluding for purposes of determining the number of shares outstanding those shares owned (x) by persons who are directors and also officers and (y) by employee stock plans in which employee participants do not have the right to determine confidentially whether shares held subject to the plan will be tendered in a tender or exchange offer; or (iii) on or subsequent to such date, the business combination is approved by the board of directors and authorized at an annual or special meeting of stockholders, and not by written consent, by the affirmative vote of at least 66 2/3% of the outstanding voting stock that is not owned by the interested stockholder.
Section 203 of the DGCL defines “business combination” to include: (i) any merger or consolidation involving the corporation and the interested stockholder; (ii) any sale, transfer, pledge or other disposition of 10% or more of the assets of the corporation in a transaction involving the interested stockholder; (iii) subject to certain exceptions, any transaction that results in the issuance or transfer by the corporation of any stock of the corporation to the interested stockholder; (iv) any transaction involving the corporation that has the effect of increasing the proportionate share of the stock of any class or series of the corporation beneficially owned by the interested stockholder; or (v) the receipt by the interested stockholder of the benefit of any loans, advances, guarantees, pledges or other financial benefits provided by or through the corporation. In general, Section 203 defines an “interested stockholder” as any entity or person beneficially owning 15% or more of the outstanding voting stock of the corporation and any entity or person affiliated with or controlling or controlled by such entity or person.
126
Table of Contents
SHARES ELIGIBLE FOR FUTURE SALE
Prior to this offering, there has been no market for our common stock. Upon completion of this offering, we will have an aggregate of shares of common stock outstanding, assuming no exercise of outstanding options and that the shares of common stock are offered at the midpoint of the range set forth on the cover page of this prospectus. All of the shares that we sell in this offering will be freely tradable without restriction or further registration under the Securities Act, except that any shares purchased by our affiliates, as that term is defined in Rule 144, may generally only be sold in compliance with the limitations of Rule 144, which is summarized below. The remaining %, or shares, of our common stock that are outstanding after this offering will be restricted shares under the terms of the Securities Act. All of these shares are subject to lock-up agreements as described in “Underwriting.” Restricted shares may be sold in the public market only if registered or if they qualify for an exemption from registration under Rules 144 or 701 promulgated under the Securities Act, which rules are summarized below.
To the extent that the initial public offering price is greater or less than the midpoint of the range set forth on the cover page of this prospectus, the number of shares to be sold by us will be adjusted upwards or downwards to maintain constant net proceeds to us of approximately $ million, and the aggregate number of shares to be sold by the selling stockholders will be adjusted downwards or upwards by an equal amount. See “Use of Proceeds.”
Sales of Restricted Securities
Restricted shares may be sold in the public market only if registered or if they qualify for an exemption from registration under Rule 144 or 701 promulgated under the Securities Act, each of which is summarized below.
The availability of Rule 144 will vary depending on whether restricted shares are held by an affiliate or a non-affiliate. Under Rule 144 as in effect on the date of this prospectus, once we have been a reporting company subject to the reporting requirements of Section 13 or Section 15(d) of the Exchange Act for 90 days, an affiliate who has beneficially owned restricted shares of our common stock for at least six months would be entitled to sell within any three-month period a number of shares that does not exceed the greater of either of the following:
| Ÿ | 1% of the number of shares of common stock then outstanding, which will equal shares immediately after this offering; and |
| Ÿ | the average weekly trading volume of our common stock during the four calendar weeks preceding the filing of a notice on Form 144 with respect to the sale. |
However, the six month holding period increases to one year in the event we have not been a reporting company for at least 90 days. In addition, any sales by affiliates under Rule 144 are also limited by manner of sale provisions and notice requirements and the availability of current public information about us.
The volume limitation, manner of sale and notice provisions described above will not apply to sales by non-affiliates. For purposes of Rule 144, a non-affiliate is any person or entity who is not our affiliate at the time of sale and has not been our affiliate during the preceding three months. Once we have been a reporting company for 90 days, a non-affiliate who has beneficially owned restricted shares of our common stock for six months may rely on Rule 144 provided that certain public information regarding us is available. The six month holding period increases to one year in the event we have not been a reporting company for at least 90 days. However, a non-affiliate who has beneficially owned the restricted shares proposed to be sold for at least one year will not be subject to any restrictions under Rule 144 regardless of how long we have been a reporting company.
127
Table of Contents
Under Rule 701, common stock acquired upon the exercise of certain currently outstanding options or pursuant to other rights granted under our stock plans may be resold, to the extent not subject to lock-up agreements, (1) by persons other than affiliates, beginning 90 days after the effective date of this offering, subject only to the manner-of-sale provisions of Rule 144, and (2) by affiliates, subject to the manner-of-sale, current public information and filing requirements of Rule 144, in each case, without compliance with the one-year holding period requirement of Rule 144.
Additional Registration Statements
We intend to file one or more registration statements under the Securities Act after this offering to register up to shares of our common stock underlying outstanding stock options or stock options reserved for issuance under the NewPage Group Incentive Plan. These registration statements will become effective upon filing, and shares covered by these registration statements will be eligible for sale in the public market immediately after the effective dates of these registration statements, subject to any limitations on exercise under the NewPage Group Incentive Plan and the lock-up agreements described in “Underwriting.”
Cerberus, SEO and certain of our executives have demand registration rights and incidental registration rights pursuant to the securityholders agreement. In addition, SEO has a one time right, exercisable after 180 days following consummation of this offering, to distribute pro rata all of our common stock then owned by SEO to SEO’s stockholders. See “Certain Relationships and Related Party Transactions—SEO Arrangements—Securityholders Agreement.”
Effects of Sales of Shares
No predictions can be made as to the effect, if any, that sales of shares of our common stock from time to time, or the availability of shares of our common stock for future sale, may have on the market price for shares of our common stock. Sales of substantial amounts of common stock, or the perception that such sales could occur, could adversely affect prevailing market prices for our common stock and could impair our future ability to obtain capital through an offering of equity securities.
128
Table of Contents
DESCRIPTION OF CERTAIN INDEBTEDNESS
The following is a summary of the material provisions of the instruments evidencing our material indebtedness. It does not include all of the provisions of our material indebtedness, copies of which have been or will be filed as exhibits to our Registration Statement filed in connection with this offering.
Senior Secured Credit Facilities
On December 21, 2007, NewPage Corporation entered into a $500 million senior secured revolving credit facility and $1,600 million senior secured term loan credit facility with Goldman Sachs Credit Partners L.P., as administrative agent, and the other parties thereto.
Structure. The senior secured credit facilities consist of:
| Ÿ | a senior secured term loan, or senior term facility, of $1,600 million, and |
| Ÿ | a senior secured revolving credit facility, or revolving facility, of $500 million. |
The full amount of the senior term facility was drawn in a single drawing at the closing of the Acquisition at an initial interest rate of LIBOR plus 3.75% per annum and was used to pay a portion of the cash price of the Acquisition, to repay certain intercompany indebtedness of SENA and to pay related fees and expenses. As of June 30, 2008, we had $425 million available for borrowing under the revolving senior secured credit facility, after reduction for $72 million in letters of credit, and there were no borrowings outstanding under the revolving senior secured credit facility as of that date. Subject to customary conditions, amounts available under the revolving facility may be borrowed, repaid and reborrowed on or after the closing until the maturity date thereof. The revolving facility may be utilized to fund our working capital, to fund permitted acquisitions and capital expenditures and for other general corporate purposes. A portion of the revolving facility may be made available in the form of swing line loans or for the issuance of letters of credit. The maximum amount that may be borrowed and outstanding at any time under the revolving facility (including undrawn letters of credit) may not exceed a borrowing base, as described below.
Borrowing Base. The amount of loans and letters of credit available to us pursuant to the revolving facility is limited to the lesser of $500 million, or an amount determined pursuant to a borrowing base. The borrowing base at any time will be equal to 85% of the book value of eligible account receivables, plus the lesser of (i) 75% of the lower of cost or market value of eligible inventory or (ii) 85% of the net recovery cost percentage of such eligible inventory, minus certain reserves established by the administrative or collateral agent under the revolving facility. The administrative agent and, as applicable, the collateral agent has the right to change these advance rates under certain circumstances. The eligibility of accounts receivable and inventory for inclusion in the borrowing base is determined in accordance with certain customary criteria specified pursuant to the revolving facility. For purposes of the borrowing base, “net recovery cost percentage” is the percentage determined by dividing the amount that would be recovered in an orderly liquidation of the inventory, as determined from the most recent inventory appraisal conducted under the terms of the revolving facility, by the cost of the inventory covered by such appraisal. The terms of the revolving facility provide that such appraisals will be conducted annually, and more frequently at the collateral agent’s request if an event of default exists.
Maturity, Amortization and Prepayment. The senior term facility has a maturity of the first to occur of (i) the seventh anniversary of the closing of the Acquisition and (ii) the date that is 181 days prior to the scheduled maturity date of the NewPage Corporation Notes and any refinancing thereof
129
Table of Contents
and will amortize in equal quarterly installments in an aggregate annual amount equal to 1.00% of the original principal amount of the senior term facility. Unless terminated earlier, the revolving facility has a maturity of the first to occur of (i) the fifth anniversary of the closing of the Acquisition and (ii) the date that is 181 days prior to the scheduled maturity date of the and any refinancing thereof.
The senior term facility is subject to mandatory prepayment with, in general: (i) 100% of the net cash proceeds of certain asset sales, subject to certain exceptions and reinvestment rights; (ii) 100% of the net cash proceeds of certain insurance and condemnation payments, subject to certain reinvestment rights; (iii) 100% of the net cash proceeds of debt incurrences (other than debt incurrences permitted under the term facility); and (iv) 50% of our excess cash flow, as defined in the senior secured credit facilities (declining in stages to zero, in accordance with a leverage ratio test).
The revolving facility is subject to mandatory prepayment and the letters of credit will be cash collateralized or replaced to the extent that such extensions of credit exceed (i) the maximum revolver amount or (ii) the then-current borrowing base.
Interest. The loans under the senior term facility bear interest, at our option, at a rate per annum equal to either: (i) the base rate (as defined in our senior secured credit facilities), plus an applicable margin, or (ii) the adjusted Eurodollar rate (as defined in our senior secured credit facilities), plus an applicable margin. Amounts outstanding under our revolving facility will bear interest, at our option, at a rate per annum equal to either: (i) the base rate, plus an applicable margin, or (ii) the adjusted Eurodollar rate, plus an applicable margin. Beginning on the date we deliver financial statements and a compliance certificate for the first full fiscal quarter following the closing of the senior secured credit facilities, the applicable margin for the revolving facility is subject to adjustment based on the achievement of certain leverage ratios. The loans and other amounts not paid when due under the senior secured credit facilities bear interest at the rate otherwise applicable plus an additional 2% per annum during the continuance of such payment event of default.
Guarantees and Security. The senior secured credit facilities are guaranteed by NewPage Holding and each of its existing and future direct and indirect subsidiaries, including foreign subsidiaries (but only to the extent that a guarantee by a foreign subsidiary is not prohibited by applicable law), other than CWPCo. In addition, securitization entities, regulated entities and any utility holding companies are not required to deliver guarantees under the senior secured credit facilities. Subject to certain customary exceptions, NewPage Corporation and each of the guarantors granted to the lenders under the revolving facility a first priority security interest in and lien on their present and future cash, deposit accounts, domestic accounts receivable, inventory and intercompany debt owed to NewPage Corporation and each of the guarantors. Subject to certain customary exceptions, NewPage Corporation and each of the guarantors granted to the lenders under the term facility (i) a first priority security interest in and lien on substantially all of NewPage Corporation’s and each of the guarantors’ present and future property and assets (other than cash, deposit accounts, domestic accounts receivable, inventory and intercompany debt owed to NewPage Corporation and each of the guarantors), including the capital stock of NewPage Holding’s domestic subsidiaries and 65% of the capital stock of NewPage Holding’s foreign subsidiaries, if any, as well as NewPage Corporation’s capital stock owned by NewPage Holding and (ii) a second priority security interest in and lien on NewPage Corporation’s and each of the guarantors’ present and future cash, deposit accounts, domestic accounts receivable, inventory and intercompany debt owed to NewPage Corporation and each of the guarantors.
Fees. Certain customary fees are payable to the lenders and the agents under the senior secured credit facilities, including, without limitation, a commitment fee on the unused amount of the revolving facility (with the percentage for such fee fluctuating based on certain leverage ratios to be determined) and letter of credit fees and issuer fronting fees.
130
Table of Contents
Covenants. The senior secured credit facilities contain various customary affirmative and negative covenants (subject to customary exceptions), including, but not limited to, restrictions on our ability and the ability of NewPage Holding and its subsidiaries to (i) dispose of assets, (ii) incur additional indebtedness and guarantee obligations (iii) repay other indebtedness, (iv) pay certain restricted payments and dividends, (v) create liens on assets or agree to restrictions on the creation of liens on assets, (vi) make investments, loans or advances, (vii) restrict distributions from our subsidiaries, (viii) make certain acquisitions, (ix) engage in mergers or consolidations, (x) enter into sale and leaseback transactions, (xi) engage in certain transactions with subsidiaries of NewPage Corporation that are not guarantors of the senior secured credit facilities or with affiliates or (xii) amend the terms of the NewPage Corporation Notes. In addition, as discussed below, under the senior term facility (and under the revolving facility to the extent that the unused borrowing availability under the revolving facility plus excess cash are below $50 million for 10 consecutive business days), NewPage Corporation will be required to comply with certain financial ratios and tests as follows:
| Ÿ | Minimum Interest Coverage Ratio. The interest coverage ratio is the ratio of NewPage Corporation’s consolidated adjusted EBITDA (as defined in the senior secured credit facilities) to NewPage Corporation’s consolidated cash interest expense (as defined in the senior secured credit facilities) for the trailing four quarters. |
| Ÿ | Fixed Charge Coverage Ratio. The fixed charge coverage ratio is the ratio of NewPage Corporation’s consolidated adjusted EBITDA to NewPage Corporation’s consolidated fixed charges (as defined in the senior secured credit facilities) for the trailing four quarters. |
| Ÿ | Total Leverage Ratio. The total leverage ratio is the ratio of NewPage Corporation’s consolidated total debt (as defined in the senior secured credit facilities) to NewPage Corporation’s consolidated adjusted EBITDA for the trailing four quarters. |
| Ÿ | Senior Leverage Ratio. The senior leverage ratio is the ratio of NewPage Corporation’s consolidated senior debt (as defined in the senior secured credit facilities) to NewPage Corporation’s consolidated adjusted EBITDA for the trailing four quarters. |
| Ÿ | Capital Expenditures. Capital expenditures are expenditures that are required by generally accepted accounting principles to be reflected in NewPage Corporation’s financial statements in the purchase of property and equipment. NewPage Corporation’s annual capital expenditures will not be permitted to exceed certain specified amounts. |
Consolidated adjusted EBITDA, as used in our senior credit facilities, is defined as EBITDA for the relevant period, as adjusted primarily by (a) adding the following amounts, to the extent deducted in computing consolidated net income for such period: (1) goodwill impairment charges, (2) non-cash compensation charges related to equity-based compensation, (3) transaction costs associated with the Acquisition, the senior secured credit facilities, this offering and the related refinancing of our prior senior secured credit facilities, and future permitted acquisitions, (4) non-cash expenses in addition to depreciation and amortization, (5) non-recurring charges in connection with any integration or restructuring related to the Acquisition or future permitted acquisitions or in connection with plant closings or the permanent shutdown or transfer of production equipment, (6) extraordinary losses, (7) net losses from certain asset sales, (8) pre-closing non-inventoried overhead costs incurred in connection with a certain plant lock-out, and (9) pre-closing costs, charges or expenses of SENA that will not be recurring after the Acquisition; and (b) deducting non-cash items increasing consolidated net income for such period.
Events of Default. The senior secured credit facilities contain customary events of default (subject to customary exceptions, thresholds and grace periods), including, without limitation: (i) nonpayment of principal or interest; (ii) failure to perform or observe covenants; (iii) inaccuracy or breaches of representations and warranties; (iv) cross-defaults with certain other indebtedness;
131
Table of Contents
(v) certain bankruptcy related events; (vi) impairment of security interests in collateral; (vii) invalidity of guarantees; (viii) monetary judgment defaults; (ix) certain ERISA matters and (x) certain change of control events.
NewPage Corporation Senior Secured Notes due 2012
NewPage Corporation issued $350 million in aggregate principal amount of 10% senior secured notes due 2012 on May 2, 2005 and $456 million in aggregate principal amount of 10% senior secured notes due 2012 on December 21, 2007 in connection with the Acquisition, which we collectively refer to as the “10% senior secured notes,” and $225 million in aggregate principal amount of floating rate senior secured notes due 2012 on May 2, 2005, which we refer to as the “floating rate senior secured notes,” and, together with the 10% senior secured notes, as the “senior secured 2012 notes.”
The following is a summary of the material terms of the senior secured notes and the indentures governing such notes. This description does not purport to be complete and is qualified in its entirely by reference to the provisions of the senior secured note indentures, the collateral trust agreement and the intercreditor agreement.
Maturity and Interest. Each of the senior secured notes will mature on May 1, 2012. Interest on the 10% senior secured notes accrues at the rate of 10% per annum and is payable semi-annually. Interest on the floating rate senior secured notes accrues at a rate per annum, reset quarterly, equal to LIBOR plus 6.25% and is payable quarterly.
Guarantees. The senior secured notes are guaranteed by NewPage Port Hawkesbury Limited and each of NewPage Corporation’s current and future domestic subsidiaries, other than CWPCo.
Security. The senior secured notes and the related subsidiary guarantees are secured equally and ratably by second priority liens on substantially all of the assets of NewPage Corporation and its subsidiaries, other than cash deposit accounts, accounts receivables, inventory, the stock of NewPage Corporation’s subsidiaries and intercompany debt. These liens will be junior in priority to the liens securing the senior secured credit facilities of NewPage Corporation. Matters relating to certain intercreditor issues relating to the priority, enforcement and other rights relating to the collateral including the order in which the proceeds from the collateral will be distributed, are governed under the collateral trust agreement and the intercreditor agreement.
Optional Redemption. At any time on or after May 1, 2009, NewPage Corporation may redeem some or all of the senior secured notes at specified redemption prices. At any time prior to May 1, 2009, NewPage Corporation may redeem some or all of the fixed rate senior secured notes at a price equal to 100% of the principal amount of the fixed rate notes plus a make-whole premium.
Mandatory Redemption. NewPage Corporation is not required to make mandatory redemption or sinking fund payments with respect to the senior secured notes.
Repurchase of Senior Secured Notes at the Option of Holders. If NewPage Corporation sells certain assets without applying the proceeds in a specified manner, or experiences certain change of control events, each holder of the senior secured notes may require NewPage Corporation to repurchase all or a portion of its senior secured notes.
Covenants. The senior secured notes indentures contain various customary negative covenants (subject to customary exceptions and certain existing obligations and liabilities), including restrictions on NewPage Corporation’s ability and the ability of its subsidiaries (i) to pay dividends and make
132
Table of Contents
certain payments or investments, (ii) to incur indebtedness, (iii) to allow liens to exist, (iv) to restrict any subsidiaries of NewPage Corporation from paying dividends or making certain other payments to NewPage Corporation or its subsidiaries, (v) to merge, consolidate or sell assets and (v) to enter into transactions with affiliates.
Events of Default. The senior secured note indentures contain various events of default including, among others, the following events of default (subject to customary exceptions, thresholds and grace periods):
(1) default for 30 days in the payment when due of interest on, or special interest (as defined in the indenture), if any, with respect to, the notes, or failure to issue any additional notes within 30 days after such interest is deemed paid;
(2) default in the payment when due (at maturity, upon redemption or otherwise) of the principal of, or premium, if any, on, the notes;
(3) failure by NewPage Corporation or any of its restricted subsidiaries (as defined in the indenture) for 30 days after notice to us by the trustee or the holders of at least 25% in aggregate principal amount of the notes then outstanding to comply with certain change of control, asset sales, merger and consolidation provisions;
(4) failure by NewPage Corporation or any of its restricted subsidiaries for 60 days after notice to NewPage Corporation by the trustee or the holders of at least 25% in aggregate principal amount of the notes then outstanding to comply with any of the other agreements in the indenture;
(5) default under any mortgage, indenture or instrument under which there may be issued or by which there may be secured or evidenced any indebtedness for money borrowed by NewPage Corporation, any of its restricted subsidiaries that is a significant subsidiary (as defined in the indenture) or any group of its restricted subsidiaries that, taken together, would constitute a significant subsidiary (or the payment of which is guaranteed by NewPage Corporation, any of its restricted subsidiaries that is a significant subsidiary or any group of its restricted subsidiaries that, taken together, would constitute a significant subsidiary), whether such indebtedness or guarantee (as defined in the indenture) now exists, or is created after the date of the indenture, if that default results in the acceleration of such indebtedness prior to its express maturity or the failure to pay such indebtedness at maturity and the principal amount of any such indebtedness, together with the principal amount of any other such indebtedness the maturity of which has been so accelerated or which has not been paid at maturity, aggregates $25 million or more;
(6) failure by NewPage Corporation, any of its restricted subsidiaries that is a significant subsidiary or any group of its restricted subsidiaries that, taken together, would constitute a significant subsidiary to pay final and non-appealable judgments entered by a court or courts of competent jurisdiction aggregating in excess of $25 million (net of any amounts covered by insurance or pursuant to which we are indemnified to the extent that the third party under such agreement acknowledges its obligations thereunder), which judgments are not paid, discharged or stayed for a period of 60 days and, in the event such judgment is covered by insurance, an enforcement proceeding has been commenced by any creditor upon such judgment or decree that is not promptly stayed;
(7) certain events of bankruptcy or insolvency described in the indenture with respect to NewPage Corporation or any of its restricted subsidiaries that is a significant subsidiary or any group of its restricted subsidiaries that, taken together, would constitute a significant subsidiary;
(9) any security document is held to be unenforceable ceases for any reason to be in full force or effect;
(10) any subsidiary guarantee guaranteeing the senior secured notes is held to be unenforceable or ceases for any reason to be in full force and effect, or any guarantor of NewPage Corporation, or
133
Table of Contents
any person acting on behalf of any such guarantor, denies or disaffirms its obligations under its guarantee; and
(11) NewPage Corporation or any of its subsidiaries acquires or retires for value any of the senior secured 2012 notes other than with the proceeds of a sale of the common equity of NewPage Holding or a contribution to the common equity capital of NewPage Holding (other than from NewPage Corporation or one of its subsidiaries).
NewPage Corporation Senior Subordinated Notes due 2013
On May 2, 2005, NewPage Corporation issued $200 million in aggregate principal amount of senior subordinated notes due 2013, which we refer to as the “senior subordinated notes.”
The following is a summary of the material terms of the senior subordinated notes and the indenture governing such notes. This description does not purport to be complete and is qualified in its entirely by reference to the provisions of the senior subordinated note indenture.
Maturity and Interest. The senior subordinated notes will mature on May 1, 2013. Interest on the senior subordinated notes accrues at the rate of 12% per annum and is payable semi-annually.
Guarantees and security. The senior subordinated notes are guaranteed by NewPage Port Hawkesbury Limited and each of NewPage Corporation’s current and future domestic subsidiaries, other than CWPCo. The senior subordinated notes are unsecured.
Subordination. The payments on the senior subordinated notes are subordinated to the prior payment in full of all of NewPage Corporation’s present and future senior indebtedness.
Optional Redemption. At any time on or after May 1, 2009, NewPage Corporation may redeem some or all of the senior subordinated notes at specified redemption prices. At any time prior to May 1, 2009, NewPage Corporation may redeem some or all of the senior subordinated notes at a price equal to 100% of the principal amount of the senior subordinated notes plus a make-whole premium.
Mandatory Redemption. NewPage Corporation is not required to make mandatory redemption or sinking fund payments with respect to the senior subordinated notes.
Repurchase of Senior Subordinated Notes at the Option of Holders. If NewPage Corporation sells certain assets without applying the proceeds in a specified manner, or experiences certain change of control events, each holder of the senior subordinated notes may require NewPage Corporation to repurchase all or a portion of its senior subordinated notes.
Covenants. The senior subordinated notes indenture contains various customary negative covenants (subject to customary exceptions and certain existing obligations and liabilities), including restrictions on NewPage Corporation’s ability and the ability of its subsidiaries (i) to pay dividends and make certain payments or investments, (ii) to incur indebtedness, (iii) to incur any indebtedness that is contractually subordinate to any senior indebtedness of NewPage Corporation and senior to the senior subordinated notes, (iv) to allow liens to exist, (v) to restrict any subsidiaries of NewPage Corporation from paying dividends or making certain other payments to NewPage Corporation or its subsidiaries, (vi) to merge, consolidate or sell assets and (vii) to enter into transactions with affiliates.
Events of Default. The senior subordinated note indenture contains various events of default substantially similar to those contained in the indenture governing the senior secured notes due 2012.
134
Table of Contents
CERTAIN MATERIAL U.S. FEDERAL INCOME AND ESTATE TAX CONSIDERATIONS
The following discussion summarizes the material United States Federal income and estate tax consequences of the ownership and disposition of common stock by a Non-U.S. Holder (as defined below) as of the date hereof. This discussion does not address all aspects of United States Federal income and estate taxes and does not deal with foreign, state and local consequences that may be relevant to such Non-U.S. Holders in light of their personal circumstances. Special rules may apply to certain Non-U.S. Holders, such as United States expatriates, “controlled foreign corporations,” “passive foreign investment companies,” corporations that accumulate earnings to avoid United States Federal income tax, and investors in pass-through entities that are subject to special treatment under the Internal Revenue Code of 1986, as amended, or the Code. Such Non-U.S. Holders are urged to consult their own tax advisors to determine the United States Federal, state, local and other tax consequences that may be relevant to them. Furthermore, the discussion below is based upon the provisions of the Code, and regulations, rulings and judicial decisions thereunder as of the date hereof, and such authorities may be repealed, revoked or modified, perhaps retroactively, so as to result in United States Federal income tax consequences different from those discussed below. If a partnership holds the common stock, the tax treatment of a partner will generally depend upon the status of the partner and the activities of the partnership. Persons who are partners of partnerships holding common stock are urged to consult their tax advisors. As used in this discussion, the term “Non-U.S. Holder” means a beneficial owner of common stock that is, for United States Federal income tax purposes:
| Ÿ | a nonresident alien individual, |
| Ÿ | a foreign corporation, |
| Ÿ | an estate whose income is not subject to United States Federal income tax on a net income basis, or |
| Ÿ | a trust, if no court within the United States is able to exercise primary jurisdiction over its administration or if no United States persons have the authority to control all of its substantial decisions an no election was made by the trust to be treated as a United States person under applicable United States Treasury regulations. |
Dividends
Distributions, if any, made to a Non-U.S. Holder out of our current or accumulated earnings and profits (as defined for U.S. federal income tax purposes) will constitute dividends for U.S. tax purposes. Dividends paid to a Non-U.S. Holder generally will be subject to withholding of United States Federal income tax at a 30% rate or such lower rate as may be specified by an applicable income tax treaty. However, dividends that are effectively connected with the conduct of a trade or business by the Non-U.S. Holder within the United States and, where a tax treaty applies, are attributable to a United States permanent establishment of the Non-U.S. Holder, are not subject to the withholding tax, but instead are subject to United States Federal income tax on a net income basis at the applicable graduated individual or corporate rates. A Non-U.S. Holder generally will be required to provide a properly executed Internal Revenue Service, or IRS, Form W-8ECI to establish that any dividends that constitute effectively connected income are exempt from withholding. Any such effectively connected dividends received by a foreign corporation may be subject to an additional “branch profits tax” at a 30% rate or such lower rate as may be specified by an applicable income tax treaty. To the extent distributions exceed our current and accumulated earnings and profits (as defined for U.S. federal income tax purposes), they will constitute a return of capital and will first reduce the Non-U.S. Holder’s basis in our common stock, but not below zero, and then will be treated as gain from the sale of stock.
A Non-U.S. Holder that wishes to claim the benefit of an applicable treaty rate for dividends will be required to (a) complete IRS Form W-8BEN (or other applicable form) and certify under penalties of
135
Table of Contents
perjury that such holder is entitled to the treaty rate and/or (b) satisfy the relevant certification requirements of applicable United States Treasury regulations if the common stock is held through certain foreign pass through entities or intermediaries.
A Non-U.S. Holder eligible for a reduced rate of United States withholding tax pursuant to an income tax treaty may obtain a refund of any excess amounts withheld by filing an appropriate claim for refund with the IRS.
Gain on Disposition of Common Stock
A Non-U.S. Holder generally will not be subject to United States Federal income tax with respect to gain recognized on a sale or other disposition of common stock unless (i) the gain is effectively connected with a trade or business of the Non-U.S. Holder in the United States, and, where a tax treaty applies, is attributable to a United States permanent establishment of the Non-U.S. Holder, (ii) in the case of a Non-U.S. Holder who is an individual and holds the common stock as a capital asset, such holder is present in the United States for 183 or more days in the taxable year of the sale or other disposition and certain other conditions are met, or (iii) our common stock constitutes a United States real property interest by reason of our status as a “United States real property holding corporation”, or USRPHC, for United States Federal income tax purposes at any time within the shorter of the five-year period preceding the sale or disposition or the holder’s holding period for our common stock.
We believe we are not, have not been and do not anticipate becoming, a USRPHC for United States Federal income tax purposes. However, because the determination of whether we are a USRPHC depends on the fair market value of our United States real property interests relative to the fair market value of our other business assets, there can be no assurance that we will not become a USRPHC in the future. Even if we become a USRPHC, however, as long as our common stock is regularly traded on an established securities market, such common stock will be treated as United States real property interests only if the non-United States holder actually or constructively held more than 5 percent of such regularly traded common stock.
An individual Non-U.S. Holder described in clause (i) above will be subject to tax on the net gain derived from the sale under regular graduated United States Federal income tax rates. An individual Non-U.S. Holder described in clause (ii) above will be subject to a flat 30% tax on the gain derived from the sale, which may be offset by United States source capital losses (even though the individual is not considered a resident of the United States). If a Non-U.S. Holder that is a foreign corporation falls under clause (i) above, it will be subject to tax on its gain under regular graduated United States Federal income tax rates and, in addition, may be subject to the branch profits tax equal to 30% of its effectively connected earnings and profits or at such lower rate as may be specified by an applicable income tax treaty.
Federal Estate Tax
Common stock held by an individual Non-U.S. Holder at the time of death will be included in such holder’s gross estate for United States Federal estate tax purposes unless an applicable estate tax treaty provides otherwise.
Information Reporting and Backup Withholding
We must report annually to the IRS and to each Non-U.S. Holder the amount of dividends paid to such holder and the tax withheld with respect to such dividends, regardless of whether withholding was required. Copies of the information returns reporting such dividends and withholding may also be made available to the tax authorities in the country in which the Non-U.S. Holder resides under the provisions of an applicable income tax treaty.
136
Table of Contents
A Non-U.S. Holder will be subject to backup withholding on payments of dividends unless it certifies under penalties of perjury that it is a Non-U.S. Holder (and the payor does not have actual knowledge or reason to know that the beneficial owner is a United States person) or the holder otherwise establishes an exemption.
Information reporting and, depending on the circumstances, backup withholding, will apply to the proceeds of a sale of common stock within the United States or conducted through United States related financial intermediaries unless the beneficial owner certifies under penalties of perjury that it is a Non-U.S. Holder (and the payor does not have actual knowledge or reason to know that the beneficial owner is a United States person) or the holder otherwise establishes an exemption.
Any amounts withheld under the backup withholding rules may be allowed as a refund or a credit against such holder’s United States Federal income tax liability provided the required information is furnished to the IRS.
137
Table of Contents
NewPage Group, the selling stockholders and Goldman, Sachs & Co. have entered into an underwriting agreement with respect to the shares being offered. Subject to certain conditions, the underwriter has agreed to purchase shares from us and shares from the selling stockholders.
The underwriter is committed to take and pay for all of the shares being offered, if any are taken, other than the shares covered by the option described below unless and until this option is exercised.
If the underwriter sells more shares than the total number set forth above, the underwriter has an option to buy up to an additional �� shares from the selling stockholders to cover such sales. The underwriter may exercise that option for 30 days.
The following tables show the per share and total underwriting discounts and commissions to be paid to the underwriter by NewPage Group and the selling stockholders. Such amounts are shown assuming both no exercise and full exercise of the underwriter’s option to purchase additional shares.
Paid by the Company
| No Exercise | Full Exercise | |||||
Per share | $ | $ | ||||
Total | $ | $ | ||||
Paid by the Selling Stockholders
| No Exercise | Full Exercise | |||||
Per share | $ | $ | ||||
Total | $ | $ | ||||
Shares sold by the underwriter to the public will initially be offered at the initial public offering price set forth on the cover of this prospectus. Any shares sold by the underwriter to securities dealers may be sold at a discount of up to $ per share from the initial public offering price. Any such securities dealers may resell any shares purchased from the underwriter to certain other brokers or dealers at a discount of up to $ per share from the initial public offering price. If all the shares are not sold at the initial public offering price, the underwriter may change the offering price and the other selling terms.
We and our officers, directors and holders of substantially all of our common stock, including the selling stockholders, have agreed with the underwriter, subject to certain exceptions, not to dispose of or hedge any of their common stock or securities convertible into or exchangeable for shares of common stock during the period from the date of this prospectus continuing through the date 180 days after the date of this prospectus, except with the prior written consent of the underwriter. This agreement does not apply to any existing employee benefit plans. See “Shares Eligible for Future Sale” for a discussion of certain transfer restrictions. The offering of the shares by the underwriter is subject to receipt and acceptance and subject to the underwriter’s right to reject any order in whole or in part.
The 180-day restricted period described in the preceding paragraph will be automatically extended if: (1) during the last 17 days of the 180-day restricted period we issue an earnings release or announce material news or a material event; or (2) prior to the expiration of the 180-day restricted period, the Company announces that it will release earnings results during the 15-day period following
138
Table of Contents
the last day of the 180-day period, in which case the restrictions described in the preceding paragraph will continue to apply until the expiration of the 18-day period beginning on the issuance of the earnings release or the announcement of the material news or material event.
Prior to the offering, there has been no public market for the shares. The initial public offering price has been negotiated between us, the selling stockholders and the underwriter. Among the factors to be considered in determining the initial public offering price of the shares, in addition to prevailing market conditions, are our historical performance, estimates of our business potential and earnings prospects, an assessment of our management and the consideration of the above factors in relation to market valuation of companies in related businesses.
We intend to apply to list the common stock on the New York Stock Exchange under the symbol “NWP,” In order to meet one of the requirements for listing the common stock on the NYSE, the underwriter will undertake to sell lots of 100 or more shares to a minimum of 2,000 beneficial holders.
In connection with the offering, the underwriter may purchase and sell shares of common stock in the open market. These transactions may include short sales, stabilizing transactions and purchases to cover positions created by short sales. Short sales involve the sale by the underwriter of a greater number of shares than they are required to purchase in the offering. “Covered” short sales are sales made in an amount not greater than the underwriter’s option to purchase additional shares from the selling stockholders in the offering. The underwriter may close out any covered short position by either exercising their option to purchase additional shares or purchasing shares in the open market. In determining the source of shares to close out the covered short position, the underwriter will consider, among other things, the price of shares available for purchase in the open market as compared to the price at which they may purchase additional shares pursuant to the option granted to them. “Naked” short sales are any sales in excess of such option. The underwriter must close out any naked short position by purchasing shares in the open market. A naked short position is more likely to be created if the underwriter is concerned that there may be downward pressure on the price of the common stock in the open market after pricing that could adversely affect investors who purchase in the offering. Stabilizing transactions consist of various bids for or purchases of common stock made by the underwriter in the open market prior to the completion of the offering.
Purchases to cover a short position and stabilizing transactions, as well as other purchases by the underwriter for its own account, may have the effect of preventing or retarding a decline in the market price of our stock and may stabilize, maintain or otherwise affect the market price of the common stock. As a result, the price of the common stock may be higher than the price that otherwise might exist in the open market. If these activities are commenced, they may be discontinued at any time. These transactions may be effected on NYSE, in the over-the-counter market or otherwise.
In relation to each member state of the European Economic Area which has implemented the Prospectus Directive (each, a Relevant Member State), each underwriter has represented and agreed that with effect from and including the date on which the Prospectus Directive is implemented in that Relevant Member State (the Relevant Implementation Date) it has not made and will not make an offer of shares to the public in that Relevant Member State prior to the publication of a prospectus in relation to the shares which has been approved by the competent authority in that Relevant Member State or, where appropriate, approved in another Relevant Member State and notified to the competent authority in that Relevant Member State, all in accordance with the Prospectus Directive, except that it may, with effect from and including the Relevant Implementation Date, make an offer of shares to the public in that Relevant Member State at any time:
(a) to legal entities which are authorised or regulated to operate in the financial markets or, if not so authorised or regulated, whose corporate purpose is solely to invest in securities;
139
Table of Contents
(b) to any legal entity which has two or more of (1) an average of at least 250 employees during the last financial year; (2) a total balance sheet of more than€43,000,000 and (3) an annual net turnover of more than€50,000,000, as shown in its last annual or consolidated accounts;
(c) to fewer than 100 natural or legal persons (other than qualified investors as defined in the Prospectus Directive) subject to obtaining the prior consent of the representatives for any such offer; or
(d) in any other circumstances which do not require the publication by the issuer of a prospectus pursuant to Article 3 of the Prospectus Directive.
For the purposes of this provision, the expression an “offer of shares to the public” in relation to any shares in any Relevant Member State means the communication in any form and by any means of sufficient information on the terms of the offer and the shares to be offered so as to enable an investor to decide to purchase or subscribe the shares, as the same may be varied in that Relevant Member State by any measure implementing the Prospectus Directive in that Relevant Member State and the expression Prospectus Directive means Directive 2003/71/EC and includes any relevant implementing measure in each Relevant Member State.
The underwriter has represented and agreed that:
(a) it has only communicated or caused to be communicated and will only communicate or cause to be communicated an invitation or inducement to engage in investment activity (within the meaning of section 21 of the Financial Services and Markets Act 2000 (as amended) (FSMA)) to persons who have professional experience in matters relating to investments falling within Article 19(5) of the Financial Services and Markets Act 2000 (Financial Promotion) Order 2005 or in circumstances in which section 21 of FSMA does not apply to us; and
(b) it has complied with, and will comply with all applicable provisions of FSMA with respect to anything done by it in relation to the shares in, from or otherwise involving the United Kingdom.
The shares may not be offered or sold by means of any document other than (i) in circumstances which do not constitute an offer to the public within the meaning of the Companies Ordinance (Cap.32, Laws of Hong Kong), or (ii) to “professional investors” within the meaning of the Securities and Futures Ordinance (Cap.571, Laws of Hong Kong) and any rules made thereunder, or (iii) in other circumstances which do not result in the document being a “prospectus” within the meaning of the Companies Ordinance (Cap.32, Laws of Hong Kong), and no advertisement, invitation or document relating to the shares may be issued or may be in the possession of any person for the purpose of issue (in each case whether in Hong Kong or elsewhere), which is directed at, or the contents of which are likely to be accessed or read by, the public in Hong Kong (except if permitted to do so under the laws of Hong Kong) other than with respect to shares which are or are intended to be disposed of only to persons outside Hong Kong or only to “professional investors” within the meaning of the Securities and Futures Ordinance (Cap. 571, Laws of Hong Kong) and any rules made thereunder.
This prospectus has not been registered as a prospectus with the Monetary Authority of Singapore. Accordingly, this prospectus and any other document or material in connection with the offer or sale, or invitation for subscription or purchase, of the shares may not be circulated or distributed, nor may the shares be offered or sold, or be made the subject of an invitation for subscription or purchase, whether directly or indirectly, to persons in Singapore other than (i) to an institutional investor under Section 274 of the Securities and Futures Act, Chapter 289 of Singapore (the “SFA”), (ii) to a relevant person, or any person pursuant to Section 275(1A), and in accordance with the conditions, specified in Section 275 of the SFA or (iii) otherwise pursuant to, and in accordance with the conditions of, any other applicable provision of the SFA.
140
Table of Contents
Where the shares are subscribed or purchased under Section 275 by a relevant person which is: (a) a corporation (which is not an accredited investor) the sole business of which is to hold investments and the entire share capital of which is owned by one or more individuals, each of whom is an accredited investor; or (b) a trust (where the trustee is not an accredited investor) whose sole purpose is to hold investments and each beneficiary is an accredited investor, shares, debentures and units of shares and debentures of that corporation or the beneficiaries’ rights and interest in that trust shall not be transferable for 6 months after that corporation or that trust has acquired the shares under Section 275 except: (1) to an institutional investor under Section 274 of the SFA or to a relevant person, or any person pursuant to Section 275(1A), and in accordance with the conditions, specified in Section 275 of the SFA; (2) where no consideration is given for the transfer; or (3) by operation of law.
The securities have not been and will not be registered under the Securities and Exchange Law of Japan (the Securities and Exchange Law) and each underwriter has agreed that it will not offer or sell any securities, directly or indirectly, in Japan or to, or for the benefit of, any resident of Japan (which term as used herein means any person resident in Japan, including any corporation or other entity organized under the laws of Japan), or to others for re-offering or resale, directly or indirectly, in Japan or to a resident of Japan, except pursuant to an exemption from the registration requirements of, and otherwise in compliance with, the Securities and Exchange Law and any other applicable laws, regulations and ministerial guidelines of Japan.
The underwriter does not expect sales to discretionary accounts to exceed five percent of the total number of shares offered. Sales of shares outside the United States may be made by affiliates of the underwriter.
We estimate that our share of the total expenses of the offering, excluding underwriting discounts and commissions, will be approximately $ million.
We and the selling stockholders have agreed to indemnify the underwriter against certain liabilities, including liabilities under the Securities Act of 1933.
The underwriter and its affiliates have, from time to time, performed, and may in the future perform, various financial advisory and investment banking services for the Company, for which they received or will receive customary fees and expenses. An affiliate of Goldman, Sachs & Co. is the sole lead arranger, sole bookrunner and administrative agent and a lender under NewPage Corporation’s senior secured credit facilities for which it receives customary fees and expenses. Goldman, Sachs & Co. acted as initial purchasers of NewPage Corporation’s senior secured notes in 2005 and 2007 and senior subordinated notes in 2005, for which services they received customary discounts and commissions. An affiliate of Goldman, Sachs & Co. received customary fees and expenses from interest rate swap transactions entered into with NewPage Corporation in 2005 and 2008.
141
Table of Contents
The validity of the shares of common stock offered hereby will be passed upon for us by Schulte Roth & Zabel LLP, New York, New York. Certain legal matters relating to this offering will be passed upon for the underwriter by Latham & Watkins LLP, New York, New York.
The consolidated financial statements of NewPage Group Inc. and its subsidiaries as of December 31, 2006 and 2007 and for the eight months ended December 31, 2005 and the years ended December 31, 2006 and 2007 and the financial statements of the printing and writing papers business (a business of MeadWestvaco Corporation) for the four months ended April 30, 2005, included in this prospectus, have been so included in reliance on the reports of PricewaterhouseCoopers LLP, an Independent Registered Public Accounting Firm, given on the authority of said firm as experts in auditing and accounting.
The financial statements of Stora Enso North America Inc. as of December 31, 2005 and 2006 and for the years ended December 31, 2004, 2005 and 2006 included in this prospectus, have been so included in reliance on the reports of PricewaterhouseCoopers LLP, Independent Auditors, given on the authority of said firm as experts in auditing and accounting.
WHERE YOU CAN FIND MORE INFORMATION
We have filed with the SEC a registration statement on Form S-1 under the Securities Act to register our common stock being offered in this prospectus. This prospectus, which forms part of the registration statement, does not contain all the information included in the registration statement and the amendments, exhibits and schedules thereto. For further information about us and the common stock being offered in this prospectus, we refer you to the registration statement and the exhibits and schedules thereto. We will file reports, proxy statements and other information with the SEC. Our SEC filings and the registration statement and the exhibits and schedules thereto may be inspected and copied at the SEC’s Public Reference Room, 100 F Street, N.E., Washington, D.C. 20549. The SEC also maintains an Internet site (http://www.sec.gov) that contains our SEC filings. Statements made in this prospectus about legal documents may not necessarily be complete and you should read the documents which are filed as exhibits to the registration statement otherwise filed with the SEC.
142
Table of Contents
F-1
Table of Contents
REPORT OF INDEPENDENT REGISTERED PUBLIC ACCOUNTING FIRM
To the Stockholders and Board of Directors of NewPage Group Inc.:
In our opinion, the accompanying consolidated balance sheets and the related consolidated statements of operations, changes in stockholders’ equity and cash flows present fairly, in all material respects, the financial position of NewPage Group Inc. and its subsidiaries at December 31, 2007 and 2006, and the results of its operations and its cash flows for the years ended December 31, 2007 and 2006 and the eight months ended December 31, 2005 in conformity with accounting principles generally accepted in the United States of America. These financial statements are the responsibility of the Company’s management. Our responsibility is to express an opinion on these financial statements based on our audits. We conducted our audits of these statements in accordance with the standards of the Public Company Accounting Oversight Board (United States). Those standards require that we plan and perform the audit to obtain reasonable assurance about whether the financial statements are free of material misstatement. An audit includes examining, on a test basis, evidence supporting the amounts and disclosures in the financial statements, assessing the accounting principles used and significant estimates made by management, and evaluating the overall financial statement presentation. We believe that our audits provide a reasonable basis for our opinion.
As discussed in Note M to the consolidated financial statements, the Company changed the manner in which it accounts for defined benefit pension and other postretirement plans effective December 31, 2006 and as discussed in Note K to the consolidated financial statements, the Company changed the manner in which it accounts for uncertain tax positions effective January 1, 2007.
/s/ PricewaterhouseCoopers LLP
PricewaterhouseCoopers LLP
Dayton, Ohio
March 24, 2008, except for Earnings Per Share, as described in Note X, the date of which is May 1, 2008
F-2
Table of Contents
NEWPAGE GROUP INC. AND SUBSIDIARIES
CONSOLIDATED BALANCE SHEETS
DECEMBER 31, 2007 and 2006
Dollars in millions, except per share amounts
| 2007 | 2006 | |||||||
ASSETS | ||||||||
Cash and cash equivalents (Note D) | $ | 143 | $ | 44 | ||||
Accounts receivable, net of allowance for doubtful accounts of $3 and $4 | 351 | 149 | ||||||
Inventories (Note E) | 584 | 317 | ||||||
Other current assets | 43 | 26 | ||||||
Total current assets | 1,121 | 536 | ||||||
Property, plant and equipment, net (Note F) | 3,564 | 1,309 | ||||||
Other assets (Note G) | 200 | 140 | ||||||
TOTAL ASSETS | $ | 4,885 | $ | 1,985 | ||||
LIABILITIES AND STOCKHOLDERS’ EQUITY | ||||||||
Accounts payable | $ | 338 | $ | 135 | ||||
Accrued expenses (Note I) | 290 | 120 | ||||||
Current maturities of long term-debt (Note J) | 16 | 5 | ||||||
Total current liabilities | 644 | 260 | ||||||
Long-term debt (Note J) | 3,277 | 1,429 | ||||||
Other long-term obligations | 351 | 42 | ||||||
Deferred income taxes (Note K) | 275 | 22 | ||||||
Commitments and contingencies (Note O) | ||||||||
Minority interest | 31 | 38 | ||||||
STOCKHOLDERS’ EQUITY | ||||||||
Common stock, 300,000,000 shares authorized, 56,307,012 and 45,055,686 shares issued and outstanding, $0.01 per share par value | 1 | — | ||||||
Additional paid-in capital | 425 | 293 | ||||||
Accumulated deficit | (142 | ) | (119 | ) | ||||
Accumulated other comprehensive income | 23 | 20 | ||||||
Total stockholders’ equity | 307 | 194 | ||||||
TOTAL LIABILITIES AND STOCKHOLDERS’ EQUITY | $ | 4,885 | $ | 1,985 | ||||
See notes to consolidated financial statements.
F-3
Table of Contents
NEWPAGE GROUP INC. AND SUBSIDIARIES
CONSOLIDATED STATEMENTS OF OPERATIONS
YEARS ENDED DECEMBER 31, 2007, 2006 AND
EIGHT MONTHS ENDED DECEMBER 31, 2005
Dollars in millions, except per share amounts
| 2007 | 2006 | 2005 | ||||||||||
Net sales | $ | 2,168 | $ | 2,038 | $ | 1,281 | ||||||
Cost of sales | 1,895 | 1,825 | 1,152 | |||||||||
Selling, general and administrative expenses | 127 | 112 | 69 | |||||||||
Interest expense (including non-cash interest expense of $48, $29, and $27) | 176 | 165 | 121 | |||||||||
Other (income) expense, net (Note H) | (1 | ) | (25 | ) | 18 | |||||||
Income (loss) from continuing operations before taxes | (29 | ) | (39 | ) | (79 | ) | ||||||
Income tax (benefit) | (6 | ) | (3 | ) | (7 | ) | ||||||
Income (loss) from continuing operations | (23 | ) | (36 | ) | (72 | ) | ||||||
Income (loss) from discontinued operations (net of income tax expense of $3 in 2005) (Note T) | — | (16 | ) | 5 | ||||||||
Net income (loss) | $ | (23 | ) | $ | (52 | ) | $ | (67 | ) | |||
Income (loss) per share—basic and diluted: | ||||||||||||
Income (loss) from continuing operations | $ | (0.51 | ) | $ | (0.80 | ) | $ | (1.60 | ) | |||
Income (loss) from discontinued operations | — | (0.35 | ) | 0.11 | ||||||||
| $ | (0.51 | ) | $ | (1.15 | ) | $ | (1.49 | ) | ||||
Basic and diluted weighted-average number of common shares outstanding (in thousands) | 45,395 | 45,056 | 45,056 | |||||||||
See notes to consolidated financial statements.
F-4
Table of Contents
NEWPAGE GROUP INC. AND SUBSIDIARIES
CONSOLIDATED STATEMENTS OF STOCKHOLDERS’ EQUITY
YEARS ENDED DECEMBER 31, 2007, 2006 AND
EIGHT MONTHS ENDED DECEMBER 31, 2005
Dollars in millions; shares in thousands
| Common Stock | Additional Paid-in Capital | Accumulated Deficit | Accumulated Other Comprehensive Income | Comprehensive Income (Loss) | |||||||||||||||||
| Shares | Amount | ||||||||||||||||||||
Issuance of common stock | 45,056 | $ | — | $ | 284 | $ | $ | ||||||||||||||
Net income (loss) | (67 | ) | $ | (67 | ) | ||||||||||||||||
Additional capital contributed by Escanaba Timber LLC (Note L) | 4 | ||||||||||||||||||||
Change in unrealized gains on cash-flow hedges, net of tax of $3 | 5 | 5 | |||||||||||||||||||
Equity awards (Note L) | 1 | ||||||||||||||||||||
Balance at December 31, 2005 | 45,056 | — | 289 | (67 | ) | 5 | $ | (62 | ) | ||||||||||||
Net income (loss) | (52 | ) | $ | (52 | ) | ||||||||||||||||
Net actuarial gains on defined benefit plans | 14 | ||||||||||||||||||||
Cash-flow hedges: | |||||||||||||||||||||
Change in unrealized gains | 5 | 5 | |||||||||||||||||||
Reclassification adjustment to net income (loss) | (4 | ) | (4 | ) | |||||||||||||||||
Equity awards (Note L) | 11 | ||||||||||||||||||||
Loan to Maple Timber | (7 | ) | |||||||||||||||||||
Balance at December 31, 2006 | 45,056 | — | 293 | (119 | ) | 20 | $ | (51 | ) | ||||||||||||
Fair value of shares issued to (Note C) | 11,251 | 1 | 122 | ||||||||||||||||||
Net income (loss) | (23 | ) | $ | (23 | ) | ||||||||||||||||
Net actuarial gains on defined benefit plans, net of tax of $10 | 9 | 9 | |||||||||||||||||||
Cash-flow hedges: | |||||||||||||||||||||
Change in unrealized gains (losses), net of tax benefit | (3 | ) | (3 | ) | |||||||||||||||||
Reclassification adjustment to net income (loss), net of tax benefit of $2 | (3 | ) | (3 | ) | |||||||||||||||||
Equity awards (Note L) | 14 | ||||||||||||||||||||
Loan to Maple Timber | (4 | ) | |||||||||||||||||||
Balance at December 31, 2007 | 56,307 | $ | 1 | $ | 425 | $ | (142 | ) | $ | 23 | $ | (20 | ) | ||||||||
See notes to consolidated financial statements.
F-5
Table of Contents
NEWPAGE GROUP INC. AND SUBSIDIARIES
CONSOLIDATED STATEMENTS OF CASH FLOWS
YEARS ENDED DECEMBER 31, 2007, 2006 AND
EIGHT MONTHS ENDED DECEMBER 31, 2005
Dollars in millions
| 2007 | 2006 | 2005 | ||||||||||
CASH FLOWS FROM OPERATING ACTIVITIES | ||||||||||||
Net income (loss) | $ | (23 | ) | $ | (52 | ) | $ | (67 | ) | |||
Adjustments to reconcile net income (loss) to net cash provided by operating activities: | ||||||||||||
(Gain) loss on discontinued operations | — | 16 | (5 | ) | ||||||||
Depreciation and amortization | 134 | 152 | 99 | |||||||||
Non-cash interest expense | 48 | 29 | 27 | |||||||||
(Gain) loss on sale of assets | 3 | (63 | ) | — | ||||||||
Unrealized (gain) loss on option contracts | — | 48 | 25 | |||||||||
Deferred income taxes | (6 | ) | (3 | ) | (4 | ) | ||||||
Write-off of costs of withdrawn initial public offering | 3 | — | — | |||||||||
Investee—earnings and distributions | — | — | 5 | |||||||||
LIFO effect | 1 | (2 | ) | 5 | ||||||||
Equity award expense (Note L) | 14 | 11 | 1 | |||||||||
Change in operating assets and liabilities: | ||||||||||||
Accounts receivable | 2 | 40 | (39 | ) | ||||||||
Inventories | 56 | 29 | 6 | |||||||||
Other operating assets | (1 | ) | 1 | (16 | ) | |||||||
Accounts payable | 4 | (30 | ) | 59 | ||||||||
Accrued expenses and other obligations | 42 | 15 | 42 | |||||||||
Net cash flows of discontinued operations | — | (11 | ) | 31 | ||||||||
Net cash provided by operating activities | 277 | 180 | 169 | |||||||||
CASH FLOWS FROM INVESTING ACTIVITIES | ||||||||||||
Cash paid for acquisitions, net of acquired cash | (1,486 | ) | — | (1,974 | ) | |||||||
Proceeds from sale of assets | — | 229 | — | |||||||||
Capital expenditures | (102 | ) | (88 | ) | (62 | ) | ||||||
Cash paid for option contracts | — | — | (73 | ) | ||||||||
Net cash flows of discontinued operations | — | (1 | ) | (5 | ) | |||||||
Net cash provided by (used in) investing activities | (1,588 | ) | 140 | (2,114 | ) | |||||||
CASH FLOWS FROM FINANCING ACTIVITIES | ||||||||||||
Proceeds from issuance of common stock | — | — | 417 | |||||||||
Proceeds from issuance of long-term debt and initial draw of revolver | 2,008 | — | 1,719 | |||||||||
Payment of financing costs | (62 | ) | (4 | ) | (59 | ) | ||||||
Distributions from Rumford Cogeneration to limited partners | (8 | ) | (6 | ) | — | |||||||
Loans to Maple Timber (Note L) | (4 | ) | (7 | ) | — | |||||||
Payments on long-term debt | (524 | ) | (224 | ) | (2 | ) | ||||||
Net borrowings (payments) on revolving credit facility | — | (46 | ) | (129 | ) | |||||||
Net cash provided by (used in) financing activities | 1,410 | (287 | ) | 1,946 | ||||||||
Increase in cash and cash equivalents from initial consolidation of Rumford Cogeneration | — | 10 | — | |||||||||
Net increase in cash and cash equivalents | 99 | 43 | 1 | |||||||||
Cash and cash equivalents at beginning of period | 44 | 1 | — | |||||||||
Cash and cash equivalents at end of period | $ | 143 | $ | 44 | $ | 1 | ||||||
SUPPLEMENTAL INFORMATION | ||||||||||||
Cash paid for interest | $ | 128 | $ | 139 | $ | 67 | ||||||
Non-cash transactions: | ||||||||||||
Issuance of PIK notes by NewPage Holding as acquisition consideration | $ | — | $ | — | $ | 100 | ||||||
Issuance of securities by NewPage Group as acquisition consideration | $ | 329 | $ | — | $ | — | ||||||
See notes to consolidated financial statements.
F-6
Table of Contents
NEWPAGE GROUP INC. AND SUBSIDIARIES
NOTES TO CONSOLIDATED FINANCIAL STATEMENTS
YEARS ENDED DECEMBER 31, 2007, 2006 AND
EIGHT MONTHS ENDED DECEMBER 31, 2005
Dollars in millions, except per share amounts
A. BASIS OF PRESENTATION
NewPage Group Inc. (“NewPage Group”) and its subsidiaries are engaged in the manufacturing, marketing and distribution of printing papers primarily used for commercial printing, magazines, catalogs, textbooks and labels. Our products include coated, uncoated, supercalendered, newsprint and specialty paper and market pulp. Our products are manufactured at multiple mills in the United States and one mill in Canada and supported by multiple distribution and converting locations. We operate within one operating segment. The consolidated financial statements include the accounts of NewPage Group and its majority-owned or -controlled subsidiaries. All intercompany transactions and balances have been eliminated.
Unless otherwise noted, the terms “we,” “our” and “us” refer to NewPage Group and its consolidated subsidiaries, including NewPage Holding Corporation (“NewPage Holding”) and NewPage Corporation (“NewPage”), two separate public-reporting companies.
NewPage Group was incorporated on October 19, 2007. Prior to the closing of the acquisition of Stora Enso North America,
| Ÿ | Escanaba Timber LLC (“Escanaba Timber”), the immediate parent entity of NewPage Holding, contributed all of the then outstanding shares of capital stock of NewPage Holding to NewPage Group in exchange for shares of common stock of NewPage Group; |
| Ÿ | Escanaba Timber distributed to Maple Timber Acquisition LLC (“Maple Timber”), Escanaba Timber’s immediate parent entity, all of the then outstanding shares of capital stock of NewPage Group; and |
| Ÿ | Maple Timber distributed all of the then outstanding shares of capital stock of NewPage Group to the members of Maple Timber. |
As a result of this pre-closing reorganization, NewPage Group became the direct parent entity of NewPage Holding (and consequently the indirect parent of NewPage) and Cerberus Capital Management, L.P. and its affiliates (“Cerberus”) and the other equity owners of Maple Timber were the sole shareholders of NewPage Group prior to the closing of the Acquisition on December 21, 2007. Because the reorganization represented a transfer of equity interests between entities under common control, NewPage Group recognized the assets and liabilities transferred at their historical carrying amounts, similar to the pooling-of-interests method. Because NewPage Group had no operations prior to the Acquisition, the combined financial statements of NewPage Group and NewPage Holding represent the historical financial statements of NewPage Holding.
In July 2005, the Emerging Issues Task Force issued EITF Issue 04-5,Investor’s Accounting for an Investment in a Limited Partnership When the Investor Is the Sole General Partner and the Limited Partners Have Certain Rights. This issue clarifies and changes the accounting for investments by general partners in limited partnerships and states that general partners are presumed to control the partnership absent certain rights of the limited parties. This issue affects the accounting for our minority ownership interest in Rumford Cogeneration Company L.P. (“Rumford Cogeneration”), a limited partnership created to generate power for us and for third-party sale, for which we are the general partner. Prior to January 1, 2006, we accounted for this investment using the equity method of accounting. As of January 1, 2006, we consolidated the partnership.
F-7
Table of Contents
NEWPAGE GROUP INC. AND SUBSIDIARIES
NOTES TO CONSOLIDATED FINANCIAL STATEMENTS—(Continued)
YEARS ENDED DECEMBER 31, 2007, 2006 AND
EIGHT MONTHS ENDED DECEMBER 31, 2005
Dollars in millions, except per share amounts
Effective April 1, 2006, we completed the sale of our carbonless paper business, which comprised our carbonless paper segment, to P. H. Glatfelter Company. In the quarter ended March 31, 2006, we began reporting the carbonless paper business as a discontinued operation. See Note T for further information.
On December 21, 2007, we acquired all of the common stock of Stora Enso North America Inc. (“SENA”). See Note C for further information.
B. SUMMARY OF SIGNIFICANT ACCOUNTING POLICIES
Estimates and assumptions
The preparation of these consolidated financial statements required management to make estimates and assumptions that affect the reported amounts of some assets and liabilities and, in some instances, the reported amounts of revenues and expenses during the reporting period. Actual results could differ from these estimates.
Foreign currency translation
The statements of operations of our Canadian entities, whose functional currencies are the Canadian dollars, are translated into U.S. dollars using the average exchange rates for the period, whereas the balance sheets are translated using the exchange rates at the reporting date. Exchange rate differences arising from the translation of the net investments in foreign entities are recorded as a component of accumulated other comprehensive income.
Concentration of credit risk
We are potentially subject to concentrations of credit risk related to our accounts receivable. The majority of accounts receivable are with paper merchants and printers. We limit our credit risk by performing ongoing credit evaluations, and when deemed necessary, by requiring letters of credit, guarantees or collateral. For each of the years ended December 31, 2007, 2006 and the eight months ended December 31, 2005, sales to our largest customer were approximately 25%, 21% and 21% of net sales. Accounts receivable at December 31, 2007 and 2006, relating to this customer were 23% and 18% of accounts receivable, net. Our ten largest customers accounted for approximately 57%, 54% and 54% of our net sales for each of the years ended December 31, 2007, 2006 and the eight months ended December 31, 2005.
Inventories
Inventories are valued at the lower of cost or market. Cost is determined using the last-in, first-out (LIFO) method for substantially all raw materials, finished goods and production materials for U.S.-based operations. Cost of all other inventories, mainly stores and supplies inventories and Canadian inventories, is determined by the average cost and first-in, first-out (FIFO) methods.
F-8
Table of Contents
NEWPAGE GROUP INC. AND SUBSIDIARIES
NOTES TO CONSOLIDATED FINANCIAL STATEMENTS—(Continued)
YEARS ENDED DECEMBER 31, 2007, 2006 AND
EIGHT MONTHS ENDED DECEMBER 31, 2005
Dollars in millions, except per share amounts
Property, plant and equipment
Owned assets are recorded at cost. Costs of renewals and betterments of properties are capitalized. Costs of maintenance and repairs are charged to expense using the direct-expensing method, whereby costs are recorded in the statement of operations in the same period that they are incurred. The cost of plant and equipment is depreciated utilizing the straight-line method over the estimated useful lives of the assets, which range from 20 to 40 years for buildings and 5 to 30 years for machinery and equipment.
Impairment of long-lived assets
We periodically evaluate whether current events or circumstances indicate that the carrying value of our long-lived assets to be held and used may not be recoverable. If these circumstances are determined to exist, an estimate of undiscounted future cash flows produced by the long-lived asset, or the appropriate grouping of assets, is compared to the carrying value to determine whether an impairment exists. We report an asset to be disposed of at the lower of its carrying value or its estimated net realizable value.
Capitalized software
Capitalized software is included in other assets and is amortized using the straight-line method over the estimated useful lives of 4 to 10 years. We record software development costs in accordance with the American Institute of Certified Public Accountants’ Statement of Position 98-1,Accounting for the Costs of Computer Software Developed or Obtained for Internal Use.
Derivative financial instruments
We use derivative financial instruments primarily to manage our exposure to changes in interest rates. Interest rate swap contracts are accounted for as cash-flow hedges with changes in fair value recorded as a component of accumulated other comprehensive income. The intrinsic portion of interest rate cap contracts are accounted for as cash-flow hedges, with changes in fair value attributed to intrinsic value recorded as a component of accumulated other comprehensive income and any change in fair value attributed to time value recorded currently in interest expense. Accumulated other comprehensive income is reclassified into current period earnings when the hedged transaction affects earnings. We also have a basket option contract on a mix of natural gas, market pulp and the Euro designed to help protect against decreases in the North American prices of coated paper. The basket option contract is accounted for at fair value with changes in the fair value of the contract recorded in other (income) expense. The fair value for a purchased derivative financial instrument is based on the amount we could receive from the counterparty to settle the instrument. These instruments are classified as other assets on our balance sheets.
Fair value of financial instruments
The fair value of long-term debt is based upon quoted market prices for the same or similar issues or on the current interest rates available to the company for debt of similar terms and maturities. The fair values of the interest rate swaps and cap and the basket option contract were based on
F-9
Table of Contents
NEWPAGE GROUP INC. AND SUBSIDIARIES
NOTES TO CONSOLIDATED FINANCIAL STATEMENTS—(Continued)
YEARS ENDED DECEMBER 31, 2007, 2006 AND
EIGHT MONTHS ENDED DECEMBER 31, 2005
Dollars in millions, except per share amounts
quotes from brokers. At December 31, 2007 and 2006, the carrying amounts of all other assets and liabilities that qualify as financial instruments approximated their fair value. Details of our assets (liabilities) recorded on our balance sheets for our financial instruments are as follows:
| 2007 | 2006 | |||||||||||||||
| Fair Value | Carrying Amount | Fair Value | Carrying Amount | |||||||||||||
Interest rate swaps | $ | (2 | ) | $ | (2 | ) | $ | 8 | $ | 8 | ||||||
Interest rate cap | — | — | 1 | 1 | ||||||||||||
Basket option | — | — | — | — | ||||||||||||
Long-term debt | (3,197 | ) | (3,147 | ) | (1,512 | ) | (1,434 | ) | ||||||||
Environmental
Environmental expenditures that increase useful lives of assets are capitalized, while other environmental expenditures are expensed. Liabilities are recorded when remedial efforts are probable and the costs can be reasonably estimated.
Landfills and other asset retirement obligations
We follow Statement of Financial Accounting Standard (SFAS) No. 143,Accounting for Asset Retirement Obligations, and FASB Interpretation No. 47,Accounting for Conditional Asset Retirement Obligations, an interpretation of FASB Statement No. 143,which require that an obligation associated with the retirement of a tangible long-lived asset be recognized as a liability when incurred, in accounting for costs related to the closure and post-closure monitoring of our owned landfills. Subsequent to initial measurement, an entity recognizes changes in the amount of the liability resulting from the passage of time and revisions to either the timing or amount of estimated cash flows.
Pension and other postretirement benefits
We maintain various defined benefit pension and other postretirement benefit plans in accordance with the local conditions and practices in the U.S. and Canada. The plans are generally funded through payments to pension funds/trusts or directly by the company and/or employees.
Defined benefit pension and other postretirement benefit expense is recorded on a full accrual basis, as opposed to a cash paid basis, and is reflected in the consolidated statements of operations over the expected working lives of the employees provided with such benefits. The economic and demographic assumptions used in calculating defined benefit pension and other postretirement benefit expense are required to be reviewed and updated periodically to the extent that local market economic conditions and demographics change.
Revenue recognition
We recognize revenue at the point when title and the risk of ownership passes to the customer. Substantially all of our revenues are generated through product sales, and shipping terms generally
F-10
Table of Contents
NEWPAGE GROUP INC. AND SUBSIDIARIES
NOTES TO CONSOLIDATED FINANCIAL STATEMENTS—(Continued)
YEARS ENDED DECEMBER 31, 2007, 2006 AND
EIGHT MONTHS ENDED DECEMBER 31, 2005
Dollars in millions, except per share amounts
indicate when title and the risk of ownership have passed. Revenue is recognized at the time of shipment for sales where shipping terms transfer title and risk of loss at the shipping point. For sales where shipping terms transfer title and risk of loss at the destination point, revenue is recognized when the goods are received by the customer. For sales made under consignment programs, revenue is recognized in accordance with the terms of the contract. We provide allowances for estimated returns and other customer credits, such as discounts, returns and volume rebates, when the revenue is recognized, based on historical experience. Sales of byproducts produced during the manufacturing process are recognized as a reduction of cost of sales. We do not recognize sales taxes collected from customers as revenue; rather we record these taxes on a net basis in our statement of operations.
International sales
We had net sales to customers outside of the United States of $217, $213 and $122 for the years ended December 31, 2007, 2006 and the eight months ended December 31, 2005. We have no material long-lived assets outside of the U.S.
Income taxes
Deferred income taxes are recorded for temporary differences between financial statement carrying amounts and the tax bases of assets and liabilities. Deferred tax assets and liabilities reflect the enacted tax rates in effect for the years the differences are expected to reverse. We evaluate the need for a deferred tax asset valuation allowance by assessing whether it is more likely than not that we will realize the deferred tax assets in the future. We recognize all income tax-related interest expense and statutory penalties imposed by taxing authorities as income tax expense.
Equity compensation
We follow SFAS No. 123 (Revised),Share-based Payment, which requires that all equity awards to employees be expensed over the vesting period of the award. We use the graded vesting attribution method for recognizing stock compensation cost whereby the cost for a stock award is determined on a straight-line basis over the service period for each separately vesting portion of the award as if the award was, in-substance, multiple awards.
C. ACQUISITIONS AND RELATED TRANSACTIONS
Acquisition of Stora Enso North America
On December 21, 2007, NewPage acquired all of the issued and outstanding common stock of SENA from Stora Enso Oyj (“SEO”) (the “Acquisition”). The purchase price for SENA included $1,516 in cash and $200 of notes issued to SEO by NewPage Group Inc. (“NewPage Group”), NewPage Holding’s direct parent. In addition, SEO received a 19.9% equity interest in NewPage Group.
We acquired SENA in order to create a single business platform and to enable us to remain competitive in the marketplace, serve our customers more efficiently and reach the synergies we have committed to achieve.
F-11
Table of Contents
NEWPAGE GROUP INC. AND SUBSIDIARIES
NOTES TO CONSOLIDATED FINANCIAL STATEMENTS—(Continued)
YEARS ENDED DECEMBER 31, 2007, 2006 AND
EIGHT MONTHS ENDED DECEMBER 31, 2005
Dollars in millions, except per share amounts
The following events occurred simultaneously with the consummation of the Acquisition:
| Ÿ | NewPage acquired all of the issued and outstanding common stock of SENA and, in exchange, SEO received: |
| Ÿ | $1,516 in cash (subject to the final working capital adjustment); |
| Ÿ | shares of common stock representing 19.9% of the outstanding common stock of NewPage Group at the closing of the Acquisition (not taking into account any potential dilution from equity awards issued to management from and after closing pursuant to a new management incentive plan); and |
| Ÿ | senior unsecured notes issued by NewPage Group in the aggregate principal amount of $200 due 2015 (the “NewPage Group PIK Notes”). |
| Ÿ | NewPage entered into senior secured credit facilities, consisting of a $1,600 senior secured term loan facility and a $500 senior secured revolving credit facility and applied the proceeds from the term loan to finance a portion of the Acquisition, repay our prior senior secured credit facilities and pay related expenses; |
| Ÿ | NewPage repaid $450 of term debt outstanding under its credit facility in place immediately prior to consummation of the Acquisition; and |
| Ÿ | NewPage issued $456 of 10% senior secured notes due 2012. |
The consolidated balance sheet in these financial statements include the assets acquired and liabilities assumed of SENA and reflect an allocation of purchase price based on fair values at the date of Acquisition. The following shows the reconciliation of the purchase price paid by NewPage:
Cash paid for acquisition disclosed in statement of cash flows | $ | 1,486 | ||
NewPage Group equity issued to SEO (at fair value) | 123 | |||
NewPage Group PIK Notes issued to SEO (at fair value) | 206 | |||
Total paid for acquisition | 1,815 | |||
Reversal of valuation allowance on NewPage Holding deferred tax assets | (39 | ) | ||
Net purchase price allocated | $ | 1,776 | ||
F-12
Table of Contents
NEWPAGE GROUP INC. AND SUBSIDIARIES
NOTES TO CONSOLIDATED FINANCIAL STATEMENTS—(Continued)
YEARS ENDED DECEMBER 31, 2007, 2006 AND
EIGHT MONTHS ENDED DECEMBER 31, 2005
Dollars in millions, except per share amounts
A summary of the preliminary purchase price allocation for the fair value of the assets acquired and the obligations assumed at the date of the Acquisition is presented below. The purchase price allocation is preliminary and is subject to the completion of several items, including consideration of final valuations, final determination of post-closing purchase price adjustments, adjustments for final estimates for restructuring activities, and for uncertain tax positions under FIN 48 and deferred tax positions under FAS 109.
Accounts receivable | $ | 204 | ||
Inventory | 323 | |||
Other current assets | 3 | |||
Property, plant and equipment | 2,285 | |||
Other assets | 22 | |||
Total assets acquired | 2,837 | |||
Accounts payable | (199 | ) | ||
Other current liabilities | (137 | ) | ||
Capital lease | (146 | ) | ||
Deferred taxes | (285 | ) | ||
Other long-term obligations | (294 | ) | ||
Total liabilities assumed | (1,061 | ) | ||
Net purchase price allocated | $ | 1,776 | ||
The results of operations for the year ended December 31, 2007 include the results for SENA from the date of Acquisition. The following table summarizes selected unaudited pro forma consolidated statements of operations data for the years ended December 31, 2007 and 2006 as if the Acquisition had been completed at the beginning of the year.
| 2007 | 2006 | |||||||
Unaudited pro forma financial data | ||||||||
Net sales | $ | 4,659 | $ | 4,214 | ||||
Net income (loss) | (124 | ) | (256 | ) | ||||
Net income (loss) per basic and diluted share | (2.20 | ) | (4.55 | ) | ||||
This selected unaudited pro forma consolidated financial data is included only for the purpose of illustration and does not necessarily indicate what the operating results would have been if the Acquisition had been completed on that date. Moreover, this information does not necessarily indicate what our future operating results will be. This information includes actual data in 2007 for the period subsequent to the date of the Acquisition. For periods prior to the Acquisition, the unaudited pro forma information includes allocations to SENA of certain expenses no longer incurred after the date of the Acquisition.
Acquisition of printing and writing papers business
NewPage acquired the printing and writing papers group of MeadWestvaco Corporation (“MeadWestvaco”) on May 2, 2005, which was deemed to have been completed on April 30, 2005.
F-13
Table of Contents
NEWPAGE GROUP INC. AND SUBSIDIARIES
NOTES TO CONSOLIDATED FINANCIAL STATEMENTS—(Continued)
YEARS ENDED DECEMBER 31, 2007, 2006 AND
EIGHT MONTHS ENDED DECEMBER 31, 2005
Dollars in millions, except per share amounts
D. CASH AND CASH EQUIVALENTS
Consolidated cash and cash equivalents include those of Rumford Cogeneration. There are no compensating balance arrangements or legal restrictions on the cash and cash equivalents of Rumford Cogeneration; however, $1 and $11 of the consolidated cash and cash equivalents at December 31, 2007 and 2006 is the property of Rumford Cogeneration and is not available to NewPage Group until distributed from the partnership to its partners.
E. INVENTORIES
Inventories as of December 31, 2007 and 2006 consist of:
| 2007 | 2006 | |||||
Finished and in-process goods | $ | 304 | $ | 232 | ||
Raw materials | 123 | 32 | ||||
Stores and supplies | 157 | 53 | ||||
| $ | 584 | $ | 317 | |||
Approximately 70% and 83% of inventories at December 31, 2007 and 2006 are valued using the LIFO method. If inventories had been valued at current costs, they would have been valued at $556 and $306 at December 31, 2007 and 2006.
F. PROPERTY, PLANT AND EQUIPMENT
Property, plant and equipment as of December 31, 2007 and 2006, consist of:
| 2007 | 2006 | |||||||
Land and land improvements | $ | 118 | $ | 56 | ||||
Buildings | 419 | 122 | ||||||
Machinery and other | 3,313 | 1,319 | ||||||
Construction in progress | 80 | 35 | ||||||
| 3,930 | 1,532 | |||||||
Less: accumulated depreciation and amortization | (366 | ) | (223 | ) | ||||
| $ | 3,564 | $ | 1,309 | |||||
See Note P for information related to the capital lease.
G. OTHER ASSETS
Other assets as of December 31, 2007 and 2006, consist of:
| 2007 | 2006 | |||||
Prepaid pension asset | $ | 88 | $ | 47 | ||
Financing costs (net of accumulated amortization of $26 and $15) | 71 | 35 | ||||
Other | 41 | 58 | ||||
| $ | 200 | $ | 140 | |||
F-14
Table of Contents
NEWPAGE GROUP INC. AND SUBSIDIARIES
NOTES TO CONSOLIDATED FINANCIAL STATEMENTS—(Continued)
YEARS ENDED DECEMBER 31, 2007, 2006 AND
EIGHT MONTHS ENDED DECEMBER 31, 2005
Dollars in millions, except per share amounts
Amortization expense for was $19, $17 and $10 for the years ended December 31, 2007, 2006 and the eight months ended December 31, 2005. Amortization expense for the next five years is expected to be $24 in 2008, $25 in 2009, $24 in 2010, $25 in 2011 and $22 in 2012.
H. DERIVATIVE FINANCIAL INSTRUMENTS
As of May 2, 2005, we entered into a commodity basket option contract with J. Aron & Company, an affiliate of Goldman, Sachs & Co., and paid a premium of $72 for the contract, which was the fair value of the option at inception. This contract is a basket of options on a mix of natural gas, market pulp and the Euro. While the commodity basket option contract was designed to help protect against decreases in the North American prices of coated paper by reference to the prices of natural gas and market pulp, and material decreases in the value of the Euro relative to the U.S. dollar, there is no assurance that the commodity basket option contract will actually protect us against price decreases or that the historical level of correlation will continue during the three-year period of the contract. Because of the uncertainty of future correlation, we do not apply hedge accounting treatment for this contract and record changes in the fair value of the contract in other (income) expense. Other (income) expense for the years ended December 31, 2007, 2006 and the eight months ended December 31, 2005, include non-cash losses of zero, $47 and $25 determined based on the mark-to-market value of the option contract. This contract expires April 2008 and had a fair value of zero at December 31, 2007 and 2006.
In June 2005, we entered into two interest rate swap agreements and one interest rate cap agreement to hedge the variability of cash flows on a portion of our variable-rate debt. We entered into a $150 notional amount interest rate swap expiring June 2009 and a $150 notional amount interest rate swap expiring June 2010. We receive LIBOR and pay a weighted-average fixed rate of 4.1% on the interest rate swaps. We purchased a $150 notional amount interest rate cap with a cap rate of 4.5% that expires June 2008.
In January 2008, we entered into four interest rate swap agreements with an aggregate notional amount of $1,050 to hedge the variability of cash flows on a portion of our floating-rate debt. The interest rate swaps have notional amounts of $300, $300, $250 and $200 and expire December 2009, December 2010, December 2011 and December 2012. We receive LIBOR and pay a weighted-average fixed rate of 3.6% on these interest rate swaps.
I. ACCRUED EXPENSES
Accrued expenses as of December 31, 2007 and 2006 consist of:
| 2007 | 2006 | |||||
Payroll and employee benefit costs | $ | 139 | $ | 42 | ||
Accrued interest | 26 | 27 | ||||
Accrued rebates and allowances | 25 | 17 | ||||
Other | 100 | 34 | ||||
| $ | 290 | $ | 120 | |||
F-15
Table of Contents
NEWPAGE GROUP INC. AND SUBSIDIARIES
NOTES TO CONSOLIDATED FINANCIAL STATEMENTS—(Continued)
YEARS ENDED DECEMBER 31, 2007, 2006 AND
EIGHT MONTHS ENDED DECEMBER 31, 2005
Dollars in millions, except per share amounts
J. LONG-TERM DEBT
The balances of long-term debt as of December 31, 2007 and 2006 are as follows:
| 2007 | 2006 | |||||
NewPage: | ||||||
Term loan senior secured credit facility (face amount $1,600 and $524; LIBOR plus 3.75%) | $ | 1,552 | $ | 524 | ||
Floating rate senior secured notes (LIBOR plus 6.25%) | 225 | 225 | ||||
10% senior secured notes (face amount $806 and $350) | 804 | 347 | ||||
12% senior subordinated notes (face amount $200) | 198 | 198 | ||||
Capital lease | 146 | — | ||||
Total long-term debt, including current portion | 2,925 | 1,294 | ||||
Current portion of long-term debt | 16 | 5 | ||||
Subtotal | 2,909 | 1,289 | ||||
NewPage Holding— | ||||||
Senior unsecured NewPage Holding PIK Notes (face amount $171 and $151; LIBOR plus 7.00%) | 161 | 140 | ||||
NewPage Group— | ||||||
Senior unsecured NewPage Group PIK Notes (face amount $201; LIBOR plus 7.00%) | 207 | — | ||||
Long-term debt | $ | 3,277 | $ | 1,429 | ||
In connection with the Acquisition, NewPage entered into senior secured credit facilities consisting of $1,600 under a senior secured term loan facility and $500 under a senior secured revolving credit facility and applied the proceeds from the term loan to finance a portion of the Acquisition, repay our prior senior secured credit facilities and pay related expenses. Included in interest expense for the year ended December 31, 2007, is $17 for the write-off of financing costs related to the pre-Acquisition term loan and unused bridge financing commitment fees.
Substantially all of our assets are pledged as collateral under our various debt agreements.
Principal payments on long-term debt for the next five years are payable as follows: $16 in 2008, $16 in 2009, $16 in 2010, $16 in 2011 and $1,047 in 2012.
See Note P for additional information on the capital lease.
Senior Secured Credit Facilities
The senior secured credit facilities consist of a senior secured term loan of $1,600 and a senior secured revolving credit facility of $500. The senior secured credit facilities may be accelerated if we are unable to refinance the senior secured and subordinated notes prior to their maturity. Subject to customary conditions, including the absence of defaults under the revolving credit facility, amounts available under the revolving credit facility may be borrowed, repaid and re-borrowed, including in the
F-16
Table of Contents
NEWPAGE GROUP INC. AND SUBSIDIARIES
NOTES TO CONSOLIDATED FINANCIAL STATEMENTS—(Continued)
YEARS ENDED DECEMBER 31, 2007, 2006 AND
EIGHT MONTHS ENDED DECEMBER 31, 2005
Dollars in millions, except per share amounts
form of letters of credit and swing line loans, until the maturity date thereof. The revolving credit facility may be utilized to fund our working capital, to fund permitted acquisitions and capital expenditures, and for other general corporate purposes. The availability under our revolving credit facility is reduced by our outstanding letters of credit, which totaled $74 and $47 at December 31, 2007 and 2006. The amount of loans and letters of credit available to us pursuant to the revolving credit facility is limited to the lesser of $500 or an amount determined pursuant to a borrowing base. Based on availability under the borrowing base as of December 31, 2007, we had $380 of additional borrowing availability under the revolving credit facility. The revolving credit facility matures the first to occur of (i) December 21, 2012 and (ii) the date that is 181 days prior to the scheduled maturity date of the term loan, senior secured notes, senior subordinated notes, the NewPage Holding PIK notes, and any refinancing thereof. Amounts outstanding under our revolving credit facility bear interest, at our option, at a rate per annum equal to either: (i) the base rate plus 1.00%, or (ii) LIBOR plus 2.00%. The interest rate spreads are subject to reduction upon meeting certain leverage thresholds or upon the occurrence of an initial public offering. Certain customary fees are payable to the lenders and the agents under the senior secured credit facilities, including, without limitation, a commitment fee for our revolving credit facility based upon non-use of available funds and letter of credit fees and issuer fronting fees.
The term loan matures on the first to occur of (i) December 21, 2014 and (ii) the date that is 181 days prior to the scheduled maturity date of the senior secured notes, senior subordinated notes, the NewPage Holding PIK notes, and any refinancing thereof and will amortize in equal quarterly installments in an aggregate annual amount equal to 1% of the original principal amount of the senior term facility, with the balance payable at maturity. Future payments are reduced ratably for early principal repayments. The term loan is subject to mandatory prepayment with, in general, (i) 100% of the net cash proceeds of certain asset sales, subject to certain reinvestment rights; (ii) 100% of the net cash proceeds of certain insurance and condemnation payments, subject to certain reinvestment rights; (iii) 50% of the net cash proceeds of equity offerings; (iv) 100% of the net cash proceeds of debt incurrence (other than debt incurrence permitted under the term facility); and (v) 50% of our excess cash flow, as defined in the senior secured credit facility; generally the mandatory prepayment rates decline in accordance with a leverage ratio test. The loans under the term loan facility bear interest, at our option, at a rate per annum equal to either: (i) the base rate plus 2.75%, or (ii) LIBOR plus 3.75%. The interest rate spreads are subject to reduction upon meeting certain leverage thresholds or upon the occurrence of an initial public offering. Our weighted-average interest rate on the outstanding balance at December 31, 2007 and 2006 was 8.7% and 8.5%.
The senior secured credit facilities are jointly and severally guaranteed by our parent and each of our guarantor subsidiaries. Subject to certain customary exceptions, we and each of the guarantors granted to the lenders under the revolving credit facility a first priority security interest in and lien on our and our guarantor subsidiaries’ present and future cash, deposit accounts, accounts receivable, inventory and intercompany debt owed to us, our parent and our guarantor subsidiaries. Subject to certain customary exceptions, we and each of the guarantors granted to the lenders under the term loan (i) a first priority security interest in and lien on substantially all of our and our guarantor subsidiaries’ present and future property and assets (other than cash, deposit accounts, accounts receivable, inventory and intercompany debt owed to us, our parent and our guarantor subsidiaries), including the capital stock of our guarantor subsidiaries and 65% of the capital stock of our foreign subsidiaries, if any, as well as our capital stock owned by our parent and (ii) a second priority security interest in and lien on our and our guarantor subsidiaries’ present and future cash, deposit accounts,
F-17
Table of Contents
NEWPAGE GROUP INC. AND SUBSIDIARIES
NOTES TO CONSOLIDATED FINANCIAL STATEMENTS—(Continued)
YEARS ENDED DECEMBER 31, 2007, 2006 AND
EIGHT MONTHS ENDED DECEMBER 31, 2005
Dollars in millions, except per share amounts
accounts receivable, inventory and intercompany debt owed to us, our parent or our guarantor subsidiaries.
The senior secured credit facilities contain various customary affirmative and negative covenants (subject to customary exceptions and certain existing obligations and liabilities), including, but not limited to, restrictions on our ability and the ability of our subsidiaries to (i) dispose of assets, (ii) incur additional indebtedness and guarantee obligations, (iii) repay other indebtedness, (iv) pay certain restricted payments and dividends, (v) create liens on assets or prohibit the creation of liens on assets, (vi) make investments, loans or advances, (vii) restrict distributions to our company from our subsidiaries, (viii) make certain acquisitions, (ix) engage in mergers or consolidations, (x) enter into sale and leaseback transactions, (xi) engage in certain transactions with subsidiaries that are not guarantors of the senior secured credit facilities or with affiliates or (xii) amend the terms of the notes and otherwise restrict corporate activities. In addition, under the term loan (and under the revolving credit facility to the extent that our unused borrowing availability under the revolving credit facility plus excess cash are below $50 for 10 consecutive business days or $25 for three consecutive days), we are required to comply with specified financial ratios and tests, including a minimum interest and fixed charge coverage ratios, maximum senior and total leverage ratios and maximum capital expenditures.
Floating Rate and 10% Senior Secured Notes
The senior secured notes consist of $806 face value of 10% senior secured notes and $225 of floating rate senior secured notes. The senior secured notes mature on May 1, 2012. Interest on the 10% senior secured notes is payable semi-annually in arrears on May 1 and November 1. Interest on the 10% senior secured notes is computed on the basis of a 360-day year comprised of twelve 30-day months. Interest on the floating rate senior secured notes accrues at a rate per annum, reset quarterly, equal to LIBOR plus 6.25% (11.2% and 11.6% at December 31, 2007 and 2006). We pay interest on the floating rate senior secured notes quarterly, in arrears, on every February 1, May 1, August 1 and November 1.
The senior secured notes are secured on a second-priority basis by liens on all of the assets of NewPage and the guarantors other than the collateral securing the revolving credit facility and the stock of our subsidiaries; are subordinated, to the extent of the value of the assets securing that indebtedness, to the senior secured credit facility; are senior in right of payment to our existing and future subordinated indebtedness, including the senior subordinated notes; and are jointly and severally unconditionally guaranteed by most of our subsidiaries.
At any time prior to May 1, 2008, we may redeem up to 30% of the 10% senior secured notes at a redemption price of 110% with the net cash proceeds of one or more equity offerings by NewPage or a contribution to the common equity capital of NewPage from the net proceeds of one or more equity offerings by a direct or indirect parent of NewPage. At any time prior to May 1, 2009, we may also redeem all or a part of the 10% senior secured notes at a redemption price equal to 100% plus a “make-whole” premium. On or after May 1, 2009, we may redeem all or a part of the 10% senior secured notes at an initial redemption price of 106%. At any time prior to May 1, 2008, we may redeem up to 30% of the floating rate senior secured notes at a redemption price of 100%, plus LIBOR on the date of redemption, plus 6.25% with the net cash proceeds of one or more equity offerings by NewPage or a contribution to the common equity capital of NewPage from the net proceeds of one or
F-18
Table of Contents
NEWPAGE GROUP INC. AND SUBSIDIARIES
NOTES TO CONSOLIDATED FINANCIAL STATEMENTS—(Continued)
YEARS ENDED DECEMBER 31, 2007, 2006 AND
EIGHT MONTHS ENDED DECEMBER 31, 2005
Dollars in millions, except per share amounts
more equity offerings by a direct or indirect parent of NewPage. On or after May 1, 2009, we may redeem all or a part of the floating rate senior secured notes at an initial redemption price of 103%. If a change of control occurs, each holder of senior secured notes has the right to require us to repurchase all or any part of that holder’s senior secured notes at 101% of the face value.
The senior secured notes contain various customary covenants (subject to customary exceptions and certain existing obligations and liabilities), including, but not limited to, restrictions on our ability and the ability of our subsidiaries to (i) dispose of assets, (ii) incur additional indebtedness and guarantee obligations or issue preferred stock, (iii) repay other indebtedness, (iv) pay certain restricted payments and dividends, (v) create liens on assets or prohibit the creation of liens on assets, (vi) make investments, loans or advances, (vii) restrict distributions to our company from our subsidiaries, (viii) make certain acquisitions, (ix) engage in mergers or consolidations, (x) enter into sale and leaseback transactions, (xi) engage in certain transactions with subsidiaries that are not guarantors of the senior secured credit facilities or with affiliates or (xii) amend the terms of the notes and otherwise restrict corporate activities.
12% Senior Subordinated Notes
The senior subordinated notes consist of $200 face value senior subordinated notes that mature on May 1, 2013. The senior subordinated notes are general unsecured obligations and are subordinated in right of payment to all our existing and future senior debt, including the senior secured notes and borrowings under the senior secured credit facilities. Interest on the senior subordinated notes accrues at the rate of 12.0% per annum and is payable semi-annually in arrears on May 1 and November 1. The senior subordinated notes are jointly and severally guaranteed by most of our subsidiaries.
At any time prior to May 1, 2008, we may redeem up to 30% of the senior subordinated notes at a redemption price of 112% with the net cash proceeds of one or more equity offerings by NewPage or a contribution to the common equity capital of NewPage from the net proceeds of one or more equity offerings by a direct or indirect parent of NewPage. At any time prior to May 1, 2009, we may also redeem all or a part of the senior subordinated notes at a redemption price equal to 100% plus a “make-whole” premium. On or after May 1, 2009, we may redeem all or a part of the senior subordinated notes at an initial redemption price of 106%. If a change of control occurs, each holder of the senior subordinated notes has the right to require us to repurchase all or any part of that holder’s senior subordinated notes at 101% of the face value.
The senior subordinated notes contain various customary covenants (subject to customary exceptions and certain existing obligations and liabilities), including, but not limited to, restrictions on our ability and the ability of our subsidiaries to (i) dispose of assets, (ii) incur additional indebtedness and guarantee obligations or issue preferred stock, (iii) repay other indebtedness, (iv) pay certain restricted payments and dividends, (v) create liens on assets or prohibit the creation of liens on assets, (vi) make investments, loans or advances, (vii) restrict distributions to our company from our subsidiaries, (viii) make certain acquisitions, (ix) engage in mergers or consolidations, (x) enter into sale and leaseback transactions, (xi) engage in certain transactions with subsidiaries that are not guarantors of the senior secured credit facilities or with affiliates or (xii) amend the terms of the notes and otherwise restrict corporate activities.
F-19
Table of Contents
NEWPAGE GROUP INC. AND SUBSIDIARIES
NOTES TO CONSOLIDATED FINANCIAL STATEMENTS—(Continued)
YEARS ENDED DECEMBER 31, 2007, 2006 AND
EIGHT MONTHS ENDED DECEMBER 31, 2005
Dollars in millions, except per share amounts
NewPage Holding Senior Unsecured PIK Notes
The NewPage Holding PIK Notes are due November 1, 2013. Interest accrues at a rate per annum, reset semi-annually, equal to LIBOR plus 7.00% (11.8% and 12.4% at December 31, 2007 and 2006) and is payable by the issuance of additional NewPage Holding PIK Notes until maturity. The NewPage Holding PIK Notes are unsecured and are not guaranteed.
NewPage Holding may redeem all or part of the NewPage Holding PIK Notes at specified redemption prices. Upon a change of control, as defined in the NewPage Holding PIK Notes indenture, and certain asset sales, holders of the NewPage Holding PIK Notes will have the right to require NewPage Holding to repurchase all or part of the holder’s NewPage Holding PIK Notes.
The NewPage Holding PIK Notes indenture contains various customary negative covenants, including restrictions on our ability and the ability of our subsidiaries to (i) incur indebtedness, (ii) allow liens to exist, (iii) permit restrictions to exist on dividends by our subsidiaries, (iv) merge, consolidate or sell assets and (v) enter into transactions with affiliates. The covenants applicable to us and our subsidiaries are substantially the same as the corresponding covenants contained in the indenture for the senior subordinated notes. Additionally, the NewPage Holding PIK Notes indenture contains restrictions on NewPage Holding’s ability to (i) incur additional indebtedness other than (a) NewPage Holding PIK Notes paid as interest and (b) guarantees of the debt obligations of subsidiaries of NewPage Holding and (ii) pay dividends. The NewPage Holding PIK Notes indenture contains customary events of default.
NewPage Group Senior Unsecured PIK Notes
The NewPage Group PIK Notes are due December 21, 2015. Interest accrues at a rate per annum, reset semi-annually, equal to LIBOR plus 7.00% (11.8% at December 31, 2007) and is payable by the issuance of additional NewPage Group PIK Notes until maturity. The NewPage Group PIK Notes are unsecured and are not guaranteed.
During the first year following issuance, the NewPage Group PIK notes may not be redeemed at NewPage Group’s option, except in the case of a change of control. After the first year following issuance, NewPage Group may redeem some or all of the NewPage Group PIK notes at specified redemption prices plus all accrued and unpaid interest to the date of redemption. Upon a change of control, each holder of the NewPage Group PIK notes will have the right to require NewPage Group to repurchase all of the outstanding NewPage Group PIK notes at a purchase price equal to the principal amount of the NewPage Group PIK notes plus accrued but unpaid interest thereon to the date of purchase. NewPage Group shall have the option to redeem any NewPage Group PIK notes that are not tendered pursuant to such offer to purchase, at a redemption price equal to the principal amount of the NewPage Group PIK notes plus accrued but unpaid interest to the date of purchase.
In the case of any public equity offering by NewPage Group or one of its subsidiaries, NewPage Group shall first use the net proceeds of the offering to repay in full the outstanding NewPage Holding PIK notes, and then shall use any remaining net proceeds to redeem NewPage Group PIK notes at a redemption price of 100% of the principal amount thereof plus accrued but unpaid interest thereon to the date of redemption.
F-20
Table of Contents
NEWPAGE GROUP INC. AND SUBSIDIARIES
NOTES TO CONSOLIDATED FINANCIAL STATEMENTS—(Continued)
YEARS ENDED DECEMBER 31, 2007, 2006 AND
EIGHT MONTHS ENDED DECEMBER 31, 2005
Dollars in millions, except per share amounts
The NewPage Group PIK notes indenture contains restrictions on (i) payments of dividends or the redemption of equity interests prior to an initial public offering, (ii) transactions with affiliates and (iii) the merger, consolidation or sale of all or substantially all of the assets of NewPage Group. The NewPage Group PIK Notes indenture contains customary events of default.
K. INCOME TAXES
The principal current and noncurrent deferred tax assets and liabilities as of December 31, 2007 and 2006 are as follows:
| 2007 | 2006 | |||||||
Deferred tax assets: | ||||||||
Intangible assets | $ | 67 | $ | 88 | ||||
Compensation-related costs | 154 | 18 | ||||||
Net operating loss carryforwards | 603 | 75 | ||||||
Tax credits | 42 | 4 | ||||||
Other accruals and reserves | 55 | 25 | ||||||
Total deferred tax assets | 921 | 210 | ||||||
Valuation allowance | (391 | ) | (42 | ) | ||||
Net deferred tax assets | 530 | 168 | ||||||
Deferred tax liabilities: | ||||||||
Property, plant and equipment | (760 | ) | (154 | ) | ||||
Inventory | (10 | ) | (1 | ) | ||||
Other | (16 | ) | (14 | ) | ||||
Total deferred tax liabilities | (786 | ) | (169 | ) | ||||
Net deferred liability | $ | (256 | ) | $ | (1 | ) | ||
Included in the balance sheet: | ||||||||
Other current assets—deferred tax asset | $ | 19 | $ | 8 | ||||
Noncurrent assets—deferred tax asset | — | 13 | ||||||
Noncurrent net deferred tax liability | (275 | ) | (22 | ) | ||||
Net deferred liability | $ | (256 | ) | $ | (1 | ) | ||
We adopted the provisions of FASB Interpretation No. 48,Accounting for Uncertainty in Income Taxes, on January 1, 2007. As a result of the implementation of Interpretation 48, we recognized a $1 reduction in deferred tax assets and a corresponding decrease in the valuation allowance.
As of January 1, 2007 the implementation had no effect on the beginning balance of accumulated deficit. A reconciliation of the beginning and ending amount of unrecognized tax benefits is as follows:
Balance at January 1, 2007 | $ | 1 | |
Additions related to the Acquisition | 62 | ||
Balance at December 31, 2007 | $ | 63 | |
F-21
Table of Contents
NEWPAGE GROUP INC. AND SUBSIDIARIES
NOTES TO CONSOLIDATED FINANCIAL STATEMENTS—(Continued)
YEARS ENDED DECEMBER 31, 2007, 2006 AND
EIGHT MONTHS ENDED DECEMBER 31, 2005
Dollars in millions, except per share amounts
The significant components of the income tax provision (benefit) are as follows:
| Year Ended Dec. 31, 2007 | Year Ended Dec. 31, 2006 | Eight Months Ended Dec. 31, 2005 | ||||||||||
Deferred: | ||||||||||||
U.S. federal | $ | 1 | $ | (19 | ) | $ | (20 | ) | ||||
State and local | (4 | ) | — | (7 | ) | |||||||
Deferred income tax expense (benefit) | (3 | ) | (19 | ) | (27 | ) | ||||||
Valuation allowance | 3 | 16 | 26 | |||||||||
| — | (3 | ) | (1 | ) | ||||||||
Allocation to loss from discontinued operations | — | — | 3 | |||||||||
Allocation to other comprehensive income | 6 | — | 3 | |||||||||
Income tax (benefit) | $ | (6 | ) | $ | (3 | ) | $ | (7 | ) | |||
The following table summarizes the major differences between the actual income tax provision (benefit) attributable to continuing operations and taxes computed at the U.S. federal statutory rate:
| Year Ended Dec. 31, 2007 | Year Ended Dec. 31, 2006 | Eight Months Ended Dec. 31, 2005 | ||||||||||
Income tax benefit computed at the U.S. federal statutory rate of 35% | $ | (10 | ) | $ | (13 | ) | $ | (28 | ) | |||
State and local income taxes, net of federal benefit | (4 | ) | 2 | (5 | ) | |||||||
Permanent differences | 6 | 3 | — | |||||||||
Tax credits | (1 | ) | (2 | ) | — | |||||||
Valuation allowance | 3 | 16 | 26 | |||||||||
Other | — | (9 | ) | — | ||||||||
Income tax (benefit) | $ | (6 | ) | $ | (3 | ) | $ | (7 | ) | |||
Effective tax rate | 19.5 | % | 8.3 | % | 9.6 | % | ||||||
We file income tax returns in the United States for federal and various state jurisdictions and in Canada. As of December 31, 2007, we have filed tax returns for the periods ended December 31, 2006 and 2005 and these periods are still open for examination by various taxing authorities. Wisconsin tax returns filed by SENA are still open for examination for periods from 1997 through 2006. Canadian tax returns filed by SENA are still open for examination for periods from 2002 through 2006.
The federal net operating loss carryforward at December 31, 2007 was $883 and is available to reduce federal taxable income through 2027. The Canadian federal net operating loss carryforward available to reduce Canadian federal taxable income at December 31, 2007 was Canadian $887 and expires between 2012 and 2014. We have recorded a valuation allowance against our net deferred tax assets for Canadian federal income taxes and for certain states since it is more likely than not that we
F-22
Table of Contents
NEWPAGE GROUP INC. AND SUBSIDIARIES
NOTES TO CONSOLIDATED FINANCIAL STATEMENTS—(Continued)
YEARS ENDED DECEMBER 31, 2007, 2006 AND
EIGHT MONTHS ENDED DECEMBER 31, 2005
Dollars in millions, except per share amounts
will not realize these benefits, as defined in SFAS No. 109, as a result of the negative evidence presented by our history of losses over the past three years.
L. EQUITY
NewPage Group has 400,000,000 shares authorized, consisting of 300,000,000 shares of common stock, par value $0.01 per share, and 100,000,000 shares of preferred stock, par value $0.01 per share. There is no established public trading market for our common stock and we have never paid or declared a cash dividend on the common stock. Our debt agreements restrict our ability and the ability of our subsidiaries to pay dividends. On December 21, 2007, Escanaba Timber contributed all of the then outstanding common stock of NewPage Holding to NewPage Group in exchange for shares of common stock of NewPage Group.
In conjunction with the Acquisition, NewPage Group issued 11,251,326 shares of common stock to SEO as part of the Acquisition consideration equal to a 19.9% ownership of NewPage Group’s common stock.
In conjunction with the acquisition of the printing and writing papers group of MeadWestvaco, we received an equity investment of $415 in common stock from Escanaba Timber LLC, our direct parent at the time of the acquisition. The allocation of the purchase price to Escanaba Timber LLC and NewPage was made in proportion to each entity’s share of the fair value of the total assets acquired and was not based on the individual legal entity’s issuance of consideration to MeadWestvaco. Below is a reconciliation between the $415 equity investment and the amount recorded in additional paid-in capital:
Equity contribution from Escanaba Timber | $ | 415 | ||
Unvested restricted equity awards | (2 | ) | ||
Proceeds from capital contributions | 413 | |||
Excess consideration contributed from Escanaba Timber over fair value of assets acquired | (129 | ) | ||
Proceeds from capital contributions in statement of stockholder’s equity | $ | 284 | ||
Equity Compensation
Maple Timber Management Interests
Certain members of our management were granted Common Percentage Interests (“Management Interests”) of Maple Timber, our former indirect parent, relating to our business. The equity interests of Maple Timber were classified into two separate series, one relating to our business and one relating to the business of Escanaba Timber. The series of equity interests relating to our business consisted of Class A Common Percentage Interests, Class B Common Percentage Interests, Class C Common Percentage Interests and Preferred Percentage Interests. In connection with the equity reorganization, all unvested Management Interests became vested as of December 21, 2007, the Management Interests were exchanged for NewPage Group common stock, and we recognized additional expense of $8 in 2007 as a result of the modification.
F-23
Table of Contents
NEWPAGE GROUP INC. AND SUBSIDIARIES
NOTES TO CONSOLIDATED FINANCIAL STATEMENTS—(Continued)
YEARS ENDED DECEMBER 31, 2007, 2006 AND
EIGHT MONTHS ENDED DECEMBER 31, 2005
Dollars in millions, except per share amounts
The fair value of Management Interests granted totaled $3 and $2 for the year ended December 31, 2006 and eight months ended December 31, 2005.
Included in selling, general and administrative expenses, we have recognized expense related to the Management Interests of $13, $11 and $1 for the years ended December 31, 2007 and 2006 and eight months ended December 31, 2005. The 2007 expense includes $4 for the repurchase of unvested equity interests granted to former executive officers and the $8 for the vesting of the unvested Management Interests. The 2006 expense includes $9 for the repurchase of unvested equity interests granted to former executive officers.
Under repurchase agreements entered into with each of the executive officers, Maple Timber agreed to repurchase all of the executive officer’s Paper Class A Common Percentage Interests and Paper Class B Common Percentage Interests. NewPage loaned an aggregate of $11 to Maple Timber and $5 in January 2008 to NewPage Group to enable each entity to satisfy its repurchase obligations, which was recorded as a reduction in shareholder’s equity as repayment is not assured.
Furthermore, certain other members of our management were issued options to purchase Class A Common Percentage Interests that only vest upon the occurrence of a change of control or an initial public offering. These options expire ten years from the date of issuance. In connection with the equity reorganization these options were converted to options to purchase NewPage Group common stock.
NewPage Group Equity Incentive Plan
In 2007, the board of directors of NewPage Group adopted the NewPage Group Equity Incentive Plan and authorized 9.9 million shares for issuance under the plan. The incentive plan provides for the grant of stock options, stock appreciation rights, restricted stock, performance awards (including cash performance awards) and other equity-based awards. Grants of stock options and other stock-based compensation awards are approved by the compensation committee of NewPage Group’s board of directors.
Stock options expire not later than ten years from the date of grant. Effective as of December 21, 2007, options on 6,282,315 shares were awarded under the plan. Half of the options will vest in three equal annual installments through December 31, 2010. The other 50% of the options will vest in three equal annual installments only if performance targets are met during 2008, 2009 and 2010. All options will vest only to the extent the employee remains employed by us on each vesting date. However, a portion of the options will automatically vest upon a change of control or an initial public offering. Because the performance targets are determined annually, the performance-based options will not be considered granted until the performance criteria are approved by the compensation committee. Thus, while the performance-based options have already been awarded, for accounting purposes they will not be considered granted until the performance criteria are approved by the compensation committee in a future period.
F-24
Table of Contents
NEWPAGE GROUP INC. AND SUBSIDIARIES
NOTES TO CONSOLIDATED FINANCIAL STATEMENTS—(Continued)
YEARS ENDED DECEMBER 31, 2007, 2006 AND
EIGHT MONTHS ENDED DECEMBER 31, 2005
Dollars in millions, except per share amounts
The following table summarizes activity in the plan:
Shares of NewPage Group issuable under stock options, in thousands | Options | Weighted- average exercise price | |||
Maple Timber options converted | 232 | $ | 0.98 | ||
Granted | 3,141 | 21.22 | |||
Outstanding at December 31, 2007 | 3,373 | 19.83 | |||
None of the outstanding options were exercisable as of December 31, 2007. The outstanding options at December 31, 2007, have a weighted-average remaining contractual life of 9.8 years. As of December 31, 2007, unrecognized compensation cost for the options totaled $34. Stock compensation expense is expected to be $21, $9 and $4 in 2008, 2009 and 2010 for these options.
We utilize a Black-Scholes pricing model to determine the fair value of options granted in accordance with SFAS 123R. The determination of the fair value of stock-based payment awards on the date of grant using an option-pricing model is affected by the stock price as well as assumptions regarding a number of other variables. These variables include expected stock price volatility over the term of the awards and projected employee stock option exercise behaviors (term of option). We estimate the expected term of options granted by incorporating the contractual term of the options and employees’ expected exercise behaviors. We estimate the volatility of our common stock by considering volatility of appropriate peer companies and adjusting for factors unique to our stock, including the effect of debt leverage. Assumptions used to determine the fair value of option grants are as follows:
| Year ended December 31, 2007 | ||||
Weighted-average fair value of options granted | $ | 12.28 | ||
Weighted-average assumptions used for grants: | ||||
Expected volatility | 60 | % | ||
Risk-free interest rate | 3.7 | % | ||
Expected life of option (in years) | 6 | |||
Included in selling, general and administrative expenses, we have recognized expense for the options granted in 2007 of $1 for the year ended December 31, 2007.
M. RETIREMENT AND OTHER POSTRETIREMENT BENEFITS
We provide retirement benefits for certain U.S. and Canadian employees. In the U.S., pension benefits are provided through employer-funded qualified (funded) and non-qualified (unfunded) defined benefit plans and are a function of either years worked multiplied by a flat monetary benefit, or of years worked multiplied by the best five years average earnings out of the last ten years, during an employee’s pensionable service. In Canada, pension benefits are provided through employer- and employee-funded defined benefit plans and benefits are a function of years worked and average final earnings during an employee’s pensionable service. Certain of the U.S. and Canadian pension benefits
F-25
Table of Contents
NEWPAGE GROUP INC. AND SUBSIDIARIES
NOTES TO CONSOLIDATED FINANCIAL STATEMENTS—(Continued)
YEARS ENDED DECEMBER 31, 2007, 2006 AND
EIGHT MONTHS ENDED DECEMBER 31, 2005
Dollars in millions, except per share amounts
are provided in accordance with collective bargaining agreements. Where pre-funding is required, independent actuaries determine the employer contributions necessary to meet the future obligations of the plans and such plan assets are held in trust for the plans. Benefits under our Canadian supplemental pension plan are unfunded but are secured through a letter of credit arrangement (Note O). Plan assets were measured as of December 31, 2007 and September 30, 2006.
We also provide other retirement and post-employment benefits for certain U.S. and Canadian employees, which may include healthcare benefits for certain retirees prior to their reaching age 65, healthcare benefits for certain retirees on and after their reaching age 65, long-term disability benefits, continued group life insurance and extended health and dental benefits. These are provided through various employer- and/or employee-funded postretirement benefit plans. We generally fund the employer portion of these other postretirement benefits on a pay-as-you-go basis. In certain instances in the U.S., benefits have been pre-funded through a Voluntary Employee Benefit Association (“VEBA”). These other postretirement benefit obligations are not required to be pre-funded. For certain U.S. postretirement healthcare plans the employer contributions toward the annual healthcare premium equivalent for retirees are limited to a specific monetary value or percentage, in which instance the remainder of the premium equivalent is the responsibility of the retiree. Certain of the U.S. and Canadian other postretirement benefits are provided in accordance with collective bargaining agreements.
We also sponsor defined contribution plans for certain U.S. employees. Employees may elect to contribute a percentage of their salary on a pre-tax basis, subject to regulatory limitations, into an account with an independent trustee which can then be invested in a variety of investment options at the employee’s discretion. The employer may also contribute to the employee’s account depending upon the requirements of the plan. For certain employees these employer contributions may be in the form of a specified percentage of each employee’s total compensation or in the form of discretionary profit-sharing that may vary depending on the achievement of certain objectives. Certain of the U.S. defined contribution benefits are provided in accordance with collective bargaining agreements. During the years ended December 31, 2007, 2006 and the eight months ended December 31, 2005, we incurred expenses of $16, $15 and $10 for employer contributions to these defined contribution plans.
F-26
Table of Contents
NEWPAGE GROUP INC. AND SUBSIDIARIES
NOTES TO CONSOLIDATED FINANCIAL STATEMENTS—(Continued)
YEARS ENDED DECEMBER 31, 2007, 2006 AND
EIGHT MONTHS ENDED DECEMBER 31, 2005
Dollars in millions, except per share amounts
The following table sets forth the changes in the benefit obligation relating to defined benefit pension and other postretirement benefits and fair value of plan assets during the year and also the funded status of our defined benefit pension and other postretirement benefit plans showing the amounts recognized in our consolidated balance sheets as of December 31, 2007 and 2006. The U.S. defined benefit pension obligations include unfunded liabilities of $12 and zero as of December 31, 2007 and 2006, associated with a non-qualified defined benefit pension plan in the U.S.
| 2007 | 2006 | |||||||||||||||||||||||
| Pension Plans | Other Post- retirement Plans | Pension Plan | Other Post- retirement Plan | |||||||||||||||||||||
| U.S. | Canada | U.S. | Canada | U.S. | U.S. | |||||||||||||||||||
Benefit obligation at beginning of period | $ | 197 | $ | — | $ | 23 | $ | — | $ | 254 | $ | 30 | ||||||||||||
Acquisition | 804 | 325 | 247 | 26 | — | — | ||||||||||||||||||
Service cost | 9 | — | 1 | — | 9 | 1 | ||||||||||||||||||
Interest cost | 16 | 1 | 2 | — | 12 | 1 | ||||||||||||||||||
Plan participant contributions | — | — | 1 | — | — | — | ||||||||||||||||||
Benefits paid | (12 | ) | — | (2 | ) | — | (7 | ) | (1 | ) | ||||||||||||||
Settlement | — | — | — | — | (68 | ) | — | |||||||||||||||||
Curtailment | — | — | — | — | — | (8 | ) | |||||||||||||||||
Termination benefits | 1 | — | — | — | — | 1 | ||||||||||||||||||
Actuarial (gains) losses | (8 | ) | 7 | — | 1 | (3 | ) | (1 | ) | |||||||||||||||
Benefit obligation at end of period | 1,007 | 333 | 272 | 27 | 197 | 23 | ||||||||||||||||||
Fair value of plan assets at beginning of period | 244 | — | — | — | 305 | — | ||||||||||||||||||
Acquisition | 808 | 296 | 10 | — | — | — | ||||||||||||||||||
Actual return on plan assets | 44 | — | — | — | 27 | — | ||||||||||||||||||
Plan participant contributions | — | — | 1 | — | — | — | ||||||||||||||||||
Employer contributions | — | — | 1 | — | — | 1 | ||||||||||||||||||
Settlement | — | — | — | — | (81 | ) | — | |||||||||||||||||
Benefits paid | (12 | ) | — | (2 | ) | — | (7 | ) | (1 | ) | ||||||||||||||
Fair value of plan assets at end of period | 1,084 | 296 | 10 | — | 244 | — | ||||||||||||||||||
Funded status at end of period | $ | 77 | $ | (37 | ) | $ | (262 | ) | $ | (27 | ) | $ | 47 | $ | (23 | ) | ||||||||
Included in the balance sheet: | ||||||||||||||||||||||||
Other assets | $ | 89 | $ | — | $ | — | $ | — | $ | 47 | $ | — | ||||||||||||
Accrued expenses | (1 | ) | — | (27 | ) | — | — | (1 | ) | |||||||||||||||
Other long-term obligations | (11 | ) | (37 | ) | (235 | ) | (27 | ) | — | (22 | ) | |||||||||||||
Total net asset (liability) | $ | 77 | $ | (37 | ) | $ | (262 | ) | $ | (27 | ) | $ | 47 | $ | (23 | ) | ||||||||
Weighted-average assumptions: | ||||||||||||||||||||||||
Discount rate | 6.4 | % | 5.5 | % | 6.1 | % | 5.0 | % | 5.9 | % | 5.7 | % | ||||||||||||
Long-term expected rate of return on plan assets | 7.9 | % | 7.0 | % | 4.5 | % | — | 7.4 | % | — | ||||||||||||||
Rate of compensation increase for compensation-based plans | 4.5 | % | 2.5 | % | N/A | N/A | N/A | N/A | ||||||||||||||||
F-27
Table of Contents
NEWPAGE GROUP INC. AND SUBSIDIARIES
NOTES TO CONSOLIDATED FINANCIAL STATEMENTS—(Continued)
YEARS ENDED DECEMBER 31, 2007, 2006 AND
EIGHT MONTHS ENDED DECEMBER 31, 2005
Dollars in millions, except per share amounts
The assumed discount rates used in determining the benefit obligations were determined by reference to the yield on zero-coupon corporate bonds rated Aa or AA maturing in conjunction with the expected timing and amount of future benefit payments.
The amounts in accumulated other comprehensive income that have not been recognized as components of net periodic defined benefit pension and other postretirement benefit cost as of December 31, 2007 and 2006 are as follows:
| 2007 | 2006 | |||||||||||||||||||||
| Pension Plans | Other Post- retirement Plans | Pension Plan | Other Post- retirement Plan | |||||||||||||||||||
| U.S. | Canada | U.S. | Canada | U.S. | U.S. | |||||||||||||||||
Unrecognized net actuarial (gains) losses | $ | (39 | ) | $ | 8 | $ | (2 | ) | $ | — | $ | (12 | ) | $ | (2 | ) | ||||||
Deferred taxes | 10 | — | — | — | — | — | ||||||||||||||||
Total accumulated other comprehensive income, net of taxes | $ | (29 | ) | $ | 8 | $ | (2 | ) | $ | — | $ | (12 | ) | $ | (2 | ) | ||||||
The estimated net actuarial (gain) and prior service cost for the defined benefit pension plans of the U.S. that will be amortized from accumulated other comprehensive income into net periodic benefit cost over the next year are $(1) and less than $1. The estimated net actuarial loss for the Canadian defined benefit pension plans that will be amortized from accumulated other comprehensive income into net periodic benefit cost over the next year is zero. The estimated net actuarial (gain) for U.S. and Canadian other postretirement benefit plans that will be amortized from accumulated other comprehensive income into net periodic benefit cost over the next year is zero.
Total accumulated benefit obligation (“ABO”) as of December 31, 2007 and 2006 was $976 and $197 for all defined benefit pension plans in the U.S. and $318 and zero for all defined benefit pension plans in Canada.
For defined benefit pension plans where the ABO exceeds the fair value of plan assets, the ABO, the projected benefit obligation (“PBO”) and the fair value of plan assets as of December 31, 2007 are as follows:
| 2007 | ||||||
| U.S. | Canada | |||||
ABO | $ | 12 | $ | 220 | ||
PBO | 12 | 231 | ||||
Fair value of assets | — | 197 | ||||
For defined benefit pension plans where the PBO exceeds the fair value of plan assets, the ABO, the PBO and fair value of plan assets as of December 31, 2007 are as follows:
| 2007 | ||||||
| U.S. | Canada | |||||
ABO | $ | 12 | $ | 318 | ||
PBO | 12 | 333 | ||||
Fair value of assets | — | 296 | ||||
F-28
Table of Contents
NEWPAGE GROUP INC. AND SUBSIDIARIES
NOTES TO CONSOLIDATED FINANCIAL STATEMENTS—(Continued)
YEARS ENDED DECEMBER 31, 2007, 2006 AND
EIGHT MONTHS ENDED DECEMBER 31, 2005
Dollars in millions, except per share amounts
Pension plan assets are held in trusts with investment policies providing a framework within which to manage the assets in each trust. Weighted-average long-term strategic allocation target ranges for investments for the U.S. pension plans are as follows: cash and cash equivalents 0% to 8%, equity securities 39% to 61%, debt securities 27% to 43%, real estate 5% to 10% and other investments 5% to 10%. In Canada, the investment policy sets the long-term return target for the assets at a real return of 4% and defines the long-term strategic allocation targets for cash and cash equivalents at 0% to 25%, equity securities at 20% to 65%, and debt securities at 10% to 60%.
The expected role of equity investments is to invest in well-diversified portfolios of domestic and international securities. The role of debt investments is to invest in well-diversified portfolios of debt instruments such that the average weighted duration does not exceed the duration of the Lehman Brothers Aggregate Index by more than approximately two years. We review investment policy statements at least once per year. In addition, the portfolios are reviewed at least quarterly to determine their deviation from target weightings and are rebalanced as necessary.
Defined benefit pension plan assets percentage of fair value by asset category at December 31, 2007 and September 30, 2006 are as follows:
| 2007 | 2006 | ||||||||
| U.S. | Canada | U.S. | |||||||
Cash and cash equivalents | 6 | % | 5 | % | — | % | |||
Equity securities | 55 | 54 | 65 | ||||||
Debt securities | 29 | 41 | 35 | ||||||
Real estate | 4 | — | — | ||||||
Other, including alternative investments | 6 | — | — | ||||||
Total | 100 | % | 100 | % | 100 | % | |||
The plans have an expected long-term rate of return on plan assets assumption ranging from 7.4% to 8.0% for the various U.S. plans and of 7.0% for the Canadian plans. These rates were derived based on the capital market assumptions for each designated asset class under the respective trust’s investment policy. The capital market assumptions reflect a combination of historical performance analysis and the forward-looking return expectations of the financial markets.
The investment policy for other postretirement benefits takes into consideration the fact that retiree healthcare obligations are not required to be funded and the pre-funding that exists will be fully utilized within the next fiscal year.
Assumptions related to retiree healthcare benefits as of December 31 are as follows:
| 2007 | 2006 | ||||||||
| U.S. | Canada | U.S. | |||||||
Weighted-average healthcare cost trend rate assumed for next year | 8.4 | % | 13.0 | % | 11.0 | % | |||
Rate to which the cost trend rate is assumed to decline | 5.0 | % | 6.0 | % | 5.0 | % | |||
Range of years that the rate reaches the ultimate trend rate depending upon the plan | 2011-2017 | 2016 | 2013 | ||||||
F-29
Table of Contents
NEWPAGE GROUP INC. AND SUBSIDIARIES
NOTES TO CONSOLIDATED FINANCIAL STATEMENTS—(Continued)
YEARS ENDED DECEMBER 31, 2007, 2006 AND
EIGHT MONTHS ENDED DECEMBER 31, 2005
Dollars in millions, except per share amounts
A one-percentage-point change in assumed retiree healthcare costs trend rates would have the following effects at December 31, 2007:
| Increase | Decrease | |||||||||||||
| U.S. | Canada | U.S. | Canada | |||||||||||
Effect on total service and interest cost components | $ | — | $ | — | $ | — | $ | — | ||||||
Effect on accumulated postretirement benefit obligation | 3 | 1 | (3 | ) | (1 | ) | ||||||||
A summary of the components of net periodic costs and amounts recognized in other comprehensive income for the years ended December 31, 2007 and 2006 and the eight months ended December 31, 2005, is as follows:
| Year Ended December 31, 2007 | Year Ended December 31, 2006 | Eight Months Ended December 31, 2005 | ||||||||||||||
| U.S. | Canada | U.S. | U.S. | |||||||||||||
Pension Plans | ||||||||||||||||
Service cost | $ | 8 | $ | — | $ | 9 | $ | 8 | ||||||||
Interest cost | 13 | 1 | 12 | 9 | ||||||||||||
Termination benefits | 1 | — | — | — | ||||||||||||
Expected return on plan assets | (20 | ) | (1 | ) | (19 | ) | (16 | ) | ||||||||
Net periodic cost before settlement and curtailment | 2 | — | 2 | 1 | ||||||||||||
Settlement loss | — | — | 5 | — | ||||||||||||
Curtailment loss | — | — | 2 | — | ||||||||||||
Net periodic cost (income) after settlement and curtailment | 2 | — | 9 | 1 | ||||||||||||
Less—cost (income) allocated to discontinued operations | — | — | 7 | — | ||||||||||||
Net periodic cost allocated to continuing operations | $ | 2 | $ | — | $ | 2 | $ | 1 | ||||||||
Weighted-average assumptions: | ||||||||||||||||
Discount rate | 6.3 | % | 5.7 | % | 5.7 | % | 5.3 | % | ||||||||
Long-term expected rate of return on plan assets | 7.9 | % | 7.0 | % | 7.4 | % | 8.0 | % | ||||||||
Rate of compensation increase for compensation-based plans | 4.5 | % | 2.5 | % | N/A | N/A | ||||||||||
Other Postretirement Plans | ||||||||||||||||
Service cost | $ | 1 | $ | — | $ | 1 | $ | 1 | ||||||||
Interest cost | 2 | — | 1 | 1 | ||||||||||||
Termination benefits | — | — | 1 | — | ||||||||||||
Net periodic cost before settlement and curtailment | 3 | — | 3 | 2 | ||||||||||||
Curtailment (gain) loss | — | — | (8 | ) | — | |||||||||||
Net periodic cost (income) after settlement and curtailment | 3 | — | (5 | ) | 2 | |||||||||||
Less—cost (income) allocated to discontinued operations | — | — | (7 | ) | — | |||||||||||
Net periodic cost allocated to continuing operations | $ | 3 | $ | — | $ | 2 | $ | 2 | ||||||||
Weighted-average assumptions: | ||||||||||||||||
Discount rate | 6.1 | % | 5.2 | % | 5.6 | % | 5.3 | % | ||||||||
Long-term expected rate of return on plan assets | 4.5 | % | — | — | — | |||||||||||
F-30
Table of Contents
NEWPAGE GROUP INC. AND SUBSIDIARIES
NOTES TO CONSOLIDATED FINANCIAL STATEMENTS—(Continued)
YEARS ENDED DECEMBER 31, 2007, 2006 AND
EIGHT MONTHS ENDED DECEMBER 31, 2005
Dollars in millions, except per share amounts
Estimated future benefit payments for the plans for each of the next five years and for the five years thereafter are expected to be paid as follows:
| Pension Plans | Other Postretirement Plans | |||||||||||
| U.S. | Canada | U.S. | Canada | |||||||||
2008 | $ | 59 | $ | 20 | $ | 27 | $ | 3 | ||||
2009 | 61 | 19 | 28 | 2 | ||||||||
2010 | 62 | 20 | 27 | 2 | ||||||||
2011 | 63 | 20 | 27 | 2 | ||||||||
2012 | 65 | 20 | 26 | 2 | ||||||||
2013 through 2017 | 349 | 112 | 117 | 9 | ||||||||
Expected employer contributions to be paid into the plans during the next year are as follows:
| Pension Plans | Other Postretirement Plans | |||||||||||
| U.S. | Canada | U.S. | Canada | |||||||||
Expected payments during 2008 | $ | 1 | $ | 10 | $ | 18 | $ | 2 | ||||
Certain of our other postretirement benefit plans have elected to receive a subsidy from the U.S. government pursuant to the Medicare Prescription Drug Improvement and Modernization Act of 2003 related to our continuation of those certain other postretirement benefit plans. The effect of this subsidy reduces 2007 expense for other postretirement benefit plans by less than $1. There was no effect on 2006 expense.
In September 2006, the Financial Accounting Standards Board issued SFAS No. 158,Employers’ Accounting for Defined Benefit Pension and Other Postretirement Plans. SFAS No. 158 requires an employer to recognize the overfunded or underfunded status of defined benefit pension and other postretirement plans as an asset or liability in its statement of financial position and to recognize changes in that funded status in the year in which the changes occur through comprehensive income. SFAS No. 158 also requires an employer to measure the funded status of a plan as of the date of its year-end statement of financial position. Effective December 31, 2006, we adopted the recognition provision of SFAS No. 158 which resulted in a ($14) increase in accumulated other comprehensive income, a $12 increase in other assets and a $2 decrease in other long-term obligations. Effective December 31, 2007, we adopted the measurement provision of SFAS No. 158, which did not have a material effect on our consolidated financial position, results of operations or cash flows.
A curtailment loss of $1 resulted from the permanent shutdown of our No. 7 paper machine and related activities at the Luke, Maryland operation during the fourth quarter of 2006. Because the curtailment loss occurred after the plan measurement date, but before our year end, the loss was recognized in the first quarter of 2007 in accordance with SFAS No. 88,Employers’ Accounting for Settlements and Curtailments of Defined Benefit Pension Plans and for Termination Benefits.
F-31
Table of Contents
NEWPAGE GROUP INC. AND SUBSIDIARIES
NOTES TO CONSOLIDATED FINANCIAL STATEMENTS—(Continued)
YEARS ENDED DECEMBER 31, 2007, 2006 AND
EIGHT MONTHS ENDED DECEMBER 31, 2005
Dollars in millions, except per share amounts
N. SHUTDOWN OF NO. 7 PAPER MACHINE
During the fourth quarter of 2006, we announced a plan to permanently shut down the No. 7 paper machine and related activities and to reduce headcount by approximately 130 employees at the Luke, Maryland, operation largely as a result of the growing influx of low-priced imported paper, particularly from China, Indonesia and South Korea. We took this action in order to continue to improve our cost position and financial performance and better align capacity with market demand.
As a result of this action, we incurred total pretax charges of $18, including $15 for accelerated depreciation and inventory write-offs recorded in the fourth quarter of 2006 and $3 in cost of sales for severance and early retirement benefits, of which $2 was recorded in the fourth quarter of 2006 and $1 was recorded in the first quarter of 2007. As of June 30, 2007, this action was complete.
The activity in the accrued severance liability relating to this action for the first half ended June 30, 2007 was as follows:
| Employee Costs | ||||
Balance accrued at December 31, 2006 | $ | 2 | ||
Payments | (2 | ) | ||
Balance accrued at June 30, 2007 | $ | — | ||
O. COMMITMENTS AND CONTINGENCIES
Contingencies
Claims have been made against us for the costs of environmental remedial measures taken or to be taken. Reserves for these liabilities have been established and no insurance recoveries have been anticipated in the determination of the reserves. We are involved in various other litigation and administrative proceedings arising in the normal course of business. Although the ultimate outcome of these matters cannot be predicted with certainty, we do not believe that the currently expected outcome of any matter, lawsuit or claim that is pending or threatened, or all of them combined, will have a material adverse effect on our financial condition, results of operations or liquidity.
Commitments
We are party to fiber supply agreements that entitle us to purchase minimum volumes of wood at market prices for periods through 2026, with renewal periods at our option. We are required to purchase minimum levels and have optional volumes that we can purchase under some of the agreements. The agreements include a limitation of damages under which our maximum potential damages for default are based on a price per ton of wood not delivered, unless the failure is the result of aforce majeure event that would have prevented either party from performing its obligations. The aggregate maximum amount of potential damages declines from approximately $20 per year in 2008 and totals an aggregate of $208 for all periods. These contracts are assignable by either party with mutual consent.
F-32
Table of Contents
NEWPAGE GROUP INC. AND SUBSIDIARIES
NOTES TO CONSOLIDATED FINANCIAL STATEMENTS—(Continued)
YEARS ENDED DECEMBER 31, 2007, 2006 AND
EIGHT MONTHS ENDED DECEMBER 31, 2005
Dollars in millions, except per share amounts
We have provided letters of credit to various environmental agencies as a means of providing financial assurance with regard to environmental liabilities. We also provided a letter of credit for securing a supplemental pension obligation and certain letters of credit or other financial assurance obligations to fulfill supplier financial assurance requirements. As of December 31, 2007, we had $74 in outstanding letters of credit. Payment would only be required under these letters of credit if we defaulted on commitments made under these arrangements.
We are a party to a service agreement that provides information technology services and human resources services necessary to support our operations through January 31, 2013, at specified monthly base prices. The base price for services under the agreement is approximately $30 annually and can be terminated with a penalty that declines over time.
In 2003, the Port Hawkesbury mill was awarded financial assistance in the amount of Canadian $15 from the Province of Nova Scotia to provide a contribution towards training and infrastructure costs associated with the construction of a thermo-mechanical pulp line. We have received C$12 as of December 31, 2007, and the remaining C$3 has been accrued for as a contribution receivable at December 31, 2007.
In 2006, we were awarded financial assistance in the amount of C$65 from the Province of Nova Scotia in settlement of its commitment to provide licensed land to the Port Hawkesbury mill. The amount will be paid out over seven years (C$10 in each of the first six years, and C$5 in the seventh year). Payout is to be made upon completion of each cumulative 12 month period of operation of the newsprint and supercalendared paper machines. If there is no production for 24 continuous months, all current and future payments are forfeited.
P. LEASE OBLIGATIONS
We lease certain buildings, transportation equipment and office equipment under operating leases with terms of one to 10 years. Rental expense for the years ended December 31, 2007 and 2006, and eight months ended December 31, 2005 was $8, $8 and $7.
As part of the Acquisition, we assumed the rights and obligations associated with a capital lease for a paper machine. The lease has a basic lease term which expires in 2014. At the end of the basic lease term, we have the option to purchase the machine or the lessor can require us to renew the lease through 2025. The lease contains purchase options at amounts approximating fair market value in 2010 and at lease termination. This lease requires us to pay customary operating and repair expenses and to observe certain operating restrictions. The leased asset is included in property, plant and equipment.
F-33
Table of Contents
NEWPAGE GROUP INC. AND SUBSIDIARIES
NOTES TO CONSOLIDATED FINANCIAL STATEMENTS—(Continued)
YEARS ENDED DECEMBER 31, 2007, 2006 AND
EIGHT MONTHS ENDED DECEMBER 31, 2005
Dollars in millions, except per share amounts
Future minimum non-cancelable operating lease payments and capital lease payments and the related present value of the capital lease payments at December 31, 2007 are as follows:
| Operating Leases | Capital Lease | ||||||
2008 | $ | 7 | $ | 8 | |||
2009 | 5 | 7 | |||||
2010 | 5 | 7 | |||||
2011 | 4 | 7 | |||||
2012 | 3 | 7 | |||||
Thereafter | 7 | 243 | |||||
Total minimum lease payments | $ | 31 | 279 | ||||
Portion representing interest | (133 | ) | |||||
Present value of net minimum lease payments | $ | 146 | |||||
Q. RELATED PARTY TRANSACTIONS
Cerberus Capital Management, L.P., our equity sponsor, retains consultants that specialize in operations management and support and who provide Cerberus with consulting advice concerning portfolio companies in which funds and accounts managed by Cerberus or its affiliates have invested. From time to time, Cerberus makes the services of these consultants available to Cerberus portfolio companies. We believe that the terms of these consulting arrangements are materially consistent with those terms that would have been obtained in an arrangement with an unaffiliated third party. We have commercial arrangements with other entities that are owned or controlled by Cerberus. SENA is a party to a capital lease entered into prior to the Acquisition for which Chrysler Capital, an affiliate of Cerberus, is an equity investor and is entitled to certain equity buyout payments no earlier than 2014. In addition, Commercial Finance LLC, an affiliate of Cerberus, is a revolving lender under our senior secured revolving credit facility. We believe that these transactions are at arms’-length terms and are not material to our results of operations or financial position.
Subsequent to the Acquisition, we are a party to various purchase agreements with SEO. We also sell power generated at Consolidated Water Power Company, a wholly-owned subsidiary, to SEO. We believe that these transactions are at arms’-length terms and are not material to our results of operations or financial position.
During 2005 we were party to fiber supply agreements with Escanaba Timber LLC, whereby we were entitled to purchase wood fibers from them at prevailing market rates. During the eight months ended December 31, 2005, we made purchases of $15 from them. In addition, we provided certain management services to them, including human resources, information technology and accounting. Our billings to them for these services were not significant. As of December 31, 2005, Escanaba Timber LLC had sold substantially all of its timberlands. The acquirers assumed the commitments under the fiber supply agreements and we negotiated certain revisions to the agreements. During the eight months ended December 31, 2005, we received $4 for changes made to a fiber supply agreement in conjunction with one of Escanaba Timber LLC’s dispositions. We have accounted for this payment as an additional capital contribution from Escanaba Timber LLC.
F-34
Table of Contents
NEWPAGE GROUP INC. AND SUBSIDIARIES
NOTES TO CONSOLIDATED FINANCIAL STATEMENTS—(Continued)
YEARS ENDED DECEMBER 31, 2007, 2006 AND
EIGHT MONTHS ENDED DECEMBER 31, 2005
Dollars in millions, except per share amounts
We are the general partner and have a 30% interest in Rumford Cogeneration Company, L.P., a limited partnership which operates the cogeneration facility located at our Rumford, Maine paper mill. Prior to January 1, 2006, we accounted for this investment using the equity method of accounting. As of January 1, 2006, we consolidated the partnership. Prior to being consolidated, sales of byproducts and charges for management services to the limited partnership were $36 for the eight months ended December 31, 2005. Purchases from the limited partnership were $32 for the eight months ended December 31, 2005. Distributions received from the limited partnership were $8 for the eight months ended December 31, 2005.
R. ACCUMULATED OTHER COMPREHENSIVE INCOME (LOSS)
Total comprehensive income (loss) is comprised of net income (loss), net unrealized gain (loss) on cash flow hedges and net actuarial gain (loss) on our defined benefit plans. The components of accumulated other comprehensive income (loss) as of December 31, 2007 and 2006 are as follows:
| 2007 | 2006 | |||||
Unrealized gain (loss) on cash flow hedge, net of tax expense (benefit) of $(1) and $3 | $ | — | $ | 6 | ||
Unrecognized gain on defined benefit plans, net of tax of $10 and zero | 23 | 14 | ||||
| $ | 23 | $ | 20 | |||
S. SALE OF HYDROELECTRIC FACILITIES
On June 8, 2006, Rumford Falls Power Company, an indirect wholly-owned subsidiary of NewPage, completed the sale of two hydroelectric generating facilities located on the Androscoggin River in Rumford, Maine to Brookfield Power Inc. for a cash sales price of $144. Included in other income (expense) for the year ended December 31, 2006 is a gain on the sale of $65.
T. SALE OF CARBONLESS PAPER BUSINESS
Effective April 1, 2006, we completed the sale of our carbonless paper business to P. H. Glatfelter Company for a cash sales price of $84.
Net sales of the carbonless paper business (included in discontinued operations) were $106 and $283 for the year ended December 31, 2006 and eight months ended December 31, 2005. Included in the loss from discontinued operations for year ended December 31, 2006, is $19 of charges related to the sale of the business, including curtailment and settlement costs related to the employee benefit plans.
U. RECENTLY ISSUED ACCOUNTING STANDARDS
In December 2007, the Financial Accounting Standards Board (FASB) issued SFAS No. 141 (revised 2007),Business Combinations (SFAS No. 141R), which replaces SFAS No. 141. SFAS No. 141R establishes principles and requirements for how an acquirer recognizes and measures in its financial statements identifiable assets acquired, liabilities assumed, any noncontrolling interest in the acquiree and goodwill acquired. The Statement also establishes disclosure requirements, which will
F-35
Table of Contents
NEWPAGE GROUP INC. AND SUBSIDIARIES
NOTES TO CONSOLIDATED FINANCIAL STATEMENTS—(Continued)
YEARS ENDED DECEMBER 31, 2007, 2006 AND
EIGHT MONTHS ENDED DECEMBER 31, 2005
Dollars in millions, except per share amounts
enable users to evaluate the nature and financial effects of the business combination. SFAS No. 141R is effective for us as of January 1, 2009; early adoption is prohibited. We are currently evaluating the potential effect, if any, of the adoption of SFAS No. 141R on our consolidated financial position, results of operations and cash flows.
In December 2007, the FASB issued SFAS No. 160,Noncontrolling Interests in Consolidated Financial Statements—an amendment of Accounting Research Bulletin No. 51 (SFAS No. 160), which establishes accounting and reporting standards for ownership interests in subsidiaries held by parties other than the parent, the amount of consolidated net income attributable to the parent and to the noncontrolling interest, changes in a parent’s ownership interest and the valuation of retained noncontrolling equity investments when a subsidiary is deconsolidated. The Statement also establishes reporting requirements that provide sufficient disclosures that clearly identify and distinguish between the interests of the parent and the interests of the noncontrolling owners. SFAS No. 160 is effective for us as of January 1, 2009; early adoption is prohibited. The adoption of SFAS No. 160 will result in the reclassification of minority interests to shareholders’ equity. We are currently evaluating further effects, if any, of this standard on our consolidated financial position, results of operations and cash flows.
In September 2006, the FASB issued SFAS No. 157,Fair Value Measurements (SFAS No. 157). SFAS No. 157 defines fair value, establishes a framework for measuring fair value and expands disclosures about fair value measurements. In February 2008, the FASB issued FSP FAS 157-2, which delays the effective date of SFAS No. 157 by one year for nonfinancial assets and liabilities that are recognized or disclosed at fair value in the financial statements on a nonrecurring basis. For items covered by FSP FAS 157-2, SFAS No. 157 will now go into effect for us as of January 1, 2009. The adoption of SFAS No. 157 for financial related items did not have a material effect on our consolidated financial position, results of operations or cash flows. We are still evaluating the potential effect of adoption of SFAS No. 157 for non-financial items.
V. SUBSEQUENT EVENT
On January 16, 2008, we announced actions being taken to integrate NewPage operations and the former SENA facilities and services. These restructuring decisions are intended to create the platform essential to become one company, remain competitive in the marketplace, serve our customers more efficiently and reach the synergies we have committed to achieve.
The specific restructuring actions are as follows:
| Ÿ | Permanently close the No. 11 paper machine in Rumford, Maine, which produces coated freesheet and groundwood papers for magazines and catalogs, which occurred in February 2008. Approximately 60 employees were affected by the shutdown. |
| Ÿ | Permanently close the pulp mill and two paper machines, Nos. 43 and 44, in Niagara, Wisconsin, in the fall of 2008. The Niagara machines produce 250,000 short tons of lightweight coated groundwood papers used in magazines and catalogs. Approximately 320 employees will be affected by the shutdown. |
| Ÿ | Permanently close the No. 95 paper machine in Kimberly, Wisconsin, by the end of May 2008. The Kimberly mill produces coated freesheet papers for publication printing, and specialty |
F-36
Table of Contents
NEWPAGE GROUP INC. AND SUBSIDIARIES
NOTES TO CONSOLIDATED FINANCIAL STATEMENTS—(Continued)
YEARS ENDED DECEMBER 31, 2007, 2006 AND
EIGHT MONTHS ENDED DECEMBER 31, 2005
Dollars in millions, except per share amounts
papers for pressure-sensitive or glue-applied labels. Approximately 125 employees will be affected. |
| Ÿ | Permanently close the Chillicothe, Ohio, converting facility by the end of November 2008 after some of the converting machines and volume are transferred to existing facilities in Luke, Maryland, and Wisconsin Rapids, Wisconsin. Approximately 160 employees will be affected. |
| Ÿ | Effect additional personnel reductions in all areas, including sales, finance and other support functions. Approximately 200 to 250 employees are expected to be affected. |
We intend to reallocate production of paper grades across our remaining combined machine base, resulting in the operation of machines in narrower ranges of paper grades around their peak production. We believe the increase in production from our largest, most efficient paper machines will more than offset the decrease in production from the shutdown or idling of these four less efficient paper machines and will be sufficient to meet the needs of our customers. We expect to recognize up to approximately $45 as a liability on the opening balance sheet for actions related to the acquired operations. We also expect to incur expenses and restructuring charges in 2008 and to a lesser extent in 2009 of up to approximately $55 in the aggregate relating to severance and early retirement benefits, costs of relocating employees and assets and costs of integrating the two businesses, including investments in information systems.
W. CONDENSED PARENT-ONLY FINANCIAL STATEMENTS
NewPage Group has no independent assets or operations other than its investment in NewPage Holding and NewPage. The ability to repay the NewPage Group PIK Notes will be dependent on the ability of NewPage to distribute funds to NewPage Group or of NewPage Group to raise sufficient funds from issuing capital stock. Currently, NewPage’s and NewPage Holding’s existing indebtedness prevents it from making distributions to NewPage Group.
The following condensed parent-only financial statements of NewPage Group reflect majority-owned subsidiaries using the equity basis of accounting.
F-37
Table of Contents
NEWPAGE GROUP INC. AND SUBSIDIARIES
NOTES TO CONSOLIDATED FINANCIAL STATEMENTS—(Continued)
YEARS ENDED DECEMBER 31, 2007, 2006 AND
EIGHT MONTHS ENDED DECEMBER 31, 2005
Dollars in millions, except per share amounts
NEWPAGE GROUP INC.—PARENT ONLY
CONDENSED BALANCE SHEETS
DECEMBER 31, 2007 and 2006
Dollars in millions, except per share amounts
| 2007 | 2006 | |||||||
ASSETS | ||||||||
TOTAL ASSETS—Investment in NewPage Holding | $ | 514 | $ | 194 | ||||
LIABILITIES AND STOCKHOLDER’S EQUITY | ||||||||
Long-term debt—NewPage Group PIK Notes | $ | 207 | $ | — | ||||
STOCKHOLDER’S EQUITY | ||||||||
Common stock, 300,000,000 shares authorized, 56,307,012 and 45,055,686 shares issued and outstanding, $0.01 per share par value | 1 | — | ||||||
Additional paid-in capital | 425 | 293 | ||||||
Accumulated deficit | (142 | ) | (119 | ) | ||||
Accumulated other comprehensive income | 23 | 20 | ||||||
Total stockholder’s equity | 307 | 194 | ||||||
TOTAL LIABILITIES AND STOCKHOLDER’S EQUITY | $ | 514 | $ | 194 | ||||
F-38
Table of Contents
NEWPAGE GROUP INC. AND SUBSIDIARIES
NOTES TO CONSOLIDATED FINANCIAL STATEMENTS—(Continued)
YEARS ENDED DECEMBER 31, 2007, 2006 AND
EIGHT MONTHS ENDED DECEMBER 31, 2005
Dollars in millions, except per share amounts
NEWPAGE GROUP INC.—PARENT ONLY
CONDENSED STATEMENTS OF OPERATIONS
YEARS ENDED DECEMBER 31, 2007, 2006 AND
EIGHT MONTHS ENDED DECEMBER 31, 2005
Dollars in millions
| 2007 | 2006 | 2005 | ||||||||||
Interest expense—non-cash | $ | 1 | $ | — | $ | — | ||||||
Equity in (earnings) loss of NewPage Holding | 22 | 52 | 67 | |||||||||
Net income (loss) | $ | (23 | ) | $ | (52 | ) | $ | (67 | ) | |||
F-39
Table of Contents
NEWPAGE GROUP INC. AND SUBSIDIARIES
NOTES TO CONSOLIDATED FINANCIAL STATEMENTS—(Continued)
YEARS ENDED DECEMBER 31, 2007, 2006 AND
EIGHT MONTHS ENDED DECEMBER 31, 2005
Dollars in millions, except per share amounts
NEWPAGE GROUP INC.—PARENT ONLY
CONDENSED STATEMENTS OF CASH FLOWS
YEARS ENDED DECEMBER 31, 2007, 2006 AND
EIGHT MONTHS ENDED DECEMBER 31, 2005
Dollars in millions
| 2007 | 2006 | 2005 | ||||||||||
CASH FLOWS FROM OPERATING ACTIVITIES | ||||||||||||
Net income (loss) | $ | (23 | ) | $ | (52 | ) | $ | (67 | ) | |||
Adjustments to reconcile net income (loss) to net cash provided by operating activities: | ||||||||||||
Interest expense on NewPage Group PIK Notes | 1 | — | — | |||||||||
Equity in (earnings) loss in NewPage Holding | 22 | 52 | 67 | |||||||||
Net cash provided by operating activities | — | — | — | |||||||||
CASH FLOWS FROM INVESTING ACTIVITIES | ||||||||||||
Investment in NewPage Holding | — | — | (441 | ) | ||||||||
Net cash used in investing activities | — | — | (441 | ) | ||||||||
CASH FLOWS FROM FINANCING ACTIVITIES | ||||||||||||
Proceeds from capital contributions | — | — | 441 | |||||||||
Net cash provided by financing activities | — | — | 441 | |||||||||
Net increase in cash and cash equivalents and cash and cash equivalents at end of period | $ | — | $ | — | $ | — | ||||||
SUPPLEMENTAL INFORMATION | ||||||||||||
Non-cash transactions: | ||||||||||||
Issuance of PIK notes by NewPage Holding as acquisition consideration | $ | — | $ | — | $ | 100 | ||||||
Issuance of securities by NewPage Group as acquisition consideration | $ | 329 | $ | — | $ | — | ||||||
X. Earnings Per Share
In accordance with SFAS No. 128,Earnings per Share, we have added disclosures for earnings per share in conjunction with the filing of the registration statement on Form S-1. Basic net income (loss) per common share are computed by dividing net income (loss) by the weighted-average number of common shares outstanding.
* * * * *
F-40
Table of Contents
NEWPAGE GROUP INC. AND SUBSIDIARIES
CONDENSED CONSOLIDATED BALANCE SHEETS (unaudited)
JUNE 30, 2008 AND DECEMBER 31, 2007
Dollars in millions, except per share amounts
| 2008 | 2007 | |||||||
ASSETS | ||||||||
Cash and cash equivalents | $ | 41 | $ | 143 | ||||
Accounts receivable, net | 338 | 351 | ||||||
Inventories (Note C) | 688 | 584 | ||||||
Other current assets | 45 | 43 | ||||||
Total current assets | 1,112 | 1,121 | ||||||
Property, plant and equipment, net of accumulated depreciation of $510 as of June 30, 2008 and $366 as of December 31, 2007 | 3,461 | 3,564 | ||||||
Other assets | 268 | 200 | ||||||
TOTAL ASSETS | $ | 4,841 | $ | 4,885 | ||||
LIABILITIES AND STOCKHOLDERS’ EQUITY | ||||||||
Accounts payable | $ | 324 | $ | 338 | ||||
Accrued expenses | 263 | 290 | ||||||
Current maturities of long-term debt (Note E) | 16 | 16 | ||||||
Total current liabilities | 603 | 644 | ||||||
Long-term debt (Note E) | 3,293 | 3,277 | ||||||
Other long-term obligations | 339 | 351 | ||||||
Deferred income taxes | 286 | 275 | ||||||
Commitments and contingencies (Note J) | ||||||||
Minority interest | 29 | 31 | ||||||
STOCKHOLDERS’ EQUITY | ||||||||
Common stock, 300,000,000 shares authorized, 56,049,282 and 56,307,012 shares issued and outstanding, $0.01 per share par value | 1 | 1 | ||||||
Additional paid-in capital | 442 | 425 | ||||||
Accumulated deficit | (177 | ) | (142 | ) | ||||
Accumulated other comprehensive income (loss) | 25 | 23 | ||||||
Total stockholders’ equity | 291 | 307 | ||||||
TOTAL LIABILITIES AND STOCKHOLDERS’ EQUITY | $ | 4,841 | $ | 4,885 | ||||
See notes to condensed consolidated financial statements.
F-41
Table of Contents
NEWPAGE GROUP INC. AND SUBSIDIARIES
CONSOLIDATED STATEMENTS OF OPERATIONS (unaudited)
FIRST HALF ENDED JUNE 30, 2008 AND 2007
Dollars in millions, except per share amounts
| First Half Ended June 30, 2008 | First Half Ended June 30, 2007 | |||||||
Net sales | $ | 2,253 | $ | 971 | ||||
Cost of sales | 2,032 | 877 | ||||||
Selling, general and administrative expenses | 117 | 52 | ||||||
Interest expense (including non-cash interest expense of $34 and $14) | 160 | 75 | ||||||
Other (income) expense, net | (8 | ) | — | |||||
Income (loss) before income taxes | (48 | ) | (33 | ) | ||||
Income tax (benefit) | (13 | ) | (1 | ) | ||||
Net income (loss) | $ | (35 | ) | $ | (32 | ) | ||
Income (loss) per share—basic and diluted | $ | (0.63 | ) | $ | (0.70 | ) | ||
Weighted-average number of common shares outstanding (in thousands)—basic and diluted | 56,073 | 45,288 | ||||||
See notes to condensed consolidated financial statements.
F-42
Table of Contents
NEWPAGE GROUP INC. AND SUBSIDIARIES
CONSOLIDATED STATEMENT OF STOCKHOLDERS’ EQUITY (unaudited)
FIRST HALF ENDED JUNE 30, 2008
Dollars in millions, shares in thousands
| �� | Common Stock | Additional Paid-in Capital | Accumulated Deficit | Accumulated Other Comprehensive Income | ||||||||||||||
| Shares | Amount | |||||||||||||||||
Balance at December 31, 2007 | 56,307 | $ | 1 | $ | 425 | $ | (142 | ) | $ | 23 | ||||||||
Net income (loss) | (35 | ) | ||||||||||||||||
Change in unrealized gain (loss) on cash-flow hedges, net of tax of $1 | 3 | |||||||||||||||||
Foreign currency translation adjustment | (1 | ) | ||||||||||||||||
Adjustment to fair value of equity issued to SEO (Note B) | 8 | |||||||||||||||||
Equity awards (Note F) | 15 | |||||||||||||||||
Repurchase of shares | (258 | ) | (6 | ) | ||||||||||||||
Balance at June 30, 2008 | 56,049 | $ | 1 | $ | 442 | $ | (177 | ) | $ | 25 | ||||||||
See notes to condensed consolidated financial statements.
F-43
Table of Contents
NEWPAGE GROUP INC. AND SUBSIDIARIES
CONDENSED CONSOLIDATED STATEMENTS OF CASH FLOWS (unaudited)
FIRST HALF ENDED JUNE 30, 2008 AND 2007
Dollars in millions
| 2008 | 2007 | |||||||
CASH FLOWS FROM OPERATING ACTIVITIES | ||||||||
Net income (loss) | $ | (35 | ) | $ | (32 | ) | ||
Adjustments to reconcile net income (loss) to net cash provided by (used in) operating activities: | ||||||||
Depreciation and amortization | 149 | 67 | ||||||
Non-cash interest expense | 34 | 14 | ||||||
(Gain) loss on sale of assets | 2 | 1 | ||||||
Deferred income taxes | (13 | ) | (1 | ) | ||||
Write-off of costs of proposed initial public offering | — | 3 | ||||||
LIFO effect | 14 | 4 | ||||||
Equity award expense (Note F) | 15 | 1 | ||||||
Change in operating assets and liabilities | (177 | ) | (32 | ) | ||||
Net cash provided by (used in) operating activities | (11 | ) | 25 | |||||
CASH FLOWS FROM INVESTING ACTIVITIES | ||||||||
Proceeds from sales of assets | 5 | — | ||||||
Cash paid for acquisition | (6 | ) | — | |||||
Capital expenditures | (71 | ) | (34 | ) | ||||
Net cash provided by (used in) investing activities | (72 | ) | (34 | ) | ||||
CASH FLOWS FROM FINANCING ACTIVITIES | ||||||||
Payment of financing costs | — | (1 | ) | |||||
Distributions from Rumford Cogeneration to limited partners | (4 | ) | (6 | ) | ||||
Repurchase of shares (Note F) | (6 | ) | — | |||||
Loans to parent companies | — | (3 | ) | |||||
Payments on long-term debt | (8 | ) | (7 | ) | ||||
Net cash provided by (used in) financing activities | (18 | ) | (17 | ) | ||||
Effect of exchange rate changes on cash and cash equivalents | (1 | ) | — | |||||
Net increase (decrease) in cash and cash equivalents | (102 | ) | (26 | ) | ||||
Cash and cash equivalents at beginning of period | 143 | 44 | ||||||
Cash and cash equivalents at end of period | $ | 41 | $ | 18 | ||||
SUPPLEMENTAL INFORMATION— | ||||||||
Cash paid for interest | $ | 129 | $ | 64 | ||||
See notes to condensed consolidated financial statements.
F-44
Table of Contents
NEWPAGE GROUP INC. AND SUBSIDIARIES
NOTES TO CONDENSED CONSOLIDATED FINANCIAL STATEMENTS
Dollars in millions
A. BASIS OF PRESENTATION
NewPage Group, Inc. (“NewPage Group”) and its subsidiaries are engaged in the manufacturing, marketing and distribution of printing papers primarily used for commercial printing, magazines, catalogs, textbooks and labels. Our products include coated, uncoated, supercalendered, newsprint and specialty paper and market pulp. Our products are manufactured at multiple mills in the United States and one mill in Canada and are supported by multiple distribution and converting locations. We operate within one operating segment. The condensed consolidated financial statements include the accounts of NewPage Group and all entities it controls. All intercompany transactions and balances have been eliminated.
Unless otherwise noted, the terms “we,” “our” and “us” refer to NewPage Group and its consolidated subsidiaries, including NewPage Holding Corporation (“NewPage Holding”) and NewPage Corporation (“NewPage”), two separate public-reporting companies.
These interim condensed consolidated financial statements have not been audited. However, in the opinion of management, these financial statements include all normal recurring adjustments necessary for a fair presentation in accordance with accounting principles generally accepted in the United States of America. Certain information and footnote disclosures normally included in annual financial statements presented in accordance with accounting principles generally accepted in the United States have been condensed or omitted. The results of operations and cash flows for the interim periods presented are not necessarily indicative of the results to be expected for the full year. The accompanying financial statements should be read in conjunction with the annual financial statements and notes thereto as of and for the year ended December 31, 2007.
B. ACQUISITION AND RELATED TRANSACTIONS
On December 21, 2007, NewPage acquired all of the issued and outstanding common stock of Stora Enso North America (“SENA”) from Stora Enso Oyj (“SEO”) (the “Acquisition”). The purchase price for SENA included $1,522 in cash (including a final working capital adjustment of $6 paid in the second quarter of 2008) and $200 of notes issued to SEO by NewPage. In addition, SEO received a 19.9% equity interest in NewPage Group.
The condensed consolidated balance sheets in these financial statements include the assets acquired and liabilities assumed of SENA and reflect a preliminary allocation of the purchase price based on estimated fair values at the date of the Acquisition. The following shows the reconciliation of the purchase price paid by NewPage:
Cash paid for acquisition, net of cash acquired | $ | 1,492 | ||
NewPage Group equity issued to SEO (at fair value) | 131 | |||
NewPage Group PIK Notes issued to SEO (at fair value) | 206 | |||
Total paid for acquisition | 1,829 | |||
Reversal of valuation allowance on NewPage Holding deferred tax assets | (39 | ) | ||
Net purchase price allocated | $ | 1,790 | ||
A summary of the preliminary purchase price allocation for the fair value of the assets acquired and the obligations assumed at the date of the Acquisition is presented below. As of June 30, 2008, we
F-45
Table of Contents
NEWPAGE GROUP INC. AND SUBSIDIARIES
NOTES TO CONDENSED CONSOLIDATED FINANCIAL STATEMENTS—(Continued)
Dollars in millions
recorded an adjustment of $8 to the fair value of equity issued to SEO in connection with the Acquisition. As of June 30, 2008, we recorded adjustments to the purchase price allocation for decisions made to reduce benefits for salaried employees to reflect a $29 reduction in benefit obligations under the SENA pension plans and a $21 reduction in benefit obligations under a SENA postretirement plan. In addition, as of June 30, 2008, we recorded $25 of employee-related costs for former SENA employees as a liability on the purchase price allocation. These adjustments have resulted in corresponding entries to property, plant and equipment.
The purchase price allocation is preliminary and is subject to the completion of several items, including consideration of final valuations, adjustments relating to the finalization of the restructuring plan, and for uncertain and deferred tax positions. The final purchase price allocation may materially change from the preliminary purchase price allocation.
Accounts receivable | $ | 204 | ||
Inventory | 323 | |||
Other current assets | 3 | |||
Property, plant and equipment | 2,266 | |||
Other assets | 91 | |||
Total assets acquired | 2,887 | |||
Accounts payable | (199 | ) | ||
Other current liabilities | (160 | ) | ||
Capital lease | (146 | ) | ||
Deferred taxes | (319 | ) | ||
Other long-term obligations | (273 | ) | ||
Total liabilities assumed | (1,097 | ) | ||
Net purchase price allocated | $ | 1,790 | ||
C. INVENTORIES
Inventories as of June 30, 2008 and December 31, 2007 consist of:
| June 30, 2008 | Dec. 31, 2007 | |||||
Finished and in-process goods | $ | 427 | $ | 304 | ||
Raw materials | 107 | 123 | ||||
Stores and supplies | 154 | 157 | ||||
| $ | 688 | $ | 584 | |||
D. DERIVATIVE FINANCIAL INSTRUMENTS
We use derivative financial instruments primarily to manage our exposure to changes in interest rates and foreign currency exchange rates. Interest rate swap agreements and foreign currency forward contracts are accounted for as cash-flow hedges with changes in fair value recorded as a component of accumulated other comprehensive income. Accumulated other comprehensive income is reclassified into current period earnings when the hedged transaction affects earnings. These instruments are classified as other assets or other long-term obligations on our balance sheets depending on the fair value of the instrument.
F-46
Table of Contents
NEWPAGE GROUP INC. AND SUBSIDIARIES
NOTES TO CONDENSED CONSOLIDATED FINANCIAL STATEMENTS—(Continued)
Dollars in millions
In April 2008, we entered into foreign currency forward contracts aggregating $40 of contract value, expiring monthly through December 2008, to hedge the variability of cash flows on anticipated U.S. dollar-denominated transactions with our Canadian subsidiary.
We measure the fair values of our foreign currency forward contracts under a Level 2 input as defined by SFAS No. 157. We value the foreign currency forward contracts based on current quoted market prices for similar contracts. As of June 30, 2008, the fair values of the foreign currency forward contracts were a liability of less than $1 included in other long-term obligations.
As of June 30, 2008, we had outstanding interest rate swaps totaling $1,350, expiring from June 2009 through December 2012. We receive amounts based on LIBOR and pay amounts at a weighted-average fixed rate of 3.7%.
We measure the fair values of our interest rate swaps under a Level 2 input as defined by SFAS No. 157. We value the interest rate swaps using observable interest rate yield curves for comparable assets and liabilities at commonly quoted intervals. As of June 30, 2008, the fair values of the interest rate swaps were a liability of $(4) included in other long-term obligations and an asset of $4 included in other assets. As of December 31, 2007, the fair values of the interest rate swaps were a liability of $(2) included in other long-term obligations. We received (paid) cash on our interest rate agreements of $(1) and $2 for the first half ended June 30, 2008 and 2007, which were recorded in interest expense on the hedged debt.
E. LONG-TERM DEBT
The balances of long-term debt as of June 30, 2008 and December 31, 2007 are as follows:
| June 30, 2008 | Dec. 31, 2007 | |||||
NewPage: | ||||||
Term loan senior secured credit facility (face amount $1,592 and $1,600; LIBOR plus 3.75%) | $ | 1,546 | $ | 1,552 | ||
Floating rate senior secured notes (LIBOR plus 6.25%) | 225 | 225 | ||||
10% senior secured notes (face amount $806) | 804 | 804 | ||||
12% senior subordinated notes (face amount $200) | 198 | 198 | ||||
Capital lease | 147 | 146 | ||||
Total long-term debt, including current portion | 2,920 | 2,925 | ||||
Current portion of long-term debt | 16 | 16 | ||||
Subtotal | 2,904 | 2,909 | ||||
NewPage Holding— | ||||||
Senior unsecured NewPage Holding PIK Notes (face amount $180 and $171; LIBOR plus 7.00%) | 171 | 161 | ||||
NewPage Group— | ||||||
Senior unsecured NewPage Group PIK Notes (face amount $212 and $201; LIBOR plus 7.00%) | 218 | 207 | ||||
Long-term debt | $ | 3,293 | $ | 3,277 | ||
F-47
Table of Contents
NEWPAGE GROUP INC. AND SUBSIDIARIES
NOTES TO CONDENSED CONSOLIDATED FINANCIAL STATEMENTS—(Continued)
Dollars in millions
Substantially all of our assets are pledged as collateral under our various debt agreements. See our annual financial statements for the year ended December 31, 2007 for further details on our debt agreements.
F. EQUITY
Under a repurchase agreement between NewPage Group and a former executive officer, NewPage Group agreed to repurchase all of the executive officer’s NewPage Group stock for an aggregate amount of $6 on January 18, 2008. The expense associated with this transaction was recognized during the fourth quarter of 2007.
NewPage Group Equity Incentive Plan
Included in selling, general and administrative expenses is equity award expense of $15 and $1 for the first half ended June 30, 2008 and 2007. In March 2008, the first installment of the performance-based options was considered granted for accounting purposes. These options had an aggregate fair value of $13 at the grant date and will be expensed over the remainder of 2008.
The following table summarizes activity in the plan:
Shares of NewPage Group issuable under stock options, in thousands | Options | Weighted- average exercise price | ||||
Outstanding at December 31, 2007 | 3,373 | $ | 19.83 | |||
Granted | 1,028 | 21.27 | ||||
Forfeited | (158 | ) | 21.22 | |||
Outstanding at June 30, 2008 | 4,243 | 20.12 | ||||
None of the outstanding options were exercisable as of June 30, 2008. The outstanding options at June 30, 2008, have a weighted-average remaining contractual life of 9.8 years.
We utilize a Black-Scholes pricing model to determine the fair value of options granted. The determination of the fair value of stock-based payment awards on the date of grant using an option-pricing model is affected by the stock price as well as assumptions regarding a number of other variables. These variables include expected stock price volatility over the term of the awards and projected employee stock option exercise behaviors (term of option). We estimate the expected term of options granted by incorporating the contractual term of the options and employees’ expected exercise behaviors. We estimate the volatility of our common stock by considering volatility of appropriate peer companies and adjusting for factors unique to our stock, including the effect of debt leverage.
Assumptions used to determine the fair value of option grants are as follows:
| First Half Ended June 30, 2008 | ||||
Weighted-average fair value of options granted | $ | 12.87 | ||
Weighted-average assumptions used for grants: | ||||
Expected volatility | 60 | % | ||
Risk-free interest rate | 2.8 | % | ||
Expected life of option (in years) | 5 | |||
F-48
Table of Contents
NEWPAGE GROUP INC. AND SUBSIDIARIES
NOTES TO CONDENSED CONSOLIDATED FINANCIAL STATEMENTS—(Continued)
Dollars in millions
G. COMPREHENSIVE INCOME (LOSS)
Total comprehensive income (loss) is comprised of net income (loss), net unrealized gains and losses on cash flow hedges and changes in foreign currency translation adjustment. Total comprehensive income (loss) was $(33) and $(31) during the first half ended June 30, 2008 and 2007.
H. PENSION AND OTHER POSTRETIREMENT BENEFITS
A summary of the components of net periodic costs for the first half ended June 30, 2008 and 2007 is as follows:
| First Half Ended June 30, 2008 | First Half Ended June 30, 2007 | |||||||||||
| U.S. | Canada | U.S. | ||||||||||
Pension Plans | ||||||||||||
Service cost | $ | 9 | $ | 2 | $ | 4 | ||||||
Interest cost | 31 | 9 | 6 | |||||||||
Expected return on plan assets | (42 | ) | (10 | ) | (9 | ) | ||||||
Net periodic cost (income) before curtailment loss and termination benefits | (2 | ) | 1 | 1 | ||||||||
Curtailment loss | — | — | 1 | |||||||||
Termination benefits | 1 | — | — | |||||||||
Net periodic cost (income) after curtailment loss and termination benefits | $ | (1 | ) | $ | 1 | $ | 2 | |||||
| First Half Ended June 30, 2008 | First Half Ended June 30, 2007 | |||||||||||
| U.S. | Canada | U.S. | ||||||||||
Other Postretirement Plans | ||||||||||||
Service cost | $ | 1 | $ | 1 | $ | — | ||||||
Interest cost | 8 | — | 1 | |||||||||
Net periodic cost | $ | 9 | $ | 1 | $ | 1 | ||||||
As a result of the restructuring actions described in Note I, during the first quarter of 2008 we recognized a special termination charge of $1 in cost of sales for employees affected by the shutdown of the No. 11 paper machine in Rumford, Maine. As of June 30, 2008, we recorded adjustments to the purchase price allocation for decisions made to reduce benefits for salaried employees to reflect a $29 reduction in benefit obligations under the SENA pension plans and a $21 reduction in benefit obligations under a SENA postretirement plan.
F-49
Table of Contents
NEWPAGE GROUP INC. AND SUBSIDIARIES
NOTES TO CONDENSED CONSOLIDATED FINANCIAL STATEMENTS—(Continued)
Dollars in millions
I. RESTRUCTURING
On January 16, 2008, we announced the initial actions being taken to integrate NewPage operations and the former SENA facilities and services. These actions are intended to create a single business platform, enable us to remain competitive in the marketplace, serve our customers more efficiently and deliver on the synergies we have committed to achieve.
The specific restructuring actions announced on January 16, 2008 are as follows:
| Ÿ | Permanently closed the No. 11 paper machine in Rumford, Maine, in February 2008. Approximately 60 employees were affected by the shutdown. |
| Ÿ | Permanently closed the pulp mill and both paper machines in Niagara, Wisconsin, in June 2008. Approximately 320 employees were affected by the shutdown. |
| Ÿ | Permanently closed the No. 95 paper machine in Kimberly, Wisconsin, in May 2008. Approximately 125 employees were affected by the shutdown. |
| Ÿ | Permanently close the Chillicothe, Ohio, converting facility by the end of November 2008. Approximately 160 employees will be affected by the shutdown. |
| Ÿ | Reduce personnel in other areas, including sales, finance and other support functions. Approximately 200 to 250 employees are expected to be affected by this action. |
On July 30, 2008, we announced an additional restructuring action to further reduce costs and balance supply and customer demand. The action was as follows:
| Ÿ | Permanently close the Kimberly, Wisconsin mill and both remaining paper machines, Nos. 96 and 97, by the end of August 2008. Approximately 475 employees will be affected by the shutdown. |
We intend to reallocate production of paper grades across our remaining combined machine base, resulting in the operation of machines in narrower ranges of paper grades around their peak production.
As a result of the initial actions announced in January 2008, during the first half ended June 30, 2008, we incurred total charges of $17, including $12 in accelerated depreciation and inventory write-offs recorded in cost of sales and $5 of employee-related costs, of which $4 is recorded in cost of sales and $1 is recorded in selling, general and administrative expenses. In addition, as of June 30, 2008, we recorded $25 of employee-related costs for former SENA employees as a liability in the purchase price allocation.
We expect to recognize up to an additional $45 as a liability in the purchase price allocation for the actions announced in January and July 2008 related to the acquired operations and expect to incur additional expenses and restructuring charges in 2008 and to a lesser extent in 2009 of up to $50 in the aggregate relating to severance and early retirement benefits, costs of relocating employees and assets, and costs of integrating the two businesses, including investments in information systems. We also expect to recognize an additional $3 in accelerated depreciation during the second half of 2008 and expect to incur additional charges of up to $15 for the write-off of inventory, primarily stores and supplies related to the Kimberly, Wisconsin mill, in the second half of 2008. Additional adjustments to these estimates are likely to occur as we finalize union negotiations and severance arrangements and finalize the restructuring plan, including the effects of sales or dispositions of assets and facilities.
F-50
Table of Contents
NEWPAGE GROUP INC. AND SUBSIDIARIES
NOTES TO CONDENSED CONSOLIDATED FINANCIAL STATEMENTS—(Continued)
Dollars in millions
The activity in the accrued severance liability relating to these actions for the first half ended June 30, 2008 was as follows:
| Employee Costs | ||||
Balance accrued at December 31, 2007 | $ | 4 | ||
Additions to reserve recorded in the purchase price allocation | 25 | |||
Current charges | 5 | |||
Payments | (10 | ) | ||
Balance accrued at June 30, 2008 | $ | 24 | ||
J. COMMITMENTS AND CONTINGENCIES
Claims have been made against us for the costs of environmental remediation measures taken or to be taken. Reserves for these liabilities have been established and no insurance recoveries have been anticipated in the determination of the reserves. We are involved in various other litigation and administrative proceedings arising in the normal course of business. Although the ultimate outcome of these matters cannot be predicted with certainty, we do not believe that the currently expected outcome of any matter, lawsuit or claim that is pending or threatened, or all of them combined, will have a material adverse effect on our financial condition, results of operations or liquidity.
K. INCOME TAXES
The disproportionate effective tax rates for the first half ended June 30, 2008 are primarily the result of the relationship of permanent items to projected net income (loss) for the year. For the first half ended June 30, 2007, we recorded a valuation allowance against our net deferred tax benefit for federal income taxes and for certain states as it was more likely than not that we would not realize those benefits, as defined in SFAS No. 109, as a result of the negative evidence at that time presented by our and our predecessor’s history of losses.
l. INITIAL PUBLIC OFFERING
On May 5, 2008, we filed a registration statement on Form S-1 with the Securities and Exchange Commission relating to an initial public offering of our common stock. As indicated in the registration statement, we intend to use the proceeds from the offering to redeem in full the NewPage Group PIK Notes and the NewPage Holding PIK Notes. There can be no assurance that we will complete the offering or what the terms of the offering will be.
* * * * *
F-51
Table of Contents
REPORT OF INDEPENDENT REGISTERED PUBLIC ACCOUNTING FIRM
To MeadWestvaco Corporation
In our opinion, the accompanying combined statements of operations, changes in combined equity and cash flows present fairly, in all material respects, the results of operations of the Printing and Writing Papers Business of MeadWestvaco Corporation and its cash flows for the four months ended April 30, 2005 in conformity with accounting principles generally accepted in the United States of America. These financial statements are the responsibility of the Business’ management. Our responsibility is to express an opinion on these financial statements based on our audit. We conducted our audit of these statements in accordance with the standards of the Public Company Accounting Oversight Board (United States). Those standards require that we plan and perform the audit to obtain reasonable assurance about whether the financial statements are free of material misstatement. An audit includes examining, on a test basis, evidence supporting the amounts and disclosures in the financial statements, assessing the accounting principles used and significant estimates made by management, and evaluating the overall financial statement presentation. We believe that our audit provides a reasonable basis for our opinion.
/s/ PricewaterhouseCoopers LLP
PricewaterhouseCoopers LLP
Dayton, Ohio
December 16, 2005, except for Discontinued Operations, as described in Note A, the date of which is May 19, 2006, except for the Guarantor Subsidiary information described in Note L, the date of which is April 15, 2008 and except for Earnings Per Share, as described in Note M, the date of which is May 1, 2008
F-52
Table of Contents
PRINTING AND WRITING PAPERS BUSINESS
(A BUSINESS OF MEADWESTVACO CORPORATION)
PREDECESSOR
COMBINED STATEMENTS OF OPERATIONS
FOUR MONTHS ENDED APRIL 30, 2005
Dollars in millions, except per share amounts
Net sales (including sales to related parties of $9) | $ | 582 | ||
Cost of sales | 538 | |||
Selling, general and administrative expenses | 31 | |||
Interest expense, including loss on defeasance of debt of $18 | 21 | |||
Other income, net | (2 | ) | ||
Loss from continuing operations before income taxes | (6 | ) | ||
Income tax benefit | (3 | ) | ||
Loss from continuing operations | (3 | ) | ||
Loss from discontinued operations, net of tax (benefit) of $4 | (5 | ) | ||
Net loss | $ | (8 | ) | |
Income (loss) per share—basic and diluted: | ||||
Income (loss) from continuing operations | $ | (0.07 | ) | |
Income (loss) from discontinued operations | (0.10 | ) | ||
Net income (loss) | $ | (0.17 | ) | |
Basic and diluted weighted-average number of common shares outstanding (in thousands) | 45,056 |
The accompanying notes are an integral part of these combined financial statements.
F-53
Table of Contents
PRINTING AND WRITING PAPERS BUSINESS
(A BUSINESS OF MEADWESTVACO CORPORATION)
PREDECESSOR
STATEMENTS OF CHANGES IN COMBINED EQUITY
FOUR MONTHS ENDED APRIL 30, 2005
Dollars in millions
| EQUITY | ||||
BALANCE, DECEMBER 31, 2004 | $ | 1,713 | ||
Net loss for the four months ended April 30, 2005 | (8 | ) | ||
Payment by MeadWestvaco Corporation to defease long-term debt | 162 | |||
Transactions with MeadWestvaco Corporation, net | 16 | |||
BALANCE, APRIL 30, 2005 | $ | 1,883 | ||
The accompanying notes are an integral part of these combined financial statements.
F-54
Table of Contents
PRINTING AND WRITING PAPERS BUSINESS
(A BUSINESS OF MEADWESTVACO CORPORATION)
PREDECESSOR
COMBINED STATEMENTS OF CASH FLOWS
FOUR MONTHS ENDED APRIL 30, 2005
Dollars in millions
Cash flows from operating activities | ||||
Net loss | $ | (8 | ) | |
Adjustments to reconcile net loss to net cash provided by operating activities: | ||||
Loss on discontinued operations | 5 | |||
Depreciation and amortization | 61 | |||
Deferred income taxes | (7 | ) | ||
Investee—earnings and distributions | 1 | |||
Loss on defeasance of debt | 18 | |||
Changes in operating assets and liabilities: | ||||
Accounts receivable, net | 1 | |||
Inventories | (63 | ) | ||
Other current assets | 1 | |||
Other assets | (2 | ) | ||
Accrued expenses | (14 | ) | ||
Other liabilities | 1 | |||
Net cash flows of discontinued operations | 8 | |||
Net cash provided by operating activities | 2 | |||
Cash flows from investing activities | ||||
Additions to property, plant and equipment | (14 | ) | ||
Net cash flows of discontinued operations | (3 | ) | ||
Net cash used in investing activities | (17 | ) | ||
Cash flows from financing activities | ||||
Net transactions with MeadWestvaco Corporation | 15 | |||
Net cash provided by financing activities | 15 | |||
Increase (decrease) in cash and cash equivalents | $ | — | ||
The accompanying notes are an integral part of these combined financial statements.
F-55
Table of Contents
PRINTING AND WRITING PAPERS BUSINESS
(A BUSINESS OF MEADWESTVACO CORPORATION)
PREDECESSOR
NOTES TO COMBINED FINANCIAL STATEMENTS
Dollars in millions
A. Description of Business and Basis of Presentation
These combined financial statements present the historical results of the Printing and Writing Papers Business (the “Business”), which was purchased from MeadWestvaco Corporation (“MeadWestvaco”) by NewPage Corporation (the “Acquisition”) pursuant to the Acquisition, which was funded on May 2, 2005, but deemed to have been completed on April 30, 2005. The Business is engaged in the manufacturing, marketing and distribution of coated paper primarily used for commercial printing, magazines, catalogs, textbooks, and labels. Our products include coated papers, uncoated papers and market pulp production manufactured at four U.S. mills and supported by multiple distribution and converting locations. We operate within one operating segment. The Business consists of the historical Papers business segment of MeadWestvaco adjusted to exclude MeadWestvaco’s investment in Northwood Panelboard and the operations of Specialty Papers, which is a distinct and different business under separate management that will not be purchased. MeadWestvaco will retain certain assets and liabilities related to the Business (included within these combined financial statements). These include certain tax receivables and certain liabilities for environmental and employee matters, including the environmental matters discussed in Note I. These amounts are not material in regard to the Business’ financial position.
Effective April 1, 2006, NewPage completed the sale of the carbonless paper business, which comprised the carbonless paper segment, to P. H. Glatfelter Company. In the quarter ended March 31, 2006, the carbonless paper business was reported as a discontinued operation. The combined financial statements and related notes have been reclassified to reflect the discontinued operations treatment. Prior periods have been presented on a comparable basis. Net revenues of the carbonless paper business (included in discontinued operations) were $135 for the four months ended April 30, 2005.
These combined financial statements are intended to present the historical results of the Business operations during each respective period. As such, these combined financial statements include allocations of certain expenses, as well as assets and liabilities historically maintained by MeadWestvaco and not recorded in the accounts of the Business. The Business and MeadWestvaco management believe these allocations have been made on a reasonable basis. However, these combined financial statements may not necessarily be indicative of the results that would have been obtained if the Business had operated as a separate entity during the periods presented.
The combined equity of the Business comprises the excess of the Business’ assets over its liabilities. Combined equity is affected by the Business’ operating results, expense allocations from MeadWestvaco and cash transfers between the Business and MeadWestvaco, including settlement of intercompany transactions and amounts paid or received relating to interest and income taxes, as MeadWestvaco manages all treasury activities of the Business.
B. Summary of Significant Accounting Policies
Estimates and assumptions
The preparation of these combined financial statements required management to make estimates and assumptions that affect the reported amounts of some revenues and expenses during the reporting period. Actual results could differ from these estimates.
F-56
Table of Contents
PRINTING AND WRITING PAPERS BUSINESS
(A BUSINESS OF MEADWESTVACO CORPORATION)
PREDECESSOR
NOTES TO COMBINED FINANCIAL STATEMENTS—(Continued)
Dollars in millions
Concentration of credit risk
The financial instruments that potentially subject the Business to concentrations of credit risk are accounts receivable. The Business limits its credit risk by performing ongoing credit evaluations, and when deemed necessary, requiring letters of credit, guarantees, or collateral. The majority of the Business’s accounts receivable are with paper merchants and printers.
For the four months ended April 30, 2005, the Business’s sales to its largest customer was 20% of net sales.
Inventories
Inventories are valued at the lower of cost or market. Cost is determined using the last-in, first-out (LIFO) method for substantially all raw materials, finished goods and production materials. Cost of all other inventories, mainly stores and supplies inventories, is determined by the average cost method.
Property, plant and equipment
When fixed assets are sold, retired or disposed of, their cost and related accumulated depreciation are removed from the accounts and any resulting gain or loss is reflected in the statement of operations. Costs of renewals and betterments of properties are capitalized; costs of maintenance and repairs are charged to expense. The cost of plant and equipment is depreciated, utilizing the straight-line method, over the estimated useful lives of the assets, which range from 20 to 40 years for buildings and 5 to 30 years for machinery and equipment. Depreciation expense was $59 for the four months ended April 30, 2005.
Capitalized software
Capitalized software is amortized using the straight-line method over the estimated useful lives of 2 to 8 years. The Business records software development costs in accordance with the American Institute of Certified Public Accountants’ Statement of Position 98-1,Accounting for the Costs of Computer Software Developed or Obtained for Internal Use. The Business recorded amortization expense of $2 in the four months ended April 30, 2005 relating to capitalized software.
Environmental
Environmental expenditures that increase useful lives of assets are capitalized, while other environmental expenditures are expensed. Liabilities are recorded when remedial efforts are probable and the costs can be reasonably estimated.
Landfills
The Business follows SFAS No. 143,Accounting for Asset Retirement Obligations, which requires that an obligation associated with the retirement of a tangible long-lived asset be recognized as a liability when incurred. Subsequent to initial measurement, an entity recognizes changes in the amount of the liability resulting from the passage of time and revisions to either the timing or amount of estimated cash flows.
F-57
Table of Contents
PRINTING AND WRITING PAPERS BUSINESS
(A BUSINESS OF MEADWESTVACO CORPORATION)
PREDECESSOR
NOTES TO COMBINED FINANCIAL STATEMENTS—(Continued)
Dollars in millions
Revenue recognition
The Business recognizes revenues at the point when title and the risk of ownership passes to the customer. Substantially all of the Business’s revenues are generated through product sales, and shipping terms generally indicate when title and the risk of ownership have passed. Revenue is recognized at shipment for sales where shipping terms are FOB (free on board) shipping point. For sales where shipping terms are FOB destination, revenue is recognized when the goods are received by the customer. The Business provides allowances for estimated returns and other customer credits such as discounts, returns and volume rebates, when the revenue is recognized, based on historical experience, current trends and any notification of pending returns. Sales of byproducts produced during the manufacturing process are recognized as a reduction of cost of sales.
Export sales
There are no operations, including long-lived assets, outside of the United States. Export sales from the United States were $56 for the four months ended April 30, 2005.
Interest expense
Included in these combined financial statements are amortization of deferred financing cost and interest expense of long-term debt specifically related to the Business facilities. MeadWestvaco has not historically allocated corporate interest cost to its segments and none of that interest cost has been allocated within these combined financial statements.
Pension and postretirement benefits
The employees of the Business are participants in various defined benefit pension and postretirement plans sponsored by MeadWestvaco and the assets and liabilities are combined with those related to other MeadWestvaco businesses. Similarly, MeadWestvaco manages its domestic postretirement benefit plans on a combined basis and claims data and liability information related to the Business is aggregated and combined, by plan, with those related to other MeadWestvaco businesses. As a result, pension and postretirement expense for the Business has been determined on a multi-employer plan basis.
Pension costs recorded by the Business with respect to the defined benefit pension plans for the four months ended April 30, 2005 were $5.
The employees of the Business are also eligible to participate in defined contribution benefit plans sponsored by MeadWestvaco. Under the terms of the defined contribution benefit plans, participant contributions may be directed into a number of investment options. MeadWestvaco matching contributions are made to a fund that invests in MeadWestvaco shares. During the four months ended April 30, 2005, the Business incurred expenses of $3 for matching contributions to the defined contribution benefit plans.
Upon retirement, MeadWestvaco provides life insurance and other postretirement benefits for certain MeadWestvaco retirees, including certain Business employees. MeadWestvaco also funds certain medical benefits on a current basis with retirees paying a portion of the costs. Costs of providing these benefits to both active and retired employees of the Business were $13 for the four months ended April 30, 2005.
F-58
Table of Contents
PRINTING AND WRITING PAPERS BUSINESS
(A BUSINESS OF MEADWESTVACO CORPORATION)
PREDECESSOR
NOTES TO COMBINED FINANCIAL STATEMENTS—(Continued)
Dollars in millions
Income taxes
The Business historically is not an income tax payer, as its results and related tax obligations, if any, are included in the consolidated returns of MeadWestvaco. The income tax benefit included in these combined financial statements was calculated on a separate return basis, as if the Business was a separate taxpayer, and the resulting current tax benefit (liability) is settled with MeadWestvaco through equity.
Stock options
The Business measures compensation cost for MeadWestvaco stock options issued to employees and directors using the intrinsic value-based method of accounting in accordance with Accounting Principles Board Opinion No. 25,Accounting for Stock Issued to Employees (“APB 25”). The Business adopted the disclosure requirements of SFAS No. 148,Accounting for Stock-Based Compensation—Transition and Disclosure. If compensation cost for MeadWestvaco stock options had been determined based on the fair value method of SFAS No. 123,Accounting for Stock-Based Compensation (“SFAS 123”), the Business’s pro forma net loss and pro forma net loss per share would have been the same as reported net loss and net loss per share.
C. Investee
The Business has a 30% interest in Rumford Cogeneration Company, L.P., a limited partnership which operates the cogeneration facility located at the Rumford, Maine, paper mill. Sales of byproducts and charges for management services from the Business to the limited partnership were $19 for the four months ended April 30, 2005. Purchases made by the Business from the limited partnership were $17 for the four months ended April 30, 2005. Distributions received from the limited partnership were $2 for the four months ended April 30, 2005.
D. Long-term debt
In conjunction with the Acquisition, MeadWestvaco repaid or defeased all outstanding debt of the Business. Included in interest expense for the four months ended April 30, 2005, is a loss of $18 on the defeasance of the debt and write-off of unamortized financing costs.
E. Leasing activities
The Business leases a variety of assets for use in its operations. Certain leases provide for escalation of the lease payments as maintenance costs and taxes increase. Rental expense under operating leases was $5 for the four months ended April 30, 2005.
F. Stock Option Plans
Certain employees of the Business participate in MeadWestvaco’s stock option plans and receive MeadWestvaco’s restricted stock. Grants of stock options and other stock-based compensation awards are approved by the Compensation committee of MeadWestvaco’s Board of Directors. The exercise prices of all options equal the market price of MeadWestvaco’s stock on the date of grant. Under certain employee plans, stock options may be granted with or without stock appreciation rights, with or
F-59
Table of Contents
PRINTING AND WRITING PAPERS BUSINESS
(A BUSINESS OF MEADWESTVACO CORPORATION)
PREDECESSOR
NOTES TO COMBINED FINANCIAL STATEMENTS—(Continued)
Dollars in millions
without limited stock appreciation rights, which are exercisable upon the occurrence of certain events related to changes in corporate control and are exercisable after a period of six months to three years and expire not later than ten years from the date of grant. No new grants for stock appreciation rights were awarded to the employees of the Business in the periods presented.
Options to purchase 1.3 million MeadWestvaco shares issued to all participants of the plan (including Business employees) under MeadWestvaco’s 1996 Stock Option Plan are accompanied by a feature that allows option holders who exercise their stock options and hold the common shares they received at exercise to receive an additional stock option grant with an exercise price at the then-current market price. Options granted with this feature are accounted for as a fixed award.
The following table summarizes activity in the plans as it relates to activity of employees of the Business:
Shares of MeadWestvaco issuable under stock options, in thousands | Options | Weighted- average exercise price | |||
Outstanding at December 31, 2004 | 1,785 | 28.86 | |||
Other Division options removed | (12 | ) | 28.05 | ||
Exercised | (265 | ) | 27.22 | ||
Cancelled | (18 | ) | 27.46 | ||
Outstanding at April 30, 2005 | 1,490 | 29.13 | |||
The following table shows various information about stock options outstanding at April 30, 2005 as it relates to activity of employees of the Business:
| Range of exercise prices | ||||||||||||
Shares in thousands | $24.00– $25.84 | $26.16– $29.74 | $30.24– $40.46 | Total | ||||||||
Number outstanding | 225 | 717 | 548 | 1,490 | ||||||||
Weighted average price | $ | 24.48 | $ | 28.30 | $ | 32.12 | $ | 29.13 | ||||
Weighted average remaining life (in years) | 5.93 | 4.99 | 4.31 | 4.88 | ||||||||
Number exercisable | 172 | 655 | 522 | 1,349 | ||||||||
Weighted average price | $ | 24.63 | $ | 28.28 | $ | 32.16 | $ | 29.31 | ||||
The Business applies APB No. 25 as amended, in accounting for MeadWestvaco’s plans. No stock option expense has been recorded in the periods presented as the option price is set at the market value of the underlying MeadWestvaco stock at the date of grant.
G. Restructuring and Other Merger-Related Expenses
Restructuring charges, other than Westvaco and Mead merger related
As part of the Business’s planned integration strategy and various restructuring activities, the Business incurred charges for separation benefits for employees from 2002 through 2004. As of December 31, 2004, substantially all of the 608 originally affected employees from 2002, 2003 and 2004 had been separated.
F-60
Table of Contents
PRINTING AND WRITING PAPERS BUSINESS
(A BUSINESS OF MEADWESTVACO CORPORATION)
PREDECESSOR
NOTES TO COMBINED FINANCIAL STATEMENTS—(Continued)
Dollars in millions
The activity in the accrued restructuring balances related to all of the plans described above was as follows:
| Employee costs | |||
Balance of related accruals at December 31, 2004 | $ | 1 | |
Less: payments | 1 | ||
Balance of related accruals at April 30, 2005 | $ | — | |
Westvaco and Mead Merger Related Restructuring
MeadWestvaco established accruals relating primarily to employee separation costs, facility closure costs and other actions relating to the integration of certain Mead operations into MeadWestvaco. Costs associated with these integration actions were recognized as a component of purchase accounting, resulting in the establishment of liabilities and adjustments to goodwill. The integration actions included the closure of three older, high-cost coated paper machines and related facilities at the Chillicothe, Ohio, paper mill and the integration of the Mead and Westvaco paper groups. The balance of the related accruals were $1 at December 31, 2004 and April 30, 2005.
H. Income Taxes
Loss from continuing operations before income taxes was $(6) for the four months ended April 30, 2005.
The significant components of the income tax provision (benefit) are as follows:
| Four Months Ended April 30, 2005 | ||||
Deferred: | ||||
U.S. federal | $ | (6 | ) | |
State and local | (1 | ) | ||
Benefit for deferred income taxes | (7 | ) | ||
Allocation to discontinued operations | (4 | ) | ||
Income tax (benefit) | $ | (3 | ) | |
F-61
Table of Contents
PRINTING AND WRITING PAPERS BUSINESS
(A BUSINESS OF MEADWESTVACO CORPORATION)
PREDECESSOR
NOTES TO COMBINED FINANCIAL STATEMENTS—(Continued)
Dollars in millions
The following table summarizes the major differences between the actual income tax provision (benefit) attributable to loss before taxes and taxes computed at the U.S. federal statutory rate:
| Four Months Ended April 30, 2005 | ||||
Income tax benefit computed at the U.S. federal statutory rate of 35% | $ | (2 | ) | |
State and local income taxes, net of federal benefit | (1 | ) | ||
Permanent differences | (1 | ) | ||
Provision to return adjustments | (1 | ) | ||
Valuation allowances | 2 | |||
Income tax (benefit) | $ | (3 | ) | |
Effective tax rate | 38.7 | % | ||
The federal net operating loss carryforward at April 30, 2005 is approximately $270 and is available to reduce federal taxable income through 2024. The Business’s valuation allowance against deferred tax assets primarily relates to state tax net operating losses for which the ultimate realization of future benefits is uncertain. The amount of net operating loss carryforwards has been derived on a separate return basis as if the Business were a separate income tax payer. These amounts have been included in the consolidated income tax filings of MeadWestvaco and may be settled with MeadWestvaco through combined equity in a future period.
The Business has operations in several domestic tax jurisdictions and is subject to audit in these jurisdictions. Tax audits by their nature are often complex and can require several years to resolve. While actual results could vary, in management’s judgment the Business has adequate accruals with respect to the ultimate outcome of these audits.
I. Environmental and Legal Matters
The Business has been notified by the U.S. Environmental Protection Agency (the “EPA”) or by various state or local governments that it may be liable under federal environmental laws or under applicable state or local laws with respect to the cleanup of hazardous substances at sites previously operated or used by the Business. The Business is currently named as a potentially responsible party (“PRP”) or has received third-party requests for contribution under the Comprehensive Environmental Response, Compensation and Liability Act (“CERCLA”) and similar state or local laws with respect to a number of sites. There are other sites which may contain contamination or which may be potential Superfund sites, but for which the Business has not received any notice or claim. The potential liability for all these sites will depend upon several factors, including the extent of contamination, the method of remediation, insurance coverage and contribution by other PRPs. The Business regularly evaluates its potential liability at these various sites. At April 30, 2005, the Business has recorded liabilities of approximately $2 for estimated potential cleanup costs based upon its close monitoring of ongoing activities and its past experience with these matters. The Business believes that it is reasonably possible that costs associated with these sites may exceed amounts of recorded liabilities by an amount that could range from an insignificant amount to as much as $2. This estimate is less certain than the estimate upon which the environmental liabilities were based. After consulting with legal counsel and after considering established liabilities, it is our judgment that the resolution of pending
F-62
Table of Contents
PRINTING AND WRITING PAPERS BUSINESS
(A BUSINESS OF MEADWESTVACO CORPORATION)
PREDECESSOR
NOTES TO COMBINED FINANCIAL STATEMENTS—(Continued)
Dollars in millions
litigation and proceedings is not expected to have a material adverse effect on the Business’s consolidated financial condition or liquidity. In any given period or periods, however, it is possible these proceedings or matters could have a material effect on the results of operations.
The Business is involved in various other litigation and administrative proceedings arising in the normal course of business. Although the ultimate outcome of these matters cannot be predicted with certainty, management does not believe that the currently expected outcome of any matter, lawsuit or claim that is pending or threatened, or all of them combined, will have a material adverse effect on the Business’s financial condition or liquidity. In any given period or periods, however, it is possible these proceedings or matters could have a material effect on the results of operations.
J. Related Party Transactions
Transactions between the Business and other business segments of MeadWestvaco commonly occur in the normal course of business. In addition, the Business also had purchases from MeadWestvaco’s Forestry Operations of $2 for the four months ended April 30, 2005. Sales to other MeadWestvaco business segments were $9 for the four months ended April 30, 2005. Purchases from other MeadWestvaco business segments were $1 for the four months ended April 30, 2005.
The Business’s combined financial statements include expense allocations for certain corporate functions provided by MeadWestvaco, such as human resources, legal, finance, information systems, purchasing, executive management and other corporate staff. Allocations were based on relative headcount for people-related costs, the Business’s assets as a percentage of total MeadWestvaco assets, the Business’s sales as a percentage of total MeadWestvaco sales, or by specific identification of costs directly associated with the Business’s operations. The Business and MeadWestvaco management believe these allocations have been made on a reasonable basis. These costs are included in cost of sales or selling, general and administrative expenses, consistent with MeadWestvaco classification, in the accompanying combined statements of operations. Costs allocated by or charged by MeadWestvaco to the Business for services performed by MeadWestvaco on behalf of the Business totaled $9 for the four months ended April 30, 2005.
In addition to the above, the Business shares facilities and related costs (utilities and services) with other business segments of MeadWestvaco. Costs charged by the Business to MeadWestvaco for shared facilities totaled $1 for the four months ended April 30, 2005. These charges were based on estimates of actual usage for utilities and head count for other services and are recorded as a reduction of the related cost.
K. Supplemental Cash Flow Information
| Four Months Ended April 30,2005 | |||
Cash paid (received) by MeadWestvaco on behalf of the Business—Interest | $ | 3 | |
Non-Cash Transactions: | |||
Payment by MeadWestvaco Corporation to defease long-term debt | 162 | ||
Contribution of property, plant and equipment by MeadWestvaco Corporation | 1 | ||
F-63
Table of Contents
PRINTING AND WRITING PAPERS BUSINESS
(A BUSINESS OF MEADWESTVACO CORPORATION)
PREDECESSOR
NOTES TO COMBINED FINANCIAL STATEMENTS—(Continued)
Dollars in millions
L. SUPPLEMENTAL GUARANTOR INFORMATION
As discussed in Note A, the Business operated as a business segment of MeadWestvaco prior to the Acquisition. In connection with the Acquisition, NewPage issued $775 of senior secured and senior subordinated debt that was subsequently registered. A separate legal parent entity with independent assets or operations did not exist for the Business prior to the Acquisition and all of the operations of the Business became guarantors as a result of the issuance of the debt by NewPage. As all of the debt was fully and unconditionally, jointly and severally guaranteed by all of the Business subsidiaries, condensed consolidated financial statements are not presented.
M. Earnings Per Share
In accordance with SFAS No. 128,Earnings per Share, we have added disclosures for earnings per share in conjunction with the filing of the registration statement on Form S-1. Basic net income (loss) per common share are computed by dividing net income (loss) by the weighted-average number of common shares outstanding of NewPage Group, Inc. This presentation reflects the post-acquisition capital structure of the successor for all periods on a consistent basis.
* * * * *
F-64
Table of Contents
REPORT OF INDEPENDENT AUDITORS
To Owners of Stora Enso North America:
In our opinion, the accompanying combined balance sheets and the related combined statements of operations, owner's investment and comprehensive income (loss), and cash flows present fairly, in all material respects, the financial position of Stora Enso North America at December 31, 2006 and December 31, 2005, and the results of its operations and its cash flows for each of the three years in the period ended December 31, 2006 in conformity with accounting principles generally accepted in the United States of America. These financial statements are the responsibility of Stora Enso North America's management. Our responsibility is to express an opinion on these financial statements based on our audits. We conducted our audits of these statements in accordance with auditing standards generally accepted in the United States of America. Those standards require that we plan and perform the audit to obtain reasonable assurance about whether the financial statements are free of material misstatement. An audit includes examining, on a test basis, evidence supporting the amounts and disclosures in the financial statements, assessing the accounting principles used and significant estimates made by management, and evaluating the overall financial statement presentation. We believe that our audits provide a reasonable basis for our opinion.
As discussed in Notes 1 and 11 to the combined financial statements, Stora Enso North America changed the manner in which it accounts for share-based compensation and defined benefit pension and postretirement plans in 2006.
As discussed in Note 1 to the combined financial statements, Stora Enso North America operations include the accounts of certain legal entities of Stora Enso North America Inc., which is a wholly owned subsidiary of Stora Enso Oyj. As discussed in Note 9, the related party debt with Stora Enso S.à.r.L. matures on August 13, 2007. Stora Enso North America received a letter from Stora Enso S.à.r.L. dated July 9, 2007, confirming that Stora Enso S.à.r.L. intends to either extend the settlement date to August 13, 2008 or enter into a new agreement for a period of twelve months subsequent to August 13, 2007 on substantially the same terms as the existing agreement. As a result, the related party debt has been classified as a non-current liability at December 31, 2006.
As discussed in Note 2 to the combined financial statements, the Company restated its combined financial statements as of and for the years ended December 31, 2006, 2005 and 2004.
/s/ PricewaterhouseCoopers LLP
Milwaukee, WI
July 19, 2007, except for the effect of the restatements described in Note 2 as to which the dates are December 1, 2007 and April 29, 2008.
F-65
Table of Contents
COMBINED STATEMENTS OF OPERATIONS
YEARS ENDED DECEMBER 31,
| 2006 (Restated) | 2005 (Restated) | 2004 (Restated) | ||||||||||
| (Dollars in millions) | ||||||||||||
Net sales | $ | 2,176 | $ | 2,374 | $ | 2,076 | ||||||
Costs and expenses: | ||||||||||||
Cost of sales | 2,135 | 2,303 | 2,129 | |||||||||
Selling, general and administrative expenses | 108 | 113 | 111 | |||||||||
Goodwill impairment | — | 162 | 520 | |||||||||
Property, plant and equipment impairment | 113 | — | — | |||||||||
Interest expense | 92 | 75 | 63 | |||||||||
Other (income) | (1 | ) | (4 | ) | (6 | ) | ||||||
Loss before income taxes | (271 | ) | (275 | ) | (741 | ) | ||||||
Income tax provision (benefit) | (28 | ) | 7 | (84 | ) | |||||||
Net loss | $ | (243 | ) | $ | (282 | ) | $ | (657 | ) | |||
The accompanying notes are an integral part of these financial statements.
F-66
Table of Contents
COMBINED BALANCE SHEETS
AS OF DECEMBER 31,
| 2006 (Restated) | 2005 (Restated) | |||||||
| (Dollars in millions) | ||||||||
ASSETS: | ||||||||
Current assets: | ||||||||
Cash and cash equivalents | $ | 195 | $ | 82 | ||||
Accounts receivable, net of allowance for doubtful accounts of $3 and $3, respectively | 129 | 113 | ||||||
Inventories | 346 | 349 | ||||||
Deferred tax assets | 32 | 31 | ||||||
Other current assets | 28 | 29 | ||||||
Total current assets | 730 | 604 | ||||||
Non-current assets: | ||||||||
Property, plant and equipment, net | 2,479 | 2,792 | ||||||
Goodwill | 280 | 280 | ||||||
Other intangible assets, net | 11 | 13 | ||||||
Other non-current assets | 21 | 267 | ||||||
Total non-current assets | 2,791 | 3,352 | ||||||
Total assets | $ | 3,521 | $ | 3,956 | ||||
LIABILITIES AND OWNER’S INVESTMENT: | ||||||||
Current liabilities: | ||||||||
Current portion of long-term debt | $ | 103 | $ | — | ||||
Accounts payable | 167 | 164 | ||||||
Accrued payroll and benefits | 51 | 44 | ||||||
Postretirement benefit provisions | 16 | 19 | ||||||
Other current liabilities | 120 | 120 | ||||||
Total current liabilities | 457 | 347 | ||||||
Non-current liabilities: | ||||||||
Long-term debt (related party is $1,069 and $1,067, respectively) | 1,446 | 1,542 | ||||||
Deferred tax liabilities | 119 | 217 | ||||||
Postretirement benefit provisions | 468 | 402 | ||||||
Other non-current liabilities | 14 | 11 | ||||||
Total non-current liabilities | 2,047 | 2,172 | ||||||
Commitments and contingencies (Note 13) | — | — | ||||||
Owner’s investment: | ||||||||
Owner’s investment | 1,216 | 1,457 | ||||||
Accumulated other comprehensive loss | (199 | ) | (20 | ) | ||||
Total owner’s investment | 1,017 | 1,437 | ||||||
Total liabilities and owner’s investment | $ | 3,521 | $ | 3,956 | ||||
The accompanying notes are an integral part of these financial statements.
F-67
Table of Contents
COMBINED STATEMENTS OF CASH FLOWS
YEARS ENDED DECEMBER 31,
(Dollars in millions)
| 2006 (Restated) | 2005 (Restated) | 2004 (Restated) | ||||||||||
CASH FLOW FROM OPERATING ACTIVITIES: | ||||||||||||
Net loss | $ | (243 | ) | $ | (282 | ) | $ | (657 | ) | |||
Adjustments to reconcile net loss to net cash provided by (used in) operating activities: | ||||||||||||
Depreciation and amortization | 267 | 292 | 271 | |||||||||
Goodwill impairment | — | 162 | 520 | |||||||||
Property, plant and equipment impairment | 113 | — | — | |||||||||
Loss on sale of property, plant and equipment | 3 | 13 | 17 | |||||||||
Deferred income taxes | (31 | ) | (46 | ) | (92 | ) | ||||||
Bond discount amortization | 2 | 2 | 2 | |||||||||
Change in current assets and liabilities: | ||||||||||||
Inventories | 2 | (24 | ) | (49 | ) | |||||||
Accounts receivable | (16 | ) | (4 | ) | 6 | |||||||
Accounts payable | 3 | (7 | ) | 33 | ||||||||
Other non-current assets and liabilities | 10 | 59 | (15 | ) | ||||||||
Pension and other postretirement, net | 49 | 22 | (106 | ) | ||||||||
Other, net | 10 | (12 | ) | 27 | ||||||||
Net cash provided by (used in) operating activities | 169 | 175 | (43 | ) | ||||||||
CASH FLOW FROM INVESTING ACTIVITIES: | ||||||||||||
Purchase of property, plant and equipment | (60 | ) | (83 | ) | (206 | ) | ||||||
Proceeds from sale of property, plant and equipment | — | 1 | 18 | |||||||||
Net cash used in investing activities | (60 | ) | (82 | ) | (188 | ) | ||||||
CASH FLOW FROM FINANCING ACTIVITIES: | ||||||||||||
Short-term debt, net | 6 | 2 | (628 | ) | ||||||||
Proceeds from long-term debt | — | — | 36 | |||||||||
Repayment of long-term debt | — | — | (81 | ) | ||||||||
Repayment of long-term debt—related party | — | (46 | ) | (232 | ) | |||||||
Change in bank overdrafts | (4 | ) | 4 | — | ||||||||
Owner’s investment—equity investment from Stora Enso Oyj | — | — | 600 | |||||||||
Owner’s investment—cash received from Stora Enso Oyj | 2 | 1 | 1 | |||||||||
Net cash provided by (used in) financing activities | 4 | (39 | ) | (304 | ) | |||||||
Effect of exchange rates on cash | — | — | — | |||||||||
Net Increase in Cash and Cash Equivalents | 113 | 54 | (535 | ) | ||||||||
Cash and cash equivalents at beginning of year | 82 | 28 | 563 | |||||||||
Net Cash and Cash Equivalents at Year End | $ | 195 | $ | 82 | $ | 28 | ||||||
The accompanying notes are an integral part of these financial statements.
F-68
Table of Contents
COMBINED STATEMENTS OF OWNER’S INVESTMENT AND
COMPREHENSIVE INCOME (LOSS)
YEARS ENDED DECEMBER 31,
(Dollars in millions)
| Owner’s Investment | Accumulated Other Comprehensive Income (Loss) | Total | ||||||||||
Balance at January 1, 2004 (Restated) | $ | 1,794 | $ | (54 | ) | $ | 1,740 | |||||
Comprehensive loss: | ||||||||||||
Net loss (Restated) | (657 | ) | (657 | ) | ||||||||
Minimum pension liability adjustment (net of tax of $31) | 51 | 51 | ||||||||||
Foreign currency translation adjustment | 42 | 42 | ||||||||||
Financial instruments (net of tax of $0) | 1 | 1 | ||||||||||
Total comprehensive loss (Restated) | $ | (563 | ) | |||||||||
Equity investment from Stora Enso Oyj | 600 | 600 | ||||||||||
Net increase in investment from Stora Enso Oyj | 1 | 1 | ||||||||||
Balance at December 31, 2004 (Restated) | $ | 1,738 | $ | 40 | $ | 1,778 | ||||||
Comprehensive loss: | ||||||||||||
Net loss (Restated) | (282 | ) | (282 | ) | ||||||||
Minimum pension liability adjustment (net of tax of $50) | (82 | ) | (82 | ) | ||||||||
Foreign currency translation adjustment | 24 | 24 | ||||||||||
Financial instruments (net of tax of $1) | (2 | ) | (2 | ) | ||||||||
Total comprehensive loss (Restated) | $ | (342 | ) | |||||||||
Net increase in investment from Stora Enso Oyj | 1 | 1 | ||||||||||
Balance at December 31, 2005 (Restated) | $ | 1,457 | $ | (20 | ) | $ | 1,437 | |||||
Comprehensive loss: | ||||||||||||
Net loss (Restated) | (243 | ) | (243 | ) | ||||||||
Minimum pension liability adjustment (net of tax of $47) | 76 | 76 | ||||||||||
Foreign currency translation adjustment | 5 | 5 | ||||||||||
Total comprehensive loss (Restated) | $ | (162 | ) | |||||||||
Net increase in investment from Stora Enso Oyj | 2 | 2 | ||||||||||
Effect of adoption of SFAS 158 (net of tax of $117) | (260 | ) | (260 | ) | ||||||||
Balance at December 31, 2006 (Restated) | $ | 1,216 | $ | (199 | ) | $ | 1,017 | |||||
The accompanying notes are an integral part of these financial statements.
F-69
Table of Contents
NOTES TO THE COMBINED FINANCIAL STATEMENTS
Note 1—Business and Summary of Significant Accounting Policies
Organization and Description of Business
The combined financial statements of the graphic paper, publication paper, specialty paper and other operations of Stora Enso Oyj, Finland (“the parent company”) in the United States of America (“US”) and Canada (collectively referred to as “North America”) are generally referred to as Stora Enso North America (“SENA”). As used in these notes, the terms “SENA,” “we,” “our,” “the Company,” “Stora Enso North America” and “us” refer to the combined operations of SENA.
SENA is a leading graphic, publication and specialty paper manufacturer in North America. We manufacture and market a broad range of paper products for a variety of applications such as corporate annual reports, high-end advertising brochures, magazines, catalogs, direct mail advertising, self adhesive labels, wet strength labels and flexible packaging.
SENA operates eight mills and 16 paper machines located primarily in Wisconsin, with one mill each in Nova Scotia, Canada and Minnesota. Our headquarters are in Wisconsin Rapids, Wisconsin. We also operate a hotel and a public utility, both of which are located in Wisconsin Rapids, Wisconsin.
The operations of SENA are ultimately wholly owned by Stora Enso Oyj of Finland. Stora Enso Oyj was formed as a combination of the former Enso Oyj of Finland and the former Stora Kopparbergs Bergslags AB of Sweden in December 1998 and, as a result of the merger, the latter became a subsidiary of Stora Enso Oyj (formerly Enso Oyj). Stora Enso Oyj and its subsidiaries are collectively referred to as the “Group”.
Stora Enso Oyj acquired the US operations of SENA from Consolidated Papers, Inc. (“CPI”) in August 2000. The US operations are contained in a subsidiary named Stora Enso North America Corp. The operations in Canada are contained in a subsidiary named Stora Enso Port Hawkesbury Limited, which was owned by Stora Enso Oyj through their Stora Kopparbergs Bergslags AB subsidiary until October of 2004. Since October of 2004, both Stora Enso Port Hawkesbury Limited and Stora Enso North America Corp. are wholly owned subsidiaries of Stora Enso North America Inc., which is a wholly owned subsidiary of Stora Enso Oyj.
Basis of Preparation
The accompanying combined financial statements of SENA have been prepared in accordance with accounting principles generally accepted in the United States of America (“US GAAP”) on a carve-out basis. Management believes the assumptions underlying the combined financial statements, including the allocation methodology described below, are reasonable. These combined financial statements include all assets, liabilities, equity, revenues and expenses of Stora Enso Port Hawkesbury Limited. and of Stora Enso North America Corp and its subsidiaries, excluding a 38.2% interest, as of December 31, 2006, in Thiele Kaolin Company, an investment accounted for using the equity method, and excluding amounts related to the Group’s import sales activity into North America for paper and timber products. Significant inter-company transactions and accounts have been eliminated.
The accompanying combined financial statements are prepared on a carve-out basis to present the operations of SENA as a stand alone entity. In accordance with Stora Enso Oyj policy, most costs are pushed down to subsidiaries on an arm’s length basis and therefore minimal additional allocation of
F-70
Table of Contents
STORA ENSO NORTH AMERICA
NOTES TO THE COMBINED FINANCIAL STATEMENTS—(Continued)
corporate expenses has been considered necessary for these combined financial statements. The exceptions are stock based compensation and certain debt related hedges which are described below.
Reclassifications
Depreciation and amortization of $270, $305 and $288 has been reclassified to cost of sales and selling, general and administrative expenses for the years ended December 31, 2006, 2005 and 2004, respectively, as follows:
| Year Ended December 31, | |||||||||
| 2006 | 2005 | 2004 | |||||||
| (Dollars in millions) | |||||||||
Cost of sales | $ | 265 | $ | 299 | $ | 281 | |||
Selling, general and administrative expenses | 5 | 6 | 7 | ||||||
Additionally, certain amounts have been reclassified in the prior year balance sheet to conform with the current year’s presentation.
Use of Estimates
The preparation of combined financial statements in accordance with US GAAP requires management to make estimates and assumptions that affect the reported amounts of assets and liabilities, the disclosure of contingent assets and liabilities at the dates of the financial statements and the reported amounts of revenues and expenses during the period. Actual results may differ from these estimates.
Foreign Currency Transactions
Transactions in foreign currencies are recorded using the rate of exchange prevailing at the transaction date. At the end of the month, foreign currency-denominated receivables and liabilities are translated using the month end exchange rate.
Foreign Currency Translation
The statements of operations of foreign entities, whose functional currencies are not US dollars, are translated into US dollars using the average exchange rates for the year, whereas the balance sheets are translated using the exchange rates at the reporting date. Exchange rate differences arising from the re-translation of the net investments in foreign entities are recorded directly in owner’s investment in Accumulated Other Comprehensive Income (Loss) (“AOCI”), as shown in the Combined Statements of Owner’s Investment and Comprehensive Income (Loss).
Derivative Financial Instruments & Hedging
Stora Enso Oyj’s treasury group (“Group Treasury”) works together with the operating units to determine the best hedging strategy for the respective units within the framework set out in the financial risk policy. The Group companies, including SENA, execute the hedging transactions with Group Treasury and the parent company executes the external deals. Within the hedging strategies on behalf of the subsidiaries, Stora Enso Oyj works on a zero margin basis, meaning that the pricing of the internal deals follows one to one with the pricing of the external deals and the gains and losses
F-71
Table of Contents
STORA ENSO NORTH AMERICA
NOTES TO THE COMBINED FINANCIAL STATEMENTS—(Continued)
between the external and internal transactions offset each other. By channeling the external hedging transactions via Group Treasury, the Group can minimize transaction expenses, get the best possible pricing from financial markets, synchronize risk management and simplify follow-up of the counterparty credit risks.
Changes in the fair value of derivatives designated and qualifying as fair value hedges are recorded in the Combined Statements of Operations, along with any changes in the fair value of the hedged assets or liabilities attributable to the hedged risk. SENA has executed certain fair value hedges related to their external long-term fixed rate bond loans.
Changes in the fair value of derivatives designated and qualifying as cash flow hedges are recognized in owner’s investment within AOCI. The cumulative gain or loss of a derivative deferred in owner’s investment is transferred to the Combined Statements of Operations and classified as income or expense in the same period in which the hedged item affects the Combined Statements of Operations. When a hedging instrument expires, is sold, terminated or exercised, has its designation revoked or it no longer meets the criteria for hedge accounting under US GAAP, any cumulative gain or loss deferred in owner’s investment at that time remains in owner’s investment and is accounted for as an adjustment to income or expense when the committed or forecasted transaction is ultimately recognized in the Combined Statements of Operations. However, if the forecasted transaction is no longer expected to occur, the cumulative gain or loss reported in owner’s investment, from the period when the hedge was effective, shall be recognized in the Combined Statements of Operations immediately. SENA has executed certain cash flow hedges related to their currency and commodity exposure.
Certain derivative transactions, while providing effective economic hedges under the Group risk management policies, do not qualify for hedge accounting under the specific rules of US GAAP and therefore changes in the fair value of such non-qualifying hedge instruments are immediately recognized in the Combined Statements of Operations.
Revenue Recognition
Sales which comprise products, raw materials, energy and services, less discounts, are adjusted for exchange differences on sales in foreign currency. Sales are recognized after the Company has transferred the risks and rewards of ownership to the buyer and the Company retains neither a continuing right to dispose of the goods, nor effective control of those goods; usually, this means that sales are recorded upon delivery of goods to customers in accordance with agreed terms of delivery.
Shipping and Handling Costs
Handling costs are classified as a component of cost of sales. Amounts billed to a customer in a sales transaction related to shipping are classified as revenue.
Research and Development
Research and development costs are expensed as incurred in selling, general and administrative expenses in the Combined Statements of Operations. Such costs incurred in the development of new products or significant improvements to existing products amounted to $6 million in 2006, $6 million in 2005 and $5 million in 2004.
F-72
Table of Contents
STORA ENSO NORTH AMERICA
NOTES TO THE COMBINED FINANCIAL STATEMENTS—(Continued)
Advertising Costs
Advertising costs are expensed as incurred. Such costs amounted to $3 million in 2006, $5 million in 2005 and $3 million in 2004.
Computer Software Development Costs
Computer software development costs or acquisition costs of new software clearly associated with an identifiable and unique product, which will be controlled by the Company and has probable benefit exceeding its cost beyond one year, are recognized as an intangible asset and amortized over the software’s expected useful life. Website costs are expensed as incurred.
Environmental Remediation Costs
Environmental expenditures resulting from the remediation of an existing condition caused by past operations, and which do not contribute to current or future revenues, are expensed as incurred. Environmental liabilities are recorded, based on current interpretations of environmental laws and regulations, when it is probable that a present obligation has arisen and the amount of such liability can be reliably estimated. Amounts accrued do not include third-party recoveries.
Income Taxes
The operations of SENA in the US have been included in the consolidated federal income tax return of Stora Enso North America, Inc. The operations of SENA in Canada have been included in the federal income tax return of Stora Enso Port Hawkesbury, Limited. The provision (benefit) for income taxes in the Combined Statements of Operations is calculated on a separate return basis as if we had operated as a stand-alone entity in 2006, 2005 and 2004. We record the estimated future tax effects of temporary differences between the tax basis of assets and liabilities and amounts reported in our Combined Balance Sheets, as well as operating loss and tax credit carryforwards. We follow very specific and detailed guidelines in each tax jurisdiction regarding the recoverability of any tax assets recorded on the Combined Balance Sheets and provide necessary valuation allowances, as required. We regularly review our deferred tax assets for recoverability based on historical taxable income, projected future taxable income, the expected timing of the reversals of existing temporary differences and tax planning strategies.
Goodwill
Goodwill resulting from the acquisition of CPI by Stora Enso Oyj has been recorded in the combined financial statements of SENA in accordance with push down accounting principles. Goodwill represents future economic benefits arising from assets that are not capable of being individually identified and separately recognized in an acquisition. Goodwill is computed as the excess of the cost of an acquisition over the fair value of the acquirer’s share of net assets of the acquired entity at the acquisition date and is allocated to those reporting units expected to benefit from the acquisition.
In accordance with Statement of Financial Accounting Standards (“SFAS”) No. 142, “Goodwill and Other Intangible Assets” (“SFAS 142”),goodwill is required to be tested at least annually for impairment. SFAS 142 requires that goodwill be tested for impairment using a two-step process. The first step is to identify a potential impairment and the second step is to measure the amount of the impairment loss, if any. Goodwill is deemed to be impaired if the carrying amount of a reporting unit’s net assets exceeds its estimated fair value. Fair value is calculated using a present value of future
F-73
Table of Contents
STORA ENSO NORTH AMERICA
NOTES TO THE COMBINED FINANCIAL STATEMENTS—(Continued)
cash flow valuation technique. The goodwill of the combined entity has been tested for impairment using the combined entity’s reporting units.
Intangible Assets
Intangible assets are stated at historical cost, or fair value if acquired, and are amortized on a straight-line basis over expected useful lives which usually vary from 3 to 10 years, though up to 20 years for trademarks and patents. Intangible items acquired are recognized as assets separately from goodwill if they meet the definition of an asset, are either separable or arise from contractual or other legal rights, and their fair value can be measured reliably.
Intangible assets recognized separately from goodwill in acquisitions consist of marketing and customer related or contract and technology based intangible assets. Typical marketing and customer related assets are trademarks, trade names, service marks, collective marks, certification marks, customer lists, order or production backlogs, customer contracts and the related customer relationships. The contract and technology based intangible assets are normally licensing and royalty agreements or patented technology and trade secrets such as confidential formulas, processes or recipes.
Property, Plant and Equipment
Property, plant and equipment acquired are stated at historical cost. Assets acquired through business combinations are stated at their fair values at the date of acquisition. Depreciation is computed on a straight-line basis, as adjusted for any impairment and disposal charges. Interest costs on borrowings to finance the construction of these assets are capitalized as part of the cost during the construction period.
Land is not depreciated as it is deemed to have an indefinite life, but otherwise depreciation is based on the following expected useful lives:
Asset Class | Depreciation Years | |
Buildings, industrial | 10-50 | |
Buildings, residential and office | 20-50 | |
Groundwood mills | 15-20 | |
Hydro-electric power | 40 | |
Paper mills, main machines | 20 | |
Pulp mills, main machines | 20 | |
Heavy machinery | 10-20 | |
Computers | 3-5 | |
Vehicles | 5 | |
Office equipment | 3-5 | |
Railway, harbors | 20-25 | |
Forest roads | 10-35 | |
Roads, fields, bridges | 15-20 |
Ordinary maintenance and repair charges are expensed as incurred; however, the costs of significant renewals and improvements are capitalized and depreciated over the remaining useful lives of the related assets.
F-74
Table of Contents
STORA ENSO NORTH AMERICA
NOTES TO THE COMBINED FINANCIAL STATEMENTS—(Continued)
Impairment
Long-lived assets are reviewed for impairment when current events or circumstances indicate that the carrying value of the assets may not be recoverable. This review compares the assets’ net book value to the projected undiscounted future cash flows generated by their use. The impaired assets are recorded at their estimated fair value.
Inventories
Inventories are reported at the lower of cost or market with cost being determined by the first-in first-out (“FIFO”) method or, alternatively, weighted average cost where it approximates FIFO. The cost of finished goods and work in progress is comprised of raw material, direct labor, depreciation, other direct costs and related production overhead but excludes interest expense. Market is the estimated selling price in the ordinary course of business, less costs of completion and sale.
Trade Receivables
Trade receivables are reported at their anticipated realizable value, an estimate being made for doubtful receivables based on an objective review of all outstanding amounts at the end of the reporting period.
Cash and Cash Equivalents
Cash and cash equivalents are comprised of cash on hand, deposits held with banks, cash pool balances and other liquid investments with original maturity of less than three months. Bank and cash pool overdrafts are reported separately in other interest bearing liabilities under other current liabilities. The Group parent company, Stora Enso Oyj, is the master account holder of the cash pool. Account balances of sub-accounts, such as the Company’s accounts, are consolidated to the master account thereby creating an internal liability between the master account holder and the sub-accounts. Cash pool internal interest is allocated to the member accounts by the participating banks at the end of each quarter. The account balances of sub-accounts represent the Company’s liquid cash receivable from or payable to the parent company and amounted to $173 million of cash on deposit at December 31, 2006 and a $4 million overdraft at December 31, 2005.
Loans Receivable
Loans receivable are non-derivative financial assets with fixed or determinable payments that are not quoted in an active market. They are recorded at cost and are subject to regular and systematic review as to collectibility and available guarantees. If any loan receivable is estimated to be unrecoverable, a provision is made for the shortfall between the carrying amount and the present value of the expected cash flows. Interest income on loans receivable is included within other income.
Pension and Other Postretirement Benefits
The Company maintains various defined benefit pension and other postretirement plans in accordance with the local conditions and practices in the countries in which it operates. The plans are generally funded through payments to pension funds/trusts or by provisions, as determined by periodic actuarial calculations. Any trust deficits or benefit payments requiring additional contributions are funded through payments or provisions allocated over a period of years not exceeding the expected remaining lives of the participating employees. The Company has met minimum funding requirements for the countries in which it operates.
F-75
Table of Contents
STORA ENSO NORTH AMERICA
NOTES TO THE COMBINED FINANCIAL STATEMENTS—(Continued)
Under SFAS No. 87, “Employers’ Accounting for Pensions” (SFAS 87”), as amended by SFAS No. 158 “Employers’ Accounting for Defined Benefit Pension and Other Postretirement Plans” (“SFAS 158”), pension expense is based upon a specified methodology that includes a designated actuarial approach and reflects the concept of accrual accounting. Under SFAS No. 106, “Employers’ Accounting for Postretirement Benefits Other Than Pensions” (“SFAS 106”), expense for postretirement benefits other than pensions (including retiree healthcare, life insurance and disability benefits, as applicable) is based upon a specified methodology that includes a designated actuarial approach and reflects the concept of accrual accounting. Under US GAAP, defined benefit pension and other postretirement benefit expense is recorded on a full accrual basis and reflected in the Combined Statements of Operations over the working lives of the employees provided with such benefits. The economic and demographic assumptions used in calculating defined benefit pension and other postretirement benefit expense are required to be reviewed and updated periodically to the extent that local market economic conditions and demographics change.
SFAS 158
The Company adopted SFAS 158 as of December 31, 2006. This new standard requires the Company to recognize a net liability or asset to report the funded status of the defined benefit pension and other postretirement benefit plans. Recognizing the funded status of the defined benefit postretirement plans as a net liability or asset requires an offsetting adjustment, net of tax, to AOCI in owner’s investment. Actuarial gains or losses and prior service costs or credits are recorded as a component of AOCI. Amounts recorded in AOCI are adjusted as they are subsequently recognized as components of net periodic benefit cost pursuant to the provisions of SFAS 158.
Share-based Compensation
The Group has a number of cash settled stock based compensation plans described below and the related liabilities are recorded at Group level. The Group level liability has been allocated to SENA based on average outstanding options at period end held by SENA employees as a percentage of total options outstanding.
SFAS 123(R)
Prior to the January 1, 2006 adoption of SFAS No. 123 (R), “Share-Based Payment” (“SFAS 123R”), the Group, as allowed under SFAS No. 123, “Accounting for Stock-Based Compensation” (“SFAS 123”), elected to apply the intrinsic value method of Accounting Principles Board Opinion No. 25, “Accounting for Stock Issued to Employees”, and related interpretations in accounting for its stock based plans.
Effective January 1, 2006, the Group adopted SFAS 123R using the modified prospective transition method which requires the use of the fair value method but does not require any retroactive adjustment of prior periods. The employee has the choice in all Group compensation plans to receive either cash or equity upon settlement, therefore all plans in the Group are accounted for using the liability method.
The Stora Enso Oyj synthetic option programs for 1999 through 2006 are settled with cash payments. The fair value of employee services received in exchange for options settled in cash is recognized at the fair value of the liability incurred and expensed ratably over the vesting period. The liability is re-measured at each balance sheet date to its fair value using estimates of the number of
F-76
Table of Contents
STORA ENSO NORTH AMERICA
NOTES TO THE COMBINED FINANCIAL STATEMENTS—(Continued)
options that are expected to become exercisable and the latest fair valuations using the Black-Scholes model, with all changes recognized immediately in the Combined Statements of Operations.
The fair value of employee services received in exchange for stock awards settled in cash is recognized at the fair value of the liability incurred and expensed ratably over the vesting period. The liability is re-measured at each balance sheet date to its fair value using estimates of the number of stock awards that are expected to be issued and the latest fair valuations by using the Stora Enso Oyj R-share closing price, with all changes recognized immediately in the Combined Statements of Operations.
The liabilities recorded at Group level and amounts allocated to SENA are as follows:
| As of December 31, | ||||||
| Group Level Liability | SENA Allocation | |||||
| (Dollars in millions) | ||||||
Stock based liability at December 31, 2006 | $ | 43 | $ | 6 | ||
Stock based liability at December 31, 2005 | 13 | 2 | ||||
Stock based liability at December 31, 2004 | 7 | 1 | ||||
Other Accounting Pronouncements
SFAS 157
In September 2006, the FASB issued SFAS No. 157, “Fair Value Measurements,” (“SFAS 157”). SFAS 157 provides guidance related to the definition of fair value, establishes a common framework for measuring fair value under US GAAP and expands disclosures required about fair value measurements. SFAS 157 applies only where fair value is required or permitted under other pronouncements and does not propagate new fair value measurements by itself. The Company will adopt this standard beginning on January 1, 2008 and is currently evaluating the impact of the standard on its results of operations and financial position.
SFAS 159
In February 2007, the FASB issued SFAS No. 159, “The Fair Value Option for Financial Assets and Financial Liabilities,” including an amendment of SFAS 115 (“SFAS 159”). SFAS 159 permits entities to choose to measure many financial instruments and certain other assets and liabilities at fair value. The Company will adopt this standard on January 1, 2008 and is currently evaluating the impact of the standard on its results of operations and financial position.
FIN 48
In June 2006, the FASB issued FASB interpretation No. 48, “Accounting for Uncertainty in Income Taxes, an interpretation of FASB Statement No. 109” (“FIN 48”). FIN 48 was issued to clarify the uncertainty in income taxes recognized in the financial statements. This interpretation prescribes a recognition threshold and measurement attribute for the financial statement recognition and measurement of a tax position taken or expected to be taken in a tax return. FIN 48 also provides guidance on derecognizing, classification, interest and penalties, accounting in interim periods, disclosure and transition. The Company will adopt this standard on January 1, 2007 and is currently evaluating the impact of the standard on its results of operations and financial position, but does not anticipate the impact of adoption to exceed $10 million.
F-77
Table of Contents
STORA ENSO NORTH AMERICA
NOTES TO THE COMBINED FINANCIAL STATEMENTS—(Continued)
Note 2—Restatements of Financial Statements
November 2007
Restatement—On November 2, 2007, the Company identified an error in the computation of the valuation allowance related to net deferred tax assets in Canada for the year ended December 31, 2005. This error resulted in an overstatement of the Company's deferred tax liabilities at December 31, 2006 and 2005 and an overstatement of the Company's 2005 net loss. Additionally, the Company identified a clerical error related to the disclosures in Note 4—Income Taxes. This error understated the disclosure of the deferred tax asset related to net operating loss carryforwards and overstated the disclosure of the deferred tax liability related to property, plant and equipment by $48 million as of December 31, 2006 and 2005.
On November 28, 2007, a lease which had been treated as an operating lease was determined to be a capital lease for purposes of these combined financial statements based on terms of a default covenant contained in the lease agreement pursuant to a 2002 amendment for a guaranty from Stora Enso Oyj, with respect to the Company's obligation under the lease. This change in treatment resulted in a reduction in rent expense, and increase in amortization expense (both are components of cost of sales), an increase in interest expense, an increase in property, plant and equipment and an increase in long term debt for each of the years ended December 31, 2006, 2005 and 2004. The effect of the lease restatement on cost of sales was a reduction of rent expense of $7 million and an increase in amortization expense of $7 million for the three years ended December 31, 2006, 2005 and 2004.
The following table presents the effect of the restatement adjustments on the Company’s Combined Statements of Operations for the years ended December 31, 2006, 2005 and 2004, respectively:
| Year Ended December 31, 2006 | Year Ended December 31, 2005 | Year Ended December 31, 2004 | ||||||||||||||||||||||||||||||||||
| As Originally Reported | Effect of Restatement | As Previously Restated | As Originally Reported | Effect of Restatement | As Previously Restated | As Originally Reported | Effect of Restatement | As Previously Restated | ||||||||||||||||||||||||||||
| (Dollars in millions) | ||||||||||||||||||||||||||||||||||||
Net Sales | $ | 2,030 | $ | — | $ | 2,030 | $ | 2,204 | $ | — | $ | 2,204 | $ | 1,928 | $ | — | $ | 1,928 | ||||||||||||||||||
Costs and Expenses: | ||||||||||||||||||||||||||||||||||||
Cost of sales | 1,989 | — | 1,989 | 2,133 | — | 2,133 | 1,981 | — | 1,981 | |||||||||||||||||||||||||||
Selling, general and administrative expenses | 108 | — | 108 | 113 | — | 113 | 111 | — | 111 | |||||||||||||||||||||||||||
Goodwill impairment | — | — | — | 162 | — | 162 | 520 | — | 520 | |||||||||||||||||||||||||||
Property, plant and equipment impairment | 113 | — | 113 | — | — | — | — | — | — | |||||||||||||||||||||||||||
Interest expense | 83 | 9 | 92 | 66 | 9 | 75 | 54 | 9 | 63 | |||||||||||||||||||||||||||
Other (income) | (1 | ) | — | (1 | ) | (4 | ) | — | (4 | ) | (6 | ) | — | (6 | ) | |||||||||||||||||||||
Loss before income taxes | (262 | ) | (9 | ) | (271 | ) | (266 | ) | (9 | ) | (275 | ) | (732 | ) | (9 | ) | (741 | ) | ||||||||||||||||||
Income tax provision (benefit) | (24 | ) | (4 | ) | (28 | ) | 49 | (42 | ) | 7 | (81 | ) | (3 | ) | (84 | ) | ||||||||||||||||||||
Net loss | $ | (238 | ) | $ | (5 | ) | $ | (243 | ) | $ | (315 | ) | $ | 33 | $ | (282 | ) | $ | (651 | ) | $ | (6 | ) | $ | (657 | ) | ||||||||||
F-78
Table of Contents
STORA ENSO NORTH AMERICA
NOTES TO THE COMBINED FINANCIAL STATEMENTS—(Continued)
The following table presents the effect of the restatement adjustments on the Company’s Combined Balance Sheets as of December 31, 2006 and 2005:
| December 31, 2006 | December 31, 2005 | |||||||||||||||||||||||
| As Originally Reported | Effect of Restatement | Restated | As Originally Reported | Effect of Restatement | Restated | |||||||||||||||||||
| (Dollars in millions) | ||||||||||||||||||||||||
ASSETS: | ||||||||||||||||||||||||
Current assets: | ||||||||||||||||||||||||
Cash and cash equivalents | $ | 195 | $ | — | $ | 195 | $ | 82 | $ | — | $ | 82 | ||||||||||||
Accounts receivable, net of allowance for doubtful accounts | 129 | — | 129 | 113 | 113 | |||||||||||||||||||
Inventories | 346 | — | 346 | 349 | 349 | |||||||||||||||||||
Deferred tax assets | 32 | — | 32 | 31 | 31 | |||||||||||||||||||
Other current assets | 28 | — | 28 | 29 | — | 29 | ||||||||||||||||||
Total current assets | 730 | — | 730 | 604 | — | 604 | ||||||||||||||||||
Non-current assets: | ||||||||||||||||||||||||
Property, plant and equipment, net | 2,387 | 92 | 2,479 | 2,694 | 98 | 2,792 | ||||||||||||||||||
Goodwill | 280 | — | 280 | 280 | — | 280 | ||||||||||||||||||
Other intangible assets, net | 11 | — | 11 | 13 | — | 13 | ||||||||||||||||||
Other non-current assets | 21 | — | 21 | 267 | — | 267 | ||||||||||||||||||
Total non-current assets | 2,699 | 92 | 2,791 | 3,254 | 98 | 3,352 | ||||||||||||||||||
Total assets | $ | 3,429 | $ | 92 | $ | 3,521 | $ | 3,858 | $ | 98 | $ | 3,956 | ||||||||||||
LIABILITIES AND OWNER’S INVESTMENT: | ||||||||||||||||||||||||
Current liabilities: | ||||||||||||||||||||||||
Current portion of long-term debt | $ | 103 | $ | — | $ | 103 | $ | — | $ | — | $ | — | ||||||||||||
Accounts payable | 167 | — | 167 | 164 | — | 164 | ||||||||||||||||||
Accrued payroll and benefits | 51 | — | 51 | 44 | — | 44 | ||||||||||||||||||
Postretirement benefit provisions | 16 | — | 16 | 19 | — | 19 | ||||||||||||||||||
Other current liabilities | 120 | — | 120 | 120 | — | 120 | ||||||||||||||||||
Total current liabilities | 457 | — | 457 | 347 | — | 347 | ||||||||||||||||||
Non-current liabilities: | ||||||||||||||||||||||||
Long-term debt | 1,314 | 132 | 1,446 | 1,412 | 130 | 1,542 | ||||||||||||||||||
Deferred tax liabilities | 175 | (56 | ) | 119 | 270 | (53 | ) | 217 | ||||||||||||||||
Postretirement benefit provisions | 468 | — | 468 | 402 | — | 402 | ||||||||||||||||||
Other non-current liabilities | 14 | — | 14 | 11 | — | 11 | ||||||||||||||||||
Total non-current liabilities | 1,971 | 76 | 2,047 | 2,095 | 77 | 2,172 | ||||||||||||||||||
Commitments and contingencies | — | — | — | — | — | — | ||||||||||||||||||
Owner’s investment: | ||||||||||||||||||||||||
Owner’s investment | 1,202 | 14 | 1,216 | 1,438 | 19 | 1,457 | ||||||||||||||||||
Accumulated other comprehensive loss | (201 | ) | 2 | (199 | ) | (22 | ) | 2 | (20 | ) | ||||||||||||||
Total owner’s investment | 1,001 | 16 | 1,017 | 1,416 | 21 | 1,437 | ||||||||||||||||||
Total liabilities and owner’s investment | $ | 3,429 | $ | 92 | $ | 3,521 | $ | 3,858 | $ | 98 | $ | 3,956 | ||||||||||||
F-79
Table of Contents
STORA ENSO NORTH AMERICA
NOTES TO THE COMBINED FINANCIAL STATEMENTS—(Continued)
The cumulative effect of the restatements was a decrease of $14 million to owner's investment at January 1, 2005.
The following table presents the major subtotals for the Company’s Combined Statements of Cash Flows and the related impact of the restatement adjustments discussed above for the years ended December 31, 2006, 2005 and 2004, respectively:
| Year Ended December 31, 2006 | Year Ended December 31, 2005 | Year Ended December 31, 2004 | |||||||||||||||||||||||||||||||
| As Originally Reported | Effect of Restatement | Restated | As Originally Reported | Effect of Restatement | Restated | As Originally Reported | Effect of Restatement | Restated | |||||||||||||||||||||||||
| (Dollars in millions) | |||||||||||||||||||||||||||||||||
Net cash provided by (used in): | |||||||||||||||||||||||||||||||||
Operating activities | $ | 169 | $ | — | $ | 169 | $ | 175 | $ | — | $ | 175 | $ | (43 | ) | $ | — | $ | (43 | ) | |||||||||||||
Investing activities | (60 | ) | — | (60 | ) | (82 | ) | — | (82 | ) | (188 | ) | — | (188 | ) | ||||||||||||||||||
Financing activities | 4 | — | 4 | (39 | ) | — | (39 | ) | (304 | ) | — | (304 | ) | ||||||||||||||||||||
Effect of exchange rate changes on cash and cash equivalents | — | — | — | — | — | — | — | — | — | ||||||||||||||||||||||||
Net increase in cash and cash equivalents | 113 | — | 113 | 54 | — | 54 | (535 | ) | — | (535 | ) | ||||||||||||||||||||||
Cash and cash equivalents at beginning of year | 82 | — | 82 | 28 | — | 28 | 563 | — | 563 | ||||||||||||||||||||||||
Net cash and cash equivalents at year end | $ | 195 | $ | — | $ | 195 | $ | 82 | $ | — | $ | 82 | $ | 28 | $ | — | $ | 28 | |||||||||||||||
F-80
Table of Contents
STORA ENSO NORTH AMERICA
NOTES TO THE COMBINED FINANCIAL STATEMENTS—(Continued)
The following table presents the effect of the restatement adjustments on the Company’s Combined Statements of Owner's Investment and Comprehensive Income (Loss) for the years ended December 31, 2006, 2005 and 2004, respectively:
| Year Ended December 31, 2006 | Year Ended December 31, 2005 | Year Ended December 31, 2004 | ||||||||||||||||||||||||||||||||||
| As Originally Reported | Effect of Restatement | Restated | As Originally Reported | Effect of Restatement | Restated | As Originally Reported | Effect of Restatement | Restated | ||||||||||||||||||||||||||||
| (Dollars in millions) | ||||||||||||||||||||||||||||||||||||
Balance at beginning of year | $ | 1,416 | $ | 21 | $ | 1,437 | $ | 1,792 | $ | (14 | ) | $ | 1,778 | $ | 1,748 | $ | (8 | ) | $ | 1,740 | ||||||||||||||||
Comprehensive income: | ||||||||||||||||||||||||||||||||||||
Net loss | (238 | ) | (5 | ) | (243 | ) | (315 | ) | 33 | (282 | ) | (651 | ) | (6 | ) | (657 | ) | |||||||||||||||||||
Minimum pension liability adjustment (net of tax) | 76 | — | 76 | (82 | ) | — | (82 | ) | 51 | — | 51 | |||||||||||||||||||||||||
Foreign currency translation adjustment | 5 | — | 5 | 22 | 2 | 24 | 42 | — | 42 | |||||||||||||||||||||||||||
Financial instruments (net of tax) | — | — | — | (2 | ) | — | (2 | ) | 1 | — | 1 | |||||||||||||||||||||||||
Total comprehensive loss | (157 | ) | (5 | ) | (162 | ) | (377 | ) | 35 | (342 | ) | (557 | ) | (6 | ) | (563 | ) | |||||||||||||||||||
Equity investment from Stora Enso Oyj | — | — | — | — | — | — | 600 | — | 600 | |||||||||||||||||||||||||||
Net Increase in investment from Stora Enso Oyj | 2 | — | 2 | 1 | — | 1 | 1 | — | 1 | |||||||||||||||||||||||||||
Effect of adoption of SFAS 158 (net of tax) | (260 | ) | — | (260 | ) | — | — | — | — | — | — | |||||||||||||||||||||||||
Balance at end of year | $ | 1,001 | $ | 16 | $ | 1,017 | $ | 1,416 | $ | 21 | $ | 1,437 | $ | 1,792 | $ | (14 | ) | $ | 1,778 | |||||||||||||||||
April 2008
The Company was acquired by NewPage Corporation on December 21, 2007. On April 21, 2008, in conjunction with the preparation of a registration statement that included the Company’s financial statements, the Company identified an error related to the presentation of shipping and handling costs. This change in treatment resulted in an increase in net sales and an increase in the same amount in cost of sales for each of the years ended December 31, 2006, 2005 and 2004. There was no effect on the Company’s Combined Balance Sheets, Combined Statements of Cash Flows, or Combined Statements of Owners’ Investment and Comprehensive Income (Loss).
The following table presents the effect of this restatement on the Company’s net sales and cost of sales for the years ended December 31, 2006, 2005 and 2004, respectively:
| Year Ended December 31, 2006 | Year Ended December 31, 2005 | Year Ended December 31, 2004 | |||||||||||||||||||||||||
| As Previously Restated | Effect of Restatement | Restated | As Previously Restated | Effect of Restatement | Restated | As Previously Restated | Effect of Restatement | Restated | |||||||||||||||||||
| (Dollars in millions) | |||||||||||||||||||||||||||
Net sales | $ | 2,030 | $ | 146 | $ | 2,176 | $ | 2,204 | $ | 170 | $ | 2,374 | $ | 1,928 | $ | 148 | $ | 2,076 | |||||||||
Cost of sales | 1,989 | 146 | 2,135 | 2,133 | 170 | 2,303 | 1,981 | 148 | 2,129 | ||||||||||||||||||
F-81
Table of Contents
STORA ENSO NORTH AMERICA
NOTES TO THE COMBINED FINANCIAL STATEMENTS—(Continued)
Additionally, all footnotes to the combined financial statements affected by the restatements have been labeled as restated.
Note 3—Segment Information
SENA’s six reportable segments are as follows: coated publication paper, uncoated publication paper, newsprint, fine paper, specialty paper and other. These segments are consistent with the internal structure used to manage these businesses.
Reportable Segment Accounting Policies (Restated)
The accounting policies applicable to these reportable segments are the same as those described in the Summary of Significant Accounting Policies with the following exceptions:
| Ÿ | The amortization of unrecognized actuarial gains and losses relating to postretirement benefits is recorded directly to owner’s investment in the internal management reports, whereas, for external purposes, the amounts are amortized to income or expense over the average remaining working life of the plan participants. |
| Ÿ | Plant, property and equipment impairment testing for management purposes uses discounted cash flows whereas, for external purposes, undiscounted cash flows are used to determine if impairment has occurred. The resulting differences in book values mean that there are also differences in depreciation charges. |
| Ÿ | Restructuring provisions are recorded in full in the management reports once a plan has been announced which results in timing differences between expense recognition under internal and external reporting. The main difference relates to severance payments which are recognized for internal purposes once a plan has been announced whereas, for external purposes, severance payments are recognized ratably over the remaining service period of the employees. |
Inter-segment sales and transfers are recorded at current market prices. Management evaluates the performance of the segments based primarily on earnings before interest and income taxes (“EBIT” or “operating profit”), excluding non-recurring items. The most common non-recurring items are impairments, restructuring provisions and changes in accounting standards.
Coated Publication Paper
SENA’s coated publication paper business is a leading manufacturer in North America specializing in lightweight coated (“LWC”), ultra-lightweight coated (“ULWC”) and rotogravure products with total production capacity of approximately 810,000 tonnes. The business operates three integrated manufacturing facilities in Wisconsin, located in Biron, Niagara and Whiting. The business serves the North American publishing and printing industry, with a primary focus on mail-order catalog, magazine and retailer end uses. SENA coated publication paper distributes product through both direct and merchant sales channels. Direct sales are targeted at strategic and key clients with potential paper purchases of $3 million or more.
Uncoated Publication Paper
SENA’s uncoated publication paper business is the leading manufacturer in North America of supercalendered papers (SC-A and SC-A(+)). The business operates two paper mills in Port
F-82
Table of Contents
STORA ENSO NORTH AMERICA
NOTES TO THE COMBINED FINANCIAL STATEMENTS—(Continued)
Hawkesbury, Nova Scotia and Duluth, Minnesota with total production capacity of approximately 615,000 tonnes. The business serves the North American publishing and printing industry, selling into major end-uses such as inserts/fliers, magazines and catalogs. SENA uncoated publication paper distributes product through both direct and merchant sales channels. Products are sold primarily in the US and Canada, with some exported to Mexico and Brazil from the Port Hawkesbury mill.
Newsprint
SENA’s newsprint business is a niche supplier of newsprint paper. The business operates one paper machine located in Port Hawkesbury, Nova Scotia with total production capacity of approximately 195,000 tonnes. The business serves the North American publishing and printing industry, selling into major end-uses such as newspapers and inserts/fliers for retail customers. SENA newsprint is distributed through both direct and merchant sales channels. Products are sold primarily in the US and Canada, with some exported to Iceland and Mexico.
Fine Paper
SENA’s fine paper business is a top three supplier of coated woodfree paper in North America with total capacity of approximately 980,000 tonnes in two Wisconsin mills, located in Wisconsin Rapids and Kimberly. The business serves the North American publication and printing industry, selling into major end-uses including commercial printing, direct mail, magazines, catalogs and retail. SENA fine paper distributes product through both direct and merchant sales channels. By accessing the market through both channels, the Company is able to access a large group of end use customers through merchant distribution while also providing mill direct service to large publishers, catalogers, printers and retailers. Fine paper sales are often bundled with SENA’s coated or uncoated publication papers.
Specialty Paper
SENA operates a leading specialty paper business in North America with total capacity of 270,000 tonnes in two Wisconsin mills, located in Stevens Point and Kimberly. The Company has realigned the specialty paper business and rationalized the asset platform to service two primary product lines as follows:
| Ÿ | The technical papers product line includes face papers, thermal transfer, direct thermal base papers, and release liners for use in self-adhesive labels. Products are sold primarily to coaters and laminators, who in turn supply converted product to customers such as label printers, small roll converters, and label/ticket/stamp manufacturers. |
| Ÿ | The packaging papers product line includes papers designed to protect, transport and identify a wide range of products. Flexible packaging papers are often used as part of a multi-layer package construction, in combination with film, foil, extruded coatings, board and other materials. Flexpack papers are used in pouch, lidding, bag, tobacco packaging, and spiral can applications. |
Other
Other operations are comprised of a Consolidated Water Power Company, a public utility, the Hotel Mead, a hotel and conference center, and the Company’s corporate support functions.
F-83
Table of Contents
STORA ENSO NORTH AMERICA
NOTES TO THE COMBINED FINANCIAL STATEMENTS—(Continued)
Reportable Segment Data
SENA does not allocate total assets internally in assessing operating performance. Net sales, operating loss, accounting policy differences, depreciation, amortization and impairment, goodwill, and net sales by geographic area as determined by SENA for its reportable segments, are shown in the following tables.
Net Sales
| Year Ended December 31, | ||||||||||||
| 2006 (Restated) | 2005 (Restated) | 2004 (Restated) | ||||||||||
| (Dollars in millions) | ||||||||||||
Coated publication paper | $ | 669 | $ | 669 | $ | 595 | ||||||
Uncoated publication paper | 307 | 507 | 451 | |||||||||
Newsprint | 6 | 99 | 93 | |||||||||
Fine paper | 918 | 807 | 685 | |||||||||
Specialty paper | 285 | 284 | 257 | |||||||||
Other | 22 | 36 | 21 | |||||||||
Eliminations | (31 | ) | (28 | ) | (26 | ) | ||||||
Net sales | $ | 2,176 | $ | 2,374 | $ | 2,076 | ||||||
Other includes sales from Hotel Mead, Consolidated Water Power Company sales to customers other than the Company, and sales of saw logs from the Company’s wood procurement function. Eliminations are for internal sales of Duluth recycled pulp within the Company.
Net sales to one customer within the coated publication paper, uncoated publication paper, newsprint, fine paper, and specialty paper segments represent approximately $231 million or approximately 10.6% of the Company’s combined net sales for 2006.
Internal Management Reporting Loss vs. External Reporting Loss
| Year Ended December 31, | ||||||||||||
| 2006 (Restated) | 2005 (Restated) | 2004 (Restated) | ||||||||||
| (Dollars in millions) | ||||||||||||
Coated publication paper | $ | 34 | $ | 15 | $ | 36 | ||||||
Uncoated publication paper | (46 | ) | 35 | (3 | ) | |||||||
Newsprint | (31 | ) | (117 | ) | (16 | ) | ||||||
Fine paper | 37 | (16 | ) | (91 | ) | |||||||
Specialty paper | (2 | ) | (155 | ) | 4 | |||||||
Other | 5 | (25 | ) | (23 | ) | |||||||
Operating loss—internal management reporting | (3 | ) | (263 | ) | (93 | ) | ||||||
Interest expense | (92 | ) | (75 | ) | (63 | ) | ||||||
Income from affiliated companies | — | — | 1 | |||||||||
Share based compensation | (4 | ) | (1 | ) | — | |||||||
Internal versus external accounting policies (see below) | (172 | ) | 64 | (586 | ) | |||||||
Loss before income taxes—external reporting | $ | (271 | ) | $ | (275 | ) | $ | (741 | ) | |||
F-84
Table of Contents
STORA ENSO NORTH AMERICA
NOTES TO THE COMBINED FINANCIAL STATEMENTS—(Continued)
Accounting Policy Differences
| Year Ended December 31, | ||||||||||||
| 2006 (Restated) | 2005 (Restated) | 2004 (Restated) | ||||||||||
| (Dollars in millions) | ||||||||||||
Impairment of goodwill—external reporting, gross fits | $ | — | $ | (162 | ) | $ | (520 | ) | ||||
Reversal of goodwill impairment—internal reporting, gross | — | 10 | — | |||||||||
Reversal of goodwill amortization—internal reporting, gross | — | — | 36 | |||||||||
Impairment of property, plant, and equipment—external reporting gross | (113 | ) | — | — | ||||||||
Reversal of property, plant, and equipment impairment—internal reporting, gross | — | 222 | — | |||||||||
Depreciation expense related to impairment reversal—internal reporting, gross | (29 | ) | (5 | ) | (6 | ) | ||||||
Restructuring costs, net | (2 | ) | (10 | ) | (5 | ) | ||||||
Postretirement benefits, net | (28 | ) | 9 | (91 | ) | |||||||
Total accounting policy differences | $ | (172 | ) | $ | 64 | $ | (586 | ) | ||||
Depreciation, Amortization and Impairment
| Year Ended December 31, | |||||||||
| 2006 (Restated) | 2005 (Restated) | 2004 (Restated) | |||||||
| (Dollars in millions) | |||||||||
Coated publication paper | $ | 62 | $ | 86 | $ | 164 | |||
Uncoated publication paper | 53 | 51 | 56 | ||||||
Newsprint | 126 | 8 | 8 | ||||||
Fine paper | 103 | 106 | 531 | ||||||
Specialty paper | 31 | 207 | 37 | ||||||
Other | 8 | 9 | 12 | ||||||
Total depreciation, amortization and impairment | $ | 383 | $ | 467 | $ | 808 | |||
Goodwill
The following table presents changes in the goodwill balances as allocated to each reportable segment for the years ended December 31, 2006 and 2005:
| Coated Publication Paper | Uncoated Publication Paper | Newsprint | Fine Paper | Specialty Paper | Total | |||||||||||||||
| (Dollars in millions) | ||||||||||||||||||||
As of January 1, 2005 | $ | — | $ | — | $ | — | $ | 280 | $ | 162 | $ | 442 | ||||||||
Impairment losses | — | — | — | — | (162 | ) | (162 | ) | ||||||||||||
As of December 31, 2005 | $ | — | $ | — | $ | — | $ | 280 | $ | — | $ | 280 | ||||||||
As of December 31, 2006 | $ | — | $ | — | $ | — | $ | 280 | $ | — | $ | 280 | ||||||||
F-85
Table of Contents
STORA ENSO NORTH AMERICA
NOTES TO THE COMBINED FINANCIAL STATEMENTS—(Continued)
Information by Geographic Area—Net Sales
| Year Ended December 31, | |||||||||
| 2006 (Restated) | 2005 (Restated) | 2004 (Restated) | |||||||
| (Dollars in millions) | |||||||||
US—paper sales | $ | 1,946 | $ | 2,080 | $ | 1,905 | |||
Canada—paper sales | 130 | 154 | 131 | ||||||
Americas, other than the US and Canada—paper sales | 20 | 32 | 23 | ||||||
Other—all other sales | 80 | 108 | 17 | ||||||
Net sales | $ | 2,176 | $ | 2,374 | $ | 2,076 | |||
Note 4—Income Taxes
Income Tax Provision
The components of income (loss) before income taxes and the significant components of the income tax provision (benefit) are as follows:
| Year Ended December 31, | ||||||||||||
| 2006 (Restated) | 2005 (Restated) | 2004 (Restated) | ||||||||||
| (Dollars in millions) | ||||||||||||
Loss before income taxes: | ||||||||||||
US | $ | (68 | ) | $ | (167 | ) | $ | (720 | ) | |||
Non-US | (203 | ) | (108 | ) | (21 | ) | ||||||
Loss before income taxes | $ | (271 | ) | $ | (275 | ) | $ | (741 | ) | |||
Current tax provision: | ||||||||||||
US-Federal | $ | 2 | $ | 1 | $ | — | ||||||
US-State | 1 | 1 | 1 | |||||||||
Non-US | — | 51 | 7 | |||||||||
Total current tax provision | 3 | 53 | 8 | |||||||||
Deferred tax provision (benefit): | ||||||||||||
US-Federal | (28 | ) | (42 | ) | (82 | ) | ||||||
US-State | (4 | ) | (3 | ) | (10 | ) | ||||||
Non-US | 1 | (1 | ) | — | ||||||||
Total deferred tax benefit | (31 | ) | (46 | ) | (92 | ) | ||||||
Income tax provision (benefit) | $ | (28 | ) | $ | 7 | $ | (84 | ) | ||||
F-86
Table of Contents
STORA ENSO NORTH AMERICA
NOTES TO THE COMBINED FINANCIAL STATEMENTS—(Continued)
Effective Tax Rate
The federal statutory income tax rate is reconciled to the Company’s effective tax rate for the years ended December 31, 2006, 2005 and 2004 as follows:
| Year Ended December 31, | |||||||||
| 2006 (Restated) | 2005 (Restated) | 2004 (Restated) | |||||||
Federal income tax statutory rate | 35.0 | % | 35.0 | % | 35.0 | % | |||
State income provision | 1.1 | 1.0 | 1.2 | ||||||
Non-deductible book goodwill | 0.4 | (24.3 | ) | (24.4 | ) | ||||
Non-deductible business expenses | (0.4 | ) | (0.1 | ) | — | ||||
Valuation allowance | (21.3 | ) | (11.7 | ) | (1.6 | ) | |||
Change in enacted tax rates | (5.4 | ) | — | — | |||||
Taxes on foreign income which differ from the US statutory rate | 2.3 | 2.6 | 0.1 | ||||||
Other items | (1.4 | ) | (5.0 | ) | 1.1 | ||||
Effective tax rate | 10.3 | % | (2.5 | )% | 11.4 | % | |||
Deferred Income Taxes
The deferred income tax accounts reflect the impact of temporary differences between the basis of assets and liabilities for financial reporting purposes and their related basis as measured by income tax regulations. A summary of the deferred income tax accounts at December 31 is as follows:
| As of December 31, | ||||||||
| 2006 (Restated) | 2005 (Restated) | |||||||
| (Dollars in millions) | ||||||||
Deferred tax assets: | ||||||||
Inventories | $ | 6 | $ | 5 | ||||
Postretirement benefits | 176 | 62 | ||||||
Deferred employee benefits | 13 | 11 | ||||||
Tax credits | 36 | 32 | ||||||
Net operating loss carryforwards | 272 | 267 | ||||||
Deferred revenue | 24 | 44 | ||||||
Employee-related benefits and allowances | 10 | 9 | ||||||
Other reserves and allowances | 6 | 7 | ||||||
Total deferred tax assets | 543 | 437 | ||||||
Less valuation allowance | (212 | ) | (125 | ) | ||||
Net deferred tax assets | $ | 331 | $ | 312 | ||||
Deferred tax (liabilities): | ||||||||
Property, plant and equipment | $ | (415 | ) | $ | (497 | ) | ||
Intangible assets | (1 | ) | (1 | ) | ||||
Other | (2 | ) | — | |||||
Total deferred tax (liabilities) | $ | (418 | ) | $ | (498 | ) | ||
Current deferred tax assets | $ | 32 | $ | 31 | ||||
Non-current deferred tax liabilities | (119 | ) | (217 | ) | ||||
Net deferred tax liabilities | $ | (87 | ) | $ | (186 | ) | ||
F-87
Table of Contents
STORA ENSO NORTH AMERICA
NOTES TO THE COMBINED FINANCIAL STATEMENTS—(Continued)
Carryforwards
As of December 31, 2006, the Company had the following US tax carryforwards which expire at various times during the years indicated:
| Amount | Expiration | ||||
| (Dollars in millions) | |||||
Federal net operating loss | $ | 599 | 2021 - 2024 | ||
State net operating loss | 858 | 2009 - 2019 | |||
Federal credits | 9 | None | |||
State credits | 27 | Through 2023 | |||
As of December 31, 2006, the Company had foreign net operating loss carryforwards of $118 that expire during the years 2010 and 2013.
Note 5—Inventories
Inventories at December 31, 2006 and 2005 are comprised of:
| As of December 31, | ||||||||
| 2006 | 2005 | |||||||
| (Dollars in millions) | ||||||||
Materials, supplies and work in progress | $ | 75 | $ | 73 | ||||
Finished goods | 189 | 195 | ||||||
Spare parts and consumables | 89 | 88 | ||||||
Obsolescence provision—spare parts | (3 | ) | (3 | ) | ||||
Obsolescence provision—finished goods | (4 | ) | (4 | ) | ||||
Total | $ | 346 | $ | 349 | ||||
Note 6—Property, Plant and Equipment
Property, plant and equipment at December 31, 2006 and 2005 are comprised of:
| As of December 31, | ||||||||
| 2006 (Restated) | 2005 (Restated) | |||||||
| (Dollars in millions) | ||||||||
Plant and equipment | $ | 3,959 | $ | 4,007 | ||||
Buildings and structures | 317 | 313 | ||||||
Land | 24 | 24 | ||||||
Other tangible assets | 16 | 4 | ||||||
Assets in progress | 40 | 56 | ||||||
Gross cost | 4,356 | 4,404 | ||||||
Less: accumulated depreciation and capital lease amortization | (1,877 | ) | (1,612 | ) | ||||
Property, plant and equipment, net | $ | 2,479 | $ | 2,792 | ||||
Depreciation expense related to property, plant and equipment was $259 million, $293 million and $278 million in 2006, 2005 and 2004, respectively. Depreciation expense includes losses on the sale of property, plant and equipment of $3 million, $13 million and $17 million in 2006, 2005 and 2004,
F-88
Table of Contents
STORA ENSO NORTH AMERICA
NOTES TO THE COMBINED FINANCIAL STATEMENTS—(Continued)
respectively. Capital lease amortization expense was $7 million for 2006, 2005 and 2007 respectively. See Note 18 for information related to the capital lease. Because of deteriorating market conditions and increasing costs, the fixed assets of the Newsprint segment were tested for impairment in 2006, which resulted in an impairment charge of $113 million.
Note 7—Goodwill and Other Intangible Assets
Goodwill and other intangible assets at December 31, 2006 and 2005, are comprised of:
| As of December 31, | ||||||||
| 2006 | 2005 | |||||||
| (Dollars in millions) | ||||||||
Goodwill | $ | 280 | $ | 280 | ||||
Other intangible assets: | ||||||||
Gross cost | $ | 43 | $ | 44 | ||||
Less: accumulated amortization | (32 | ) | (31 | ) | ||||
Other intangible assets, net | $ | 11 | $ | 13 | ||||
Goodwill of $2,128 million was recognized upon the acquisition of Consolidated Papers, Inc. by Stora Enso Oyj in August of 2000. Goodwill amortization in the amount of $144 million was recognized prior to the adoption of SFAS No. 142, “Goodwill and Other Intangible Assets,” (“SFAS 142”) and since then has been tested for impairment on an annual basis. A total of $1,704 million of impairment losses have been recorded of which $1,022 million was recorded prior to 2004, $520 million was recorded in 2004 and $162 million was recorded in 2005 due to deterioration in market conditions and increased costs associated with the business.
The other intangible assets consist of computer software both internally developed and purchased, along with certain patents, trademarks and franchises. As of December 31, 2006, computer software had a net book value of $3 million while patents, trademarks and franchises had a net book value of $8 million. As of December 31, 2005, computer software had a net book value of $5 million while patents, trademarks and franchises had a net book value of $9 million. Amortization expense related to other intangible assets was $4 million, $5 million and $3 million in 2006, 2005 and 2004, respectively. Future amortization related to the net book value of other intangible assets is estimated to be $2 million in 2007, $2 million in 2008, $1 million in 2009, $1 million in 2010, $1 million in 2011 and $4 million in 2012 and beyond.
Note 8—Other Non-current Assets
| As of December 31, | ||||||
| 2006 | 2005 | |||||
| (Dollars in millions) | ||||||
Pension asset (Note 11) | $ | 17 | $ | 257 | ||
Other | 4 | 10 | ||||
Total | $ | 21 | $ | 267 | ||
F-89
Table of Contents
STORA ENSO NORTH AMERICA
NOTES TO THE COMBINED FINANCIAL STATEMENTS—(Continued)
Note 9—Debt
Borrowings have various maturities, the latest being in 2023, and have either fixed or floating interest rates ranging from 5.61% to 7.30% in 2006, and 4.72% to 7.30% in 2005. The Company’s loans are denominated in US dollars.
Debt as of December 31 of Each Year
| Repayable within 12 Months | Repayable after 12 Months | ||||||||||||||
| 2006 | 2005 | 2006 (Restated) | 2005 (Restated) | ||||||||||||
| (Dollars in millions) | |||||||||||||||
Bond loans | $ | 104 | $ | — | $ | 255 | $ | 358 | |||||||
Bond loan discounts | (1 | ) | — | (10 | ) | (13 | ) | ||||||||
Loans from Stora Enso Group companies (related parties) | — | — | 1,069 | 1,067 | |||||||||||
Capital lease obligation | — | — | 132 | 130 | |||||||||||
Total debt | $ | 103 | $ | — | $ | 1,446 | $ | 1,542 | |||||||
Loans from Stora Enso Group companies (related parties) include $1,060 million of LIBOR based floating rate debt from Stora Enso S.à.r.L, a subsidiary of Stora Enso Oyj. While the debt matures on August 13, 2007, Stora Enso S.à.r.L has committed to extend or amend the $1,060 million debt to mature on August 13, 2008 or beyond. Interest rates on this debt were 5.975% and 4.81% at December 31, 2006 and 2005, respectively. The capital lease liabilities relate to a lease of paper machine 35, situated in the Stevens Point mill. See Note 18 for information related to the capital lease.
Maturity Schedule of Debt at December 31, 2006
| 2007 | 2008 | 2009 | 2010 | 2011 | 2012+ (Restated) | Total (Restated) | ||||||||||||||||||||||
| (Dollars in millions) | ||||||||||||||||||||||||||||
Bond loans | $ | 104 | $ | — | $ | 79 | $ | — | $ | — | $ | 176 | $ | 359 | ||||||||||||||
Bond loan discounts | (1 | ) | (1 | ) | (1 | ) | (1 | ) | (1 | ) | (6 | ) | (11 | ) | ||||||||||||||
Loans from Stora Enso Group companies (related parties) | — | 1,060 | — | — | — | 9 | 1,069 | |||||||||||||||||||||
Capital lease liabilities | — | — | — | — | — | 132 | 132 | |||||||||||||||||||||
Total debt | $ | 103 | $ | 1,059 | $ | 78 | $ | (1 | ) | $ | (1 | ) | $ | 311 | 1,549 | |||||||||||||
Current liabilities: repayable within the next 12 months |
| 103 | ||||||||||||||||||||||||||
Non-current liabilities: repayable after 12 months |
| $ | 1,446 | |||||||||||||||||||||||||
The fair value of non-current liabilities, exclusive of the current portion, has a value of $1,494 million at December 31, 2006 and $1,615 million at December 31, 2005 versus a carrying value of $1,446 million at December 31, 2006 and $1,542 at December 31, 2005. Due to the short-term nature of the current debt and the current portion of the long-term debt, the carrying amounts are considered to be reasonable approximations of the fair values.
F-90
Table of Contents
STORA ENSO NORTH AMERICA
NOTES TO THE COMBINED FINANCIAL STATEMENTS—(Continued)
Bond Loans in Long- term Debt
Bond loans are unsecured and are guaranteed by Stora Enso Oyj.
Issue / Maturity Dates | Description of Bond | Fixed Interest Rate % | Nominal Value Issued 2006 | Carrying Value | ||||||||||
| 2006 | 2005 | |||||||||||||
| (Dollars in millions) | ||||||||||||||
1997-2007 | Senior Notes Series B 2007 | 6.82 | % | $ | 102 | $ | 103 | $ | 103 | |||||
1997-2009 | Senior Notes Series C 2009 | 6.90 | % | 48 | 48 | 48 | ||||||||
1997-2012 | Senior Notes Series D 2012 | 7.00 | % | 23 | 23 | 22 | ||||||||
1997-2017 | Senior Notes Series E 2017 | 7.14 | % | 23 | 22 | 22 | ||||||||
1998-2009 | Senior Notes Series F 2009 | 6.93 | % | 30 | 30 | 29 | ||||||||
1998-2018 | Senior Notes Series G 2018 | 7.24 | % | 65 | 62 | 61 | ||||||||
1998-2023 | Senior Notes Series H 2023 | 7.30 | % | 65 | 60 | 60 | ||||||||
Total bond loans | $ | 348 | $ | 345 | ||||||||||
Note 10—Financial Instruments
Fair Values of Financial Instruments
Derivative financial instruments are recorded on the Combined Balance Sheets at their fair values, defined as the amount at which the instrument could be exchanged between willing parties in a current transaction, other than in a liquidation or forced sale. The counterparty in all derivative transactions is Stora Enso Oyj. The fair values of such financial items are estimated on the following basis:
| Ÿ | Currency option contract values are calculated using year-end market rates together with common option pricing models, the fair values being implicit in the resulting carrying amounts. |
| Ÿ | The carrying amounts of foreign exchange forward contracts are calculated using year-end market rates and thus they approximate fair values. |
| Ÿ | The fair values of interest rate swaps are calculated using a discounted cash flow analysis. |
| Ÿ | Commodity contract fair values are computed with reference to quoted market prices on future exchanges and thus the carrying amounts approximate fair values. |
Fair value gains and losses on financial instruments are deferred, net of tax in AOCI, if they fulfill the cash flow hedge accounting criteria. The remaining fair value movements are reported in the Combined Statements of Operations as other (income) expense as shown below. The Company had no outstanding embedded derivatives at December 31, 2006, 2005 or 2004.
Fair Value Hedge Gains and Losses
| As of December 31, | ||||||||||||
| 2006 | 2005 | 2004 | ||||||||||
| (Dollars in millions) | ||||||||||||
Net (gain)/loss on qualifying hedges | $ | (2 | ) | $ | (8 | ) | $ | (8 | ) | |||
Fair value changes (gain)/loss in hedged items | 2 | 8 | 8 | |||||||||
Net (gain)/loss | — | — | — | |||||||||
Net (gain)/loss on non-qualifying hedges | (1 | ) | (1 | ) | (1 | ) | ||||||
Net fair value (gain)/loss | $ | (1 | ) | $ | (1 | ) | $ | (1 | ) | |||
F-91
Table of Contents
STORA ENSO NORTH AMERICA
NOTES TO THE COMBINED FINANCIAL STATEMENTS—(Continued)
Certain derivatives are designated as cash flow hedges and measured at fair value with the fair value movements recorded in the separate owner’s investment category of AOCI. As of December 31, 2006, the Company did not have any open cash flow hedging derivatives. As of December 31, 2005, the hedging reserve was less than $1 million. The gain on derivative financial instruments designated as cash flow hedges that was realized from AOCI through the Combined Statements of Operations amounted to $1 million in 2006, $3 million in 2005 and $3 million in 2004.
Fair Values of Derivative Financial Instruments
| As of December 31, | |||||||||||||
| 2006 | 2005 | ||||||||||||
| Positive Fair Values | Negative Fair Values | Net Fair Values | Net Fair Values | ||||||||||
| (Dollars in millions) | |||||||||||||
Interest rate swaps | $ | 3 | $ | (1 | ) | $ | 2 | $ | 5 | ||||
Forward contracts | — | — | — | 1 | |||||||||
Currency options | — | — | — | — | |||||||||
Commodity contracts | — | — | — | — | |||||||||
Total | $ | 3 | $ | (1 | ) | $ | 2 | $ | 6 | ||||
Positive and negative fair values of financial instruments are shown under other current and non-current assets and current and long-term debt.
Notional Values of Derivative Financial Instruments
| As of December 31, | ||||||
| 2006 | 2005 | |||||
| (Dollars in millions) | ||||||
Interest rate derivatives: | ||||||
Interest rate swaps: | ||||||
Maturity under 1 year | $ | 102 | $ | — | ||
Maturity 2-5 years | 79 | 181 | ||||
Maturity 6-10 years | 52 | 52 | ||||
Total interest rate derivatives | $ | 233 | $ | 233 | ||
Foreign exchange derivatives: | ||||||
Forward contracts | $ | — | $ | 18 | ||
Currency options | — | 60 | ||||
Total foreign exchange derivatives | $ | — | $ | 78 | ||
Commodity derivatives | $ | — | $ | 4 | ||
F-92
Table of Contents
STORA ENSO NORTH AMERICA
NOTES TO THE COMBINED FINANCIAL STATEMENTS—(Continued)
Note 11—Pension and Other Postretirement Benefits
The Company adopted SFAS 158 as of December 31, 2006. Prior to the adoption of SFAS 158, US GAAP required recognition of an additional minimum pension liability when the accumulated benefit obligation exceeded the fair value of the plan assets and this amount was greater than the liability recognized on the Combined Balance Sheets. An intangible asset was recognized up to the amount of unrecognized prior service cost with the excess recognized in OCI. During 2006, the additional minimum liability, net of intangible asset, decreased from $139 million to $16 million at December 31, 2006, with the change of $123 million being credited to OCI. Following the adoption of SFAS 158, the recognition of an additional minimum liability net of intangible asset is no longer required; therefore, $16 million has been reversed. The Company uses a December 31 measurement date for all of its plans.
This new standard has been applied prospectively; therefore, the amounts recognized and disclosed for 2005 have not been restated to comply with SFAS 158.
The following table sets forth the incremental effect of applying SFAS 158 on individual line items in the year-end Combined Balance Sheets as of December 31, 2006.
| Before Application of SFAS 158 (Restated) | Adjustments | After Application of SFAS 158 (Restated) | ||||||||||
| (Dollars in millions) | ||||||||||||
Pension and other postretirement benefit asset | $ | 234 | $ | (217 | ) | $ | 17 | |||||
Total assets | 3,738 | (217 | ) | 3,521 | ||||||||
Liability for pension and other postretirement benefits—current | (11 | ) | (5 | ) | (16 | ) | ||||||
Liability for pension and other postretirement benefits—non-current | (313 | ) | (155 | ) | (468 | ) | ||||||
Deferred tax liability (Restated) | (236 | ) | 117 | (119 | ) | |||||||
Total liabilities (Restated) | (2,461 | ) | (43 | ) | (2,504 | ) | ||||||
Accumulated other comprehensive income, net of taxes (Restated) | (61 | ) | 260 | 199 | ||||||||
Total owner’s investment (Restated) | (1,277 | ) | 260 | (1,017 | ) | |||||||
F-93
Table of Contents
STORA ENSO NORTH AMERICA
NOTES TO THE COMBINED FINANCIAL STATEMENTS—(Continued)
The following table sets forth the changes in the benefit obligation and fair value of plan assets during the year and the funded status of the Company’s defined benefit pension and other postretirement benefit plans showing the amounts recognized in the Company’s Combined Balance Sheets in accordance with US GAAP as of December 31, 2006 and 2005.
| As of December 31, | ||||||||||||||||||||||||||||||||
| 2006 | 2005 | |||||||||||||||||||||||||||||||
| Pension | Other benefits | Pension | Other benefits | |||||||||||||||||||||||||||||
| US | Canada | US | Canada | US | Canada | US | Canada | |||||||||||||||||||||||||
| (Dollars in millions) | ||||||||||||||||||||||||||||||||
Change in Benefit Obligation: | ||||||||||||||||||||||||||||||||
Benefit obligation at beginning of year | $ | 820 | $ | 258 | $ | 405 | $ | 23 | $ | 779 | $ | 222 | $ | 427 | $ | 19 | ||||||||||||||||
Service cost | 17 | 2 | 9 | — | 16 | 3 | 9 | — | ||||||||||||||||||||||||
Interest cost | 46 | 14 | 23 | 1 | 44 | 13 | 22 | 1 | ||||||||||||||||||||||||
Plan participants’ contributions | — | 1 | 2 | — | — | 2 | 2 | — | ||||||||||||||||||||||||
Amendments | (1 | ) | 10 | (10 | ) | — | — | — | (29 | ) | — | |||||||||||||||||||||
Actuarial loss (gain) | (6 | ) | 5 | 13 | 6 | 26 | 21 | 3 | 4 | |||||||||||||||||||||||
Benefits paid | (45 | ) | (13 | ) | (27 | ) | (2 | ) | (45 | ) | (12 | ) | (29 | ) | (2 | ) | ||||||||||||||||
Curtailments | — | 14 | — | — | — | — | — | — | ||||||||||||||||||||||||
Currency effect | — | — | — | — | — | 9 | — | 1 | ||||||||||||||||||||||||
Benefit obligation at the end of year | $ | 831 | $ | 291 | $ | 415 | $ | 28 | $ | 820 | $ | 258 | $ | 405 | $ | 23 | ||||||||||||||||
Change in Plan Assets: | ||||||||||||||||||||||||||||||||
Fair value of plan assets at beginning of year | $ | 759 | $ | 242 | $ | 34 | $ | — | $ | 731 | $ | 209 | $ | 48 | $ | — | ||||||||||||||||
Actual return on plan assets | 99 | 28 | 2 | — | 71 | 23 | 1 | — | ||||||||||||||||||||||||
Company contribution | 1 | 4 | 12 | 2 | 1 | 11 | 12 | 2 | ||||||||||||||||||||||||
Plan participants’ contributions | — | 1 | 3 | — | — | 2 | 2 | — | ||||||||||||||||||||||||
Benefits paid | (45 | ) | (13 | ) | (28 | ) | (2 | ) | (44 | ) | (12 | ) | (29 | ) | (2 | ) | ||||||||||||||||
Currency effect | — | — | — | — | — | 9 | — | — | ||||||||||||||||||||||||
Fair value of plan assets at the end of year | $ | 814 | $ | 262 | $ | 23 | $ | — | $ | 759 | $ | 242 | $ | 34 | $ | — | ||||||||||||||||
Funded status at the end of year | $ | (17 | ) | $ | (29 | ) | $ | (393 | ) | $ | (28 | ) | $ | (62 | ) | $ | (16 | ) | $ | (370 | ) | $ | (23 | ) | ||||||||
Unrecognized prior service cost | (1 | ) | 19 | (120 | ) | — | (1 | ) | 11 | (128 | ) | — | ||||||||||||||||||||
Unrecognized actuarial loss | 207 | 39 | 237 | 12 | 267 | 46 | 241 | 9 | ||||||||||||||||||||||||
(Accrued)/Prepaid benefit cost | 189 | 29 | (276 | ) | (16 | ) | 204 | 41 | (257 | ) | (14 | ) | ||||||||||||||||||||
Additional minimum liability | — | (16 | ) | — | — | (138 | ) | — | — | — | ||||||||||||||||||||||
Net amount recognized before adoption of FAS 158 | $ | 189 | $ | 13 | $ | (276 | ) | $ | (16 | ) | $ | 66 | $ | 41 | $ | (257 | ) | $ | (14 | ) | ||||||||||||
Adoption of FAS 158 | (206 | ) | (42 | ) | (116 | ) | (12 | ) | ||||||||||||||||||||||||
Net amount recognized after adoption of FAS 158 | $ | (17 | ) | $ | (29 | ) | $ | (392 | ) | $ | (28 | ) | ||||||||||||||||||||
F-94
Table of Contents
STORA ENSO NORTH AMERICA
NOTES TO THE COMBINED FINANCIAL STATEMENTS—(Continued)
The following table presents the amount in AOCI that has not been recognized as components of net periodic pension cost as of December 31, 2006, subsequent to the adoption of SFAS 158:
| As of December 31, 2006 | ||||||||||||||
| Pensions | Other Benefits | |||||||||||||
| US | Canada | US | Canada | |||||||||||
| (Dollars in millions) | ||||||||||||||
Unrecognized prior service cost (credit) | $ | (1 | ) | $ | 19 | $ | (120 | ) | $ | — | ||||
Unrecognized actuarial loss | 207 | 39 | 237 | 12 | ||||||||||
Deferred taxes | (78 | ) | — | (45 | ) | — | ||||||||
Total accumulated other comprehensive income, net of taxes | $ | 128 | $ | 58 | $ | 72 | $ | 12 | ||||||
The estimated net actuarial loss and prior service (credit) for the defined benefit pension plans of the US that will be amortized from AOCI into net periodic benefit cost over the next fiscal year are $11 million and less than $1 million, respectively. The estimated net actuarial loss and prior service cost for the Canadian defined benefit pension plans that will be amortized from AOCI into net periodic benefit cost over the next fiscal year are $1 million and $2 million, respectively. The estimated net actuarial loss and prior service (credit) for other postretirement benefit plans that will be amortized from AOCI into net periodic benefit cost over the next fiscal year are $16 million and ($18) million, respectively.
The following table sets forth assets and liabilities recognized in the Combined Balance Sheets as of December 31, 2006, subsequent to the adoption of SFAS 158:
| As of December 31, 2006 | ||||||||||||||||
| Pensions | Other Benefits | |||||||||||||||
| US | Canada | US | Canada | |||||||||||||
| (Dollars in millions) | ||||||||||||||||
Non-current assets | $ | 16 | $ | 1 | $ | — | $ | — | ||||||||
Current liabilities | (1 | ) | — | (12 | ) | (2 | ) | |||||||||
Non-current liabilities | (33 | ) | (29 | ) | (380 | ) | (26 | ) | ||||||||
| $ | (18 | ) | $ | (28 | ) | $ | (392 | ) | $ | (28 | ) | |||||
Total accumulated benefit obligation (“ABO”) in 2006 was $761 million for all plans in the US and $277 million for all plans in Canada.
The following table sets forth assets and liabilities recognized in the Combined Balance Sheets as of December 31, 2005:
| As of December 31, 2005 | ||||||||||||||||
| Pensions | Other Benefits | |||||||||||||||
| US | Canada | US | Canada | |||||||||||||
| (Dollars in millions) | ||||||||||||||||
Accrued benefit liability | $ | (12 | ) | $ | — | $ | (257 | ) | $ | (14 | ) | |||||
Additional minimum liability | (141 | ) | (1 | ) | — | — | ||||||||||
Intangible asset | 2 | 1 | — | — | ||||||||||||
Prepaid benefit cost | 216 | 41 | — | — | ||||||||||||
Accumulated other comprehensive income | 139 | — | — | — | ||||||||||||
| $ | 204 | $ | 41 | $ | (257 | ) | $ | (14 | ) | |||||||
F-95
Table of Contents
STORA ENSO NORTH AMERICA
NOTES TO THE COMBINED FINANCIAL STATEMENTS—(Continued)
For plans where accumulated benefit obligation (“ABO”) exceed the fair value of plan assets under US GAAP, the ABO, the pension benefit obligation (“PBO”) and fair value of plan assets as of December 31, 2006 and 2005 were as follows:
| Pension and Other Postretirement Benefits as of December 31, | ||||||||||||
| 2006 | 2005 | |||||||||||
| US | Canada | US | Canada | |||||||||
| (Dollars in millions) | ||||||||||||
ABO | $ | 11 | $ | 180 | $ | 425 | $ | 6 | ||||
PBO | 11 | 191 | 464 | 6 | ||||||||
Fair value of assets | — | 161 | 407 | — | ||||||||
For plans where the PBO exceeds the fair value of plan assets under US GAAP, the ABO, the PBO and fair value of plan assets as of December 31, 2006 and 2005 were as follows:
| Pension and Other Postretirement Benefits as of December 31, | ||||||||||||
| 2006 | 2005 | |||||||||||
| US | Canada | US | Canada | |||||||||
| (Dollars in millions) | ||||||||||||
ABO | $ | 436 | $ | 180 | $ | 746 | $ | 219 | ||||
PBO | 473 | 191 | 820 | 234 | ||||||||
Fair value of assets | 439 | 161 | 759 | 216 | ||||||||
Net periodic benefit cost of defined benefit pension benefits recognized in accordance with US GAAP for the years ended December 31, 2006, 2005 and 2004 included the following components:
| Pension Benefits for the year ended December 31, | ||||||||||||||||||||||||
| 2006 | 2005 | 2004 | ||||||||||||||||||||||
| US | Canada | US | Canada | US | Canada | |||||||||||||||||||
| (Dollars in millions) | ||||||||||||||||||||||||
Service cost | $ | 17 | $ | 2 | $ | 16 | $ | 3 | $ | 16 | $ | 2 | ||||||||||||
Interest cost | 46 | 14 | 44 | 13 | 44 | 12 | ||||||||||||||||||
Expected return on plan assets | (60 | ) | (17 | ) | (58 | ) | (16 | ) | (56 | ) | (13 | ) | ||||||||||||
Recognized net actuarial (gains) losses | 14 | 2 | 14 | 1 | 16 | 1 | ||||||||||||||||||
Amortization of prior service cost (credit) | — | 1 | — | 1 | — | 1 | ||||||||||||||||||
Subtotal | 17 | 2 | 16 | 2 | 20 | 3 | ||||||||||||||||||
Curtailment | — | 14 | — | — | — | — | ||||||||||||||||||
Net periodic benefit cost | $ | 17 | $ | 16 | $ | 16 | $ | 2 | $ | 20 | $ | 3 | ||||||||||||
F-96
Table of Contents
STORA ENSO NORTH AMERICA
NOTES TO THE COMBINED FINANCIAL STATEMENTS—(Continued)
Net periodic benefit cost of other postretirement benefits recognized in accordance with US GAAP for the years ended December 31, 2006, 2005 and 2004 included the following components:
| Other Postretirement Benefits for the Year Ended December 31, | |||||||||||||||||||||
| 2006 | 2005 | 2004 | |||||||||||||||||||
| US | Canada | US | Canada | US | Canada | ||||||||||||||||
| (Dollars in millions) | |||||||||||||||||||||
Service cost | $ | 9 | $ | — | $ | 9 | $ | — | $ | 10 | $ | — | |||||||||
Interest cost | 23 | 1 | 22 | 1 | 29 | 1 | |||||||||||||||
Expected return on plan assets | (1 | ) | — | (2 | ) | — | (3 | ) | — | ||||||||||||
Recognized net actuarial (gains) losses | 16 | 3 | 12 | 1 | 14 | 1 | |||||||||||||||
Amortization of past service cost (credit) | (17 | ) | 1 | (14 | ) | — | (4 | ) | — | ||||||||||||
Net periodic benefit cost | $ | 30 | $ | 5 | $ | 27 | $ | 2 | $ | 46 | $ | 2 | |||||||||
Canada
As of December 31, 2006 and 2005, the Company’s Canadian defined benefit pension plans have total defined benefit obligations of $291 million and $258 million, respectively and combined assets of $262 million and $242 million, respectively, representing net unfunded liabilities of $29 million and $16 million, respectively. In Canada, pension benefits are provided through employer and employee funded defined benefit plans. Independent actuaries determine the employer contributions necessary to meet future obligations of the plans, whereas employee contributions are a fixed percentage of pensionable earnings. Funds are invested in a mix of fixed income and equity investments and are held by an independent trustee. The retirement benefits are a function of years worked and the best five years average salary during an employee’s pensionable service.
The investment policy sets the long-term return target for the funds at a real return of 4 percent and defines the long-term strategic allocation targets for equities at 20% to 60%, bonds, 10% to 60% and liquid investments, 0% to 25%. The chosen investment managers are at liberty to adjust the asset mix for their portion of the funds in accordance with the minimum and maximum levels for each asset class.
As of December 31, 2006 and 2005, the Company’s Canadian other postretirement benefit plans have total defined benefit obligations of $28 million and $23 million, respectively. These other postretirement benefit obligations are unfunded, are not required to be funded, and generally provide healthcare, life insurance and disability benefits to certain retirees.
United States
As of December 31, 2006 and 2005, the Company’s US defined benefit pension plans have total defined benefit obligations of $831 million and $820 million, respectively and combined assets of $814 million and $759 million, respectively, representing net unfunded liabilities of $18 million and $62 million, respectively. Of these unfunded liabilities, $11 million and $12 million, respectively, represents defined benefit obligations of a non-qualified defined benefit pension plan which is not required to be funded.
In the US, retirement benefits are provided through employer funded defined benefit plans and through employer and employee funded defined contribution plans, also known as 401(k) plans. For
F-97
Table of Contents
STORA ENSO NORTH AMERICA
NOTES TO THE COMBINED FINANCIAL STATEMENTS—(Continued)
the defined benefit plans, independent actuaries determine the employer contributions necessary to meet the future obligations of the plans and the funds are invested in a diversified mix of fixed income, equity and alternative investments held by independent trustees. The retirement benefits are a function of either years worked multiplied by a flat monetary benefit, or of years worked multiplied by the best five years average salary out of the last ten years, during an employee’s pensionable service. For the defined contribution plans, employees may elect to contribute a percentage of their salary on a pre-tax basis, subject to regulatory limitations, into an account with an independent trustee which can then be invested in a variety of investment options at the employee’s discretion. The employer may also contribute to the employee’s account depending upon the requirements of the plan.
As of December 31, 2006 and 2005, the Company’s US other postretirement benefit plans have total defined benefit obligations of $415 million and $405 million, respectively and combined assets of $23 million and $34 million, respectively, representing net unfunded liabilities of $393 million and $370 million, respectively. These other postretirement benefit obligations generally provide healthcare, and in certain cases life insurance, to certain retirees.
Healthcare benefits are provided to certain retirees through employer and employee funded post-employment plans, though these plans are not required to be pre-funded. Although these are largely pay-as-you -go plans, independent actuaries determine the expense to be charged in the Combined Statements of Operations to meet the plan obligations. When pre-funding does occur, funds are invested in a diversified mix of investments held by an independent trustee. Eligibility for benefits is generally a function of the number of years worked and attained age at retirement.
For US plans, the Company has been implementing a policy whereby Company contributions toward the annual healthcare premium equivalent for retirees are limited to a specific monetary value or percentage, in which instance the remainder of the premium equivalent is the responsibility of the retiree. Prior to 2003, a retiree would generally pay either a stated amount of premium, that did not change as time went on, or pay a stated percentage of the premium. The Company was then obliged to absorb almost all inflationary increases in US healthcare costs.
At the beginning of 2003, a limit was placed on the amount the Company would contribute toward retiree healthcare premium equivalents for future non-union retirees, the basic effect being that the Company would no longer be 100% responsible for all future increases in healthcare costs for this group of future retirees. In 2004, limits were placed on the amount the Company would contribute toward retiree healthcare premium equivalents for a large portion of the participants who were already retired and in addition, Company contribution limits were negotiated with Niagara Mill union future retirees. In 2005, Company contribution limits were negotiated for Kimberly Mill union future retirees and in addition no Company contributions would be available for any new hires in the Kimberly Mill union or any US non-union new hires. In 2006, negotiations with Central Wisconsin OPEIU members resulted in Company contribution limits toward pre-65 retiree healthcare premium equivalents for future retirees, no Company contribution toward post-65 retiree healthcare premium equivalents for future retirees, and no Company contribution for any retiree healthcare for OPEIU new hires. Throughout 2006, negotiations continued with the remaining active Company union members not already subject to limitations on Company contributions toward retiree healthcare premium equivalents.
Plan assets in the US are held in trusts with investment policies providing a framework within which to manage the assets in each trust. It is the primary objective of these policies to invest the trust assets in a manner that ensures sufficient funds will be available to meet the benefit obligations of the trusts as determined in connection with periodic asset-liability studies commissioned by the Investment
F-98
Table of Contents
STORA ENSO NORTH AMERICA
NOTES TO THE COMBINED FINANCIAL STATEMENTS—(Continued)
Committee. As updated at the end of 2005, the pension investment policy provides for long-term strategic allocation targets as follows: US equity 28%, non-U.S. equity 17% (including developed and emerging markets), fixed income 35% (including core, TIPS and high yield), real estate 10% and alternative investments 10%. In addition, the policy also provides for appropriate drift ranges for each asset class and rebalancing back to the allocation target when the range is exceeded. The policy has additional requirements to ensure adequate diversification, limit non-investment grade quality fixed income securities and restrict the use of derivatives. The investment policy for other postretirement benefits is similar but also takes into consideration the fact that retiree healthcare obligations are not required to be funded and have varying cash flow needs.
SENA’s defined benefit pension plan assets percentage of fair value by asset category at December 31, 2006 and 2005 are as follows:
| 2006 | 2005 | |||||||||||
| US | Canada | US | Canada | |||||||||
Cash and cash equivalents | — | % | 4 | % | — | % | 4 | % | ||||
Equity securities | 55 | 58 | 63 | 57 | ||||||||
Debt securities | 32 | 38 | 27 | 39 | ||||||||
Real estate | 6 | — | 5 | — | ||||||||
Other, including alternative investments | 7 | — | 5 | — | ||||||||
Total | 100 | % | 100 | % | 100 | % | 100 | % | ||||
The plans have an expected long-term rate of return on plan assets assumption of 8.0% for the US plans and 7.0% for the Canadian plans. These rates were derived based on the assumptions for each asset class under the respective trust’s investment policy. The capital market assumptions reflect a combination of historical performance analysis and the forward-looking return expectations of the financial markets.
Weighted-average assumptions used in the calculation of postretirement benefit obligations as of December 31 are as follows:
| Postretirement Benefits as of December 31, | ||||||||||||
| 2006 | 2005 | |||||||||||
| US | Canada | US | Canada | |||||||||
Discount rate | 5.75 | % | 5.25 | % | 5.75 | % | 5.25 | % | ||||
Rate of compensation increase | 4.50 | 2.04 | 4.50 | 2.00 | ||||||||
Weighted-average assumptions used in the calculation of net periodic cost for the years ended December 31 are as follows:
| Postretirement Benefits as of December 31, | ||||||||||||
| 2006 | 2005 | |||||||||||
| US | Canada | US | Canada | |||||||||
Discount rate | 5.75 | % | 5.25 | % | 5.75 | % | 6.00 | % | ||||
Rate of compensation increase | 4.50 | 2.00 | 5.00 | 2.00 | ||||||||
Expected return on plan assets | 8.00 | 7.00 | 8.00 | 7.50 | ||||||||
F-99
Table of Contents
STORA ENSO NORTH AMERICA
NOTES TO THE COMBINED FINANCIAL STATEMENTS—(Continued)
The discount rate used to discount postretirement benefit obligations is measured using interest rates of high quality bonds at the balance sheet date. Maturity terms of the interest rates are used to approximate the duration and maturity terms of the related liability.
Estimated future benefit payments as of December 31, 2006 are as follows:
| Estimated Future Benefit Payments | ||||||||||||
| Pensions | Other Benefits | |||||||||||
| US | Canada | US | Canada | |||||||||
| (Dollars in millions) | ||||||||||||
2007 | $ | 44 | $ | 15 | $ | 26 | $ | 2 | ||||
2008 | 45 | 16 | 26 | 2 | ||||||||
2009 | 45 | 16 | 25 | 2 | ||||||||
2010 | 46 | 16 | 25 | 2 | ||||||||
2011 | 47 | 17 | 25 | 2 | ||||||||
Years 2012 – 2016 | 261 | 94 | 130 | 10 | ||||||||
Expected employer contributions to be paid into the plans during next fiscal year:
| Expected Employer Contributions | ||||||||||||
| Pensions | Other Benefits | |||||||||||
| US | Canada | US | Canada | |||||||||
| (Dollars in millions) | ||||||||||||
Payments during fiscal year 2007 | $ | 1 | $ | 15 | $ | 13 | $ | 2 | ||||
Assumptions related to retiree healthcare benefits as of December 31:
| 2006 | 2005 | |||||||||||
| US | Canada | US | Canada | |||||||||
Healthcare cost trend rate assumed for next year | 10 | % | 14 | % | 10 | % | 11 | % | ||||
Rate to which the cost trend rate is assumed to decline (the ultimate trend rate) | 5 | % | 6 | % | 5 | % | 6 | % | ||||
Year that the rate reaches the ultimate trend rate | 2011 | 2015 | 2011 | 2011 | ||||||||
A one-percentage-point change in assumed retiree healthcare cost trend rates would have the following effects:
| Other Postretirement Benefits | |||||||||||||
| 1-Percentage- Point Increase | 1-Percentage- Point Decrease | ||||||||||||
| US | Canada | US | Canada | ||||||||||
| (Dollars in millions) | |||||||||||||
Effect on total of service and interest cost components | $ | 4 | $ | — | $ | (3 | ) | $ | — | ||||
Effect on postretirement benefit obligation | 40 | — | (31 | ) | — | ||||||||
SENA has elected to receive a subsidy from the US government pursuant to the Medicare Prescription Drug Improvement and Modernization Act of 2003 related to its continuation of certain other postretirement benefit plans. The effect of this subsidy reduces 2006 expense for other postretirement benefit plans by $8 million and 2005 expense by $7 million.
F-100
Table of Contents
STORA ENSO NORTH AMERICA
NOTES TO THE COMBINED FINANCIAL STATEMENTS—(Continued)
Note 12—Other Current Liabilities
Other accrued liabilities at December 31, 2006 and 2005 are comprised of:
| As of December 31, | ||||||
| 2006 | 2005 | |||||
| (Dollars in millions) | ||||||
Current portion of restructuring provision | $ | 6 | $ | 11 | ||
Interest payable and other interest bearing liabilities | 20 | 20 | ||||
Accrued liabilities and deferred income | 33 | 26 | ||||
Current tax liability | 47 | 46 | ||||
Property tax payable | 7 | 8 | ||||
Legal liabilities | 4 | 5 | ||||
Other payables | 3 | 4 | ||||
Total | $ | 120 | $ | 120 | ||
Accrued liabilities and deferred income consist primarily of personnel expenses and customer pre-payments. Other payables encompass accrued municipal, county, and state taxes, and various miscellaneous accruals.
Note 13—Commitments and Contingencies
Commitments
| As at December 31, | |||||||||
| 2006 | 2005 | 2004 | |||||||
| (Dollars in millions) | |||||||||
Commitments on behalf of others: | |||||||||
Guarantees | $ | 5 | $ | 6 | $ | 5 | |||
Commitments, own: | |||||||||
Letters of credit | 19 | 14 | 16 | ||||||
Operating leases, in next 12 months | 2 | 2 | 2 | ||||||
Operating leases, after next 12 months | 6 | 2 | 4 | ||||||
Other commitments | 4 | 5 | 4 | ||||||
Total | $ | 36 | $ | 29 | $ | 31 | |||
Guarantees and letters of credit may be made in the ordinary course of business on behalf of associated companies and occasionally others.
The guarantees, entered into with financial institutions and other credit guarantors, generally obligate the Company to make payment in the event of default by the borrower. The Company has guaranteed bank loans to pulpwood contractors for the purchase of equipment required to supply, produce or transport forest products to the company. In the event of default on these bank loans by the pulpwood contractors, the Company has the right to take immediate possession of and sell the equipment in order to use the proceeds to repay all or a portion of the loans owing to the bank. The Company estimates that in excess of 80% of the guaranteed amount can be expected to be recovered from proceeds on liquidation of the equipment in the event of default. The Company has accrued less than $1 million for each of December 31, 2006, 2005 and 2004, respectively, for mortgages in default for the year.
F-101
Table of Contents
STORA ENSO NORTH AMERICA
NOTES TO THE COMBINED FINANCIAL STATEMENTS—(Continued)
The Company has provided letters of credit to various environmental agencies as a means of providing financial assurance with regard to environmental liabilities. The Company also provides a letter of credit for securing a supplemental pension obligation and certain letters of credit to fulfill supplier financial assurance requirements. Payment would only be required under these letters of credit if the Company defaulted on commitments made under these arrangements.
The guarantees and letters of credit have off-balance sheet credit risk representing the accounting loss that would be recognized at the reporting date if the Company or the counterparties failed to perform completely as contracted. The credit risk amounts are equal to the contract sums, assuming the amounts are not paid in full and are not recoverable from other parties
In 2003, Stora Enso Port Hawkesbury Limited (“SEPH”) was awarded financial assistance in the amount of $13 million from the Province of Nova Scotia to provide a contribution towards training and infrastructure costs associated with the construction of the thermo-mechanical pulp (TMP) line. The amount includes an incentive amount of $5 million provided that SEPH employs a minimum number of full-time equivalent (“FTE”) positions in its newsprint operation and SEPH as a whole. SEPH has received $2 million as of December 31, 2006 and a contribution of $2 million has been accrued at December 31, 2006, relating to the incentive assistance component.
In 2006, SEPH was awarded financial assistance in the amount of $56 million from the Province of Nova Scotia in settlement of its commitment to provide licensed land to SEPH. The amount will be paid out over seven years ($9 million in each of the first six years, and $4 million in the seventh year). Payout is to be made upon completion of each cumulative 12 month period of operation of SEPH’s newsprint and supercalendered paper machines. If there is no production for 24 continuous months, all current and future payments are forfeited.
Estimated Purchase Agreement Commitments as of December 31, 2006
| Type of Supply | Country | Years Left | Contract Total | Scheduled Contract Payments | |||||||||||||||||
| 2007 | 2008-9 | 2010-11 | 2012+ | ||||||||||||||||||
| (Dollars in millions) | |||||||||||||||||||||
Location: | |||||||||||||||||||||
Stora Enso North America Corp. | Electricity | US | 5 | $ | 103 | $ | 27 | $ | 32 | $ | 44 | $ | — | ||||||||
Stora Enso North America Corp. | Natural Gas | US | 4 | 34 | 18 | 15 | 1 | — | |||||||||||||
Stora Enso North America Corp. | Coal | US | 2 | 72 | 57 | 15 | — | — | |||||||||||||
Stora Enso North America Corp. | Chemicals | US | 2 | 5 | 5 | — | — | — | |||||||||||||
Stora Enso Port Hawkesbury Limited | Natural Gas | Canada | 6 | 94 | 17 | 35 | 28 | 14 | |||||||||||||
| 308 | 124 | 97 | 73 | 14 | |||||||||||||||||
Capital expenditure | 8 | 8 | — | — | — | ||||||||||||||||
Total contractual commitments | $ | 316 | $ | 132 | $ | 97 | $ | 73 | $ | 14 | |||||||||||
F-102
Table of Contents
STORA ENSO NORTH AMERICA
NOTES TO THE COMBINED FINANCIAL STATEMENTS—(Continued)
Purchases related to the above agreements were $172 million in 2006, $168 million in 2005 and $113 million in 2004.
SENA leases office and warehouse space as well as some mobile equipment under various non-cancellable operating leases, some of which contain renewal options. The future cost for contracts exceeding one year and for non-cancellable operating lease contracts are:
Repayment Schedule of Operating Lease Commitments
| As of December 31, | |||||||||
| 2006 | 2005 | 2004 | |||||||
| (Dollars in millions) | |||||||||
Less than 1 year | $ | 2 | $ | 2 | $ | 2 | |||
1–2 years | 2 | 1 | 2 | ||||||
2–3 years | 1 | 1 | 1 | ||||||
3–4 years | 1 | — | 1 | ||||||
4–5 years | 1 | — | — | ||||||
Over 5 years | 1 | — | — | ||||||
| $ | 8 | $ | 4 | $ | 6 | ||||
Contingent Liabilities
The Company is party to legal proceedings that arise in the ordinary course of business and which primarily involve claims arising out of commercial and environmental laws. It is also involved in administrative proceedings relating primarily to competition law. Management does not consider the potential liabilities related to such proceedings, before insurance recoveries, if any, are likely to be material to the Company’s financial condition or results of operations.
Competition Law Proceedings
Inspections by US Competition Authorities and Class-action Lawsuits in the United States
In May 2004, Stora Enso North America Corp. (“SENAC”) received subpoenas issued by the US Department of Justice as part of preliminary antitrust investigations into the magazine paper industry in the US. Subsequent to the commencement of these antitrust investigations, SENAC was named, along with other producers of paper and forestry products, as a defendant in a number of lawsuits brought in US federal and state courts by direct and indirect purchasers of publication paper purporting to act on behalf of a class of purchasers. They allege, generally, that the defendants agreed to fix, increase or maintain the price of publication paper in the US. They seek unspecified treble damages and, in some cases, restitution for the alleged overcharges resulting from the alleged violations, including interest and legal costs.
On December 13, 2006, the US antitrust authorities announced that SENAC had been indicted for its alleged anticompetitive conduct in connection with the sale of coated magazine paper in the US in 2002 and 2003; however, no SENAC employee was charged individually. SENAC denied any wrongdoing and entered a plea of not guilty. At a trial which commenced July 16, 2007 and concluded on July 19, 2007, SENAC was found not guilty.
F-103
Table of Contents
STORA ENSO NORTH AMERICA
NOTES TO THE COMBINED FINANCIAL STATEMENTS—(Continued)
The purported class-action lawsuits remain pending. There can be no assurances that SENAC will prevail in its efforts to defend these claims and we do not have liability insurance which would cover any adverse judgments or losses resulting from these lawsuits. Due to the uncertainties associated with these matters, it is not possible to estimate any potential loss contingencies, thus no provision has been made with respect to the purported class-action lawsuits. However, we do not believe that the ultimate outcome of these purported class-action lawsuits will have a material adverse effect on the Company’s business, operational results or financial condition.
Environmental Proceedings
Wisconsin Rapids Emissions
The US Environmental Protection Agency (“EPA”) has issued a notice of violation and a finding of violation to the Wisconsin Rapids mill alleging that expansions and other capital projects between 1983 and 1991 violated the US Clean Air Act. The EPA is seeking a penalty of $8 million and the installation of additional air pollution control equipment. Stora Enso North America Corp. considers that there are a number of defenses to these allegations and thus only an immaterial provision for this loss contingency has been recorded based on the Company’s best estimate of the outcome.
Niagara Emissions
The EPA has issued a notice of violation and a finding of violation to the Niagara mill alleging that projects at the mill between 1995 and 1997 violated the US Clean Air Act. No demand has been received from the EPA, but the EPA may seek a monetary penalty and the installation of additional control equipment. Stora Enso North America Corp. intends to defend any case brought by the EPA based upon these allegations and thus only an immaterial provision for this loss contingency has been recorded based on the Company’s best estimate of the outcome.
Note 14—Related Party Transactions
| As of December 31, | ||||||||||
| 2006 | 2005 | 2004 | ||||||||
| (Dollars in millions) | ||||||||||
Income statement: | ||||||||||
Sales to Stora Enso Oyj and other Group companies | $ | 6 | $ | 2 | $ | 2 | ||||
Purchases from Stora Enso Oyj and other Group companies | 45 | 33 | 59 | |||||||
Interest expense from Stora Enso Oyj and Stora Enso S.à.r.L | 61 | 44 | 33 | |||||||
Sales to Corenso North America | — | — | — | |||||||
Purchases from Corenso North America | 14 | 14 | 11 | |||||||
Balance sheet: | ||||||||||
Miscellaneous receivables from Stora Enso Oyj and other Group companies | $ | 12 | $ | 3 | $ | 8 | ||||
Cash pooling with Stora Enso Oyj | 173 | (4 | ) | 10 | ||||||
Loans from Stora Enso Oyj and Stora Enso S.à.r.L | 1,060 | 1,060 | 1,106 | |||||||
Interest payable to Stora Enso Oyj and Stora Enso S.à.r.L | 16 | 12 | 8 | |||||||
Miscellaneous payables to Stora Enso Oyj and other Group Companies | 10 | 7 | 15 | |||||||
Receivables from Corenso North America | — | — | 17 | |||||||
Payables to Corenso North America | 9 | 7 | 16 | |||||||
F-104
Table of Contents
STORA ENSO NORTH AMERICA
NOTES TO THE COMBINED FINANCIAL STATEMENTS—(Continued)
SENA currently sells, purchases, and utilizes services from Stora Enso Oyj, its ultimate parent company, and other Group companies for multiple items. A generally immaterial amount of paper is sold to the Group. Purchases from Group include, but are not limited to, the purchase of pulp and administrative services. SENA incurs interest expense and has long-term and short-term loans from the Group (see Note 9).
SENA purchases cores from Corenso North America Corp. (“CNA”) which is a wholly owned subsidiary of Stora Enso Oyj. SENA sells power generated at Consolidated Water Power Company, a wholly owned subsidiary, to CNA. SENA also sells steam from the Wisconsin Rapids mill and various administrative services to CNA.
During the last three years, SENA has not been involved in any material transactions with any of its directors, managers, or executive officers, including relatives or spouses of any of these persons.
Stora Enso Oyj has guaranteed certain obligations under the capital lease. Refer to Note 2 for further information.
Note 15—Restructuring Provision
The activity in restructuring provisions during 2004, 2005 and 2006 is as follows:
| Restructuring Provision | ||||
| (Dollars in millions) | ||||
Balance at January 1, 2004 | $ | 6 | ||
Charges | 11 | |||
Payments | (16 | ) | ||
Balance at December 31, 2004 | 1 | |||
Charges | 15 | |||
Payments | (5 | ) | ||
Balance at December 31, 2005 | 11 | |||
Charges | — | |||
Payments | (5 | ) | ||
Balance at December 31, 2006 | $ | 6 | ||
Throughout 2003 and 2004, SENA actively reduced their headcounts as a result of the Fixed Cost reduction initiatives that started in 2003 which resulted in a reduction of 832 employees. During 2005 a reduction of 35 employees occurred as a result of the Profit Enhancement Program and a further reduction of 82 employees occurred as a result of additional Fixed Cost reduction initiatives. During 2006, a reduction of 27 employees occurred as a result of the closure of paper machine number 31 and an additional reduction of 114 employees occurred as a result of additional Fixed Cost reduction initiatives.
As a result of the above initiatives, SENA recorded charges of $11 million in 2004, $15 million in 2005 and $1 million in 2006 for employment termination benefits and machine closure costs. The
F-105
Table of Contents
STORA ENSO NORTH AMERICA
NOTES TO THE COMBINED FINANCIAL STATEMENTS—(Continued)
charges were included in cost of sales and in selling, general and administrative expenses. SENA paid $17 million, $5 million and $5 million in 2004, 2005 and 2006, respectively, for liabilities which were accrued for in prior years.
Note 16—Combined Statements of Cash Flows
Supplemental cash flow disclosures are as follows:
Cash paid during the period for:
| Year Ended December 31, | |||||||||
| 2006 | 2005 | 2004 | |||||||
| (Dollars in millions) | |||||||||
Interest | $ | 91 | $ | 74 | $ | 72 | |||
Income taxes | 6 | 5 | 5 | ||||||
Note 17—Accumulated Other Comprehensive Income (Loss) (“AOCI”) (Restated)
Comprehensive income (loss) includes: net earnings; foreign currency translation adjustments; adjustments to minimum pension liability, net of tax; and a loss on the effective portion of a cash flow hedge, net of tax, that are all presented as a component of owner’s investment. The Company’s total comprehensive income (loss) was $(162), $(342) and $(563) million for 2006, 2005 and 2004, respectively.
The components of accumulated other comprehensive income (loss) are as follows:
| Foreign Currency Translation Adjustments | Financial Instruments | Pension and Other Postretirement Benefits | Total AOCI | ||||||||||||
| (Dollars in millions) | |||||||||||||||
Balance at January, 2004 | $ | — | $ | 1 | $ | (55 | ) | $ | (54 | ) | |||||
Foreign currency translation adjustments | 42 | — | — | 42 | |||||||||||
Financial instruments | — | 1 | — | 1 | |||||||||||
Minimum pension liability | — | — | 51 | 51 | |||||||||||
Balance at December 31, 2004 | 42 | 2 | (4 | ) | 40 | ||||||||||
Foreign currency translation adjustments | 24 | — | — | 24 | |||||||||||
Financial instruments | — | (2 | ) | — | (2 | ) | |||||||||
Minimum pension liability | — | — | (82 | ) | (82 | ) | |||||||||
Balance at December 31, 2005 (Restated) | 66 | — | (86 | ) | (20 | ) | |||||||||
Foreign currency translation adjustments | 5 | — | — | 5 | |||||||||||
Minimum pension liability | — | — | 76 | 76 | |||||||||||
Adoption of SFAS 158 | — | — | (260 | ) | (260 | ) | |||||||||
Balance at December 31, 2006 (Restated) | $ | 71 | $ | — | $ | (270 | ) | $ | (199 | ) | |||||
F-106
Table of Contents
STORA ENSO NORTH AMERICA
NOTES TO THE COMBINED FINANCIAL STATEMENTS—(Continued)
Note 18—Capital Leases
The Company’s predecessor entered into a sale-leaseback transaction for a paper machine in 1997 for $136 million. The lease has a basic lease term which expires in 2014. At the end of the basic lease term, the Company has the option to purchase the machine or the lessor can require the Company to renew the lease through 2025. The lease contains purchase options at amounts approximating fair market value in 2010 and at lease termination. This lease requires the Company to pay customary operating and repair expenses and to observe certain operating restrictions. The lease was deemed to be an operating lease at the inception of the lease.
In 2002, the Company entered into an amendment to the lease. Under the terms of the amendment, Stora Enso Oyj, the ultimate parent company, is the guarantor of this lease and is required to comply with both financial reporting and minimum debt rating covenants. Because the guarantee contains provisions outside the operations of the Company, the lease is classified as a capital lease in the combined financial statements from the date of the amendment.
Leased capital assets included in net property, plant and equipment were $77 million and $83 million at December 31, 2006 and 2005, respectively. Amortization of the capital lease assets was $7 million for each of the years 2006, 2005 and 2004. Interest expense related to the capital lease obligation was $9 million for each of the years 2006, 2005 and 2004.
Future minimum capital lease payments and the related present value of the capital lease payments at December 31, 2006 were as follows:
| Capital Lease | ||||
| (Dollars in millions) | ||||
2007 | $ | 7 | ||
2008 | 8 | |||
2009 | 7 | |||
2010 | 7 | |||
2011 | 7 | |||
After 2012 | 250 | |||
Total minimum lease payments | 286 | |||
Interest | (154 | ) | ||
Present value of net minimum lease payments | $ | 132 | ||
* * * * *
F-107
Table of Contents
CONDENSED COMBINED STATEMENTS OF OPERATIONS (UNAUDITED)
THREE QUARTERS ENDED SEPTEMBER 30, 2007
AND THREE QUARTERS ENDED SEPTEMBER 30, 2006
| Three Quarters Ended September 30, 2007 (Restated) | Three Quarters Ended September 30, 2006 (Restated) | |||||||
| (Dollars in millions) | ||||||||
Net sales | $ | 1,864 | $ | 1,584 | ||||
Costs and expenses: | ||||||||
Cost of sales | 1,846 | 1,552 | ||||||
Selling, general and administrative expenses | 67 | 81 | ||||||
Interest expense | 61 | 68 | ||||||
Other (income) | (1 | ) | (1 | ) | ||||
Loss before incomes taxes | (109 | ) | (116 | ) | ||||
Income tax (benefit) | (25 | ) | (14 | ) | ||||
Net loss | $ | (84 | ) | $ | (102 | ) | ||
The accompanying notes are an integral part of these condensed combined financial statements.
F-108
Table of Contents
CONDENSED COMBINED BALANCE SHEETS (UNAUDITED)
AS OF SEPTEMBER 30, 2007 AND DECEMBER 31, 2006
| September 30, 2007 | December 31, 2006 (Restated) | |||||||
| (Dollars in millions) | ||||||||
Assets: | ||||||||
Current assets: | ||||||||
Cash and cash equivalents | $ | 233 | $ | 195 | ||||
Accounts receivable, net of allowance for doubtful accounts of $3 and $3, respectively | 188 | 129 | ||||||
Inventories | 330 | 346 | ||||||
Deferred tax assets | 31 | 32 | ||||||
Other current assets | 55 | 28 | ||||||
Total current assets | 837 | 730 | ||||||
Non-current assets: | ||||||||
Property, plant and equipment, net | 2,386 | 2,479 | ||||||
Goodwill | 280 | 280 | ||||||
Other intangible assets, net | 10 | 11 | ||||||
Other non-current assets | 4 | 21 | ||||||
Total non-current assets | 2,680 | 2,791 | ||||||
Total assets | $ | 3,517 | $ | 3,521 | ||||
Liabilities and Owner’s Investment: | ||||||||
Current liabilities: | ||||||||
Short-term debt (related party is $161 and $0, respectively) | $ | 161 | $ | — | ||||
Current portion of long-term debt (related party is $1,060 and $0, respectively) | 1,304 | 103 | ||||||
Accounts payable | 196 | 167 | ||||||
Accrued payroll and benefits | 57 | 51 | ||||||
Postretirement benefit provisions | 16 | 16 | ||||||
Other current liabilities | 110 | 120 | ||||||
Total current liabilities | 1,844 | 457 | ||||||
Non-current liabilities: | ||||||||
Long-term debt (related party is $0 and $1,069, respectively) | 132 | 1,446 | ||||||
Deferred tax liabilities | 142 | 119 | ||||||
Postretirement benefit provisions | 313 | 468 | ||||||
Other non-current liabilities | 15 | 14 | ||||||
Total non-current liabilities | 602 | 2,047 | ||||||
Commitments and contingencies (Note 11) | — | — | ||||||
Owner’s investment: | ||||||||
Owner’s investment | 1,125 | 1,216 | ||||||
Accumulated other comprehensive loss | (54 | ) | (199 | ) | ||||
Total owner’s investment | 1,071 | 1,017 | ||||||
Total liabilities and owner’s investment | $ | 3,517 | $ | 3,521 | ||||
The accompanying notes are an integral part of these condensed combined financial statements.
F-109
Table of Contents
CONDENSED COMBINED STATEMENTS OF CASH FLOWS (UNAUDITED)
THREE QUARTERS ENDED SEPTEMBER 30, 2007
AND THREE QUARTERS ENDED SEPTEMBER 30, 2006
| Three Quarters Ended September 30, 2007 | Three Quarters Ended September 30, 2006 (Restated) | |||||||
| (Dollars in millions) | ||||||||
CASH FLOW FROM OPERATING ACTIVITIES: | ||||||||
Net loss | $ | (84 | ) | $ | (102 | ) | ||
Adjustments to reconcile net loss to net cash provided by operating activities: | ||||||||
Depreciation and amortization | 190 | 201 | ||||||
Loss on sale of property, plant and equipment | 3 | 1 | ||||||
Deferred income taxes | (25 | ) | (14 | ) | ||||
Bond discount amortization | 1 | 1 | ||||||
Change in current assets and liabilities: | ||||||||
Inventories | 24 | (6 | ) | |||||
Accounts receivable | (59 | ) | (15 | ) | ||||
Accounts payable | 23 | (17 | ) | |||||
Other non-current assets and liabilities | 2 | 15 | ||||||
Pension and other postretirement, net | (2 | ) | 27 | |||||
Other, net | (49 | ) | (61 | ) | ||||
Net cash provided by operating activities | 24 | 30 | ||||||
CASH FLOW FROM INVESTING ACTIVITIES: | ||||||||
Purchase of property, plant and equipment | (38 | ) | (42 | ) | ||||
Proceeds from sale of property, plant and equipment | 1 | — | ||||||
Net cash used in investing activities | (37 | ) | (42 | ) | ||||
CASH FLOW FROM FINANCING ACTIVITIES: | ||||||||
Short-term debt, net | 152 | — | ||||||
Repayment of long-term debt | (102 | ) | — | |||||
Owner’s investment—cash received from Stora Enso Oyj | 1 | 1 | ||||||
Net cash provided by financing activities | 51 | 1 | ||||||
Effect of exchange rates on cash | — | 3 | ||||||
NET INCREASE (DECREASE) IN CASH AND CASH EQUIVALENTS | 38 | (8 | ) | |||||
Cash and cash equivalents at beginning of year | 195 | 82 | ||||||
NET CASH AND CASH EQUIVALENTS AT END OF PERIOD | $ | 233 | $ | 74 | ||||
The accompanying notes are an integral part of these condensed combined financial statements.
F-110
Table of Contents
CONDENSED COMBINED STATEMENTS OF OWNER’S INVESTMENT AND
COMPREHENSIVE INCOME (LOSS) (UNAUDITED)
THREE QUARTERS ENDED SEPTEMBER 30, 2007
AND THREE QUARTERS ENDED SEPTEMBER 30, 2006
| Owner’s Investment | Accumulated Other Comprehensive Income (Loss) | Total | ||||||||||
| (Dollars in millions) | ||||||||||||
Balance at January 1, 2007 (Restated) | $ | 1,216 | $ | (199 | ) | $ | 1,017 | |||||
Comprehensive income: | ||||||||||||
Net loss | (84 | ) | (84 | ) | ||||||||
Foreign currency translation adjustment | 63 | 63 | ||||||||||
SFAS 158 (net of tax of $48) | 82 | 82 | ||||||||||
Total comprehensive income | $ | 61 | ||||||||||
Adoption of FIN 48 | (8 | ) | (8 | ) | ||||||||
Net increase in investment from Stora Enso Oyj | 1 | 1 | ||||||||||
Balance at September 30, 2007 | $ | 1,125 | $ | (54 | ) | $ | 1,071 | |||||
| Owner’s Investment | Accumulated Other Comprehensive Income (Loss) | Total | ||||||||||
| (Dollars in millions) | ||||||||||||
Balance at January 1, 2006 (Restated) | $ | 1,457 | $ | (20 | ) | $ | 1,437 | |||||
Comprehensive (loss): | ||||||||||||
Net loss | (102 | ) | (102 | ) | ||||||||
Minimum pension liability adjustment (net of tax of $33) | 57 | 57 | ||||||||||
Foreign currency translation adjustment | 29 | 29 | ||||||||||
Total comprehensive (loss) | $ | (16 | ) | |||||||||
Net increase in investment from Stora Enso Oyj | 1 | 1 | ||||||||||
Balance at September 30, 2006 (Restated) | $ | 1,356 | $ | 66 | $ | 1,422 | ||||||
The accompanying notes are an integral part of these condensed combined financial statements.
F-111
Table of Contents
NOTES TO THE CONDENSED COMBINED FINANCIAL STATEMENTS
Note 1—Business and Summary of Significant Accounting Policies
Organization and Description of Business
The condensed combined financial statements of the graphic paper, publication paper, specialty paper and other operations of Stora Enso Oyj, Finland (“the parent company”) in the United States of America (“US”) and Canada (collectively referred to as “North America”) are generally referred to as Stora Enso North America (“SENA”). As used in these notes, the terms “SENA,” “we,” “our,” “the Company,” “Stora Enso North America” and “us” refer to the combined operations of SENA. Stora Enso Oyj and its subsidiaries are collectively referred to as the “Group”.
SENA is a leading graphic, publication and specialty paper manufacturer in North America. We manufacture and market a broad range of paper products for a variety of applications such as corporate annual reports, high-end advertising brochures, magazines, catalogs, direct mail advertising, self adhesive labels, wet strength labels and flexible packaging.
SENA operates eight mills and 16 paper machines located primarily in Wisconsin, with one mill each in Nova Scotia, Canada and Minnesota. Our headquarters are in Wisconsin Rapids, Wisconsin. We also operate a hotel and a public utility, both of which are located in Wisconsin Rapids, Wisconsin.
The operations of SENA are ultimately wholly owned by Stora Enso Oyj of Finland. Stora Enso Oyj acquired the US operations of SENA from Consolidated Papers, Inc. (“CPI”) in August 2000. The US operations are contained in a subsidiary named Stora Enso North America Corp. The operations in Canada are contained in a subsidiary named Stora Enso Port Hawkesbury Limited. Since October of 2004, both Stora Enso Port Hawkesbury Limited and Stora Enso North America Corp. are wholly owned subsidiaries of Stora Enso North America Inc., which is a wholly owned subsidiary of Stora Enso Oyj.
Basis of Preparation
The accompanying condensed combined financial statements of SENA have been prepared in accordance with accounting principles generally accepted in the United States of America (“US GAAP”) on a carve-out basis. Management believes the assumptions underlying the condensed combined financial statements, including the allocation methodology described below, are reasonable. These condensed combined financial statements include all assets, liabilities, equity, revenues and expenses of Stora Enso Port Hawkesbury Limited and of Stora Enso North America Corp and its subsidiaries, excluding a 38.8% and a 38.2% interest, as of September 30, 2007 and December 31, 2006, respectively, in Thiele Kaolin Company, an investment accounted for using the equity method, and excluding amounts related to the Group’s import sales activity into North America for paper and timber products. Significant inter-company transactions and accounts have been eliminated.
The accompanying condensed combined financial statements are prepared on a carve-out basis to present the operations of SENA as a stand alone entity. In accordance with Stora Enso Oyj policy, most costs are pushed down to subsidiaries on an arm’s length basis and therefore minimal additional allocation of corporate expenses has been considered necessary for these condensed combined financial statements. The exceptions are stock based compensation and certain debt related hedges.
F-112
Table of Contents
STORA ENSO NORTH AMERICA
NOTES TO THE CONDENSED COMBINED FINANCIAL STATEMENTS—(Continued)
The condensed combined balance sheet as of December 31, 2006 (Restated) is combined financial information derived from the audited balance sheet, but does not include all disclosures required by US GAAP. The interim financial statements are unaudited. The financial statements have been prepared in accordance with US GAAP and, in the opinion of management, reflect all adjustments (consisting of normal recurring accruals) necessary for a fair statement in accordance with US GAAP for the periods presented. Certain information and footnote disclosures normally included in the annual financial statements presented in accordance with US GAAP have been condensed or omitted. The statements of operations and cash flows for the interim periods presented are not necessarily indicative of the results to be expected for the full year.
The accompanying financial statements should be read in conjunction with the annual financial statements and notes thereto, as of and for the year ended December 31, 2006 (Restated).
Reclassifications
Depreciation and amortization of $193 million and $202 million for the three quarters ended September 30, 2007 and 2006, respectively, has been reclassified to cost of sales and selling, general and administrative expenses as follows:
| Three Quarters Ended September 30, 2007 | Three Quarters Ended September 30, 2006 (Restated) | |||||
| (Dollars in millions) | ||||||
Cost of sales | $ | 190 | $ | 198 | ||
Selling, general and administrative expenses | 3 | 4 | ||||
Foreign Currency Translation
The statements of operations of foreign entities, whose functional currencies are not US dollars, are translated into US dollars using the average exchange rates for the year, whereas the balance sheets are translated using the exchange rates at the reporting date. Exchange rate differences arising from the re-translation of the net investments in foreign entities are recorded directly in owner’s investment in Accumulated Other Comprehensive Income (Loss) (“AOCI”), as shown in the Condensed Combined Statement of Owner’s Investment and Comprehensive Income (Loss).
Cash and Cash Equivalents
Cash and cash equivalents are comprised of cash on hand, deposits held with banks, cash pool balances and other liquid investments with original maturity of less than three months. Bank and cash pool overdrafts are reported separately in other interest bearing liabilities under other current liabilities. The Group parent company, Stora Enso Oyj, is the master account holder of the cash pool. Account balances of sub-accounts, such as the Company’s accounts, are consolidated to the master account thereby creating an internal liability between the master account holder and the sub-accounts. Cash pool internal interest is allocated to the member accounts by the participating banks at the end of each quarter. The account balances of sub-accounts represent the Company’s liquid cash receivable from or payable to the parent company and amounted to $204 million and $173 million of cash on deposit at September 30, 2007 and December 31, 2006, respectively.
F-113
Table of Contents
STORA ENSO NORTH AMERICA
NOTES TO THE CONDENSED COMBINED FINANCIAL STATEMENTS—(Continued)
Note 2—Restatements
As discussed in the combined financial statements as of December 31, 2006 and 2005 (Restated), the Company identified an error in the computation of the valuation allowance related to net deferred tax assets in Canada for the year ended December 31, 2005. This error resulted in an overstatement of the Company's deferred tax liabilities at December 31, 2006 and 2005 and an overstatement of the Company's 2005 net loss.
Further, as discussed in the combined financial statements as of December 31, 2006 and 2005 (Restated), a lease which had been treated as an operating lease was determined to be a capital lease for purposes of these combined financial statements based on terms of a default covenant contained in the lease agreement pursuant to a 2002 amendment for a guaranty from Stora Enso Oyj, with respect to the Company's obligation under the lease. This change in treatment resulted in a reduction in rent expense, and increase in amortization expense (both are components of cost of sales), an increase in interest expense, an increase in property, plant and equipment and an increase in long term debt for each of the years ended December 31, 2006, 2005 and 2004.
Further, as discussed in the combined financial statements as of December 31, 2006 and 2005 (Restated), the Company identified an error related to the presentation of shipping and handling costs. This change in treatment resulted in an increase in sales and an increase in the same amount in cost of sales for each of the three quarters ended September 30, 2007 and 2006. There was no effect on the Company’s Combined Balance Sheets, Combined Statements of Cash Flows, or Combined Statements of Owners’ Investment and Comprehensive Income (Loss).
The following table presents the effect of this restatement on the Company’s net sales and cost of sales for the three quarters ended September 30, 2007 and 2006, respectively:
| Three Quarters Ended September 2007 | Three Quarters Ended September 2006 | |||||||||||||||||
| As Previously Restated | Effect of Restatement | Restated | As Previously Restated | Effect of Restatement | Restated | |||||||||||||
(Dollars in millions) | ||||||||||||||||||
Net sales | $ | 1,728 | $ | 136 | $ | 1,864 | $ | 1,480 | $ | 104 | $ | 1,584 | ||||||
Cost of sales | 1,710 | 136 | 1,846 | 1,448 | 104 | 1,552 | ||||||||||||
Note 3—Segment Information
SENA’s six reportable segments are as follows: coated publication paper, uncoated publication paper, newsprint, fine paper, specialty paper and other. These segments are consistent with the internal structure used to manage these businesses.
Reportable Segment Data
SENA does not allocate total assets internally in assessing operating performance. Net sales, operating loss, accounting policy differences, depreciation and amortization, goodwill, and net sales by geographic area as determined by SENA for its reportable segments, are shown in the following tables.
F-114
Table of Contents
STORA ENSO NORTH AMERICA
NOTES TO THE CONDENSED COMBINED FINANCIAL STATEMENTS—(Continued)
Net Sales
| Three Quarters Ended September 30, 2007 (Restated) | Three Quarters Ended September 30, 2006 (Restated) | |||||||
| (Dollars in millions) | ||||||||
Coated publication paper | $ | 509 | $ | 507 | ||||
Uncoated publication paper | 360 | 188 | ||||||
Newsprint | 64 | 2 | ||||||
Fine paper | 695 | 674 | ||||||
Specialty paper | 242 | 218 | ||||||
Other | 24 | 17 | ||||||
Eliminations | (30 | ) | (22 | ) | ||||
Net sales | $ | 1,864 | $ | 1,584 | ||||
Internal Management Reporting Loss vs. External Reporting Loss
| Three Quarters Ended September 30, 2007 | Three Quarters Ended September 30, 2006 (Restated) | |||||||
| (Dollars in millions) | ||||||||
Coated publication paper | $ | 6 | $ | 25 | ||||
Uncoated publication paper | (34 | ) | (45 | ) | ||||
Newsprint | (14 | ) | (24 | ) | ||||
Fine paper | 53 | 20 | ||||||
Specialty paper | 17 | (3 | ) | |||||
Other | 2 | (4 | ) | |||||
Operating income (loss)—internal management reporting | 30 | (31 | ) | |||||
Interest expense | (61 | ) | (68 | ) | ||||
Share based compensation | (2 | ) | (3 | ) | ||||
Internal vs. external accounting policies (see below) | (76 | ) | (14 | ) | ||||
Loss before income taxes—external reporting | $ | (109 | ) | $ | (116 | ) | ||
Accounting Policy Differences
| Three Quarters Ended September 30, 2007 | Three Quarters Ended September 30, 2006 | |||||||
| (Dollars in millions) | ||||||||
Depreciation expense related to impairment reversal—internal reporting, gross | $ | (13 | ) | $ | (22 | ) | ||
Restructuring costs, net | (2 | ) | (2 | ) | ||||
Postretirement benefits, net | (61 | ) | 10 | |||||
Total accounting policy differences | $ | (76 | ) | $ | (14 | ) | ||
F-115
Table of Contents
STORA ENSO NORTH AMERICA
NOTES TO THE CONDENSED COMBINED FINANCIAL STATEMENTS—(Continued)
Depreciation and Amortization
| Three Quarters Ended September 30, 2007 | Three Quarters Ended September 30, 2006 (Restated) | |||||
| (Dollars in millions) | ||||||
Coated publication paper | $ | 47 | $ | 47 | ||
Uncoated publication paper | 44 | 40 | ||||
Newsprint | 1 | 9 | ||||
Fine paper | 76 | 77 | ||||
Specialty paper | 21 | 23 | ||||
Other | 4 | 6 | ||||
Total depreciation and amortization | $ | 193 | $ | 202 | ||
Information by Geographic Area—Net Sales
| Three Quarters Ended September 30, 2007 (Restated) | Three Quarters Ended September 30, 2006 (Restated) | |||||
| (Dollars in millions) | ||||||
US—paper sales | $ | 1,636 | $ | 1,422 | ||
Canada—paper sales | 120 | 93 | ||||
Americas, other than the US and Canada—paper sales | 22 | 15 | ||||
Other—all other sales | 86 | 54 | ||||
Net sales | $ | 1,864 | $ | 1,584 | ||
Note 4—Income Taxes
The income tax provision is determined by applying an estimated annual effective income tax rate to income before income taxes. The estimated annual effective income tax rate is based on the most recent annualized forecast of pretax income, permanent book/tax difference and tax credits.
The Company and its subsidiaries file income tax returns in the US for federal and various state jurisdictions and in Canada. As of September 30, 2007, the Company is open for examination for US federal purposes from 2000 through 2006, for Wisconsin purposes from 1997 through 2005 and for Canadian purposes from 2002 through 2006. The Company is also open for examination in various other jurisdictions for various years.
The Company has recorded a valuation allowance against its net deferred tax asset for Canadian income taxes since it is more likely than not, that it will not realize these benefits, as defined in SFAS No. 109. The Company has also recorded a $1 million valuation allowance against its deferred tax asset for US state losses in the third quarter ended September 30, 2007.
The Company adopted the provisions of Financial Accounting Standards Board Interpretation No. 48 “Accounting for Uncertainty in Income Taxes, an Interpretation of FASB Statement No. 109” (“FIN 48”), on January 1, 2007. As a result of the implementation of FIN 48, the Company recognized a
F-116
Table of Contents
STORA ENSO NORTH AMERICA
NOTES TO THE CONDENSED COMBINED FINANCIAL STATEMENTS—(Continued)
cumulative effect adjustment of $8 million, increasing its liability for unrecognized tax benefits and reducing the January 1, 2007 balance of owner’s investment. The total amount of unrecognized tax benefits at January 1, 2007 was $58 million. The amount of unrecognized tax benefits that, if recognized as of January 1, 2007, would affect the Company’s effective tax rate was $48 million (net of tax benefit). The Company does not expect a significant change in its unrecognized tax benefits between now and the end of 2007.
The Company has elected to recognize all income tax related interest and statutory penalties imposed by taxing authorities as income tax expense. The total amount of accrued interest and penalties at January 1, 2007 amounted to $7 million. The Company has recorded $1 million in interest expense in its Condensed Combined Statements of Operations for the three quarters ended September 30, 2007.
Note 5—Inventories
Inventories at September 30, 2007 and December 31, 2006 are comprised of:
| September 30, 2007 | December 31, 2006 | |||||||
| (Dollars in millions) | ||||||||
Materials, supplies and work in progress | $ | 73 | $ | 75 | ||||
Finished goods | 167 | 189 | ||||||
Spare parts and consumables | 97 | 89 | ||||||
Obsolescence provision—spare parts | (4 | ) | (3 | ) | ||||
Obsolescence provision—finished goods | (3 | ) | (4 | ) | ||||
Total | $ | 330 | $ | 346 | ||||
Note 6—Property, Plant and Equipment
Property, plant and equipment at September 30, 2007 and December 31, 2006 are comprised of:
| September 30, 2007 | December 31, 2006 (Restated) | |||||||
| (Dollars in millions) | ||||||||
Plant and equipment | $ | 4,066 | $ | 3,959 | ||||
Buildings and structures | 309 | 317 | ||||||
Land | 19 | 24 | ||||||
Other tangible assets | 17 | 16 | ||||||
Assets in progress | 40 | 40 | ||||||
Gross cost | 4,451 | 4,356 | ||||||
Less: accumulated depreciation and capital lease amortization | (2,065 | ) | (1,877 | ) | ||||
Property, plant and equipment, net | $ | 2,386 | $ | 2,479 | ||||
Depreciation expense related to property, plant and equipment was $185 million and $194 million in the three quarters ended September 30, 2007 and the three quarters ended September 30, 2006, respectively. Depreciation expense includes losses on the sale of property, plant and equipment of $3 million and $1 million in the three quarters ended September 30, 2007 and the three quarters ended
F-117
Table of Contents
STORA ENSO NORTH AMERICA
NOTES TO THE CONDENSED COMBINED FINANCIAL STATEMENTS—(Continued)
September 30, 2006, respectively. Capital lease amortization expense was $6 million and $5 million in the three quarters ended September 30, 2007 and the three quarters ended September 30, 2006, respectively.
Note 7—Goodwill and Other Intangible Assets
Goodwill and other intangible assets at September 30, 2007 and December 31, 2006 are comprised of:
| September 30, 2007 | December 31, 2006 | |||||||
| (Dollars in millions) | ||||||||
Goodwill | $ | 280 | $ | 280 | ||||
Other intangible assets: | ||||||||
Gross cost | $ | 47 | $ | 43 | ||||
Less: accumulated amortization | (37 | ) | (32 | ) | ||||
Other intangible assets, net | $ | 10 | $ | 11 | ||||
Goodwill of $2,128 million was recognized upon the acquisition of Consolidated Papers, Inc. by Stora Enso Oyj in August of 2000. Goodwill amortization in the amount of $144 million was recognized prior to the adoption of Statement of Financial Accounting Standards No. 142, “Goodwill and Other Intangible Assets,” (“SFAS 142”) and since then goodwill has been tested for impairment on an annual basis. A total of $1,704 million of impairment losses have been recorded prior to 2006 due to deterioration in market conditions and increased operating costs associated with the business.
The other intangible assets consist of computer software both internally developed and purchased, along with certain patents, trademarks and franchises. As of September 30, 2007, computer software had a net book value of $3 million while patents, trademarks and franchises had a net book value of $7 million. As of December 31, 2006, computer software had a net book value of $3 million while patents, trademarks and franchises had a net book value of $8 million.
Note 8—Debt
The balances of debt as of September 30, 2007 and December 31, 2006 are as follows:
| September 30, 2007 | December 31, 2006 (Restated) | |||||||
| (Dollars in millions) | ||||||||
Bond loans | $ | 254 | $ | 359 | ||||
Bond loan discounts | (10 | ) | (11 | ) | ||||
Loans from Stora Enso Group companies (related parties) | 1,221 | 1,069 | ||||||
Capital lease obligation | 132 | 132 | ||||||
Total debt | 1,597 | 1,549 | ||||||
Current liabilities: repayable within the next 12 months | (1,465 | ) | (103 | ) | ||||
Non-current liabilities: repayable after 12 months | $ | 132 | $ | 1,446 | ||||
F-118
Table of Contents
STORA ENSO NORTH AMERICA
NOTES TO THE CONDENSED COMBINED FINANCIAL STATEMENTS—(Continued)
Loans from Stora Enso Group companies (related parties) include $1,060 million of LIBOR based floating rate debt from Stora Enso S.á.r.L., a subsidiary of Stora Enso Oyj. This debt matures on August 13, 2008. This debt is anticipated to be repaid in connection with the transaction described in Note 16—Acquisition Announcement. Also in anticipation of the transaction described in Note 16, on November 7, 2007, the Company committed to prepaying all of its outstanding bond loans, with a net carrying value of $244 million, on December 7, 2007. As a result, all of the Company’s debt, other than capital lease liabilities, is presently repayable within the next 12 months. The capital lease liabilities relate to a lease of paper machine 35, situated in the Stevens Point mill.
Note 9—Financial Instruments
Fair Values of Financial Instruments
Fair value gains and losses on financial instruments are deferred, net of tax, in Accumulated Other Comprehensive Income (“AOCI”) if they fulfill the cash flow hedge accounting criteria. The remaining fair value movements are reported in the Condensed Combined Statements of Operations as other (income) expense as shown below. The Company had no outstanding embedded derivatives at September 30, 2007 or at December 31, 2006.
Fair Value Hedge Gains and Losses
Three Quarters Ended September 30, 2007 | Three Quarters Ended September 30, 2006 | ||||||
| (Dollars in millions) | |||||||
Net (gain)/loss on qualifying hedges . | $ | 2 | $ | (2 | ) | ||
Fair value changes (gain)/loss in hedged items | — | 2 | |||||
Net (gain)/loss | 2 | — | |||||
Net (gain)/loss on non-qualifying hedges | — | (1 | ) | ||||
Net fair value (gain)/loss | $ | 2 | $ | (1 | ) | ||
Certain derivatives are designated as cash flow hedges and measured at fair value with the fair value movements recorded in the separate owner’s investment category of AOCI. As of September 30, 2007, the hedging reserve, after deferred taxes, was $1 million. As of December 31, 2006, the Company did not have any open cash flow hedging derivatives. The gain on derivative financial instruments designated as cash flow hedges that was realized from AOCI through the Condensed Combined Statements of Operations amounted to $4 million in the three quarters ended September 30, 2007 and to less than $1 million in the three quarters ended September 30, 2006.
F-119
Table of Contents
STORA ENSO NORTH AMERICA
NOTES TO THE CONDENSED COMBINED FINANCIAL STATEMENTS—(Continued)
Notional Values of Derivative Financial Instruments
| September 30, 2007 | December 31, 2006 | |||||
| (Dollars in millions) | ||||||
Interest rate derivatives: | ||||||
Interest rate swaps: | ||||||
Maturity under 1 year | $ | — | $ | 102 | ||
Maturity 2-5 years | 109 | 79 | ||||
Maturity 6-10 years | 22 | 52 | ||||
Total interest rate derivatives | $ | 131 | $ | 233 | ||
Foreign exchange derivatives: | ||||||
Forward contracts | $ | 5 | $ | — | ||
Currency options | 20 | — | ||||
Total foreign exchange derivatives | $ | 25 | $ | — | ||
Note 10—Pension and Other Postretirement Benefits
United States Based Plans:
A summary of the components of net periodic pension cost for the US defined benefit retirement plans is as follows:
| Three Quarters Ended September 30, 2007 | Three Quarters Ended September 30, 2006 | |||||||
| (Dollars in millions) | ||||||||
Service cost | $ | 10 | $ | 12 | ||||
Interest cost | 36 | 34 | ||||||
Expected return on plan assets | (48 | ) | (45 | ) | ||||
Recognized net actuarial gains | (1 | ) | — | |||||
Amortization of prior service cost | 10 | 11 | ||||||
Curtailment | 3 | — | ||||||
Net periodic benefit cost | $ | 10 | $ | 12 | ||||
A summary of the components of net periodic postretirement benefit cost for the US postretirement health care and life insurance benefits plans is as follows:
| Three Quarters Ended September 30, 2007 | Three Quarters Ended September 30, 2006 | |||||||
| (Dollars in millions) | ||||||||
Service cost | $ | 2 | $ | 7 | ||||
Interest cost | 12 | 18 | ||||||
Expected return on plan assets | (1 | ) | (1 | ) | ||||
Recognized net actuarial gains | (25 | ) | (13 | ) | ||||
Amortization of prior service cost | 12 | 12 | ||||||
Net periodic benefit cost | $ | — | $ | 23 | ||||
F-120
Table of Contents
STORA ENSO NORTH AMERICA
NOTES TO THE CONDENSED COMBINED FINANCIAL STATEMENTS—(Continued)
During the three quarters ended September 30, 2007, the Company concluded contract negotiations with the majority of its US based union membership. Negotiated changes in pension and other postretirement benefits resulted in net reductions to the pension and other postretirement benefit obligations, the impacts of which are reflected in the FAS 158 adjustment in AOCI and in the reduction of the net periodic benefit cost.
Canadian Based Plans:
A summary of the components of net periodic pension cost for the Canadian defined benefit retirement plans is as follows:
| Three Quarters Ended September 30, 2007 | Three Quarters Ended September 30, 2006 | |||||||
| (Dollars in millions) | ||||||||
Service cost | $ | 3 | $ | 2 | ||||
Interest cost | 12 | 11 | ||||||
Expected return on plan assets | (16 | ) | (12 | ) | ||||
Recognized net actuarial losses | 1 | 1 | ||||||
Amortization of prior service cost | 1 | 1 | ||||||
Curtailment | — | 14 | ||||||
Net periodic benefit cost | $ | 1 | $ | 17 | ||||
A summary of the components of net periodic postretirement benefit cost for the Canadian postretirement health care and life insurance benefit plans is as follows:
| Three Quarters Ended September 30, 2007 | Three Quarters Ended September 30, 2006 | |||||
| (Dollars in millions) | ||||||
Service cost | $ | 1 | $ | — | ||
Interest cost | 1 | 1 | ||||
Amortization of prior service cost | — | 2 | ||||
Net periodic benefit cost | $ | 2 | $ | 3 | ||
The expense arising from defined benefit pension and other postretirement benefits is based upon a specific methodology that includes a designated actuarial approach and reflects accrual accounting. The expense accrued for each quarter is based on the method used in normal quarterly closings. The full year actuarial estimates made at the end of the previous year for the coming year have been accrued for the quarters and no new actuarial calculations have been prepared specifically for the quarterly closings.
Note 11—Commitments and Contingencies
Contingent Liabilities
The Company is party to legal proceedings that arise in the ordinary course of business and which primarily involve claims arising out of commercial and environmental laws. It is also involved in administrative proceedings relating primarily to competition law. Management does not consider the potential liabilities related to such proceedings, before insurance recoveries, if any, are likely to be material to the Company’s financial condition or results of operations.
F-121
Table of Contents
STORA ENSO NORTH AMERICA
NOTES TO THE CONDENSED COMBINED FINANCIAL STATEMENTS—(Continued)
Competition Law Proceedings
Inspections by US Competition Authorities and Class-action Lawsuits in the United States
In May 2004, Stora Enso North America Corp. (“SENAC”) received subpoenas issued by the US Department of Justice as part of an antitrust investigation into the magazine paper industry in the US. Subsequent to the commencement of these antitrust investigations, SENAC was named, along with other producers of paper and forestry products, as a defendant in a number of lawsuits brought in US federal and state courts by direct and indirect purchasers of publication paper purporting to act on behalf of a class of purchasers. They allege, generally, that the defendants agreed to fix, increase or maintain the price of publication paper in the US. They seek unspecified treble damages and, in some cases, restitution for the alleged overcharges resulting from the alleged violations, including interest and legal costs.
On December 13, 2006, the US antitrust authorities announced that SENAC had been indicted for its alleged anticompetitive conduct in connection with the sale of coated magazine paper in the US in 2002 and 2003. At a trial which commenced July 16, 2007 and concluded on July 19, 2007, SENAC was found not guilty.
The purported class-action lawsuits remain pending. There can be no assurances that SENAC will prevail in its efforts to defend these claims and we do not have liability insurance which would cover any adverse judgments or losses resulting from these lawsuits. Due to the uncertainties associated with these matters, it is not possible to estimate any potential loss contingencies, thus no provision has been made with respect to the purported class-action lawsuits. However, we do not believe that the ultimate outcome of these purported class-action lawsuits will have a material adverse effect on the Company’s business, operational results or financial condition.
Environmental Proceedings
Wisconsin Rapids Emissions
The US Environmental Protection Agency (“EPA”) has issued a notice of violation and a finding of violation to the Wisconsin Rapids mill alleging that expansions and other capital projects between 1983 and 1991 violated the US Clean Air Act. The EPA is seeking a penalty of $8 million and the installation of additional air pollution control equipment. SENAC considers that there are a number of defenses to these allegations and thus only an immaterial provision for this loss contingency has been recorded based on the Company’s best estimate of the outcome.
Niagara Emissions
The EPA has issued a notice of violation and a finding of violation to the Niagara mill alleging that projects at the mill between 1995 and 1997 violated the US Clean Air Act. No demand has been received from the EPA, but the EPA may seek a monetary penalty and the installation of additional control equipment. SENAC intends to defend any case brought by the EPA based upon these allegations and thus only an immaterial provision for this loss contingency has been recorded based on the Company’s best estimate of the outcome.
F-122
Table of Contents
STORA ENSO NORTH AMERICA
NOTES TO THE CONDENSED COMBINED FINANCIAL STATEMENTS—(Continued)
Note 12—Related Party Transactions
| Three Quarters Ended September 30, 2007 | Three Quarters Ended September 30, 2006 | |||||
| (Dollars in millions) | ||||||
Income statement: | ||||||
Sales to Stora Enso Oyj and other Group companies | $ | — | $ | 1 | ||
Purchases from Stora Enso Oyj and other Group companies | 37 | 34 | ||||
Interest expense from Stora Enso Oyj and Stora Enso S. á. r. L | 47 | 41 | ||||
Purchases from Corenso North America | 8 | 11 | ||||
| September 30, 2007 | December 31, 2006 | |||||
| (Dollars in millions) | ||||||
Balance sheet: | ||||||
Miscellaneous receivables from Stora Enso Oyj and other Group companies | $ | 19 | $ | 12 | ||
Cash pooling with Stora Enso Oyj | 204 | 173 | ||||
Loans from Stora Enso Oyj and Stora Enso S.á. r.L | 1,221 | 1,060 | ||||
Interest payable to Stora Enso Oyj and Stora Enso S.á. r.L | 19 | 16 | ||||
Miscellaneous payables to Stora Enso Oyj and other Group companies | 7 | 10 | ||||
Receivables from Corenso North America | 3 | — | ||||
Payables to Corenso North America | — | 9 | ||||
SENA currently sells, purchases, and utilizes services from Stora Enso Oyj, its ultimate parent company, and other Group companies for multiple items. A generally immaterial amount of paper is sold to the Group. Purchases from Group include, but are not limited to, the purchase of pulp and administrative services. SENA incurs interest expense and has long-term and short-term loans from the Group (see Note 8).
SENA purchases cores from Corenso North America Corp. (“CNA”) which is a wholly owned subsidiary of Stora Enso Oyj. SENA sells power generated at Consolidated Water Power Company, a wholly owned subsidiary, to CNA. SENA also sells steam from the Wisconsin Rapids mill and various administrative services to CNA.
During the last three years, SENA has not been involved in any material transactions with any of its directors, managers, or executive officers, including relatives or spouses of any of these persons.
Stora Enso Oyj has guaranteed certain obligations under the capital lease.
F-123
Table of Contents
STORA ENSO NORTH AMERICA
NOTES TO THE CONDENSED COMBINED FINANCIAL STATEMENTS—(Continued)
Note 13—Restructuring Provision
The activity in restructuring provisions during the three quarters ended September 30, 2007 is as follows:
| Restructuring Provision | ||||
| (Dollars in millions) | ||||
Balance at January 1, 2007 | $ | 6 | ||
Translation difference | — | |||
Charges | 8 | |||
Payments | (9 | ) | ||
Balance at September 30, 2007 | $ | 5 | ||
During 2007, a reduction of approximately 190 employees occurred as a result of the conclusion of union contract negotiations and related fixed cost reduction initiatives.
Note 14—Condensed Combined Statements of Cash Flows
Supplemental cash flow disclosures are as follows:
Cash paid during the period for:
| Three Quarters Ended September 30, 2007 | Three Quarters Ended September 30, 2006 | |||||
| (Dollars in millions) | ||||||
Interest (Restated) | $ | 71 | $ | 60 | ||
Income taxes | 1 | 4 | ||||
Note 15—Other Comprehensive Income (Loss)
Comprehensive income (loss) includes the following:
| Three Quarters Ended September 30, 2007 | Three Quarters Ended September 30, 2006 (Restated) | |||||||
| (Dollars in millions) | ||||||||
Net loss | $ | (84 | ) | $ | (102 | ) | ||
Foreign currency translation adjustment | 63 | 57 | ||||||
Minimum pension liability adjustment, net of tax | — | 29 | ||||||
SFAS 158, net of tax | 82 | — | ||||||
Total comprehensive income (loss) | $ | 61 | $ | (16 | ) | |||
F-124
Table of Contents
STORA ENSO NORTH AMERICA
NOTES TO THE CONDENSED COMBINED FINANCIAL STATEMENTS—(Continued)
Note 16—Acquisition Announcement
On September 20, 2007, NewPage Holding Corporation and Stora Enso Oyj (SENA’s ultimate parent company) entered into a definitive agreement pursuant to which NewPage Corporation will acquire all of the common stock of Stora Enso North America, Inc. (SENA’s immediate parent company). The transaction includes all Stora Enso North American operations except for the associated company Thiele Kaolin Company, and the North American timber operations, each of which have been excluded from these condensed combined financial statements. The import sales activity of Stora Enso Oyj into North America through SENA will not be continued by SENA after the sale. As such this import sales activity has been excluded from these condensed combined financial statements.
* * * * *
F-125
Table of Contents

Table of Contents
Shares
NewPage Group Inc.
Common Stock
Goldman, Sachs & Co.
Through and including , 2008 (the 25th day after the date of this prospectus), all dealers effecting transactions in these securities, whether or not participating in this offering, may be required to deliver a prospectus. This is in addition to a dealer’s obligation to deliver a prospectus when acting as an underwriter and with respect to an unsold allotment or subscription.
Table of Contents
PART II
Information Not Required in the Prospectus
| Item 13. | Other Expenses of Issuance and Distribution |
The following table shows the costs and expenses, other than underwriting discounts and commissions, payable in connection with the sale and distribution of the securities being registered. Except as otherwise noted, we will pay all of these amounts. All amounts except the SEC registration fee and the FINRA fee are estimated. All amounts will be filed by amendment.
SEC Registration Fee | $ | ||
New York Stock Exchange Listing Fee | |||
FINRA Fee | |||
Accounting Fees and Expenses | |||
Legal Fees and Expenses | |||
Printing Fees and Expenses | |||
Blue Sky Fees and Expenses | |||
Miscellaneous | |||
Total | $ | ||
| Item 14. | Indemnification of Directors and Officers |
Indemnification under the Delaware General Corporation Law
NewPage Group Inc., or NewPage Group, is a corporation incorporated under the laws of the State of Delaware. Section 145 of the Delaware General Corporation Law, or the DGCL, authorizes a corporation to indemnify any person who was or is a party, or is threatened to be made a party, to any threatened, pending or completed action, suit or proceeding, whether civil, criminal, administrative or investigative, by reason of the fact that the person is or was a director, officer, employee or agent of the corporation, or is or was serving at the request of the corporation as a director, officer, employee or agent of another corporation, partnership, joint venture, trust or other enterprise, against expenses, including attorneys’ fees, judgments, fines and amounts paid in settlement actually and reasonably incurred by the person in connection with such action, suit or proceeding, if the person acted in good faith and in a manner the person reasonably believed to be in, or not opposed to, the best interests of the corporation and, with respect to any criminal action or proceeding, had no reasonable cause to believe the person’s conduct was unlawful. In addition, the Delaware General Corporation Law does not permit indemnification in any threatened, pending or completed action or suit by or in the right of the corporation in respect of any claim, issue or matter as to which such person shall have been adjudged to be liable to the corporation, unless and only to the extent that the court in which such action or suit was brought shall determine upon application that, despite the adjudication of liability, but in view of all the circumstances of the case, such person is fairly and reasonably entitled to indemnity for such expenses, which such court shall deem proper. To the extent that a present or former director or officer of a corporation has been successful on the merits or otherwise in defense of any action, suit or proceeding referred to above, or in defense of any claim, issue or matter, such person shall be indemnified against expenses, including attorneys’ fees, actually and reasonably incurred by such person. Indemnity is mandatory to the extent a claim, issue or matter has been successfully defended. The Delaware General Corporation Law also allows a corporation to provide for the elimination or limit of the personal liability of a director to the corporation or its stockholders for monetary damages for breach of fiduciary duty as a director, provided that such provision shall not eliminate or limit the liability of a director
(1) for any breach of the director’s duty of loyalty to the corporation or its stockholders,
II-1
Table of Contents
(2) for acts or omissions not in good faith or which involve intentional misconduct or a knowing violation of law,
(3) for unlawful payments of dividends or unlawful stock purchases or redemptions, or
(4) for any transaction from which the director derived an improper personal benefit.
These provisions will not limit the liability of directors or officers under the Federal securities laws of the United States.
Indemnification under the Certificate of Incorporation
Article V of the amended and restated certificate of incorporation of NewPage Group eliminates a directors’ personal liability to the fullest extent permitted under applicable law.
Article VI of the amended and restated certificate of incorporation of NewPage Group gives the company the right, to the fullest extent permitted by applicable law, to indemnify its officers and directors.
Indemnification under the Bylaws
Article V of the amended and restated bylaws of NewPage Group provides that the company will, to the fullest extent permitted by applicable law, indemnify, and advance expenses to, each and every person who is or was a director, officer, employee, agent or fiduciary of the company or of any other corporation, partnership, joint venture, trust, employee benefit plan or other enterprise in which such person is or was serving at the request of the company and who, because of any such position or status, is directly or indirectly involved in any action, suit, arbitration, alternate dispute resolution mechanism, investigation, administrative hearing or any other proceeding whether civil, criminal, administrative or investigative. Such expenses include all reasonable attorneys’ fees, retainers, court costs, transcript costs, fees of experts, witness fees, travel expenses, duplicating costs, printing and binding costs, telephone charges, postage, delivery service fees, and all other disbursements or expenses of the types customarily incurred in connection with prosecuting, defending, preparing to prosecute or defend, investigating, or being or preparing to be a witness in a proceeding.
Indemnification under Indemnification Agreements
We expect to enter into an indemnification agreement with each of our executive officers and directors that provides, in general, that we will indemnify them to the fullest extent permitted by law in connection with their service to us or on our behalf.
| Item 15. | Recent Sales of Unregistered Securities. |
The following is a list of all unregistered securities sold or issued by the registrant within the past three years. The information shown does not give effect to the stock split to be implemented by the registrant prior to completion of the offering registered by this registration statement.
(1) NewPage Group was formed to become the direct parent entity of NewPage Holding Corporation, or NewPage Holding. In December 2007, NewPage Group issued 45,055,686 shares of its common stock to Escanaba Timber LLC in exchange for all of the outstanding shares of NewPage Holding. The shares were issued in reliance on Section 4(2) of the Securities Act as the sale of the securities did not involve a public offering. The shares issued to Escanaba Timber were then distributed to Maple Timber Acquisition LLC, which then distributed them to the members of Maple Timber Acquisition LLC.
II-2
Table of Contents
(2) In December 2007, we granted options to purchase 6,282,315 shares of our common stock to certain of our employees and independent directors under the NewPage Group Inc. 2008 Incentive Plan at an exercise price of $21.22 per share. The options were issued pursuant to compensatory plans or agreements with our employees and directors in reliance on Rule 701 of the Securities Act.
(3) In December 2007, NewPage Group issued 11,251,326 shares of its common stock to Stora Enso Oyj, or SEO, as part of the purchase price of the acquisition of Stora Enso North America, or SENA. The shares were issued in reliance on Section 4(2) of the Securities Act as the sale of the securities did not involve a public offering.
(4) In December 2007, NewPage Group issued $200 million in aggregate principal amount of floating rate senior unsecured PIK Notes due 2015 to SEO as part of the purchase price of the acquisition of SENA. The notes were issued in reliance on Section 4(2) of the Securities Act as the sale of the securities did not involve a public offering.
| Item 16. | Exhibits and Financial Statement Schedules. |
(a) Exhibits
| 1.1 | * | Form of Underwriting Agreement | |
| 3.1 | * | Form of Amended and Restated Certificate of Incorporation of NewPage Group Inc. | |
| 3.2 | * | Form of Amended and Restated Bylaws of NewPage Group Inc. | |
| 4.1 | *** | Form of Specimen of Common Stock certificate | |
| 4.2 | * | Securityholders Agreement, dated as of December 21, 2007, by and among Stora Enso Oyj, NewPage Group Inc., NewPage Investments LLC and the other Initial Cerberus Investor Holders named therein and the Executives named therein | |
| 5.1 | * | Opinion of Schulte Roth & Zabel LLP | |
| 10.1 | Equity and Asset Purchase Agreement, dated as of January 14, 2005, among MeadWestvaco Corporation and Maple Acquisition LLC (n/k/a Escanaba Timber LLC) (incorporated by reference from Exhibit 10.1 to the Registration Statement on Form S-4 (Reg. No. 333-129343) of NewPage Holding Corporation, filed on October 31, 2005) as amended by the First Amendment, dated as of April 22, 2005, (incorporated by reference from Exhibit 10.2 to the Registration Statement on Form S-4 (Reg. No. 333-129343) of NewPage Holding Corporation, filed on October 31, 2005) and the Second Amendment, dated as of April 30, 2005, (incorporated by reference from Exhibit 10.3 to the Registration Statement on Form S-4 (Reg. No. 333-129343) of NewPage Holding Corporation, filed on October 31, 2005) | ||
| 10.2 | Employment Letter Agreement dated May 2, 2005, by and between NewPage Corporation and Daniel A. Clark (incorporated by reference from Exhibit 10.12 to the Registration Statement on Form S-4 (Reg. No. 333-129343) of NewPage Holding Corporation, filed on October 31, 2005), as amended by Amendment No. 1 dated as of January 28, 2007 (incorporated by reference from Exhibit 10.12 to the Annual Report on Form 10-K of NewPage Holding Corporation for the year ended December 31, 2006) and Amendment No. 2 dated as of December 21, 2007 (incorporated by reference from Exhibit 10.9 to the Form 8-K of NewPage Holding Corporation filed on December 28, 2007) | ||
| 10.3 | Employment Letter Agreement dated May 2, 2005, by and between NewPage Corporation and James C. Tyrone (incorporated by reference from Exhibit 10.14 to the Registration Statement on Form S-4 (Reg. No. 333-129343) of NewPage Holding Corporation, filed on October 31, 2005), as amended by Amendment No. 1 dated as of January 28, 2007 (incorporated by reference from Exhibit 10.14 to the Annual Report on Form 10-K of NewPage Holding Corporation for the year ended December 31, 2006) and Amendment No. 2 dated as of December 21, 2007 (incorporated by reference from Exhibit 10.14 to the Form 8-K of NewPage Holding Corporation filed on December 28, 2007) | ||
II-3
Table of Contents
| 10.4 | Consulting Agreement dated May 2, 2005, by and between NewPage Corporation and Mark Suwyn (incorporated by reference from Exhibit 10.16 to the Registration Statement on Form S-4 (Reg. No. 333-129343) of NewPage Holding Corporation, filed on October 31, 2005) | ||
| 10.5 | Employment Letter Agreement dated October 6, 2005, by and between NewPage Corporation and Douglas K. Cooper (incorporated by reference from Exhibit 10.20 to the Registration Statement on Form S-4 (Reg. No. 333-129343) of NewPage Holding Corporation, filed on October 31, 2005), as amended by Amendment No. 1 dated as of January 28, 2007 (incorporated by reference from Exhibit 10.20 to the Annual Report on Form 10-K of NewPage Holding Corporation for the year ended December 31, 2006) and Amendment No. 2 dated as of December 21, 2007 (incorporated by reference from Exhibit 10.10 to the Form 8-K of NewPage Holding Corporation filed on December 28, 2007) | ||
| 10.6 | Asset Purchase Agreement dated January 6, 2006, among Brascan Power Inc., Rumford Falls Power Company and Rumford Paper Company (incorporated by reference from Exhibit 10.25 to the Amendment No. 2 to the Registration Statement on Form S-4 (Reg. No. 333-129343) of NewPage Holding Corporation, filed on January 18, 2006), as amended by Amendment No. 1 to the Asset Purchase Agreement dated as of June 7, 2006 (incorporated by reference from Exhibit 10.37 to the Amendment No. 2 to the Registration Statement on Form S-1 (Reg. No. 333-133367) of NewPage Holding Corporation, filed on June 14, 2006) | ||
| 10.7 | Asset Purchase Agreement among NewPage Corporation, Chillicothe Paper Inc. and P. H. Glatfelter Company dated February 21, 2006 (incorporated by reference from Exhibit 10.26 to the Amendment No. 3 to the Registration Statement on Form S-4 (Reg. No. 333-129343) of NewPage Holding Corporation, filed on April 17, 2006) | ||
| 10.8 | Employment Letter Agreement dated May 2, 2005, by and between NewPage Corporation and Charles J. Aardema (incorporated by reference from Exhibit 10.30 to the Amendment No. 3 to the Registration Statement on Form S-4 (Reg. No. 333-129343) of NewPage Holding Corporation, filed on April 17, 2006), as amended by Amendment No. 1 dated as of January 28, 2007 (incorporated by reference from Exhibit 10.30 to the Annual Report on Form 10-K of NewPage Holding Corporation for the year ended December 31, 2006) | ||
| 10.9 | Employment Letter Agreement dated May 2, 2005, by and between NewPage Corporation and George F. Martin (incorporated by reference from Exhibit 10.31 to the Amendment No. 3 to the Registration Statement on Form S-4 (Reg. No. 333-129343) of NewPage Holding Corporation, filed on April 17, 2006), as amended by Amendment No. 1 dated as of January 28, 2007 (incorporated by reference from Exhibit 10.31 to the Annual Report on Form 10-K of NewPage Holding Corporation for the year ended December 31, 2006) and Amendment No. 2 dated as of December 21, 2007 (incorporated by reference from Exhibit 10.11 to the Form 8-K of NewPage Holding Corporation filed on December 28, 2007) | ||
| 10.10 | Employment Agreement dated as of April 17, 2006 by and between NewPage Corporation and Mark A. Suwyn (incorporated by reference from Exhibit 10.33 to the Amendment No. 3 to the Registration Statement on Form S-4 (Reg. No. 333-129343) of NewPage Holding Corporation, filed on April 17, 2006), as amended by Amendment No. 1 dated as of December 21, 2007 (incorporated by reference from Exhibit 10.13 to the Form 8-K of NewPage Holding Corporation filed on December 28, 2007) | ||
| 10.11 | Employment Agreement dated as of April 17, 2006 by and between NewPage Corporation and Richard D. Willett, Jr. (incorporated by reference from Exhibit 10.34 to the Amendment No. 3 to the Registration Statement on Form S-4 (Reg. No. 333-129343) of NewPage Holding Corporation, filed on April 17, 2006) | ||
| 10.12 | *** | Form of Indemnification Agreement | |
| 10.13 | *** | Form of Independent Director Agreement | |
II-4
Table of Contents
| 10.14 | Employment Agreement dated as of May 2, 2005 by and between NewPage Corporation and Michael L. Marziale, as amended by letter agreement dated as of June 30, 2006, and by Amendment No. 2 dated as of January 28, 2007 (incorporated by reference from Exhibit 10.40 to the Annual Report on Form 10-K of NewPage Holding Corporation for the year ended December 31, 2006) and Amendment No. 3 dated as of December 21, 2007 (incorporated by reference from Exhibit 10.12 to the Form 8-K of NewPage Holding Corporation filed on December 28, 2007) | |
| 10.15 | Employment Agreement dated as of December 18, 2006 by and between NewPage Corporation and Jason W. Bixby (incorporated by reference from Exhibit 10.41 to the Annual Report on Form 10-K of NewPage Holding Corporation for the year ended December 31, 2006) | |
| 10.16 | Term Loan Credit and Guaranty Agreement, dated December 21, 2007, among NewPage Corporation, NewPage Holding Corporation and certain of its affiliates, the lenders party thereto, Goldman Sachs Credit Partners L.P., as Administrative Agent, and the other parties thereto (incorporated by reference from Exhibit 10.1 to the Form 8-K of NewPage Holding Corporation filed on December 28, 2007) | |
| 10.17 | Revolving Credit and Guaranty Agreement, dated December 21, 2007, among NewPage Corporation, NewPage Holding Corporation, certain subsidiaries of NewPage Corporation, lenders party thereto, Goldman Sachs Credit Partners L.P., as Administrative Agent, JPMorgan Chase Bank, N.A., as Collateral Agent, and the other parties thereto (incorporated by reference from Exhibit 10.2 to the Form 8-K of NewPage Holding Corporation filed on December 28, 2007) | |
| 10.18 | Priority Lien Debt Pledge and Security Agreement, dated December 21, 2007, among NewPage Corporation and certain of its affiliates and The Bank of New York (incorporated by reference from Exhibit 10.3 to the Form 8-K of NewPage Holding Corporation filed on December 28, 2007) | |
| 10.19 | Revolving Credit Pledge and Security Agreement, dated December 21, 2007, among NewPage Corporation and certain of its affiliates and JPMorgan Chase Bank, N.A. (incorporated by reference from Exhibit 10.4 to the Form 8-K of NewPage Holding Corporation filed on December 28, 2007) | |
| 10.20 | Stock Purchase Agreement by and among Stora Enso Oyj, Stora Enso North America, Inc. and NewPage Holding Corporation, dated as of September 20, 2007 (incorporated by reference from Exhibit 10.1 to the Quarterly Report on Form 10-Q for the quarter ended September 30, 2007), as amended by the First Amendment, dated as of on December 21, 2007 (incorporated by reference from Exhibit 10.15 to the Form 8-K of NewPage Holding Corporation filed on December 28, 2007) | |
| 10.21 | Intercreditor Agreement, dated as of May 2, 2005 among NewPage Corporation, NewPage Holding Corporation, certain subsidiaries of NewPage Corporation, JPMorgan Chase Bank, N.A., as revolving loan collateral agent and The Bank of New York, as collateral trustee (incorporated by reference from Exhibit 4.9 to the Registration Statement on Form S-4 (Reg. No. 333-125952) of NewPage Corporation, filed on June 20, 2005) | |
| 10.22 | Separation Letter Agreement dated July 27, 2007, by and between NewPage Corporation and Charles J. Aardema (incorporated by reference from Exhibit 10.2 to the Quarterly Report on Form 10-Q of NewPage Holding Corporation for the quarter ended September 30, 2007) | |
| 10.23 | Employment Agreement dated as of November 1, 2007 by and between NewPage Corporation and Michael T. Edicola (incorporated by reference from Exhibit 10.27 to the Annual Report on Form 10-K of NewPage Holding Corporation for the year ended December 31, 2007) | |
II-5
Table of Contents
| 10.24 | Separation Letter Agreement dated December 21, 2007, by and between NewPage Corporation and James C. Tyrone (incorporated by reference from Exhibit 10.28 to the Annual Report on Form 10-K of NewPage Holding Corporation for the year ended December 31, 2007) | ||
| 10.25 | *** | NewPage Group Inc. 2008 Incentive Plan | |
| 10.26 | ** | NewPage Group Inc. Rollover Equity Incentive Plan | |
| 10.27 | ** | Form of Equity Exchange and Restricted Stock Agreement by and between NewPage Group Inc. and the Executive named therein | |
| 10.28 | ** | Form of Rollover Nonqualified Stock Option Agreement between NewPage Group Inc. and the Participant named therein | |
| 10.29 | ** | Form of Nonqualified Stock Option Agreement between NewPage Group Inc. and the Participant named therein | |
| 10.30 | Indenture for the Floating Rate Senior Secured Notes due 2012 dated as of May 2, 2005 by and among NewPage Corporation, the guarantors named herein and HSBC Bank USA, National Association, as Trustee (incorporated by reference from Exhibit 4.1 to the Registration Statement on Form S-4 (Reg. No. 333-125952) of NewPage Corporation, filed on June 20, 2005), as supplemented dated December 21, 2007 (incorporated by reference from Exhibit 10.7 to the Form 8-K filed on December 28, 2007) | ||
| 10.31 | Indenture for the 10% Senior Secured Notes due 2012 dated as of May 2, 2005 among NewPage Corporation, as Issuer, the guarantors named herein, HSBC Bank USA, National Association, as Trustee (incorporated by reference from Exhibit 4.2 to the Registration Statement on Form S-4 (Reg. No. 333-125952) of NewPage Corporation, filed on June 20, 2005), as supplemented dated December 21, 2007 (incorporated by reference from Exhibit 10.5 to the Form 8-K filed on December 28, 2007) | ||
| 10.32 | Indenture for the 12% Senior Subordinated Notes due 2013 dated as of May 2, 2005 among NewPage Corporation, the guarantors named herein and HSBC Bank USA, National Association, as Trustee (incorporated by reference from Exhibit 4.3 to the Registration Statement on Form S-4 (Reg. No. 333-125952) of NewPage Corporation, filed on June 20, 2005), as supplemented dated December 21, 2007 (incorporated by reference from Exhibit 10.8 to the Form 8-K filed on December 28, 2007) | ||
| 10.33 | Collateral Trust Agreement dated as of May 2, 2005 among NewPage Corporation, the Pledgors from time to time party thereto, Goldman Sachs Credit Partners L.P., HSBC Bank USA, National Association, and The Bank of New York (incorporated by reference from Exhibit 4.10 to the Registration Statement on Form S-4 (Reg. No. 333-125952) of NewPage Corporation, filed on June 20, 2005) | ||
| 10.34 | Priority Lien Debt Pledge and Security Agreement, dated December 21, 2007, among NewPage Corporation and certain of its affiliates and The Bank of New York (incorporated by reference from Exhibit 10.3 to the Form 8-K of NewPage Corporation filed on December 28, 2007) | ||
| 10.35 | *** | Confidentiality Agreement dated as of January 22, 2008 between NewPage Group Inc. and Charles E. Long | |
| 21.1 | ** | Subsidiaries of the registrant | |
| 23.1 | Consent of PricewaterhouseCoopers LLP | ||
| 23.2 | Consent of PricewaterhouseCoopers LLP | ||
| 23.3 | * | Consent of Schulte Roth & Zabel LLP (incorporated by reference in Exhibit 5.1) | |
| 24.1 | ** | Power of Attorney (included on Signature Page of initial filing) | |
| 99.1 | ** | Consent of Resource Information Systems, Inc. | |
| * | To be filed by amendment |
| ** | Previously filed on May 5, 2008 as an exhibit to the Registrant’s Registration Statement on Form S-1. |
| *** | Previously filed on July 14, 2008 as an exhibit to Amendment No. 1 to the Registrant’s Registration Statement on Form S-1. |
II-6
Table of Contents
(b) Financial Statement Schedules
None.
| Item 17. | Undertakings. |
The undersigned Registrant hereby undertakes:
(1) To provide to the underwriter at the closing specified in the underwriting agreement, certificates in such denominations and registered in such names as required by the underwriter to permit prompt delivery to each purchaser.
(2) That, for the purposes of determining any liability under the Securities Act, the information omitted from the form of prospectus filed as a part of this registration statement in reliance upon Rule 430A and conformed in a form of prospectus filed by the registrant pursuant to Rule 424(b)(1) or (4) or 497(h) under the Securities Act shall be deemed to be part of this registration statement as of the time it was declared effective.
(3) That, for the purpose of determining any liability under the Securities Act, each post-effective amendment that contains a form of prospectus shall be deemed to be a new registration statement relating to the security offered therein, and the offering of such securities of such form shall be deemed to be the initial bona fide offering thereof.
Insofar as indemnification for liabilities arising under the Securities Act may be permitted to directors, officers and controlling persons of the Registrant pursuant to the foregoing provisions, or otherwise, the Registrant has been advised that in the opinion of the SEC, such indemnification is against public policy as expressed in the Securities Act and is, therefore, unenforceable. In the event that a claim for indemnification against such liabilities (other than the payment by the Registrant of expenses incurred or paid by a director, officer or controlling person of the Registrant in the successful defense of any action, suit or proceeding) is asserted by such director, officer or controlling person in connection with the securities being registered, the Registrant will, unless in the opinion of its counsel the matter has been settled by controlling precedent, submit to a court of appropriate jurisdiction the question whether such indemnification by it is against public policy as expressed in the Securities Act and will be governed by the final adjudication of such issue.
II-7
Table of Contents
SIGNATURES
Pursuant to the requirements of the Securities Act of 1933, NewPage Group Inc. has duly caused this registration statement to be signed on its behalf by the undersigned, thereunto duly authorized, in the City of Miamisburg, State of Ohio, on the 20th day of August 2008.
| NEWPAGE GROUP INC. | ||
By: | /s/ MARK A. SUWYN | |
| Name: | Mark A. Suwyn | |
| Title: | Chief Executive Officer | |
Date: August 20, 2008
Pursuant to the requirements of the Securities Act of 1933, this registration statement has been signed below by the following persons in the capacities and on the date indicated.
Signature | Title | Date | ||
/s/ MARK A. SUWYN Mark A. Suwyn | Chief Executive Officer and Director (Principal Executive Officer) | August 20, 2008 | ||
/s/ JASON W. BIXBY Jason W. Bixby | Senior Vice President, Chief Financial Officer and Assistant Secretary (Principal Financial Officer) | August 20, 2008 | ||
/s/ STEPHEN A. DELONG Stephen A. DeLong | Controller and Chief Accounting Officer (Principal Accounting Officer) | August 20, 2008 | ||
* Robert M. Armstrong | Director | August 20, 2008 | ||
* Charles E. Long | Director | August 20, 2008 | ||
* David J. Prystash | Director | August 20, 2008 | ||
* James R. Renna | Director | August 20, 2008 | ||
* John W. Sheridan | Director | August 20, 2008 | ||
* Lenard B. Tessler | Director | August 20, 2008 | ||
* Michael S. Williams | Director | August 20, 2008 | ||
II-8
Table of Contents
Signature | Title | Date | ||
* Alexander M. Wolf | Director | August 20, 2008 | ||
* George J. Zahringer, III | Director | August 20, 2008 | ||
*By: | /S/ JASON W. BIXBY | |
Jason W. Bixby Attorney-in-fact | ||
II-9
Table of Contents
EXHIBIT INDEX
| 1.1 | * | Form of Underwriting Agreement | |
| 3.1 | * | Form of Amended and Restated Certificate of Incorporation of NewPage Group Inc. | |
| 3.2 | * | Form of Amended and Restated Bylaws of NewPage Group Inc. | |
| 4.1 | *** | Form of Specimen of Common Stock certificate | |
| 4.2 | * | Securityholders Agreement, dated as of December 21, 2007, by and among Stora Enso Oyj, NewPage Group Inc., NewPage Investments LLC and the other Initial Cerberus Investor Holders named therein and the Executives named therein | |
| 5.1 | * | Opinion of Schulte Roth & Zabel LLP | |
| 10.1 | Equity and Asset Purchase Agreement, dated as of January 14, 2005, among MeadWestvaco Corporation and Maple Acquisition LLC (n/k/a Escanaba Timber LLC) (incorporated by reference from Exhibit 10.1 to the Registration Statement on Form S-4 (Reg. No. 333-129343) of NewPage Holding Corporation, filed on October 31, 2005) as amended by the First Amendment, dated as of April 22, 2005, (incorporated by reference from Exhibit 10.2 to the Registration Statement on Form S-4 (Reg. No. 333-129343) of NewPage Holding Corporation, filed on October 31, 2005) and the Second Amendment, dated as of April 30, 2005, (incorporated by reference from Exhibit 10.3 to the Registration Statement on Form S-4 (Reg. No. 333-129343) of NewPage Holding Corporation, filed on October 31, 2005) | ||
| 10.2 | Employment Letter Agreement dated May 2, 2005, by and between NewPage Corporation and Daniel A. Clark (incorporated by reference from Exhibit 10.12 to the Registration Statement on Form S-4 (Reg. No. 333-129343) of NewPage Holding Corporation, filed on October 31, 2005), as amended by Amendment No. 1 dated as of January 28, 2007 (incorporated by reference from Exhibit 10.12 to the Annual Report on Form 10-K of NewPage Holding Corporation for the year ended December 31, 2006) and Amendment No. 2 dated as of December 21, 2007 (incorporated by reference from Exhibit 10.9 to the Form 8-K of NewPage Holding Corporation filed on December 28, 2007) | ||
| 10.3 | Employment Letter Agreement dated May 2, 2005, by and between NewPage Corporation and James C. Tyrone (incorporated by reference from Exhibit 10.14 to the Registration Statement on Form S-4 (Reg. No. 333-129343) of NewPage Holding Corporation, filed on October 31, 2005), as amended by Amendment No. 1 dated as of January 28, 2007 (incorporated by reference from Exhibit 10.14 to the Annual Report on Form 10-K of NewPage Holding Corporation for the year ended December 31, 2006) and Amendment No. 2 dated as of December 21, 2007 (incorporated by reference from Exhibit 10.14 to the Form 8-K of NewPage Holding Corporation filed on December 28, 2007) | ||
| 10.4 | Consulting Agreement dated May 2, 2005, by and between NewPage Corporation and Mark Suwyn (incorporated by reference from Exhibit 10.16 to the Registration Statement on Form S-4 (Reg. No. 333-129343) of NewPage Holding Corporation, filed on October 31, 2005) | ||
| 10.5 | Employment Letter Agreement dated October 6, 2005, by and between NewPage Corporation and Douglas K. Cooper (incorporated by reference from Exhibit 10.20 to the Registration Statement on Form S-4 (Reg. No. 333-129343) of NewPage Holding Corporation, filed on October 31, 2005), as amended by Amendment No. 1 dated as of January 28, 2007 (incorporated by reference from Exhibit 10.20 to the Annual Report on Form 10-K of NewPage Holding Corporation for the year ended December 31, 2006) and Amendment No. 2 dated as of December 21, 2007 (incorporated by reference from Exhibit 10.10 to the Form 8-K of NewPage Holding Corporation filed on December 28, 2007) | ||
Table of Contents
| 10.6 | Asset Purchase Agreement dated January 6, 2006, among Brascan Power Inc., Rumford Falls Power Company and Rumford Paper Company (incorporated by reference from Exhibit 10.25 to the Amendment No. 2 to the Registration Statement on Form S-4 (Reg. No. 333-129343) of NewPage Holding Corporation, filed on January 18, 2006), as amended by Amendment No. 1 to the Asset Purchase Agreement dated as of June 7, 2006 (incorporated by reference from Exhibit 10.37 to the Amendment No. 2 to the Registration Statement on Form S-1 (Reg. No. 333-133367) of NewPage Holding Corporation, filed on June 14, 2006) | ||
| 10.7 | Asset Purchase Agreement among NewPage Corporation, Chillicothe Paper Inc. and P. H. Glatfelter Company dated February 21, 2006 (incorporated by reference from Exhibit 10.26 to the Amendment No. 3 to the Registration Statement on Form S-4 (Reg. No. 333-129343) of NewPage Holding Corporation, filed on April 17, 2006) | ||
| 10.8 | Employment Letter Agreement dated May 2, 2005, by and between NewPage Corporation and Charles J. Aardema (incorporated by reference from Exhibit 10.30 to the Amendment No. 3 to the Registration Statement on Form S-4 (Reg. No. 333-129343) of NewPage Holding Corporation, filed on April 17, 2006), as amended by Amendment No. 1 dated as of January 28, 2007 (incorporated by reference from Exhibit 10.30 to the Annual Report on Form 10-K of NewPage Holding Corporation for the year ended December 31, 2006) | ||
| 10.9 | Employment Letter Agreement dated May 2, 2005, by and between NewPage Corporation and George F. Martin (incorporated by reference from Exhibit 10.31 to the Amendment No. 3 to the Registration Statement on Form S-4 (Reg. No. 333-129343) of NewPage Holding Corporation, filed on April 17, 2006), as amended by Amendment No. 1 dated as of January 28, 2007 (incorporated by reference from Exhibit 10.31 to the Annual Report on Form 10-K of NewPage Holding Corporation for the year ended December 31, 2006) and Amendment No. 2 dated as of December 21, 2007 (incorporated by reference from Exhibit 10.11 to the Form 8-K of NewPage Holding Corporation filed on December 28, 2007) | ||
| 10.10 | Employment Agreement dated as of April 17, 2006 by and between NewPage Corporation and Mark A. Suwyn (incorporated by reference from Exhibit 10.33 to the Amendment No. 3 to the Registration Statement on Form S-4 (Reg. No. 333-129343) of NewPage Holding Corporation, filed on April 17, 2006), as amended by Amendment No. 1 dated as of December 21, 2007 (incorporated by reference from Exhibit 10.13 to the Form 8-K of NewPage Holding Corporation filed on December 28, 2007) | ||
| 10.11 | Employment Agreement dated as of April 17, 2006 by and between NewPage Corporation and Richard D. Willett, Jr. (incorporated by reference from Exhibit 10.34 to the Amendment No. 3 to the Registration Statement on Form S-4 (Reg. No. 333-129343) of NewPage Holding Corporation, filed on April 17, 2006) | ||
| 10.12 | *** | Form of Indemnification Agreement | |
| 10.13 | *** | Form of Independent Director Agreement | |
| 10.14 | Employment Agreement dated as of May 2, 2005 by and between NewPage Corporation and Michael L. Marziale, as amended by letter agreement dated as of June 30, 2006, and by Amendment No. 2 dated as of January 28, 2007 (incorporated by reference from Exhibit 10.40 to the Annual Report on Form 10-K of NewPage Holding Corporation for the year ended December 31, 2006) and Amendment No. 3 dated as of December 21, 2007 (incorporated by reference from Exhibit 10.12 to the Form 8-K of NewPage Holding Corporation filed on December 28, 2007) | ||
| 10.15 | Employment Agreement dated as of December 18, 2006 by and between NewPage Corporation and Jason W. Bixby (incorporated by reference from Exhibit 10.41 to the Annual Report on Form 10-K of NewPage Holding Corporation for the year ended December 31, 2006) | ||
Table of Contents
| 10.16 | Term Loan Credit and Guaranty Agreement, dated December 21, 2007, among NewPage Corporation, NewPage Holding Corporation and certain of its affiliates, the lenders party thereto, Goldman Sachs Credit Partners L.P., as Administrative Agent, and the other parties thereto (incorporated by reference from Exhibit 10.1 to the Form 8-K of NewPage Holding Corporation filed on December 28, 2007) | ||
| 10.17 | Revolving Credit and Guaranty Agreement, dated December 21, 2007, among NewPage Corporation, NewPage Holding Corporation, certain subsidiaries of NewPage Corporation, lenders party thereto, Goldman Sachs Credit Partners L.P., as Administrative Agent, JPMorgan Chase Bank, N.A., as Collateral Agent, and the other parties thereto (incorporated by reference from Exhibit 10.2 to the Form 8-K of NewPage Holding Corporation filed on December 28, 2007) | ||
| 10.18 | Priority Lien Debt Pledge and Security Agreement, dated December 21, 2007, among NewPage Corporation and certain of its affiliates and The Bank of New York (incorporated by reference from Exhibit 10.3 to the Form 8-K of NewPage Holding Corporation filed on December 28, 2007) | ||
| 10.19 | Revolving Credit Pledge and Security Agreement, dated December 21, 2007, among NewPage Corporation and certain of its affiliates and JPMorgan Chase Bank, N.A. (incorporated by reference from Exhibit 10.4 to the Form 8-K of NewPage Holding Corporation filed on December 28, 2007) | ||
| 10.20 | Stock Purchase Agreement by and among Stora Enso Oyj, Stora Enso North America, Inc. and NewPage Holding Corporation, dated as of September 20, 2007 (incorporated by reference from Exhibit 10.1 to the Quarterly Report on Form 10-Q for the quarter ended September 30, 2007), as amended by the First Amendment, dated as of on December 21, 2007 (incorporated by reference from Exhibit 10.15 to the Form 8-K of NewPage Holding Corporation filed on December 28, 2007) | ||
| 10.21 | Intercreditor Agreement, dated as of May 2, 2005 among NewPage Corporation, NewPage Holding Corporation, certain subsidiaries of NewPage Corporation, JPMorgan Chase Bank, N.A., as revolving loan collateral agent and The Bank of New York, as collateral trustee (incorporated by reference from Exhibit 4.9 to the Registration Statement on Form S-4 (Reg. No. 333-125952) of NewPage Corporation, filed on June 20, 2005) | ||
| 10.22 | Separation Letter Agreement dated July 27, 2007, by and between NewPage Corporation and Charles J. Aardema (incorporated by reference from Exhibit 10.2 to the Quarterly Report on Form 10-Q of NewPage Holding Corporation for the quarter ended September 30, 2007) | ||
| 10.23 | Employment Agreement dated as of November 1, 2007 by and between NewPage Corporation and Michael T. Edicola (incorporated by reference from Exhibit 10.27 to the Annual Report on Form 10-K of NewPage Holding Corporation for the year ended December 31, 2007) | ||
| 10.24 | Separation Letter Agreement dated December 21, 2007, by and between NewPage Corporation and James C. Tyrone (incorporated by reference from Exhibit 10.28 to the Annual Report on Form 10-K of NewPage Holding Corporation for the year ended December 31, 2007) | ||
| 10.25 | *** | NewPage Group Inc. 2008 Incentive Plan | |
| 10.26 | ** | NewPage Group Inc. Rollover Equity Incentive Plan | |
| 10.27 | ** | Form of Equity Exchange and Restricted Stock Agreement by and between NewPage Group Inc. and the Executive named therein | |
| 10.28 | ** | Form of Rollover Nonqualified Stock Option Agreement between NewPage Group Inc. and the Participant named therein | |
| 10.29 | ** | Form of Nonqualified Stock Option Agreement between NewPage Group Inc. and the Participant named therein | |
Table of Contents
| 10.30 | Indenture for the Floating Rate Senior Secured Notes due 2012 dated as of May 2, 2005 by and among NewPage Corporation, the guarantors named herein and HSBC Bank USA, National Association, as Trustee (incorporated by reference from Exhibit 4.1 to the Registration Statement on Form S-4 (Reg. No. 333-125952) of NewPage Corporation, filed on June 20, 2005), as supplemented dated December 21, 2007 (incorporated by reference from Exhibit 10.7 to the Form 8-K filed on December 28, 2007) | ||
| 10.31 | Indenture for the 10% Senior Secured Notes due 2012 dated as of May 2, 2005 among NewPage Corporation, as Issuer, the guarantors named herein, HSBC Bank USA, National Association, as Trustee (incorporated by reference from Exhibit 4.2 to the Registration Statement on Form S-4 (Reg. No. 333-125952) of NewPage Corporation, filed on June 20, 2005), as supplemented dated December 21, 2007 (incorporated by reference from Exhibit 10.5 to the Form 8-K filed on December 28, 2007) | ||
| 10.32 | Indenture for the 12% Senior Subordinated Notes due 2013 dated as of May 2, 2005 among NewPage Corporation, the guarantors named herein and HSBC Bank USA, National Association, as Trustee (incorporated by reference from Exhibit 4.3 to the Registration Statement on Form S-4 (Reg. No. 333-125952) of NewPage Corporation, filed on June 20, 2005), as supplemented dated December 21, 2007 (incorporated by reference from Exhibit 10.8 to the Form 8-K filed on December 28, 2007) | ||
| 10.33 | Collateral Trust Agreement dated as of May 2, 2005 among NewPage Corporation, the Pledgors from time to time party thereto, Goldman Sachs Credit Partners L.P., HSBC Bank USA, National Association, and The Bank of New York (incorporated by reference from Exhibit 4.10 to the Registration Statement on Form S-4 (Reg. No. 333-125952) of NewPage Corporation, filed on June 20, 2005) | ||
| 10.34 | Priority Lien Debt Pledge and Security Agreement, dated December 21, 2007, among NewPage Corporation and certain of its affiliates and The Bank of New York (incorporated by reference from Exhibit 10.3 to the Form 8-K of NewPage Corporation filed on December 28, 2007) | ||
| 10.35 | *** | Confidentiality Agreement dated as of January 22, 2008 between NewPage Group Inc. and Charles E. Long | |
| 21.1** | Subsidiaries of the registrant | ||
| 23.1 | Consent of PricewaterhouseCoopers LLP | ||
| 23.2 | Consent of PricewaterhouseCoopers LLP | ||
| 23.3* | Consent of Schulte Roth & Zabel LLP (incorporated by reference in Exhibit 5.1) | ||
| 24.1** | Power of Attorney (included on Signature Page of initial filing) | ||
| 99.1** | Consent of Resource Information Systems, Inc. | ||
| * | To be filed by amendment |
| ** | Previously filed on May 5, 2008 as an exhibit to the Registrant’s Registration Statement on Form S-1. |
| *** | Previously filed on July 14, 2008 as an exhibit to Amendment No. 1 to the Registrant’s Registration Statement on Form S-1. |