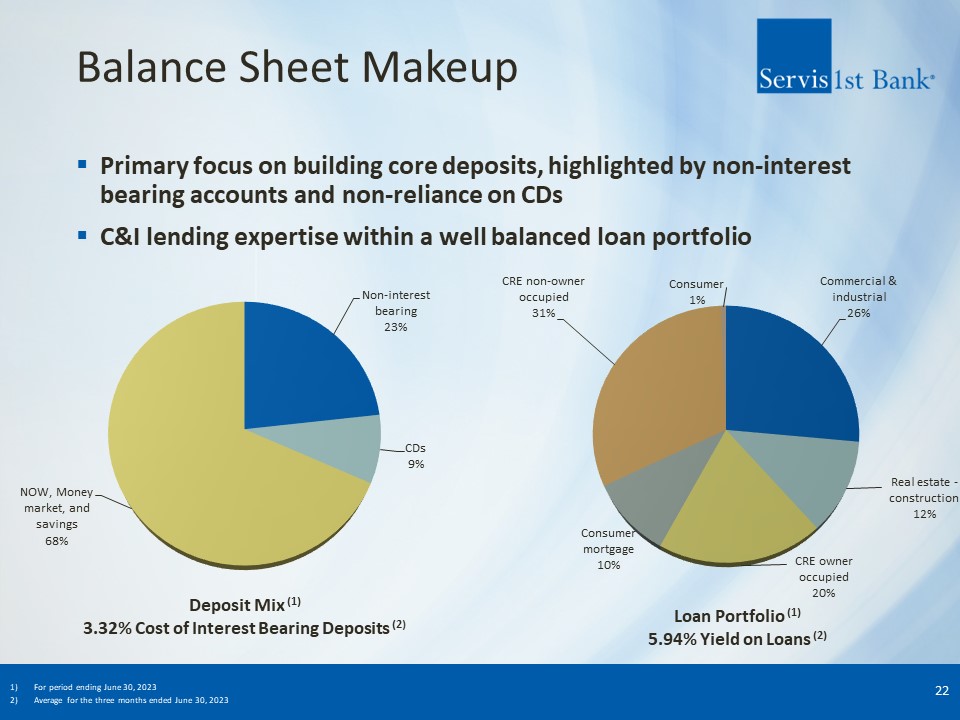
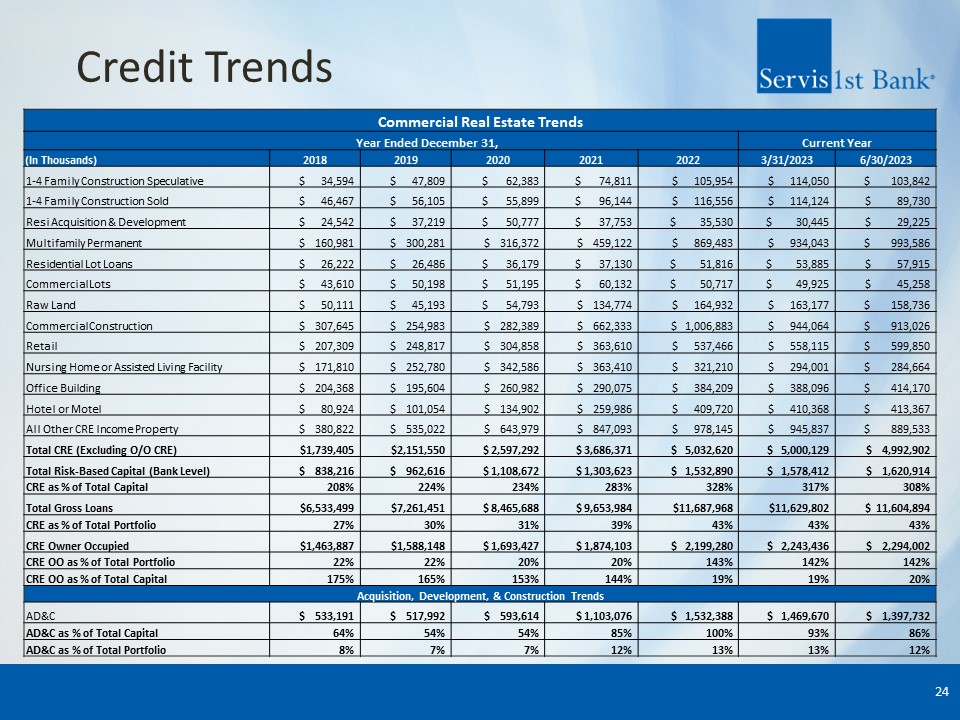
Credit Trends 24 Commercial Real Estate Trends Year Ended December 31, Current Year (In Thousands) 2018 2019 2020 2021 2022 3/31/2023 6/30/2023 1-4 Family Construction Speculative $ 34,594 $ 47,809 $ 62,383 $ 74,811 $ 105,954 $ 114,050 $ 103,842 1-4 Family Construction Sold $ 46,467 $ 56,105 $ 55,899 $ 96,144 $ 116,556 $ 114,124 $ 89,730 Resi Acquisition & Development $ 24,542 $ 37,219 $ 50,777 $ 37,753 $ 35,530 $ 30,445 $ 29,225 Multifamily Permanent $ 160,981 $ 300,281 $ 316,372 $ 459,122 $ 869,483 $ 934,043 $ 993,586 Residential Lot Loans $ 26,222 $ 26,486 $ 36,179 $ 37,130 $ 51,816 $ 53,885 $ 57,915 Commercial Lots $ 43,610 $ 50,198 $ 51,195 $ 60,132 $ 50,717 $ 49,925 $ 45,258 Raw Land $ 50,111 $ 45,193 $ 54,793 $ 134,774 $ 164,932 $ 163,177 $ 158,736 Commercial Construction $ 307,645 $ 254,983 $ 282,389 $ 662,333 $ 1,006,883 $ 944,064 $ 913,026 Retail $ 207,309 $ 248,817 $ 304,858 $ 363,610 $ 537,466 $ 558,115 $ 599,850 Nursing Home or Assisted Living Facility $ 171,810 $ 252,780 $ 342,586 $ 363,410 $ 321,210 $ 294,001 $ 284,664 Office Building $ 204,368 $ 195,604 $ 260,982 $ 290,075 $ 384,209 $ 388,096 $ 414,170 Hotel or Motel $ 80,924 $ 101,054 $ 134,902 $ 259,986 $ 409,720 $ 410,368 $ 413,367 All Other CRE Income Property $ 380,822 $ 535,022 $ 643,979 $ 847,093 $ 978,145 $ 945,837 $ 889,533 Total CRE (Excluding O/O CRE) $1,739,405 $2,151,550 $ 2,597,292 $ 3,686,371 $ 5,032,620 $ 5,000,129 $ 4,992,902 Total Risk-Based Capital (Bank Level) $ 838,216 $ 962,616 $ 1,108,672 $ 1,303,623 $ 1,532,890 $ 1,578,412 $ 1,620,914 CRE as % of Total Capital 208% 224% 234% 283% 328% 317% 308% Total Gross Loans $6,533,499 $7,261,451 $ 8,465,688 $ 9,653,984 $11,687,968 $11,629,802 $ 11,604,894 CRE as % of Total Portfolio 27% 30% 31% 39% 43% 43% 43% CRE Owner Occupied $1,463,887 $1,588,148 $ 1,693,427 $ 1,874,103 $ 2,199,280 $ 2,243,436 $ 2,294,002 CRE OO as % of Total Portfolio 22% 22% 20% 20% 143% 142% 142% CRE OO as % of Total Capital 175% 165% 153% 144% 19% 19% 20% Acquisition, Development, & Construction Trends AD&C $ 533,191 $ 517,992 $ 593,614 $ 1,103,076 $ 1,532,388 $ 1,469,670 $ 1,397,732 AD&C as % of Total Capital 64% 54% 54% 85% 100% 93% 86% AD&C as % of Total Portfolio 8% 7% 7% 12% 13% 13% 12%