Exhibit 99.1
February 13, 2017NYSE MKT: GIG GigPeak Q4 FY16 Corporate Summary
Additional Information and Where to Find It:This presentation does not constitute an offer to sell or the solicitation of an offer to buy any securities. The tender offer for the outstanding shares of GigPeak’s common stock described in the separate GigPeak press releases has not commenced. At the time the tender offer is commenced, IDT will file or cause to be filed a Tender Offer Statement on Schedule TO with the SEC and GigPeak will file a Solicitation/Recommendation Statement on Schedule 14D-9 with the SEC related to the tender offer. The Tender Offer Statement (including an Offer to Purchase, a related Letter of Transmittal and other tender offer documents) and the Solicitation/Recommendation Statement will contain important information that should be read carefully before any decision is made with respect to the tender offer. Those materials will be made available to GigPeak’s stockholders at no expense to them by the information agent to the tender offer, which will be announced. In addition, all of those materials (and any other documents filed with the SEC) will be available at no charge on the SEC’s website at www.sec.gov.Forward Looking Statements: This presentation contains statements regarding the anticipated consummation of the acquisition of GigPeak and the timing and benefits thereof, operating trends; expected future results and guidance; GigPeak’s and its subsidiaries’ expansion and business strategies into new markets and projects; anticipated growth opportunities; changes in business or other market conditions and product trends that are forward-looking. We undertake no obligation to update or revise the forward-looking statements, whether as a result of new information, future events or otherwise. Additional factors that could cause actual results to differ are discussed under the heading "Risk Factors" and in other sections of the GigPeak filings with the SEC, and in GigPeak’s other current and periodic reports filed or furnished from time to time with the SEC. Disclaimer 2
Use of Non-GAAP and Adjusted EBITDA Financial Measures:These materials include references to non-GAAP net income/loss, adjusted consolidated non-GAAP net income/loss, and Adjusted EBITDA. Adjusted EBITDA is defined as net earnings before interest, taxes, other expense (income), net, depreciation and amortization, including amortization of intangibles, stock-based compensation, acquisition and strategic activities related costs and loss on equity method investment. Adjusted EBITDA differs from net earnings, as calculated in accordance with GAAP, in that it excludes the foregoing items. GigPeak believes that these non-GAAP financial measures are important indicators of the ongoing operations of its business, provide an additional metric for comparability between reporting periods, and provide an additional baseline for analyzing trends in GigPeak’s operations. In addition, Adjusted EBITDA is used in determining compliance with covenants in our term loan and revolving line agreement. GigPeak does not, nor does it suggest that investors should, consider such non-GAAP and Adjusted EBITDA financial measures in isolation from, or as a substitute for, financial information prepared in accordance with GAAP. GigPeak believes the disclosure of the effects of these items increases the reader’s understanding of, and an enhanced level of transparency into, the underlying performance of the business and that such non-GAAP and Adjusted EBITDA financial measures provide investors with a supplemental tool to evaluate our financial results and assess our prospects for future performance.Intellectual Property:All trademarks, service marks and trade names of GigPeak, Inc. used herein are trademarks or registered trademarks of GigPeak, Inc. Any other product, company names, or logos mentioned herein are the trademarks and/or property of their respective owners. Disclaimer 3
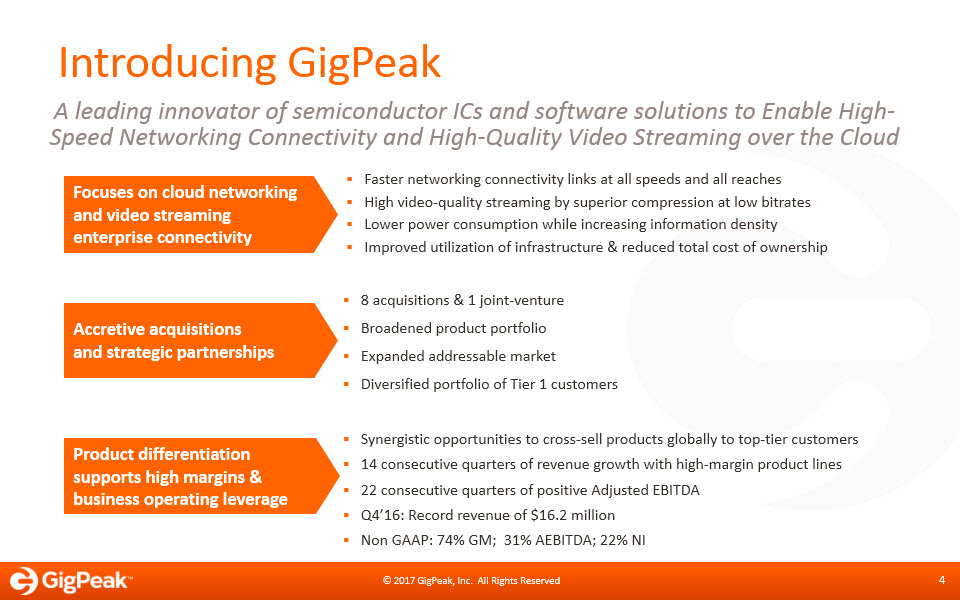
Introducing GigPeak 4 A leading innovator of semiconductor ICs and software solutions to Enable High-Speed Networking Connectivity and High-Quality Video Streaming over the Cloud Faster networking connectivity links at all speeds and all reaches High video-quality streaming by superior compression at low bitrates Lower power consumption while increasing information density Improved utilization of infrastructure & reduced total cost of ownership Focuses on cloud networking and video streaming enterprise connectivity Accretive acquisitions and strategic partnerships Product differentiation supports high margins & business operating leverage 8 acquisitions & 1 joint-venture Broadened product portfolioExpanded addressable marketDiversified portfolio of Tier 1 customers Synergistic opportunities to cross-sell products globally to top-tier customers14 consecutive quarters of revenue growth with high-margin product lines22 consecutive quarters of positive Adjusted EBITDAQ4’16: Record revenue of $16.2 millionNon GAAP: 74% GM; 31% AEBITDA: 22% NI

A leading innovator of semiconductor ICs and software solutions to Enable High-Speed Networking Connectivity and High-Quality Video Streaming over the Cloud GigPeak Focused Mission 5 BASE STATIONBACKHAUL METRO ROUTERS CORE ROUTERS NETWORKING APPLICATIONS CLOUD CONNECTED APPLICATIONS SUBMARINE NETWORKS SATELLITEGROUNDSTATION SATELLITE COMMUNICATION AIRBORNE COMMUNICATION ENTERPRISE& DATA CENTER ACCESS Multi-Screen Video STREAMING APPLICATIONS

GigPeak Growth History 6 20%+Revenue CAGRfrom 2009 – 2015 ($ in millions) Telecom PMD Video compression solutions Datacom PMD High speed ASIC GNSS/IoT RF devices Wireless devices Datacom PMD 72 High-Speed & HQ Cloud Connectivity = Networking + Video Streaming
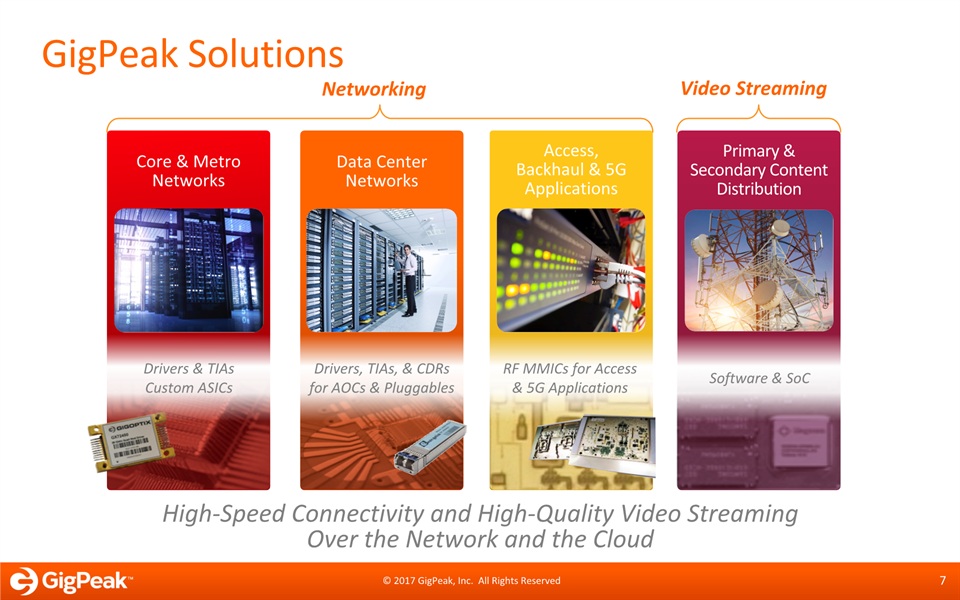
High-Speed Connectivity and High-Quality Video StreamingOver the Network and the Cloud GigPeak Solutions 7 Data Center Networks Drivers, TIAs, & CDRs for AOCs & Pluggables Core & Metro Networks Drivers & TIAsCustom ASICs Access,Backhaul & 5G Applications RF MMICs for Access & 5G Applications Networking Primary & Secondary Content Distribution Software & SoC Video Streaming
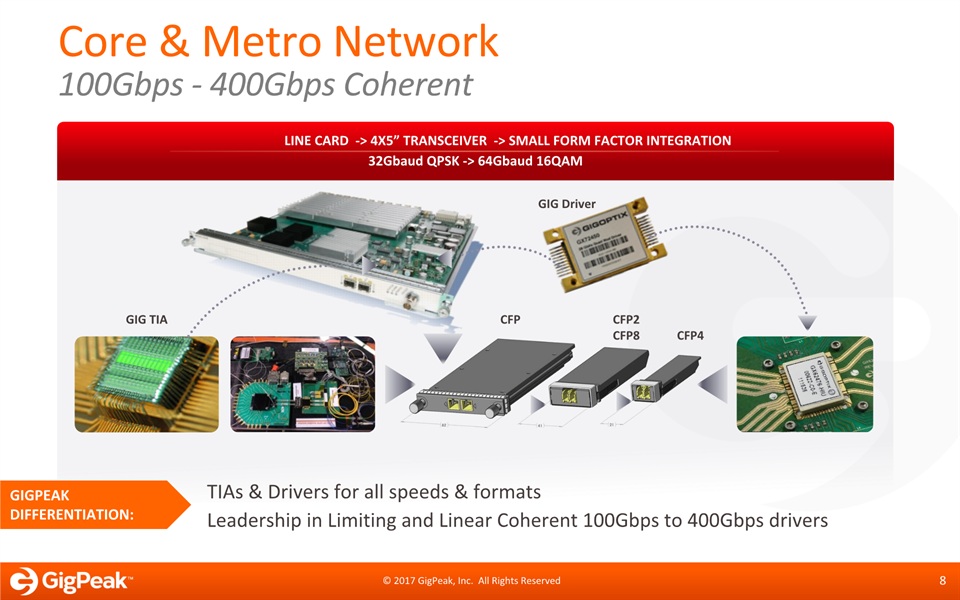
GIG Driver GIG TIA Core & Metro Network 100Gbps - 400Gbps Coherent 8 Line Card -> 4x5” Transceiver -> Small Form Factor integration32Gbaud QPSK -> 64Gbaud 16QAM TIAs & Drivers for all speeds & formatsLeadership in Limiting and Linear Coherent 100Gbps to 400Gbps drivers GigPeakDifferentiation: CFP CFP2CFP8 CFP4

Devices for Parallel Optics Links1x/4x/12x channels for nrz 10, 14 & 28Gbps / channel 1x/4x channels for pam4 56Gbps / channel TIA IC PD ARRAY VD IC VD IC TIA IC VCSEL ARRAY VCSEL ARRAY PD ARRAY LENS ARRAY LENS ARRAY LENS ARRAY LENS ARRAY CDR ARRAY CDR ARRAY CDR ARRAY CDR ARRAY Data Center Communication Meaningful Footprint in the Data Center Links 9 40Gbps ICs - Sole merchant supplier of this technology, which will dominate the industry for the next few years 100Gbps ICs– complete product portfolio for SFP+ and QSFP28 SR & LR ModulesPSM4 ICs - First in the market to offer for 200Gbps DC intra-connect market GigPeakDifferentiation:
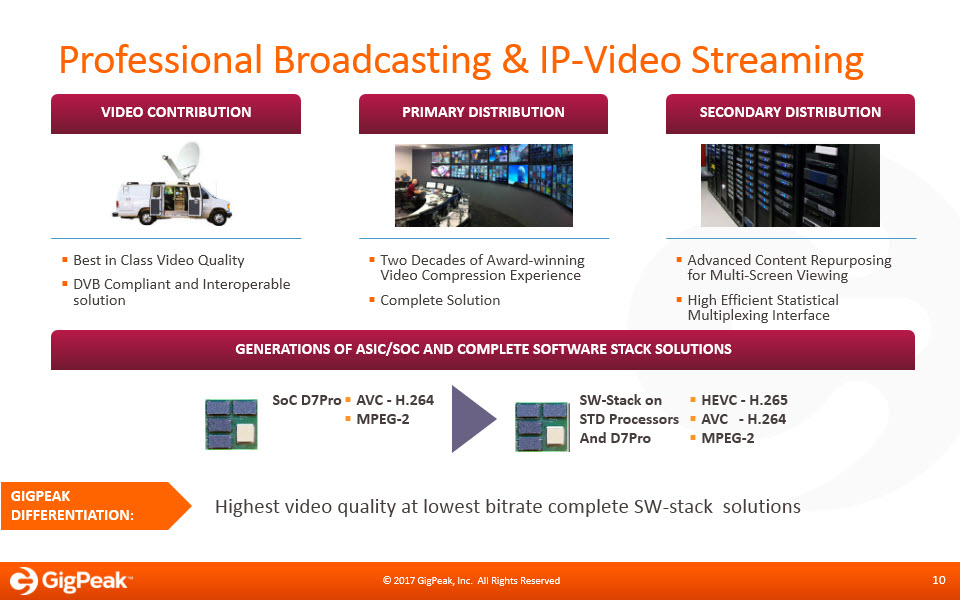
Professional Broadcasting & IP-Video Streaming 10 Generations of ASIC/SOC and Complete Software Stack SolutionS SoC D7Pro AVC - H.264MPEG-2 SW-Stack on STD ProcessorsAnd D7Pro HEVC - H.265AVC - H.264MPEG-2 Video Contribution Primary distribution Secondary distribution Best in Class Video QualityDVB Compliant and Interoperable solution Two Decades of Award-winning Video Compression ExperienceComplete Solution Advanced Content Repurposing for Multi-Screen ViewingHigh Efficient Statistical Multiplexing Interface GigPeakDifferentiation: Highest video quality at lowest bitrate complete SW-stack solutions

GigPeak Broad Customer Base 11 11 APAC NORTH AMERICA EMEA
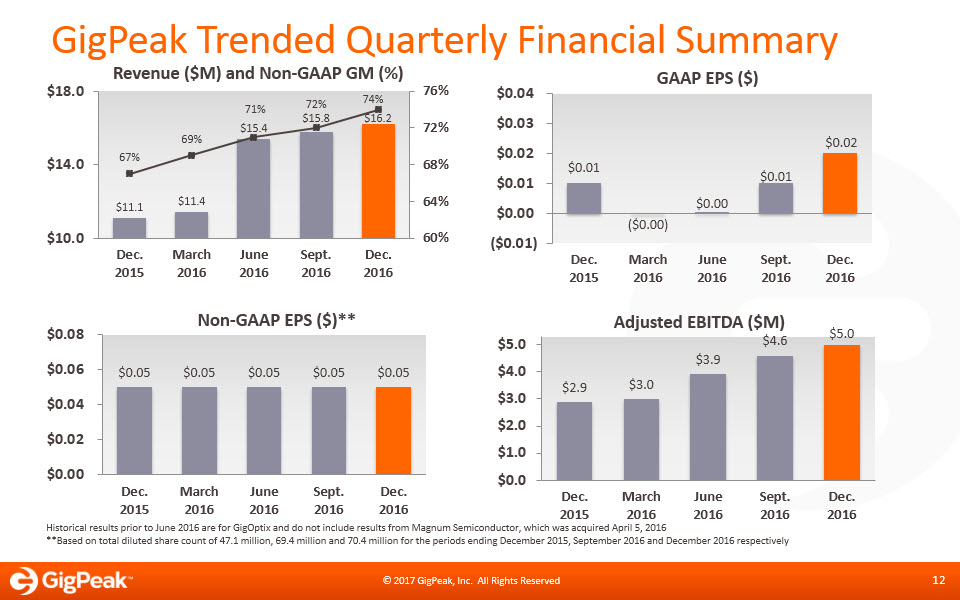
GigPeak Trended Quarterly Financial Summary Historical results prior to June 2016 are for GigOptix and do not include results from Magnum Semiconductor, which was acquired April 5, 2016 **Based on total diluted share count of 47.1 million, 69.4 million and 70.4 million for the periods ending December 2015, September 2016 and December 2016 respectively 12

GigPeak Non-GAAP EPS Profitability Trends 13 The 14th straight quarter of revenue growth The 11th straight quarter of non-GAAP Net Income The 22nd straight quarter of positive Adjusted EBITDANon-GAAP EPS of $0.20 for last 4 quarters through Q4’16Increased EPS in FY 2016 in spite of ~67% additional shares since Q4’15 Annual Non-GAAP EARNINGS PER SHARE Commentary on Preliminary Q4’16 Results Annual ADJUSTED EBITDA Margins
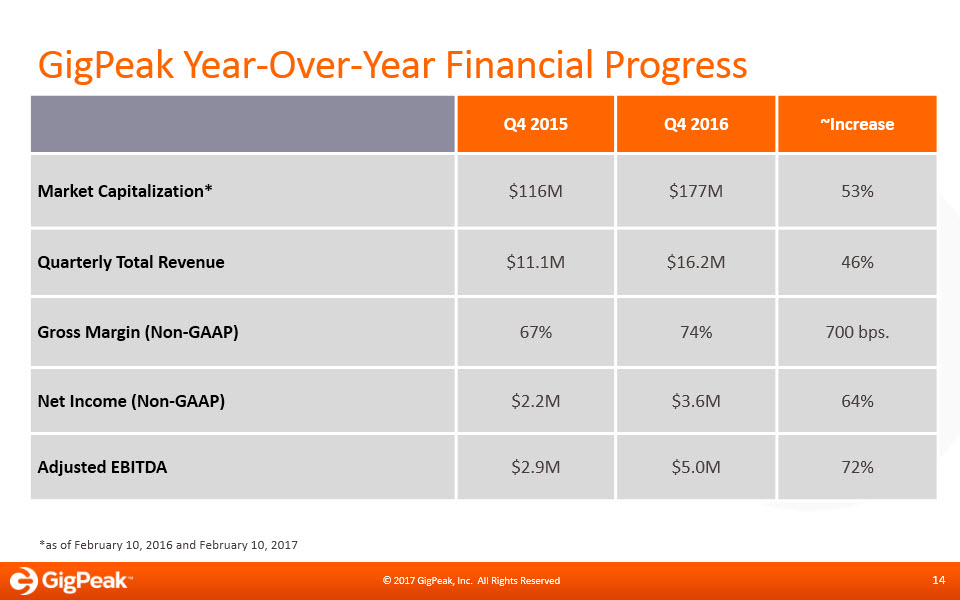
GigPeak Year-Over-Year Financial Progress Q4 2015 Q4 2016 ~Increase Market Capitalization* $116M $177M 53% Quarterly Total Revenue $11.1M $16.2M 46% Gross Margin (Non-GAAP) 67% 74% 700 bps. Net Income (Non-GAAP) $2.2M $3.6M 64% Adjusted EBITDA $2.9M $5.0M 72% *as of February 10, 2016 and February 10, 2017 14

GigPeak Balance Sheet & Capitalization Cash & Equivalents $35.8 Accounts Receivable $15.3 Inventory $13.7 Other Current Assets $0.7 Total Current Assets $65.4 Long-term Assets $75.1 Total Assets $140.4 Current Liabilities $16.0 Long-term Liabilities/Other $14.1 Total Liabilities $30.1 Total Equity $110.3 Total Liabilities & Equity $140.4 Diluted Common Stock Outstanding 70.4M Stock Price1 $2.52 Avg. Trading Volume1 ~480,000 Market Cap1 $177M Options Outstanding 7.1M Weighted Exercise Price $2.26 RSUs Outstanding 5.5M Warrants Outstanding 0.2M Balance Sheet 12/31/16 (Millions) Cap Table Highlights 1 As of February 10, 2017 15
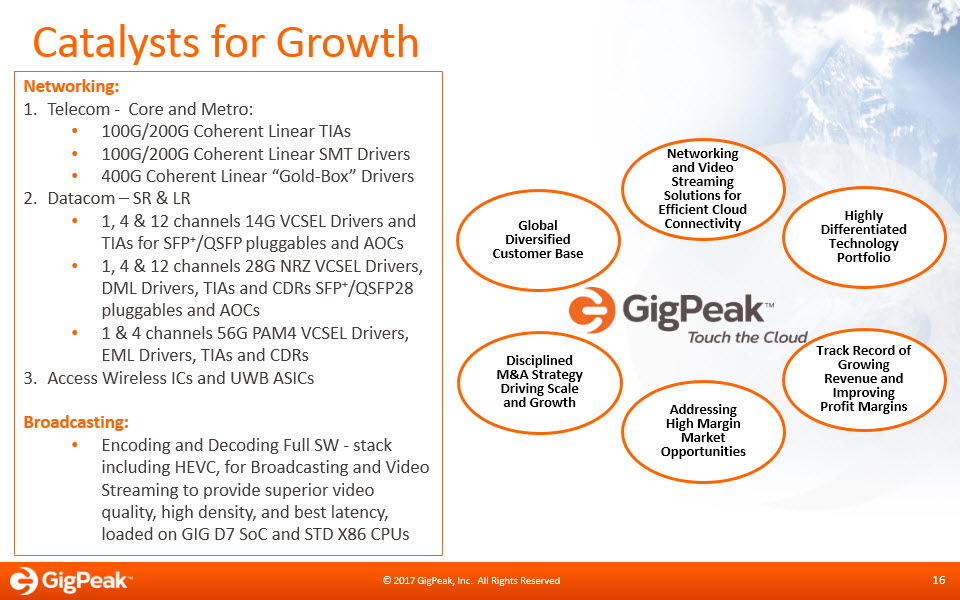
Catalysts for Growth Track Record of Growing Revenue and Improving Profit Margins Networking and Video Streaming Solutions for Efficient Cloud Connectivity Global Diversified Customer Base Highly Differentiated Technology Portfolio Disciplined M&A Strategy Driving Scale and Growth Addressing High Margin Market Opportunities 16 Networking:Telecom - Core and Metro:100G/200G Coherent Linear TIAs100G/200G Coherent Linear SMT Drivers400G Coherent Linear “Gold-Box” DriversDatacom – SR & LR1, 4 & 12 channels 14G VCSEL Drivers and TIAs for SFP+/QSFP pluggables and AOCs 1, 4 & 12 channels 28G NRZ VCSEL Drivers, DML Drivers, TIAs and CDRs SFP+/QSFP28 pluggables and AOCs1 & 4 channels 56G PAM4 VCSEL Drivers, EML Drivers, TIAs and CDRsAccess Wireless ICs and UWB ASICsBroadcasting:Encoding and Decoding Full SW - stack including HEVC, for Broadcasting and Video Streaming to provide superior video quality, high density, and best latency, loaded on GIG D7 SoC and STD X86 CPUs
February 13, 2017NYSE MKT: GIG GigPeak Q4 FY16 Corporate Summary

GAAP to Non-GAAP Reconciliation *GigOptix Historical Results ($ in Thousands) 2013 2014 2015 Gross Margin Reconciliation GAAP gross profit $19,236 $25,496 $7,679 $10,175 $10,648 $11,511 $40,013 Stock-based compensation 336 387 86 72 74 61 293 Amortization of intangible assets 412 413 103 702 641 426 1,872 Special bonus – 3 – – 10 – 10 Non-GAAP Gross Profit $19,984 $26,299 $7,868 $10,949 $11,373 $11,998 $42,188 Revenue $32,947 $40,394 $11,362 $15,368 $15,796 $16,217 $58,743 GAAP gross margin 58% 63% 68% 66% 67% 71% 68% Non-GAAP gross margin 61% 65% 69% 71% 72% 74% 72% Net Income Reconciliation GAAP net income (Loss) ($5,821) $1,249 ($52) $85 $671 $1,529 $2,233 Stock-based compensation 4,225 3,848 1,285 1,072 1,097 1,133 4,587 Amortization of intangible assets 893 991 320 1,014 953 740 3,027 Restructuring expense, net 343 – – – – – – Acquisition & strategic activities related costs 466 668 803 469 50 189 1,511 Special bonus 343 550 – – 695 – 695 Change of executive severance & related costs 334 – – – – – – Loss on equity investment 456 3 – – – – – Non-GAAP net income $1,239 $7,309 $2,356 $2,640 $3,466 $3,591 $12,053 2014* 2015* Q1’16* 18 Q2’16 Q3’16 2016 Q4’16 Reconciliation tables of GAAP to non-GAAP included in the financial tables filed in a Form 8-K with the SEC.* Results for GigOptix, Inc. only