UNITED STATES SECURITIES AND EXCHANGE COMMISSION
Washington, D.C. 20549
FORM 6-K
REPORT OF FOREIGN PRIVATE ISSUER
PURSUANT TO RULE 13a-16 OR 15d-16 UNDER
THE SECURITIES EXCHANGE ACT OF 1934
For the month of March, 2024
Commission File Number: 001-38049
Azul S.A.
(Name of Registrant)
Edifício Jatobá, 8th floor, Castelo Branco Office Park
Avenida Marcos Penteado de Ulhôa Rodrigues, 939
Tamboré, Barueri, São Paulo, SP 06460-040, Brazil.
+55 (11) 4831 2880
(Address of Principal Executive Office)
Indicate by check mark whether the registrant files or will file annual reports under cover of Form 20-F or Form 40-F.
Form 20-F x Form 40-F ¨
Indicate by check mark if the registrant is submitting the Form 6-K in paper as permitted by Regulation S-T Rule 101(b)(1):
Yes ¨ No x
Indicate by check mark if the registrant is submitting the Form 6-K in paper as permitted by Regulation S-T Rule 101(b)(7):
Yes ¨ No x
 | Fourth Quarter Unaudited Results 2023 |
Azul Reports Record Results and Increases 2024 Guidance
São Paulo, March 28, 2024 – Azul S.A., “Azul” (B3:AZUL4, NYSE:AZUL), the largest airline in Brazil by number of cities and departures, announces today its unaudited results for the fourth quarter of 2023 (“4Q23”) and full year 2023. The following financial information, unless stated otherwise, is presented in Brazilian reais and in accordance with International Financial Reporting Standards (IFRS).
Financial and Operating Highlights
| § | 4Q23 EBITDA increased 33.7% to R$1.5 billion, representing a margin of 29.2%. For the full year, EBITDA increased 61.4%, reaching R$5.2 billion and a margin of 27.9%. This represents an increase of R$2.0 billion compared to 2022 and an all-time record both for fourth quarter and annual EBITDA. |
| § | Operating income in 4Q23 increased an impressive 68.3% to R$883.2 million, representing a margin of 17.6%, 5.8 percentage points higher than in 4Q22. For the year, operating income reached R$2.9 billion, an increase of R$1.8 billion versus 2022. |
| § | In 4Q23, operating revenue increased 13.0% to a record of R$5.0 billion, mainly driven by the robust growth in passenger revenues and supported by the strong contribution from our other businesses, in particular the continued growth in domestic cargo revenue and our vacations business Azul Viagens. |
| § | RASK once again reached all-time record levels at R$45.30 cents, an increase of 6.1% versus 4Q22. This was a better result than our guidance, even with capacity growing 6.5%. |
| § | Passenger traffic (RPK) increased 9.1% over a capacity increase of 6.5% in 4Q23, resulting in a load factor of 80.0%, 1.9 percentage point higher than in 4Q22. For the full year 2023, capacity increased 11.2%, in line with our guidance. |
| 4Q23 Highlights¹ | 4Q23 | 4Q22 | Change | 2023 | 2022 | Change |
| Total operating revenue (R$ million) | 5,030.4 | 4,453.5 | 13.0% | 18,694.6 | 15,948.1 | 17.2% |
| Operating income (R$ million) | 883.2 | 524.7 | 358.5 | 2,899.9 | 1,135.7 | 1,764.2 |
| Operating margin (%) | 17.6% | 11.8% | +5.8 p.p. | 15.5% | 7.1% | +8.4 p.p. |
| EBITDA (R$ million) | 1,467.1 | 1,097.7 | 369.4 | 5,214.2 | 3,230.1 | 1,984.1 |
| EBITDA margin (%) | 29.2% | 24.6% | +4.5 p.p. | 27.9% | 20.3% | +7.6 p.p. |
| ASK (million) | 11,105 | 10,426 | 6.5% | 44,006 | 39,579 | 11.2% |
| RASK (R$ cents) | 45.30 | 42.72 | 6.1% | 42.48 | 40.29 | 5.4% |
| PRASK (R$ cents) | 42.01 | 39.52 | 6.3% | 39.46 | 36.88 | 7.0% |
| Yield (R$ cents) | 52.51 | 50.60 | 3.8% | 49.05 | 46.25 | 6.1% |
| CASK (R$ cents) | 37.35 | 37.68 | -0.9% | 35.89 | 37.42 | -4.1% |
| Fuel cost per liter (R$) | 4.66 | 5.63 | -17.3% | 4.56 | 5.44 | -16.1% |
¹ Operating results were adjusted for non-recurring items. Please refer to page 9 for additional 4Q23 details.
| § | CASK in 4Q23 was R$37.35 cents, a reduction of 0.9% compared to 4Q22, mainly driven by a 17.3% reduction in fuel prices. CASK ex-fuel was up as a reflection of investments to support 2024 growth and maximize fleet availability to benefit from the continued strong demand environment. |
| § | Immediate liquidity was R$3.0 billion, representing 16.2% of the last twelve months’ revenues and 18.8% higher compared to 4Q22. In the quarter, we paid down over R$0.7 billion in debt amortization and deferrals. |
| § | Azul’s leverage, measured as net debt to LTM EBITDA, reduced to 3.7x, in line with our guidance and an impressive reduction of 2 full points compared to 4Q22. Azul expects to continue reducing leverage, reaching approximately 3x at the end of 2024, below our pre-pandemic levels. |
| 1 |
| | Fourth Quarter Unaudited Results 2023 |
Management Comments
2023 was a year of many records for Azul: R$19 billion in revenue, a RASK of R$42.48 cents, up 5% from full-year 2022 even with a capacity increase of 11%, and an EBITDA of R$5.2 billion, an increase of R$2.0 billion year over year. In addition to this outstanding financial performance, we were the second most on-time airline in 2023 after reaching the number one spot in 2022. This is a true testament to our incredible crewmembers who delivered a world-class experience to our 30 million customers this year, each and every day. I want to thank them for their passion and dedication.
Azul continues to be unique. Our broad network serves 160 destinations, roughly 100 more than anyone else, enabled by a flexible fleet which allows us to access demand that was never explored before. These structural competitive advantages have only grown over time as we stay true to our business model. These advantages are only further strengthened by our non-ticket businesses: loyalty, vacations, cargo, ancillaries and charters, all of them fast-growing, high-margin ventures. With Brazil very much in our DNA we are extremely proud to partner with the Brazilian Olympic Committee and support team Brazil in the Paris 2024 Summer games.
For the fourth quarter we delivered an all-time record revenue of R$5.0 billion, an all-time record RASK of R$45.30 cents, a record fourth quarter EBIT margin of 17.6% and record fourth quarter EBITDA margin of 29.2%, one of the highest in the world. EBITDA margin improved 7.6 pecentage points for the year and 4.5 percentage points for the quarter, clearly demonstrating our ability to continue increasing margins in spite of higher fuel and higher currency. This clearly demonstrates the strength of our business model.
Immediate liquidity remains solid at R$3.0 billion, representing 16.2% of our annual revenues. Including long-term investments and receivables, security deposits and reserves, our total liquidity was R$6.1 billion even after paying down debt and making investments to prepare our operations for 2024 growth, as we continue to see a very positive demand environment in Brazil.
With overall revenue growth of 17.2% from 2022 to 2023, it is fair to say that demand for Azul’s products and services has never been stronger. Our loyalty business Azul Fidelidade is larger than ever, now with 17 million members with record monthly active users, points redemptions, recurring revenue and credit card revenue. Our vacations business Azul Viagens continues its impressive growth trajectory and is now the second largest vacations business in Brazil. Gross bookings are increasing 50% year-over-year as we take advantage of strong leisure demand and opportunities to increase aircraft utilization with unique nonstop flights. Our cargo business grew in the fourth quarter, in the opposite direction of global trends, by expanding our diversified customer base with even more retailers, manufacturers, and e-commerce operators in Brazil who value our reliable, far-reaching logistic solutions.
In 2023 we continued our deleveraging process, reaching a leverage of 3.7x in 2023, a reduction of 2 full points in one year, and in line with our guidance. This achievement was reached after a successful, amicable capital optimization plan developed and negotiated swiftly in a manner to protect and maximize value to all of our stakeholders. We are confident we will continue reducing our leverage organically and estimate to end 2024 with a leverage of approximately 3x, below our pre-pandemic levels. With the success of this plan, we now have a liquidity position and capital structure that matches our unique strategy and operational performance.
This year, we have made critical investments in our operation, our maintenance capabilities and our staffing. In addition, we have secured strategic partnerships with our OEM partners to ensure our fleet reliability and availability. We are aware that the global operating environment is challenging and want to make sure that we are ahead of the curve.
We are more confident than ever in our ability to make Azul an even more efficient and profitable airline going forward, and with the strong momentum and encouraging demand environment we are witnessing, we updated our 2024 EBITDA guidance to R$6.5 billion. We are laser-focused on strengthening our business, driving growth and margins in all of our business units, and continuously generating more value for all of our stakeholders.
We thank all of our Crewmembers, partners and stakeholders for the confidence and support last year and look forward to an even more successful and rewarding 2024.
John Rodgerson, CEO of Azul S.A.
| 2 |
| | Fourth Quarter Unaudited Results 2023 |
Consolidated Financial Results
The following income statement and operating data should be read in conjunction with the quarterly results comments presented below:
| Income statement (R$ million)¹ | 4Q23 | 4Q22 | % Δ | 2023 | 2022 | % ∆ |
| Operating Revenue | ||||||
| Passenger revenue | 4,665.3 | 4,119.9 | 13.2% | 17,362.9 | 14,595.6 | 19.0% |
| Cargo revenue and other | 365.1 | 333.5 | 9.5% | 1,331.7 | 1,352.5 | -1.5% |
| Total operating revenue | 5,030.4 | 4,453.5 | 13.0% | 18,694.6 | 15,948.1 | 17.2% |
| Operating Expenses | ||||||
| Aircraft fuel | 1,513.0 | 1,773.5 | -14.7% | 5,890.5 | 6,561.3 | -10.2% |
| Salaries and benefits | 679.8 | 515.2 | 32.0% | 2,397.3 | 1,954.6 | 22.6% |
| Depreciation and amortization | 583.9 | 573.0 | 1.9% | 2,314.3 | 2,094.4 | 10.5% |
| Airport fees | 273.4 | 250.5 | 9.1% | 1,056.9 | 911.2 | 16.0% |
| Traffic and customer servicing | 212.6 | 188.5 | 12.8% | 807.6 | 641.9 | 25.8% |
| Sales and marketing | 220.1 | 217.4 | 1.2% | 779.3 | 699.0 | 11.5% |
| Maintenance and repairs | 172.1 | 152.8 | 12.7% | 686.2 | 592.1 | 15.9% |
| Other | 492.2 | 257.8 | 90.9% | 1,862.7 | 1,357.8 | 37.2% |
| Total Operating Expenses | 4,147.2 | 3,928.7 | 5.6% | 15,794.7 | 14,812.4 | 6.6% |
| Operating Result | 883.2 | 524.7 | 68.3% | 2,899.9 | 1,135.7 | 155.3% |
| Operating margin | 17.6% | 11.8% | +5.8 p.p. | 15.5% | 7.1% | +8.4 p.p. |
| EBITDA | 1,467.1 | 1,097.7 | 33.7% | 5,214.2 | 3,230.1 | 61.4% |
| EBITDA margin | 29.2% | 24.6% | +4.5 p.p. | 27.9% | 20.3% | +7.6 p.p. |
| Financial Result | ||||||
| Financial income | 76.3 | 86.1 | -11.4% | 220.1 | 277.3 | -20.6% |
| Financial expenses² | (1,207.3) | (1,248.4) | -3.3% | (5,363.5) | (4,558.1) | 17.7% |
| Derivative financial instruments, net² | (134.1) | 96.4 | n.a. | 19.9 | 438.2 | -95.5% |
| Foreign currency exchange, net | 824.8 | 772.3 | 6.8% | 1,562.8 | 1,327.4 | 17.7% |
| Result Before Income Taxes | 442.9 | 231.2 | 91.6% | (660.8) | (1,379.6) | -52.1% |
| Income tax and social contribution | - | - | n.a. | - | - | n.a. |
| Deferred income tax and social contribution | (39.5) | - | n.a. | (39.5) | - | n.a. |
| Net Result² | 403.3 | 231.2 | 74.5% | (700.3) | (1,379.6) | -49.2% |
| Net margin | 8.0% | 5.2% | +2.8 p.p. | -3.7% | -8.7% | +4.9 p.p. |
| Adjusted Net Result² ³ | (270.6) | (610.5) | -55.7% | (2,421.0) | (2,667.6) | -9.2% |
| Adjusted net margin² ³ | -5.4% | -13.7% | +8.3 p.p. | -13.0% | -16.7% | +3.8 p.p. |
| Shares outstanding⁴ | 347.7 | 348.0 | -0.1% | 347.5 | 347.7 | 0.0% |
| EPS | 1.16 | 0.66 | 74.6% | (2.02) | (3.97) | -49.2% |
| EPS (US$) | 0.23 | 0.13 | 85.0% | (0.40) | (0.77) | -47.5% |
| EPADR (US$) | 0.70 | 0.38 | 85.0% | (1.21) | (2.31) | -47.5% |
| Adjusted EPS³ | (0.78) | (1.75) | -55.6% | (6.97) | (7.67) | -9.2% |
| Adjusted EPS³ (US$) | (0.16) | (0.33) | -53.0% | (1.39) | (1.49) | -6.1% |
| Adjusted EPADR³ (US$) | (0.47) | (1.00) | -53.0% | (4.18) | (4.46) | -6.1% |
¹ Operating results were adjusted for non-recurring items. Please refer to page 9 for additional 4Q23 details.
² Excludes the conversion right related to the convertible debentures.
³ Adjusted net result.EPS/EPADR were adjusted for unrealized derivative results and foreign currency. One ADR equals three preferred shares (PNs).
⁴ Shares outstanding do not include the dilution related to the convertible and equity instruments.
| 3 |
| | Fourth Quarter Unaudited Results 2023 |
| Operating Data¹ | 4Q23 | 4Q22 | % Δ | 2023 | 2022 | % ∆ |
| ASK (million) | 11,105 | 10,426 | 6.5% | 44,006 | 39,579 | 11.2% |
| Domestic | 8,657 | 8,450 | 2.5% | 34,367 | 33,605 | 2.3% |
| International | 2,448 | 1,976 | 23.9% | 9,639 | 5,974 | 61.3% |
| RPK (million) | 8,885 | 8,143 | 9.1% | 35,399 | 31,561 | 12.2% |
| Domestic | 6,812 | 6,526 | 4.4% | 27,180 | 26,517 | 2.5% |
| International | 2,073 | 1,617 | 28.2% | 8,219 | 5,044 | 62.9% |
| Load factor (%) | 80.0% | 78.1% | +1.9 p.p. | 80.4% | 79.7% | +0.7 p.p. |
| Domestic | 78.7% | 77.2% | +1.5 p.p. | 79.1% | 78.9% | +0.2 p.p. |
| International | 84.7% | 81.8% | +2.9 p.p. | 85.3% | 84.4% | +0.8 p.p. |
| Average fare (R$) | 643.6 | 588.7 | 9.3% | 593.0 | 531.0 | 11.7% |
| Passengers (thousands) | 7,248 | 6,998 | 3.6% | 29,278 | 27,485 | 6.5% |
| Block hours | 136,888 | 136,674 | 0.2% | 550,843 | 518,813 | 6.2% |
| Aircraft utilization (hours per day)² | 10.5 | 9.5 | 10.3% | 10.0 | 9.2 | 8.6% |
| Departures | 78,123 | 79,535 | -1.8% | 316,896 | 304,429 | 4.1% |
| Average stage length (km) | 1,184 | 1,113 | 6.4% | 1,159 | 1,105 | 4.8% |
| End of period operating passenger aircraft | 183 | 177 | 3.4% | 183 | 177 | 3.4% |
| Fuel consumption (thousands of liters) | 324,588 | 314,740 | 3.1% | 1,291,297 | 1,206,925 | 7.0% |
| Fuel consumption per ASK | 29.2 | 30.2 | -3.2% | 29.3 | 30.5 | -3.8% |
| Full-time-equivalent employees | 15,248 | 13,543 | 12.6% | 15,248 | 13,543 | 12.6% |
| End of period FTE per aircraft | 83 | 77 | 8.9% | 83 | 77 | 8.9% |
| Yield (R$ cents) | 52.51 | 50.60 | 3.8% | 49.05 | 46.25 | 6.1% |
| RASK (R$ cents) | 45.30 | 42.72 | 6.1% | 42.48 | 40.29 | 5.4% |
| PRASK (R$ cents) | 42.01 | 39.52 | 6.3% | 39.46 | 36.88 | 7.0% |
| CASK (R$ cents) | 37.35 | 37.68 | -0.9% | 35.89 | 37.42 | -4.1% |
| CASK ex-fuel (R$ cents) | 23.72 | 20.67 | 14.7% | 22.51 | 20.85 | 8.0% |
| Fuel cost per liter (R$) | 4.66 | 5.63 | -17.3% | 4.56 | 5.44 | -16.1% |
| Break-even load factor (%) | 66.0% | 68.9% | -2.9 p.p. | 68.0% | 74.1% | -6.1 p.p. |
| Average exchange rate (R$ per US$) | 4.96 | 5.26 | -5.6% | 5.00 | 5.16 | -3.3% |
| End of period exchange rate | 4.90 | 5.22 | -6.1% | 4.90 | 5.22 | -6.1% |
| Inflation (IPCA/LTM) | 4.46% | 5.79% | -1.3 p.p. | 4.46% | 5.79% | -1.3 p.p. |
| WTI (average per barrel, US$) | 76.21 | 82.40 | -7.5% | 77.66 | 93.72 | -17.1% |
| Heating oil (US$ per gallon) | 2.85 | 3.54 | -19.5% | 2.81 | 3.55 | -20.7% |
¹ Operating results were adjusted for non-recurring items. Please refer to page 9 for additional 4Q23 details.
² Excludes Cessna aircraft and freighters.
Operating Revenue
In 4Q23, Azul´s total operating revenue increased R$576.9 million or 13.0%, reaching a record of R$5.0 billion. Passenger revenue increased 13.2% on 6.5% more capacity compared to the same period last year. Total revenue for the year reached an all-time record of R$18.7 billion, an increase of 17.2% in the year, boosted by the full recovery of corporate and international passenger demand and the outstanding performance of our other businesses.
Cargo revenue and other reached R$365.1 million in 4Q23, 9.5% higher than 4Q22, mainly due to the solid performance of our Azul Viagens vacation business and the 11.8% revenue growth in domestic cargo.
Total RASK and PRASK reached all-time records of R$45.30 cents and R$42.01 cents, respectively, enabled by our rational capacity deployment and the sustainable competitive advantages of our business model. Compared to 4Q22, RASK and PRASK increased 6.1% and 6.3%, respectively.
| 4 |
| | Fourth Quarter Unaudited Results 2023 |
| R$ cents¹ | 4Q23 | 4Q22 | % Δ | 2023 | 2022 | % Δ |
| Operating revenue per ASK | ||||||
| Passenger revenue | 42.01 | 39.52 | 6.3% | 39.46 | 36.88 | 7.0% |
| Cargo revenue and other | 3.29 | 3.20 | 2.8% | 3.03 | 3.42 | -11.4% |
| Operating revenue (RASK) | 45.30 | 42.72 | 6.1% | 42.48 | 40.29 | 5.4% |
| Operating expenses per ASK | ||||||
| Aircraft fuel | 13.63 | 17.01 | -19.9% | 13.39 | 16.58 | -19.3% |
| Salaries and benefits | 6.12 | 4.94 | 23.9% | 5.45 | 4.94 | 10.3% |
| Depreciation and amortization | 5.26 | 5.50 | -4.3% | 5.26 | 5.29 | -0.6% |
| Airport fees | 2.46 | 2.40 | 2.4% | 2.40 | 2.30 | 4.3% |
| Traffic and customer servicing | 1.91 | 1.81 | 5.9% | 1.84 | 1.62 | 13.2% |
| Sales and marketing | 1.98 | 2.09 | -4.9% | 1.77 | 1.77 | 0.3% |
| Maintenance and repairs | 1.55 | 1.47 | 5.8% | 1.56 | 1.50 | 4.2% |
| Other operating expenses | 4.43 | 2.47 | 79.2% | 4.23 | 3.43 | 23.4% |
| Total operating expenses (CASK) | 37.35 | 37.68 | -0.9% | 35.89 | 37.42 | -4.1% |
| Operating income per ASK (RASK-CASK) | 7.95 | 5.03 | 58.0% | 6.59 | 2.87 | 129.7% |
¹ Operating results were adjusted for non-recurring items. Please refer to page 9 for additional 4Q23 details.
Operating Expenses
In 4Q23, operating expenses were R$4.1 billion, 5.6% higher than 4Q22 mainly explained by the 6.5% increase in passenger capacity, the 4.5% inflation in the period, and investments made in the quarter to support 2024 growth and maximize fleet availability to benefit from the continued strong demand environment, offset by a 17.3% reduction in fuel price.
The breakdown of our main operating expenses compared to 4Q22 is as follows:
| § | Aircraft fuel decreased 14.7% to R$1,513.0 million even with a 6.5% increase in total capacity, mostly due to a 17.3% reduction in fuel price per liter (excluding hedges) and a reduction in fuel burn per ASK as a result of our more efficient next-generation fleet. |
| § | Salaries and benefits increased R$164.6 million compared to 4Q22, mainly driven by our capacity increase of 6.5%, a 5.5% union increase in salaries paid two months in advance as a result of collective bargaining agreements applicable to all airline employees in Brazil, insourcing of certain activities to reduce total costs, and hirings made in the quarter to support 2024 growth. |
| § | Depreciation and amortization increased 1.9% or R$10.9 million, driven by the increase in the size of our fleet compared to 4Q22. |
| § | Airport fees increased 9.1% or R$22.8 million, mostly driven by the 6.5% increase in our capacity, in particular our 23.9% growth in international capacity, which drives higher fees. |
| § | Traffic and customer servicing increased 12.8% or R$24.1 million, primarily due to the 23.9% growth in international capacity, which have higher expenses, and the 4.5% inflation in the period. |
| § | Sales and marketing increased 1.2% to R$220.1 million, mostly driven by the 13.2% growth in passenger revenue, offset by savings from the insourcing of marketing activities. |
| § | Maintenance and repairs increased R$19.3 million compared to 4Q22, mainly due to a higher number of maintenance events to maximize aircraft availability and support 2024 growth, partially offset by the 5.6% appreciation of the Brazilian real against the US dollar and savings from insourcing of maintenance events. |
| § | Other increased R$234.4 million, mainly due to an increase in judicial claims in Brazil, in addition to 6.5% increase in passenger capacity and higher training expenses as we prepared ourselves for 2024 growth, in addition to an increase of revenue-driven IT expenses, crewmembers accommodations, cargo last-mile operations, and flight contingencies. |
| 5 |
| | Fourth Quarter Unaudited Results 2023 |
Non-Operating Results
| Net financial results (R$ million) | 4Q23 | 4Q22 | % Δ | 2023 | 2022 | % ∆ |
| Net financial expenses | (1,131.0) | (1,162.3) | -2.7% | (5,143.4) | (4,280.9) | 20.1% |
| Derivative financial instruments, net | (134.1) | 96.4 | n.a. | 19.9 | 438.2 | -95.5% |
| Foreign currency exchange, net | 824.8 | 772.3 | 6.8% | 1,562.8 | 1,327.4 | 17.7% |
| Net financial results | (440.3) | (293.5) | 50.0% | (3,560.7) | (2,515.3) | 41.6% |
¹ Excludes the conversion right related to the convertible debentures.
Net financial expenses were R$1,131.0 million in the quarter, mainly from the R$455.2 million in leases recognized as interest expense and the R$85.8 million in interest on loans and financing in 4Q23.
Derivative financial instruments resulted in net losses of R$134.1 million in 4Q23 mostly due to fuel hedge losses recorded during the period. As of December 31, 2023, Azul had hedged approximately 15.1% of its expected fuel consumption for the next twelve months by using forward contracts and options.
Foreign currency exchange, net registered a gain of R$824.8 million in 4Q23 due to the 2.1% end of period appreciation of the Brazilian real against the US dollar in the quarter, resulting in a reduction in lease liabilities and loans denominated in foreign currency.
Liquidity and Financing
Azul ended the quarter with total liquidity of R$6.1 billion including long-term investments and receivables, security deposits, and maintenance reserves. Immediate liquidity as of December 31, 2023 was R$3.0 billion, 18.8% higher compared to 4Q22 and representing 16.2% of our LTM revenues.
In the quarter, we generated recurrent free cash flow of R$300 million after paying R$797.2 million in aircraft leases, R$499.1 million in CAPEX, and R$438.2 million in interest. Additionally, we paid down R$468.2 million in debt amortizations, and over R$217.1 million in deferrals.
| Liquidity (R$ million) | 4Q23 | 3Q23 | % Δ | 4Q22 | % Δ |
| Cash, cash equivalents and short-term investments | 1,897.3 | 1,670.1 | 13.6% | 668.3 | 183.9% |
| Accounts receivable | 1,124.0 | 1,793.5 | -37.3% | 1,874.2 | -40.0% |
| Immediate liquidity | 3,021.3 | 3,463.5 | -12.8% | 2,542.5 | 18.8% |
| Cash as % of LTM revenue | 16.2% | 19.1% | -3.0 p.p. | 15.9% | +0.2 p.p. |
| Long-term investments and receivables | 796.5 | 806.0 | -1.2% | 838.9 | -5.1% |
| Security deposits and maintenance reserves | 2,293.5 | 2,413.6 | -5.0% | 2,539.6 | -9.7% |
| Total Liquidity | 6,111.4 | 6,683.1 | -8.6% | 5,921.0 | 3.2% |
| 6 |
| | Fourth Quarter Unaudited Results 2023 |
Azul’s debt amortization schedule as of December 31, 2023 is presented below. The chart converts our dollar-denominated debt to reais using the quarter-end foreign exchange rate of R$4.90 .
Loans and financial debt amortization as of December 31, 2023
|
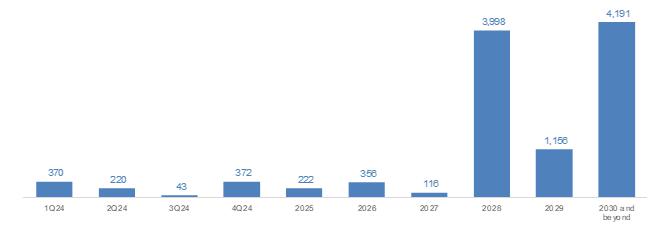
¹ Excludes convertible debentures, equity instruments and OEMs’ notes.
Gross debt decreased R$683.9 million in the quarter to R$23,185.6 million, mostly due to our continued deleveraging process with over R$1.6 billion in payments of loans, interest and leases during the quarter.
| Loans and financing (R$ million)¹ | 4Q23 | 3Q23 | % Δ | 4Q22 | % Δ |
| Lease liabilities | 11,805.1 | 11,715.9 | 0.8% | 13,771.3 | -14.3% |
| Lease notes | 1,030.8 | 1,029.9 | 0.1% | - | n.a. |
| Finance lease liabilities | 650.7 | 700.4 | -7.1% | 811.5 | -19.8% |
| Other aircraft loans and financing | 399.4 | 535.6 | -25.4% | 792.2 | -49.6% |
| Loans and financing | 9,299.5 | 9,887.7 | -5.9% | 6,440.5 | 44.4% |
| % of non-aircraft debt in local currency | 10% | 12% | -1.9 p.p. | 19% | -9.2 p.p. |
| % of total debt in local currency | 4% | 5% | -1.0 p.p. | 6% | -1.5 p.p. |
| Gross debt | 23,185.6 | 23,869.5 | -2.9% | 21,815.5 | 6.3% |
¹ Considers the effect of hedges on debt. Excludes convertible debentures, equity instruments and OEMs’ notes. Consistently, shares outstanding should be adjusted to 492.5 million.
As of December 31, 2023, Azul’s average debt maturity excluding lease liabilities and convertible debentures was 4.7 years, with an average interest rate of 11.0%. Average interest rate on local and dollar-denominated obligations were equivalent to CDI + 5% and 10.5%, respectively.
Azul’s leverage ratio measured as net debt to LTM EBITDA decreased 2 full points year-over-year, from 5.7x to 3.7x, in line with our guidance. We are confident in our ability to continue reducing leverage organically and we forecast to end 2024 with leverage of approximately 3x, below pre-pandemic levels.
| Key financial ratios (R$ million) | 4Q23 | 3Q23 | % Δ | 4Q22 | % Δ |
| Cash¹ | 3,817.9 | 4,269.6 | -10.6% | 3,381.4 | 12.9% |
| Gross debt² | 23,185.6 | 23,869.5 | -2.9% | 21,815.5 | 6.3% |
| Net debt | 19,367.7 | 19,599.9 | -1.2% | 18,434.1 | 5.1% |
| Net debt / EBITDA (LTM) | 3.7x | 4.0x | -0.3x | 5.7x | -2.0x |
¹ Includes cash, cash equivalents, receivables, short and long-term investments.
² Excludes convertible debentures, equity instruments and OEMs’ notes.
| 7 |
| | Fourth Quarter Unaudited Results 2023 |
Fleet and Capex Expenditures
As of December 31, 2023, Azul had a passenger operating fleet of 183 aircraft and a passenger contractual fleet of 189 aircraft, with an average aircraft age of 7.4 years excluding Cessna aircraft. At the end of 4Q23, the 6 aircraft not included in our operating passenger fleet consisted of (i) 3 Embraer E1s subleased to Breeze, (ii) 1 ATR and 2 Embraer E1s being prepared to exit the fleet.
Azul ended 4Q23 with approximately 82% of its capacity coming from next-generation aircraft, considerably higher than any competitor in the region.
| Passenger Contractual Fleet¹ | 4Q23 | 3Q23 | % Δ | 4Q22 | % Δ |
| Airbus widebody | 11 | 11 | - | 14 | -21.4% |
| Airbus narrowbody | 55 | 54 | 1.9% | 52 | 5.8% |
| Embraer E2 | 20 | 17 | 17.6% | 14 | 42.9% |
| Embraer E1 | 42 | 45 | -6.7% | 49 | -14.3% |
| ATR | 37 | 43 | -14.0% | 41 | -9.8% |
| Cessna | 24 | 24 | - | 24 | - |
| Total | 189 | 194 | -2.6% | 194 | -2.6% |
| Aircraft under operating leases | 164 | 167 | -1.8% | 168 | -2.4% |
1 Includes 3 subleased aircraft.
| Passenger Operating Fleet | 4Q23 | 3Q23 | % Δ | 4Q22 | % Δ |
| Airbus widebody | 11 | 11 | - | 11 | - |
| Airbus narrowbody | 55 | 54 | 1.9% | 51 | 7.8% |
| Embraer E2 | 20 | 17 | 17.6% | 13 | 53.8% |
| Embraer E1 | 37 | 37 | - | 43 | -14.0% |
| ATR | 36 | 38 | -5.3% | 37 | -2.7% |
| Cessna | 24 | 24 | - | 22 | 9.1% |
| Total | 183 | 181 | 1.1% | 177 | 3.4% |
Capex
Capital expenditures totaled R$499.1 million in 4Q23, mostly due to the capitalization of engine overhaul events, the acquisition of spare parts and pre-delivery payments in the quarter.
| Capex (R$ million) | 4Q23 | 3Q23 | % Δ | 2023 | 2022 | % Δ |
| Aircraft and maintenance and checks | 337.3 | 100.9 | 234.2% | 612.4 | 974.9 | -37.2% |
| Intangible assets | 39.6 | 36.9 | 7.4% | 169.0 | 198.5 | -14.9% |
| Pre-delivery payments | 84.1 | 13.9 | 506.0% | 113.2 | 23.9 | 373.9% |
| Other | 38.1 | 18.0 | 112.0% | 77.8 | 57.4 | 35.6% |
| Capex | 499.1 | 169.6 | 194.2% | 972.3 | 1,254.6 | -22.5% |
| 8 |
| | Fourth Quarter Unaudited Results 2023 |
Environmental, Social and Governance (“ESG”) Responsibility
The table below presents Azul’s key ESG information according to the Sustainability Accounting Standards Board (SASB) standard for the airline industry:
| ESG Key Indicators | 2023 | 2022 | % Δ |
| Environmental | |||
| Fuel | |||
| Total fuel consumed per ASK (GJ / ASK) | 1,102 | 1,146 | -3.8% |
| Total fuel consumed (GJ x 1000) | 48,508 | 45,338 | 7.0% |
| Fleet | |||
| Average age of operating fleet¹ (years) | 7.4 | 7.1 | 4.2% |
| Social | |||
| Labor Relations | |||
| Employee gender: male (%) | 59.4% | 59.8% | -0.4 p.p. |
| Employee gender: female (%) | 40.6% | 40.2% | 0.4 p.p. |
| Employee monthly turnover (%) | 0.7% | 0.9% | -0.2 p.p. |
| Employee covered under collective bargaining agreements (%) | 100% | 100% | - |
| Volunteers (#) | 6,012 | 4,324 | 39% |
| Governance | |||
| Management | |||
| Independent directors (%) | 92% | 91% | 0.7 p.p. |
| Percent of Board members that are women (%) | 25% | 18% | 7.0 p.p. |
| Board of Directors' average age (years) | 58 | 58 | 0.2% |
| Director meeting attendance (%) | 99% | 96% | 3 p.p. |
| Board size (#) | 12 | 11 | 9.1% |
| Participation of women in leadership positions (%) | 38% | 40% | -2 p.p. |
¹ excluding Cessna.
Non-Recurring Items Reconciliation
The operating results presented in this release include charges that we deem non-recurring and that should not be considered to compare to prior or future periods. In 4Q23, adjustments for non-recurring items totaled R$363.2 million, mainly due to a change in the accounting policy of loyalty bonus points dated back to the inception of the program; final fees related to our capital optimization plan; and adjustments in fleet and parts inventory derived from our lessor negotiations, including the earlier than expected retirement of the Airbus A350 and the termination of sublease agreements with a corresponding reintegration of aircraft in our fleet.
The table below provides a reconciliation of our reported amounts to the adjusted amounts excluding non-recurrent items:
| 4Q23 Non-recurring Adjustments | As recorded | Adjustments | Adjusted |
| Operating revenue | 4,905.5 | 124.9 | 5,030.4 |
| Operating expense | 4,385.5 | (238.3) | 4,147.2 |
| Maintenance and repairs | 232.4 | (60.3) | 172.1 |
| Other expense | 670.2 | (177.9) | 492.2 |
| Operating income | 520.0 | 363.2 | 883.2 |
| Operating Margin | 10.6% | +7.0 p.p. | 17.6% |
| EBITDA | 1,103.9 | 363.2 | 1,467.1 |
| EBITDA Margin | 22.5% | +6.7 p.p. | 29.2% |
| 9 |
| | Fourth Quarter Unaudited Results 2023 |
Conference Call Details
Thursday, March 28, 2024
11:00 a.m. (EDT) | 12:00 p.m. (Brasília time)
USA: +1 253 205-0468
Brazil: +55 11 4632-2237 or +55 21 3958-7888
Code: 847 4409 0112
Webcast: ri.voeazul.com.br/en/
About Azul
Azul S.A. (B3: AZUL4, NYSE: AZUL), the largest airline in Brazil by number of flight departures and cities served, offers 1,000 daily flights to over 160 destinations. With an operating fleet of over 180 aircraft and more than 16,000 Crewmembers, the Company has a network of 300 non-stop routes. Azul was named by Cirium (leading aviation data analysis company) as the most on-time airline in the world in 2022, being the first Brazilian airline to obtain this honor. In 2020 Azul was awarded best airline in the world by TripAdvisor, the first time a Brazilian flag carrier earned the number one ranking in the Traveler’s Choice Awards. For more information visit ri.voeazul.com.br/en/.
Contact:
| Investor Relations Tel: +55 11 4831 2880 invest@voeazul.com.br | Media Relations Tel: +55 11 4831 1245 imprensa@voeazul.com.br |
| 10 |
| | Fourth Quarter Unaudited Results 2023 |
Balance Sheet – IFRS
| (R$ million) | December 31, 2023 | September 30, 2023 | December 31, 2022 |
| Assets | 20,532.9 | 19,605.1 | 18,721.3 |
| Current assets | 5,044.1 | 5,931.4 | 4,871.9 |
| Cash and cash equivalents | 1,897.3 | 1,670.1 | 668.3 |
| Accounts receivable | 1,109.4 | 1,721.9 | 1,804.0 |
| Sublease receivables | 14.6 | 71.6 | 70.2 |
| Inventories | 799.2 | 751.6 | 721.7 |
| Security deposits and maintenance reserves | 515.7 | 987.0 | 1,025.2 |
| Taxes recoverable | 219.4 | 224.3 | 234.9 |
| Derivative financial instruments | 21.9 | 113.1 | 36.1 |
| Prepaid expenses | - | 113.1 | 182.9 |
| Other current assets | 466.6 | 278.9 | 128.7 |
| Non-current assets | 15,488.8 | 13,673.7 | 13,849.4 |
| Long-term investments | 780.3 | 744.3 | 733.0 |
| Sublease receivables | 16.2 | 61.7 | 105.9 |
| Security deposits and maintenance reserves | 1,777.8 | 1,426.5 | 1,514.4 |
| Derivative financial instruments | - | - | 235.9 |
| Prepaid expenses | - | 199.2 | 319.0 |
| Other non-current assets | 143.8 | 7.0 | 9.0 |
| Right of use – leased aircraft and other assets | 8,075.9 | 7,086.8 | 6,773.4 |
| Right of use – maintenance of leased aircraft | 935.7 | 686.3 | 779.2 |
| Property and equipment | 2,295.8 | 1,998.9 | 1,953.1 |
| Intangible assets | 1,463.2 | 1,462.8 | 1,426.5 |
| Liabilities and equity | 20,532.9 | 19,605.1 | 18,721.3 |
| Current liabilities | 14,748.9 | 14,064.1 | 15,056.1 |
| Loans and financing | 1,100.1 | 1,269.9 | 1,112.9 |
| Convertible instruments | 25.8 | 32.0 | 14.8 |
| Leases | 3,349.1 | 3,441.6 | 4,025.9 |
| Lease notes | 121.9 | 99.2 | - |
| Lease equity | 216.4 | 110.0 | - |
| Accounts payable | 2,202.0 | 1,901.9 | 2,432.8 |
| Factoring | 290.8 | 104.2 | 753.4 |
| Air traffic liability | 5,205.9 | 4,333.6 | 4,140.0 |
| Salaries and benefits | 474.8 | 514.9 | 479.4 |
| Insurance payable | 75.9 | 0.4 | 85.0 |
| Taxes payable | 142.2 | 119.2 | 193.6 |
| Derivative financial instruments | 68.9 | 9.7 | 69.4 |
| Provisions | 736.4 | 713.6 | 834.3 |
| Airport fees | 588.4 | 1,265.6 | 831.9 |
| Other | 150.4 | 148.1 | 82.7 |
| Non-current liabilities | 27,111.9 | 26,827.2 | 22,672.7 |
| Loans and financing | 8,598.9 | 9,153.4 | 6,119.8 |
| Convertible instruments | 1,175.8 | 1,118.8 | 1,388.9 |
| Leases | 9,106.8 | 8,974.6 | 10,556.9 |
| Lease notes | 908.9 | 930.7 | - |
| Lease equity | 1,443.4 | 1,444.9 | - |
| Accounts payable | 1,320.9 | 1,426.0 | 517.0 |
| Derivative financial instruments | 0.8 | 0.3 | 175.2 |
| Provision | 2,404.4 | 2,139.9 | 2,408.7 |
| Airport fees | 1,171.7 | 586.6 | 502.9 |
| Other non-current liabilities | 980.3 | 1,051.9 | 1,003.4 |
| Equity | (21,327.8) | (21,286.1) | (19,007.5) |
| Issued capital | 2,314.8 | 2,314.8 | 2,313.9 |
| Advance for future capital increase | 0.8 | 0.8 | 0.1 |
| Capital reserve | 2,029.6 | 2,016.3 | 1,970.1 |
| Treasury shares | (9.0) | (9.0) | (10.2) |
| Accumulated other comprehensive result | 3.1 | 5.3 | 5.3 |
| Accumulated losses | (25,667.1) | (25,614.3) | (23,286.7) |
| 11 |
| | Fourth Quarter Unaudited Results 2023 |
Cash Flow Statement – IFRS
| (R$ million) | 4Q23 | 4Q22 | % Δ | 2023 | 2022 | % Δ |
| Cash flows from operating activities | ||||||
| Net profit (loss) for the period | (52.8) | 1,106.1 | n.a. | (2,380.5) | (722.4) | 229.5% |
| Total non-cash adjustments | ||||||
| Depreciation and amortization | 583.9 | 573.0 | 1.9% | 2,404.2 | 2,094.4 | 14.8% |
| Unrealized derivatives | 194.2 | (425.9) | n.a. | 238.5 | (958.0) | n.a. |
| Exchange gain and (losses) in foreign currency | (867.9) | (840.8) | 3.2% | (1,616.4) | (1,464.2) | 10.4% |
| Interest on assets and liabilities, net | 1,140.4 | 880.3 | 29.5% | 5,313.9 | 3,968.5 | 33.9% |
| Provisions | (26.9) | 189.5 | n.a. | (161.0) | 438.4 | n.a. |
| Result of lease agreements modification | (104.7) | (29.5) | 254.6% | (204.0) | (93.1) | 119.1% |
| Other | 190.4 | (677.7) | n.a. | 438.7 | (798.0) | n.a. |
| Changes in operating assets and liabilities | ||||||
| Trade and other receivables | 614.2 | 171.2 | 258.8% | 877.0 | (1,107.1) | n.a. |
| Sublease receivables | - | 27.4 | n.a. | 19.5 | 68.4 | -71.5% |
| Security deposits and maintenance reserves | (157.3) | (188.0) | -16.3% | (453.1) | (606.2) | -25.3% |
| Prepaid expenses | 85.7 | (79.1) | n.a. | - | (274.6) | n.a. |
| Other assets | (2,143.2) | (656.5) | 226.5% | (3,153.8) | (822.8) | 283.3% |
| Derivatives | 16.7 | 27.1 | -38.3% | (138.0) | 477.6 | n.a. |
| Accounts payable | 2,048.2 | 1,067.0 | 92.0% | 2,796.1 | 2,275.4 | 22.9% |
| Salaries and benefits | (60.4) | 24.7 | n.a. | 13.2 | 113.8 | -88.4% |
| Air traffic liability | 939.8 | (247.1) | n.a. | 1,134.7 | 793.7 | 43.0% |
| Contingencies | 31.8 | (48.1) | n.a. | (237.5) | (179.4) | 32.4% |
| Other liabilities | 10.6 | 248.1 | -95.7% | 273.0 | 402.7 | -32.2% |
| Interest paid | (543.8) | (288.4) | 88.6% | (1,724.8) | (1,169.8) | 47.4% |
| Net cash generated (used) by operating activities | 1,898.8 | 833.3 | 127.9% | 3,439.7 | 2,437.3 | 41.1% |
| Cash flows from investing activities | ||||||
| Short-term investment | - | 0.3 | n.a. | - | 1.5 | n.a. |
| Cash received on sale of property and equipment | - | 201.2 | n.a. | - | 518.7 | n.a. |
| Sales and leaseback | 91.7 | - | n.a. | 91.7 | 321.3 | -71.5% |
| Restricted cash | 262.7 | - | n.a. | 6.1 | - | n.a. |
| Acquisition of intangible | (39.6) | (65.0) | -39.1% | (169.0) | (198.5) | -14.9% |
| Acquisition of property and equipment | (459.5) | (361.9) | 27.0% | (803.3) | (1,252.5) | -35.9% |
| Net cash generated (used) in investing activities | (144.7) | (225.4) | -35.8% | (874.5) | (609.5) | 43.5% |
| Cash flows from financing activities | ||||||
| Loans and financing | ||||||
| Proceeds | - | 12.3 | n.a. | 4,733.3 | 200.0 | 2266.6% |
| Repayment | (466.0) | (249.1) | 87.1% | (2,393.8) | (831.8) | 187.8% |
| Lease repayment | (680.1) | (651.7) | 4.4% | (2,353.3) | (2,772.6) | -15.1% |
| Factoring | (104.1) | (137.3) | -24.2% | (831.5) | (818.3) | 1.6% |
| Capital increase | - | 0.1 | n.a. | 1.6 | 23.0 | -93.0% |
| Treasury shares | - | (3.0) | n.a. | (6.8) | (3.9) | 74.0% |
| Repayment convertible | - | - | n.a. | (542.5) | - | n.a. |
| Net cash generated (used) in financing activities | (1,250.2) | (1,028.8) | 21.5% | (1,392.9) | (4,203.6) | -66.9% |
| Exchange gain (loss) on cash and cash equivalents | (6.0) | (14.5) | -59.0% | 56.7 | 0.7 | 8328.1% |
| Net decrease in cash and cash equivalents | 497.9 | (435.4) | n.a. | 1,229.0 | (2,375.1) | n.a. |
| Cash and cash equivalents at the beginning of the period | 1,399.4 | 1,103.7 | 26.8% | 668.3 | 3,073.8 | -78.3% |
| Cash and cash equivalents at the end of the period | 1,897.3 | 668.3 | 183.9% | 1,897.3 | 668.3 | 183.9% |
| 12 |
| | Fourth Quarter Unaudited Results 2023 |
Glossary
Aircraft Utilization
Average number of block hours per day per aircraft operated.
Available Seat Kilometers (ASK)
Number of aircraft seats multiplied by the number of kilometers flown.
Completion Factor
Percentage of scheduled flights that were executed.
Cost per ASK (CASK)
Operating expenses divided by available seat kilometers.
Cost per ASK ex-fuel (CASK ex-fuel)
Operating expenses divided by available seat kilometers excluding fuel expenses.
EBITDA
Earnings before interest, taxes, depreciation, and amortization. Adjusted EBITDA excludes non-recurring items.
FTE (Full-Time Equivalent)
Equivalent number of employees assuming all work full-time.
Immediate Liquidity
Cash, cash equivalents, short-term investments, and receivables.
Load Factor
Number of passengers as a percentage of number of seats flown (calculated by dividing RPK by ASK).
LTM
Last twelve months ended on the last day of the quarter presented.
Revenue Passenger Kilometers (RPK)
One-fare paying passenger transported one kilometer. RPK is calculated by multiplying the number of revenue passengers by the number of kilometers flown.
Passenger Revenue per Available Seat Kilometer (PRASK)
Passenger revenue divided by available seat kilometers (also equal to load factor multiplied by yield).
Revenue per ASK (RASK)
Operating revenue divided by available seat kilometers.
Stage Length
The average number of kilometers flown per flight.
Trip Cost
Average cost of each flight calculated by dividing total operating expenses by total number of departures.
Yield
Average amount paid per passenger to fly one kilometer. Usually, yield is calculated as average revenue per revenue passenger kilometer.
| 13 |
| | Fourth Quarter Unaudited Results 2023 |
This press release includes estimates and forward-looking statements within the meaning of the U.S. federal securities laws. These estimates and forward-looking statements are based mainly on our current expectations and estimates of future events and trends that affect or may affect our business, financial condition, results of operations, cash flow, liquidity, prospects, and the trading price of our preferred shares, including in the form of ADSs. Although we believe that these estimates and forward-looking statements are based upon reasonable assumptions, they are subject to many significant risks, uncertainties and assumptions and are made in light of information currently available to us. In addition, in this release, the words “may,” “will,” “estimate,” “anticipate,” “intend,” “expect,” “should” and similar words are intended to identify forward-looking statements. You should not place undue reliance on such statements, which speak only as of the date they were made. Azul is not under the obligation to update publicly or to revise any forward-looking statements after we distribute this press release because of new information, future events, or other factors. Our independent public auditors have neither examined nor compiled the forward-looking statements and, accordingly, do not provide any assurance with respect to such statements. In light of the risks and uncertainties described above, the future events and circumstances discussed in this release might not occur and are not guarantees of future performance. Because of these uncertainties, you should not make any investment decision based upon these estimates and forward-looking statements.
In this press release, we present EBITDA and EBITDA margin, which are non-IFRS performance measures and are not financial performance measures determined in accordance with IFRS and should not be considered in isolation or as alternatives to operating income or net income or loss, or as indications of operating performance, or as alternatives to operating cash flows, or as indicators of liquidity, or as the basis for the distribution of dividends. Accordingly, you are cautioned not to place undue reliance on this information.
n
| 14 |
| | Fourth Quarter Unaudited Results 2023 |
SIGNATURES
Pursuant to the requirements of the Securities Exchange Act of 1934, the registrant has duly caused this report to be signed on its behalf by the undersigned, thereunto duly authorized.
Date: March, 28 2024
Azul S.A.
By: /s/ Alexandre Wagner Malfitani
Name: Alexandre Wagner Malfitani
Title: Chief Financial Officer